
Submitted:
20 November 2024
Posted:
20 November 2024
You are already at the latest version
Abstract
Background: Breast cancer-related lymphedema (BCRL) is a serious complication often occurring after breast cancer surgery, which substantially diminishes the quality of life for those affected. Current treatments, including conservative and surgical approaches, primarily address lymphedema symptoms, slow disease progression, and mitigate complications. Therefore, there is an urgent need for new and effective methods for early diagnosis and treatment of BCRL. Methods: In the current study, we analyzed human serum and interstitial fluid (ISF) from BCRL patients without cancer progression (n = 22, age 69.6 ± 3.4 years). Control blood samples were collected from age-matched individuals without BCRL (n = 12, age 63.7 ± 6.5 years). Quantitative metabolomic profiling of the samples was performed using a high-frequency 1H NMR, and the concentrations (in μM) of a total of 48 metabolites in the samples were determined. Results: Serum and ISF in BCRL patients display a similar metabolomic composition: concentrations of most metabolites are similar or comparable. At the same time, the concentrations of pyruvic acid, 2-ketoisovaleric acid, ketoleucine, 3-methyl-2-oxovaleric acid, tryptophan, proline, creatine, isobutyric acid, propylene glycol, ascorbic acid, formic acid, isoleucine, leucine, threonine, and creatinine are higher in serum of BCRL patients compared to controls. Quantitative metabolite set enrichment analysis (QMSEA) of serum samples from BCRL patients and controls indicates that the most affected metabolic pathways involve energy production and inflammation. Conclusions: Differential serum metabolites reported in this study can be considered potential biomarkers for lymphedema.
Keywords:
metabolomics
; nuclear magnetic resonance
; breast cancer
; breast cancer-related lymphedema
; blood serum
; interstitial fluid
; biomarkers
1. Introduction
Despite the advanced diagnostic capabilities of modern medicine, certain diseases and dysfunctions in the human body remain challenging to diagnose and treat early on. Often, this is due to a limited understanding of the underlying mechanisms driving the formation and progression of the pathology, leading to restricted therapeutic options. Breast cancer (BC) ranks among the most prevalent cancers globally, while recent advancements in diagnosis and treatment have improved survival rates; however, the survival is associated with an increased risk of complications. One of the most severe complications is breast cancer-related lymphedema (BCRL) [1], which significantly diminishes quality of life for affected individuals [2]. The development of BCRL before the appearance of visible symptoms can last from several months to up to 10 years post-surgery, affecting approximately 20-49% of breast cancer survivors [3].
Lymphedema or lymphoedema is a condition characterized by regional lymphatic dysfunction due to impaired lymphatic fluid flow or its complete absence. The disease progression is accompanied by chronic inflammation and results in gradual accumulation of protein-rich fluid in the interstitial space. This results in limb swelling, as well as fibrotic changes in the skin and subcutaneous tissues due to compromised lymphatic system function [4].
Current secondary lymphedema treatment options, including both conservative and surgical approaches, primarily address symptoms, slow disease progression, and mitigate complications. However, these treatments often fail to substantially improve the quality of life for patients [5]. Therefore, there is an urgent need for novel and effective early diagnostic and therapeutic strategies for BCRL.
A most promising approach to tackling these challenges involves the use of high-throughput omics technologies, particularly metabolomics [6]. Various omics investigate different molecular levels of tissue functioning organization, encompassing the genome, transcriptome, proteome, metabolome, lipidome, etc. While the genome represents the most stable molecular level, the metabolome stands out as the most dynamic and responsive to changes caused by numerous internal and external factors. Moreover, metabolomic profile exerts a profound influence on a tissue physiology. The concentrations of metabolites in tissues or fluids are typically regulated within narrow ranges by their roles in metabolic processes. However, the onset of pathological conditions, such as malignant tumors and postoperative complications, can result in significant alterations in both the metabolic cycles of affected tissues and the blood metabolome [7].
The correct collection of biosamples for metabolomic purposes is a crucial step, performed even before the initial treatment of samples, such as metabolic activity quenching or extraction of metabolites. While blood sampling is a routine clinical procedure, sampling of interstitial fluid (ISF) presents a challenge. Recently, we developed and tested a novel ISF sampling method [8], which was employed in this study and allowed for the successful acquisition of this valuable material from BCRL patients.
In the current study, we employed a quantitative metabolomic approach based on the nuclear magnetic resonance (NMR) to investigate changes in the human lymphatic system's function associated with BCRL progression. The objectives were to identify metabolomic biomarkers of lymphedema in the ISF and blood serum of patients who had undergone BC treatment and to elucidate the molecular mechanisms underlying lymphedema onset and progression. This research aims to deepen insights into lymphatic system function and offers potential for the development of promising and minimally invasive methods for early BCRL diagnosis and personalized treatment.
2. Materials and Methods
2.1. Materials
Methanol and chloroform (HPLC grade) from J.T. Backer (Radnor, USA), 99.9% D2O from Astrachim (St. Petersburg, Russia), sodium 4,4-dimethyl-4-silapentane-1-sulfonate (DSS) from Cambridge Isotope Laboratories (Tewkesbury, USA) were used as received. To prepare 50 mM deuterated phosphate buffer, monosodium phosphate dihydrate and disodium phosphate from Applichem (Darmstadt, Germany) were dissolved in D2O and vacuum dried overnight to replace hydrogen atoms with deuterium. The procedure was repeated twice. H2O was deionized using an Aqualab-AL-1 Plus water system (Aqualab, Moscow, Russia) to the quality of 18.2 MΩ*cm.
2.2. Sample Collection
The investigations were conducted in accordance with the principles outlined in the Declaration of Helsinki 2008 (https://www.wma.net/what-we-do/medical-ethics/declaration-of-helsinki/doh-oct2008/, accessed on 01.08.2024), which delineate ethical principles for medical research involving human subjects. Ethical approval was obtained from the International Tomography Center SB RAS (#ECITC-2020-12 from 16.12.2020) and the Research Institute of Clinical and Experimental Lymphology – Branch of the Institute of Cytology and Genetics SB RAS (#159 from 20.07.2020). Written informed consent was obtained from all patients after a thorough explanation of the study's nature and potential consequences. No special permission from national or local authorities was required.
Blood (n=22) and interstitial fluid (n=9) samples were collected from patients who had previously undergone breast cancer treatment and who subsequently developed and were diagnosed with BCRL (n=22, age 69.6 ± 3.4 years). All patients were in remission and experienced no recurrence of BC. Eight patients had a prior history of erysipelas (Table S1). More than a year had passed since the last episode of BC relapse.
Control blood samples (n=12, age 63.7 ± 6.5 years) were collected from age-matched patients without diagnosed breast cancer and without lymphedema (Table S1). Peripheral blood was obtained from the ulnar vein in the morning after overnight fasting under aseptic conditions into a vacutainer containing a coagulation activator. Within 10-15 minutes of collection, the blood samples were centrifuged (3000×g, 10 min), and the plasma obtained was transferred into separate Eppendorf vials.
Interstitial fluid from the affected arm from the patients with secondary lymphedema was collected by the method described earlier [8]. Briefly, an ultrasound examination of the affected limb was performed using a 5 MHz and 10 MHz linear array probe. Areas of interstitial fluid accumulation were identified and marked. At these areas, the skin was punctured with a 27G needle and the interstitial fluid that appeared at the puncture site was collected using a 22G plastic catheter and transferred into clean Eppendorf vials. The vials with biofluid samples were immediately frozen and stored at -70°C until analysis.
2.3. Sample Preparation
For the preparation of extracts from blood serum for metabolomic measurements, we adhered to a standard protocol described in detail previously [9,10,11]. Briefly, after thawing human blood plasma, the clot was removed from the vial, yielding blood serum. Subsequently, 300 μL of H2O, 600 μL of cold (-20 °C) methanol and 600 μL of cold (-20 °C) chloroform were added to 300 µL of serum. The ISF volume varied from 50 to 200 μL, and the volume of added water was adjusted to match the ISF volume in each sample. Twice the volume of cold (-20 °C) methanol and cold (-20 °C) chloroform was added to each ISF sample. The resulting mixtures were stirred on a shaker at +4 °C for 15 minutes, followed by incubation at -20 °C for 30 minutes. Subsequently, the mixtures were centrifuged at 16,100×g for 30 minutes at +4 °C. Centrifugation resulted in the separation of a mixture into two immiscible phases. The upper water-methanol phase was collected and vacuum dried overnight.
2.4. NMR Measurements
The dried extracts were dissolved in 600 µL of 50 mM of deuterated phosphate buffer (pH 7.2) containing 20 µM of sodium 4,4-dimethyl-4-silapentane-1-sulfonic acid (DSS) as an internal standard. The 1H NMR measurements were conducted at the Center of Collective Use "Mass Spectrometric Investigations" SB RAS, using an AVANCE III HD 700 MHz NMR spectrometer (Bruker BioSpin, Rheinstetten, Germany), equipped with 16.4T magnet and corresponding proton Larmour frequency of 700 MHz. NMR spectra for each sample were acquired in a standard 5 mm glass NMR tube using a 5 mm TXI ATMA NMR probe. We used 70-degree detection pulse (pulse sequence name zgpr) and summed 64 free induction decay (FID) signals while maintaining the sample temperature at 25°C. For two ISF samples with volumes below 100 µL, we collected 128 FIDs to improve the signal-to-noise ratio. Prior to acquisition, low-power radiation was applied at the water resonance frequency to presaturate the water signal. To allow for the relaxation of all spins, a repetition time of 20 seconds was used between scans.
The resulted dataset is available at the NIH Common Fund's National Metabolomics Data Repository (NMDR) website, the Metabolomics Workbench (https://www.metabolomicsworkbench.org, accessed on 03.10.2024), where it has been assigned Project ID ST003506 (http://dx.doi.org/10.21228/M8FR6S, accessed on 22.10.2024). This dataset is also available in AMDB repository by the following link: https://amdb.online/amdb/experiments/291/ (accessed on 03.10.2024). The dataset contains NMR raw data, sample descriptions, metabolite concentrations, and experimental protocols.
2.5. Identification and Quantification of Metabolites in NMR Data
Metabolite identification was conducted by analyzing their NMR spectra, which were sourced from literature, databases (HMDB, METLIN, BMRB, and SpectraBase), an in-house NMR library [9,10,12], and AMDB [13]. Baseline processing, identification, and integration of spectral NMR peaks (quantification) were performed using MestReNova v12.0 (Mestrelab Research, A Coruna, Spain). In cases where NMR signal assignment was not straightforward, the identification of metabolites was verified by spiking extracts with commercially available standard compounds. Despite these efforts, several signals in the NMR spectra remained unassigned. Metabolite concentrations in the samples were determined in µM by integrating NMR signals relative to the internal standard DSS, and then normalized to the biofluid volume. On average, 60-80 compounds were identified in the samples. However, the quantification of some compounds was unreliable due to weak signals or signal overlap. The final table contains only 48 reliably identified and quantified metabolites. The raw data may contain additional information on yet unidentified metabolites.
2.6. Data Analysis
Univariate and multivariate statistical analyses, biomarker validation, and pathway analysis of an 1H NMR-based metabolomics dataset were performed on the MetaboAnalyst 6.0 web platform (www.metaboanalyst.ca, accessed on 01.08.2024) with autoscaled data. A data overview was performed with principal component analysis (PCA), and it was plotted for three sample groups. Pairwise comparisons were then used to identify significant differences between two corresponding groups. Univariate analysis for detecting differences between two groups was based on a volcano plot, combining fold change (FC) values with a threshold of FC > 1.5 and p-values from a statistical significance test (Mann-Whitney U-test) with false discovery rate (FDR) correction, and a threshold of p < 0.05. Differentiating metabolites in multivariate statistics were identified by orthogonal partial least squares-discriminant analysis (oPLS-DA) using the variable importance in projection (VIP) score, with a VIP-score threshold ≥ 1. Potential biomarkers were examined and validated with the area under the curve (AUC) measure from receiver operating characteristic (ROC) method, employing Monte Carlo cross-validation (MCCV), which is used to evaluate the accuracy and precision of biomarkers. Multivariate ROC curve exploratory analysis was performed using a linear support vector machine classifier and feature ranking methods. Quantitative Metabolite Set Enrichment Analysis (QMSEA) was performed on 80 metabolite sets from the KEGG human metabolic pathways database (data from December 2023) using the globaltest package to test for associations between metabolite sets and outcomes.
3. Results
3.1. Metabolite Concentration in Samples
Using high-field (high-resolution) 1H NMR spectroscopy, we analyzed blood serum and interstitial fluid specimens collected from patients with BCRL and control subjects. In total, we identified and quantified 48 most abundant metabolites across the samples. Table 1 provides the average concentrations (in µM) and standard deviations for these metabolites in each group, while Table S2 lists the concentrations for each individual sample. A representative 1H NMR spectrum for interstitial fluid, with corresponding metabolite identification are presented in Figure 1.
We applied principal component analysis (PCA) to overview the quantitative metabolomic data obtained for serum and ISF samples from BCRL patients and controls in order to establish major similarities and differences between the samples. The results are presented in Figure 2.
PCA shows clear separation between the BCRL and control samples, while serum and ISF samples from the BCRL patients are not separated.
3.2. Comparison of Serum and ISF Metabolomic Composition
To analyze minor differences between serum and ISF, we performed multivariate oPLS-DA and volcano plot analyses. The results are presented in Figure 3.
Statistically significant differences in metabolite concentrations between serum and ISF of BCRL patients were observed in the volcano plot (Figure 3C) for: inosine, ketoleucine, tryptophan, lactic acid, 3-methyl-2-oxovaleric acid, 2-ketoisovaleric acid, phenylalanine, 2-hydroxy-3-methylbutyric acid, 2-hydroxybutyric acid, acetic acid, and dimethyl sulfone. All these metabolites, except dimethyl sulfone, were also highlighted by multivariate oPLS-DA as having the highest VIP-scores (Figure 3B). The oPLS-DA plot (Figure 3A) demonstrates a clear separation of both groups and corresponding samples along the T-score axis, which represents between-group variation. Additional metabolites identified by oPLS-DA as differentiating between groups included creatinine, serine, formic acid, proline, and citric acid. Notably, nearly all metabolite concentrations were higher in serum than in ISF.
Additionally, we made a pairwise comparison of metabolite concentrations in serum and ISF (Figure S1). For each patient, the ratio of metabolite concentrations in serum to ISF was calculated, and then ratios were averaged across patients. The highest mean serum/ISF ratio (3.6) was found for ascorbic acid, followed by 2-hydroxy-3-methylbutyric acid (2.8), 3-hydroxybutyric acid (2.2), ketoleucine (2.0), and tryptophan (2.0). The lowest ratio was found for 3-hydroxyisobutyric acid (0.45). Inosine was below the limit of detection (LOD) in ISF, while pyroglutamic acid was not detected in serum, but showed high variability of concentrations in ISF. Most other metabolites displayed ratios between 0.97 and 1.23 (Figure S1). The overall mean ratio across all metabolites was 1.27 ± 0.53, and a median value was 1.08.
3.3. Comparison of Serum Metabolomic Composition from BCLR Patients and Controls
To achieve the primary objective of the current study – identifying differences between serum samples from BCRL patients and controls – we performed multivariate oPLS-DA and volcano plot analyses. The results of these analyses are presented in Figure 4.
The most pronounced differences between serum samples from BCRL patients and controls, as shown in the volcano plot (Figure 4C), were found for pyruvic acid, 2-ketoisovaleric acid, ketoleucine, 3-methyl-2-oxovaleric acid, tryptophan, proline, creatine, isobutyric acid, propylene glycol, ascorbic acid, and formic acid. Among these, all except propylene glycol and ascorbic acid are also highlighted by multivariate oPLS-DA as metabolites having highest VIP-scores (Figure 4B). In the oPLS-DA scores plot (Figure 4A), both groups and corresponding samples are well separated along the T-score axis, representing between-group variation. Additional metabolites identified by oPLS-DA as differentiating between groups included isoleucine, leucine, threonine, creatinine, glycerol, and valine. Concentrations of all these compounds are increased in the serum of BCRL patients.
3.4. Biomarker Analysis and Analysis of Affected Metabolic Pathways in BCRL
An initial analysis of potential biomarkers indicating the difference between serum samples from BCRL patients and the control group was performed using univariate ROC curve analysis for individual metabolites. The results (Table 2) reveal that four metabolites achieve an AUC metric of 1, while seven compounds exhibit AUC values greater than 0.8. A full table of the univariate biomarker analysis is provided in Table S3. These 11 compounds match the differential compounds indicated in prior analyses by the oPLS-DA and the volcano plot.
Therefore, these compounds can be considered promising candidates for the role of lymphedema biomarkers. To verify this, we performed a multivariate biomarker analysis using a combination of the top five metabolites identified though univariate ROC analysis and ranked by AUC: 2-ketoisovaleric acid, ketoleucine, pyruvic acid, 3-methyl-2-oxovaleric acid, and tryptophan. The results of the ROC-AUC analysis, presented in Figure 5 demonstrate excellent performance, with an AUC of 1 and zero misclassified samples. The combination of all 11 metabolites also shows an excellent AUC measure (Figure S2).
To determine the metabolic pathways altered in BCRL, we performed quantitative metabolite set enrichment analysis (QMSEA), with the results presented in Figure 6. Table 3 provides the statistical characteristics of the most affected metabolic pathways, indicating the significance and reliability of observed changes, as well as the metabolites from our dataset associated with these metabolic pathways. The complete list of analyzed pathways and corresponding QMSEA characteristics is available in Table S4.
To visualize the variability in metabolite concentrations in the groups, we prepared boxplots for differentiating metabolites found in this study (Figure 7): 2-ketoisovaleric acid, ketoleucine, pyruvic acid, 3-methyl-2-oxovaleric acid, tryptophan, isoleucine, proline, creatine, isobutyric acid.
4. Discussion
Analysis of quantitative data obtained by NMR method on concentrations of the most abundant metabolites indicates that serum and ISF in BCRL patients have a rather similar metabolomic composition: concentrations of the majority of metabolites (Table 1) are comparable, although nearly all compounds exhibit slightly higher concentrations in serum compared to ISF (Figure 3C). PCA analysis (Figure 2) supports this observation showing no clear separation between the serum and ISF sample groups. The most pronounced statistically significant differences between serum and ISF revealed by a combination of univariate and supervised multivariate statistics were (oPLS-DA) observed for inosine, ketoleucine, tryptophan, lactic acid, 3-methyl-2-oxovaleric acid, 2-ketoisovaleric acid, phenylalanine, 2-hydroxy-3-methylbutyric acid, 2-hydroxybutyric acid, acetic acid, creatinine, serine, formic acid, proline, and citric acid. The metabolomic composition of ISF may differ from that of serum due to the disruption of ISF outflow into the lymphatic vessels in secondary lymphedema, accompanied by altered biochemical processes in the extracellular matrix and chronic inflammation. Assuming that under normal conditions the metabolomic compositions of serum and ISF are in dynamic equilibrium [14,15], it can be concluded that the increased generation of these metabolites in the blood or their elevated consumption in ISF leads to a partial disruption of this equilibrium. The implications of the increased metabolite generation are discussed below.
The most pronounced differences in the serum of BCRL and control patients, identified through a combination of univariate and multivariate statistics (Figure 4), were observed for pyruvic acid, 2-ketoisovaleric acid, ketoleucine, 3-methyl-2-oxovaleric acid, tryptophan, proline, creatine, isobutyric acid, propylene glycol, ascorbic acid, formic acid, isoleucine, leucine, threonine, creatinine, glycerol, and valine; all concentrations are increased in BCRL patients. Biomarker analysis using the ROC-AUC method further supports the differences in 11 of these metabolites, demonstrating high diagnostic significance (AUC > 0.8, Table 2).
It should be noted that the magnitude of the increase in the differential metabolite concentrations in BCRL serum, compared to control serum, was noticeably greater than the magnitude of differences observed between BCRL serum and BCRL ISF, as well as the differences between control serum and BCRL ISF (Figure 7, Figure S3). This suggests that the observed metabolomic changes primarily occur in the blood rather than in ISF. Subsequently, these alterations in the blood spread to ISF [14], resulting in less pronounced changes in metabolite concentrations in ISF. Unfortunately, direct comparison of ISF from BCRL and control groups was not possible, due to study limitations related to the current difficulties of obtaining ISF from control patients and from unaffected arms of BCRL patients. Nevertheless, the proposed interpretation of the observed alterations in metabolite concentrations among the sample groups appears to be the most plausible. Therefore, blood serum emerges as a promising fluid for the development of early lymphedema diagnostics additionally to ISF. Moreover, the ease of collecting blood samples compared to ISF could expedite further research on BCRL.
The pathogenesis of lymphedema involves chronic inflammation, increased adipose tissue, interstitial fluid accumulation, and subsequent tissue fibrosis leading to the development of the disease. Based on the results of the enrichment analysis, we assessed the significance of biochemical pathways in the development of lymphedema. It should be noted that our study had another limitation due to the lack of data from patients who had undergone BC treatment but did not develop BCRL. However, a few recent studies have reported changes in the blood plasma metabolome following surgical and chemotherapy treatment of BC [16,17]. Pathways altered after 1 month include purine metabolism, galactose metabolism and several others [16]. One year after BC treatment changes in lysine degradation, branched-chain amino acids (BCAA) metabolism, linoeic acid metabolism, and tyrosine metabolism have been observed [17]. In the current study, most patients undergone chemotherapy and surgery more than one year prior to sample collection (Table S1), and all patients showed no signs of BC recurrence.
Most of the enriched metabolic sets listed in the Table 3 characterize the activation of energy production pathways. The processes of BCRL development are accompanied by activation of the defense mechanisms required by the body for an effective response to the disease. Usually, energy deficiency manifests itself in an increase in the content of intermediates of the tricarboxylic acid cycle, protein metabolism and fatty acid oxidation. In our case, the processes related to the TCA cycle, the degradation of valine, leucine and isoleucine (BCAA), the metabolism of other amino acids, pyruvate, and lipoic acid are noted. These processes indicate the activity of glycolysis or gluconeogenesis in the body (which is also in the QMSEA list, Table 3), and they are involved in replenishing the energy needs of the body to fight the disease. It is worth noting the activation of the synthesis of pantothenate and coenzyme A, which are important substrates of the metabolism of carbohydrates, proteins and fatty acids, complements the hypothesis of activation of energy production processes [18].
In addition to the energy role, metabolic processes involving glutamine may reflect increased activity of immune cells, since glutamine is used as an energy source by immune cells – lymphocytes, neutrophils and macrophages [19]. Branched-chain amino acids have been shown to play a signaling role in regulatory T-cells, which are a subset of immune cells that, among other activities, perform immunosuppressive functions [20].
The metabolism of methylating agents – serine, glycine, betaine, and methionine – affects key biochemical processes. It is particularly interesting that hypermethylation, according to previous studies, is associated with shifting immune responses toward a T-helper 2 (Th2) proinflammatory response, and also contributes to an increase in cytokine production, thereby generally intensifying inflammation [21,22]. It was described earlier [4] that the inflammatory response in secondary lymphedema typically involves upregulated expression of various cytokines and chemokines, as well as an increase in the accumulation and activation of immune cells. In a mouse model, an increased number of CD4+ T cells and increased Th2 differentiation were observed [23]. Th2 cells play a significant role in the pathogenesis of lymphedema, as inhibition of their differentiation has been shown to reduce fibrosis and improve lymphatic function [23,24]. Thus, information on altered in the metabolism of methylating agents may be used for the development of subsequent studies on BCRL.
The data obtained demonstrate the potential for further search and verification of biomarkers though targeted monitoring of metabolites in these pathways on a larger cohort, enabling a more reliable assessment of deviations in the biochemical processes involving these metabolites.
5. Conclusions
Based on the results of the statistical analysis of 1H NMR quantitative data obtained from serum and ISF samples from BCRL and control patient groups, we made the following observations. Serum and ISF display a rather similar metabolomic composition, though concentrations of nearly all compounds are slightly higher in serum compared to ISF. Significant differences in metabolite concentrations between the serum of BCRL and control patients were identified using multiple statistical methods. Differential metabolites that may serve as potential biomarkers for lymphedema are 2-ketoisovaleric acid, 3-methyl-2-oxovaleric acid, ketoleucine, pyruvic acid, tryptophan, proline, creatine, isoleucine, isobutyric acid, leucine, and creatinine. The most significantly altered metabolic pathways, as evaluated by enrichment analysis, include “Arginine and proline metabolism”, pathways of branched-chain amino acids, “Pantothenate and CoA biosynthesis”, “Tryptophan metabolism”, “Glycolysis/Gluconeogenesis”, “Glycine, serine and threonine metabolism”, “Alanine, aspartate and glutamate metabolism”, “Glyoxylate and dicarboxylate metabolism”, all of which are associated with the activation of energy production and inflammation.
Supplementary Materials
The following supporting information can be downloaded at the website of this paper posted on Preprints.org, Figure S1: Distribution of average ratios of metabolite concentrations in serum to ISF in BCRL patients; Figure S2: Biomarker analysis between serum samples from BCRL and control patients; Figure S3: Boxplots for the concentrations of differential metabolites; Table S1: Description of patients; Table S2: Concentrations of metabolites in samples; Table S3: Result of univariate biomarker analysis; Table S4: The result of quantitative metabolite sets enrichment analysis.
Author Contributions
Conceptualization, L.V.Y. and V.V.N.; methodology, L.V.Y., N.A.O., and Y.P.T.; formal analysis, V.V.Y., L.V.Y., and D.S.G.; investigation, L.V.Y., D.S.G. and N.A.O.; resources, V.V.N.; visualization, L.V.Y., D.S.G., and V.V.Y; data curation, writing—original draft preparation, V.V.Y.; writing—review and editing, L.V.Y., N.A.O., and Y.P.T.; project administration, funding acquisition, L.V.Y.; supervision, Y.P.T. All authors have read and agreed to the published version of the manuscript. All authors have read and agreed to the published version of the manuscript.
Funding
This research was funded by the Russian Science Foundation, grant number 23-25-00462, https://rscf.ru/project/23-25-00462/.
Institutional Review Board Statement
The investigations were conducted in accordance with the principles outlined in the Declaration of Helsinki 2008 (https://www.wma.net/what-we-do/medical-ethics/declaration-of-helsinki/doh-oct2008/, accessed on 03.10.2024), which delineate ethical principles for medical research involving human subjects. Ethical approval was obtained from the International Tomography Center SB RAS (#ECITC-2020-12 from 16.12.2020) and the Research Institute of Clinical and Experimental Lymphology – Branch of the Institute of Cytology and Genetics SB RAS (#159 from 20.07.2020). No special permission from national or local authorities was required.
Informed Consent Statement
Written informed consent was obtained from all patients after a thorough explanation of the study's nature and potential consequences.
Data Availability Statement
The dataset is available at the NIH Common Fund's National Metabolomics Data Repository (NMDR) website, the Metabolomics Workbench (https://www.metabolomicsworkbench.org, accessed on 03.10.2024), where it has been assigned Project ID ST003506 (http://dx.doi.org/10.21228/M8FR6S, accessed on 22.10.2024). This dataset is also available in AMDB repository by the following link: https://amdb.online/amdb/experiments/291/ (accessed on 03.10.2024). The dataset contains NMR raw data, sample descriptions, metabolite concentrations, and experimental protocols.
Acknowledgments
We thank the Ministry of Science and Higher Education of the RF for access to NMR and LC-MS equipment. The clinical assessment and blood samples collection were carried out at the expense of the state funding of the RICEL—Branch of IC&G SB RAS.
Conflicts of Interest
The authors declare no conflicts of interest.
References
- DiSipio, T.; Rye, S.; Newman, B.; Hayes, S. Incidence of Unilateral Arm Lymphoedema after Breast Cancer: A Systematic Review and Meta-Analysis. Lancet Oncol 2013, 14, 500–515. [Google Scholar] [CrossRef] [PubMed]
- Shaitelman, S.F.; Cromwell, K.D.; Rasmussen, J.C.; Stout, N.L.; Armer, J.M.; Lasinski, B.B.; Cormier, J.N. Recent Progress in the Treatment and Prevention of Cancer-Related Lymphedema. CA Cancer J Clin 2015, 65, 55–81. [Google Scholar] [CrossRef] [PubMed]
- Mayrovitz, H.N. Measuring Breast Cancer-Related Lymphedema. In Breast Cancer; Mayrovitz, H.N., Ed.; Exon Publications: Brisbane (AU), 2022; ISBN 978-0-645-33203-2. [Google Scholar]
- Duhon, B.H.; Phan, T.T.; Taylor, S.L.; Crescenzi, R.L.; Rutkowski, J.M. Current Mechanistic Understandings of Lymphedema and Lipedema: Tales of Fluid, Fat, and Fibrosis. Int J Mol Sci 2022, 23, 6621. [Google Scholar] [CrossRef] [PubMed]
- Martínez-Jaimez, P.; Armora Verdú, M.; Forero, C.G.; Álvarez Salazar, S.; Fuster Linares, P.; Monforte-Royo, C.; Masia, J. Breast Cancer-Related Lymphoedema: Risk Factors and Prediction Model. J Adv Nurs 2022, 78, 765–775. [Google Scholar] [CrossRef]
- Ashrafian, H.; Sounderajah, V.; Glen, R.; Ebbels, T.; Blaise, B.J.; Kalra, D.; Kultima, K.; Spjuth, O.; Tenori, L.; Salek, R.M.; et al. Metabolomics: The Stethoscope for the Twenty-First Century. Medical Principles and Practice 2020, 30, 301–310. [Google Scholar] [CrossRef]
- His, M.; Gunter, M.J.; Keski-Rahkonen, P.; Rinaldi, S. Application of Metabolomics to Epidemiologic Studies of Breast Cancer: New Perspectives for Etiology and Prevention. J Clin Oncol 2024, 42, 103–115. [Google Scholar] [CrossRef]
- Konenkov, V.I.; Nimaev, V.V.; Shevchenko, A.V.; Prokofiev, V.F. Polymorphism of Angiogenesis Regulation Factor Genes (VEGF/VEGFR), and Extracellular Matrix Remodeling Genes (MMP/TIMP), and the Levels of Their Products in Extracellular Tissues of Patients with Primary and Secondary Lymphedema. Vavilovskii Zhurnal Genet Selektsii 2024, 28, 433–442. [Google Scholar] [CrossRef]
- Yanshole, V.V.; Yanshole, L.V.; Snytnikova, O.A.; Tsentalovich, Y.P. Quantitative Metabolomic Analysis of Changes in the Lens and Aqueous Humor under Development of Age-Related Nuclear Cataract. Metabolomics 2019, 15, 29. [Google Scholar] [CrossRef]
- Zelentsova, E.A.; Yanshole, L.V.; Tsentalovich, Y.P.; Sharshov, K.A.; Yanshole, V.V. The Application of Quantitative Metabolomics for the Taxonomic Differentiation of Birds. Biology 2022, 11, 1089. [Google Scholar] [CrossRef]
- Yanshole, V.V.; Yanshole, L.V.; Zelentsova, E.A.; Tsentalovich, Y.P. Ovothiol A Is the Main Antioxidant in Fish Lens. Metabolites 2019, 9, 95. [Google Scholar] [CrossRef]
- Tsentalovich, Y.P.; Yanshole, V.V.; Yanshole, L.V.; Zelentsova, E.A.; Melnikov, A.D.; Sagdeev, R.Z. Seasonal Variations and Interspecific Differences in Metabolomes of Freshwater Fish Tissues: Quantitative Metabolomic Profiles of Lenses and Gills. Metabolites 2019, 9, 264. [Google Scholar] [CrossRef]
- Yanshole, V.V.; Melnikov, A.D.; Yanshole, L.V.; Zelentsova, E.A.; Snytnikova, O.A.; Osik, N.A.; Fomenko, M.V.; Savina, E.D.; Kalinina, A.V.; Sharshov, K.A.; et al. Animal Metabolite Database: Metabolite Concentrations in Animal Tissues and Convenient Comparison of Quantitative Metabolomic Data. Metabolites 2023, 13, 1088. [Google Scholar] [CrossRef]
- Wiig, H.; Swartz, M.A. Interstitial Fluid and Lymph Formation and Transport: Physiological Regulation and Roles in Inflammation and Cancer. Physiological Reviews 2012, 92, 1005–1060. [Google Scholar] [CrossRef]
- Chachaj, A.; Matkowski, R.; Gröbner, G.; Szuba, A.; Dudka, I. Metabolomics of Interstitial Fluid, Plasma and Urine in Patients with Arterial Hypertension: New Insights into the Underlying Mechanisms. Diagnostics 2020, 10, 936. [Google Scholar] [CrossRef]
- Jiménez-Franco, A.; Jiménez-Aguilar, J.M.; Canela-Capdevila, M.; García-Pablo, R.; Castañé, H.; Martínez-Navidad, C.; Araguas, P.; Malavé, B.; Benavides-Villarreal, R.; Acosta, J.C.; et al. Preliminary Metabolomics Study Suggests Favorable Metabolic Changes in the Plasma of Breast Cancer Patients after Surgery and Adjuvant Treatment. Biomedicines 2024, 12, 2196. [Google Scholar] [CrossRef]
- Lyon, D.E.; Yao, Y.; Garrett, T.; Kelly, D.L.; Cousin, L.; Archer, K.J. Comparison of Serum Metabolomics in Women with Breast Cancer Prior to Chemotherapy and at 1 Year: Cardiometabolic Implications. BMC Womens Health 2023, 23, 221. [Google Scholar] [CrossRef]
- Litwack, G. Vitamins and Nutrition. In Human Biochemistry; 2018; pp. 645–680. ISBN 978-0-12-383864-3. [Google Scholar]
- Cruzat, V.; Macedo Rogero, M.; Noel Keane, K.; Curi, R.; Newsholme, P. Glutamine: Metabolism and Immune Function, Supplementation and Clinical Translation. Nutrients 2018, 10, 1564. [Google Scholar] [CrossRef]
- Yahsi, B.; Gunaydin, G. Immunometabolism - The Role of Branched-Chain Amino Acids. Front Immunol 2022, 13, 886822. [Google Scholar] [CrossRef]
- Boisvert, F.-M.; Richard, S. Arginine Methylation Regulates the Cytokine Response. Mol Cell 2004, 15, 492–494. [Google Scholar] [CrossRef]
- Schwartz, D.A. Epigenetics and Environmental Lung Disease. Proc Am Thorac Soc 2010, 7, 123–125. [Google Scholar] [CrossRef]
- Avraham, T.; Zampell, J.C.; Yan, A.; Elhadad, S.; Weitman, E.S.; Rockson, S.G.; Bromberg, J.; Mehrara, B.J. Th2 Differentiation Is Necessary for Soft Tissue Fibrosis and Lymphatic Dysfunction Resulting from Lymphedema. FASEB J 2013, 27, 1114–1126. [Google Scholar] [CrossRef] [PubMed]
- Savetsky, I.L.; Ghanta, S.; Gardenier, J.C.; Torrisi, J.S.; Nores, G.D.G.; Hespe, G.E.; Nitti, M.D.; Kataru, R.P.; Mehrara, B.J. Th2 Cytokines Inhibit Lymphangiogenesis. PLOS ONE 2015, 10, e0126908. [Google Scholar] [CrossRef] [PubMed]
Figure 1.
Representative 1H NMR spectrum for interstitial fluid of 70 y.o. patient with grade IIa lymphedema of the left upper limb. Abbreviations: 2-OH-But - 2-hydroxybutyrate, 3-Me-2-oxoValerate—3-Methyl-2-oxovalerate, 3-OH-But - 3-hydroxybutyrate, Glc – glucose, i-But – isobutyrate, MeOH—methanol. For amino acids, a standard tree letter code is used.
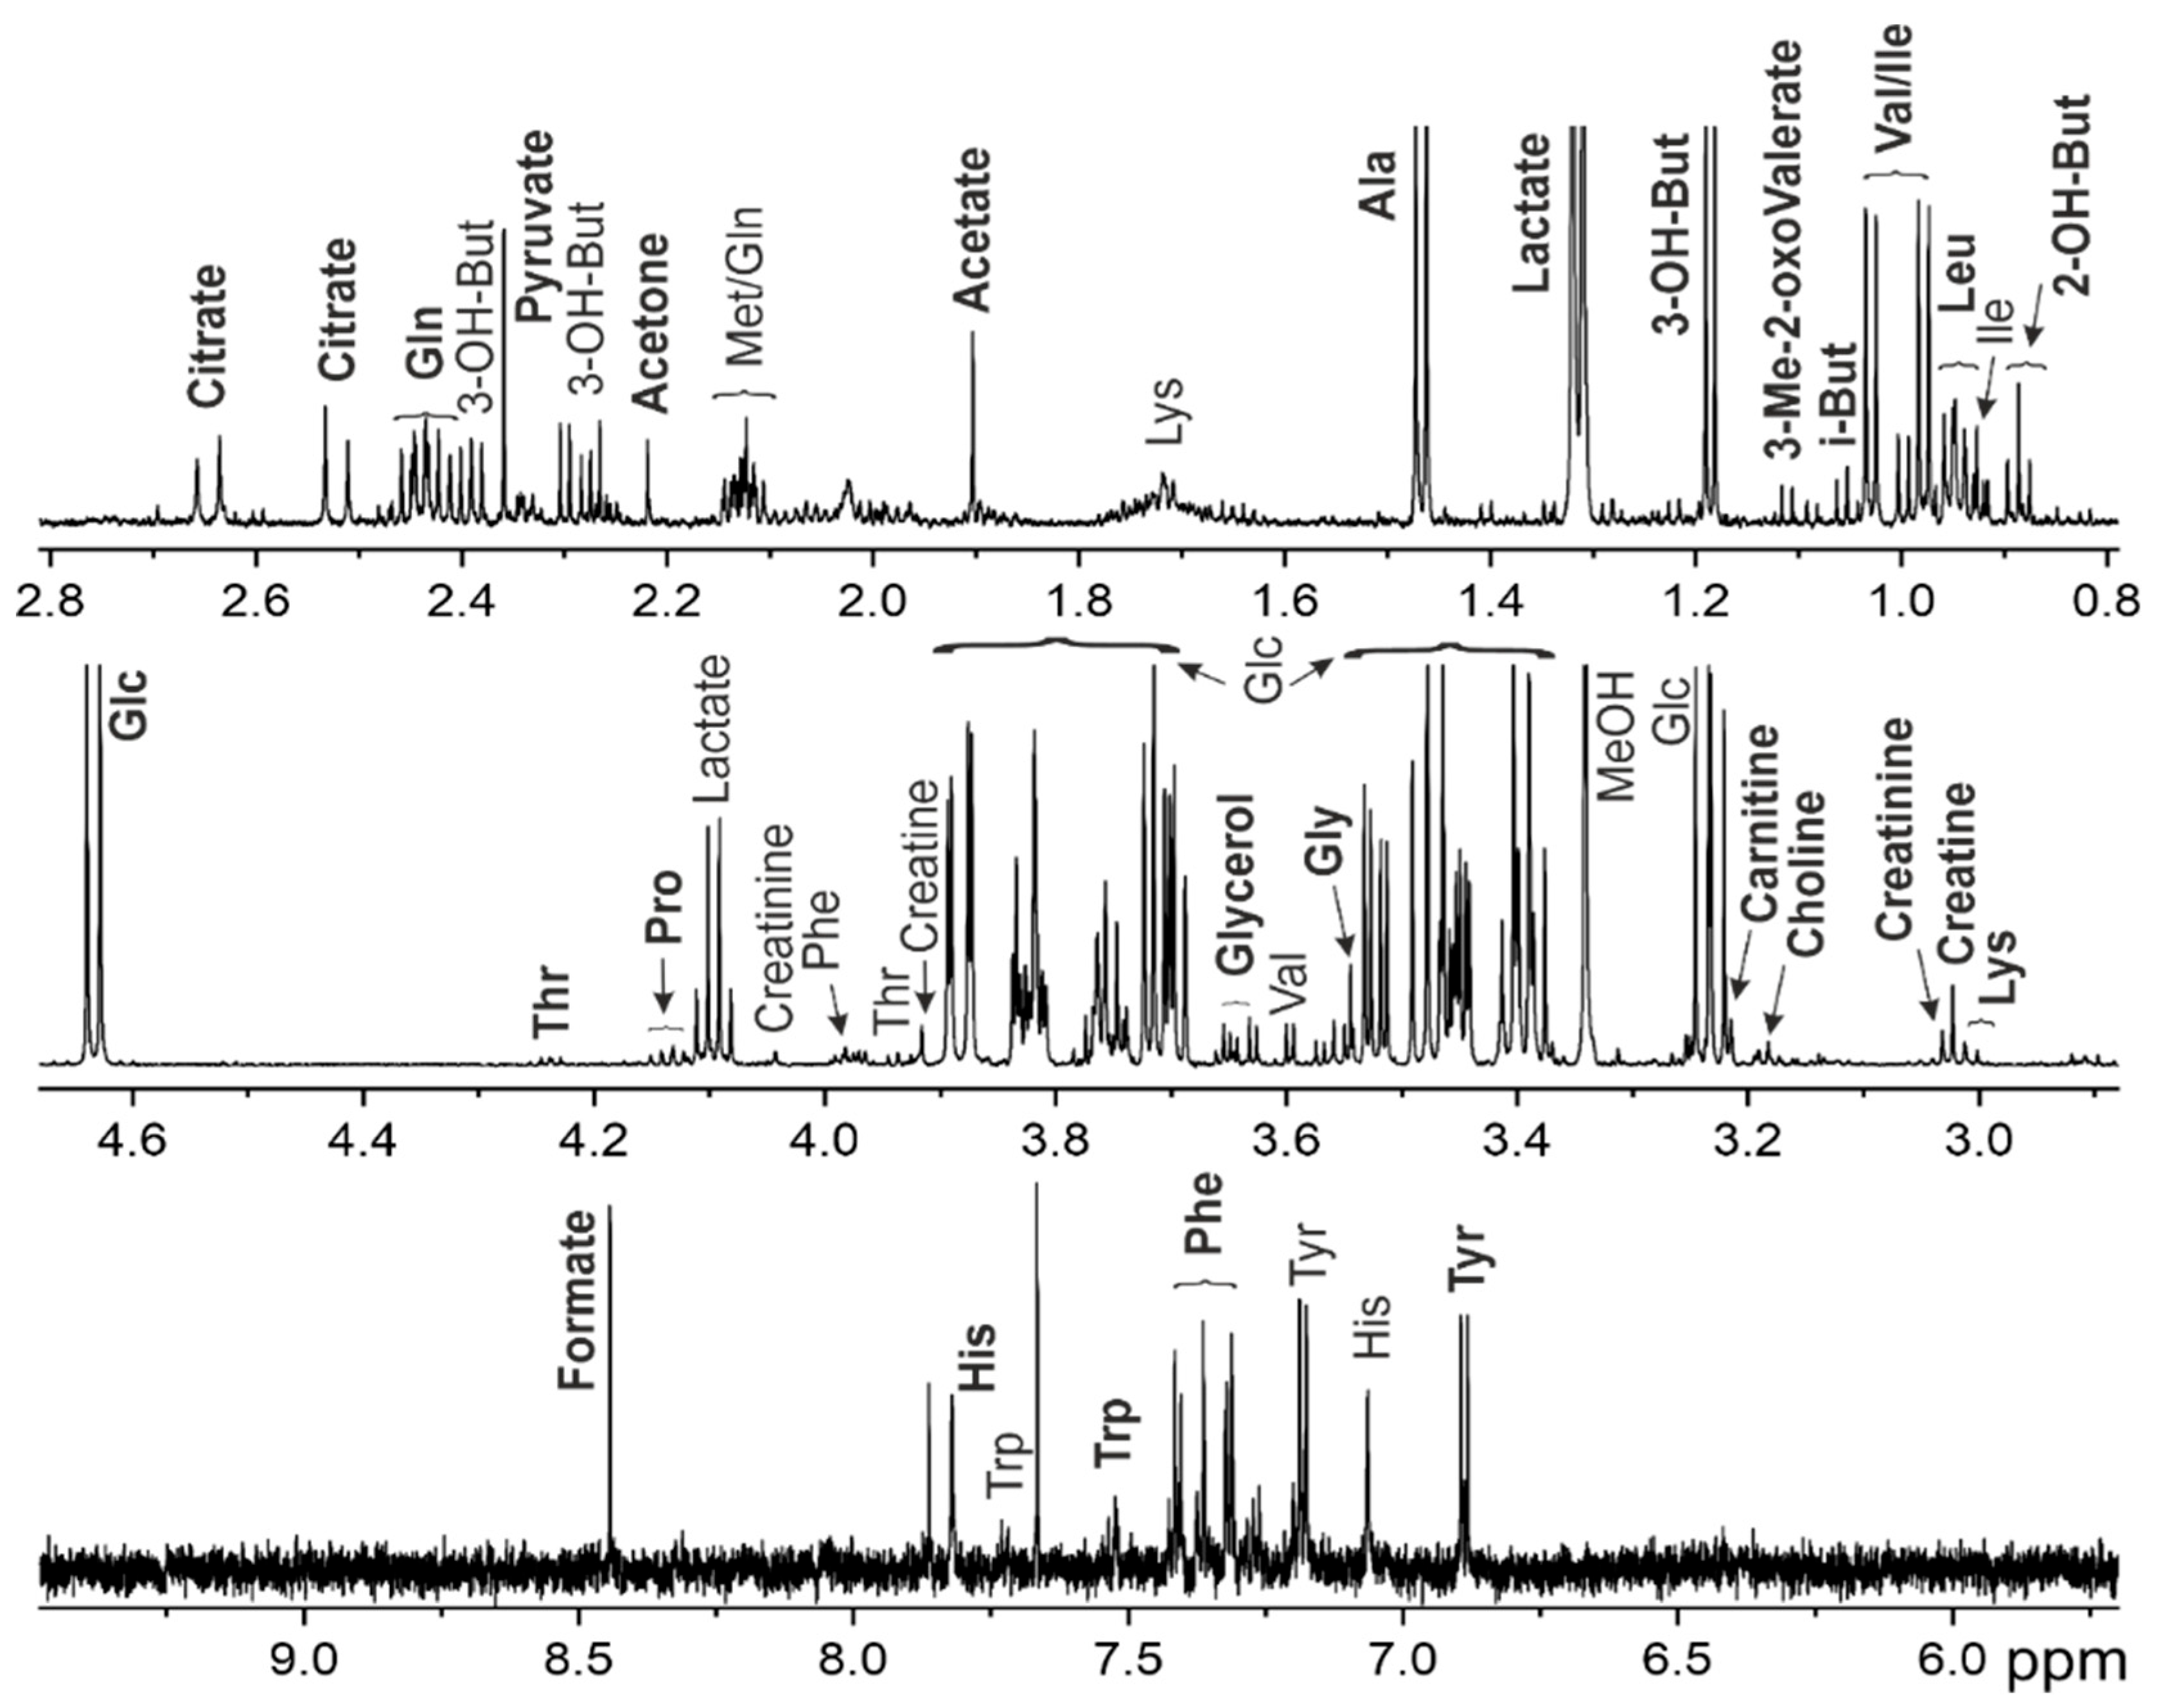
Figure 2.
Overview of the entire dataset by PCA method. (A) PCA scores and (B) loadings plots for the sample groups. SerumC (green) – serum samples from control group, SerumL (blue) – serum samples from BCRL group, ISFL (red) – interstitial fluid samples from BCRL group. Variance explained by the first (PC 1) and second (PC 2) principal components are indicated on the axis. Colored ovals indicate 95% confidence regions.
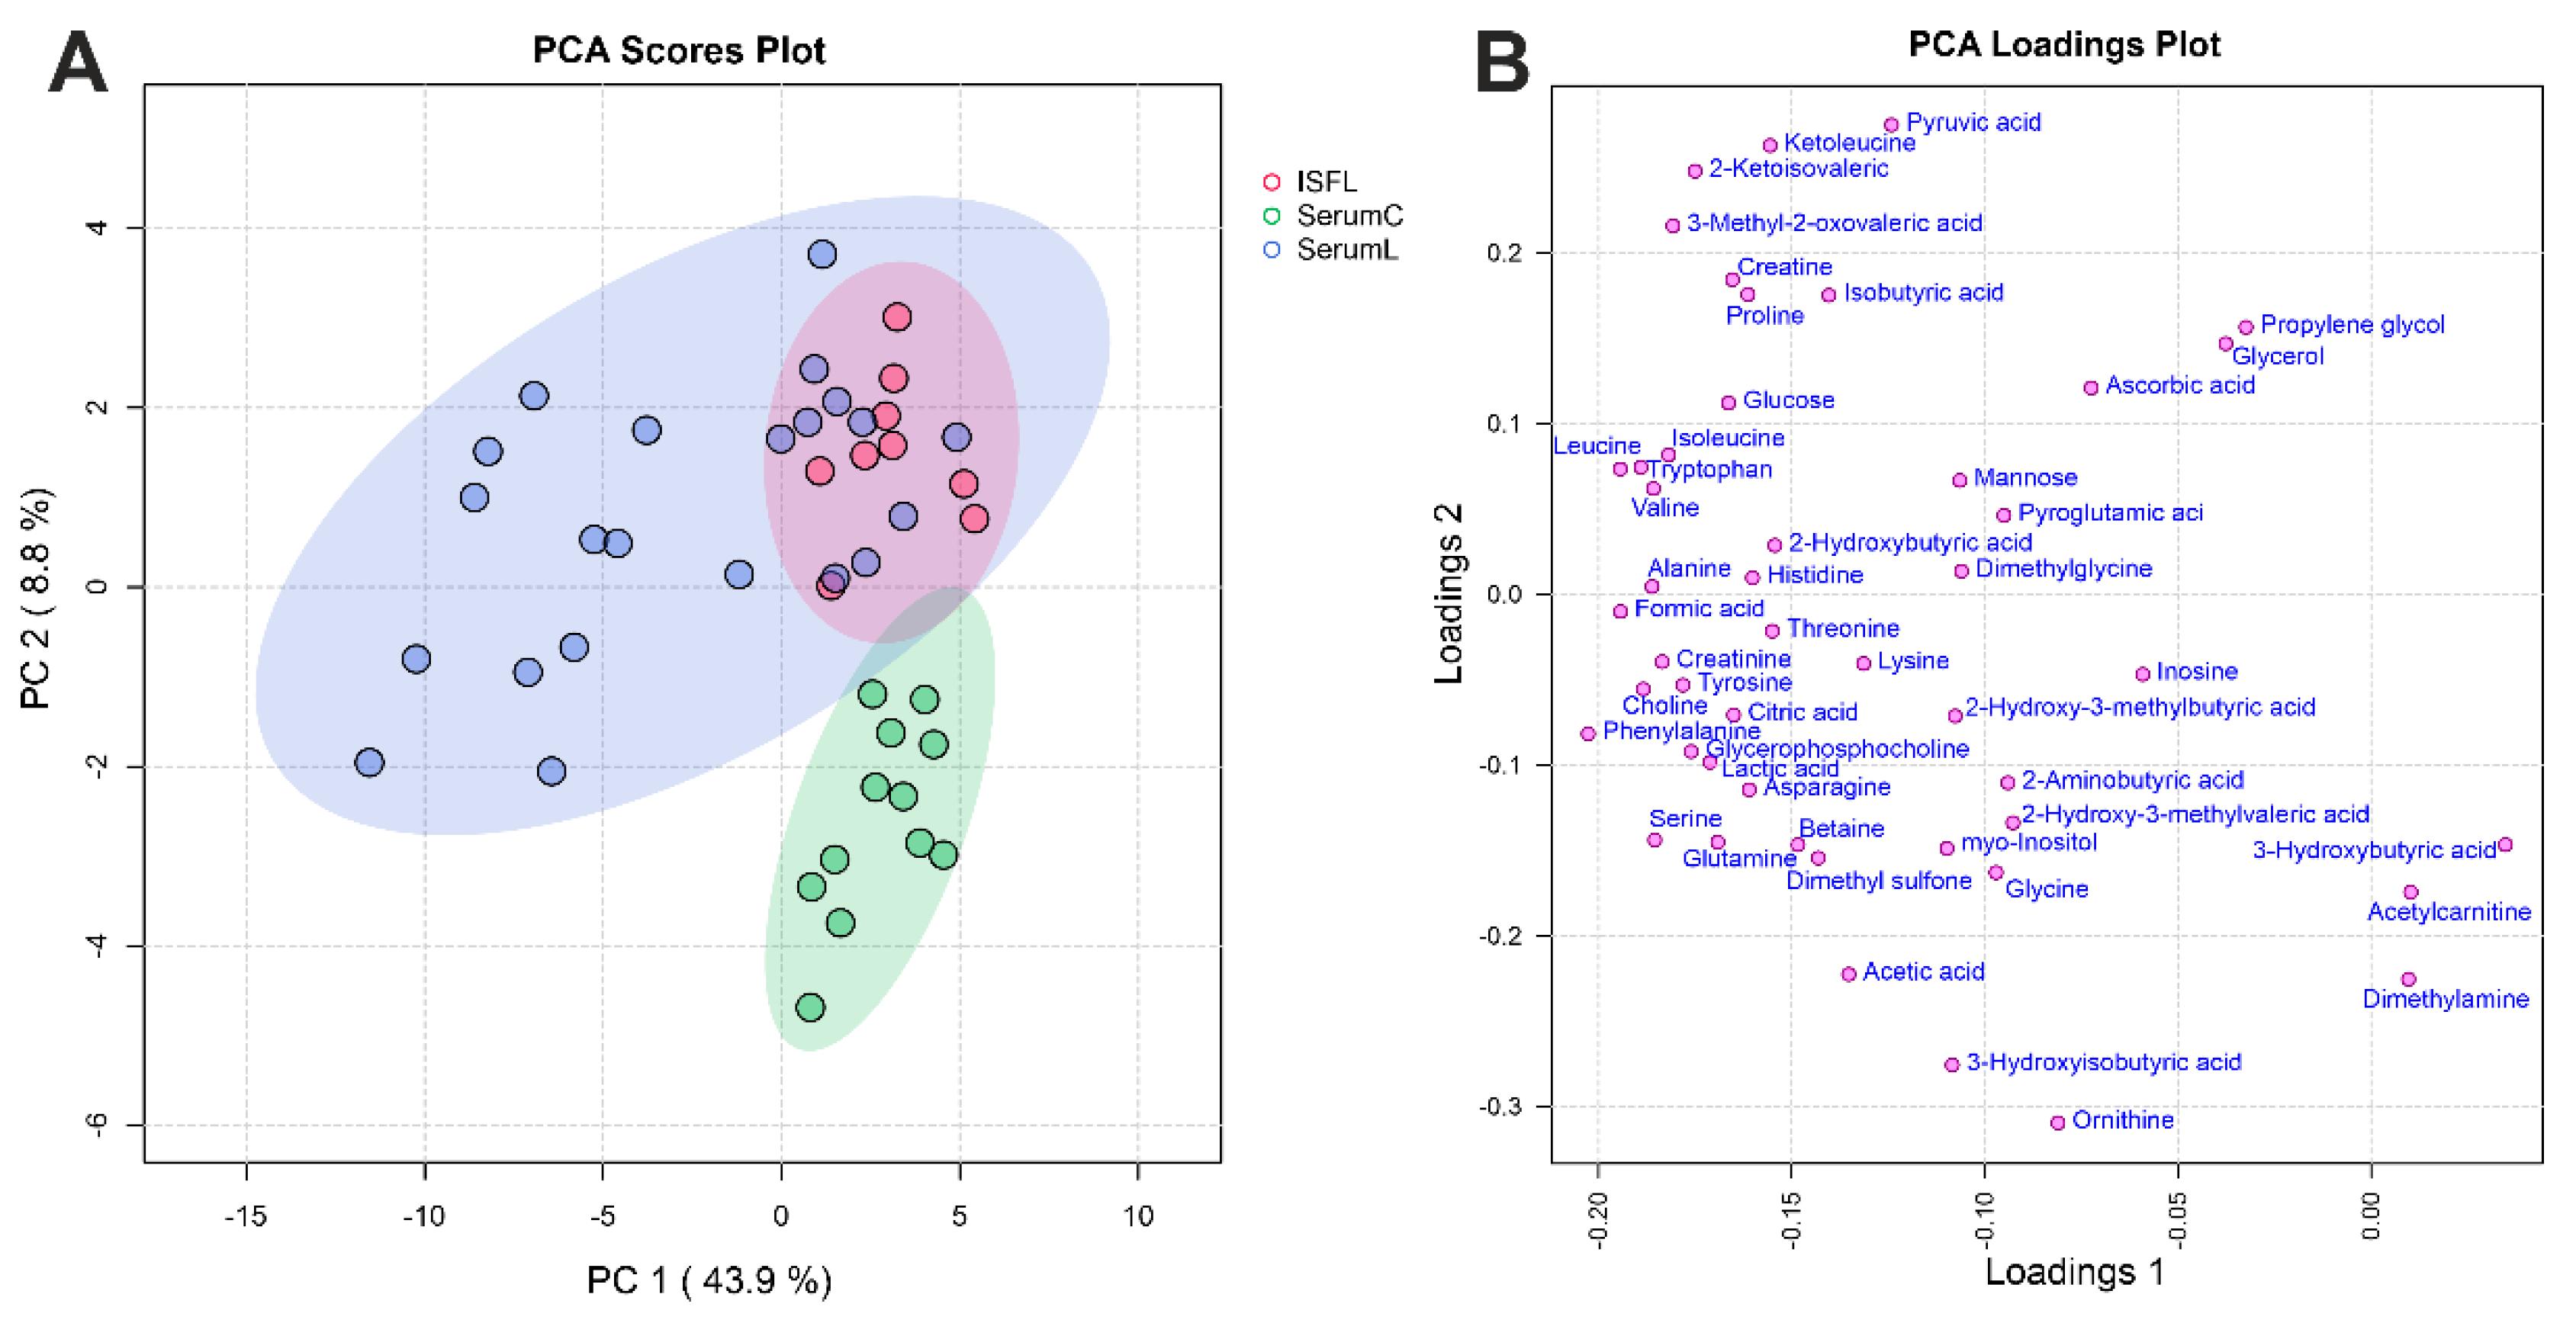
Figure 3.
Analysis of differences between serum and ISF from BCRL patients. (A) oPLS-DA scores plot between serum (SerumL, green) and ISF (ISFL, red) samples. The T-score axis represents between-group variation, and the orthogonal T-score axis – within-group variation. Colored ovals indicate 95% confidence regions. (B) VIP scores plot for the top 15 metabolites from oPLS-DA. The colored boxes on the right indicate an increase (red) or a decrease (blue) in the metabolite abundance for the corresponding group. (C) Volcano plot. The x-axis represents the mean fold change (FC) between groups, and the y-axis represents the statistical significance of changes. Dashed lines indicate thresholds, and the color and the size of the circle indicate FC and p-values, respectively.
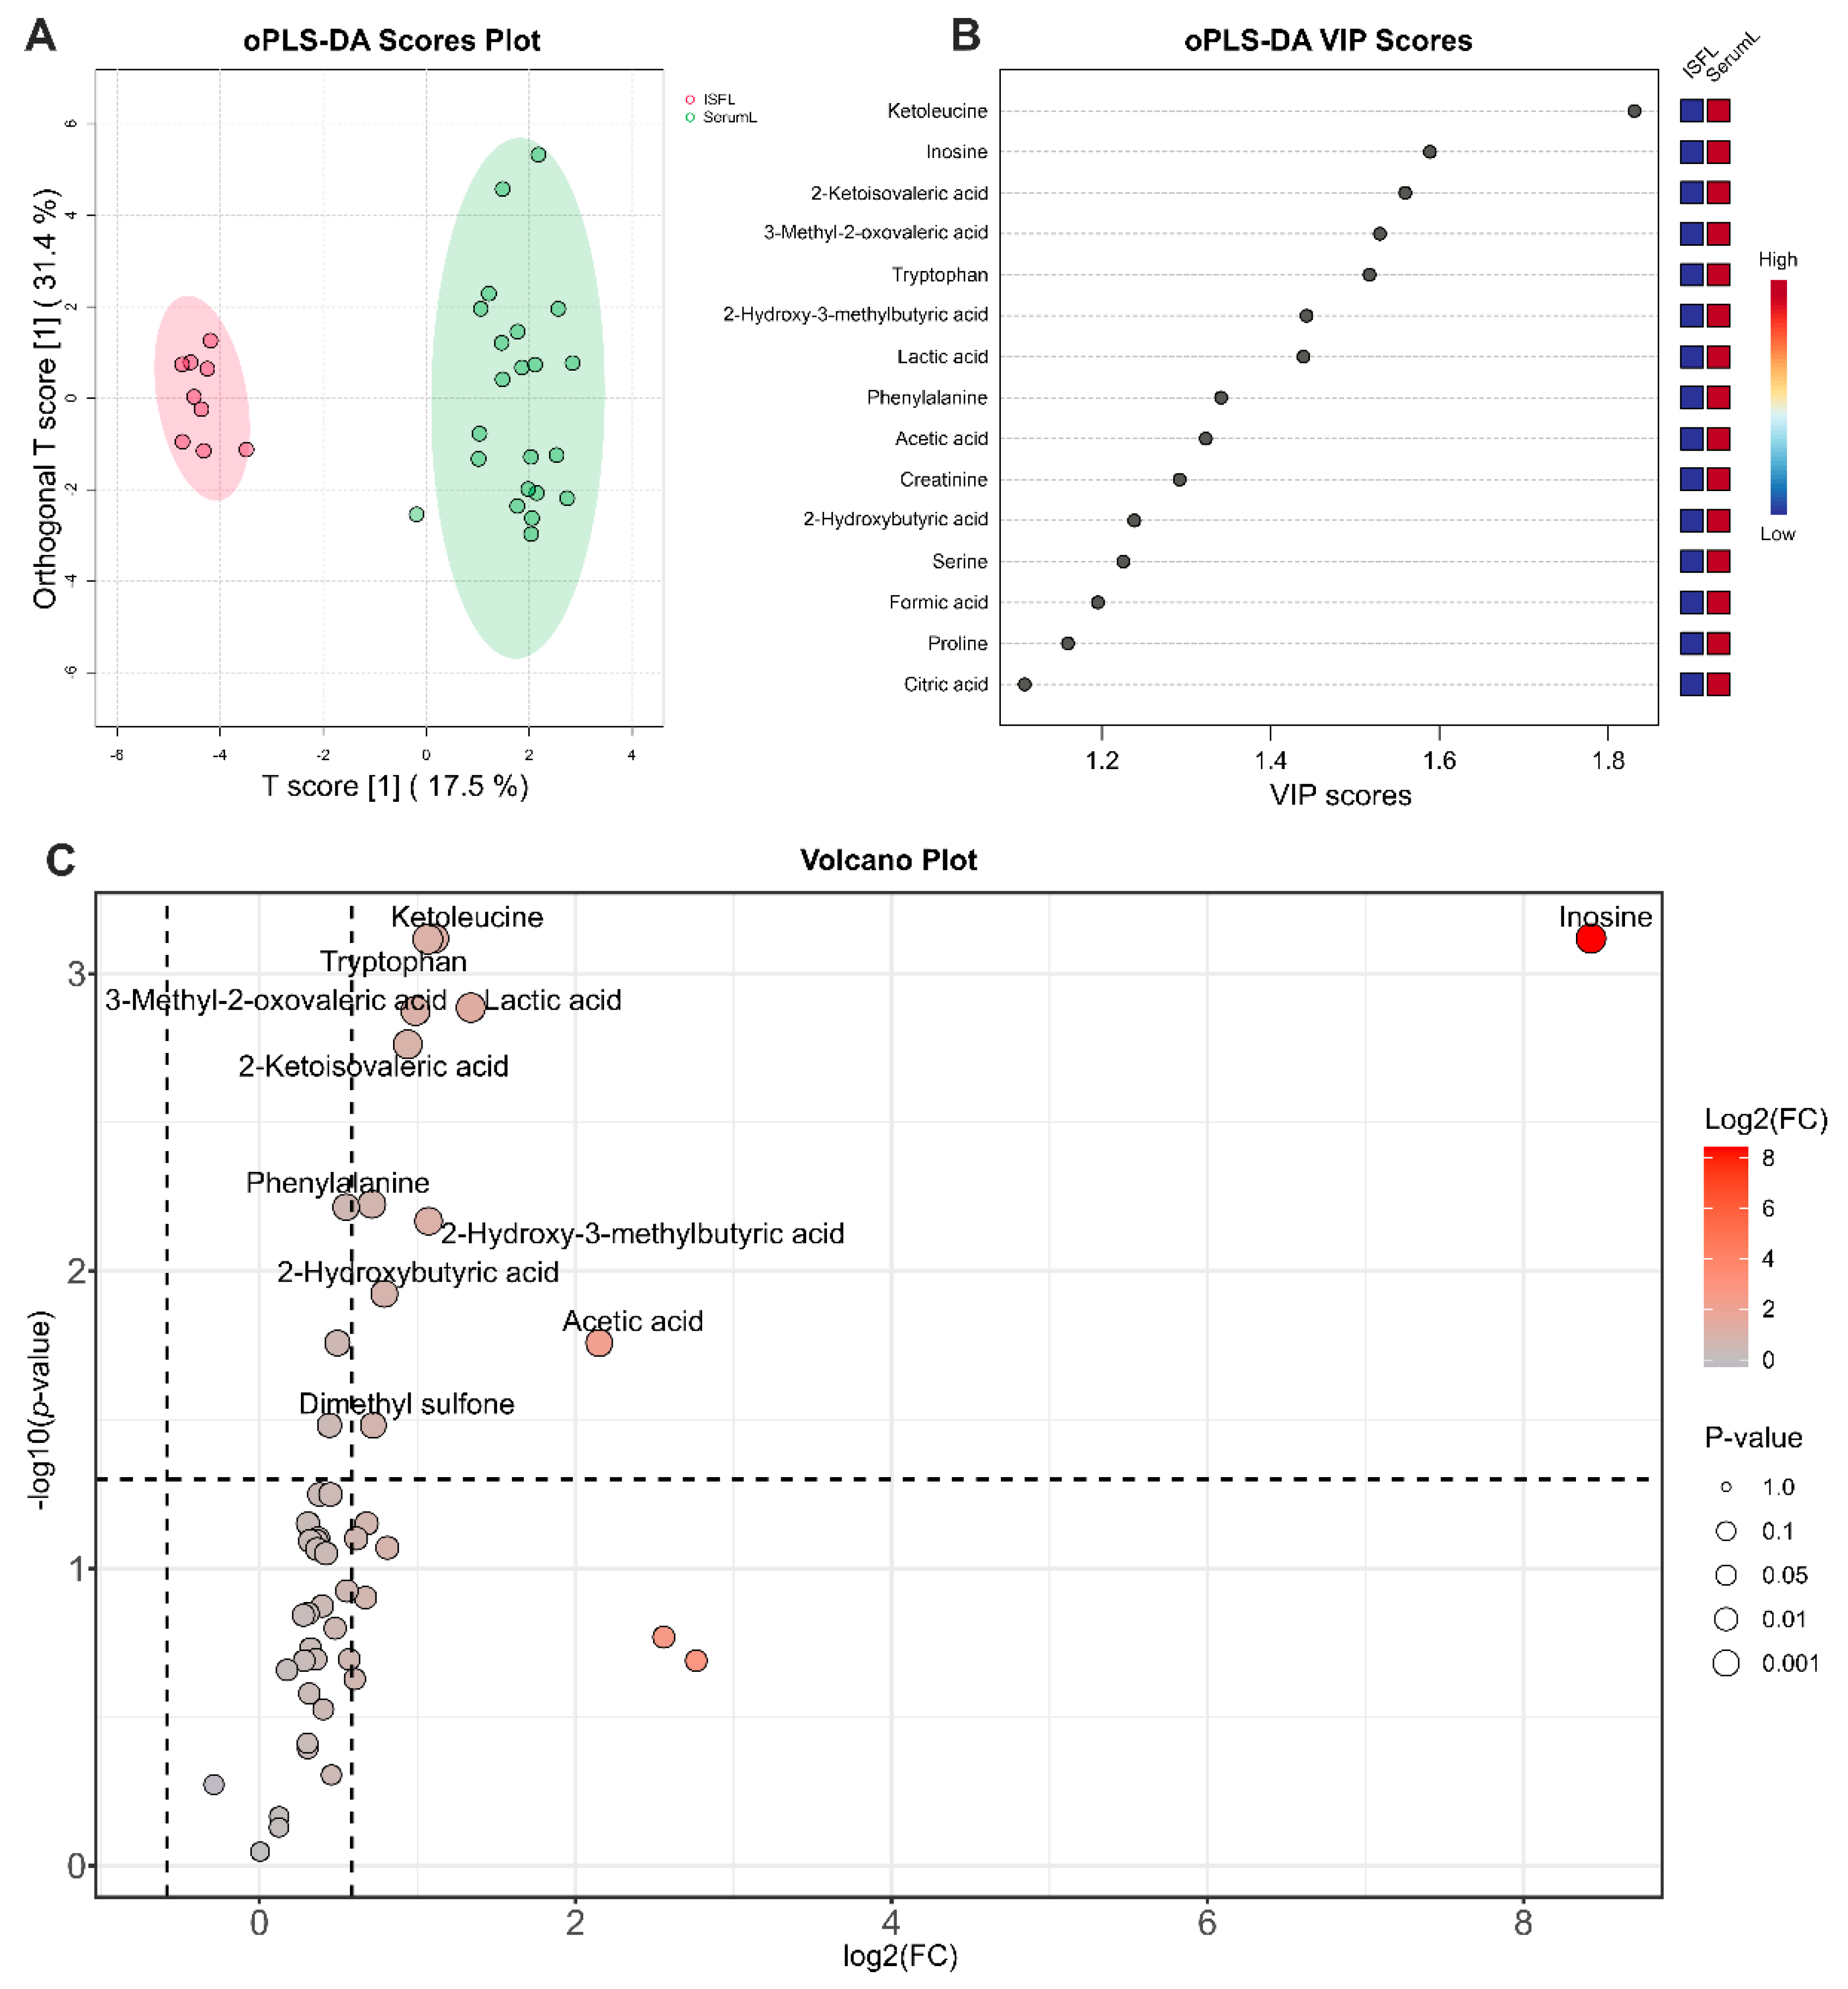
Figure 4.
Analysis of differences between serum samples from BCRL patients and controls. (A) oPLS-DA scores plot between serum samples of BCRL patients (SerumL, red) and controls (SerumC, green). The T-score axis represents between-group variation, and the orthogonal T-score axis – within-group variation. Colored ovals indicate 95% confidence regions. (B) VIP scores plot for top 15 metabolites from oPLS-DA. The colored boxes on the right indicate an increase (red) or a decrease (blue) in metabolite abundance for the corresponding group. (C) Volcano plot. The x-axis represents the mean fold change (FC) between groups, and the y-axis represent the statistical significance of changes. Dashed lines indicate thresholds, and the color and the size of the circle indicate FC and p-values, respectively.
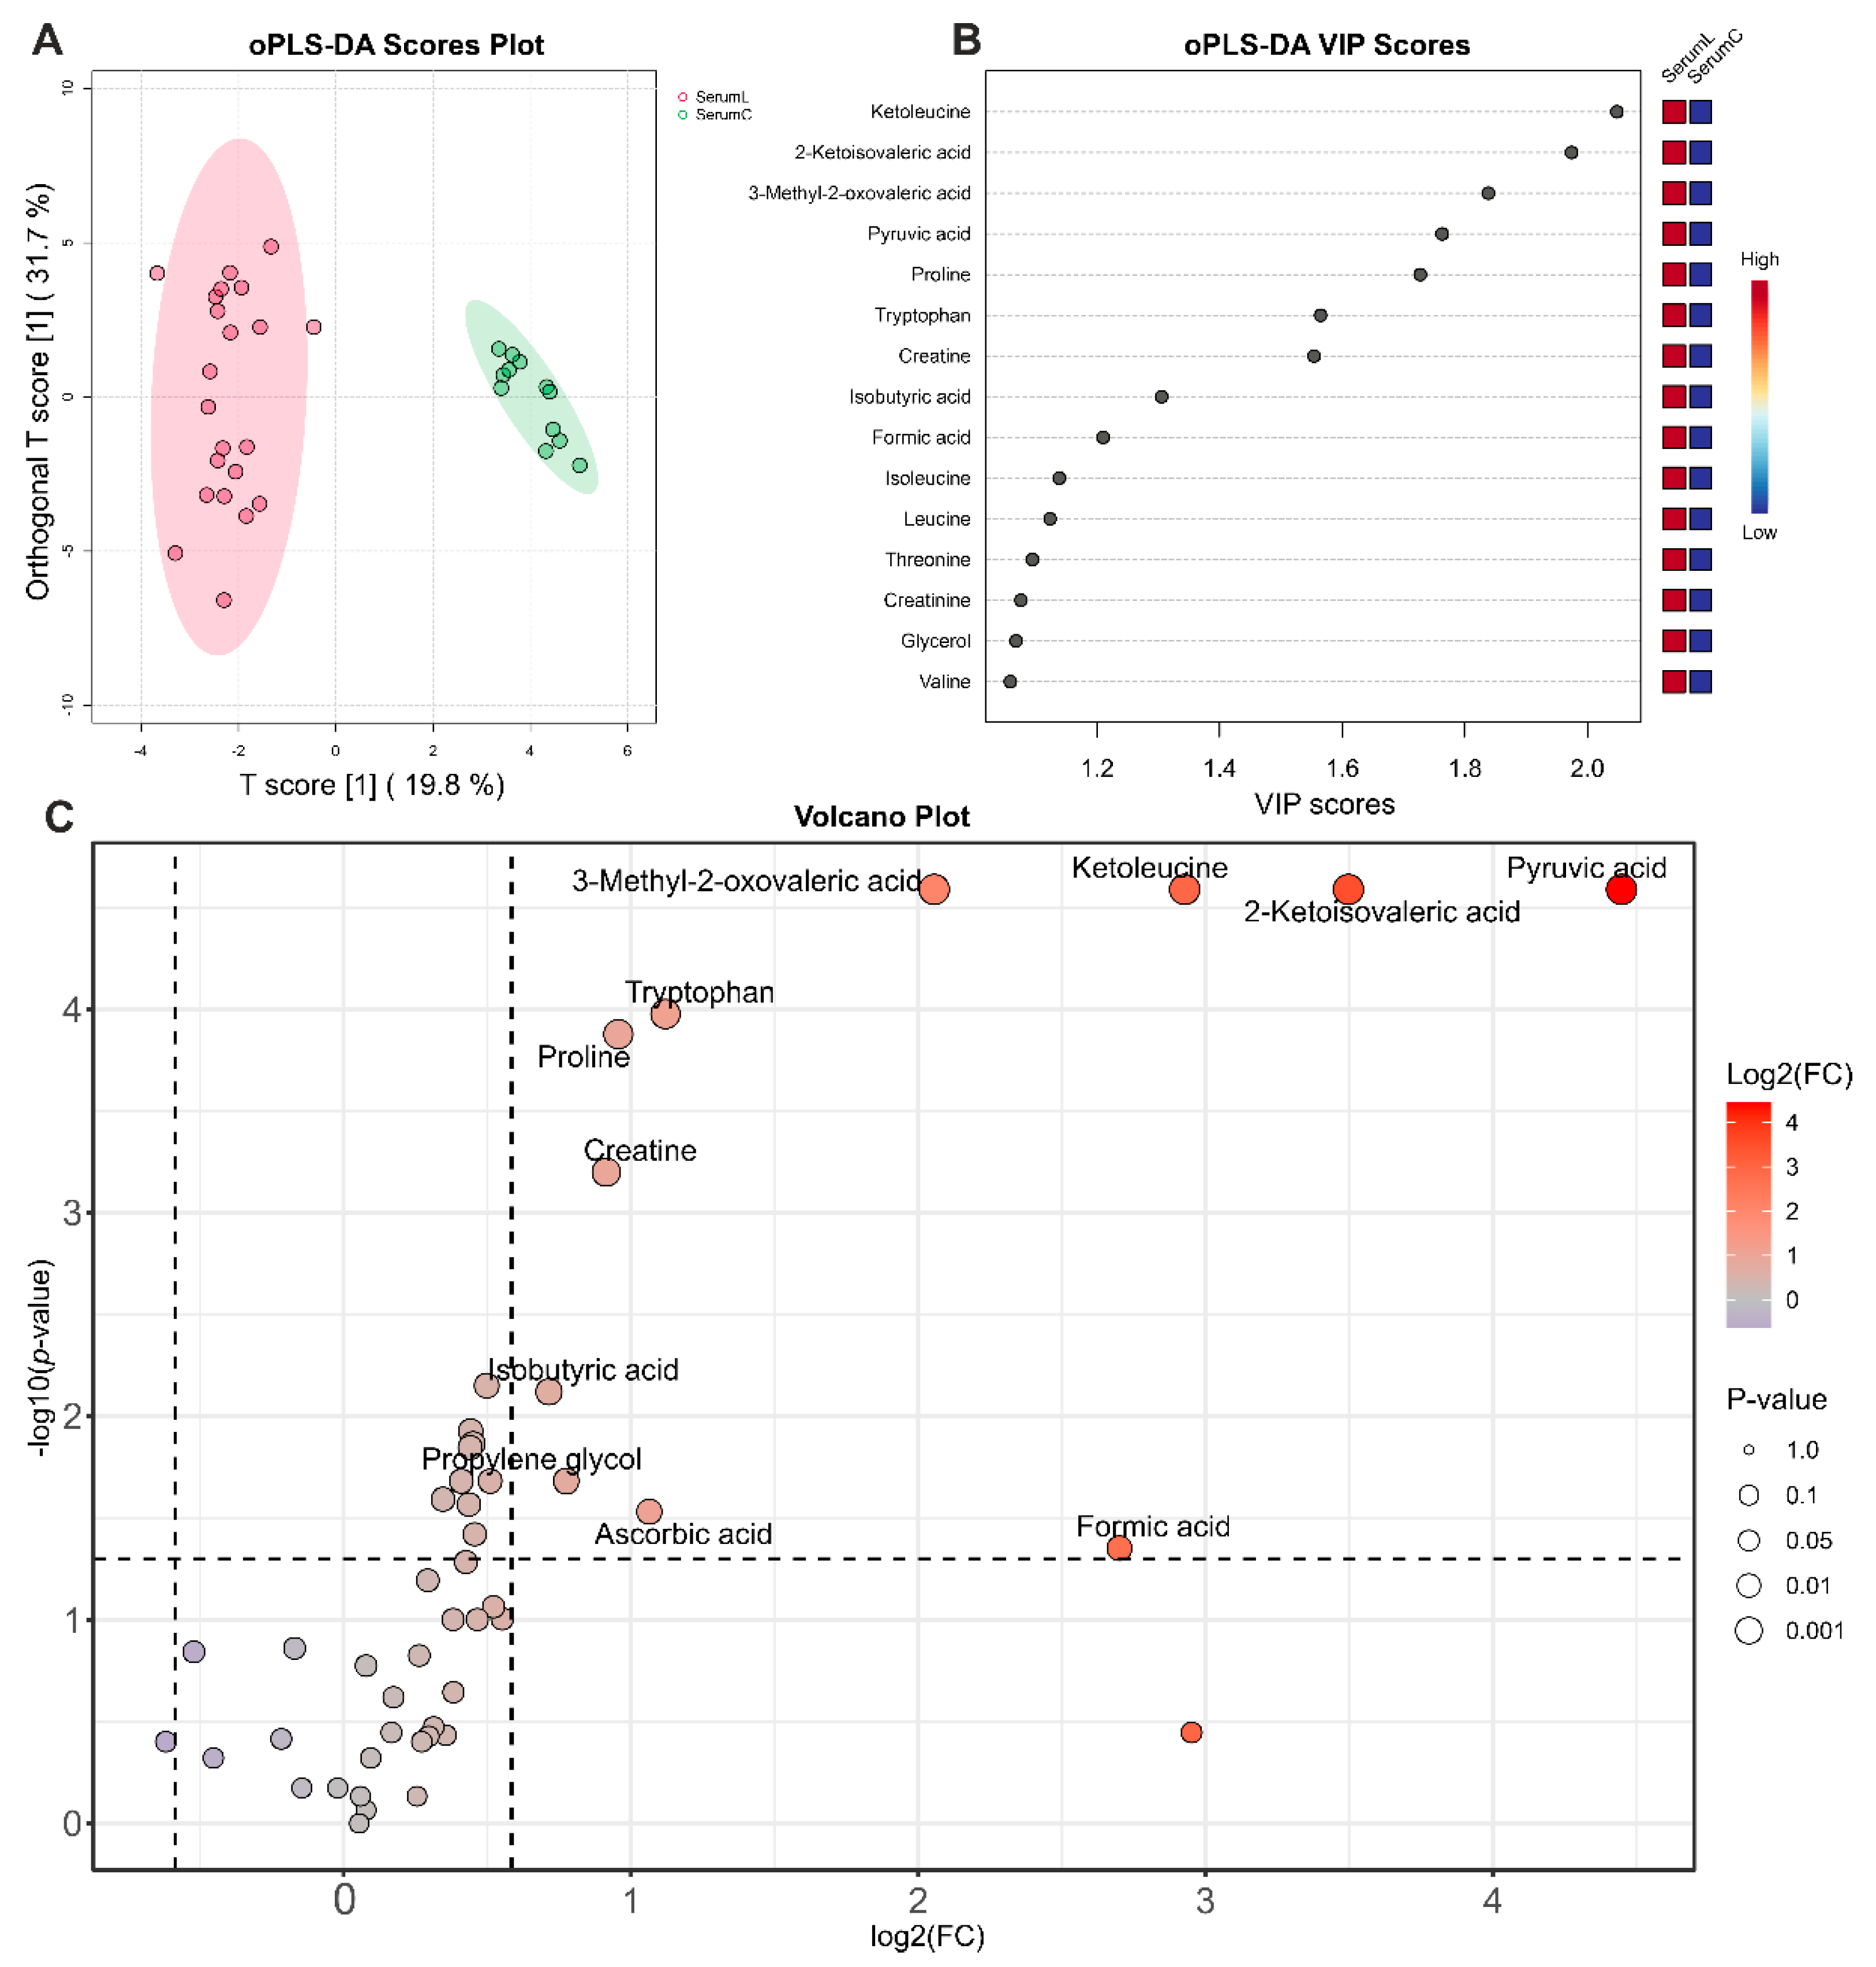
Figure 5.
Biomarker analysis between serum samples from BCRL patients (SerumL, full circles) and controls (SerumC, open circles). (A) ROC curve plot for the created biomarker model (combination of 5 metabolites), based on its average performance across all MCCV runs, with the 95 % confidence interval. (B) Predicted class probabilities for all samples using the created biomarker model. Due to balanced subsampling, the classification boundary is at the center (x = 0.5, dotted line).
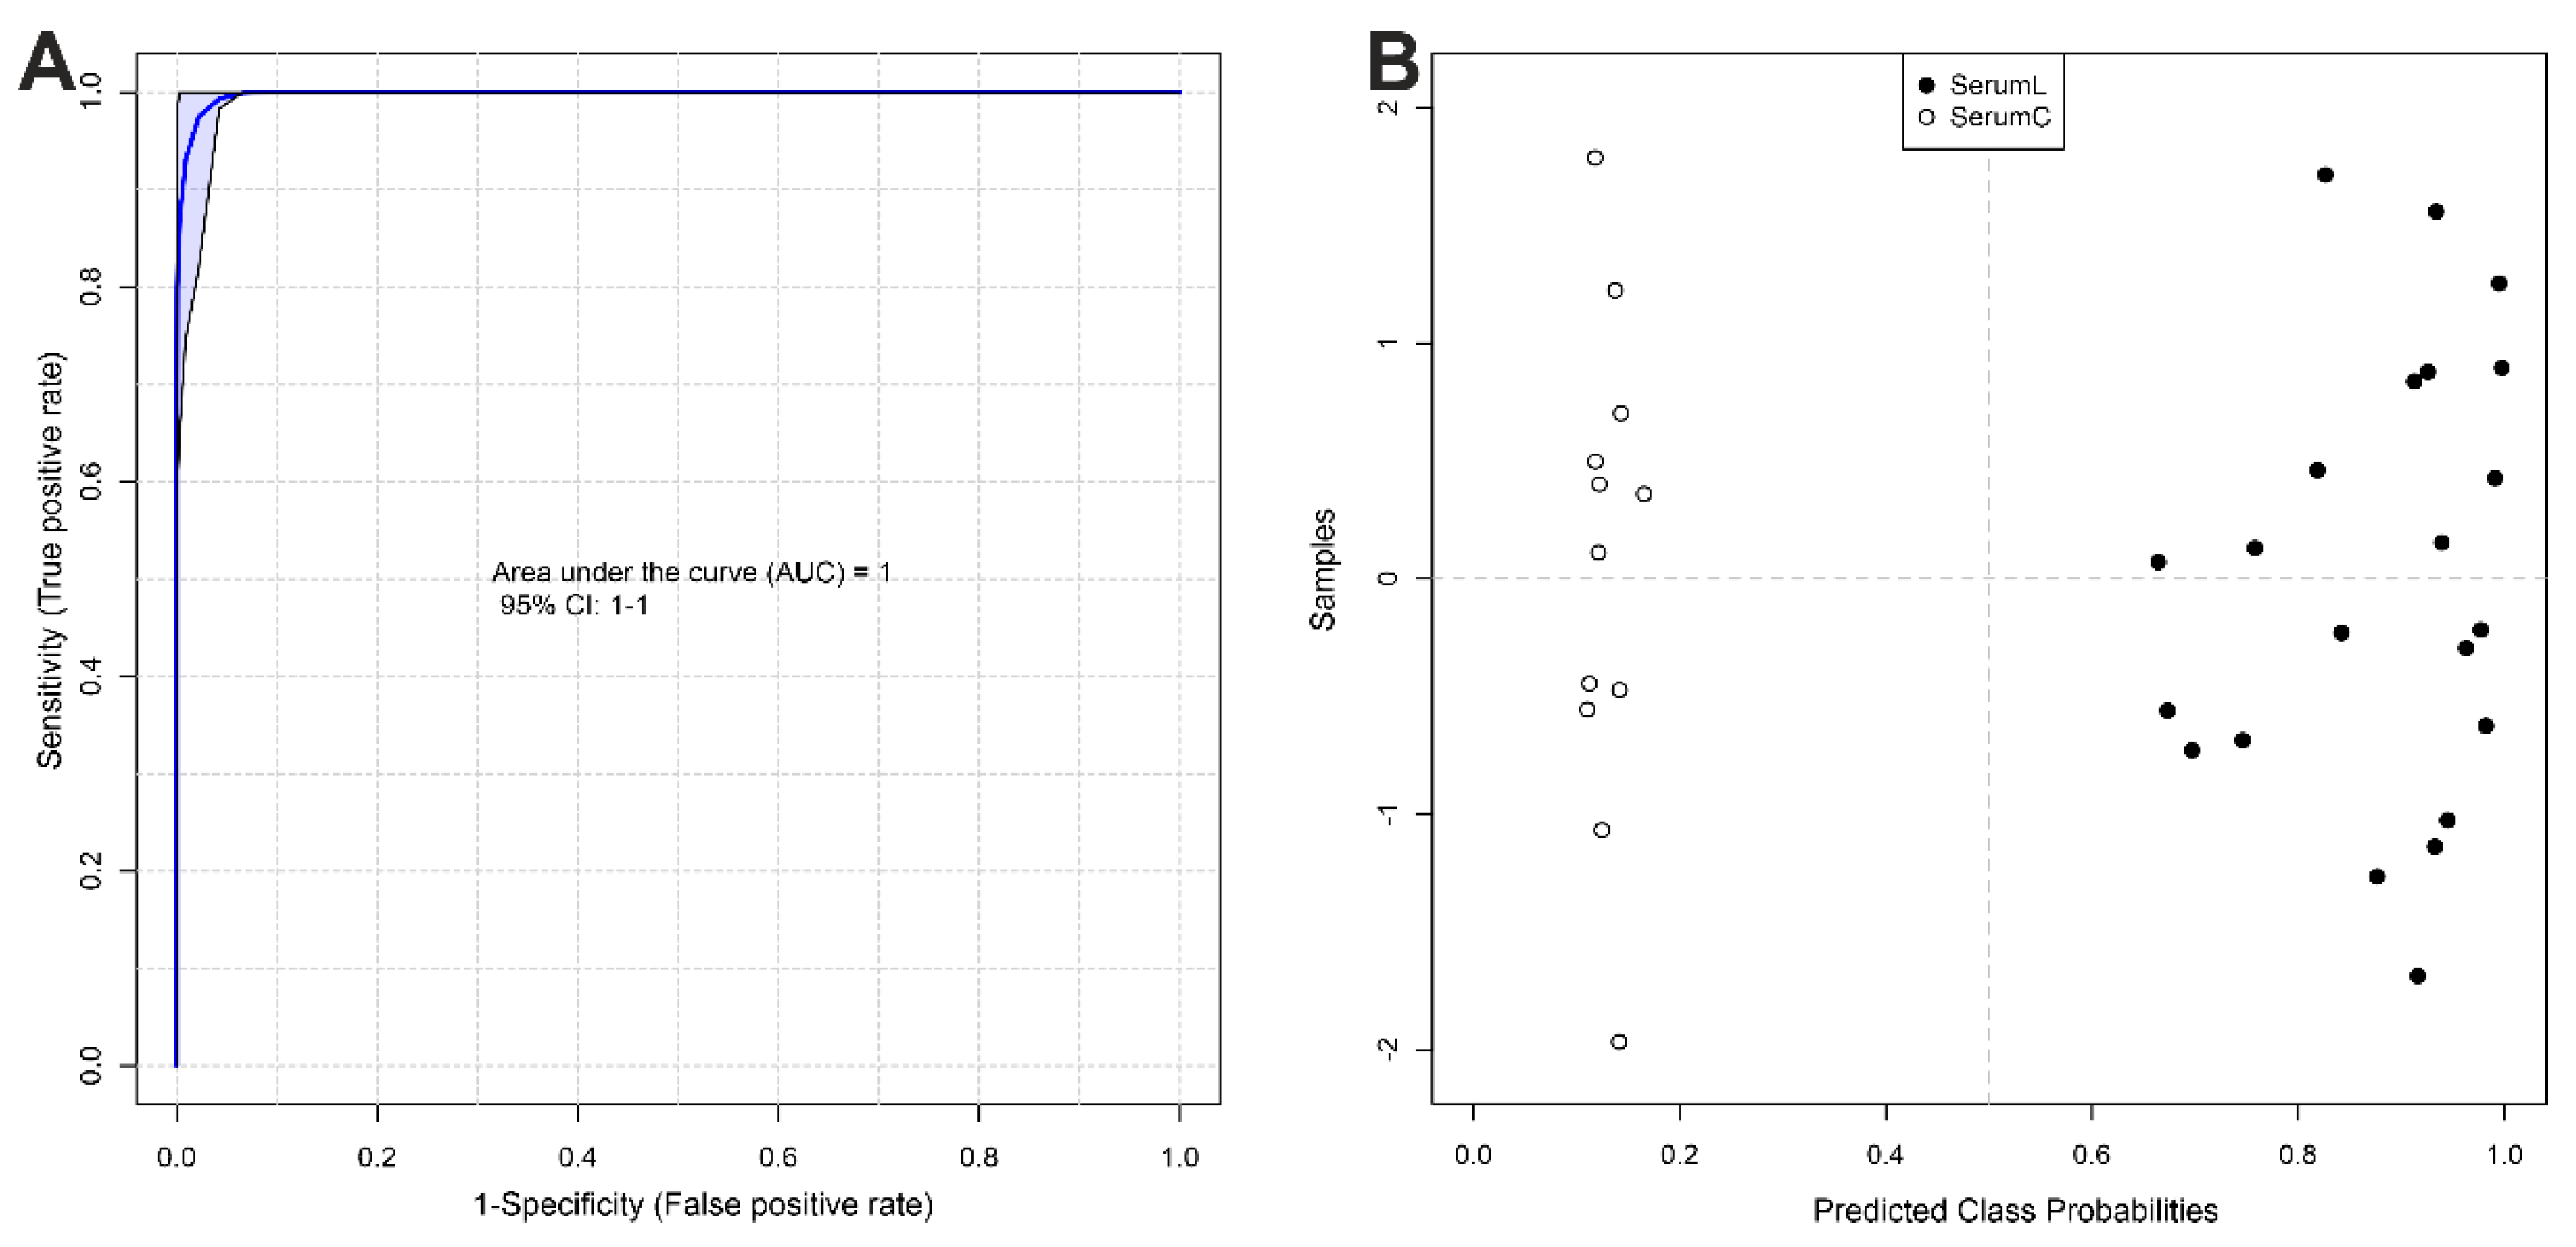
Figure 6.
Summary plot for the Quantitative Metabolite Set Enrichment Analysis (QMSEA), presenting top 25 enriched metabolite sets. The size of the circles indicates the enrichment ratio, the color indicates the statistical significance.
Figure 6.
Summary plot for the Quantitative Metabolite Set Enrichment Analysis (QMSEA), presenting top 25 enriched metabolite sets. The size of the circles indicates the enrichment ratio, the color indicates the statistical significance.
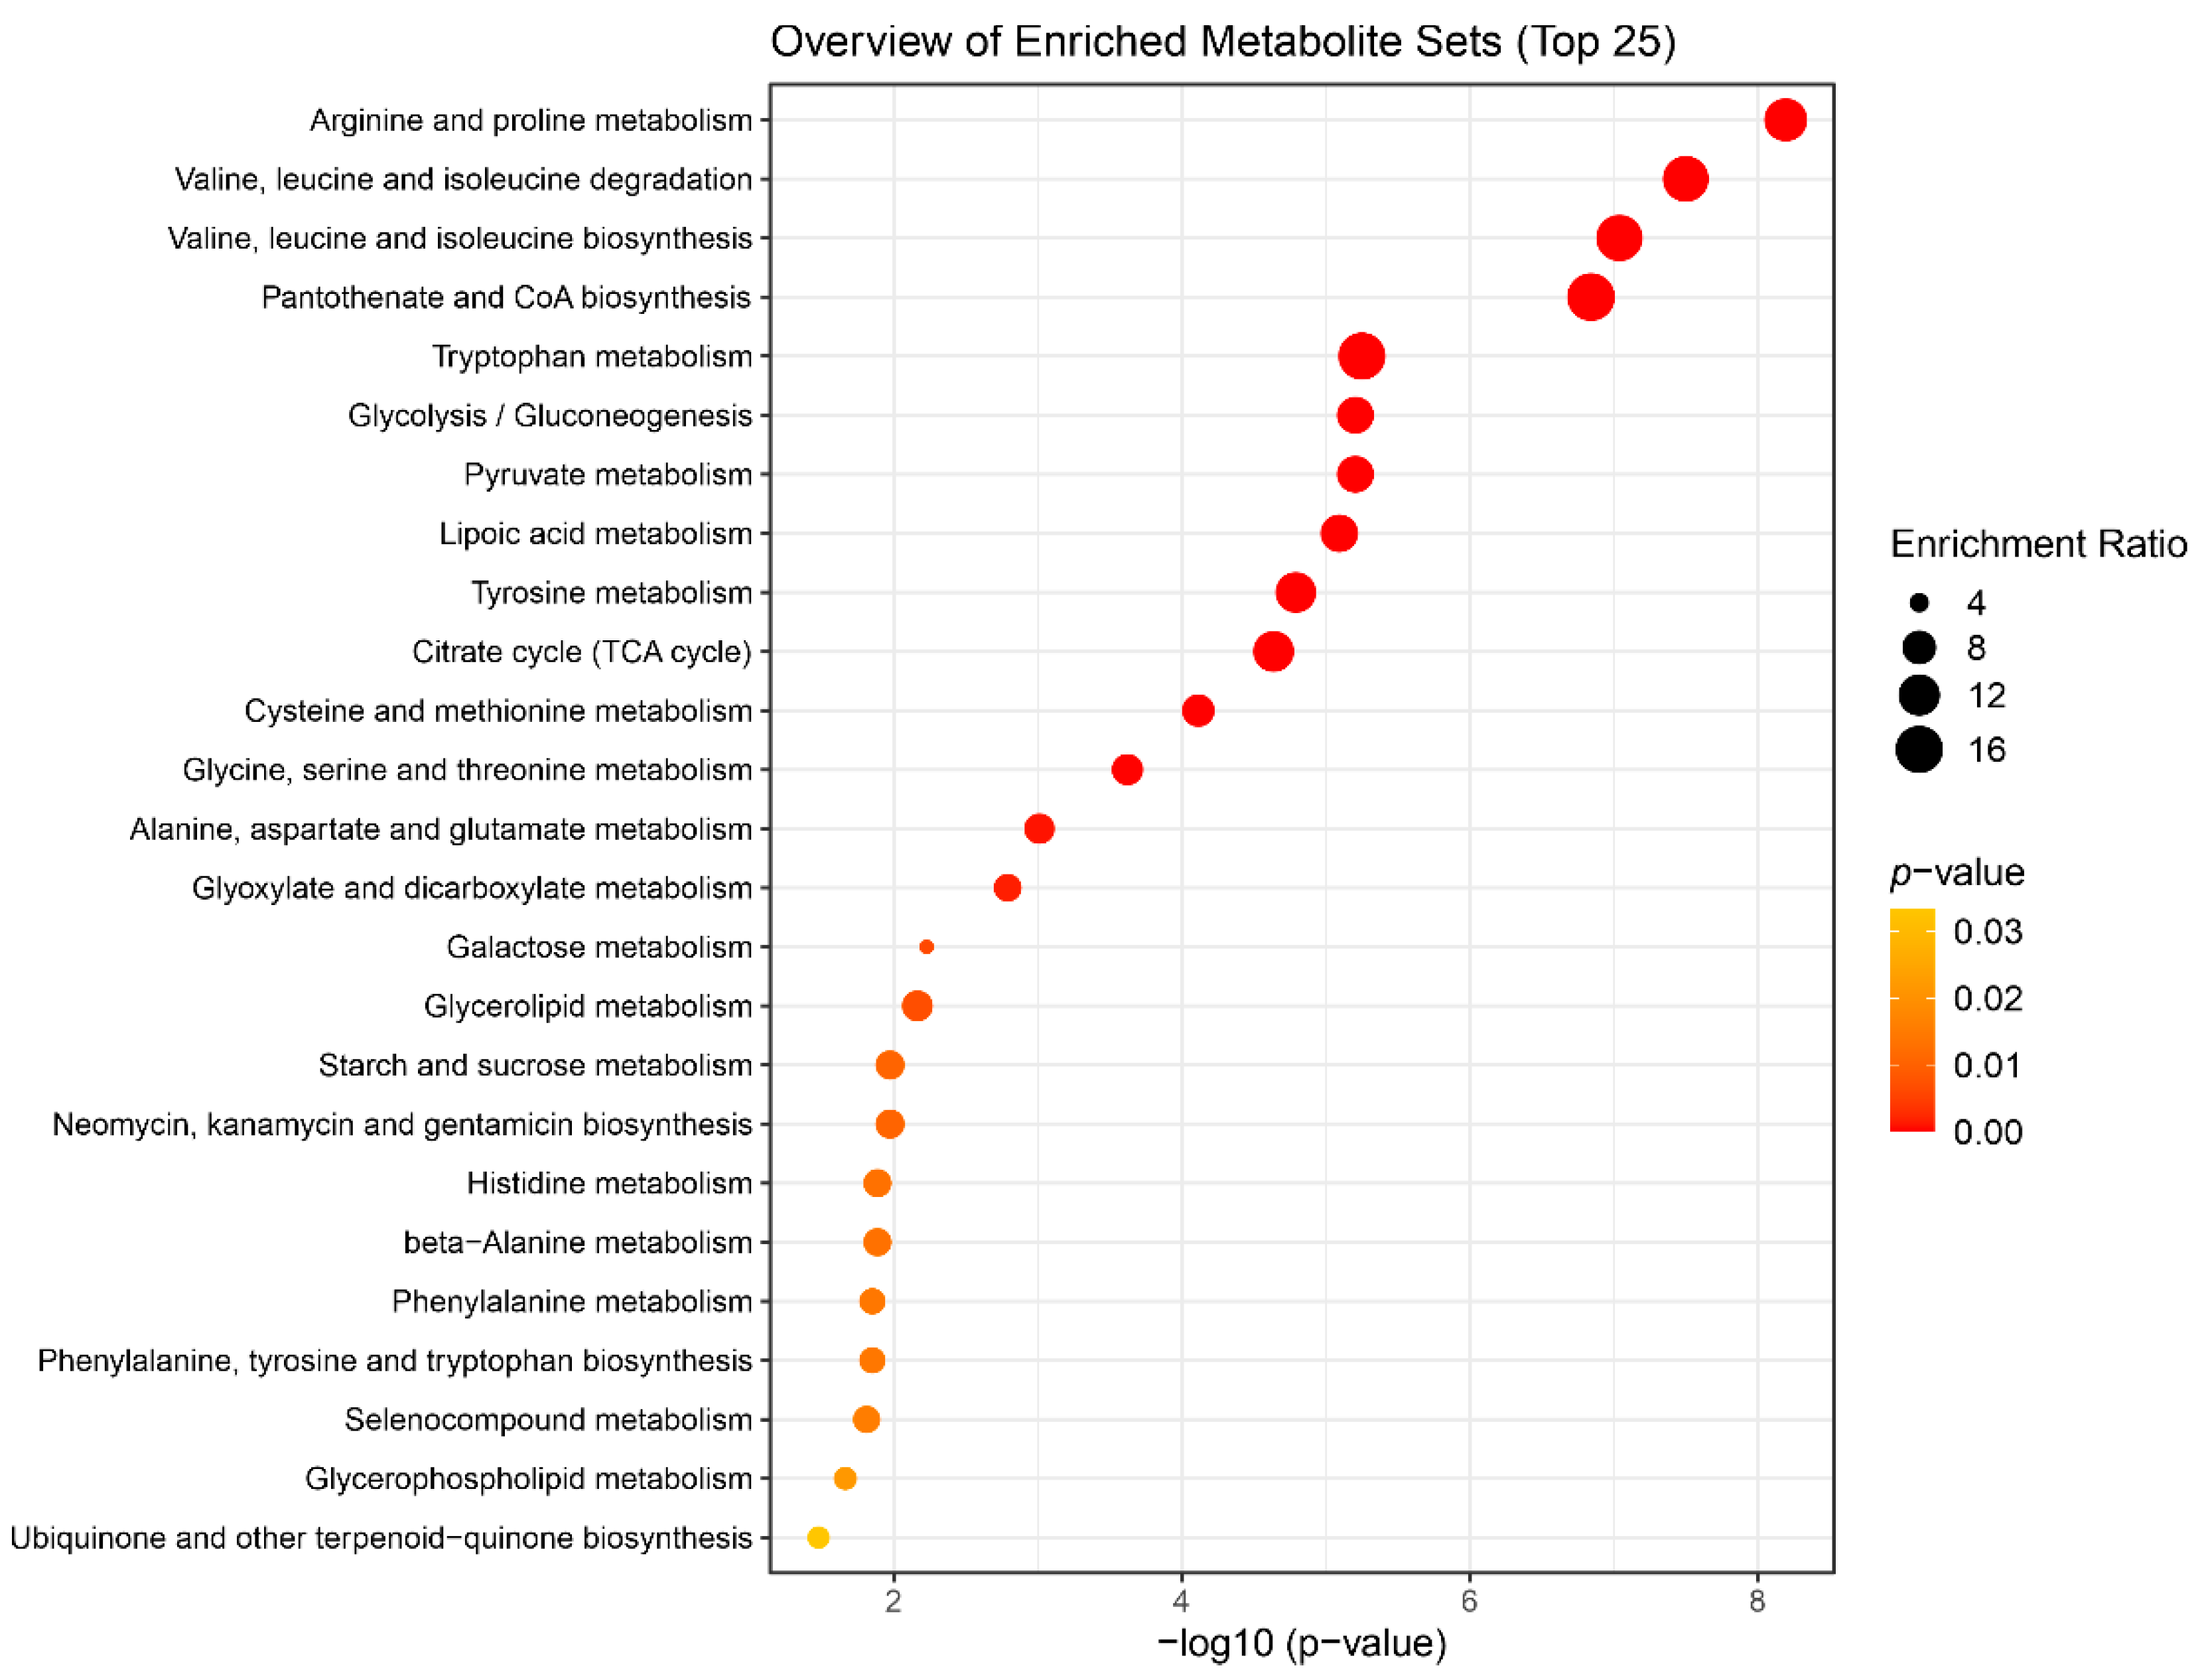
Figure 7.
Boxplots for the concentrations (in µM) of differential metabolites. SerumC (red) – serum samples from control group, SerumL (green) – serum samples from BCRL group, ISFL (blue) – interstitial fluid samples from BCRL group.
Figure 7.
Boxplots for the concentrations (in µM) of differential metabolites. SerumC (red) – serum samples from control group, SerumL (green) – serum samples from BCRL group, ISFL (blue) – interstitial fluid samples from BCRL group.
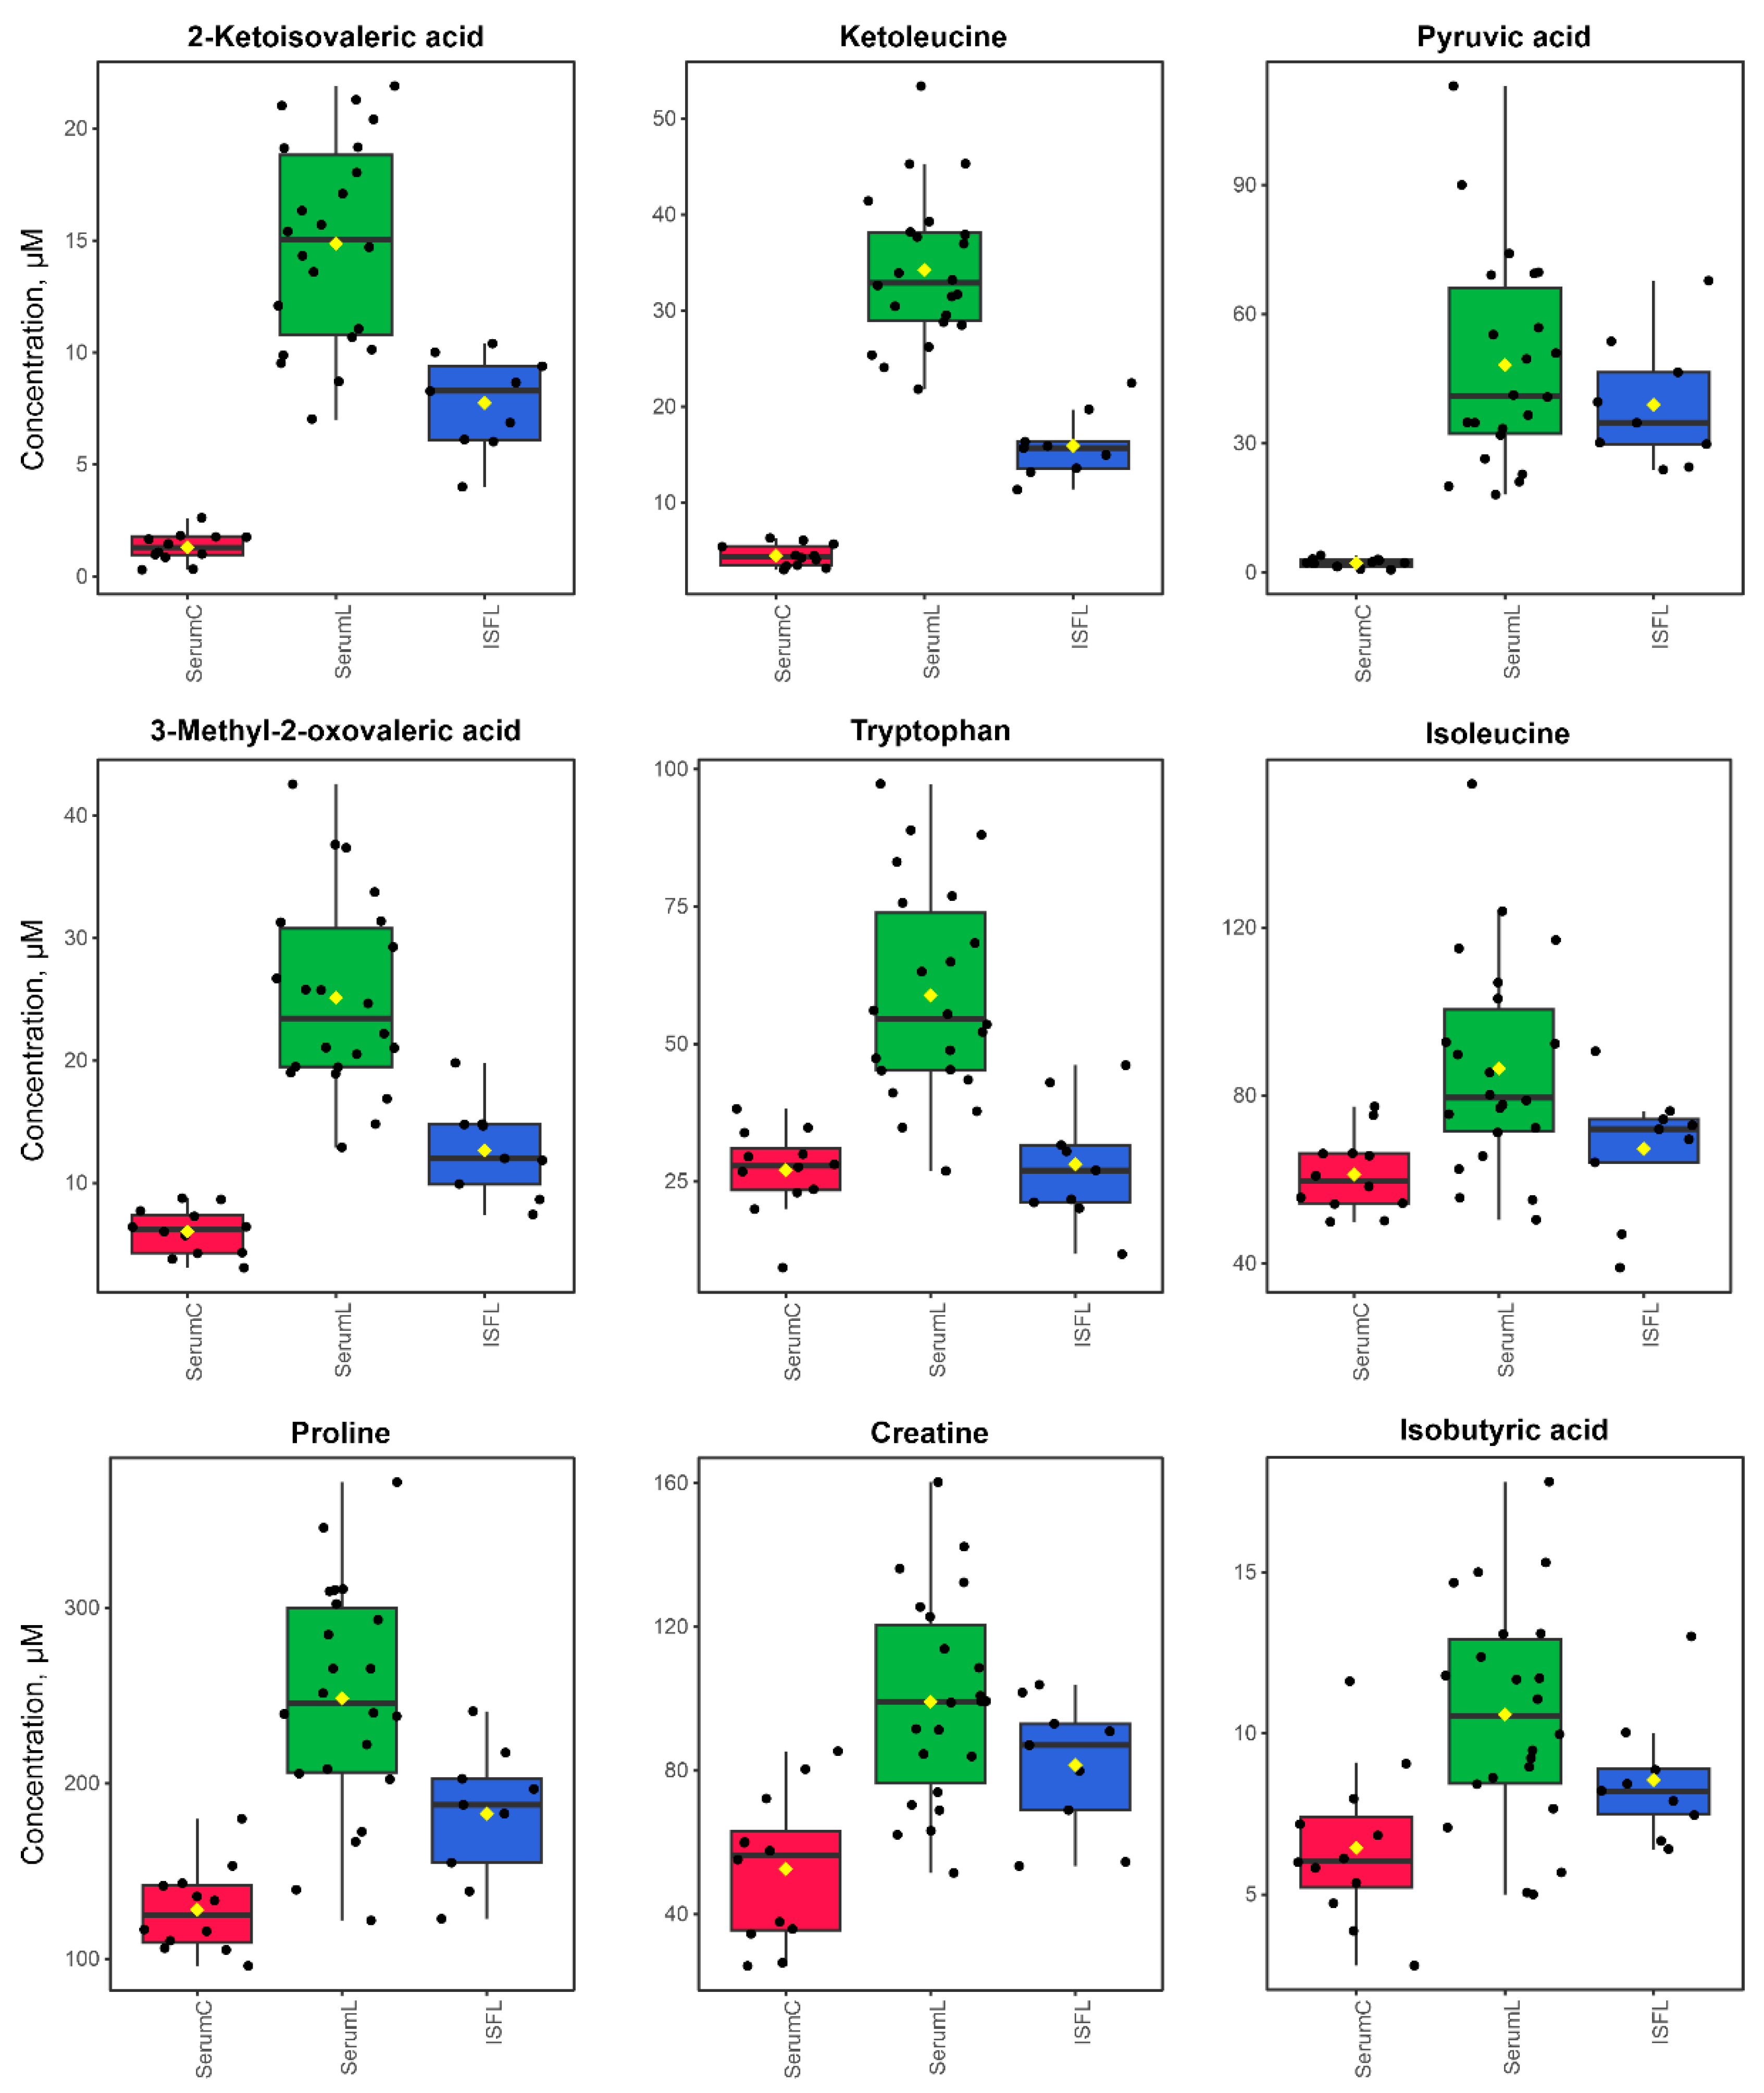

Table 1.
Averaged concentrations of metabolites in sample groups. Values are given in µM as mean ± standard deviation. SerumC – serum samples from control group, SerumL – serum samples from BCRL group, ISFL – interstitial fluid samples from BCRL group.
Table 1.
Averaged concentrations of metabolites in sample groups. Values are given in µM as mean ± standard deviation. SerumC – serum samples from control group, SerumL – serum samples from BCRL group, ISFL – interstitial fluid samples from BCRL group.
| Metabolites\Groups | SerumC | SerumL | ISFL |
|---|---|---|---|
| 2-Aminobutyric acid | 27 ± 5 | 27 ± 10 | 22 ± 9 |
| 2-Hydroxy-3-methylbutyric acid | 8.7 ± 4.1 | 9.3 ± 3 | 4.4 ± 3 |
| 2-Hydroxy-3-methylvaleric acid | 25 ± 2 | 26 ± 18 | 17 ± 7 |
| 2-Hydroxybutyric acid | 64 ± 19 | 84 ± 29 | 48 ± 21 |
| 2-Ketoisovaleric acid | 1.3 ± 0.7 | 15 ± 5 | 7.8 ± 2.1 |
| 3-Hydroxybutyric acid | 230 ± 210 | 150 ± 120 | 100 ± 90 |
| 3-Hydroxyisobutyric acid | 32 ± 5 | 22 ± 15 | 16 ± 6 |
| 3-Methyl-2-oxovaleric acid | 6 ± 1.9 | 25 ± 8 | 13 ± 4 |
| Acetic acid | 270 ± 40 | 240 ± 160 | 54 ± 7 |
| Acetylcarnitine | 12 ± 3 | 11 ± 4 | 10 ± 2 |
| Alanine | 400 ± 90 | 550 ± 180 | 410 ± 90 |
| Ascorbic acid | 2.9 ± 2 | 6.1 ± 4 | 3.5 ± 4.4 |
| Asparagine | 47 ± 7 | 58 ± 27 | 39 ± 14 |
| Betaine | 35 ± 11 | 44 ± 22 | 27 ± 12 |
| Choline | 11 ± 2 | 15 ± 6 | 11 ± 3 |
| Citric acid | 130 ± 30 | 160 ± 40 | 120 ± 30 |
| Creatine | 53 ± 20 | 99 ± 29 | 82 ± 19 |
| Creatinine | 73 ± 17 | 100 ± 28 | 68 ± 9 |
| Dimethylamine | 4.8 ± 2.9 | 3.5 ± 2.4 | 2.3 ± 1.4 |
| Dimethylglycine | 2.9 ± 0.8 | 4.1 ± 2 | 3.8 ± 1.6 |
| Dimethyl sulfone | 10 ± 3.3 | 11 ± 5 | 6.4 ± 2.9 |
| Formic acid | 33 ± 3 | 210 ± 170 | 36 ± 6 |
| Glucose | 5100 ± 700 | 6900 ± 2200 | 5300 ± 900 |
| Glutamine | 530 ± 100 | 650 ± 210 | 470 ± 70 |
| Glycerol | 140 ± 30 | 200 ± 70 | 180 ± 50 |
| Glycerophosphocholine | 47 ± 11 | 61 ± 24 | 40 ± 8 |
| Glycine | 260 ± 90 | 310 ± 150 | 230 ± 70 |
| Histidine | 67 ± 13 | 92 ± 32 | 72 ± 15 |
| Inosine | 6.6 ± 4.7 | 6.9 ± 4.6 | 0 |
| Isobutyric acid | 6.5 ± 2.4 | 11 ± 3 | 8.6 ± 2 |
| Isoleucine | 61 ± 9 | 86 ± 25 | 67 ± 16 |
| Ketoleucine | 4.5 ± 1.1 | 34 ± 8 | 16 ± 3 |
| Lactic acid | 2700 ± 700 | 3500 ± 1600 | 1400 ± 500 |
| Leucine | 130 ± 20 | 170 ± 40 | 140 ± 20 |
| Lysine | 170 ± 30 | 190 ± 50 | 170 ± 30 |
| Mannose | 64 ± 17 | 72 ± 17 | 58 ± 15 |
| myo-Inositol | 44 ± 12 | 46 ± 15 | 36 ± 14 |
| Ornithine | 81 ± 15 | 72 ± 28 | 55 ± 13 |
| Phenylalanine | 74 ± 16 | 100 ± 30 | 62 ± 13 |
| Proline | 130 ± 20 | 250 ± 70 | 180 ± 40 |
| Propylene glycol | 3.6 ± 3.4 | 6.2 ± 2.4 | 7.6 ± 4.5 |
| Pyroglutamic acid | 11 ± 10 | 88 ± 126 | 13 ± 20 |
| Pyruvic acid | 2.2 ± 1 | 48 ± 25 | 39 ± 15 |
| Serine | 250 ± 40 | 300 ± 80 | 210 ± 40 |
| Threonine | 100 ± 20 | 140 ± 40 | 110 ± 30 |
| Tryptophan | 27 ± 8 | 59 ± 19 | 28 ± 11 |
| Tyrosine | 62 ± 16 | 83 ± 31 | 67 ± 9 |
| Valine | 230 ± 40 | 300 ± 70 | 240 ± 40 |
Table 2.
Result of univariate biomarker analysis. AUC - Area under ROC curve.
| Metabolite | AUC | p-value | Fold Change |
|---|---|---|---|
| 2-Ketoisovaleric acid | 1.00 | 1.29E-11 | -3.50 |
| 3-Methyl-2-oxovaleric acid | 1.00 | 2.40E-09 | -2.06 |
| Ketoleucine | 1.00 | 1.86E-14 | -2.93 |
| Pyruvic acid | 1.00 | 3.25E-07 | -4.45 |
| Tryptophan | 0.96 | 5.63E-06 | -1.12 |
| Proline | 0.95 | 7.58E-07 | -0.96 |
| Creatine | 0.91 | 2.40E-05 | -0.91 |
| Isoleucine | 0.84 | 0.0023 | -0.50 |
| Isobutyric acid | 0.84 | 0.0008 | -0.72 |
| Leucine | 0.82 | 0.0019 | -0.44 |
| Creatinine | 0.80 | 0.0053 | -0.45 |
Table 3.
Most affected metabolic pathways determined by QMSEA and associated metabolites. FDR – false discovery rate correction for p-values.
Table 3.
Most affected metabolic pathways determined by QMSEA and associated metabolites. FDR – false discovery rate correction for p-values.
| Metabolite Set | Total Compounds | Hits | p-value (FDR) | Associated metabolites |
|---|---|---|---|---|
| Arginine and proline metabolism | 36 | 4 | 2.69E-07 | creatine; proline; ornithine; pyruvic acid |
| Valine, leucine and isoleucine degradation | 39 | 7 | 6.66E-07 | 3-methyl-2-oxovaleric acid; valine; 2-ketoisovaleric acid; isoleucine; 3-hydroxyisobutyric acid; ketoleucine; leucine |
| Valine, leucine and isoleucine biosynthesis | 8 | 7 | 1.28E-06 | threonine; 3-methyl-2-oxovaleric acid; leucine; 2-ketoisovaleric acid; isoleucine; ketoleucine; valine |
| Pantothenate and CoA biosynthesis | 20 | 2 | 1.52E-06 | valine; 2-ketoisovaleric acid |
| Tryptophan metabolism | 41 | 1 | 3.75E-05 | tryptophan |
| Glycolysis / Gluconeogenesis | 26 | 2 | 3.75E-05 | pyruvic acid; acetic acid |
| Pyruvate metabolism | 23 | 2 | 3.75E-05 | pyruvic acid; acetic acid |
| Lipoic acid metabolism | 28 | 2 | 4.24E-05 | pyruvic acid; glycine |
| Tyrosine metabolism | 42 | 2 | 7.55E-05 | tyrosine; pyruvic acid |
| Citrate cycle (TCA cycle) | 20 | 2 | 9.70E-05 | citric acid; pyruvic acid |
| Cysteine and methionine metabolism | 33 | 3 | 0.00029393 | serine; 2-aminobutyric acid; pyruvic acid |
| Glycine, serine and threonine metabolism | 33 | 8 | 0.00083638 | serine; choline; betaine; dimethylglycine; glycine; threonine; creatine; pyruvic acid |
| Alanine, aspartate and glutamate metabolism | 28 | 5 | 0.0031553 | asparagine; alanine; glutamine; citric acid; pyruvic acid |
| Glyoxylate and dicarboxylate metabolism | 31 | 7 | 0.0048664 | citric acid; serine; glycine; acetic acid; pyruvic acid; formic acid; glutamine |
Disclaimer/Publisher’s Note: The statements, opinions and data contained in all publications are solely those of the individual author(s) and contributor(s) and not of MDPI and/or the editor(s). MDPI and/or the editor(s) disclaim responsibility for any injury to people or property resulting from any ideas, methods, instructions or products referred to in the content. |
© 2024 by the authors. Licensee MDPI, Basel, Switzerland. This article is an open access article distributed under the terms and conditions of the Creative Commons Attribution (CC BY) license (https://creativecommons.org/licenses/by/4.0/).
Copyright: This open access article is published under a Creative Commons CC BY 4.0 license, which permit the free download, distribution, and reuse, provided that the author and preprint are cited in any reuse.


