
Submitted:
15 November 2024
Posted:
20 November 2024
You are already at the latest version
Abstract
Among the cultivated crop species, the economically and culturally important Grapevine plays host to the greatest number of distinctly characterized viruses. A critical component of the management and containment of these viral diseases in Grape is both the identification of infected vines and the characterization of new pathogens. Next generation high throughput sequencing technologies, i.e. HTS, have been widely adopted for their ability to quickly, broadly, and directly characterize molecular sequences associated with potential pathogens. We empirically analyze the performance of HTS as a diagnostic tool in a phytosanitary context and make recommendations on its deployment for detecting known and novel viruses in Grape. Three popular and widely used modalities for analyzing HTS data are characterized and compared using the standard diagnostic performance criteria of sensitivity (the true positive rate) and specificity (the true negative rate) and characterize diagnostic sensitivity using dilution series.
Keywords:
plant viruses
; bioinformatics
; NGS
; grapevines
1. Introduction
Among the cultivated crop species, Grapevines play host to the greatest number of distinct viruses (Martelli 2018). Over 101 plant viruses from diverse families have been characterized in this economically and culturally important crop (Fuchs 2023). The majority of viruses isolated from Grapevines have Vitis sp. as the only known host (Fuchs 2020). More importantly, the majority of viruses isolated from Grapevines are associated with damaging symptoms, about half of which are widespread (Fuchs 2020).
A critical component of the management of these viral diseases is the identification and subsequent removal of infected vines. This happens at the vineyard level, in quarantine programs, and at the production level. In particular, the establishment of virus-tested foundation vine-stock as a resource for propagation is an essential component for the production of quality planting material and for the planting of healthy vineyards. Thus, clean plant and quarantine facilities like Foundation Plant Services (FPS) are important consumers of virus detection technology. Located at the University of California, Davis, FPS is a USDA-APHIS permitted grapevine importation center, and maintains a virus-tested collection of grapevines totaling more than 2,400 selections. Each selection is rigorously tested for pathogens before release from quarantine and inclusion in the collection.
1.1. Identification of Grapevine Virus Infections
The conventional molecular methods for detecting viral infections are enzyme linked immunosorbent assay (ELISA) and Polymerase Chain Reaction (PCR). These methods are widely considered sensitive but they require detailed knowledge of the virus genome to develop. Because developing an ELISA assay is a time consuming and expensive process, PCR is the more favored of the two but not without its own drawbacks. PCR primers are highly specific, thus developing a sensitive and specific PCR assay requires detailed knowledge of both the genome and nucleotide diversity of the target virus. The high sequence specificity of PCR primers makes designing assays for diverse virus species a unique challenge (Diaz Lara et al. 2020). It can also lead to false negative test results in the presence of unanticipated genetic diversity. (Al Rwahnih et al. 2015; Maree et al. 2018)
Biological indexing has been the standard in quarantine and regulatory programs for decades; it has the ability to detect viral infections independent of molecular sequence, as is the case for novel viruses. This method involves the replicated grafting of subjects onto indicator plants followed by years of expert monitoring for virus symptoms. Biological indexing is expensive, time consuming, and subject to false negative results (Al Rwahnih et al. 2024).
In this context, next generation high throughput sequencing technologies, i.e. HTS, have been widely adopted for their ability to quickly, broadly, and directly characterize molecular sequences associated with the potential pathogen. The primary advantage of HTS over the aforementioned methods is that deep sequencing provides a detailed view of the infection status of the plant. Because the nucleotide sequence data is available, taxonomic characterization can be accomplished in silico using approaches that are much more robust to nucleotide divergence. Novel viruses can be identified and characterized using translated comparisons that infer amino acid similarities over very long evolutionary distances.
1.2. This Study
In this study we empirically analyze the performance of high throughput sequencing as a diagnostic tool and make recommendations on its deployment for detecting known and novel viruses in Grapevines. Previous quality assessment and validation of sampling, timing, internal controls and sample template were completed by Soltani et. al (2021). This study provides a deeper look at the bioinformatics on which the diagnostics rely. Much of our recommendations have been in the HTS bioinformatics workflow at FPS which is the ensemble method presented at the end of this paper.
Three widely used modalities for analyzing HTS data are characterized and compared: First the mapping of reads to a reference database which requires a-priori knowledge of the virus species genome. Second, to facilitate the detection of novel viruses, we employ a de novo approach. Finally we looked at a more recent metagenomic method that rely on a database of taxonomically classified short k-length substrings (i.e. k-mers) to taxonomically classify sequenced reads (Wood et al. 2019). We evaluate these approaches using the standard diagnostic performance criteria of sensitivity (the true positive rate) and specificity (the true negative rate) (Burd 2010; EPPO 2019).
2. Material and Methods
2.1. Grapevine Panel Selection
Our test panel of positive controls consisted of eighteen grapevine plants infected by a broad range of common DNA and RNA viruses and viroids (Table 1). They were preferred for this study because of their consistent use as positive controls for diagnostic testing at FPS (Golino 1992). They are also proximally maintained in the Davis Virus Collection (Puckett 2018). The panel also includes one healthy control (cv. ‘Ganzin’) maintained as a rootstock in a foundation vineyard at FPS. The healthy control has consistently tested negative by RT-qPCR for more than 40 viral agents. All vines were tested by HTS and real-time reverse transcription quantitative PCR (RT-qPCR) or qPCR as described previously (Al Rwahnih et al. 2015, Kesanakurti et al. 2016).
2.2. TNA Extraction
Petioles and dormant canes were collected from the 19 vines in late May and October (spring and fall), respectively. Petioles or cane scrapings (665 mg/sample) were processed and spiked with 35 mg of BTS leaf tissue to act as a positive control (see Solatani et al. 2021; Kesanakurti et al. 2016) . A total of 1 g leaf tissue per sample was homogenized in 10 ml lysis buffer (4 M guanidine isothiocyanate; 0.2 M sodium acetate, pH 5.0; 2 mM EDTA; 2.5% (w/v) PVP-40) using a Homex grinder (Bioreba, Switzerland) followed by TNA extraction with the MagMax Plant RNA Isolation kit (ThermoFisher Scientific, CA, USA) excluding DNase treatment. TNA was quantified with the Qubit (Invitrogen). The relative concentration of PvEVs at each five-day interval was measured by RT-qPCR using the TaqMan Fast Virus 1-Step Master Mix kit (ThermoFisher) according to the manufacturer’s protocol. PvEV primers and probes were selected from Kesanakurti et al., (2016). Thermocycler conditions were 5 min at 50 °C, 20 sec at 94 °C, and then 40 cycles of 3 sec at 94 °C and 30 sec at 60 °C
2.3. Illumina Library Preparation and Sequencing
For individual samples, a total of 700 ng per 10 µl of extracted nucleic acids were subjected to rRNA depletion (only for TNA-based input) and cDNA library construction. Later, cDNA libraries were end-repaired, adapter-ligated by unique dual-indexes, PCR enriched, and used in four separate HTS runs (Table 3). Finally, the amplicons were sequenced in an Illumina NextSeq 500 platform using a single-end 75-bp format. To reduce carryover from the previous run, three washes were performed prior to sample loading.
2.4. In-silico Dilution Series
To increase the tested range of virus titer and investigate the limits of detection for these methods we created an extensive in-silico dilution series. The reads from each fully sequenced sample were randomly sub-sampled without replacement to create in-silico subsampled replicates. For each sample, we created the following 32 subsampled replicates: 150K, 250K, 500K, 1000K, 1500K, 2000K, 2500K, 3000K, 3500K, 4000K, 4500K, 5000K, 6000K, 7000K, 8000K, 9000K, 10000K, 11000K, 12000K, 13000K, 14000K, 15000K, 16000K, 17000K, 18000K, 19000K, 20000K, 21000K, 22000K, 23000K, 24000K, 25000K.
2.5. Sequence Processing
All Illumina reads were demultiplexed using bcl2fastq v2.20.0.422. The tolerance for barcode mismatches was set to 0 to reduce the possibility of crosstalk (or misidentified barcodes) between adjacent clusters on the flowcell. Adapter Trimming: Adapter trimming is also performed by bcl2fastq during demultiplexing. Where noted, we also evaluated the added utility of using trim galore (v 0.6.7) as an additional adapter and quality trimming step.
Where noted we performed a host genome screen by mapping sequenced reads against a target database consisting of the Grapevine reference genome (GCF_000003745.3) and mitochondrion (NC_012119) and chloroplast (NC_007957). Mapping was done using bowtie2 (Langmead and Salzberg 2012) and all exact matches were filtered.
2.6. De novo Assembly
Three commonly used de novo assemblers were evaluated for this project. Megahit (v1.2.9) developed at the Beijing Genome Institute. Trinity (v2.13.2) developed at the Broad Institute and the Hebrew University of Jerusalem (Grabherr et al. 2011). Spades (v3.15.4), a.k.a. the Saint Petersburg genome assembler (Bankevich et al. 2012). In all cases, de novo assemblers were run with default values for a single read (unpaired) Illumina sequencing protocol.
2.7. Read Mapping
Illumina reads were mapped to virus and viroid sequence databases using bowtie2 (v2.4.2) software (Langmead and Salzberg 2012). Bowtie was run in two variations: with default parameters for unpaired reads and also in very sensitive local mode (bowtie2 --very-sensitive-local) which allows for more divergent partial alignments using a local alignment algorithm with a scoring methodology that reduces the penalty for mismatches and gaps. Where noted, the pathoscope2 software package (v2.0.6) was employed to reassign multi-mapped reads using the very sensitive local bowtie2 output as described by the Pathoscope 2 method (Hong et al. 2014) and implemented for detecting viruses in (Rott et al. 2017).
2.8. Taxonomic Read Classification Using k-Mers
We used the program kraken2 (Wood et al. 2019) to perform read based taxonomic classification. Reads were taxonomically classified using a database of taxonomically classified k-mers constructed using kraken2-build from the Genbank non-redundant nucleotide database. Classifying reads using kraken2 is the most memory intensive method employed in this study due to the size of the database and can only be run on a computer with at least 1Tb of ram installed. After reads were classified, read counts for each taxon were compiled by adapting the method provided in the Kraken software suite (Lu et al. 2022) to sum reads over all taxon ids associated with a virus (Supplementary table 1). A sample was considered a positive for a virus or viroid if it met the minimum read count threshold for the associated taxon (Supplementary table 1) otherwise it was considered negative.
3. Results
3.1. Samples and Sequencing
For this study we relied on a Validation panel consisting of 18 virus infected Grapevine samples and one healthy control (cv. ‘Ganzin’) free of virus infection. The selected samples represent a broad range of common DNA and RNA virus and viroid infections (Table 1) which have been confirmed by PCR. Two independent samples were taken from each grapevine spring petioles and fall canes (Table 2).
Our 38 replicates were sequenced to a minimum target depth of 20 million reads using a 75 bp single-end (one read per molecule) Illumina protocol. This was done across two flowcells resulting in 903 million reads total, in line with the per flowcell yield of 450 million reads we typically see at FPS. For these samples, we obtained 24 million reads on average, with all but two of the 38 replicates exceeding 20 million reads.
For a robust comparison of methods and to ascertain limits of detection each independent sample was subsampled without replacement to a precise number of reads at 32 different dilutions. This resulted in 1216 in-silico dilution replicates with the goal of having the same sequencing depth for each replicate in a two orders of magnitude dilution series (Table 2). The total number of reads analyzed increases from 903 million to 12.4 billion. The in-silico replicates were then processed through a second round of adapter and quality trimming - the first round having already occurred in the Illumina software during the demultiplexing step. Consistent with a high quality adapter free dataset emerging from Illumina's bcl2fastq software, little data is lost during this phase. We observed a 0.02% reduction in the number of reads and a 0.7% reduction in the total number of bases in the dataset. Subsequent to this an additional dataset was created with host screened reads. Our libraries are constructed from total RNA and are expected to contain a substantial amount of RNA originating from the genome of the host, even after employing a hybridization based ribo-depletion step during library construction. In this dataset, a majority of the data (67.7% of reads and bases) were identified as similar to and thus likely transcribed from the host nuclear and organelle genomes.
3.2. Read Mapping for Virus Detection
For read mapping, we evaluated three target sequence databases of increasing size and generality. The smallest and most specific is a database of reference genomes of grapevine viruses (Ref-GV) which contains only a single reference genome for each grapevine virus and viroid in our study (Supplementary Table 1). These sequences primarily come from the NCBI RefSeq database or Genbank when a RefSeq entry did not exist. All segments of the virus are represented in this database, but only one isolate or variant is chosen for each virus - so genetic diversity is not captured. To capture viral genetic diversity in the database, we used a database consisting of all sequences for each grapevine virus and viroid deposited in Genbank as identified by their taxonomic ID (NT-GV). Finally for the broadest scope we used the entire viral division of Genbank (NT-Viral). We were unable to evaluate all of Genbank in this study due to the excessive computational cost.
For each of the given databases we evaluated three mapping approaches. The widely cited bowtie2 as representative of a short reads mapping approach. We also evaluated the pathoscope2 software package which uses a bayesian approach to reassign multi-mapped reads to the most likely (minimal) taxonomic distribution. Because the pathoscope algorithm uses bowtie's very sensitive local output (bowtie2-vsl) we evaluated that method separately so we could separate the utility of the more sensitive mapping algorithm from taxon assignment.
Finally we evaluated the utility of host screening in this context by performing mapping with and without host screening. For each approach diagnostic statistics were calculated using a minimum read count of 20 and a minimum coverage of 200 bp. The results are summarized in Table 3.

Table 3.
Summary of diagnostic statistics for three popular three read mapping algorithms using three databases. Both host screened and unscreened reads were considered. Statistics are averaged over all in silico replicates sampled to a depth of at least 15 million reads. The observed trends are consistent with all in silico replicates.
| lgorithm | Database | Host Screened | True Positive Rate | False Positive Rate | False Negative Rate | True Negative Rate |
|---|---|---|---|---|---|---|
| bowtie2 | Ref-GVBREAK | yes | 91.49% | 0.55% | 8.51% | 99.45% |
| bowtie2-vsl | 92.25% | 0.54% | 7.75% | 99.46% | ||
| pathoscope2 | 92.25% | 0.48% | 7.75% | 99.52% | ||
| bowtie2 | NT-GVBREAK | 94.11% | 2.41% | 5.89% | 97.59% | |
| bowtie2-vsl | 94.18% | 2.39% | 5.82% | 97.61% | ||
| pathoscope2 | 88.53% | 2.25% | 11.47% | 97.75% | ||
| bowtie2 | NT-ViralBREAK | 95.39% | 1.05% | 4.61% | 98.95% | |
| bowtie2-vsl | 95.97% | 1.04% | 4.03% | 98.96% | ||
| pathoscope2 | 92.22% | 1.00% | 7.78% | 99.00% | ||
| bowtie2 | Ref-GV | no | 91.63% | 0.58% | 8.37% | 99.42% |
| bowtie2-vsl | 92.15% | 0.55% | 7.85% | 99.45% | ||
| pathoscope2 | 92.15% | 0.48% | 7.85% | 99.52% | ||
| bowtie2 | NT-GV | 94.46% | 2.53% | 5.54% | 97.47% | |
| bowtie2-vsl | 94.28% | 2.72% | 5.72% | 97.28% | ||
| pathoscope2 | 89.15% | 2.45% | 10.85% | 97.55% | ||
| bowtie2 | NT-Viral | 95.66% | 1.25% | 4.34% | 98.75% | |
| bowtie2-vsl | 96.42% | 1.21% | 3.58% | 98.79% | ||
| pathoscope2 | 92.18% | 1.11% | 7.82% | 98.89% |
Mapping Algorithm. For all but one combination of host screening and database, bowtie2-vsl performed optimally or co-optimally in terms of sensitivity (TPR) the only exception was NT-GV with no target host screening where bowtie2 does slightly better (delta TPR 0.18%). For all combinations of host screening and database pathoscope2 performed optimally in terms of specificity (TNR). The pathoscope2 algorithm worked best on the database of Grapevine reference genomes, similar to how it is deployed in Rott et al. 2017. In these two cases (with and without host screening) the reassignment of reads maintained sensitivity and increased specificity.
Database Choice. For the bowtie algorithms the single reference database performed the worst in terms of sensitivity (TNR). We see and increase in sensitivity and a decrease in specificity when moving to NT-GV which incorporates more genetic diversity. Moving to NT-Viral surprisingly there is a slight increase in sensitivity (TPR) and specificity (TPR). The pathoscope algorithm performed optimally in terms of sensitivity and specificity on the single reference database (Ref-GV) suggesting that the data from the larger less curated database may confound the Bayesian assignment algorithm.
Host filtering. For all mapping algorithms the unscreened reads performed the best in terms of sensitivity for the larger databases. If the goal is maximum sensitivity, mapping unscreened reads against a database incorporating genetic diversity (NT-GV & NT-Viral) performed best. On the flip side, the host screened data mapped against the single reference database (Ref-GV) using pathoscope2 had the best specificity.
Sequencing depth. The in silico dilution series was employed to determine a recommended sequencing depth. Using that data we performed a limit of detection style analysis by plotting sensitivity (TPR) against sequencing depth. The result for bowtie2-vsl against NT-Viral is plotted in Figure 3. A notable feature of all detection methods (including read mapping) is that we observe diminishing returns after we sequence to a depth of 15 million reads.
3.3. de novo Assembly for Virus Detection
We also looked at methods for de novo assembly of the overlapping reads from a metagenome and subsequent annotation of the resulting consensus sequences. The assembled genome consists of fewer but longer consensus sequences (contigs) that should allow for longer more divergent homologies to be ascertained and more computationally intensive annotation methods. Figure 1 shows average diagnostic statistics and a limit of detection analysis for our de novo assemblers.
The results presented in the Figure 1 table suggest that if one wanted to choose a single assembler for optimal sensitivity it would be spades which has the highest average TPR for the three assemblers evaluated over all 1216 in silico dilutions. The averaged results also support the idea that host screening may lead to higher sensitivity and specificity in a de novo assembly context. This is true for all three assemblers individually and averaged. A secondary benefit of host screening, for trinity in particular, is that it made the assembly much more tractable - noted by a substantial decrease in runtime.
The limit of detection analysis shows performance of each assembler with host screening implemented as the number of reads sequenced is reduced. While averaged over all sampling depths the spades assembler performs the best in terms of sensitivity, it didn't always maintain that rank for all sampling depths. For example megahit performed best at the sampling depth of 6 million. The heuristic nature of assemblers suggests that trying more than one assembler on a dataset could be used to improve results. Indeed we unioned the results of the best two and three assemblers to quantify this improvement. The shape of the curves in the LOD analysis also suggest diminishing returns for sensitivity as sequencing depth increases past 15m reads, at which point the curves flatten out.
3.4. Comparing Annotation Methods
We evaluated tractable variants of BLAST to annotate the contigs obtained from de novo assembly. In all cases we used the appropriate Genbank non-redundant nucleotide (nt) and protein (nr) databases to annotate our sequences over a wide taxonomic range. This analysis was confined to the spades assembler after being identified as the single best option.
For annotating known viruses and viroids BLASTN was employed. Over all in silico subsamples of 15 million reads or more, the average sensitivity (TPR) was 92.18%. It was only slightly easier to detect viruses than viroids (delta TPR < 1%). This is probably due to their short length and the circular nature of viroid genomes.
For detecting novel viruses, we evaluated two tractable methods of translated search. Both methods performed equally well in this study. Over all 1216 in silico replicates, the algorithms only differed in two annotations, both from in-silico replicates with fewer than 15 million reads. Surprisingly, for replicates with 15 million or more reads, the results are identical (Table 4).
For detecting known viruses BLASTN (TPR = 91.98%) is only slightly more sensitive than BLASTX (TPR = 91.92%). We expected larger differences due to the different alphabet sizes and scoring methods. We expect these differences would become more pronounced for novel viruses as the level of divergence becomes higher and BLASTN is no longer effective. Not surprisingly BLASTX is not suited for detecting viroids, so this comparison was only done for viruses.
3.5. K-mer Methods for Virus Detection
We used the program kraken2 to perform virus detection using taxonomically classified reads using a database of taxonomically classified k-mers constructed from the Genbank non-redundant nucleotide database. A virus positive was determined if a specific read threshold is reached. The histogram in Figure 2 plots the number of taxonomically assigned reads associated with both true and false positives results in the in silico dilution data. From that plot we assumed that 35 reads, the place where the TPR and FPR rates are roughly equal, would offer a good balance of sensitivity and specificity. The summary diagnostic statistics are presented in the Figure 2 table. The kraken2 algorithm performed nearly as good in terms of overall sensitivity as the best read mapping technique but with higher specificity, implying that it may actually perform better if the threshold was relaxed. The kraken2 algorithm performs better than denovo+blastn in terms of sensitivity at the expense of specificity.
3.6. Ensemble Methods
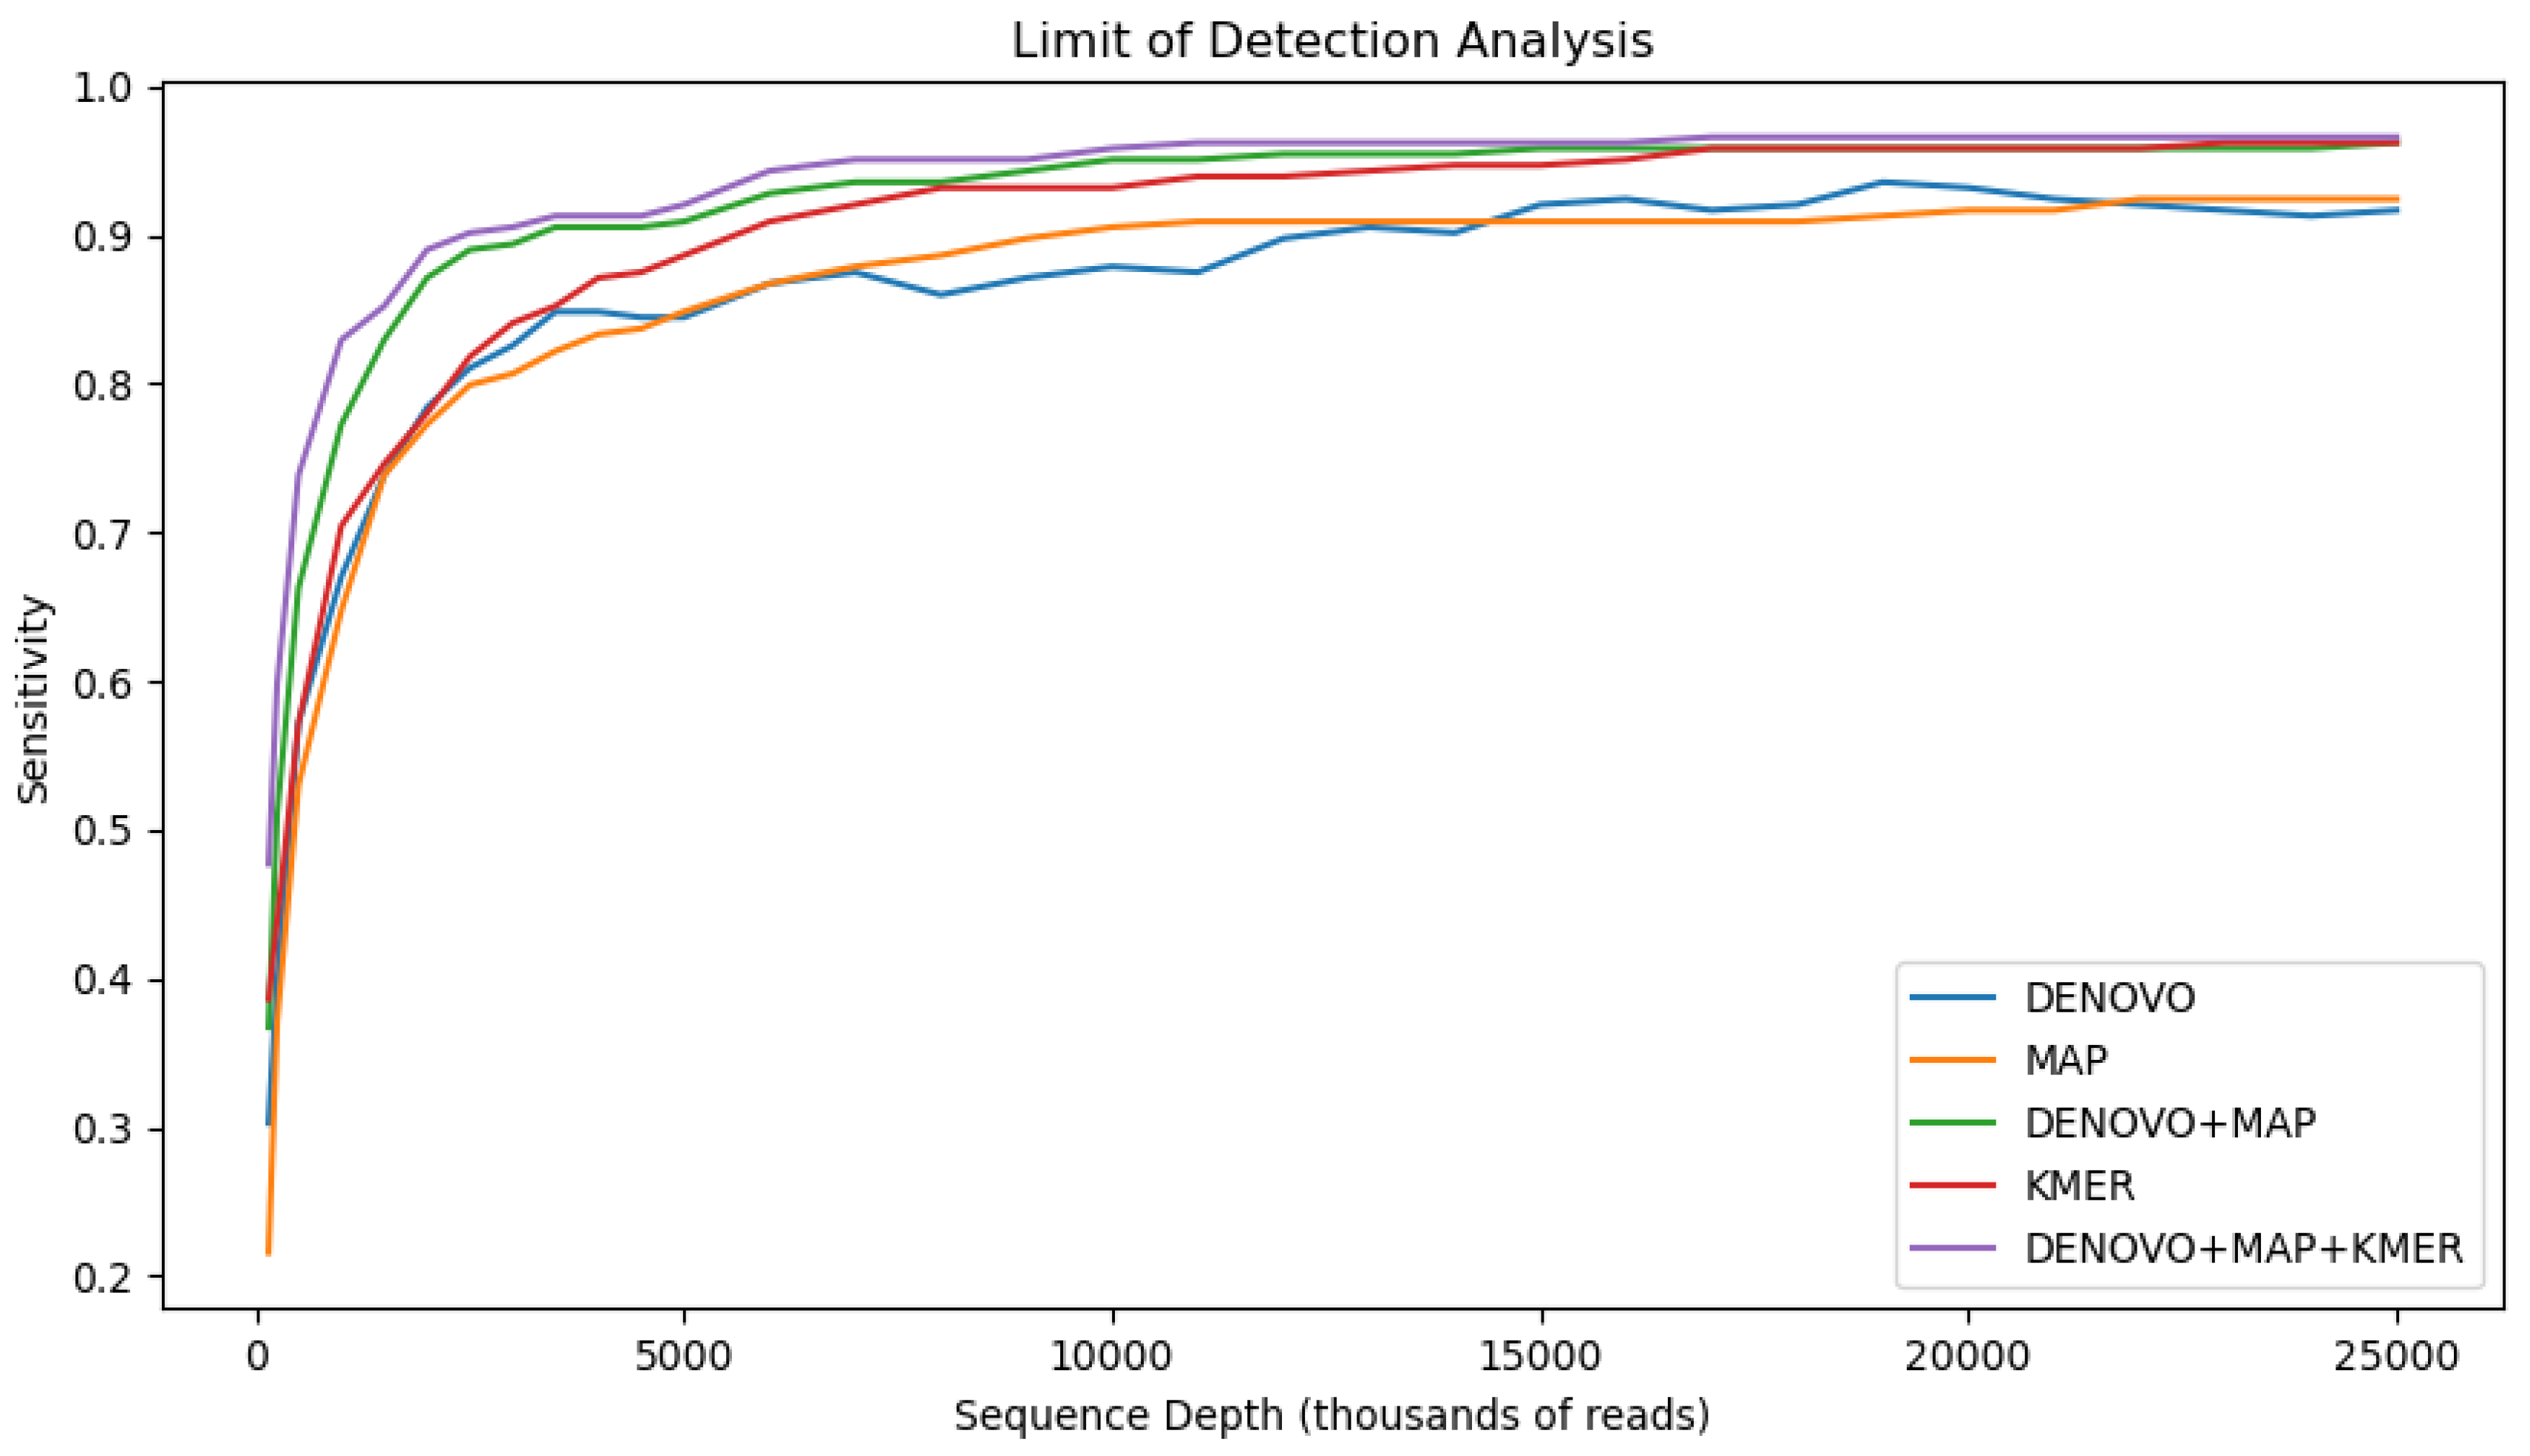
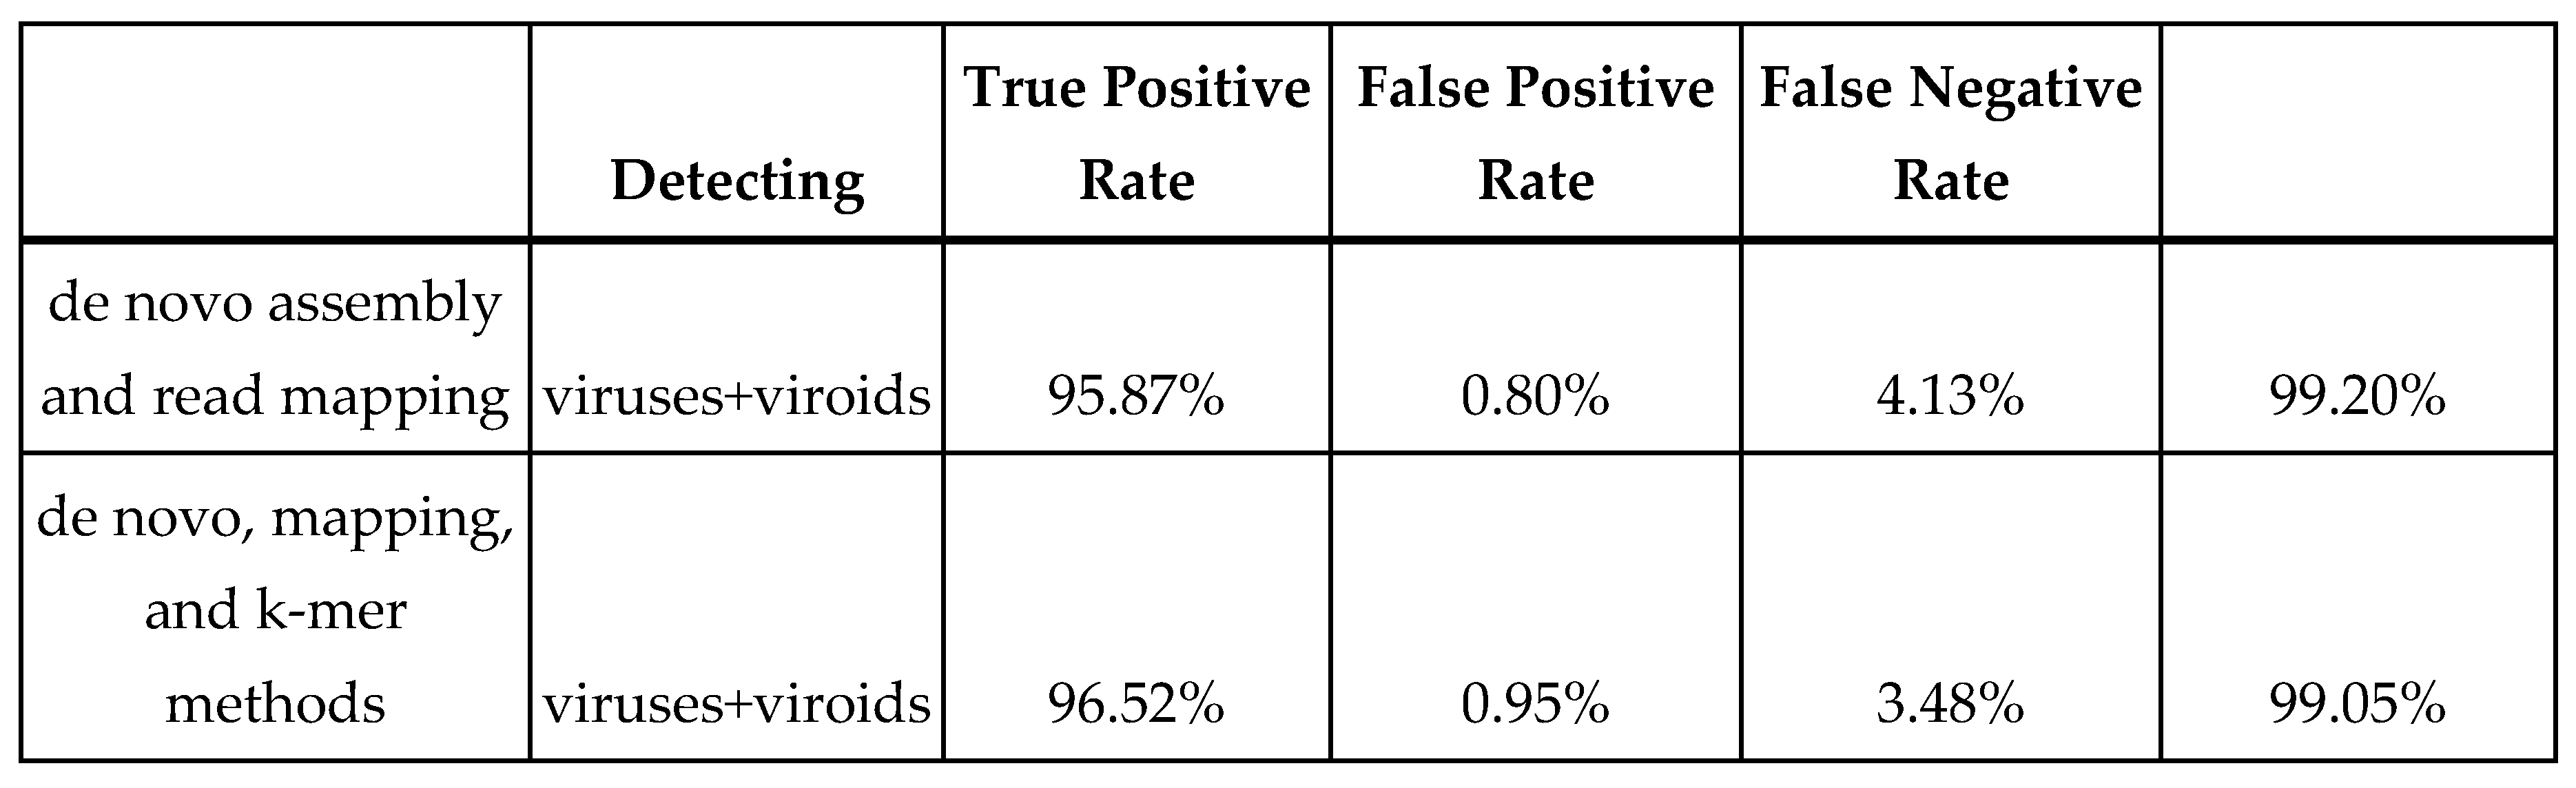
We evaluated the diagnostic performance of two ensemble methods in the context of a limit of detection analysis (Figure 1). A de novo assembly (spades + BLAST) and read mapping (pathoscope2 + Ref-GV) method were combined logically by considering a sample positive for a viral agent if either method produced a positive result and negative only if both methods produced a negative result. This logic implies that the sensitivity can not decrease, since the ensemble set of positives is the union of the individual methods. Indeed, this is reflected in the results where the ensemble method is more sensitive (TPR = 95.9%) than both individual component methods (TPR = 92.18%) for de novo and (TPR=92.25%) for read mapping. The price we pay for this increase in sensitivity is a decrease in specificity, (TNR = 99.2%), since the ensemble set of false positives is the union of the false positives from the individual methods.
We extended our ensemble analysis to evaluate the ensemble of three methods: de novo, read mapping, and the kraken2 k-mer method. For this ensemble, a sample was considered a positive if any of the three methods produced a positive. By adding a k-mer method sensitivity increased by a further 0.7% to an ensemble TPR of 96.52% with specificity modestly decreasing by 0.2% to an ensemble TNR of 99.05%.
The limit of detection analysis illustrates the ensemble methods particularly outperform the individual methods when dilutions of 5 million reads or less, which is notably less than a single order of magnitude from our target depth. We speculate the sensitivity gained by using an ensemble method to be even higher for low titer infections.
Figure 3.
Ensemble methods. (top) Limit of detection style plot of sensitivity (TPR) of the individual methods and the two ensemble methods over the different in silico dilution levels. (bottom) Summary diagnostic statistics for two ensemble methods averaged over all in-silico replicates sampled at a depth of at least 15 million reads.
4. Conclusions
In this paper we compared the performance of multiple methods for ascertaining virus positives in Grapevine using High throughput sequencing (HTS). HTS promises to be an improved diagnostic technique for screening plant material and limiting the spread of material containing harmful viruses. It has been reported that HTS-based detection methods can perform at least as well or better than conventional biological and molecular methods under specific circumstances.
Previous studies have investigated different aspects of HTS performance criteria. Extraction protocols and sequencing platforms were investigated in (Bester et al. 2021, Kutnjak et al. 2021). Different nucleic acid templates were investigated in (Massart et al. 2019, Kutnjak et al. 2021; Tamisier et al. 2021). Bioinformatics pipelines have been investigated in (Massart et al. 2019, Kutnjak et al. 2021; Tamisier et al. 2021). In this study we evaluate the performance of different bioinformatics approaches for detecting both known and novel viruses in a diagnostic setting. We also evaluate ensemble approaches that can accomplish both. Finally, we make recommendations on the findings in this study as well as the experience gleaned from processing thousands of individual samples (Al Rwahnih et al. 2024).
4.1. Read Mapping Approaches
We believed that read mapping would be a more sensitive approach to detecting known viruses. Theoretically fewer reads are required to identify a positive compared to approaches that rely on de novo assembly to first construct a consensus sequence from multiple overlapping reads before classification can occur. Indeed we have many anecdotes of PCR positives that are confirmed by a very small number of mapped HTS reads. Surprisingly though when we employed reasonable coverage and depth cutoffs of 20 reads and 200bp coverage, the read mapping method was not more sensitive than de novo, at least for known viruses.
Our results also showed that selection of the target database for read mapping is important. A single reference genome is not able to incorporate the high genetic diversity found in virus species. Target databases incorporating more than one reference genome per species outperformed target databases incorporating just a single reference. We also showed that specificity can be increased by using Pathoscope2 read assignment technique. Pathoscope2 works by reassigning multi-mapped reads to a minimal number of virus species. This helps greatly to reduce the number of false positives.
4.2. De Novo Assembly Approaches
de novo assembly is important for identifying novel viruses. FPS researchers have discovered, or supported the discovery of 35 novel viruses by employing de novo assembly followed by translated BLAST annotation (Al Rwahnih et al. 2024), However, de novo assemblers are very much heuristic methods which may be optimized for different scenarios. Our assessment of three de novo assemblers (for rnaSeq and metagenomic datasets) showed that choice of de novo assembler is an important consideration in determining sensitivity. Spades and Trinity performed clearly better than megahit at low coverage. Indeed, because assemblers may be optimized to different scenarios, running more than one offers additional sensitivity at the price of specificity and computation time. This is something we routinely do to obtain better assemblies from a dataset (e.g Diaz lara et al. 2021)
Our results showed that identifying novel viruses (blastx vs Genbank) is nearly as sensitive as identifying known viruses (blastn vs genbank). This is promising for the use of HTS as a replacement for biological indexing as a Phytosanitary diagnostic tool (Al Rwahnih et al. 2015; Al Rwahnih et al. 2024)
Running NCBI blastx against Genbank was too computationally intense to evaluate for this study. We looked at two tractable alternative approaches that performed equally well. The first is to use a small database of virus proteins to obtain presumptive positives. The much smaller list of presumptive positives is then screened against Genbank using NCBI blastx. The second method uses diamond blastx, a faster implementation of NCBIs translated search algorithm.
4.3. k-Mer Database Approaches
The kraken2 k-mer method was a surprising standout though it requires extensive computational and memory resources. While the method relies on exact substring matches, it can incorporate the genetic diversity of a virus by using a large target database, in this case all of Genbank. The k-mer method was sensitive and also more specific than read mapping. We routinely filter spurious low complexity matches to viral sequences when employing the read mapping approach. We also routinely filter misidentified and artifactual genbank sequences (e.g. a series of host sequences amplified using degenerate primers and wrongly annotated as citrus exocortis viroid as described in Di serio et al. 2014) these types of sequences may be precluded from being assigned to a specific virus in the k-mer database due to their taxonomic ambiguity. What the method lacks is a consensus sequence that would allow for better follow up, but this could be added by subsequent mapping or de novo assembly of the classified reads.
5. Recommendations
An ensemble is best. In general bioinformatics tools are almost always implemented as heuristic algorithms. That is they are different ac-hoc approaches to solve an algorithmic problem that only approximates a well defined optimal solution - which may be intractable or may not exist. Each heuristic implementation gives slightly different results. In our diagnostic setting, we can exploit the non-independence of these results by combining them to achieve greater sensitivity. Translated annotation is required for sensitive detection of novel viruses, however it is not a replacement for nucleotide methods that can detect untranslated homologies and are efficient enough to use on individual reads with potentially greater sensitivity. In this study, this recommendation is best exemplified by the performance of the two ensemble diagnostics evaluated, which both yielded a higher level of diagnostic sensitivity than all individual methods.
The more computational work you can put in, the greater the sensitivity. This is not only a corollary of our first recommendation, it also follows from the observation that the best annotation tools tend to be the most computationally expensive. For read mapping, the slower more sensitive algorithm combined with a larger target database incorporating genetic diversity performed best. For de novo assembly, multiple assemblers may be run for improved performance and expensive translated searches offer the potential to sensitively detect novel viruses. The k-Mer method was the most sensitive technique for known viruses evaluated but requires the largest computer to run.
Curation improves diagnostic accuracy. It is our experience at FPS that expert curation can be used to dramatically improve specificity over the numbers observed in this study. This is because these methods ascertain molecular sequences that can be further investigated by an expert. Curation can investigate homologies at the sequence and database level, ensuring the annotation is specific to the putative virus. Furthermore it can be investigated at the literature level to determine the level of confidence and likely host range of the virus homolog. Thus, specificity can be sacrificed somewhat for sensitivity. In our phytosanitary context, HTS is considered a presumptive test - largely due to the possibility of sample contamination. Presumptive positives will be followed up using PCR on an independent sample from the plant at a different time (Soltani et al. 2021; Al Rwahnih et al. 2024).
The molecular protocol is a limiting step. When positives are determined by a very small number of reads, it is important to use a sequencing protocol that is robust to cross contamination. For example Illumina platforms can be prone to cross contamination within a multiplexed run by the misidentification of the attached barcode sequences and between runs via sample retention in the fluidics system (MacConaill et al. 2018). We reduce this possibility using 96 dual index barcoding. Barcode pairs are more robust to misidentification within a run and allow for more infrequent re-use between runs. On the Illumina Nextseq we employ additional washing steps to reduce carryover between runs. Finally, we note that a good ribo-depletion step is required to remove a large amount of unwanted material that would otherwise be sequenced. We note that our recommended sequencing depth is dependent on how efficient ribo-depletion is.
For our specific HTS protocol we recommend: 1) Sequence to at least 15 million reads. The limit of detection analyses suggest diminishing returns after that point. 2) Host screening of the data up front leads to improved sensitivity for de novo assembly. Since a majority of the reads are removed during this step, different hosts and ribo-depletion protocols may affect performance 3) If employing a single de novo assembler use spades followed by blast against the Genbank non redundant nucleotide and protein databases. 4) For maximum sensitivity, employ the most sensitive approach available for mapping individual reads against a database that incorporates the known genetic diversity. In our study this was bowtie2 using the very-sensitive local mode against the complete viral division of Genbank. Summing reads over taxa using minimum depth cutoff of 20 removed the vast majority of false positives. We reduce that cutoff when employed as a confirmatory test 5) For highest sensitivity use a read mapping, de novo assembly, and a k-mer method as a third check and a confirmation. In our study 35 reads would be appropriate as a standalone test using kraken2 and could be reduced as a confirmatory test.
In conclusion, HTS has become a critical component of the management of Grapevine viral diseases. It is distinct from previous widely deployed methods in that it benefits from but does not rely on previous characterization of the viral agent. This allows for sensitive detection of known viruses with the possibility of detecting novel viruses. In this paper we empirically evaluated different bioinformatics tools for detecting viruses in HTS and report our recommendations on its implementation in a phytosanitary setting. At FPS, we have implemented the ensemble method of BLAST and read mapping since 2016. Because the diagnostic is inherently presumptive, we focus primarily on maximizing sensitivity. Because the protocol directly determines molecular sequences for a putative viral agent it lends itself well to additional expert evaluation and follow up experimentation.
References
- Al Rwahnih, M., Daubert, S., Golino, D., Islas, C. and Rowhani, A., 2015. Comparison of next-generation sequencing versus biological indexing for the optimal detection of viral pathogens in grapevine. Phytopathology, 105(6), pp.758-763.
- Al Rwahnih, M., Rowhani, A., Westrick, N., Stevens, K., Diaz-Lara, A., Trouillas, F.P., Preece, J., Kallsen, C., Farrar, K. and Golino, D., 2018. Discovery of viruses and virus-like pathogens in pistachio using high-throughput sequencing. Plant disease, 102(7), pp.1419-1425.
- Al Rwahnih, M., Klaassen, V., Erickson, T., Olufemi, J.A., Stevens, K., Hwang, M.S., and Port, L., 2024. A New Era in Federal Quarantine and State Certification Diagnostics at Clean Plant Centers in the USA. Plant Disease, in press.
- Bankevich, A., Nurk, S., Antipov, D., Gurevich, A.A., Dvorkin, M., Kulikov, A.S., Lesin, V.M., Nikolenko, S.I., Pham, S., Prjibelski, A.D. and Pyshkin, A.V., 2012. SPAdes: a new genome assembly algorithm and its applications to single-cell sequencing. Journal of computational biology, 19(5), pp.455-477.
- Bester, R., Cook, G., Breytenbach, J.H., Steyn, C., De Bruyn, R. and Maree, H.J., 2021. Towards the validation of high-throughput sequencing (HTS) for routine plant virus diagnostics: measurement of variation linked to HTS detection of citrus viruses and viroids. Virology Journal, 18(1), pp.1-19.
- Buchfink, B., Xie, C. and Huson, D.H., 2015. Fast and sensitive protein alignment using DIAMOND. Nature methods, 12(1), pp.59-60.
- Burd, E.M. Validation of laboratory-developed molecular assays for infectious diseases. Clin. Microbiol. Rev. 2010, 23, 550–576. [CrossRef]
- Di Serio, F., Flores, R., Verhoeven, J.T.J., Li, S.F., Pallás, V., Randles, J.W., Sano, T., Vidalakis, G. and Owens, R.A., 2014. Current status of viroid taxonomy. Archives of virology, 159, pp.3467-3478.
- Diaz-Lara, A., Stevens, K., Klaassen, V., Golino, D. and Al Rwahnih, M., 2020. Comprehensive real-time RT-PCR assays for the detection of fifteen viruses infecting Prunus spp. Plants, 9(2), p.273.
- Diaz-Lara, A., Stevens, K.A., Klaassen, V., Hwang, M.S. and Al Rwahnih, M., 2021. Sequencing a strawberry germplasm collection reveals new viral genetic diversity and the basis for new RT-qPCR assays. Viruses, 13(8), p.1442.
- EPPO PM 7/98 (4) Specific requirements for laboratories preparing accreditation for a plant pest diagnostic activity. EPPO Bulletin 2019, 49, 530–563. [CrossRef]
- Fuchs, M., 2020. Grapevine viruses: A multitude of diverse species with simple but overall poorly adopted management solutions in the vineyard. Journal of Plant Pathology, 102(3), pp.643-653.
- Fuchs, M., 2023. Grapevine virology highlights: 2018-2023. In Proceedings of the 20th Congress of ICVG, Thessaloniki, Greece (pp.18-26).
- Golino, D.A., 1992. The Davis grapevine virus collection. American Journal of Enology and Viticulture, 43(2), pp.200-205.
- Grabherr, M.G., Haas, B.J., Yassour, M., Levin, J.Z., Thompson, D.A., Amit, I., Adiconis, X., Fan, L., Raychowdhury, R., Zeng, Q. and Chen, Z., 2011. Trinity: reconstructing a full-length transcriptome without a genome from RNA-Seq data. Nature biotechnology, 29(7), p.644.
- Hong, C., Manimaran, S., Shen, Y., Perez-Rogers, J.F., Byrd, A.L., Castro-Nallar, E., Crandall, K.A. and Johnson, W.E., 2014. PathoScope 2.0: a complete computational framework for strain identification in environmental or clinical sequencing samples. Microbiome, 2(1), pp.1-15.
- Kesanakurti, P., Belton, M., Saeed, H., Rast, H., Boyes, I. and Rott, M., 2016. Screening for plant viruses by next generation sequencing using a modified double strand RNA extraction protocol with an internal amplification control. Journal of Virological Methods, 236, pp.35-40.
- Kutnjak, D., Tamisier, L., Adams, I., Boonham, N., Candresse, T., Chiumenti, M., De Jonghe, K., Kreuze, J.F., Lefebvre, M., Silva, G. and Malapi-Wight, M., 2021. A primer on the analysis of high-throughput sequencing data for detection of plant viruses. Microorganisms, 9(4), p.841.
- Langmead, B. and Salzberg, S.L., 2012. Fast gapped-read alignment with Bowtie 2. Nature methods, 9(4), pp.357-359.
- MacConaill, L.E., Burns, R.T., Nag, A., Coleman, H.A., Slevin, M.K., Giorda, K., Light, M., Lai, K., Jarosz, M., McNeill, M.S. and Ducar, M.D., 2018. Unique, dual-indexed sequencing adapters with UMIs effectively eliminate index cross-talk and significantly improve sensitivity of massively parallel sequencing. BMC genomics, 19, pp.1-10.
- Martelli, G.P., 2018, April. Where grapevine virology is heading to. In Proceedings of the 19th Congress of ICVG (pp. 10-15).
- Massart, S., Chiumenti, M., De Jonghe, K., Glover, R., Haegeman, A., Koloniuk, I., Kominek, P., Kreuze, J., Kutnjak, D., Lotos, L. and Maclot, F., 2019. Virus detection by high-throughput sequencing of small RNAs: Large-scale performance testing of sequence analysis strategies. Phytopathology, 109(3), pp.488-497.
- Puckett, J., Al Rwahnih, M., Klassen, V. and Golino, D., 2018, April. The Davis grapevine virus collection—A current perspective. In Proceedings of the 19th Congress of the ICVG, Santiago, Chile (pp. 9-12).
- Rott, M., Xiang, Y., Boyes, I., Belton, M., Saeed, H., Kesanakurti, P., Hayes, S., Lawrence, T., Birch, C., Bhagwat, B. and Rast, H., 2017. Application of next generation sequencing for diagnostic testing of tree fruit viruses and viroids. Plant Disease, 101(8), pp.1489-1499.
- Soltani N., Stevens K.A., Klaassen V., Hwang M-S, Golino D.A., and Al Rwahnih M., 2021. Quality Assessment and Validation of High-Throughput Sequencing for Grapevine Virus Diagnostics. Viruses,13, 1130.
- Tamisier, L., Haegeman, A., Foucart, Y., Fouillien, N., Al Rwahnih, M., Buzkan, N., Candresse, T., Chiumenti, M., De Jonghe, K., Lefebvre, M. and Margaria, P., 2021. Semi-artificial datasets as a resource for validation of bioinformatics pipelines for plant virus detection. Peer Community Journal, 1.
- Wood, D.E., Lu, J. and Langmead, B., 2019. Improved metagenomic analysis with Kraken 2. Genome biology, 20, pp.1-13.
Figure 1.
(top) Limit of detection style plot of sensitivity (TPR) over different in silico dilution levels. (bottom) Summary of diagnostic statistics for three popular de novo assemblers and two ensembles over all 1216 in silico replicates. Both screened and unscreened reads were considered for the individual assemblers.
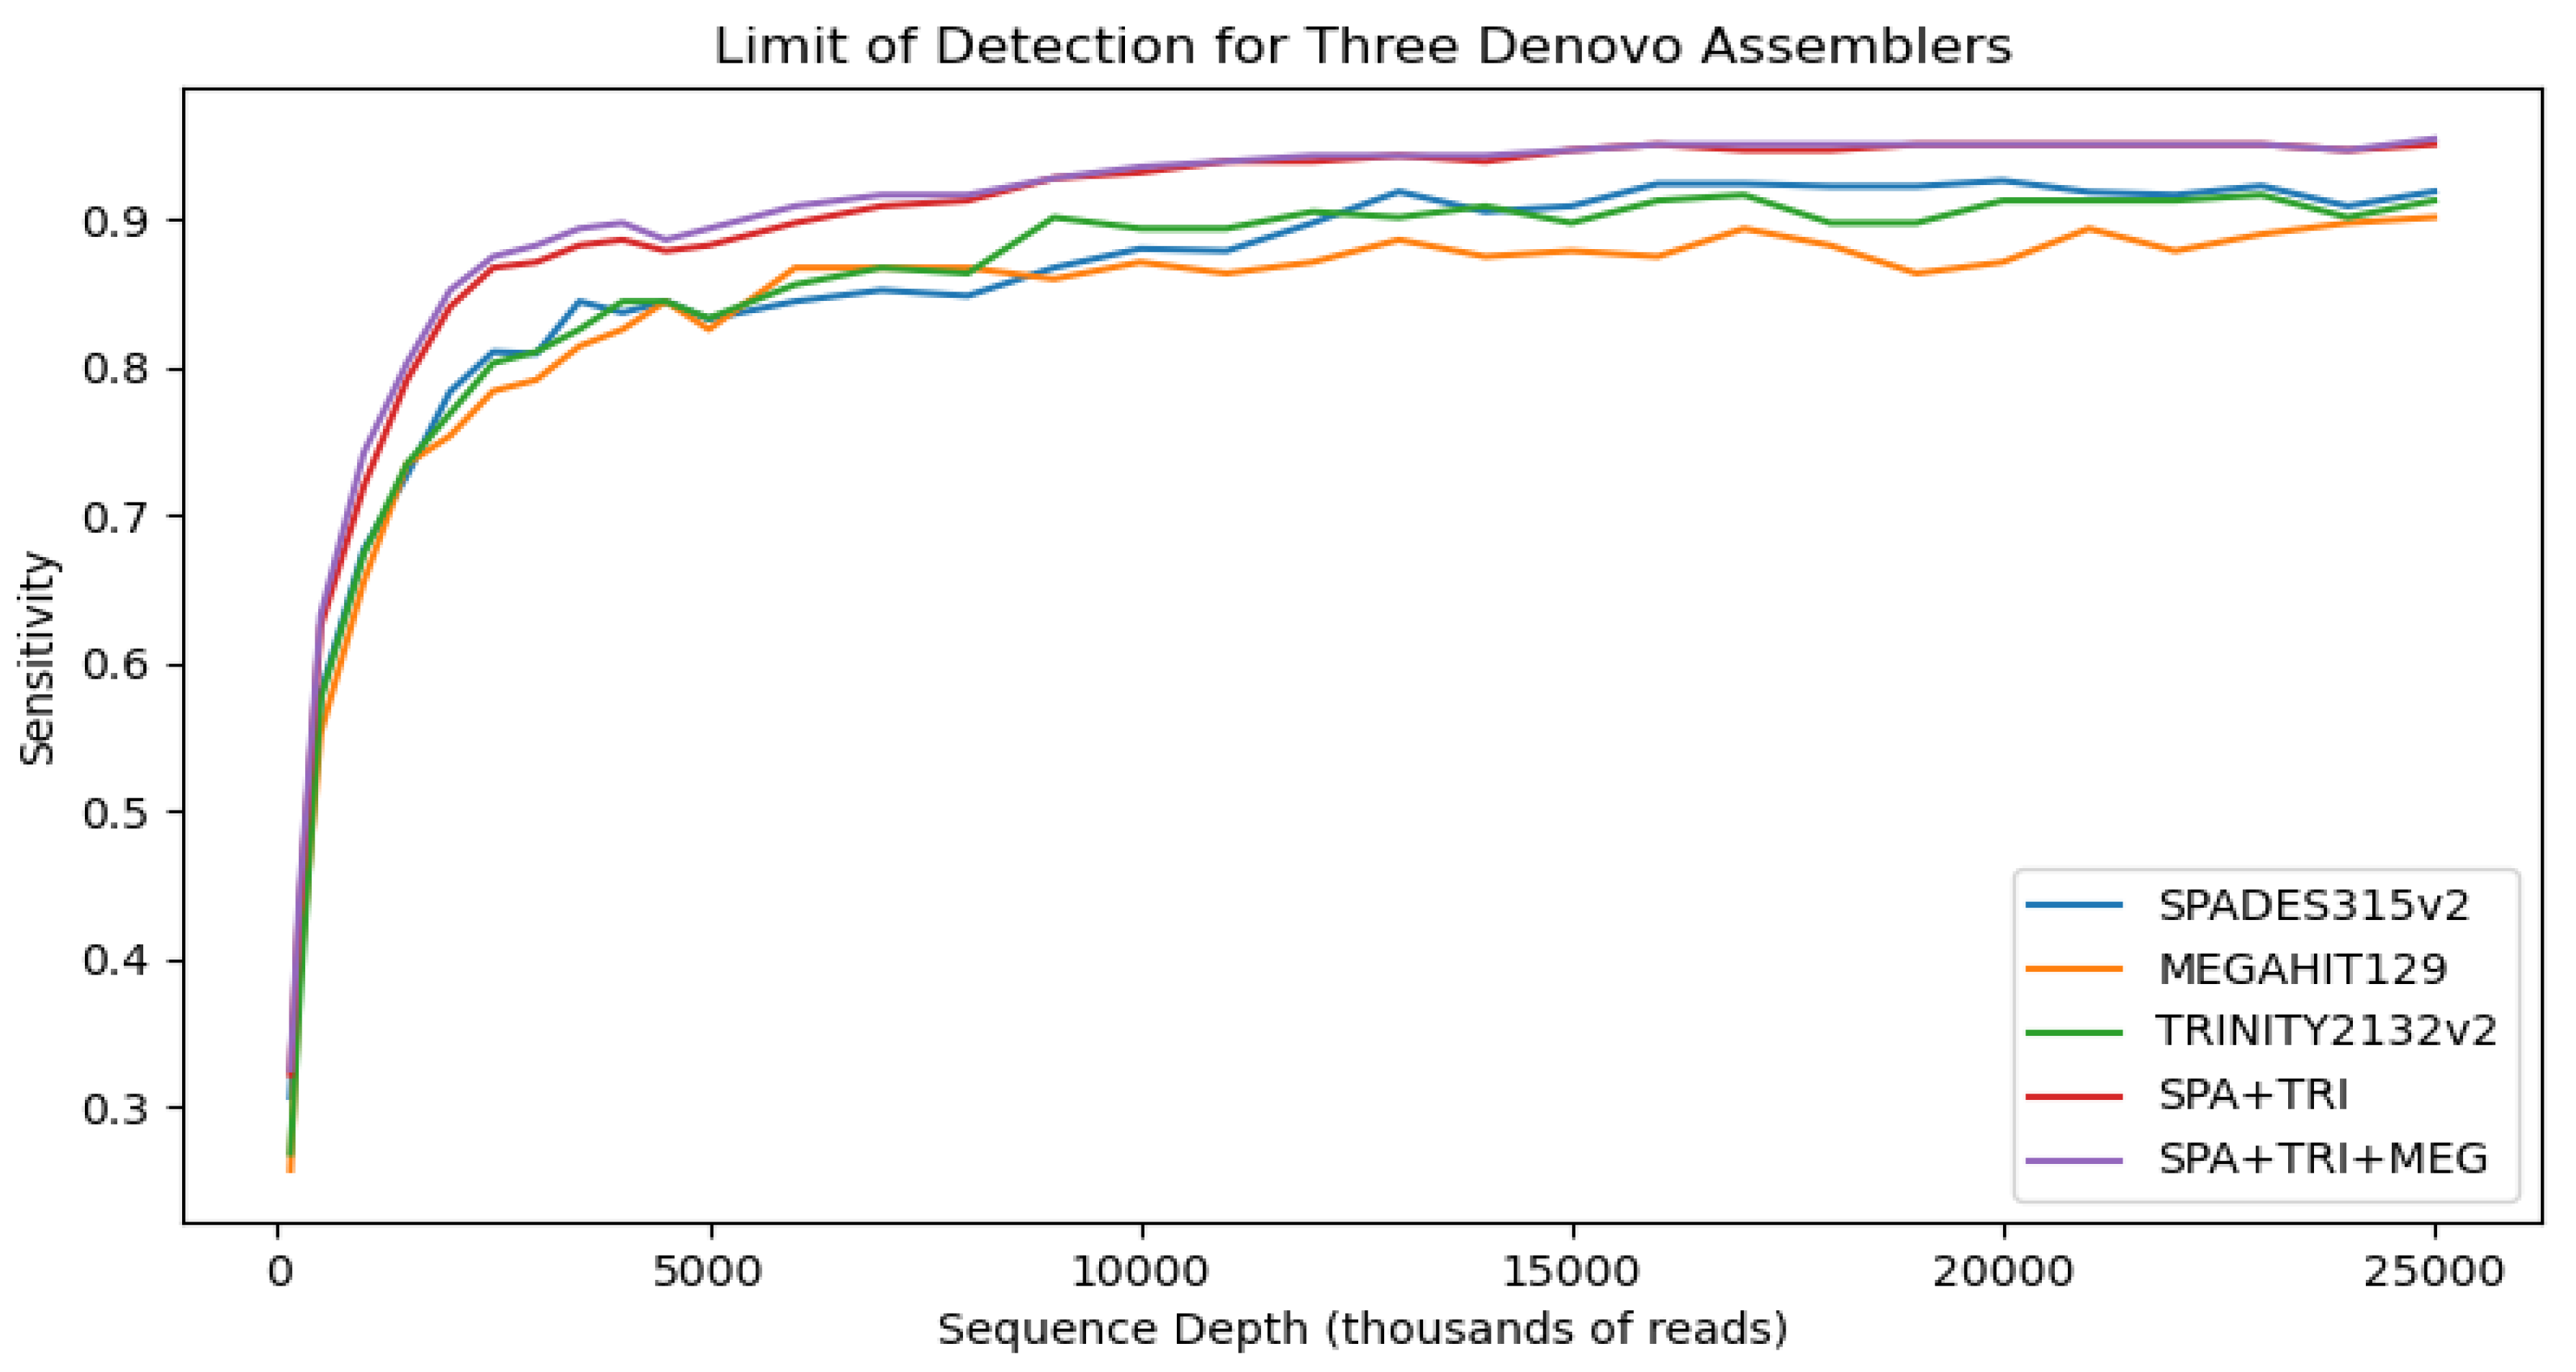
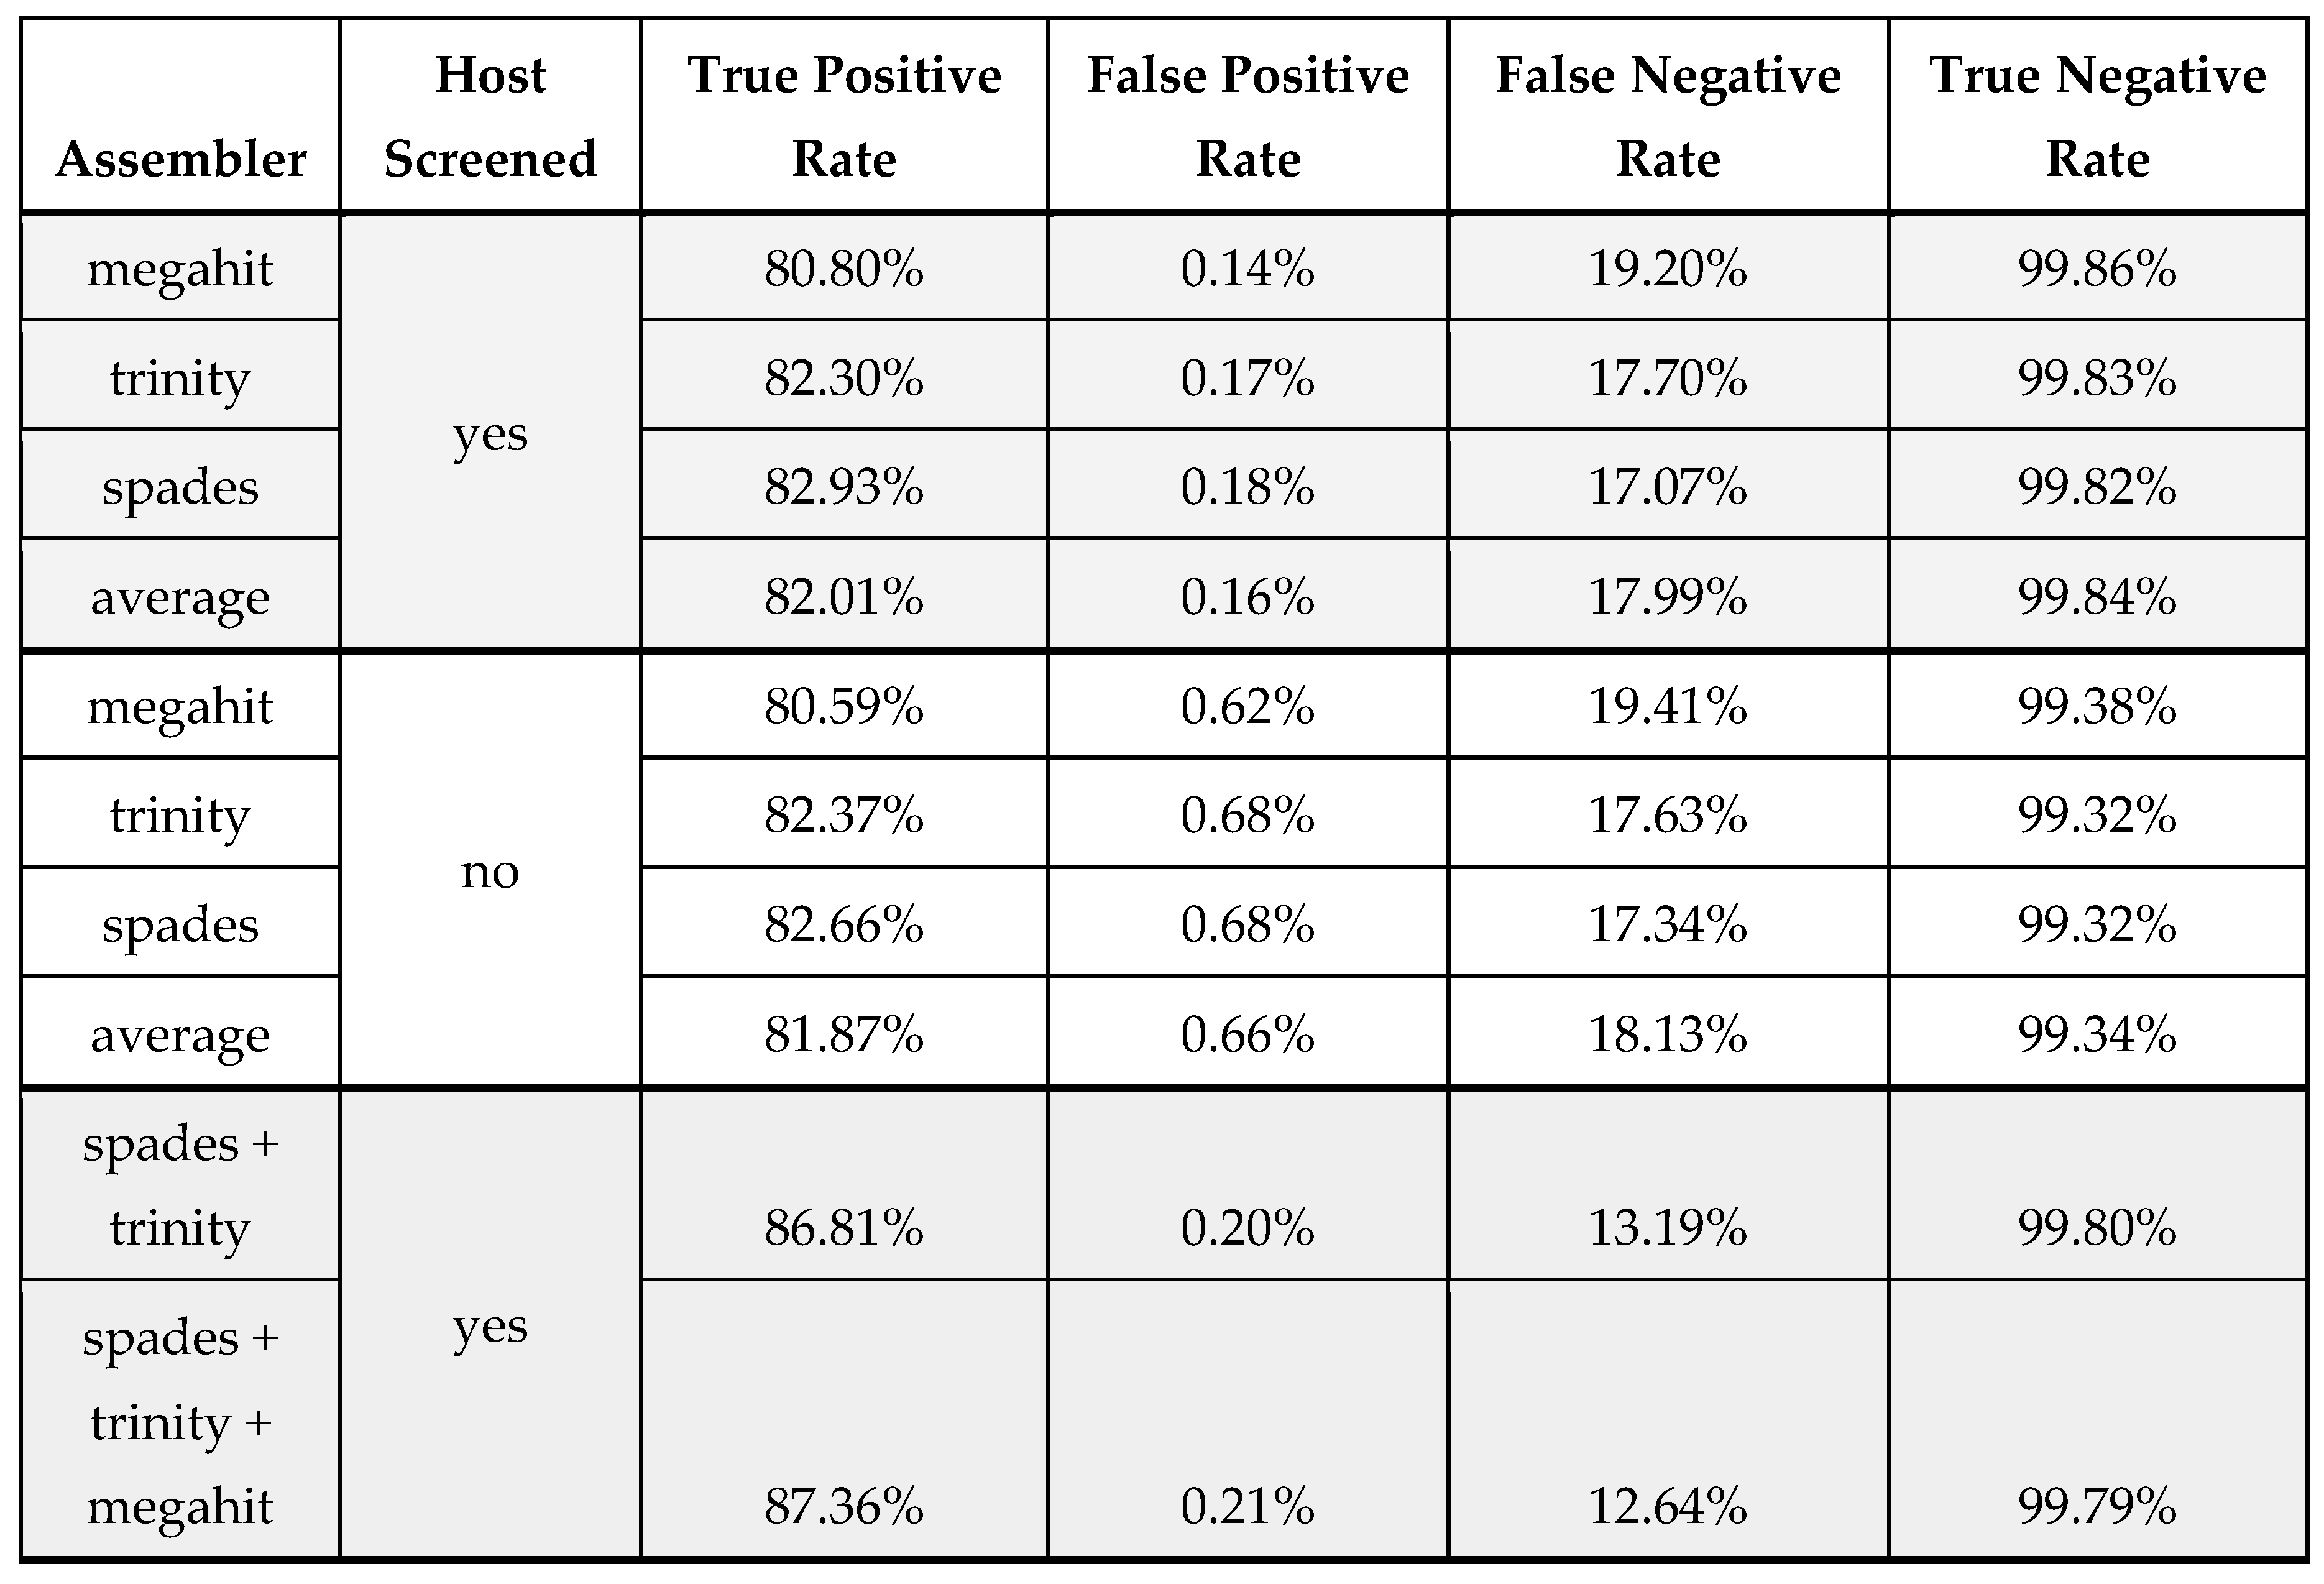
Figure 2.
(top) Histogram showing the number of taxonomically assigned reads associated with both true and false positives results in the in silico dilution data, (bottom) Summary diagnostic statistics for the kraken2 method averaged over all in-silico replicates sampled at a depth of at least 15 million reads.
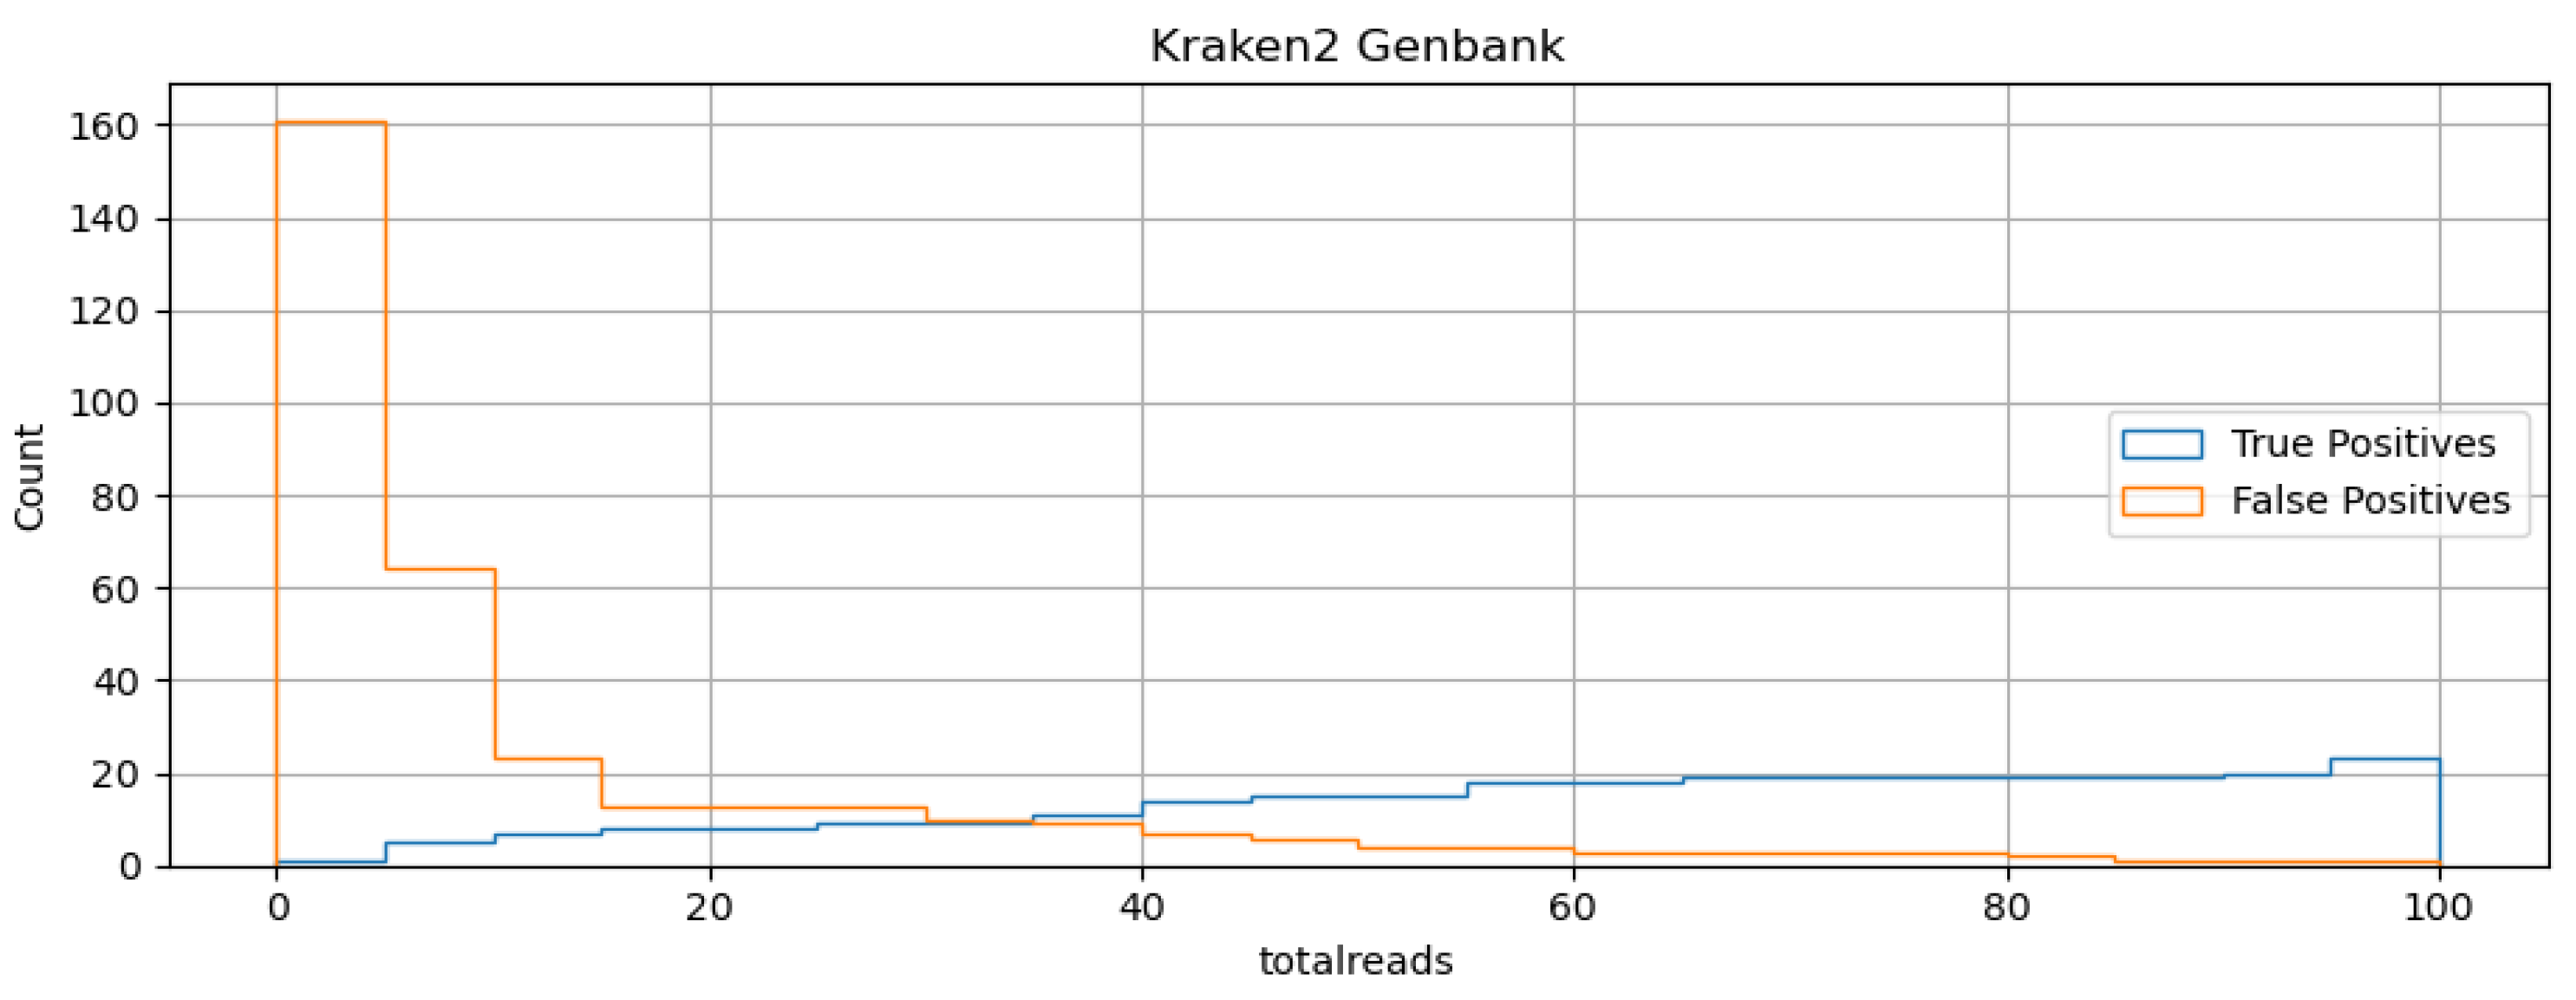
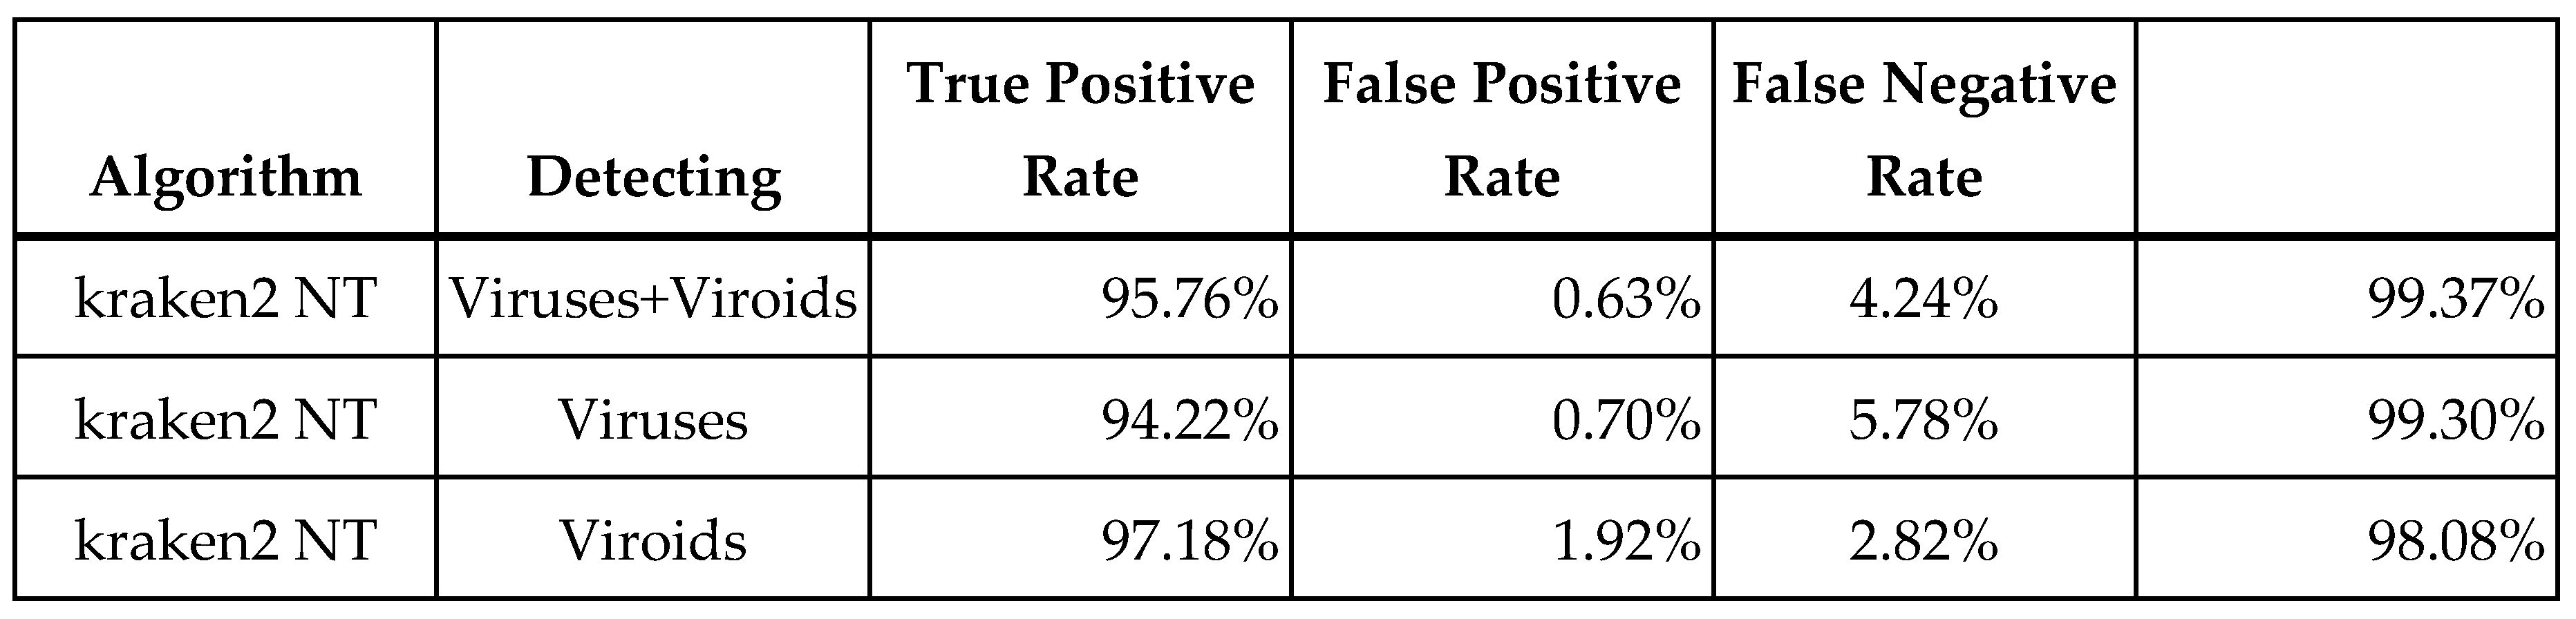
Table 1.
Composition and number of independent occurrences of virus and viroid infections in our Grapevine validation panel. For this study, we considered PCR confirmed infections to be "real" positives.
Table 1.
Composition and number of independent occurrences of virus and viroid infections in our Grapevine validation panel. For this study, we considered PCR confirmed infections to be "real" positives.
| Viral Agent | ID | N | Viral Agent | ID | N |
|---|---|---|---|---|---|
| Arabis mosaic virus | ArMV | 2 | Grapevine Red Globe Virus | GRGV | 1 |
| Fig badnavirus-1 | FBV-1 | 3 | Grapevine roditis leaf discoloration-assoc. virus | GRLDaV | 1 |
| Grapevine asteroid mosaic assoc. virus | GAMaV | 3 | Grapevine rupestris stem pitting-associated virus | GRSPaV | 15 |
| Grapevine badnavirus 1 | GBV-1 | 1 | Grapevine rupestris vein feathering virus | GRVFV | 7 |
| Grapevine enamovirus 1 | GEV-1 | 1 | Grapevine virus A | GVA | 6 |
| Grapevine fanleaf virus | GFLV | 9 | Grapevine virus B | GVB | 5 |
| Grapevine fleck virus | GFkV | 4 | Grapevine virus D | GVD | 1 |
| Grapevine Kizil Sapak virus | GKSV | 1 | Grapevine virus E | GVE | 1 |
| Grapevine leafroll-associated virus 1 | GLRaV-1 | 3 | Grapevine virus F | GVF | 2 |
| Grapevine leafroll-associated virus 2 | GLRaV-2 | 4 | Grapevine virus L | GVL | 1 |
| Grapevine leafroll-associated virus 3 | GLRaV-3 | 10 | Grapevine satellite virus | satGVV | 1 |
| Grapevine leafroll-associated virus 4 | GLRaV-4 | 7 | Hop stunt viroid | HSVd | 19 |
| Grapevine leafroll-associated virus 7 | GLRaV-7 | 1 | Grapevine yellow speckle viroid 1 | GYSVd-1 | 17 |
| Grapevine polerovirus 1 | GPoV-1 | 1 | Grapevine yellow speckle viroid 2 | GYSVd-2 | 9 |
| Grapevine red blotch virus | GRBV | 1 | Australian grapevine viroid | AGVd | 5 |
Table 2.
Sample, Sequencing and Filtering Data.
| Independent Grapevines | 19 | |
| Independent Samples | 38 | |
| A0A0A0A0Average number of reads sequenced | 24 | million average |
| A0A0A0A0Total number of reads sequenced | 903 | million total |
| A0A0A0A0Average number of bp sequenced | 1.77 | billion bp average |
| A0A0A0A0Total number of bp sequenced | 67.2 | billion bp total |
| In-silico Sub-sampled | ||
| A0A0A0A0Number of sub-samples | 32 | per sample |
| 1216 | total | |
| A0A0A0A0Number of reads sampled | 12.4 | billion total |
| A0A0A0A0Number of bp sampled | 924.6 | billion total |
| Adapter and Quality Trimmed | ||
| A0A0A0A0Number of trimmed reads | 12.4 | billion total |
| 0.02% | % reduction | |
| 918.2 | billion total | |
| 0.70% | % reduction | |
| Host Filtered | ||
| A0A0A0A0Number of reads post filter | 4.0 | billion total |
| 67.73% | % reduction | |
| A0A0A0A0Number of bp post filter | 296.4 | billion total |
| 67.72% | % reduction |
Table 4.
Summary of diagnostic statistics for different BLAST annotation algorithms with their appropriate Genbank non-redundant database. The diagnostic statistics are averaged over all in silico replicates sampled at a depth of at least 15 million reads.
Table 4.
Summary of diagnostic statistics for different BLAST annotation algorithms with their appropriate Genbank non-redundant database. The diagnostic statistics are averaged over all in silico replicates sampled at a depth of at least 15 million reads.
| Algorithm | Detecting | True Positive Rate | False Positive Rate | False Negative Rate | True Negative Rate |
|---|---|---|---|---|---|
| blastn nt | Viruses+Viroids | 92.18% | 0.25% | 7.82% | 99.75% |
| blastx GV+NR | Viruses+Viroids | 57.16% | 0.24% | 42.84% | 99.76% |
| diamond NR | Viruses+Viroids | 57.16% | 0.24% | 42.84% | 99.76% |
| blastn NT | Viruses | 91.98% | 0.32% | 8.02% | 99.68% |
| blastx GV+NR | Viruses | 91.92% | 0.31% | 8.08% | 99.69% |
| diamond NR | Viruses | 91.92% | 0.31% | 8.08% | 99.69% |
| blastn NT | Viroids | 91.36% | 1.92% | 8.64% | 98.08% |
Disclaimer/Publisher’s Note: The statements, opinions and data contained in all publications are solely those of the individual author(s) and contributor(s) and not of MDPI and/or the editor(s). MDPI and/or the editor(s) disclaim responsibility for any injury to people or property resulting from any ideas, methods, instructions or products referred to in the content. |
© 2024 by the authors. Licensee MDPI, Basel, Switzerland. This article is an open access article distributed under the terms and conditions of the Creative Commons Attribution (CC BY) license (http://creativecommons.org/licenses/by/4.0/).
Copyright: This open access article is published under a Creative Commons CC BY 4.0 license, which permit the free download, distribution, and reuse, provided that the author and preprint are cited in any reuse.


