
Submitted:
20 November 2024
Posted:
20 November 2024
You are already at the latest version
Abstract
The healthy gut masks a dynamic balance between pro- and anti-inflammatory activities, largely due to microbial factors in the lumen. IL-10 is vital among the anti-inflammatory mediators yet confirming constitutive versus stimulated secretion in any cell type is difficult due to the cellular complexity in the gut. Seeking to determine whether intestinal epithelial cells are programmed to constitutively make IL-10, we confirmed that IL-10 mRNA was present in enteroids from C57BL/6 mice and co-localized with a Paneth cell marker but not with markers for goblet or tuft cells. Paneth cells positive for IL-10 also possessed apical and basal IL-10RA while cells negative for IL-10 had only basal IL-10RA, suggesting a possible autocrine role for IL-10. Indeed, Paneth cells in IL-10 gene knockout (IL-10KO) enteroids possessed lower levels of anti-microbial protein mRNAs which could not be restored by adding IL-10. Enteroids passaged onto Transwell® filters to form monolayers were treated with IL-10 and STAT3 phosphorylation was measured. Apically applied IL-10 resulted in a stronger STAT3 signal than basally applied cytokine. Our results indicate that a subpopulation of Paneth cells constitutively secrete IL-10 apically, which binds apical IL-10RA, impacting the expression of anti-microbial proteins unique to Paneth cells.
Keywords:
Paneth cell
; Interleukin-10
1. Introduction
The homeostatic state of the healthy gut is achieved by a number of physical barriers combined with active suppression of lymphocyte responses to microbial and ingested antigens. The gut epithelium, comprised of multiple cell types aligned in a simple columnar epithelium, is the gate-keeper in this dynamic by providing a physical barrier but also by secreting mucus (goblet cells), anti-microbial peptides (Paneth cells), complement (enterocytes), and transporting immunoglobulins onto the lumen side of the monolayer [1]. Presumably these secretory activities are stimulated through pattern recognition receptors including toll-like receptors, formylated peptide receptors and anaphylatoxin receptors that enable the cells to respond directly or indirectly to challenges arising from the lumen [2]. Importantly, epithelial cells can be induced to secrete cytokines some of which participate in homeostasis or launch an inflammatory response [3,4].
One cytokine discovered to be critical to maintaining gut homeostasis is IL-10. In fact, mice and humans lacking IL-10 or the IL-10 receptor will invariably develop colitis and also ileitis in the case of gene knockout mice [5,6,7]. First discovered as a T lymphocyte cytokine and called cytokine synthesis inhibitory factor [8], IL-10 has since been reported to be secreted by multiple cell types. In the gut, macrophages stimulated by microbial products are a significant source of IL-10 [9,10], and IL-10 production by fibroblasts and cells within the epithelium has been reported [11,12]. Considering the cellular complexity of the gut and opposing anti-inflammatory versus inflammatory activities, it is difficult to prove whether IL-10 production is stimulated or constitutive in any cell type using in situ detection methods.
The gut epithelium is profoundly affected by IL-10, with IL-10 heightening epithelial integrity through multiple mechanisms [12] such as promoting intestinal stem cell renewal [13] and the function of secretory cell types including Paneth cells [14] and goblet cells [15]. Therefore, it is reasonable to hypothesize that epithelial cells may constitutively secrete IL-10, to bolster barrier properties and homeostasis. We sought to determine whether small intestinal epithelial cells constitutively produce IL-10 by examining cells in gut organoids, which are devoid of leukocytes and other parenchymal cells. Organoids have revolutionized intestinal epithelial cell research since an organoid made from the small intestine (an enteroid) includes all the major polarized differentiated cell types in addition to the dividing stem cells, something that has not been achieved by cell lines [16,17]. Using a combination of approaches, we show that a small population of Paneth cells in enteroids produce IL-10 and also possess the IL-10 receptor on the apical surface, implicating IL-10 in an autocrine loop in determining Paneth cell phenotype.
2. Materials and Methods
2.1. Animals
Wildtype mice (C57BL/6J) and IL-10-gene knockout mice (B6.129P2-Il10tm1Cgn/J) were purchased from The Jackson Laboratory (Bar Harbor, ME) then bred under SPF conditions at the IWK Health Centre facility. Mouse genotyping was done with the KAPA Mouse Genotyping kit (Roche, Pleasanton, CA) following the protocol provided by The Jackson Laboratory. IL-10GFP reporter mice on the C57BL genetic background have been described previously and were initially obtained from Dr. Richard Flavell (Yale University) then bred onsite [18,19]. For establishing enteroid cultures, primary tissues were isolated from male mice in the range of 6–14 weeks old. Experiments involving live animals meet the ARRIVE guidelines and were approved by the institutional animal ethics committee, the University Committee on Laboratory Animals (protocol 20-012), which applies the guidelines of the Canadian Council on Animal Care.
2.2. Crypt Isolation and Organoid Cultures
Enteroid cultures were established using the protocol reported by Sato et al. (2009) with some modifications [16]. In brief, the small intestine dissected from a euthanized mouse was first flushed with chilled phosphate buffer saline (PBS). The tissue was subsequently diced into ~2mm pieces which were repeatedly washed with chilled PBS before incubation in 30ml of ice-chilled 1mM EDTA for 30 minutes, then 30ml of chilled 5mM EDTA for 30 minutes. After the EDTA incubations the tissue was resuspended in 25ml of DMEM/F12 (Gibco, Waltham, MA) and manually shaken to dissociate mucosal crypts which were subsequently strained through a 100μm cell filter to enrich for crypts. The resulting crypt preparation was pelleted by centrifugation (130×g at 4°C for 4 minutes) then resuspended in DMEM/F12, which was repeated. The crypts were finally seeded into wells of a 24-well plate at a density of 100-200 crypts per 50µl basement membrane extract droplet (BME, comprised of chilled reduced growth factor BME Cultrex® (Trevigen, Gaithersburg, MD) and DMEM/F12 in a 3:1 ratio). After 20 minutes at 37°C the droplets typically solidified and 500µl of IntestiCult™ (Stem Cell Technologies, Vancouver, BC) was added. The preparations were incubated at 37°C with 5% CO2. The media was changed on days 3 and 5 of culture. For passaging enteroids (on day 7 of culture, at 1:5 ratio), droplets were dissolved and enteroids dissociated into crypts by serial pipetting in ice-chilled DMEM/F12 + 5% FBS (Gibco) followed by centrifugation (300×g) and resuspension in 1ml of chilled DMEM/F12 then seeding back into a fresh 24-well plate in a BME droplet.
2.3. Cytokine Treatments of Enteroids
Enteroid media had 20ng/ml murine recombinant IL-10 (Peprotech, Rocky Hill, NJ) added, which was refreshed every second day. For experiments analyzed using western blotting, a final concentration of 100ng/ml of IL-10 in growth media was applied to enteroid cultures for 20 minutes.
2.4. RNA Isolation and RT-qPCR
To extract RNA from enteroids, 2 to 3 enteroid BME droplets were gently dissolved then washed with ice-chilled PBS before being pooled. RNA was extracted using the ReliaPrep™ RNA Tissue Miniprep System (Promega, Madison, WI) following the manufacturer’s instructions. RNA was assessed for purity and quantity using the NanoDrop™ (Thermo Scientific, Waltham, MA) and stored at -80°C. Complementary DNA (cDNA) was made from 1µg RNA using a High-Capacity cDNA Reverse Transcription Kit (Applied Biosystems, Waltham, MA), following instructions provided with the kit. Subsequently, the PowerUp SYBR Green Master Mix (Applied Biosystems) was used for amplification of mRNAs of interest on a CFX96 Dx Real-Time PCR Detection System (Bio-Rad, Hercules, CA).
All PCR were normalized to the TATA-binding protein (TBP) signal, reported by Wang et al. (2010) to be the most stable qPCR reference gene for murine intestinal epithelial cells [20]. PCR products, either from genotyping or RT-qPCR, were run on 1.5% agarose/Tris-acetate-EDTA gels with 0.5μg/ml ethidium bromide, at 130 V for 40 minutes. Novel juice DNA stain (Sigma) was used as loading dye for imaging amplified DNA products and a 100 base pair DNA ladder (FroggaBio, Concord, ON). Images of amplified products were captured on a ChemiDoc™ Touch Imaging System (Bio-Rad). A list of primer sequences is provided in supplemental Table S1.
2.5. Immunofluorescent Staining
An immunofluorescent staining protocol was adapted from O’Rourke et al. [21]. Specifically, enteroids in 20µl BME droplets were cultured in chambers of a Millicell EZ SLIDE 8-well glass chamber (Millipore Sigma, Burlington, MA) for 4 days. To prepare the enteroids for staining, the droplet was washed with ice-chilled PBS for 1 minute then fixed in 300μl chilled 4% paraformaldehyde in 1X PME buffer (10x PME buffer: 500mM PIPES, 25mM MgCl2, 50mM EDTA) for 20 minutes on a shaking platform. Subsequently, enteroids were permeabilized with ice-chilled 0.5% Triton X-100 in PBS for 20 minutes on the shaking platform. In experiments in which enteroids contained abundant dead cells in the lumen, the enteroids were incubated for 30 minutes in 100mM glycine in PBS or Image-iT™ FX Signal Enhancer (ThermoFisher, Waltham, MA) at room temperature to quench autofluorescence by the dead cells. Enteroids were blocked with chilled 1% BSA in PBS for 30 minutes before being washed with washing buffer (0.2% Triton-X-100 and 0.05% Tween-20 in PBS) for 10 minutes. Primary antibodies were diluted in antibody signal enhancer (10mM glycine, 0.05% Tween20, 0.1% Triton X-100 and 0.1% hydrogen peroxide in PBS) at 1:50 ratio for the anti-IL-10 antibody (ThermoFisher), 1:200 for anti-Lyz1 (Bioss, Woburn, MA) and anti-Muc2 antibodies (ThermoFisher). Enteroids were incubated overnight at 4°C in the diluted primary antibody. Subsequently, enteroids were washed 3 times with washing buffer, 10 minute each time, before being incubated in a secondary antibody for 2 hours at room temperature (1:400 for all secondary antibodies). A list of antibodies is provided in Supplemental Table S2. Enteroids were counterstained with 1µg/ml DAPI in PBS for 5 minutes and washed 3 times with washing buffer, each time for 15 minutes, before mounting. To mount enteroids, chamber walls were detached from the slide and enteroids were mounted with Prolong™ Gold Antifade Mountant (Invitrogen) under a coverslip which was sealed with nail polish. Stained enteroids were imaged using a LSM 710 confocal microscope (Carl Zeiss).
To stain monolayers, the Transwell® insert was first detached using a scalpel then placed inside one of the chambers of a Millicell EZ SLIDE 8-well glass chamber (Millipore Sigma, Burlington, MA). The monolayers were then processed for immunofluorescence following the protocol for 3D enteroids. Conjugated antibodies were diluted in antibody signal enhancer (10mM glycine, 0.05% Tween20, 0.1% Triton X-100 and 0.1% hydrogen peroxide in PBS) at 1:200 dilution for both occludin (Santa Cruz, Dallas, TX) and KI67 (LifeSpan Biosciences, Seattle, WA). Subsequent steps followed the immunofluorescence protocol for 3D enteroids.
2.6. Adapting Enteroids to Monolayer Cultures
We adapted a published protocol to achieve 2D epithelial cultures from enteroids [22]. Transwell® inserts (6mm, 0.4μm pore size, Corning, Darmstadt, Germany) were treated with 40µl of sterile type 1 collagen (Millipore) preparation consisting of 1 part 7.48mg/ml collagen: 1 part 0.2% acetic acid: 1 part 70% ethanol) and left to air-dry overnight under laminar flow (in a Biological Safety cabinet). High density enteroid cultures were established by dissociating 7 day enteroids into a suspension. The dissociated crypts were resuspended in fresh BME droplets up to the original volume of the source enteroids, then grown for 3 days before being dissociated again this time including mechanical dissociation by passage through an 18-gauge needle. Prior to adding the cell suspension onto the Transwell® insert, 500µl of pre-warmed Intesticult™ was added to each Transwell® bottom compartment. Three dissociated enteroid droplets were pooled together for each monolayer insert. Following an overnight incubation on the insert, the media was replaced with 200µl of fresh Intesticult™ to remove unattached cells. Subsequently, the media was refreshed every 2 days.
2.7. Protein Extraction
Enteroids and monolayer cultures were pre-treated with cell-permeant phosphatase inhibitor (30µM phenylarsine in medium) for 15 minutes. Enteroids embedded in a BME droplet were gently washed with chilled PBS, then vigorously pipetted in chilled Cell Recovery Solution (VWR), then left on a vortex for 20 minutes at 4°C, to facilitate BME dissolution and enteroid dissociation. The dissociated enteroids were pelleted and washed in chilled PBS (200×g for 4 minutes each time); the pellet was then resuspended in 150µl RIPA buffer (50mM Tris HCl—pH 7.4, 150mM NaCl, 1% Triton X-100, 0.5% sodium deoxycholate, 0.1% SDS, 1mM EDTA, 10mM sodium fluoride, 1X freshly added Halt™ protease inhibitor cocktail (ThermoFisher), and freshly added phosphatase inhibitor cocktail (final concentration: 5mM sodium orthovanadate, 10mM sodium pyrophosphate decahydrate and 10mM β-glycerophosphate). To extract protein from monolayers after the phosphatase inhibitor pre-treatment, the Transwell® insert was detached using a scalpel and immediately immersed in 150µl of RIPA buffer. Lysis was conducted at 4°C shaking on a vortex for 30 minutes, then the contents were centrifuged at 13000×g for 10 minutes and the protein fraction recovered in the supernatant. The protein/lysate was diluted in 4X SDS-PAGE loading buffer (25% glycerol, 12% SDS, 20% β-mercaptoethanol, 0.04% bromophenol blue in 150 mM Tris) (3:1 ratio, respectively) and boiled at 90°C for 5 minutes before being immediately chilled on ice and stored at -80°C.
2.8. Western Blotting
Proteins were separated by electrophoresis with Tris-Glycine running buffer (10X buffer contains 14% glycine, 3% Tris base and 1% SDS in dH2O) on either 8% SDS-PAGE gel for 2 hours at 100V, or on gradient TGX Stain-Free™ Mini-PROTEAN precast gels (Bio-Rad Laboratories) for 1 hour at 120V. Subsequently, protein was transferred from the gel to 0.45µm low fluorescence PVDF membrane using a Trans-Blot Turbo RTA Transfer kit and Trans-Blot Turbo Transfer System. To enhance detection of low abundant proteins the membrane was incubated in SuperSignal™ Western Blot Enhancer (ThermoFisher) for 30 minutes before incubation in blocking buffer TBS-T (20mM Tris, 150mM NaCl and 0.1% Tween® 20 detergent) + 3% BSA) for 1 hour. Subsequently, the membrane was incubated in a primary antibody (pSTAT3(TYR705), or STAT3, Cell Signaling Technology, Danvers, MA) diluted 1:2000 in blocking buffer) overnight at 4°C with gentle rocking. The membrane was washed 3 times in TBS-T, each time for 10 minutes with gentle rocking before being incubated with secondary HRP-linked goat anti-rabbit antibody for 1 hour at room temperature (1:10000 dilution, Cell Signaling Technology). The membrane was then washed 4 times with TBS-T, each time for 10 minutes, before being activated with either Clarity™ Western ECL Substrate (Bio-Rad Laboratories), or with SuperSignal™ West Atto ultimate Sensitivity Chemiluminescent Substrate (ThermoFisher) for low-abundance protein. Proteins on membranes were imaged using a Bio-Rad ChemiDoc™ Touch Imaging System.
2.9. Statistical Analyses
Comparisons of 2 groups were conducted using unpaired two-tailed Student’s t-test. Comparison of more than 2 groups were conducted first with One-way ANOVA, followed by Tukey’s post hoc test (1 independent variable), or Two-way ANOVA (2 independent variables), followed by Sidak’s post hoc test. Significance of fold change was tested using one-sample Wilcoxon test. All statistical tests and figures were created with GraphPad Prism 8 (GraphPad Software, San Diego, CA). P-value of less than 0.05 is considered statistically significant (* p < 0.05, ** p< 0.01, *** p < 0.001, ns—not significant). Specifically, for the IL-10 and IL-10RA transcripts data, results were normalized to TBP and displayed as mean ± standard deviation (n = 3-4, One way ANOVA followed by Tukey’s post hoc test). For cell type marker transcripts (LYZ1, MUC2, DLCK1, DEFA5, NOTCH1, ATOH1, HES1) all results were normalized to TBP and shown as mean ± standard deviation (n = 6-9, One way ANOVA followed by Tukey’s post hoc test). For pSTAT3 quantification in 3D enteroids, the results were normalized to STAT3 and shown as mean ± standard deviation (n = 3, ns,–not significant, 2-tailed t-test). For pSTAT3 quantification in monolayers, the results were normalized to STAT3 signal and shown as mean ± standard deviation (n = 3, * < 0.05, ** < 0.01, ns—not significant, two-way ANOVA followed by Sidak’s post hoc test).
3. Results
3.1. Enteroid Culture Conditions and Intrinsic Expression of IL-10 and IL-10 Receptor mRNA
Enteroids provide a model recapitulating the intestinal epithelium yet because they are derived from whole intestine, risk being contaminated by leukocytes, particularly intraepithelial lymphocytes. It was shown by others that screening for CD45 or CD3 was insufficient to confirm leukocytes are absent since these markers have been reported in data from single-cell mRNA sequences from intestinal epithelial cells [23]. Thus, we chose to work with enteroids after first passage when leukocytes are presumed to be lost. Budding commonly started as early as day 3 and most enteroids had budded by day 5 of culture. Notable, due to inevitable variations in growth factor gradients in the BME matrix, different enteroids within the same droplet were not necessarily homogenous in their developmental stages.
IL-10 and IL-10RA mRNAs were detected in WT enteroids at all the time points tested, days 2, 4 and 6 of culture, with expression of IL-10 transcripts significantly elevated in the day 4 cultures (Figure 1A). (We also used RT/PCR to confirm that our IL-10KO
enteroids lacked mRNA for IL-10, shown in Supplemental Figure S1.) Based on the IL-10 mRNA data we chose to analyze day 4 cultures more closely, on the presumption this is a crucial time point for differentiation and maturation of specialized epithelial cells. IL-10RA mRNA was detected but levels were not significantly different over the culture period (Figure 1A). Since RT-qPCR results indicated the highest relative expression of IL-10 in day 4 enteroids we used this period of development to investigate the source of IL-10 in WT and IL-10-GFP reporter enteroids using immunofluorescence. GFP fluorescence was undetectable in unstained IL-10-GFP reporter enteroids (bottom right panel in Figure 1B) possibly due to very low expression levels; therefore, the GFP protein was indirectly detected (and the signal amplified) with an anti-GFP antibody followed by a suitably conjugated secondary antibody. GFP expression in IL-10-GFP reporter enteroids, and IL-10 protein in WT enteroids, were both detected on the apical side of cells at the crypt base (Figure 1B). To provide better resolution on our evidence that IL-10 is in the apical portion of cells we co-stained enteroids for IL-10 and phalloidin (stains apical F-actin, Supplemental Figure S2). IL-10RA protein was also detected in enteroids, in both WT and IL-10KO genotypes. While basal expression of IL-10RA can be seen at the crypt base of both WT and IL-10KO enteroids, apical expression was only detected in WT enteroids. An isotype control of same host species (rabbit) was used as negative control and no staining was detected (Figure 1B and C). Considering that IL-10 and IL-10RA are both expressed apically on cells found in the crypt base we hypothesized that there is a potential for autocrine activity in enteroids. We co-stained enteroids for IL-10 and IL-10RA and observed that both proteins indeed occurred in the same cell (Figure 1D). Interestingly, cells expressing apical IL-10RA also express basal IL-10RA but are rarer in number compared to cells expressing only basal IL-10RA (Figure 1C, D), suggesting that this rare cell subtype with possible IL-10 autocrine activity may play a different role from the rest of the IL-10RA expressing cells present in the crypt base area.
3.2. Paneth Cells Produce IL-10 Apically for Autocrine Activity
Localized in the crypt, the cellular source of IL-10 is likely Paneth or stem cells or possibly both. Using lysozyme (LYZ1) as the cellular marker for Paneth cells we determined that IL-10 is expressed on LYZ1-positive cells in WT enteroids (Figure 2A). This finding was duplicated in enteroids from IL-10-GFP reporter mice; GFP was co-expressed with LYZ1, confirming the production of IL-10 in Paneth cells (Figure 2A). We detected 0-6 Paneth cells per organoid (median 1.5 Paneth cells per organoid) and 0-3 IL-10-positive cells per organoid. To rule-out other differentiated cell types possibly expressing IL-10, IL-10 detection was combined with mucin-2 as marker for goblet cells, or doublecortin-like kinase 1 (DCLK1) as a marker for tuft cells. We determined that the epithelial IL-10 signal did not overlap with either of these cell types indicating IL-10 expression is limited to Paneth cells (Figure 2A). Notably, only a very small number of LYZ1-positive Paneth cells were found positive for IL-10 suggesting that IL-10 production is perhaps limited to a particular developmental stage of Paneth cells, or a specialized subset of Paneth cell (Figure 2B).
The cell type bearing the IL-10RA was also investigated using the cell-type specific markers. As predicted, apical IL-10RA was found on LYZ1-positive Paneth cells (Figure 2C). Contrasting the Paneth cell-specific staining of apical IL-10RA. basal IL-10RA was not limited to the crypt base as scattered patches of basal IL-10RA staining were detected at regions outside the crypts. Some of the basal IL-1RA signal was localized to goblet cells but not to tuft cells (Figure 2C).
3.3. Paneth Cell Markers Are Reduced in the Absence of Epithelial IL-10
Since IL-10 was found heightened in day 4 enteroids we decided to investigate the effect of epithelial IL-10 upon cell types one day after the peak of IL-10 expression, to allow time for the cellular targets to respond to the endogenous IL-10. mRNA for anti-microbial proteins specific to Paneth cells, LYZ1 and DEFA5, as well as MUC2 for goblet cells, were measured in day 5 WT and IL-10KO enteroids. Both LYZ1 and DEFA5 mRNAs were significantly less in IL-10KO enteroids compared to WT enteroids (Figure 3A). Harvesting the entire enteroid, we cannot confidently determine whether the deficiency is in all Paneth cells or only the few that would be expressing apical IL-10RA but if it is limited to a subset of Paneth cells then the deficiency is quite profound considering much of the signal would be from cells unaffected by the loss of IL-10 signaling. To rule-out a secretory cell-wide deficiency in IL-10KO enteroids we measured MUC2 mRNA levels and found no significant difference between IL-10KO and WT enteroids. These results suggested that epithelial endogenous IL-10 likely plays a regulatory role specific to Paneth cell development.
We next tried to reverse the observed deficiencies of Paneth cell markers in IL-10KO enteroids by supplementing IL-10KO enteroids with recombinant IL-10. Recombinant IL-10 was added to IL-10KO enteroid cultures to a final concentration of 20ng/ml beginning on day 1 of culture and replenished at each media change; however, IL-10 had no significant effect on the markers in IL-10KO enteroid (Figure 3A). This result indicated that stimulation with IL-10, at least through basal receptors, does not affect the cellular markers of Paneth cells (nor goblet cells) in IL-10KO organoids, recalling that cells in IL-10KO enteroids lacked apical IL-10RA.
To gain further insight into the developmental stage that epithelial IL-10 could be acting on, we examined cellular lineage markers that determine the balance between secretory and absorptive progenitors. NOTCH1 and HES1 induce absorptive progenitors, i.e., enterocytes, while ATOH1 induces the emergence of secretory progenitors such as goblet and Paneth cells [24]. We found no significant differences in mRNA levels of these lineage markers between WT and IL-10KO enteroids suggesting that IL-10 does not affect enteroids at this early lineage-determining stage (Figure 3B).
3.4. STAT3-Dependent IL-10 Signaling Occurs upon Stimulation of Apical IL-10RA Receptors
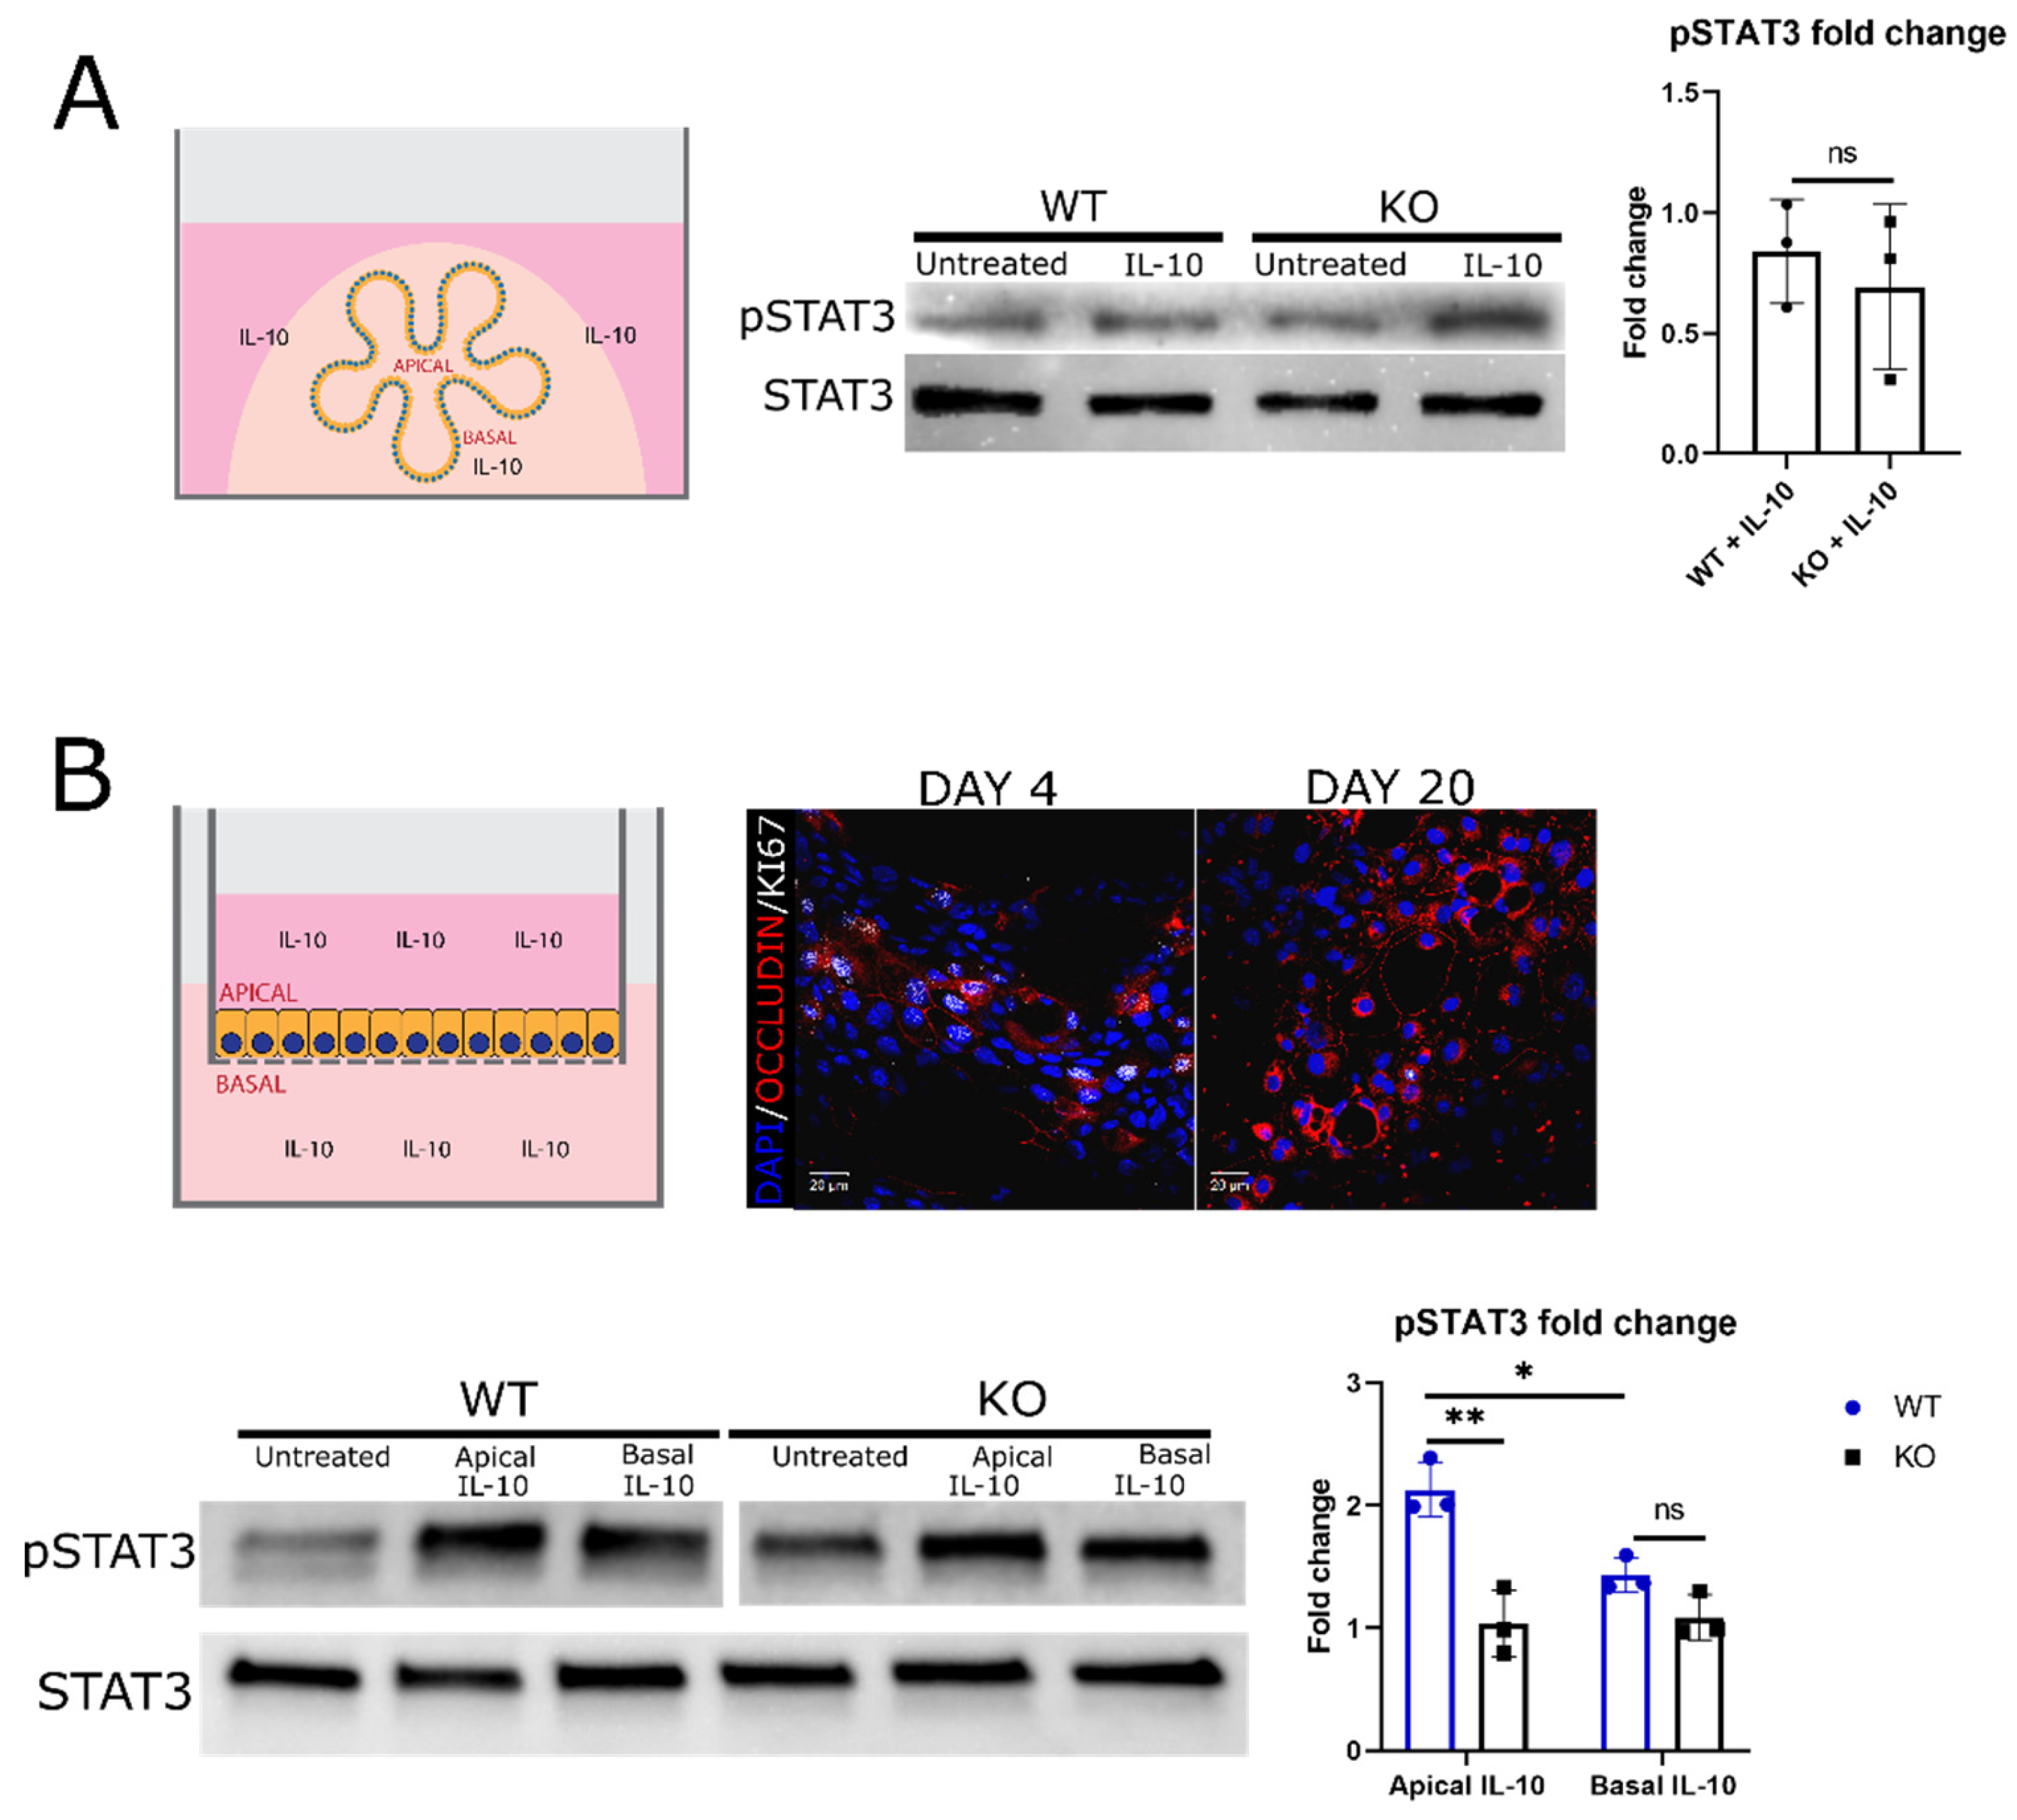
The cell-dependent polar expression of IL-10RA on the epithelium raised the possibility that different signaling pathways are activated through the receptors on either side of the cell. In many cells IL-10RA signals predominantly through the phosphorylation of STAT3 [25,26]; therefore, IL-10 signaling in WT and IL-10KO enteroids was examined by measuring phosphorylated STAT3 (pSTAT3) relative to unphosphorylated STAT3 in the same lysate. It was first noted that untreated WT and IL-10KO enteroids already have detectable pSTAT3 (Figure 4A). Then, over multiple repeats, levels of pSTAT3 in IL-10-treated enteroids was similar between WT versus IL-10KO genotype and untreated enteroids (Figure 4A). The effect of apical stimulation alone remained to be teased-out.
To gain access to IL-10 receptors on both sides of the epithelium we established 2D enteroid monolayers on Transwell® filters (Figure 4B). Our 2D enteroid monolayer model reached 100% confluency with fully developed tight junctions (shown with occludin staining, Figure 4B) after 20 days of culture. However, because day 20 monolayers have few Ki67+ cells (Figure 4B), which could confound results compared to day 5 enteroids in 3D culture, we conducted the IL-10 treatment experiment as soon as the monolayer reached confluency despite the possibility that tight junctions are incompletely developed (Figure 4B). Nevertheless, upon apical exposure of monolayers to IL-10, the relative level of pSTAT3 in WT monolayers was 2-fold higher than that of the untreated monolayers prepared from the same batch of enteroids. This change was significantly higher than the pSTAT3 level observed in WT monolayers upon basal stimulation. No increase in STAT3 phosphorylation was observed in IL-10KO monolayers following either basal or apical stimulation with IL-10.
4. Discussion
Although IL-10 has long been considered the key regulator of intestinal epithelial and therefore intestinal homeostasis, the role of epithelial-derived IL-10 is not completely understood. Using an enteroid model we were able to exclude leukocyte-derived sources and focus on epithelial-derived (endogenous) IL-10, while maintaining the spatial and temporal dynamics of the native epithelium.
Cells within enteroids constitutively express IL-10 and IL-10RA throughout enteroid developmental stages, detectable as mRNA and protein. We further show that some Paneth cells possess both apical IL-10 and apical IL-10RA. Given that Paneth cells are long-lived cells (> 30 days in vivo) and undergo complex changes before reaching maturation [27], early enteroid culture might only capture a snapshot of IL-10 and IL-10RA expression patterns in the Paneth cell population. The increase in IL-10 transcripts in day 4 cultures could be explained by a number of hypotheses and the limited number of Paneth cells expressing IL-10 is compatible with expression being restricted to a specific developmental stage. The “budding” events in day 4 cultures indicate a transitional phase from proliferation to differentiation and IL-10 production could be linked to this temporary phase and therefore be enhanced in the process. Alternatively, IL-10-positive Paneth cells might accumulate associated with new crypt formation. Finally, others have shown that Paneth cells are phenotypically diverse depending on the region in the gut [23]. We grew enteroids from whole murine small intestine; IL-10-positive Paneth cells in our cultures could constitute a particular regional-specific subpopulation of Paneth cells, an idea that could be confirmed by growing enteroids from limited regions of small intestine.
Regarding the impact of local IL-10 expression, we detected reduced expression of antimicrobial products LYZ1 and DEFA5 in IL-10KO compared to WT enteroids. Although reduced LYZ1 expression was not observed in vivo, the packing of lysozyme granules in Paneth cells of IL-10KO mice were reported to be abnormal compared to Paneth cells in WT mice [14,28,29]. Our finding of Paneth cell antimicrobial deficiencies in IL-10KO enteroids is compatible with those reports and the specific differences due to the sensitivity of detecting products in enteroids versus whole intestine or other extrinsic factors in mice. Interestingly, addition of IL-10 to either WT mice or WT ileum enteroids was shown to induce production of LYZ1 [30]. In our study, addition of IL-10 to IL-10KO enteroids was shown to be ineffective at raising Paneth cell markers. This discrepancy may be due to the lack of apical IL-10RA expression by cells recovered from IL-10KO mice, and in vivo, other cell types may respond to the added IL-10 and indirectly provide signals to Paneth cells.
Although the lack of epithelial IL-10 was shown to affect the production of Paneth cell product mRNAs in our study, how IL-10 drives this physiological change remains undetermined. Our investigation of the lineage balance between secretory and absorptive progenitors showed insignificant differences between WT and IL-10KO enteroids. However, this observation does not rule-out the impact of IL-10 upon the upstream pathway of Paneth cell determination or development. IL-10 was suggested to play a pivotal role in reaching complete cellular maturation, as IL-10KO mice were found with 3-fold more abundant intermediate cells which co-express both Paneth cell and goblet cell features compared to WT enteroids [14]. One candidate upstream signaling molecule that could have such an impact is NF-κB. Indeed, epithelial-derived IL-10 was shown to induce NF-κB [31], the activity of which was shown in another study to determine the cell fate of Paneth cell from goblet cell via activation of the SOX9 transcription factor [32]. Perhaps the reason we did not see any changes in the levels of NOTCH1, HES1 or ATOH1 is because in the process of Paneth cell fate determination these markers regulate the early stage of secretory-versus-absorptive lineage commitment, which occurs upstream from Paneth cell-determining SOX9 activation [33]. Future examinations of the relationship between IL-10, NF-κB signaling and Paneth cell development can shed light on this speculation.
Alternatively, the observed deficiency of Paneth cell markers in IL-10KO enteroids could be a result of proliferation-versus-differentiation imbalance, which aligns with previous reports of hyper-proliferation in IL-10KO crypts in vivo [30]. Addition of IL-10 to WT enteroids was shown to shift the cellular dynamics away from proliferation and towards differentiation [30]. Whether such effects were attributed to epithelial-specific source of IL-10 or other exogenous sources remain undefined. It is noteworthy that our findings of Paneth cell IL-10 and apical IL-10RA are made in the absence of any microbes, implying the events are intrinsic to the epithelium.
Polarity of IECs is critical to epithelial function, with the apical membrane facing the microbes and antigens in the lumen, in contrast to the basal membrane. As a result, the signaling direction across the epithelium is likely key to keeping balance of two seemingly paradoxical tasks: facilitating immune surveillance though antigen-sampling while maintaining immune tolerance. It is therefore reasonable to predict that the same type of receptor on each polar extreme may have different signaling properties linked to different outcomes. We are not the first to report IL-10RA on the apical side of epithelial cells, (although we show it among cells in enteroids), nor are we the precedent showing there may be differences in signaling by the same receptor from opposite sides of an epithelial cell [34,35]. The signaling of IL-10 through STAT3 was addressed on both sides of the epithelium using enteroid monolayers, after we observed that IL-10 did not induce STAT3 phosphorylation in 3D enteroids. We determined that STAT3-dependent signaling of IL-10 is more potent upon stimulation of apical compared to basal receptors in WT enteroid monolayers despite our immunofluorescent data indicating more cells possess basal IL-10RA. We entertain this as evidence of apical versus basal IL-10RA exerting a differential response which presumably differentially impacts Paneth cell physiology. Our finding of greater STAT3 phosphorylation upon apical IL-10R stimulation is congruent with a past study which reported increased STAT3-dependent IL-10 signaling associated with upregulation of apical IL-10R [36]. Interestingly, unlike WT enteroid monolayers, IL-10KO enteroid monolayers showed no significant STAT3 phosphorylation (over background) upon IL-10 addition, regardless of the direction of stimulation, which is compatible with the lack of apical IL-10 receptor in IL-10KO enteroids. It is noteworthy that WT and IL-10KO enteroids possess considerable constitutive pSTAT3, possibly due to other intrinsic STAT3-activators such as IL-6 or IL-15, cytokines reportedly produced by intestinal epithelial cells [3,37]. A limitation in our monolayer STAT signaling experiments was our presumption that differentiated cell type phenotypes were similar to cells in organoids [22].
In addition to Paneth cells, we detected IL-10 receptors on goblet cells. Unlike on Paneth cells where the receptors were expressed on both polls, in goblet cells the receptors were limited to the basal side, suggesting goblet cells are targets for IL-10 from non-epithelial cell sources. While several studies have shown a detrimental impact of IL-10/IL-10R deficiency on goblet cells, it remains elusive whether the impact is directly due to the ablation of IL-10/goblet cell crosstalk or indirectly to changes in immune elements due to the absence of systemic IL-10. One study showed that IL-10 could directly act on goblet cells, mediating protein-folding of MUC2 and endoplasmic reticulum homeostasis [38]. Moreover, recent studies have demonstrated that IL-10 is an important regulator of goblet cell homeostasis via STAT3-independent Notch1 signaling as disruption of IL-10 signaling proved to skew the lineage toward excessive goblet cell numbers while diminishing absorptive lineage [39,40]. Our results indicate that none of these processes are susceptible to apical IL-10 receptors on goblet cells.
Overall, while IL-10 has been shown to play versatile roles in epithelia homeostasis, the detection of apical autocrine activity limited to a single cell type is novel. Additionally, we show differential signaling upon apical versus basal IL-10 stimulation which speaks to a unique role of epithelial derived IL-10 in Paneth cell development as it is non-redundant to exogenous (e.g., basally applied) IL-10. The impact and whether this autocrine loop is critical in vivo remains to be determined.
Supplementary Materials
The following supporting information can be downloaded at the website of this paper posted on Preprints.org, Table S1: Oligonucleotide primer sequences used in qPCR for detecting mouse mRNAs; Table S2: Antibodies used for immunofluorescence; Figure S1: Negative control for IL-10 in IL-10KO enteroids; Figure S2: Confocal fluorescence image of IL-10-expressing cells with apical surface marker (phalloidin); Figure S3: Epifluorescence image of LYZ-positive cells in day-4 enteroids;.
Author Contributions
Conceptualization, Huong Nguyen and Andrew Stadnyk; Formal analysis, Huong Nguyen; Funding acquisition, Andrew Stadnyk; Investigation, Huong Nguyen; Methodology, Huong Nguyen, Francesca Di Cara, Jun Wang and Andrew Stadnyk; Project administration, Andrew Stadnyk; Resources, Jun Wang and Andrew Stadnyk; Supervision, Andrew Stadnyk; Validation, Huong Nguyen and Andrew Stadnyk; Writing—original draft, Huong Nguyen; Writing—review & editing, Huong Nguyen, Francesca Di Cara, Jun Wang and Andrew Stadnyk.
Funding
This research was funded by a grant from the Natural Sciences and Engineering Research Council of Canada to A.W.S.
Institutional Review Board Statement
The animal study protocol was approved by the University Committee on Laboratory Animals, Dalhousie University (protocol #20-012).
Data Availability Statement
Raw data is available on request from the corresponding author.
Conflicts of Interest
The authors declare no conflicts of interest.
References
- Kopp, Z.A.; Jain, U.; Van Limbergen, J.; Stadnyk, A.W. Do antimicrobial peptides and complement collaborate in the intestinal mucosa? Front. Immunol. 2015, 6, 17. [CrossRef]
- Goto, Y. Epithelial cells as a transmitter of signals from commensal bacteria and host immune cells. Front. Immunol. 2019, 10, 2057. [CrossRef]
- Stadnyk, A.W. Intestinal epithelial cells as a source of inflammatory cytokines and chemokines. Can. J. Gastroenterol. 2002, 16, 241–246. [CrossRef]
- Peterson, L.W.; Artis, D. Intestinal epithelial cells: Regulators of barrier function and immune homeostasis. Nat. Rev. Immunol. 2014, 14, 141–153. [CrossRef]
- Engelhardt, K. R.; Shah, N.; Faizura-Yeop, I.; Kocacik Uygun, D. F.; Frede, N.; Muise, A. M.; Shteyer, E.; Filiz, S.; Chee, R.; Elawad, M.; Hartmann, B.; Arkwright, P. D.; Dvorak, C.; Klein, C.; Puck, J. M.; Grimbacher, B.; Glocker, E. O. Clinical outcome in IL-10- and IL-10 receptor-deficient patients with or without hematopoietic stem cell transplantation. J. Allergy Clin. Immunol. 2013, 131, 825–830. [CrossRef]
- Franke, A.; Balschun, T.; Karlsen, T. H.; Sventoraityte, J.; Nikolaus, S.; Mayr, G.; Domingues, F. S.; Albrecht, M.; Nothnagel, M.; Ellinghaus, D.; Sina, C.; Onnie, C. M.; Weersma, R. K.; Stokkers, P. C.; Wijmenga, C.; Gazouli, M.; Strachan, D.; McArdle, W. L.; Vermeire, S.; Rutgeerts, P.; Rosenstiel, P.; Krawczak, M.; Vatn, M.H.; IBSEN study group; Mathew, C.G.; Schreiber, S. Sequence variants in IL10, ARPC2 and multiple other loci contribute to ulcerative colitis susceptibility. Nat. Genet. 2008, 40, 1319–1323. [CrossRef]
- Kühn, R.; Löhler, J.; Rennick, D.; Rajewsky, K.; Müller, W. Interleukin-10-deficient mice develop chronic enterocolitis. Cell 1993 75, 263–274. [CrossRef]
- Fiorentino, D.F.; Bond, M.W.; Mosmann, T.R. Two types of mouse t helper cell: IV. Th2 clones secrete a factor that inhibits cytokine production by Thl clones. J. Exp. Med. 1989, 170, 2081–2095. [CrossRef]
- Morhardt, T. L.; Hayashi, A.; Ochi, T.; Quirós, M.; Kitamoto, S.; Nagao-Kitamoto, H.; Kuffa, P.; Atarashi, K.; Honda, K.; Kao, J. Y.; Nusrat, A.; Kamada, N. IL-10 produced by macrophages regulates epithelial integrity in the small intestine. Sci. Rep. 2019, 9, 1223. [CrossRef]
- Hayashi, A.; Sato, T.; Kamada, N.; Mikami, Y.; Matsuoka, K.; Hisamatsu, T.; Hibi, T.; Roers, A.; Yagita, H.; Ohteki, T.; Yoshimura, A.; Kanai, T. A single strain of Clostridium butyricum induces intestinal IL-10-producing macrophages to suppress acute experimental colitis in mice. Cell Host Microbe 2013, 13, 711–722. [CrossRef]
- Ina, K.; Kusugami, K.; Kawano, Y.; Nishiwaki, T.; Wen, Z.; Musso, A.; West, G. A.; Ohta, M.; Goto, H.; Fiocchi, C. Intestinal fibroblast-derived IL-10 increases survival of mucosal T cells by inhibiting growth factor deprivation- and Fas-mediated apoptosis. J. Immunol. 2005, 175, 2000–2009. [CrossRef]
- Nguyen, H.D.; Aljamaei, H.M.; Stadnyk, A.W. The production and function of endogenous interleukin-10 in intestinal epithelial cells and gut homeostasis. Cell. Mol. Gastroenterol. Hepatol. 2021, 12, 1343–1352. [CrossRef]
- Biton, M.; Haber, A.L.; Rogel, N.; Burgin, G.; Beyaz, S.; Schnell, A.; Ashenberg, O.; Su, C.-W.; Smillie, C.; Shekhar, K.; Chen, Z.; Wu, C.; Ordovas-Montanes, J.; Alvarez, D.; Herbst, R.H.; Zhang, M.; Tirosh, I.; Dionne, D.; Nguyen, L.T.; Xifaras, M.E.; Shalek, A.K.; von Andrian, U.H.; Graham, D.B.; Rozenblatt-Rosen, O.; Shi, H.N.; Kuchroo, V.; Yilmaz, O.H.; Regev, A.; Xavier, R.J. T helper cell cytokines modulate intestinal stem cell renewal and differentiation. Cell 2018, 175, 1307-1320.e22. [CrossRef]
- Berkowitz, L.; Pardo-Roa, C.; Ramírez, G.; Vallejos, O.P.; Sebastián, V. P.; Riedel, C.A.; Álvarez-Lobos, M.; Bueno, S.M. The absence of interleukin 10 affects the morphology, differentiation, granule content and the production of cryptidin-4 in Paneth cells in mice. PLoS One 2019, 14, e0221618. [CrossRef]
- Schwerbrock, N.M.; Makkink, M.K.; van der Sluis, M.; Büller, H.A.; Einerhand, A.W.; Sartor, R.B.; Dekker, J. Interleukin 10-deficient mice exhibit defective colonic Muc2 synthesis before and after induction of colitis by commensal bacteria. Inflamm. Bowel Dis. 2004, 10, 811–823. [CrossRef]
- Sato, T.; Vries, R.G.; Snippert, H.J.; van de Wetering, M.; Barker, N.; Stange, D. E.; van Es, J.H.; Abo, A.; Kujala, P.; Peters, P.J.; Clevers, H. Single Lgr5 stem cells build crypt-villus structures in vitro without a mesenchymal niche. Nature 2009, 459, 262–265. [CrossRef]
- George, M.M.; Rahman, M.; Connors, J.; Stadnyk, A.W. Opinion: Are organoids the end of model evolution for studying host intestinal epithelium/microbe interactions? Microorganisms 2019, 7, 406. [CrossRef]
- Kamanaka, M.; Kim, S.T.; Wan, Y.Y.; Sutterwala, F.S.; Lara-Tejero, M.; Galán, J.E.; Harhaj, E.; Flavell, R.A. Expression of interleukin-10 in intestinal lymphocytes detected by an interleukin-10 reporter knockin tiger mouse. Immunity 2006, 25, 941–952. [CrossRef]
- Moore-Connors, J.M.; Kim, H.S.; Marshall, J.S.; Stadnyk, A.W.; Halperin, S.A.; Wang, J. CD43-, but not CD43+, IL-10-producing CD1dhi CD5+ B cells suppress type 1 immune responses during Chlamydia muridarum genital tract infection. Mucosal Immunol. 2015, 8, 94–106. [CrossRef]
- Wang, F.; Wang, J.; Liu, D.; Su, Y. Normalizing genes for real-time polymerase chain reaction in epithelial and nonepithelial cells of mouse small intestine. Anal. Biochem. 2010, 399, 211–217. [CrossRef]
- O’Rourke, K.; Dow, L.; Lowe, S. Immunofluorescent staining of mouse intestinal stem cells. BIO-PROTOCOL 2016 6, e1732. [CrossRef]
- Altay, G.; Larrañaga, E.; Tosi, S.; Barriga, F.M.; Batlle, E.; Fernández-Majada, V.; Martínez, E. Self-organized intestinal epithelial monolayers in crypt and villus-like domains show effective barrier function. Sci. Rep. 2019, 9, 10140. [CrossRef]
- Haber, A.L.; Biton, M.; Rogel, N.; Herbst, R.H.; Shekhar, K.; Smillie, C.; Burgin, G.; Delorey, T.M.; Howitt, M.R.; Katz, Y.; Tirosh, I.; Beyaz, S.; Dionne, D.; Zhang, M.; Raychowdhury, R.; Garrett, W.S.; Rozenblatt-Rosen, O.; Shi, H.N.; Yilmaz, O.; Xavier, R.J.; Regev, A. A single-cell survey of the small intestinal epithelium. Nature 2017, 551, 333–339 (2017). [CrossRef]
- Tamagawa, Y.; Ishimura, N.; Uno, G.; Yuki, T.; Kazumori, H.; Ishihara, S.; Amano, Y.; Kinoshita, Y. Notch signaling pathway and Cdx2 expression in the development of Barrett’s esophagus. Lab. Investig. 2012, 92, 896–909. [CrossRef]
- Shouval, D.S.; Ouahed, J.; Biswas, A.; Goettel, J.A.; Horwitz, B.H.; Klein, C.; Muise, A.M.; Snapper, S.B. Interleukin 10 receptor signaling: Master regulator of intestinal mucosal homeostasis in mice and humans. Adv. Immunol. 2014, 122, 177–210. [CrossRef]
- Weber-Nordt, R.M.; Riley, J.K.; Greenlund, A.C.; Moore, K.W.; Darnell, J.E.; Schreiber, R.D. Stat3 recruitment by two distinct ligand-induced, tyrosine- phosphorylated docking sites in the interleukin-10 receptor intracellular domain. J. Biol. Chem. 1996, 271, 27954–27961. [CrossRef]
- Lueschow, S.R. McElroy, S.J. The Paneth cell: The curator and defender of the immature small intestine. Front. Immunol. 2020, 11, 587. [CrossRef]
- Inaba, Y.; Ashida, T.; Ito, T.; Ishikawa, C.; Tanabe, H.; Maemoto, A.; Watari, J.; Ayabe, T.; Mizukami, Y.; Fujiya, M.; Kohgo, Y. Expression of the antimicrobial peptide α-defensin/cryptdins in intestinal crypts decreases at the initial phase of intestinal inflammation in a model of inflammatory bowel disease, IL-10-deficient mice. Inflamm. Bowel Dis. 2010, 16, 1488–1495. [CrossRef]
- Xue, Y.; Zhang, H.; Sun, X. Zhu, M.J. Metformin improves ileal epithelial barrier function in interleukin-10 deficient mice. PLoS One 2016, 11, e0168670. [CrossRef]
- Deng, F.; Hu, J.; Yang, X.; Wang, Y.; Lin, Z.; Sun, Q.; Liu, K. Interleukin-10 expands transit-amplifying cells while depleting Lgr5+ stem cells via inhibition of Wnt and notch signaling. Biochem. Biophys. Res. Commun. 2020, 533, 1330–1337. [CrossRef]
- Papoutsopoulou, S.; Pollock, L.; Walker, C.; Tench, W.; Samad, S. S.; Bergey, F.; Lenzi, L.; Sheibani-Tezerji, R.; Rosenstiel, P.; Alam, M. T.; Martins Dos Santos, V.A.P.; Müller, W.; Campbell, B.J. Impact of interleukin 10 deficiency on intestinal epithelium responses to inflammatory signals. Front. Immunol. 2021, 12, 690817. [CrossRef]
- Brischetto, C.; Krieger, K.; Klotz, C.; Krahn, I.; Kunz, S.; Kolesnichenko, M.; Mucka, P.; Heuberger, J.; Scheidereit, C.; Schmidt-Ullrich, R. NF-κB determines Paneth versus goblet cell fate decision in the small intestine. Development 2021, 148, dev199683. [CrossRef]
- Mori-Akiyama, Y.; van den Born, M.; van Es, J.H.; Hamilton, S.R.; Adams, H.P.; Zhang, J.; Clevers, H.; de Crombrugghe, B. SOX9 Is required for the differentiation of Paneth cells in the intestinal epithelium. Gastroenterology 2007, 133, 539–546. [CrossRef]
- Onyiah, J.C.; Colgan, S.P. Cytokine responses and epithelial function in the intestinal mucosa. Cell. Mol. Life Sci. 2016, 73, 4203–4212. [CrossRef]
- Kuwada, S.K.; Lund, K.A.; Li, X. F.; Cliften, P.; Amsler, K.; Opresko, L.K.; Wiley, H.S. Differential signaling and regulation of apical vs. basolateral EGFR in polarized epithelial cells. Am. J. Physiol. 1998, 275, C1419-28. [CrossRef]
- Kominsky, D.J.; Campbell, E.L.; Ehrentraut, S.F.; Wilson, K.E.; Kelly, C.J.; Glover, L.E.; Collins, C.B.; Bayless, A.J.; Saeedi, B.; Dobrinskikh, E.; Bowers, B.E.; MacManus, C.F.; Müller, W.; Colgan, S.P.; Bruder, D. IFN-γ–mediated induction of an apical IL-10 receptor on polarized intestinal epithelia. J. Immunol. 2014, 192, 1267–1276. [CrossRef]
- Mizoguchi, A. Healing of intestinal inflammation by IL-22. Inflamm. Bowel Dis. 2012, 18, 1777–1784. [CrossRef]
- Hasnain, S.Z.; Tauro, S.; Das, I.; Tong, H.; Chen, A.C.; Jeffery, P.L.; McDonald, V.; Florin, T.H.; McGuckin, M.A. IL-10 promotes production of intestinal mucus by suppressing protein misfolding and endoplasmic reticulum stress in goblet cells. Gastroenterology 2023, 144, 357–368. [CrossRef]
- Jenkins, B.R.; Blaseg, N.A.; Grifka-Walk, H.M.; Deuling, B.; Swain, S.D.; Campbell, E.L.; Walk, S.T.; Kominsky, D.J. Loss of interleukin-10 receptor disrupts intestinal epithelial cell proliferation and skews differentiation towards the goblet cell fate. FASEB J. 2021, 35 , e21551. [CrossRef]
- Morales, R.A.; Rabahi, S.; Diaz, O.E.; Salloum, Y.; Kern, B.C.; Westling, M.; Luo, X.; Parigi, S.M.; Monasterio, G.; Das, S.; Hernández, P.P.; Villablanca, E.J. Interleukin-10 regulates goblet cell numbers through Notch signaling in the developing zebrafish intestine. Mucosal Immunol. 2022, 15, 940–951. [CrossRef]
Figure 1.
Evidence of apical autocrine IL-10 activity in enteroids. (A) mRNA for IL-10 and the IL-10RA are detectable in developing and mature mouse enteroids. Levels of IL-10 and IL-10RA transcripts were determined by RT-qPCR and the result normalized to the TBP level for the same culture. Results are the mean ± standard deviation (n = 3-4, *p < 0.05, **p < 0.01, One way ANOVA followed by Tukey’s post hoc test). (B) Representative confocal images of IL-10 detected in day 4 WT enteroids and IL-10-GFP reporter enteroids. Negative controls include no primary IL-10 antibody applied to WT enteroids and no primary GFP antibody applied to IL-10-GFP enteroids. (C) Representative confocal images of IL-10RA detected in day 4 WT enteroids and IL-10KO (KO) enteroids. The negative control is rabbit IgG isotype. (D) Representative confocal images of combined IL-10 and IL-10RA in WT enteroids. All scale bars are 10μm.
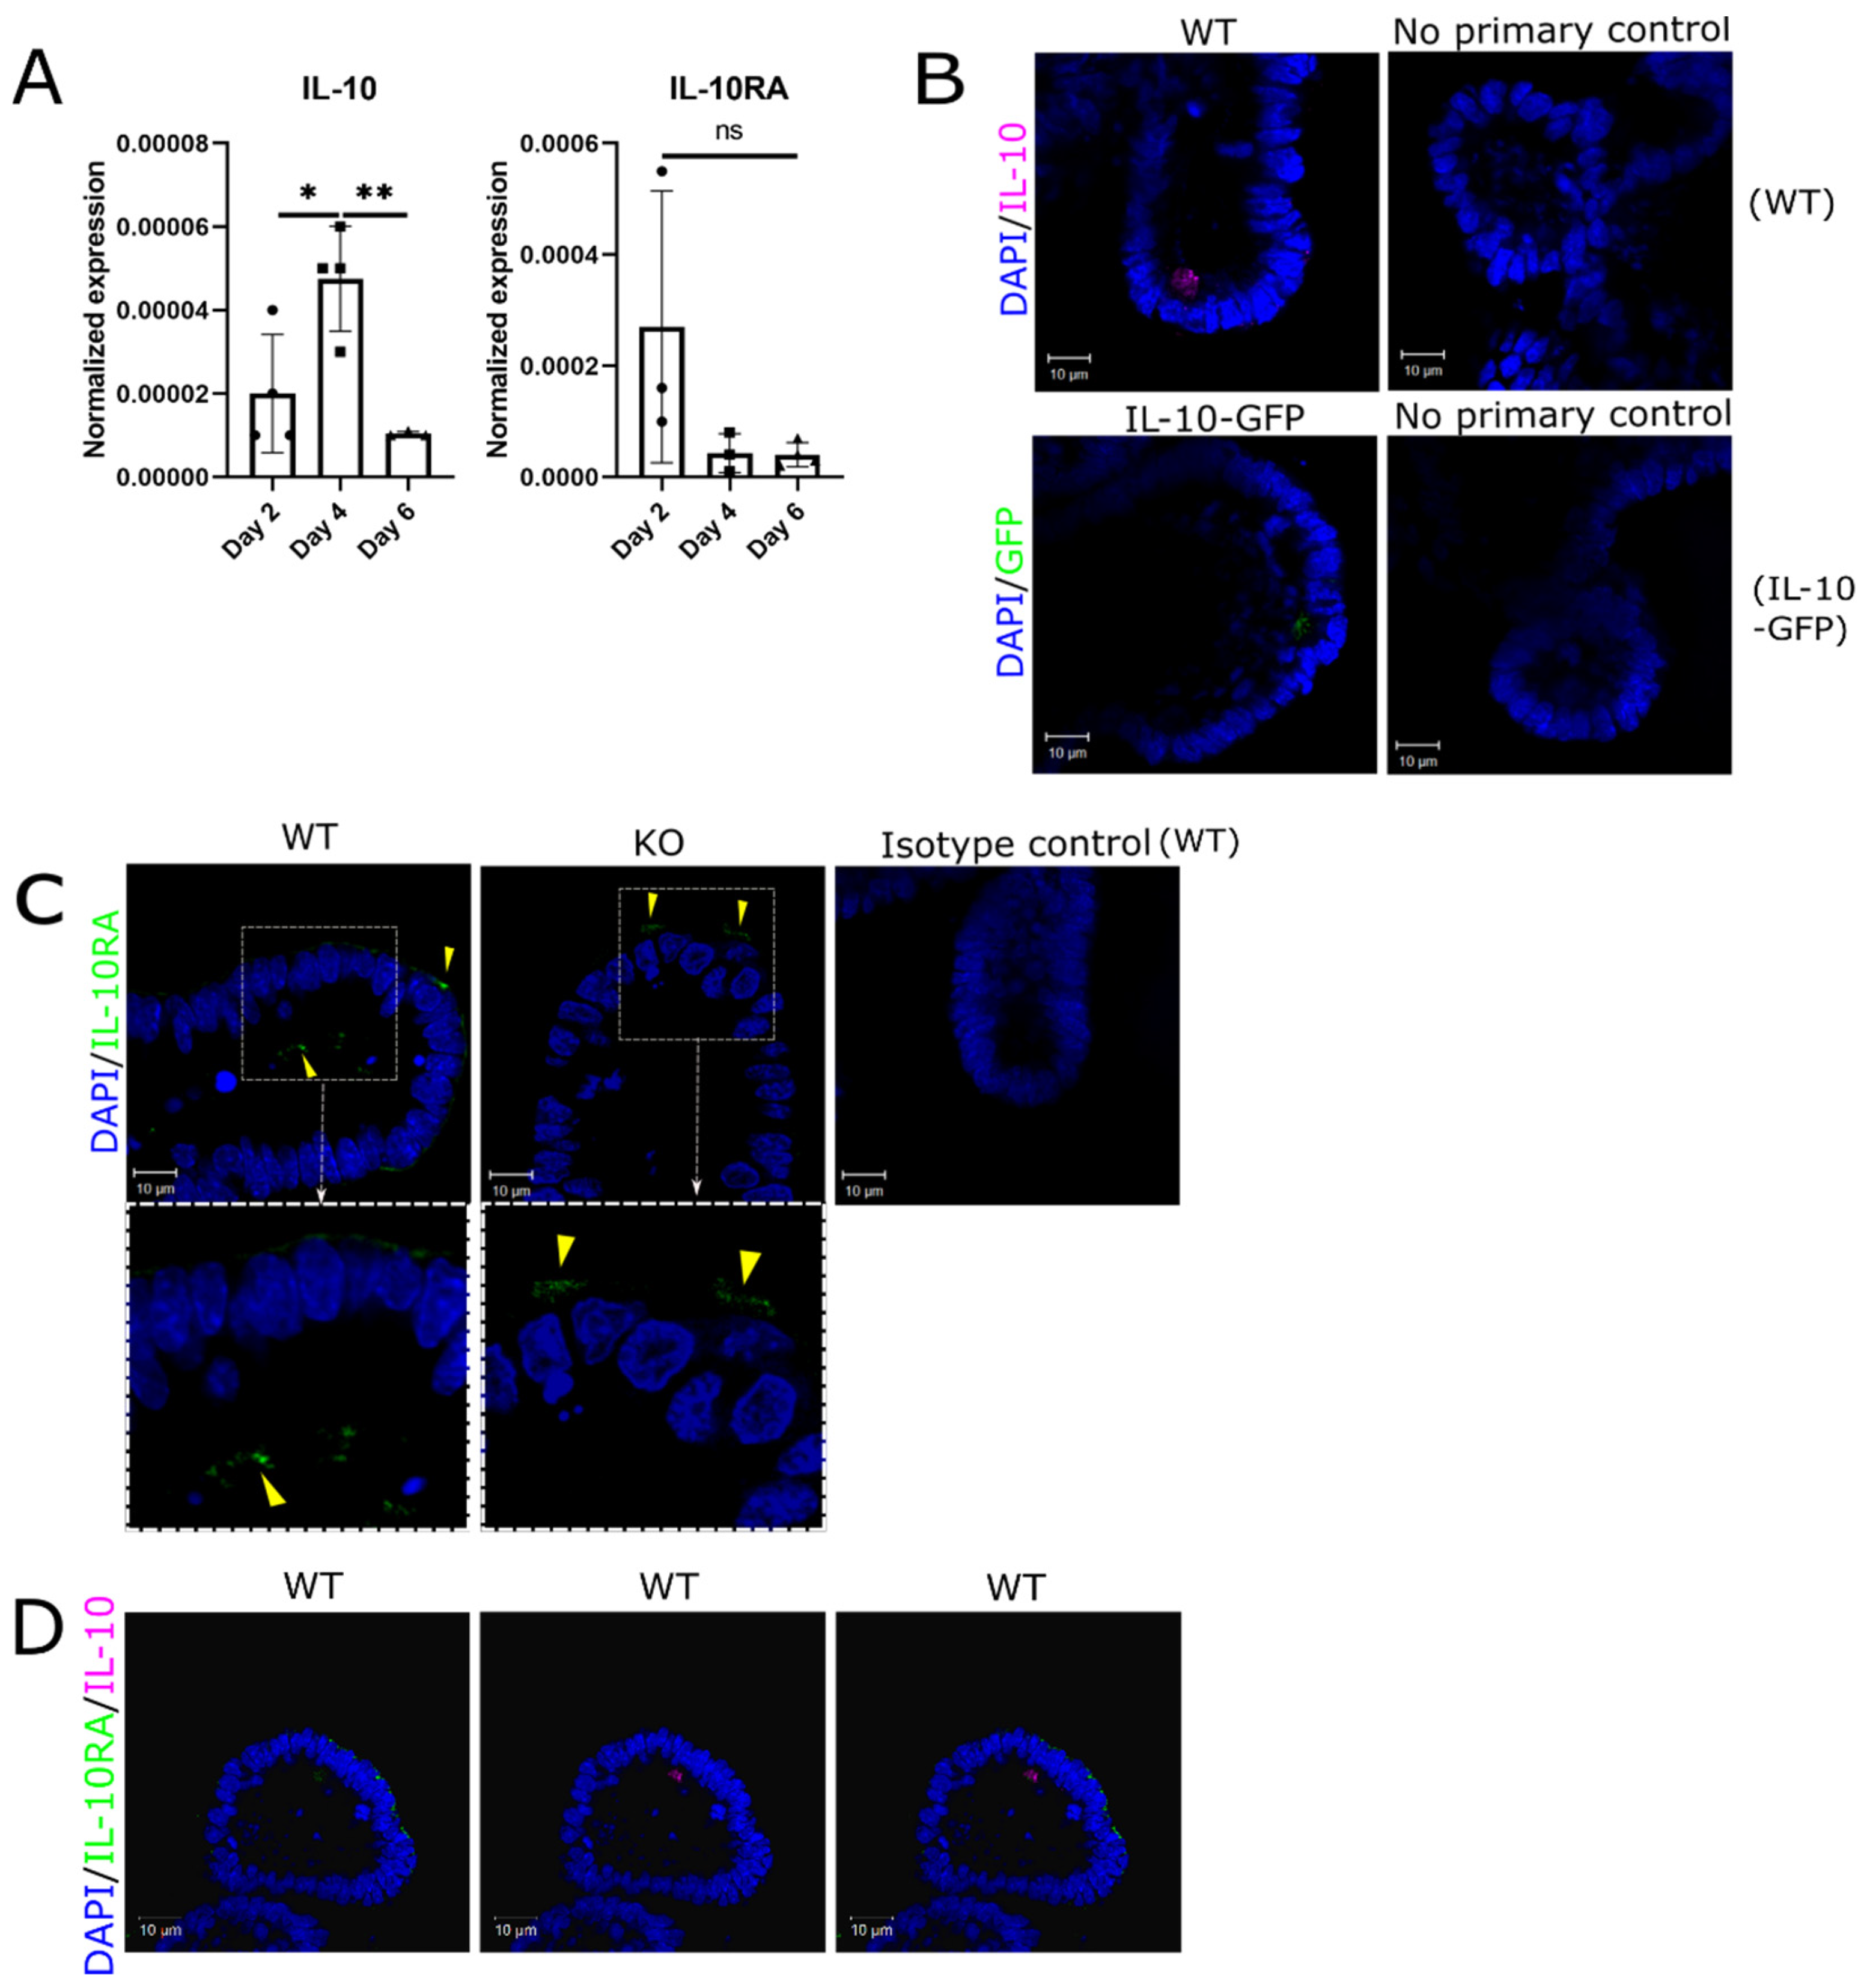
Figure 2.
Autocrine activity of IL-10 in Paneth cells. (A) First row: representative confocal images of IL-10 (pink) and cell specific markers in WT enteroids, including LYZ1 for Paneth cells (red), MUC2 for goblet cells (yellow) and DCLK1 for tuft cells (yellow). Second row: representative confocal images of GFP (pink), and Paneth cell marker LYZ1 (red) in IL-10-GFP reporter enteroids. IL-10-expressing cells are indicated with yellow arrowheads. (B) Representative confocal images show that IL-10 is not detectable in all Paneth cells. The white arrow shows an example of IL-10-negative Paneth cell (pink—IL-10, red—LYZ1, blue—DAPI/nuclei). IL-10-expressing cells are indicated with yellow arrowheads. (C) Representative images of IL-10RA (green), and cell markers in WT enteroids, including LYZ1 for Paneth cells (red), MUC2 for goblet cells (yellow) and DCLK1 for tuft cells (yellow). All enteroid nuclei were stained with DAPI (blue). All scale bars are 10μm.
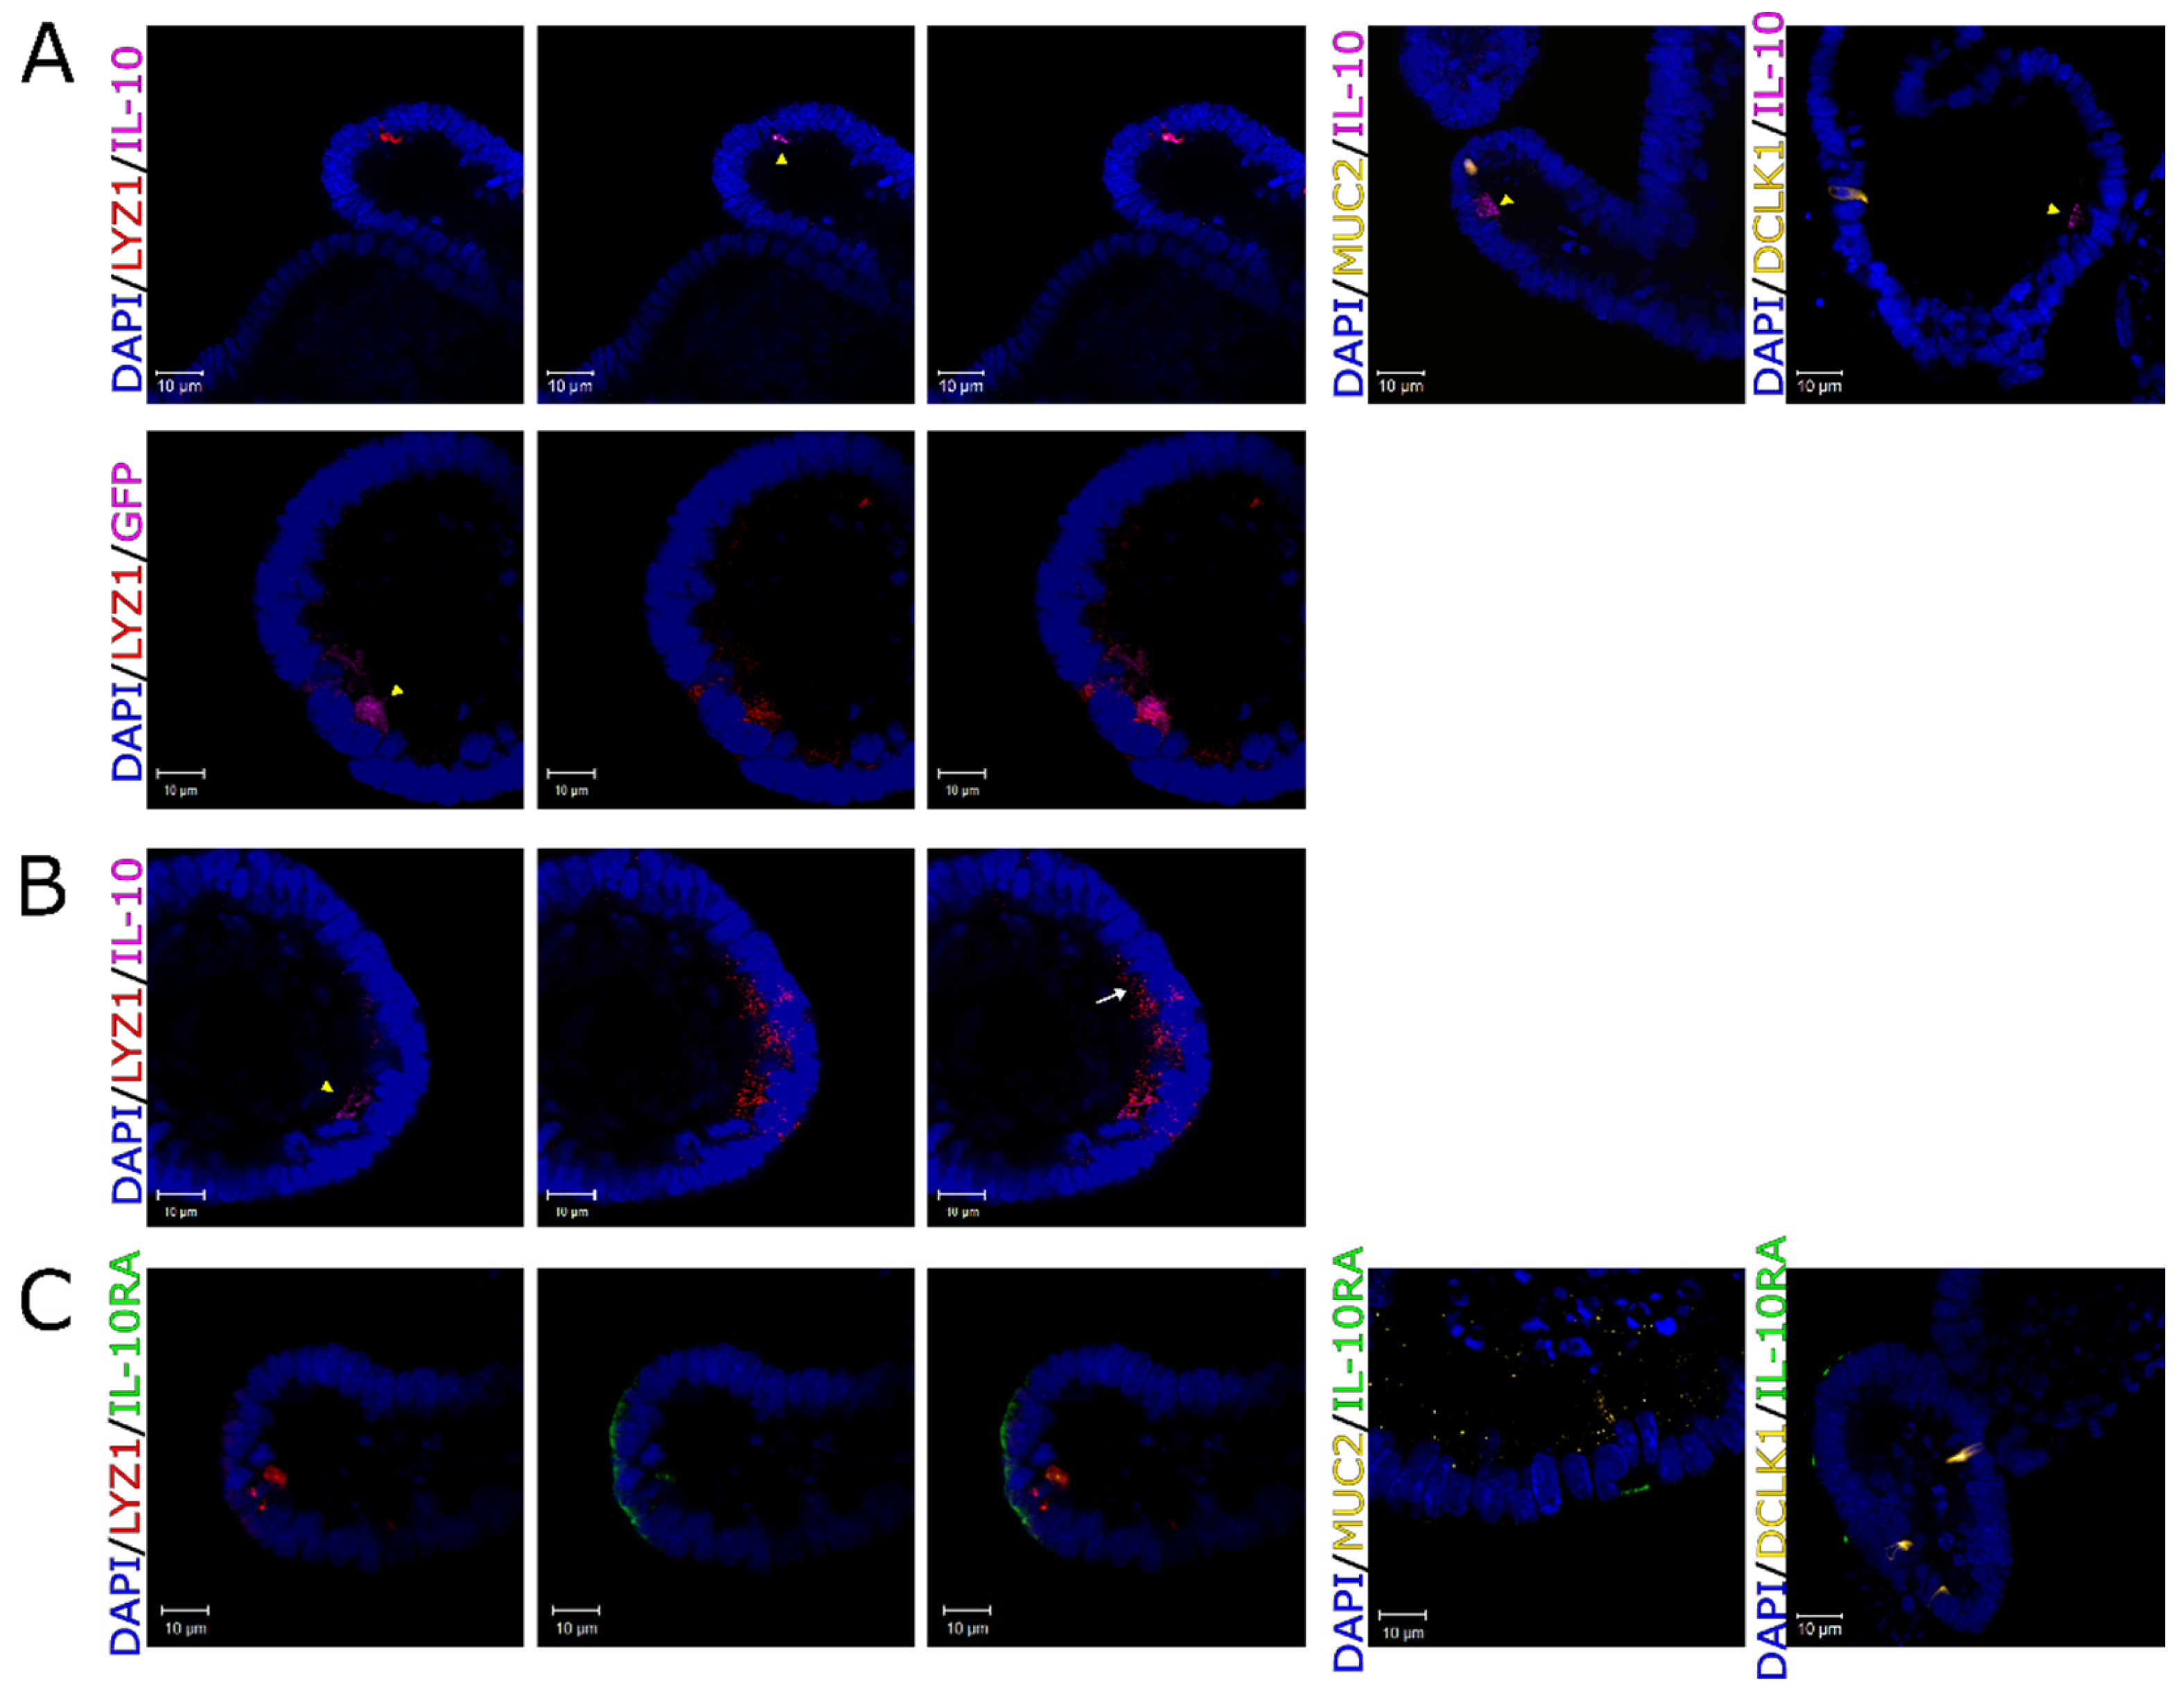
Figure 3.
IL-10KO (KO) enteroids are deficient in Paneth cell markers. (A) RT-qPCR measures of mRNA for Paneth cell markers LYZ1 and DEFA5, and Goblet cell marker MUC2, in day 5 WT enteroids, IL-10KO (KO) enteroids and IL-10-treated IL-10KO (KO+IL-10) enteroids. IL-10KO (KO) enteroids were treated with 20ng/ml IL-10 for 5 days before recovering mRNA and measuring cell-specific markers using RT-qPCR. (B) Relative mRNA expression of cellular lineage markers, HES1 and NOTCH1, positive regulators for absorptive progenitor, and ATOH1, a positive regulator for secretory progenitors. All results were normalized to TBP and displayed as mean ± standard deviation, n = 6-9 (* p < 0.05, ** p< 0.01, *** p < 0.001, ns—not significant, One way ANOVA followed by Tukey’s post hoc test).
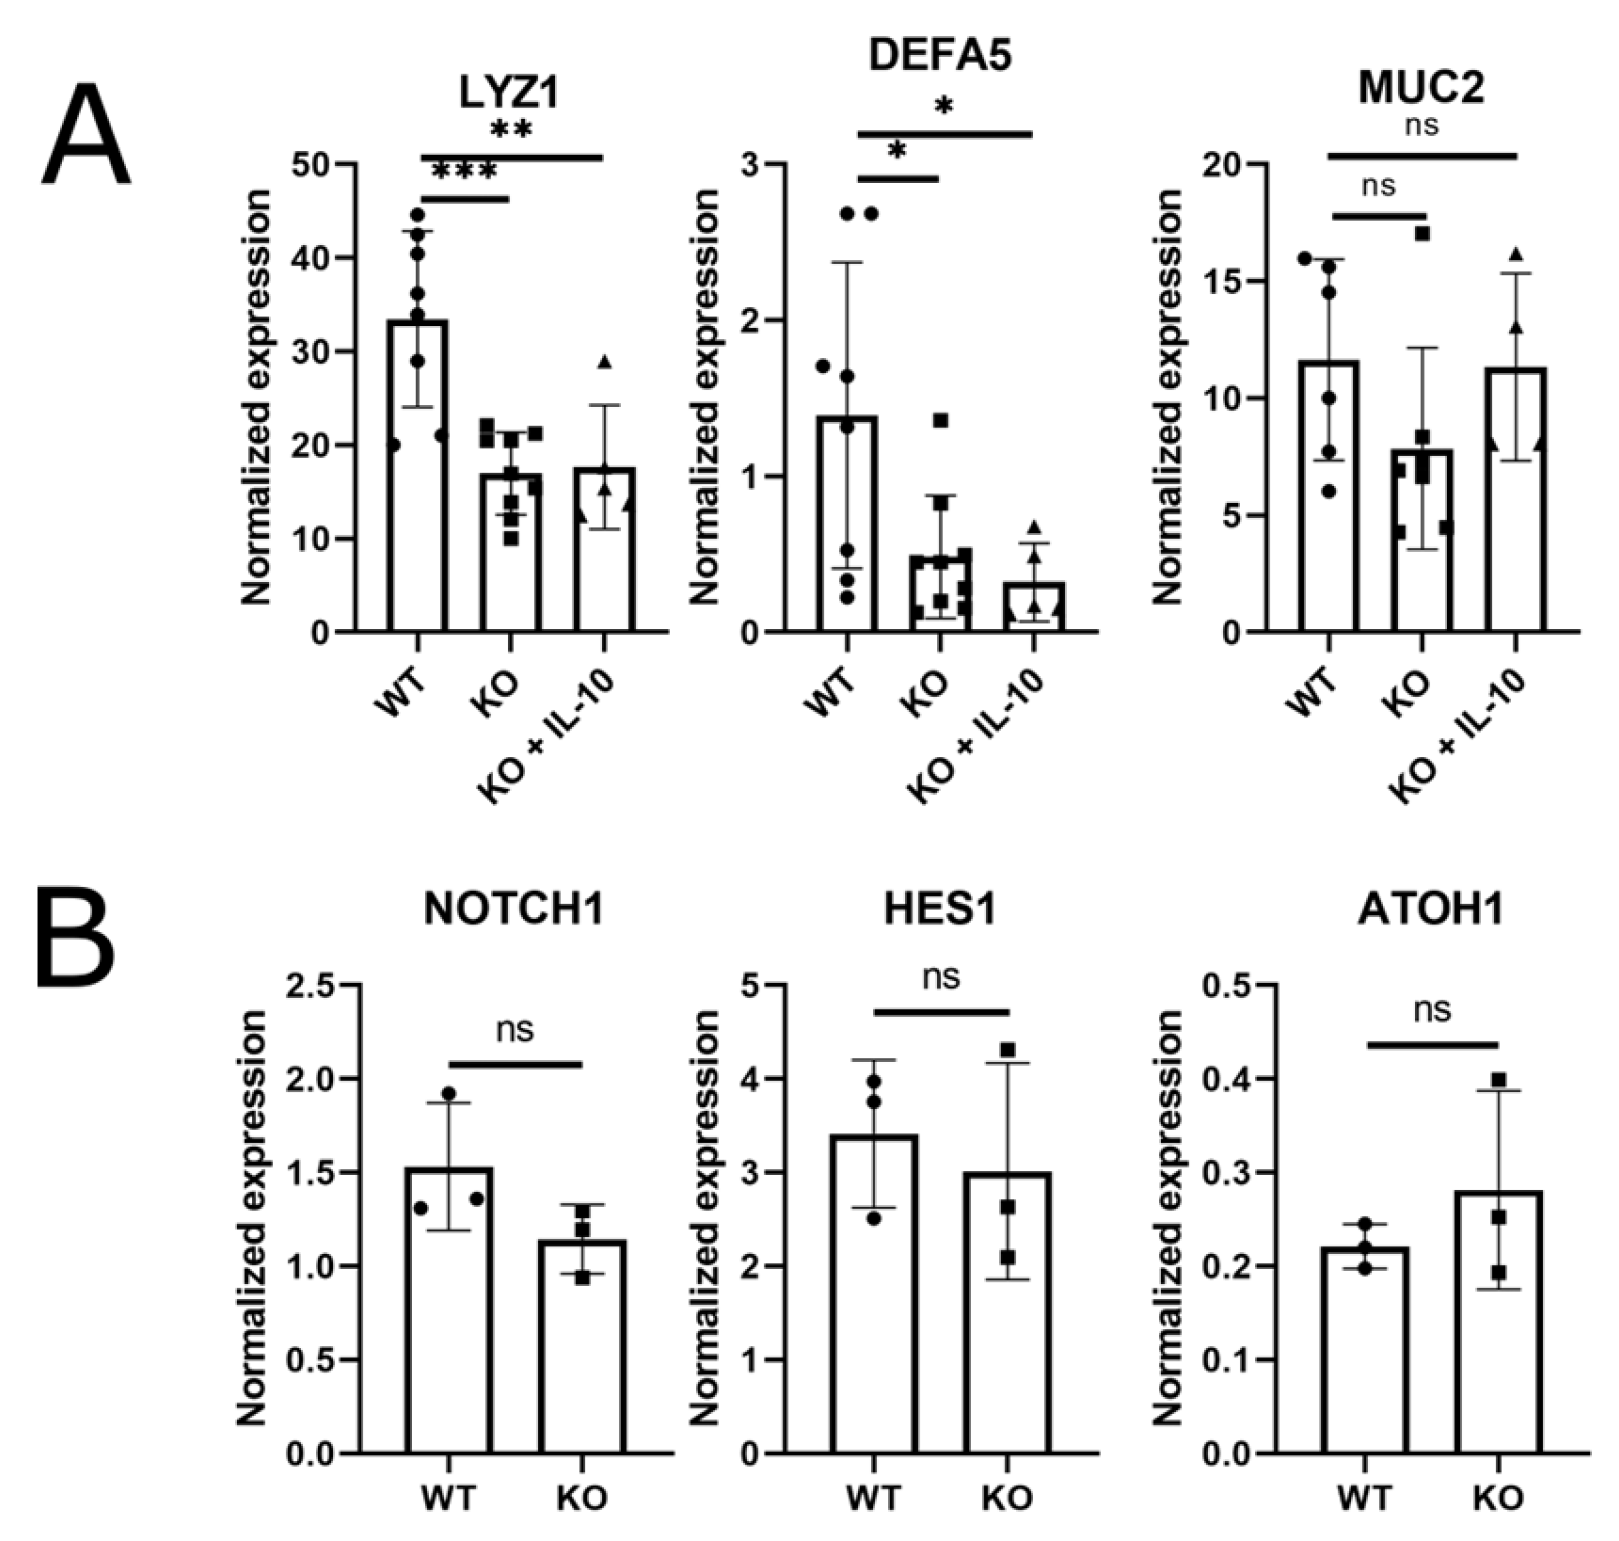
Figure 4.
IL-10 activation of STAT3 in 3D enteroids and 2D monolayers derived from enteroids. (A) WT and IL-10KO (KO) enteroids were assessed for phosphorylated STAT3 (pSTAT3, TYR705) levels by Western blotting, relative to the STAT3 level in the same sample, following IL-10 treatment (100ng/ml for 20 minutes). Fold change in pSTAT3 signal in IL-10-treated enteroids relative to untreated enteroids. The result is shown as mean ± standard deviation (n = 3, ns—not significant, two-tailed t-test). (B) Schema and representative image of 2D enteroid monolayers (red—occludin, white—KI67, blue—nuclei/DAPI). Scale bars are 20μm. Day 20 WT and IL-10KO (KO) enteroid monolayers levels of pSTAT3 relative to STAT3 levels, following IL-10 treatment (100ng/ml for 20 minutes) on either the apical side (top of Transwell® insert) or the basal side (bottom of Transwell® insert) of the monolayers. Fold change in pSTAT3 signal in IL-10-treated monolayers relative to untreated monolayers. The result is shown as mean ± standard deviation (n = 3, * < 0.05, ** < 0.01, ns—not significant, two-way ANOVA followed by Sidak’s post hoc test).
Disclaimer/Publisher’s Note: The statements, opinions and data contained in all publications are solely those of the individual author(s) and contributor(s) and not of MDPI and/or the editor(s). MDPI and/or the editor(s) disclaim responsibility for any injury to people or property resulting from any ideas, methods, instructions or products referred to in the content. |
© 2024 by the authors. Licensee MDPI, Basel, Switzerland. This article is an open access article distributed under the terms and conditions of the Creative Commons Attribution (CC BY) license (http://creativecommons.org/licenses/by/4.0/).
Copyright: This open access article is published under a Creative Commons CC BY 4.0 license, which permit the free download, distribution, and reuse, provided that the author and preprint are cited in any reuse.


