
Submitted:
18 November 2024
Posted:
20 November 2024
You are already at the latest version
Abstract
Decarbonization of energy systems is forcing the development of renewable energy generation and consumption technologies. Photovoltaic systems are used in almost every industrial field, including autonomous power systems. Such systems are used, for example, on ships, space vehicles, or flying platforms. The use of energy generated from renewable sources requires a grid converter. To effectively use clean renewable energy, it is necessary to properly control power. In such a case, the precise synchronization of the converter with the grid becomes a key challenge. When the converter is connected to voltage with constant frequency, the synchronization process does not cause a problem. In the case of connecting the grid inverter to buses with changing voltage frequency, known synchronization algorithms become unsuitable. It has been shown that the use of frequency variation information causes deviations from the unit amplitude of synchronization signals, so a new system was proposed for adapting to variable frequency using a generalized second-order integrator. As a result, synchronization signals of unit amplitude were obtained. With the proposed method, the proportional resonant controller was able to control the active and reactive components of the current even with changes in voltage frequency, by adapting the resonant frequency.
Keywords:
synchronization
; variable frequency
; photovoltaic
; proportional-resonance control
1. Introduction
A stable energy future is the main goal of the research that is being carried out in the field of energy conversion. Decarbonization of power systems is becoming a global effort that requires large-scale implementation of zero-carbon technologies [1], particularly for the generation of renewable energy. Photovoltaic (PV) and wind power plants are now cost competitive with power generation from fossil fuel sources. Interest in low-carbon technologies is gaining momentum and is expanding into larger and larger operating areas. One such area is facilities with autonomous power grids, designed and customized to meet specific energy requirements. Examples include space vehicles or shipboard systems.
In the case of facilities containing autonomous power supply systems, an essential component of power generation is a system of generators, often powered by engines fueled by fossil fuels. Synchronized generator operation is the basis for the stability of the internal grid and the key to preventing unwanted power outages. In the situation of using renewable energy sources, the problem is complicated by the voltage inverters connected to the on-board grid, which are an essential element to integrate it with renewable energy resources. The complication arises from the need for perfect synchronization of power control algorithms with the voltages in the grid, without which maintaining acceptable reliability and efficiency of on-board power systems becomes a difficult, and in some situations impossible, task [2].
The use of power electronic systems, especially grid-connected converters, requires proper synchronization with the frequency and phase of the grid voltage. This is a critical task for the correct operation of synchronous-based controllers, due to their dependence on the accuracy of variable transformation procedures. [3,4,5]. Extensive research into methods of synchronizing grid converters reduces to procedures for minimizing deviations in voltage, phase angle, and frequency between the output of a renewable energy source generator and the grid. [6].
The most popular synchronization schemes for grid-connected inverters are based on phase locked loop (PLL) and extended PLL (EPLL) [7,8,9,10,11,12]. Among the techniques described in the literature, solutions based on Kalman filtering [13,14,15,16] and discrete or recursive Fourier transforms can be found [17,18,19]. These methods are able to provide control algorithms not only with the information necessary for synchronization but also with information regarding harmonics. Thanks to them, it is possible to activate procedures to improve the quality of electricity in the power system. One of the more commonly used methods of synchronization in single-phase systems is also a method based on the use of a generalized second-order integrator (SOGI), which performs harmonic detection and generates the necessary synchronization signals [20,21,22]. With SOGI, synchronization systems characterized by low complexity in relation to methods using Fourier transform or Kalman filters are obtained.
The synchronization methods described in the literature refer to power grids with a fixed voltage frequency. In the case of autonomous on-board grids, the voltages have a wide frequency range reaching up to 800 Hz. In such a situation, the estimation of synchronization signals is a more difficult problem [23] than in the case of typical power grids. This is caused by problems in the accuracy of the calculations that cause a reduction in the dynamic response of the synchronization system in the estimation of voltage parameters. All described synchronization methods are characterized by good performance in estimating voltage parameters only around the equilibrium point [24]. The work [18,25] attempted to estimate the change frequency in a system designed for aircraft, but its main weakness is the high computational load.
Many on-board grids are characterized by the presence of power buses with different voltage parameters. Typical AC subgrids are characterized by different voltage parameters, in particular different voltage frequencies in relation to the objects fed from it. In most cases, the voltage parameters of these buses are fixed and the connection of grid converters that integrate them with renewable energy sources requires the use of known synchronization methods, effectively estimating the voltage parameters around static equilibrium points. A special group is represented by power buses, to which are connected devices that require dynamic changes in the value of voltage amplitude or frequency. An example of such a device can be an ozone generator, which is necessary in water treatment processes. In such a situation, the use of classical synchronizers becomes impossible, because of the wide divergence of the device's operating frequency from the synchronizer's equilibrium point. The main challenge of the work was to develop a new synchronization system which, by modifying to an adaptive form of a generalized second-order integrator, allows efficient synchronization of a grid converter with a widely varying grid frequency. Consequently, this allows precise control of the active and reactive components of the current of the grid without causing emergency shutdowns of the device.
The rest of the paper is organized as follows. Section 2 describes the synchronization problem resulting from linear changes in the frequency and amplitude of the supply voltage. The problem resulting from a voltage having the shape of a chirped signal is analytically demonstrated, and the numerically determined error causing disturbance of the control system's reference signals is presented. A new algorithm for adaptive synchronization and a proportional-resonant control system is described. Section 3 presents test results that confirm the effectiveness of the proposed method. Section 4 concludes the paper by formulating the final conclusions.
2. Materials and Methods
The vast majority of systems in which energy is converted operate at constant operating parameters. If these parameters change over time, these changes usually have time constants that are many times larger than the characteristic time constants of the converter devices. However, there are situations in which the given trajectories of changes in operating parameters are characterized by high dynamics, which cause disturbances in the operation of the converter. One of such devices is an ozone generator, used in the water treatment process. The processes of optimizing energy distribution and consumption on flying platforms, ships, and space vehicles additionally require the use of renewable energy. The study refers to the analysis of the use of solar energy in the ozone production process in the context of the changes in the high dynamics of voltage frequency forcing internal electrical discharges. The system which block diagram is shown in Figure 1 was tested.
The tested system is part of an on-board system developed and reported in publications [26], in which the solar energy conversion subsystem is connected to Bus 2. Bus 2 supplies power to a facility characterized by a high-steep voltage frequency trajectory during the start-up phase. It was assumed that the trajectory of changes in the voltage generator's operating parameters is made independently through the system (GC) controlling the operation of the power generator (PG). In the research conducted, the device start process was assumed by implementing a reference voltage trajectory according to the curves shown in Figure 2.
At the time of starting the device, the generator begins operating with voltage at the maximum frequency fH and amplitude close to zero. By linearly increasing the voltage at a constant frequency, the start-up control process waits for the signal of the beginning of electrical discharges in the device and the production of ozone. When the initiated ozone producing process is detected (t1), the generator starts to reduce the voltage frequency from fH to fL. This reduction occurs linearly and lasts until the moment (t2), defined in the technological process as the stable phase. An example of the Bus 2 voltage waveform of a generator implementing the assumed trajectory of amplitude and frequency changes is shown in Figure 3.
Taking into account the voltage frequency trajectory from Figure 2 (a) and the voltage amplitude trajectory from Figure 2b, the voltage waveform vG on Bus 2 can be described as follows:
where V is the amplitude of the voltage at which sliding discharges take place.
Assuming that the energy needed to generate ozone comes not only from the generator (PG) but also from the photovoltaic panels, a photovoltaic converter is connected to Bus 2 to transmit the converted solar energy. The amount of energy available depends on environmental parameters such as the outdoor temperature T and solar irradiance s, and is a function of the installed power of the PV array. The operating point of photovoltaic panels is determined by the Maximum Power Point Tracker (MPPT) implementing the incremental conductance algorithm [27] based on the current values of the photovoltaic voltage vPV and photovoltaic current iPV. In the proportional integral control algorithm (PI), the fill factor for the switch s in the boost converter is determined. This converter controls the capacitor charge current in the DC link in a way that allows the maximum power point of the PV to be obtained. Increasing or decreasing the current feed into the DC link causes the voltage across Bus 1 to rise or fall, respectively. To counteract this, based on the measured voltage value in Bus 1, another proportional integral regulator (PI2) controls the reference current of the grid converter (Inverter), leading to voltage stabilization in Bus 1.
The value of the current fed by the grid converter into Bus 2 depends on the current energy production of the PV array. Most of the time, the grid inverter is not loaded with nominal power, so it was used to compensate for reactive power in Bus 2. The parameters of the current fed into Bus 2 are determined by the proportional-resonant regulator (P+R), which controls the active and reactive components of the current. This is possible only if the current control algorithm has current information on the orthogonal components of the voltage vG occurring on Bus 2. The function of the orthogonal signal generator is performed by the reference shape signal generator (RSG).
The proportional-resonant control system that controls the current fed Bus 2 is designed to directly control the active and reactive components. The reference value of the active component iar is set to obtain a stable voltage on Bus1 according to formula (2).
where ΔvDC is the voltage deviation on Bus 1, kP is the gain and TC is the integration constant. The reference value of the reactive component irr is arbitrarily determined based on the given level of reactive power compensation on Bus 2. The calculated active and reactive components of the current are used to define the reference waveform for the proportional-resonant algorithm according to formula (3).
where and estimate the cosine and sine components of the voltage on Bus 2, respectively. In the case of ac systems characterized by a constant voltage frequency, the waveforms of the sinusoidal and cosine components of the voltage can be easily calculated using the known structures of quadrature generators based on the integration of the fundamental component obtained from the phase lock loop (PLL) system. In the case of the voltages described by Equation 1, there is a problem related to the calculation of the combination of the trigonometric function and the linear function.
Assuming that in the linear stage of the voltage frequency change, the fundamental component estimation algorithm (implemented in RSG) reconstructs it by directly implementing the trajectory in the form of Equation (4):
where af is the is a directional coefficient that determines the dynamics of frequency changes, the reference signal curve can be written in the form (5):
Formula (5) describes a typical chirp signal in which the frequency increases (for af > 0) or decreases (for af < 0) over time. It is commonly used in spread spectrum systems. In order to analyze the influence of the voltage estimation given by Equation (5) on the control process, its transform should be analyzed. The Fourier transform of the function (5) has the form:
The function (5) can be written as:
then
Due to the fact that the exponents in equation (8) are quadratic functions, the resulting oscillating integrals can be simplified by substituting:
Assuming a stationary point where the phase differential takes a value of zero, the results are obtained:
and
The Fourier transform of a quadratic phase function leads to a result proportional to the Gaussian function in the frequency domain. Based on the symbolic calculations performed in Maple, approximate results were obtained:
and
By substituting (13) and (14) into (8), it can be written:
Assuming a constant value for the steepness of the frequency ramp af, Fourier transform (15) can be simplified to the form:
Formula (16) is in the form of a Gaussian function with a distribution that depends on the rate of change of frequency. Therefore, it can be concluded that a function of the steepness of frequency changes in the interval from t1 to t2, the amplitude of the signal estimate described by equation (5) will change. In this case, the use of a standard PLL will cause the reference waveforms obtained in it to be no longer unit waveforms.
In a further stage of research, the problem arising from equation (16) was analysed in the structure of a generalized second-order integrator, which acts as a quadrature generator for phase synchronization. The equations of the quadrature generator are described by the following equations:
where and are orthogonal signals, v is the input signal and ω=2πf. The Bode plots corresponding to equations (17) and (18) are shown in Figure 4.
Figure 4a shows the Bode plot of the sine function, and Figure 4b the cosine function determined for a fixed frequency ω = 500 Hz. Analyzing the plots, it can be concluded that for a variable frequency, the sinusoidal signal should be disturbed to a small degree relative to the cosine signal. In the case of the chirp signal, occurring in the interval from t1 to t2 of the signal presented in Figure 3, equations (17) and (18) can be written in the form:
The analytical solution of differential equations (19) and (20) is a complex problem, so their numerical simulation was performed. The block structure of the equations that describe the quadrature signal generator based on the second-order generalized integrator with linearly variable frequency is shown in Figure 5.
During the test, it was assumed that the input signal v is in the form of a fixed frequency signal fH = 500 Hz, which at time t1 changes into a chirped signal with a linearly modulated frequency. The linear frequency modulation ends at time t2, when the frequency of the chirped signal reaches fL = 100 Hz. The waveforms of the input signal applied to the generalized second-order integrator and the profile of frequency changes are shown in Figure 6.
To obtain quadrature signals based on the generalized second-order integrator shown in Figure 5 it is necessary to include the frequency value in the signal processing. If the frequency changes, the Bode plots cannot be analyzed due to the fact that frequency is a fixed transmittance parameter. These signals can only be calculated from equations (19) and (20). In the case of a frequency change according to a known profile ω(t), the profile can be inserted into the calculation instead of the fixed parameter. If a frequency variation profile is substituted for a fixed parameter, calculations will be performed to continuously update of its value. Intuitively, it may seem that, as a consequence of this update of frequency values, orthogonal signals should be correctly estimated. In Figure 6, it can be observed that the calculated quadrature signals correctly track the frequency changes, but their amplitudes change as the input signal is reduced. This observation confirms the conclusions formulated for Equations (19) and (20).
Properly estimated quadrature signals should be sinusoidal and have unit amplitude. In the case of the analyzed frequency variation profile, the trajectory resulting from the quadrature signals should always be a circle with a unit radius. Figure 7 shows the trajectories resulting from the calculations of the generalized second-order integrator for a fixed frequency, corresponding to the initial frequency fH and the final frequency fL. Analysis of the obtained trajectories shows the change from circular to elliptical form or vice versa, remaining circular only for the frequency interval consistent with the set parameter. The densities of the paths of the elliptical envelope trajectory indicate at the same time the achievement of a steady state characterized by a non-unit amplitude value and non-orthogonality of the waveforms.
If a known frequency-change profile is substituted in place of a fixed parameter, the resulting trajectories are similar to circular trajectories. Path densities occur in the boundary of a single circle. As a consequence, it can be confirmed that the obtained quadrature waveforms will be correct during the analysed time interval, and the amplitude and phase changes will be transient. This case such the trajectory is shown in Figure 8.
Due to the requirement of unit amplitude for quadrature signals, the approach presented to the implementation of the PLL system will result in errors in the calculation of the active and reactive components of the reference current.
This paper proposes a new quadrature signal generation method based on a generalized second-order integrator. The use of a known frequency variation profile does not give the desired effect of a circular trajectory, so the traditionally used PLL system was replaced by a reference shape signal generation (RSG) system. If the sinusoidal input signal is frequency modulated, then during the period of the signal, a change in the value of the characteristic frequency in the second-order integrator will always result in a deformation of the signal from the desired shape. In order to achieve the condition of unit amplitude with the correct phase shift, a method of synchronous latching of the current frequency value was used. Using this approach, where the current frequency value is latched for a time corresponding to the period of the input signal, will make the calculation of quadrature signals take place with a quasi-stationary parameter corresponding to the characteristic frequency of the second-order integrator.
A flow chart of the proposed characteristic-frequency referencing system is shown in Figure 9.
The proposed solution to the problem of changing the fixed transmittance parameter of the reference signal was based on a single-flag system. Systems based on flags are classic synchronization mechanisms used in concurrent programming. Their primary goal is to manage access to shared resources among multiple threads to prevent conflicts and ensure correct cooperation. The assumed binary flag (FlagA) is set when the frequency change trajectory (x) is changed. At this point, the timer is reset; after that the interval is measured, which is derived from the latched period value resulting from the set trajectory of frequency changes. The timer used measures time with a resolution resulting from the set interval ΔT. After measuring the current value of the reference waveform, the frequency value is updated, and the new value is read from the set trajectory (x). For the algorithm shown in Figure 9 to work properly, the time relations associated with the calculations performed must be met. These relations are shown in Figure 10.
Taking into account the proposed frequency change adaptation system explained in Figure 10, the RSG system can be depicted as in Figure 11. In the shown system, a pre-set frequency change trajectory is input to the quadrature signal generator via an adaptive zero-order hold block (AZOH). AZOH samples the input trajectory x with varying frequency and holds the sampled value until the next synchronization cycle. The set frequency trajectory is marked in Figure 11 as the red x waveform and the resulting frequency is marked blue as the f waveform.
Taking into account the quadrature signals obtained from the proposed system, the waveform of the signal modulating the operation of the inverter switches was calculated using the proportional-resonant control algorithm. A diagram of the complete control system is shown in Figure 12.
The control system of the grid inverter consists of three main structures to control the current with respect to a linearly varying frequency. A proportional-integral controller (PI2), which calculates the reference value of the ac component of the inverter current (iar), is directly responsible for maintaining a constant voltage on Bus 1 (vDC). According to Equation (3), the reference current of the inverter is determined, taking into account its reactive component (irr). The reactive component is set by the higher-level system. The reference waveform of the inverter current is controlled in the proposed controller (P+R), with its output (y) fed to the inverter modulator. In typical applications of proportional-resonant controllers, its settings depend on the resonant frequency, which corresponds to the frequency of the generated waveforms in the inverter. When the frequency changes, the proposed controller automatically adjusts as a function of f. This function is calculated in the RSG structure. The RSG consists of a generalized second-order integrator (SOGI), which is described by equations (16) and (17); an adaptive block (AZOH), which operates according to the diagram shown in Figure 9; and a frequency trajectory generator (GT). GT is a structure to generate trajectories based on the status of the O3 signal, as shown in Figure 2. This trajectory is used in the adaptive tuning process of the controller and SOGI system and is involved in the control of the main generator through the control system (GC). The operation of the GC system is a separate issue and will not be discussed in this article.
3. Results
The grid inverter control system structure proposed in this article to support a power system based on a variable frequency voltage generator was described in the hardware description language (HDL), which implemented it in a control board containing a reconfigurable FPGA type EP2C20F487 logic chip. By using the capabilities of the HDL language, the developed structure was capable of running as independent instances that executed concurrently.
The tests carried out focused mainly on demonstrating the effects of the changes made to the structure of the synchronization system and on showing the impact of the proposed adaptive mechanism on the entire on-board subsystem. The tests used the debugging and visualization tools built into the FPGA chip's operating environment for on-chip signals, which communicated with the host system through a JTAG interface. The inverter were carried out on a test bench, shown in Figure 13.
The converter control system from Figure 12 was tuned according to the settings summarized in Table 1.
3.1. RSG Test
Tests of the RSG system were carried out to validate the proposed adaptation of a synchronizer based on a generalized second-order integrator operating at changing frequency. Figure 6 shows that the knowledge of changing frequency trajectory alone is not sufficient for the SOGI system to correctly reproduce orthogonal unit signals. After the implementation of the AZOH system, the trajectory shown in Figure 14 was obtained.
Comparing for the same conditions the obtained trajectory of quadrature signals including AZOH (Figure 14) with the trajectory obtained for SOGI without the frequency trajectory adaptive system (Figure 8), it can be concluded that the obtained signals are unitary sinusoidal signals and they are orthogonal. During the full profile of frequency changes, the trajectory for AZOH maintains a circular profile that generates overlapping paths. The minor variations are due to computational errors and are of marginal significance.
The tests were carried out in case of a linear frequency change from 500 to 100 Hz over a duration of 100 milliseconds.
3.2. Tests for Different Dynamics of Frequency Changes
Analysis of the performance of the proposed system to adapt the synchronization system to changing frequency leads to the conclusion that the quality of quadrature signal estimation can be affected by the slowness of the linear frequency change. To experimentally confirm this statement, tests of the synchronization system were designed, during which the frequency change was changed from 500 to 100 Hz. For comparison purposes, the maximum deviation of the quadrature signal from the singular value was measured for the generalized second-order integrator with the introduced frequency profile and with the AZOH system.
The first test was carried out for a linear frequency change over 280 milliseconds. The results are shown in Figure 15.
An analysis of Figure 15 shows that the largest change in the amplitude of the 0.1 amplitude quadrature signals occurs at the time of the frequency change. As can be easily deduced, this is the result of the start of the AZOH process at the time of the appearance of a nonzero value of the derivative of the frequency change. The SOGI system at a frequency change of 280 milliseconds correctly generates quadrature signals, both when the frequency change profile is entered directly (Figure 15a) and when the AZOH system was applied (Figure 15b).
Another test was performed for a frequency change of 140 milliseconds. The recorded amplitudes of the quadrature signals are shown in Figure 16.
It can be seen in Figure 16 that reducing the duration of the linear frequency change by half does not affect the operation of the RSG with AZOH. Waveforms in Figure 15b and Figure 16b are the same. When AZOH is not used in the SOGI system (Figure 16a), changes in the amplitude of the quadrature signals that reach 0.85 Vmax appear. Also, it should be noted that the amplitude changes continue for the entire duration of the frequency reduction.
The last recorded case refers to the frequency changes duration of 30 milliseconds. The results obtained for such frequency reduction conditions are shown in Figure 17.
The analysis of Figure 17 confirms the effectiveness of the AZOH system even for extremely dynamic frequency variation profiles. The behaviour of the RSG system with AZOH confirms the effectiveness of the system's operation. In the absence of an adaptation mechanism, for frequency changes lasting 30 milliseconds, the synchronization system reduces the amplitudes of the quadrature signals by close to 50%. In such a situation, it should be assumed that the control system will not be able to properly control the active and reactive components, which can consequently lead to emergency conditions.
Summarizing the studies performed relating to the influence of the dynamics of frequency profile changes, it was deduced that for slow frequency changes sustained for more than 280 milliseconds, the system with and without AZOH gives similar results. The deviations of the quadrature signals from unity are due to the amplitude characteristics of the generalized second-order integrator and the frequency reduction time. The dependence of the percentage change in the amplitude of the quadrature signal on the steepness that describes the linear frequency reduction is shown in Figure 18. When AZOH is used, the maximum value of the percentage reduction in amplitude is 10%, and it occurs only in one period. In the remaining duration of frequency changes, the reduction in amplitude is negligibly small.
3.2. Tests of the Power System
The control system shown on Figure 12, implemented in a control board with an FPGA, was tested on a test bench with a grid inverter. Tests were carried out on the effect of the proposed RSG on the precision of reconstructing the reference values of the active and reactive components of the grid current in the set trajectories of changes in the amplitude and frequency of the voltage at bus 2. The tests carried out concern two cases:
1. the set active component with zero reactive component;
2. the set active component equal to the reactive component (phase angle of 45 degree).
Figure 19 shows the waveform of the grid inverter current and voltage registered on bus 2 with non-zero set active component and a zero reactive component. From the analysis of the results, it can be seen that in all start-up states, including voltage rise at constant frequency, linear frequency reduction and steady state, the current waveforms are in phase with the voltage waveform.
Figure 20 shows the current and voltage waveforms recorded for a given inverter current that contains active and reactive components with the same values. Consequently, the current flowing from the photovoltaic system into bus 2 should have a phase shift of 45 degrees.
The power circuit confirmed the effectiveness of the proposed adaptive synchronization method implementing the AZOH algorithm in the RSG. In addition, information about the change in the frequency of the voltage on bus 2 was used in the control of controlling the output current of the grid inverter. Consequently, the possibility of regulating the active and reactive components of the inverter current was also obtained in states of dynamically changing voltage frequency.
4. Conclusions
This paper has proposed a single-phase converter system connected to an on-board bus with a changing voltage frequency. During dynamic voltage frequency variation, standard synchronizers based on generalized second-order integrators cannot maintain unit amplitudes of quadrature signals, which are necessary for accurate control of active and reactive power. By implementing the proposed adaptive procedure, unitary synchronization signals with a known frequency variation profile are obtained while adapting the resonant frequencies of the grid current controller. Analytically, it is shown that the dynamics of voltage frequency changes has a key effect on the accuracy of quadrature signal estimation. In the proposed method, the rate of change does not play a significant role in the estimation of synchronization signals, making it possible to control active and reactive power even at high dynamics and with a wide range of voltage frequency changes.
Author Contributions
Conceptualization, T.B.; methodology, T.B.; software, T.B.; validation, T.B., L.B. and D.M.; formal analysis, T.B.; investigation, T.B, L.B.; resources, T.B, D.M. and P.P; data curation, T.B., L.B., D.M. and P.P.; writing—original draft preparation, T.B..; writing—review and editing, T.B. and P.P; visualization, T.B. and L.B.; supervision, T.B.; project administration, T.B.; funding acquisition, T.B. All authors have read and agreed to the published version of the manuscript.
Funding
This research and the APC were funded by the Minister of Education and Science of the Republic of Poland “Maintain the research potential of the discipline of automation, electronics and electrical engineering”, grant number: PB22.EE.24.001.
Institutional Review Board Statement
Not applicable.
Informed Consent Statement
Not applicable.
Data Availability Statement
Data are contained within the article.
Acknowledgments
The research was carried out at the Department of Electric Power Engineering, Faculty of Electrical Engineering and Informatics, Technical University of Kosice, in relation to a research internship. The authors thank the management of the department for providing research workstations.
Conflicts of Interest
The authors declare no conflicts of interest.
References
- Luke, M.; Thernstrom, J. J. Deep decarbonization of the electric power sector: Insights from recent literature. Environmental Science, Engineering, 2017.
- Rohten, J.; Espinoza, J.; Villarroel, F.; Perez, M.; Munoz, J.; Melin, P.; Espinoza, E. Static power converter synchronization and control under varying frequency conditions, In Proceedings of the IECON 2012 - 38th Annual Conference on IEEE Industrial Electronics Society, Montreal, QC, Canada, 2012, pp. 786-791. [CrossRef]
- Sajadi, A.; Kenyon, R.W.; Hodge, B. M. Synchronization in electric power networks with inherent heterogeneity up to 100% inverter-based renewable generation. Nature Communication, 2022, 13, 2490. [CrossRef]
- Kenyon, R. W.; Bossart, M.; Marković, M.; Doubleday, K.; Matsuda-Dunn, M.; Mitova, S.; Julien, S. A.; Hale, E. T.; Hodge, B. Stability and control of power systems with high penetrations of inverter-based resources: An accessible review of current knowledge and open questions, Solar Energy, 2020, Volume 210, pages 149-168. [CrossRef]
- Kenyon, R. W.; Sajadi, A.; Bossart, M.; Hoke, A.; Hodge, B. M. Interactive Power to Frequency Dynamics Between Grid-Forming Inverters and Synchronous Generators in Power Electronics-Dominated Power Systems. IEEE Systems Journal, 2023, vol. 17, no. 3, pp. 3456-3467. [CrossRef]
- Cho, C.; Jeon, J. H.; Kim, J. Y.; Kwon, S.; Park, K.; Kim, S. Active Synchronizing Control of a Microgrid. IEEE Transactions on Power Electronics, 2011, vol. 26, no. 12, pp. 3707-3719. [CrossRef]
- Kaura, V.; Blasko, V. Operation of a phase locked loop system under distorted utility conditions. IEEE Transactions on Industry Applications, 1997, vol. 33, no. 1, pp. 58-63.
- Shinnaka, S. A. Robust Single-Phase PLL System With Stable and Fast Tracking. Transactions on Industry Applications, 2008, vol. 44, no. 2, pp. 624-633. [CrossRef]
- Salamah, A.M.; Finney, S.J.; Williams, B.W. Three-phase phase-lock loop for distorted utilities. IET Electric Power Applications, 2007, Volume 1, Issue 6. doi.org/10.1049/iet-epa:20070036.
- Timbus, A.V.; Teodorescu, R.; Blaabjerg, F.; Liserre, M.; Dell’Aquila, A. Independent Synchronization and Control of Three Phase Grid Converters. In Proceedings of International Symposium on Power Electronics, Electrical Drives, Automation and Motion-SPEEDAM 2006, pp. 1246 - 1251.
- Robles, E.; Ceballos, S.; Pou, J.; Martín, J. L.; Zaragoza, J.; Ibañez, P. Variable-Frequency Grid-Sequence Detector Based on a Quasi-Ideal Low-Pass Filter Stage and a Phase-Locked Loop. IEEE Transactions on Power Electronics, 2010, vol. 25, no. 10, pp. 2552-2563. [CrossRef]
- Chung, S. Phase-locked loop for grid-connected three-phase power conversion systems. IEE Proc-Electr. Power Appl., 2000 , vol. 147, no. 3, pp. 213-219.
- Moreno, V. M.; Liserre, M.; Pigazo, A.; Dell'Aquila, A. A. Comparative Analysis of Real-Time Algorithms for Power Signal Decomposition in Multiple Synchronous Reference Frames. IEEE Transactions on Power Electronics, 2007, vol. 22, no. 4, pp. 1280-1289. [CrossRef]
- Huang, C. H.; Lee, C. H.; Shih, K. J.; Wang, Y. J. Frequency Estimation of Distorted Power System Signals Using a Robust Algorithm. IEEE Transactions on Power Delivery, 2008, vol. 23, no. 1, pp. 41-51. [CrossRef]
- Agha Zadeh, R.; Ghosh, A.; Ledwich, G. Combination of Kalman Filter and Least-Error Square Techniques in Power System. IEEE Transactions on Power Delivery, 2010, vol. 25, no. 4, pp. 2868-2880. [CrossRef]
- Dash, P. K.; Pradhan, A. K.; Panda, G. Frequency estimation of distorted power system signals using extended complex Kalman filter. IEEE Transactions on Power Delivery, 1999, vol. 14, no. 3, pp. 761-766. [CrossRef]
- Hart, D.; Novosel, D.; Hu, Y.; Smith, B.; Egolf, M. A new frequency tracking and phasor estimation algorithm for generator protection. IEEE Transactions on Power Delivery, 1997, vol. 12, no. 3, pp. 1064-1073. [CrossRef]
- Lavopa, E.; Zanchetta, P.; Sumner, M.; Cupertino, F. Real-Time Estimation of Fundamental Frequency and Harmonics for Active Shunt Power Filters in Aircraft Electrical Systems. IEEE Transactions on Industrial Electronics, 2009, vol. 56, no. 8, pp. 2875-2884. [CrossRef]
- Kang, S. H.; Lee, D. G.; Nam, S. R.; Crossley, P. A.; Kang, Y. C. Fourier transform-based modified phasor estimation method immune to the effect of the DC offsets. In Proceedings of the 2009 IEEE Power & Energy Society General Meeting, Calgary, AB, Canada, 2009, pp. 1-1. [CrossRef]
- Prakash, S.; Singh, J. K.; Behera, R. L.; Mondal, A. Comprehensive Analysis of SOGI-PLL Based Algorithms for Single-Phase System. In Proceedings of 2019 National Power Electronics Conference (NPEC), Tiruchirappalli, India, 2019, pp. 1-6. [CrossRef]
- Kalkoul, S.; Benalla, H.; Nabti, K.; Reama, A. Comparison Among Single-phase PLLs Based on SOGI. In Proceedings of the 2020 6th International Conference on Electric Power and Energy Conversion Systems (EPECS), Istanbul, Turkey, 2020, pp. 118-122. [CrossRef]
- Stojic, D.; Tarczewski, T.; Niewiara, L.J.; Grzesiak, L.M. Improved Fixed-Frequency SOGI Based Single-Phase PLL. Energies 2022, 15, 7297. [CrossRef]
- Fan, M.; Dai, Z.; Yang, Y.; Xie, M.; Zhao, P.; Zhang, J. Fast grid synchronization method for variable-frequency AC systems. International Journal of Electrical Power & Energy Systems, 2020, Volume 120. [CrossRef]
- Teodorescu R.; Liserre M.; Rodriguez P. Grid Converters for Photovoltaic and Wind Power Systems. Wiley; 2011.
- Dai, Z.; Qiu, Y.; Li, J.; Zhang, C. Global asymptotic estimation of grid voltage parameters for variable frequency AC systems. In Proceedings of the IECON 2017 - 43rd Annual Conference of the IEEE Industrial Electronics Society, Beijing, China, 2017, pp. 4155-4159. [CrossRef]
- Binkowski, T.; Nowak, M.; Piróg, S. Power Supply and Reactive Power Compensation of a Single-Phase Higher Frequency On-Board Grid with Photovoltaic Inverter. Energies, 2022, 15, 2563. [CrossRef]
- Feroz Mirza, A.; Mansoor, M.; Ling, Q.; Khan, M.I.; Aldossary, O.M. Advanced Variable Step Size Incremental Conductance MPPT for a Standalone PV System Utilizing a GA-Tuned PID Controller. Energies, 2020, 13, 4153. [CrossRef]
Figure 1.
Block diagram of a photovoltaic converter system connected to an alternating-current voltage bus with varying frequency.
Figure 1.
Block diagram of a photovoltaic converter system connected to an alternating-current voltage bus with varying frequency.
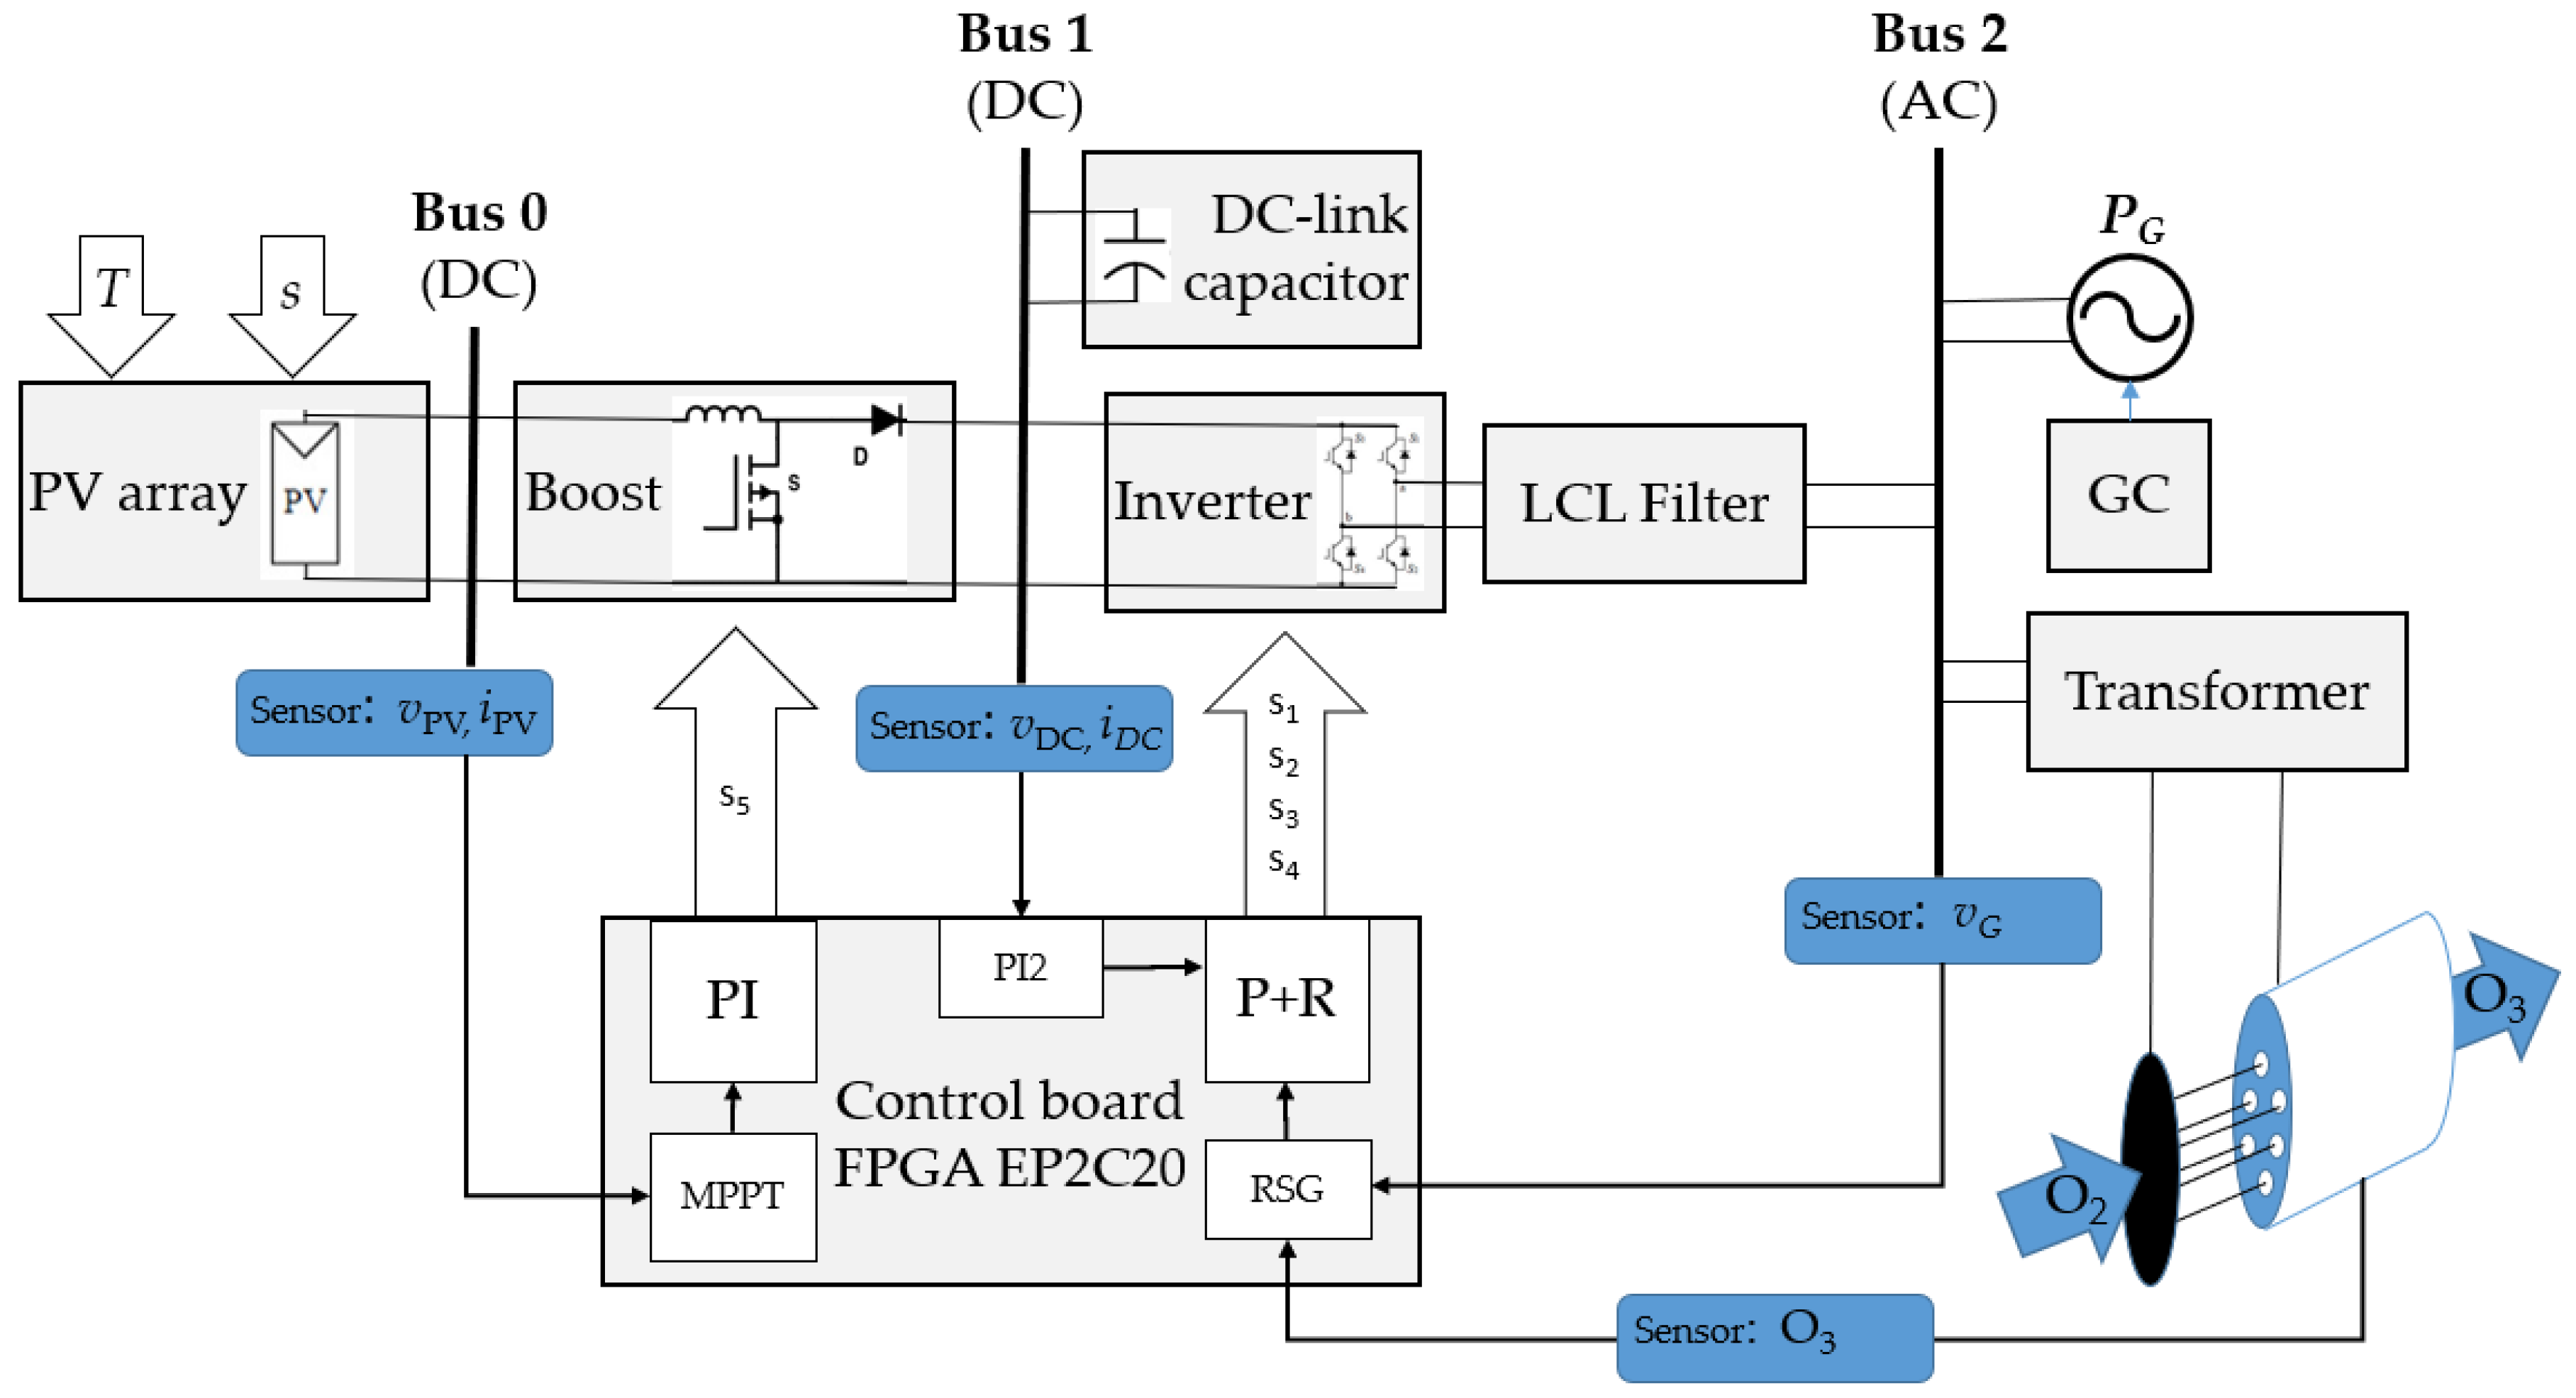
Figure 2.
Trajectories of changes in frequency (a) and amplitude (b) of voltage at the point of connection of the grid converter.
Figure 2.
Trajectories of changes in frequency (a) and amplitude (b) of voltage at the point of connection of the grid converter.
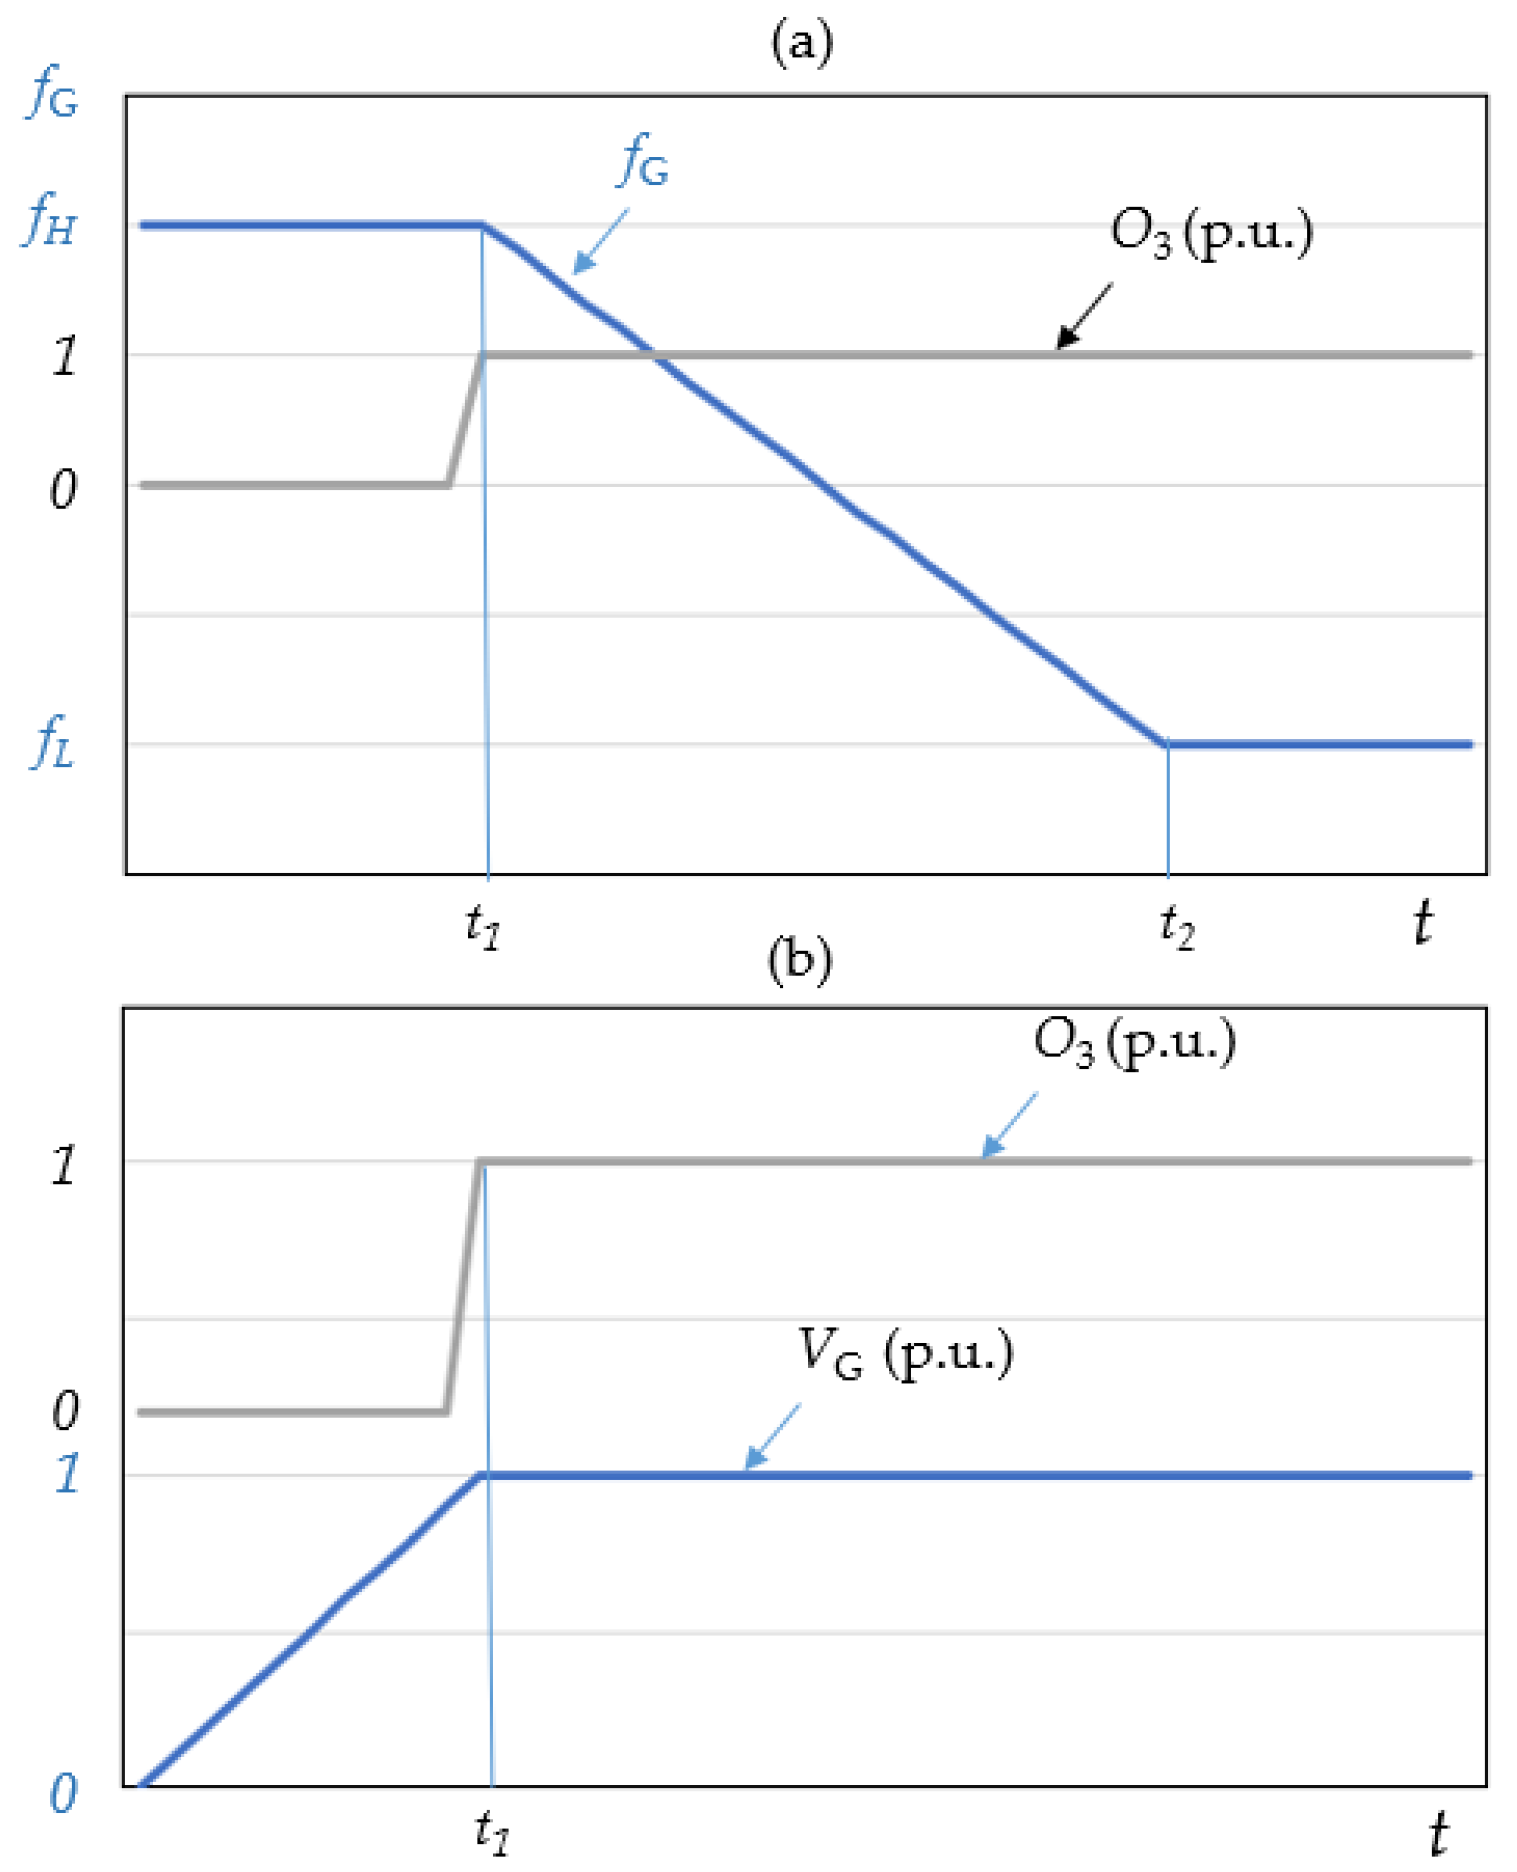
Figure 3.
Generator voltage waveform at the connection point of the grid converter.
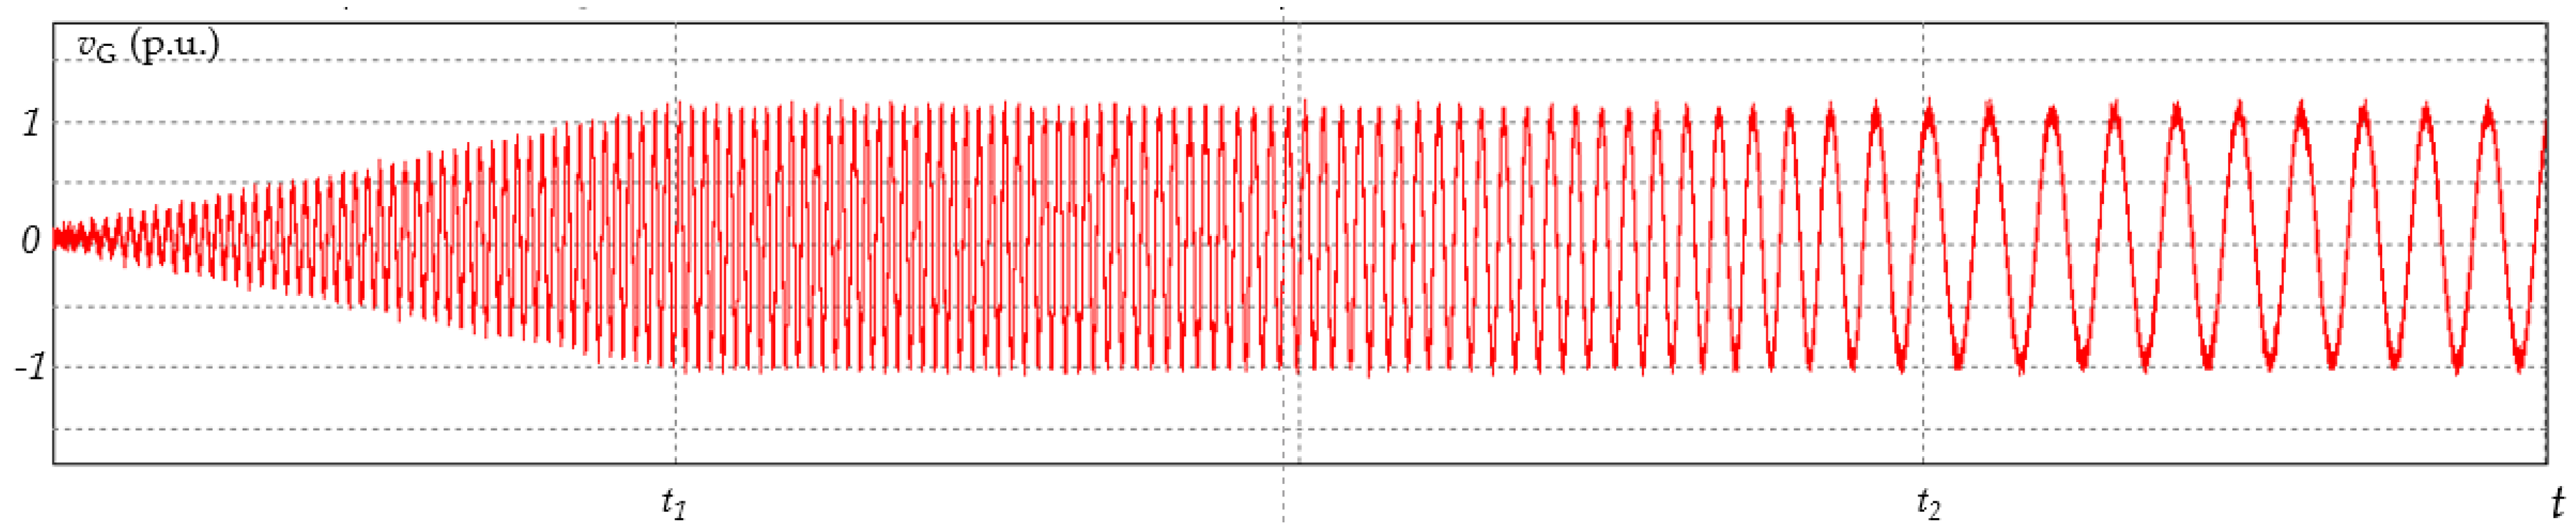
Figure 4.
Bode plots of the generalized second-order integrator for frequency f = 500 Hz.
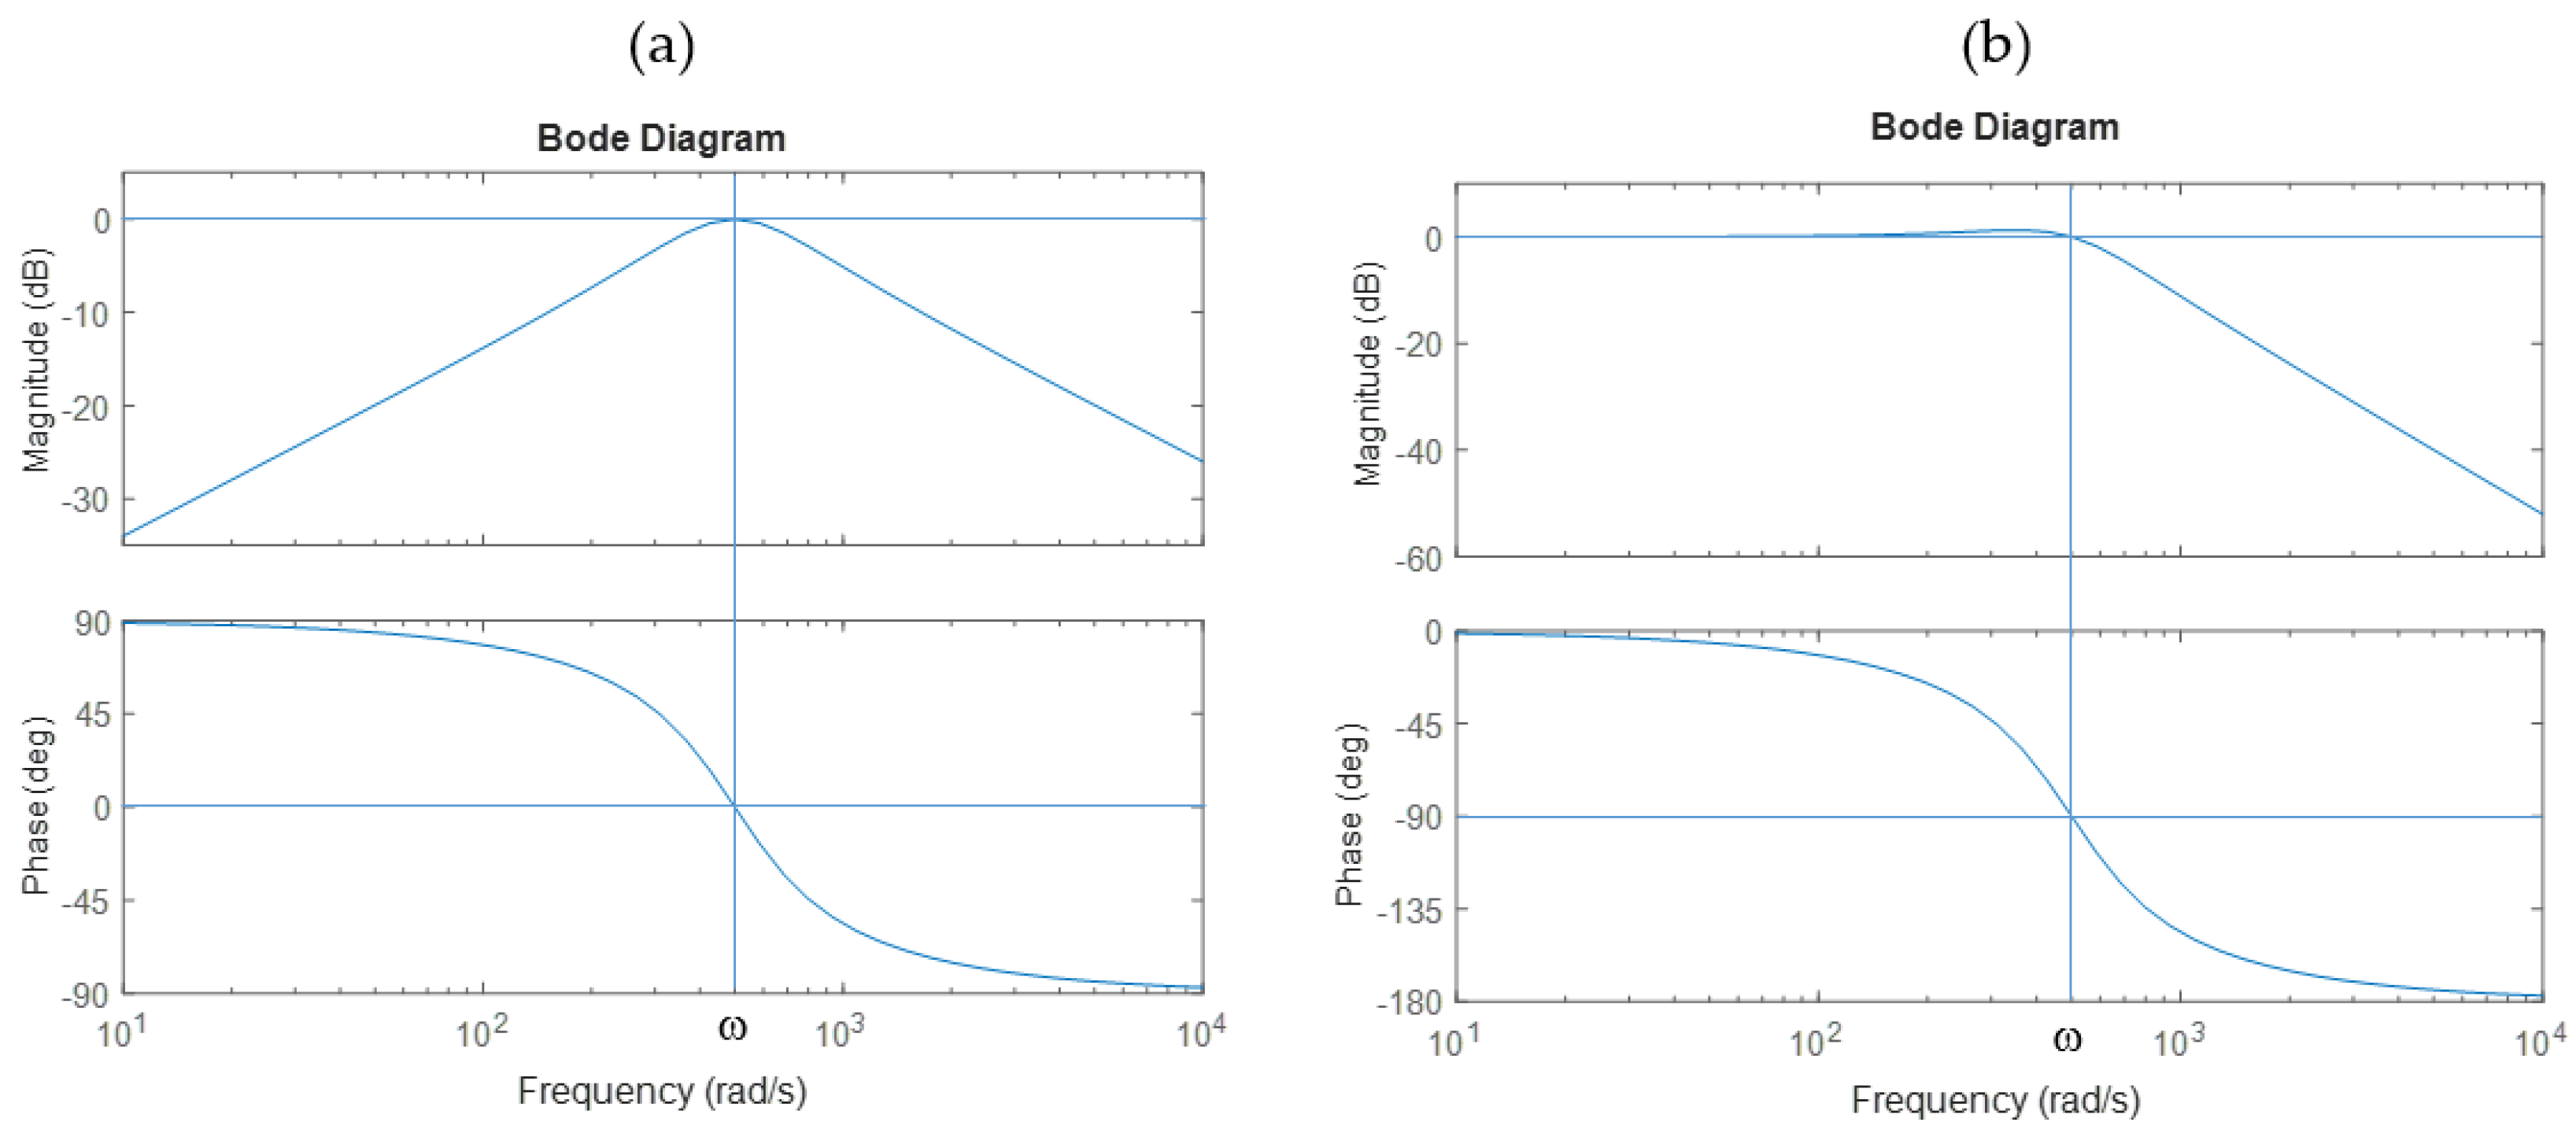
Figure 5.
Block structure of the generalized second-order integrator.
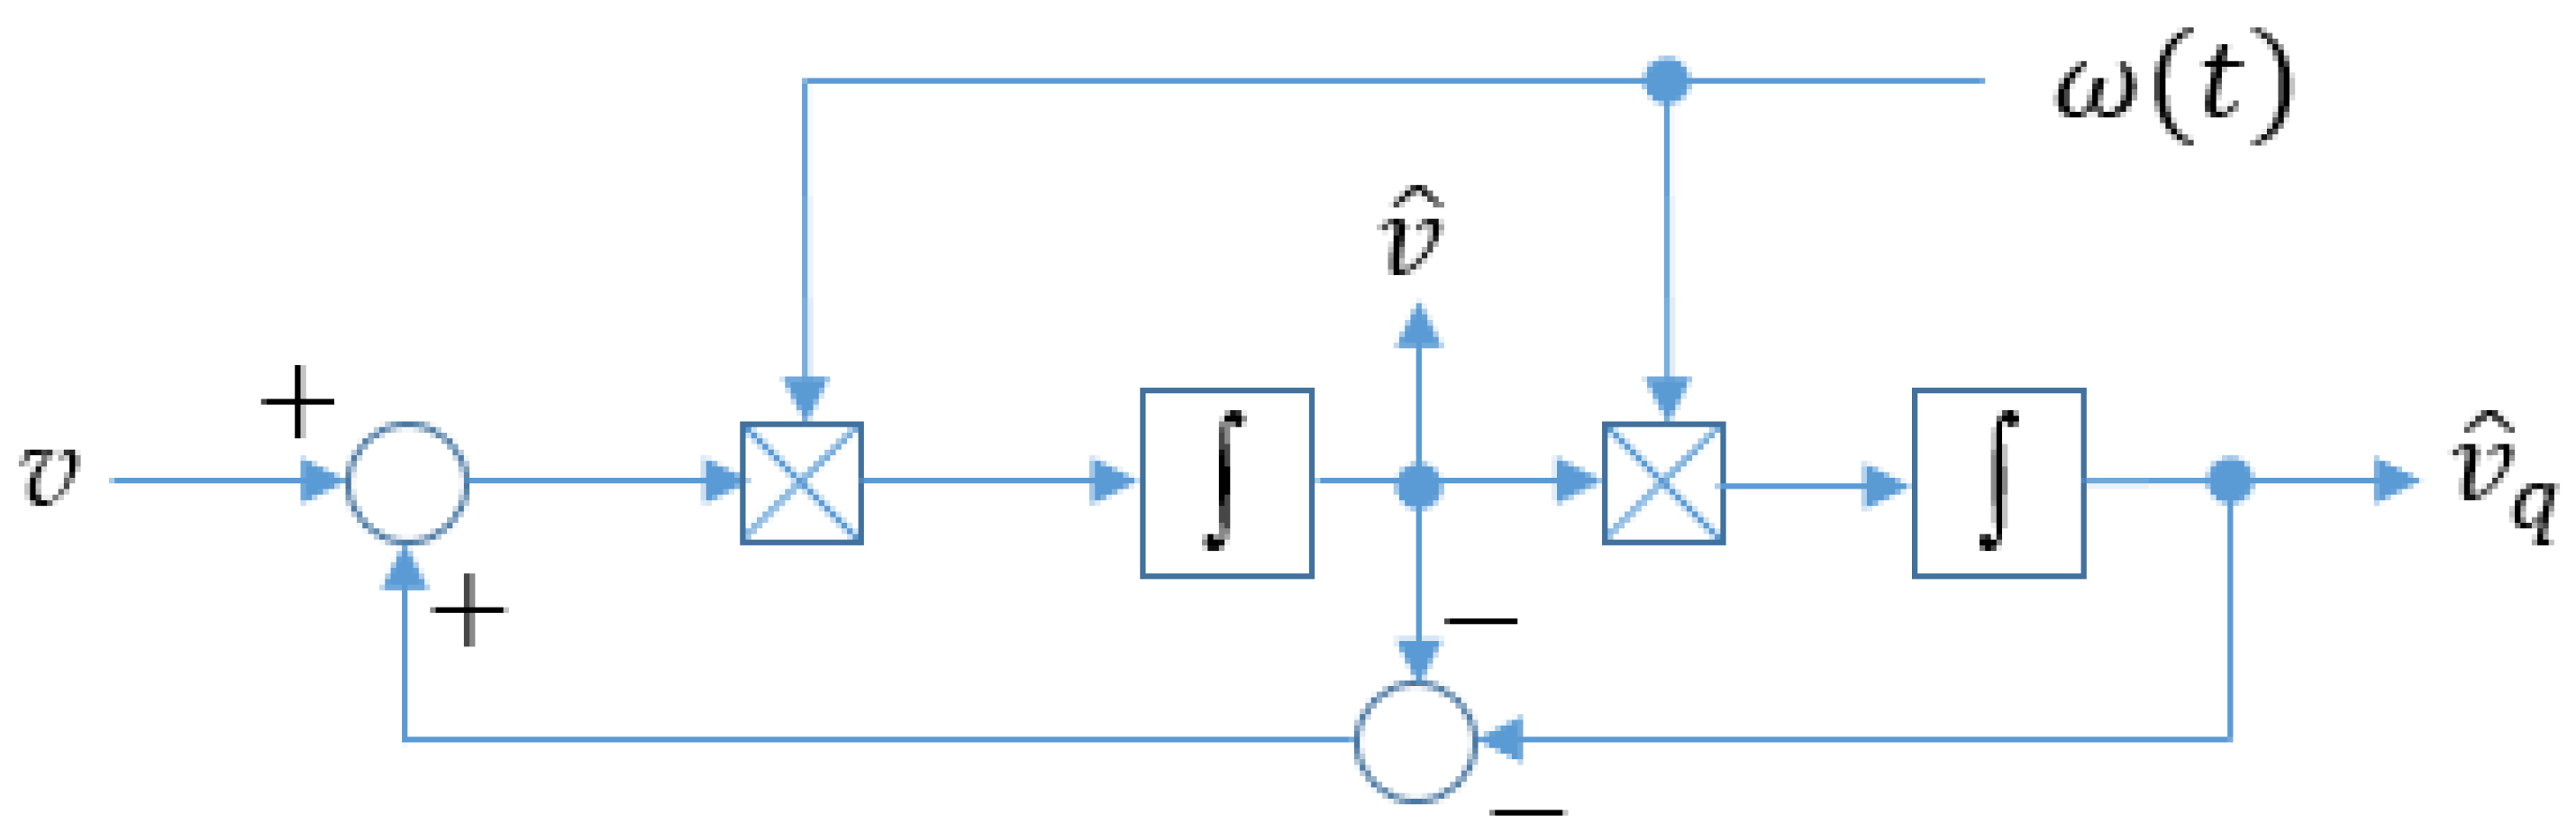
Figure 6.
Voltage waveform v and quadrature signal estimates and q obtained by direct implementation of the frequency variation profile f in the generalized second-order integrator.
Figure 6.
Voltage waveform v and quadrature signal estimates and q obtained by direct implementation of the frequency variation profile f in the generalized second-order integrator.
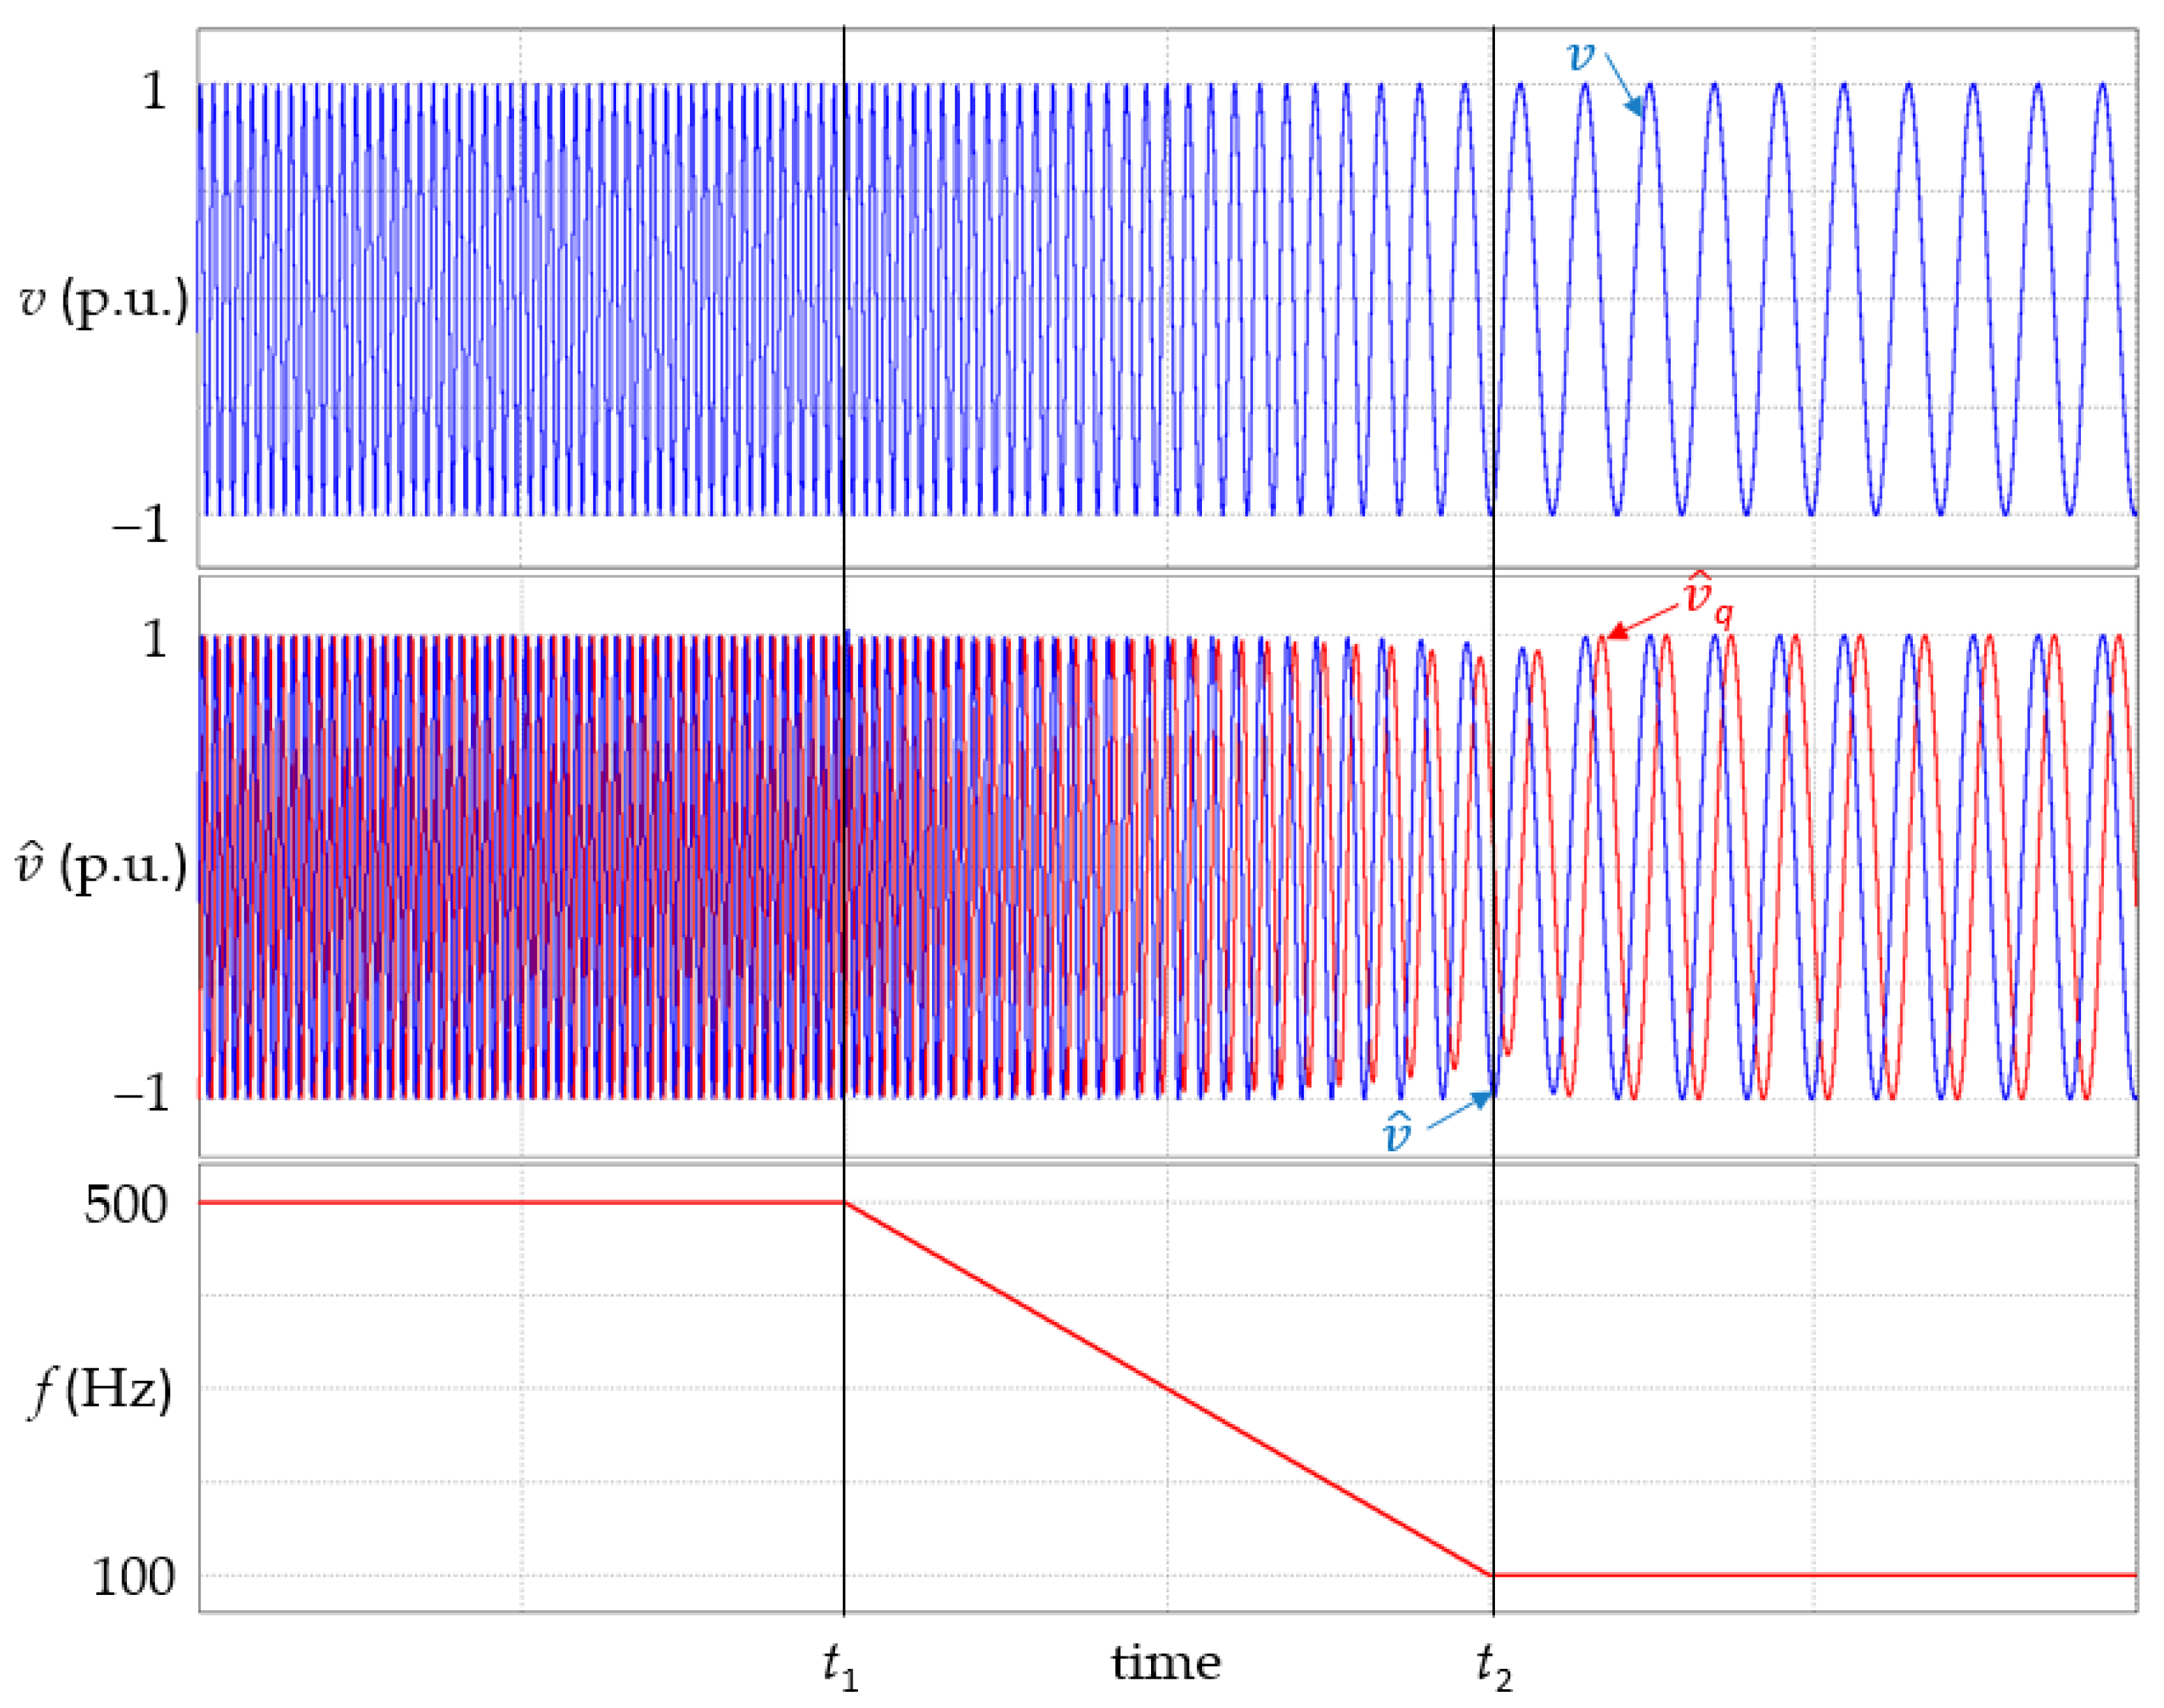
Figure 7.
Trajectory of quadrature signals formed in the generalized second-order integrator for (a) ω = 500 Hz, (b) ω = 100 Hz.
Figure 7.
Trajectory of quadrature signals formed in the generalized second-order integrator for (a) ω = 500 Hz, (b) ω = 100 Hz.
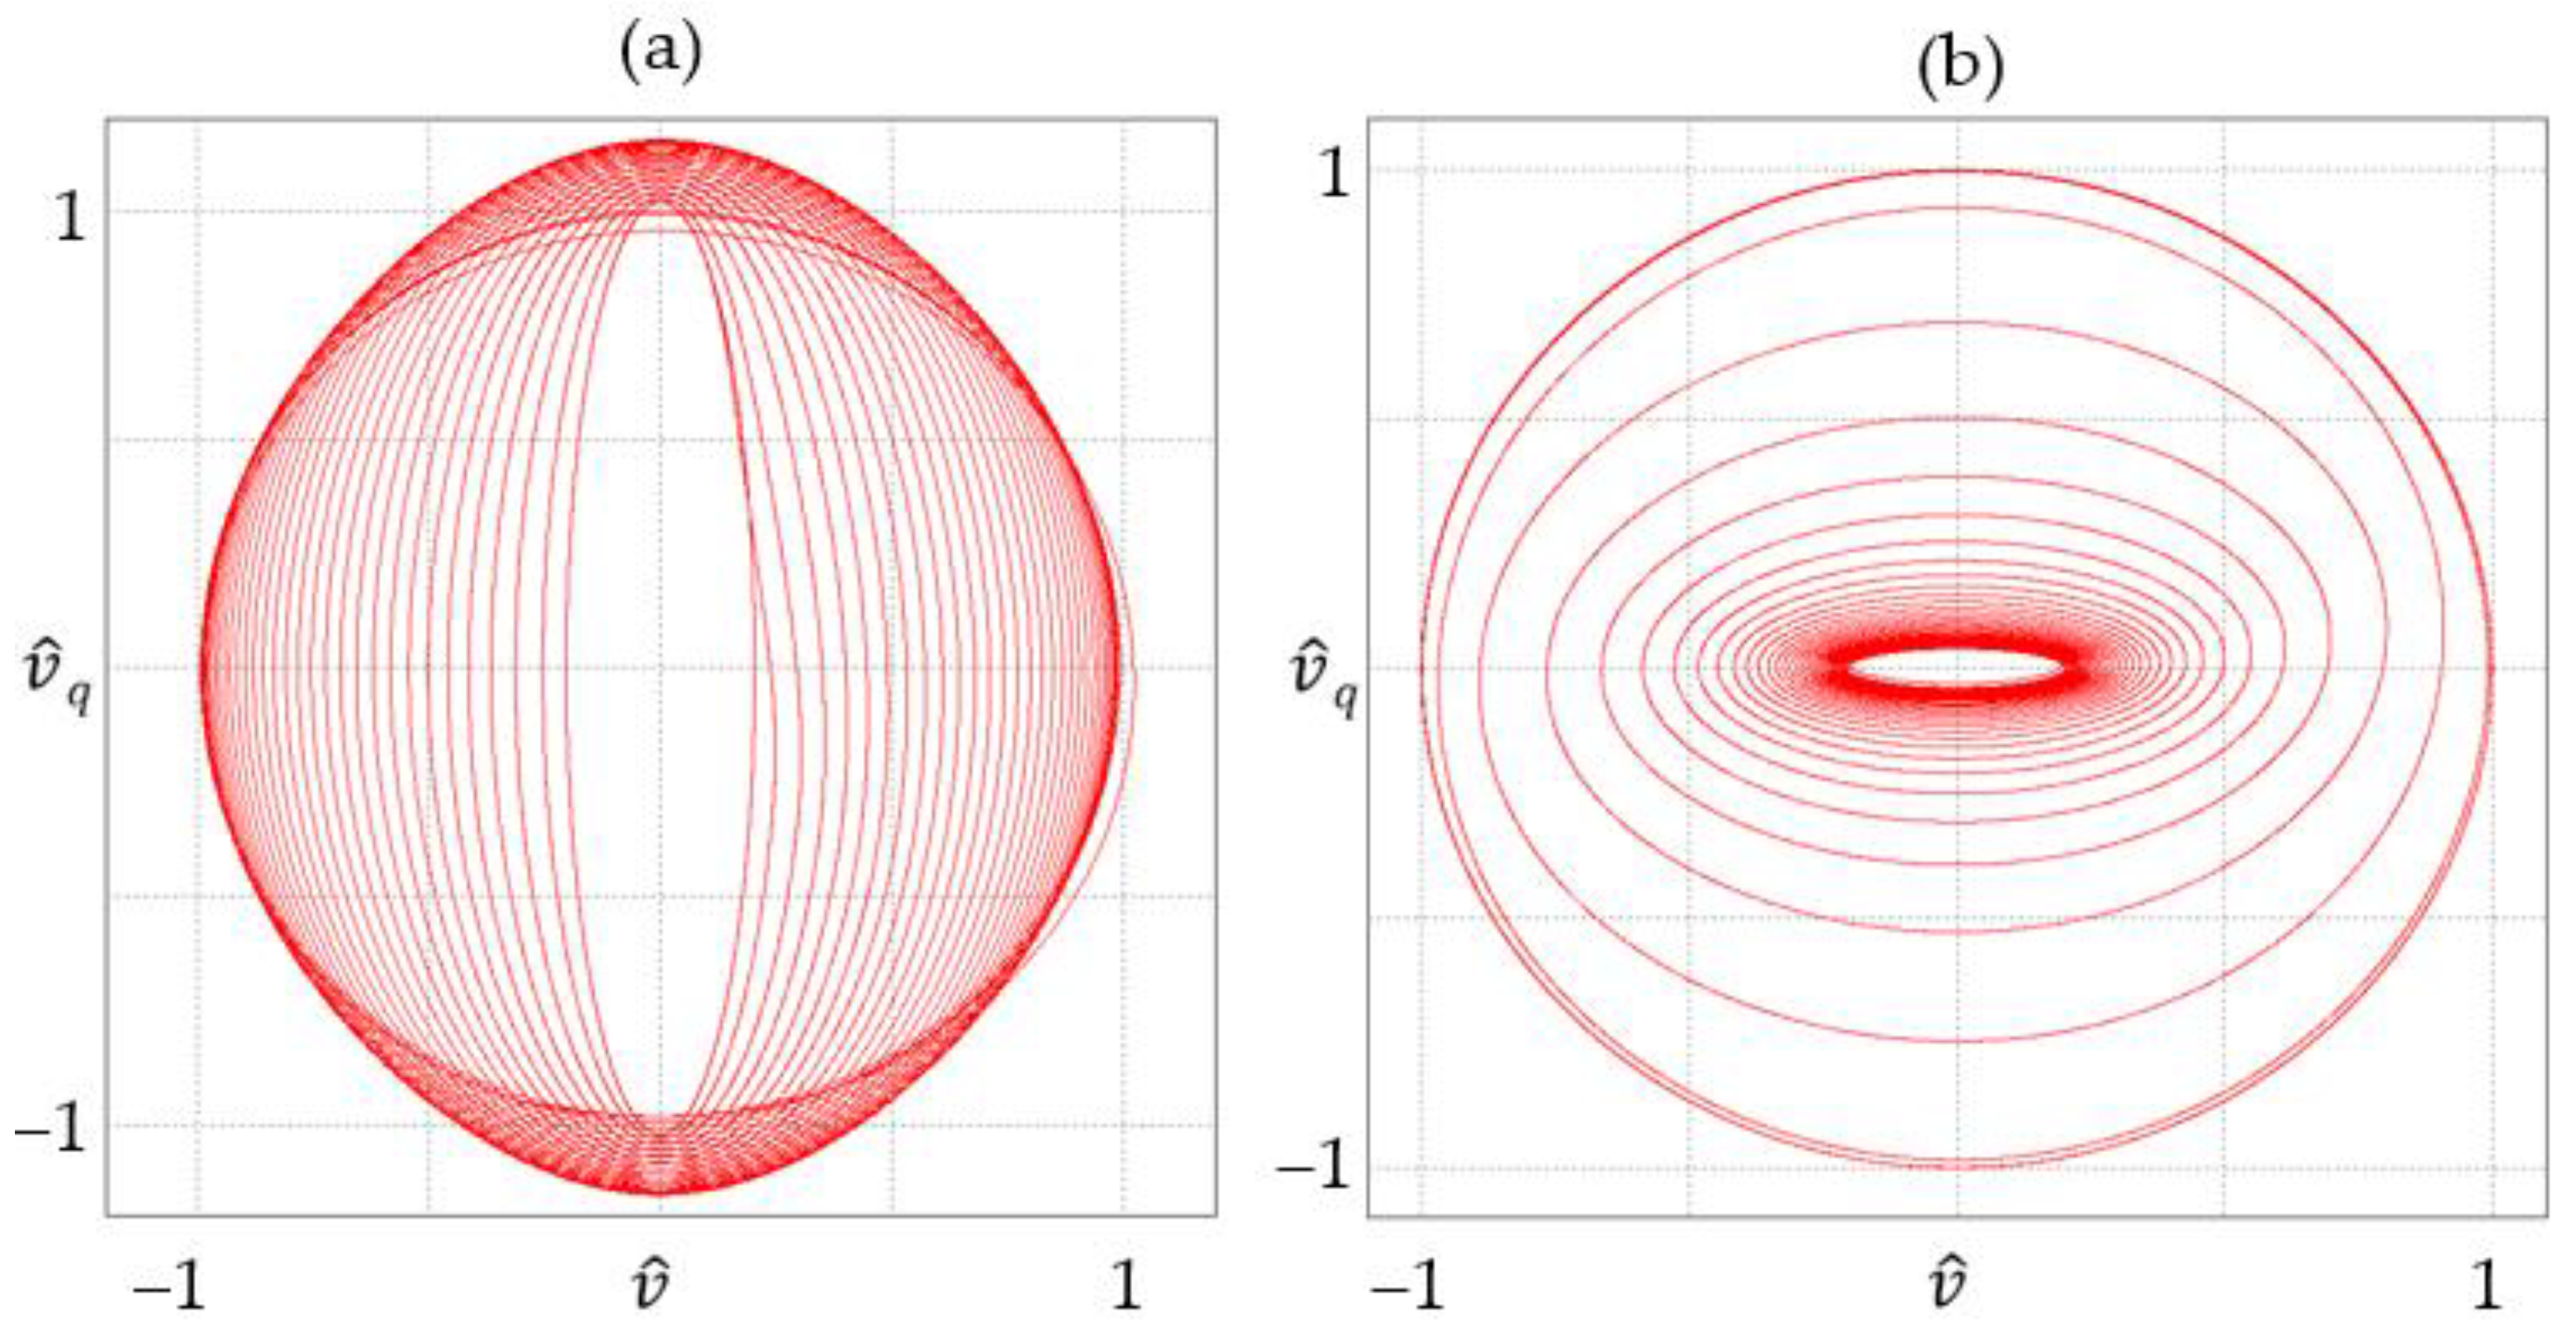
Figure 8.
Trajectory of quadrature signals formed in a generalized second-order integrator for a given frequency variation profile.
Figure 8.
Trajectory of quadrature signals formed in a generalized second-order integrator for a given frequency variation profile.
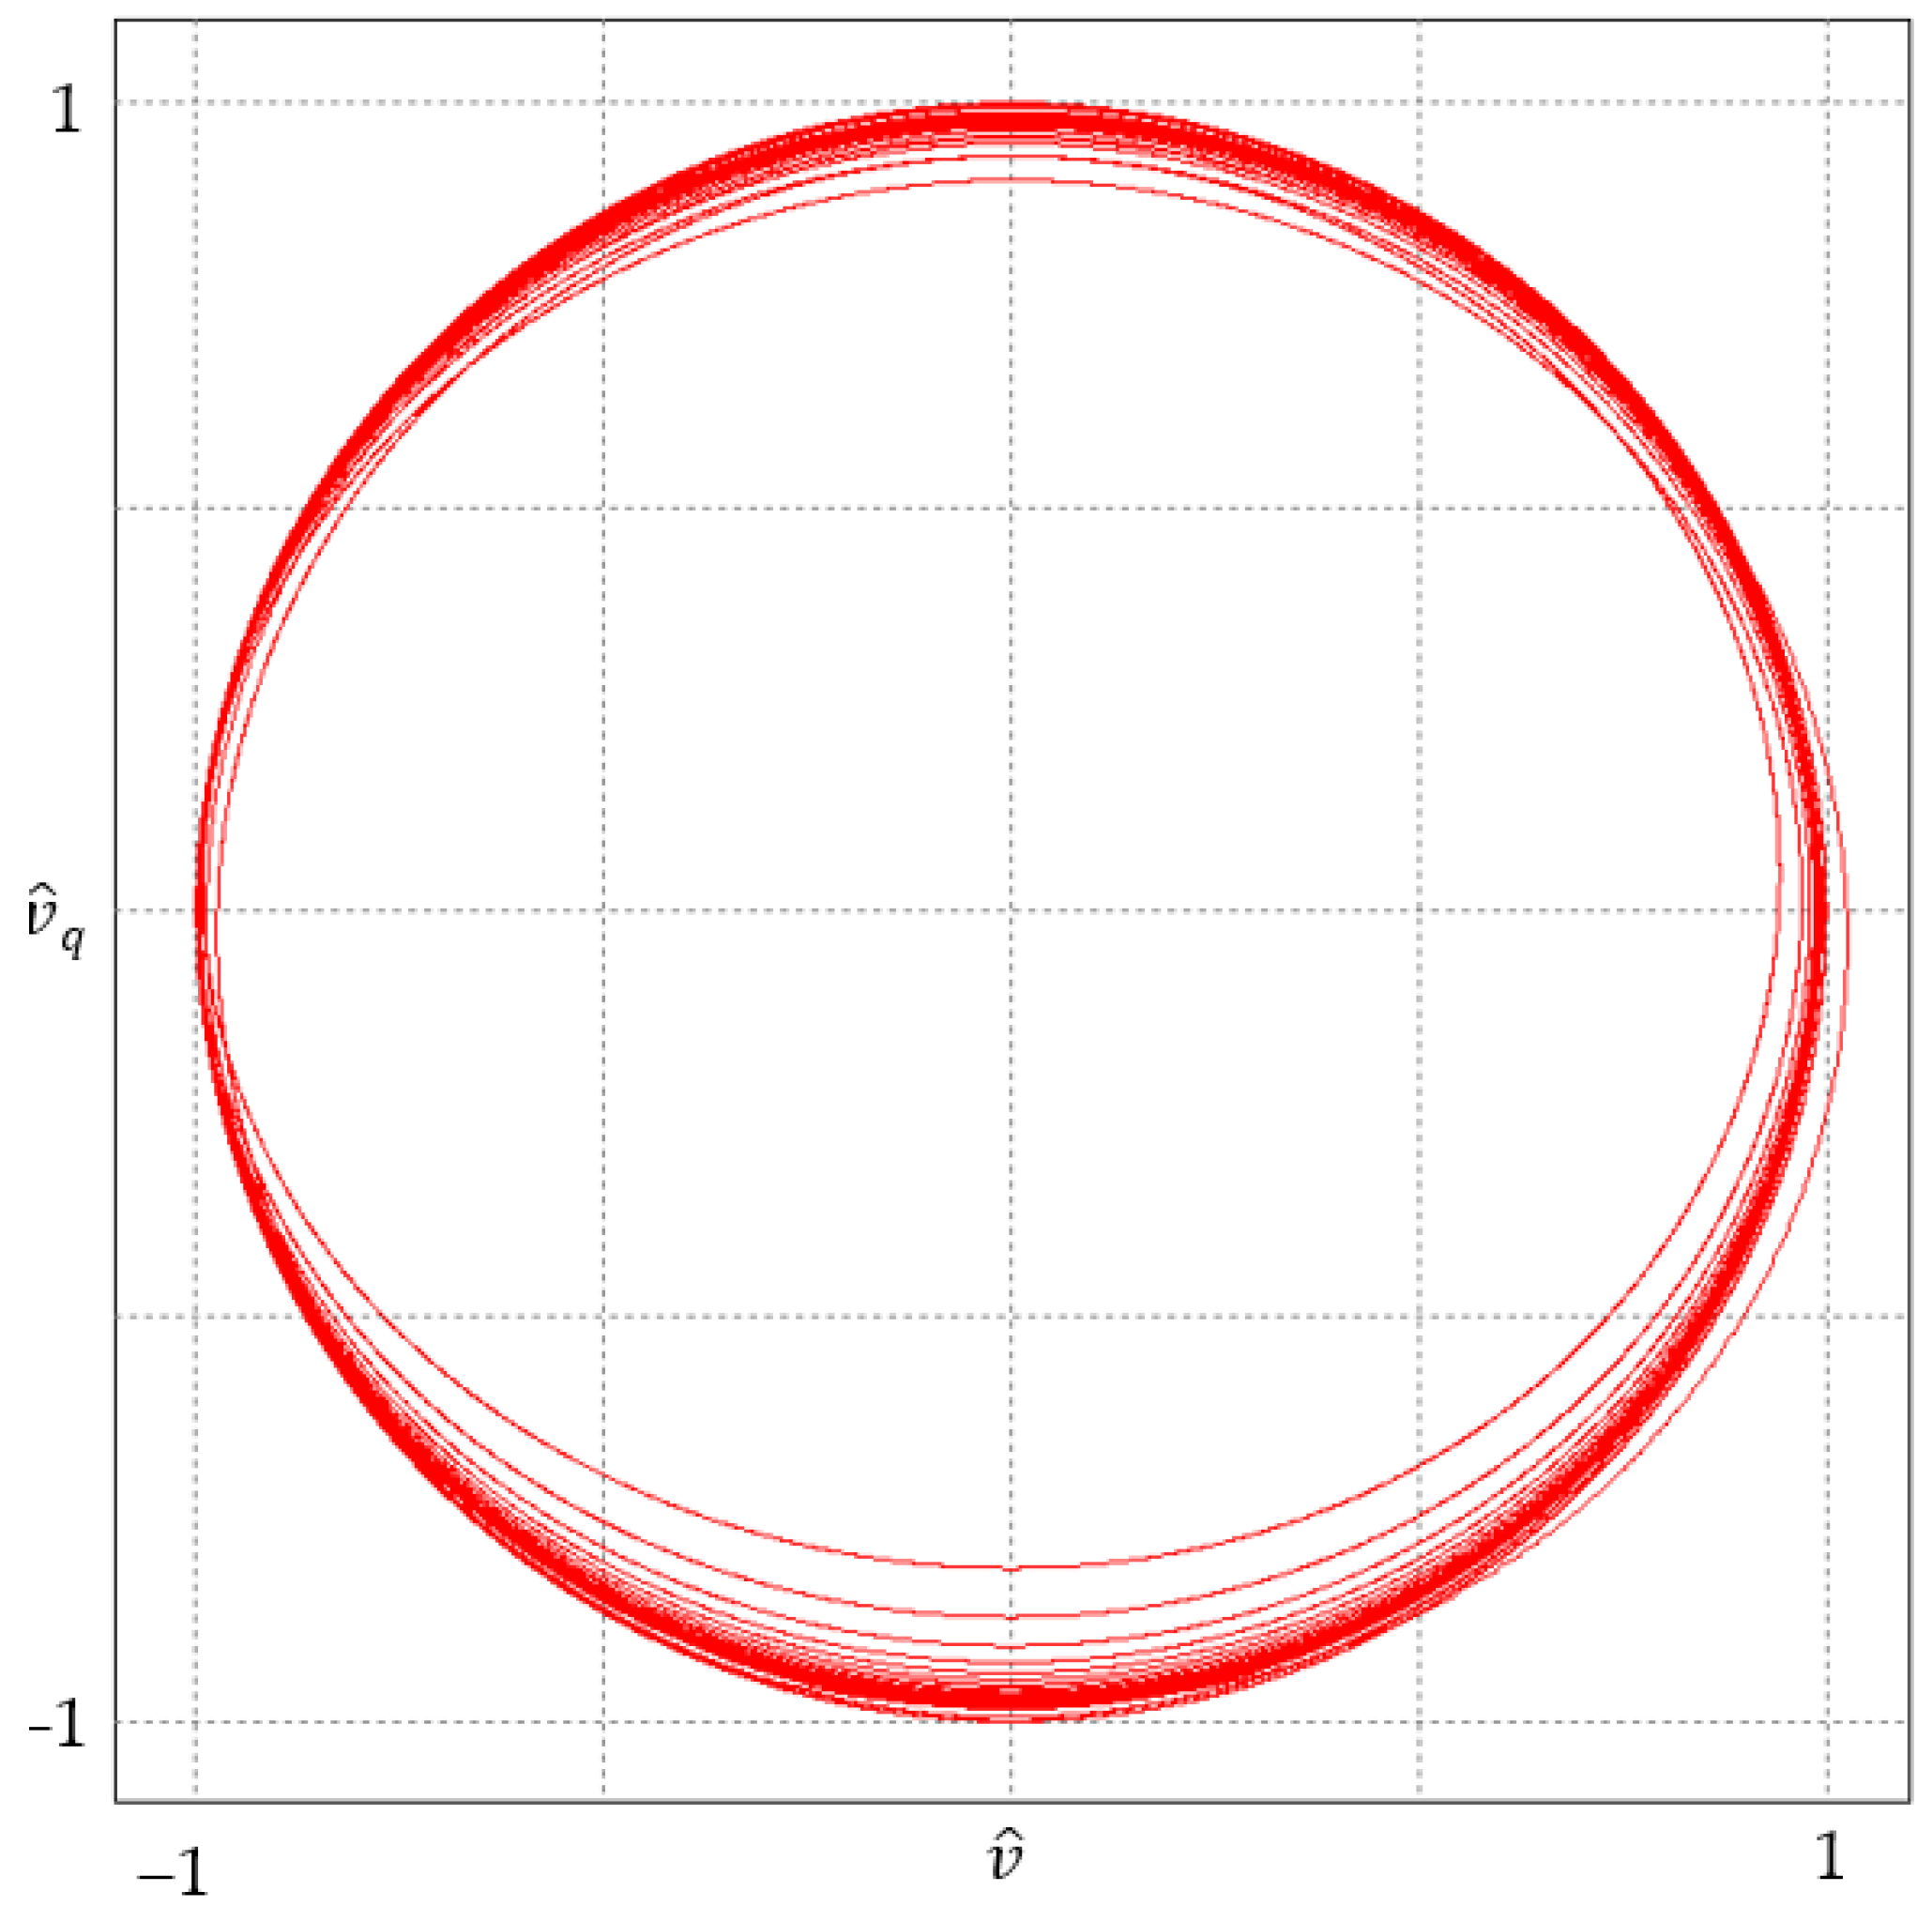
Figure 9.
Flow chart of the proposed characteristic frequency reference system.
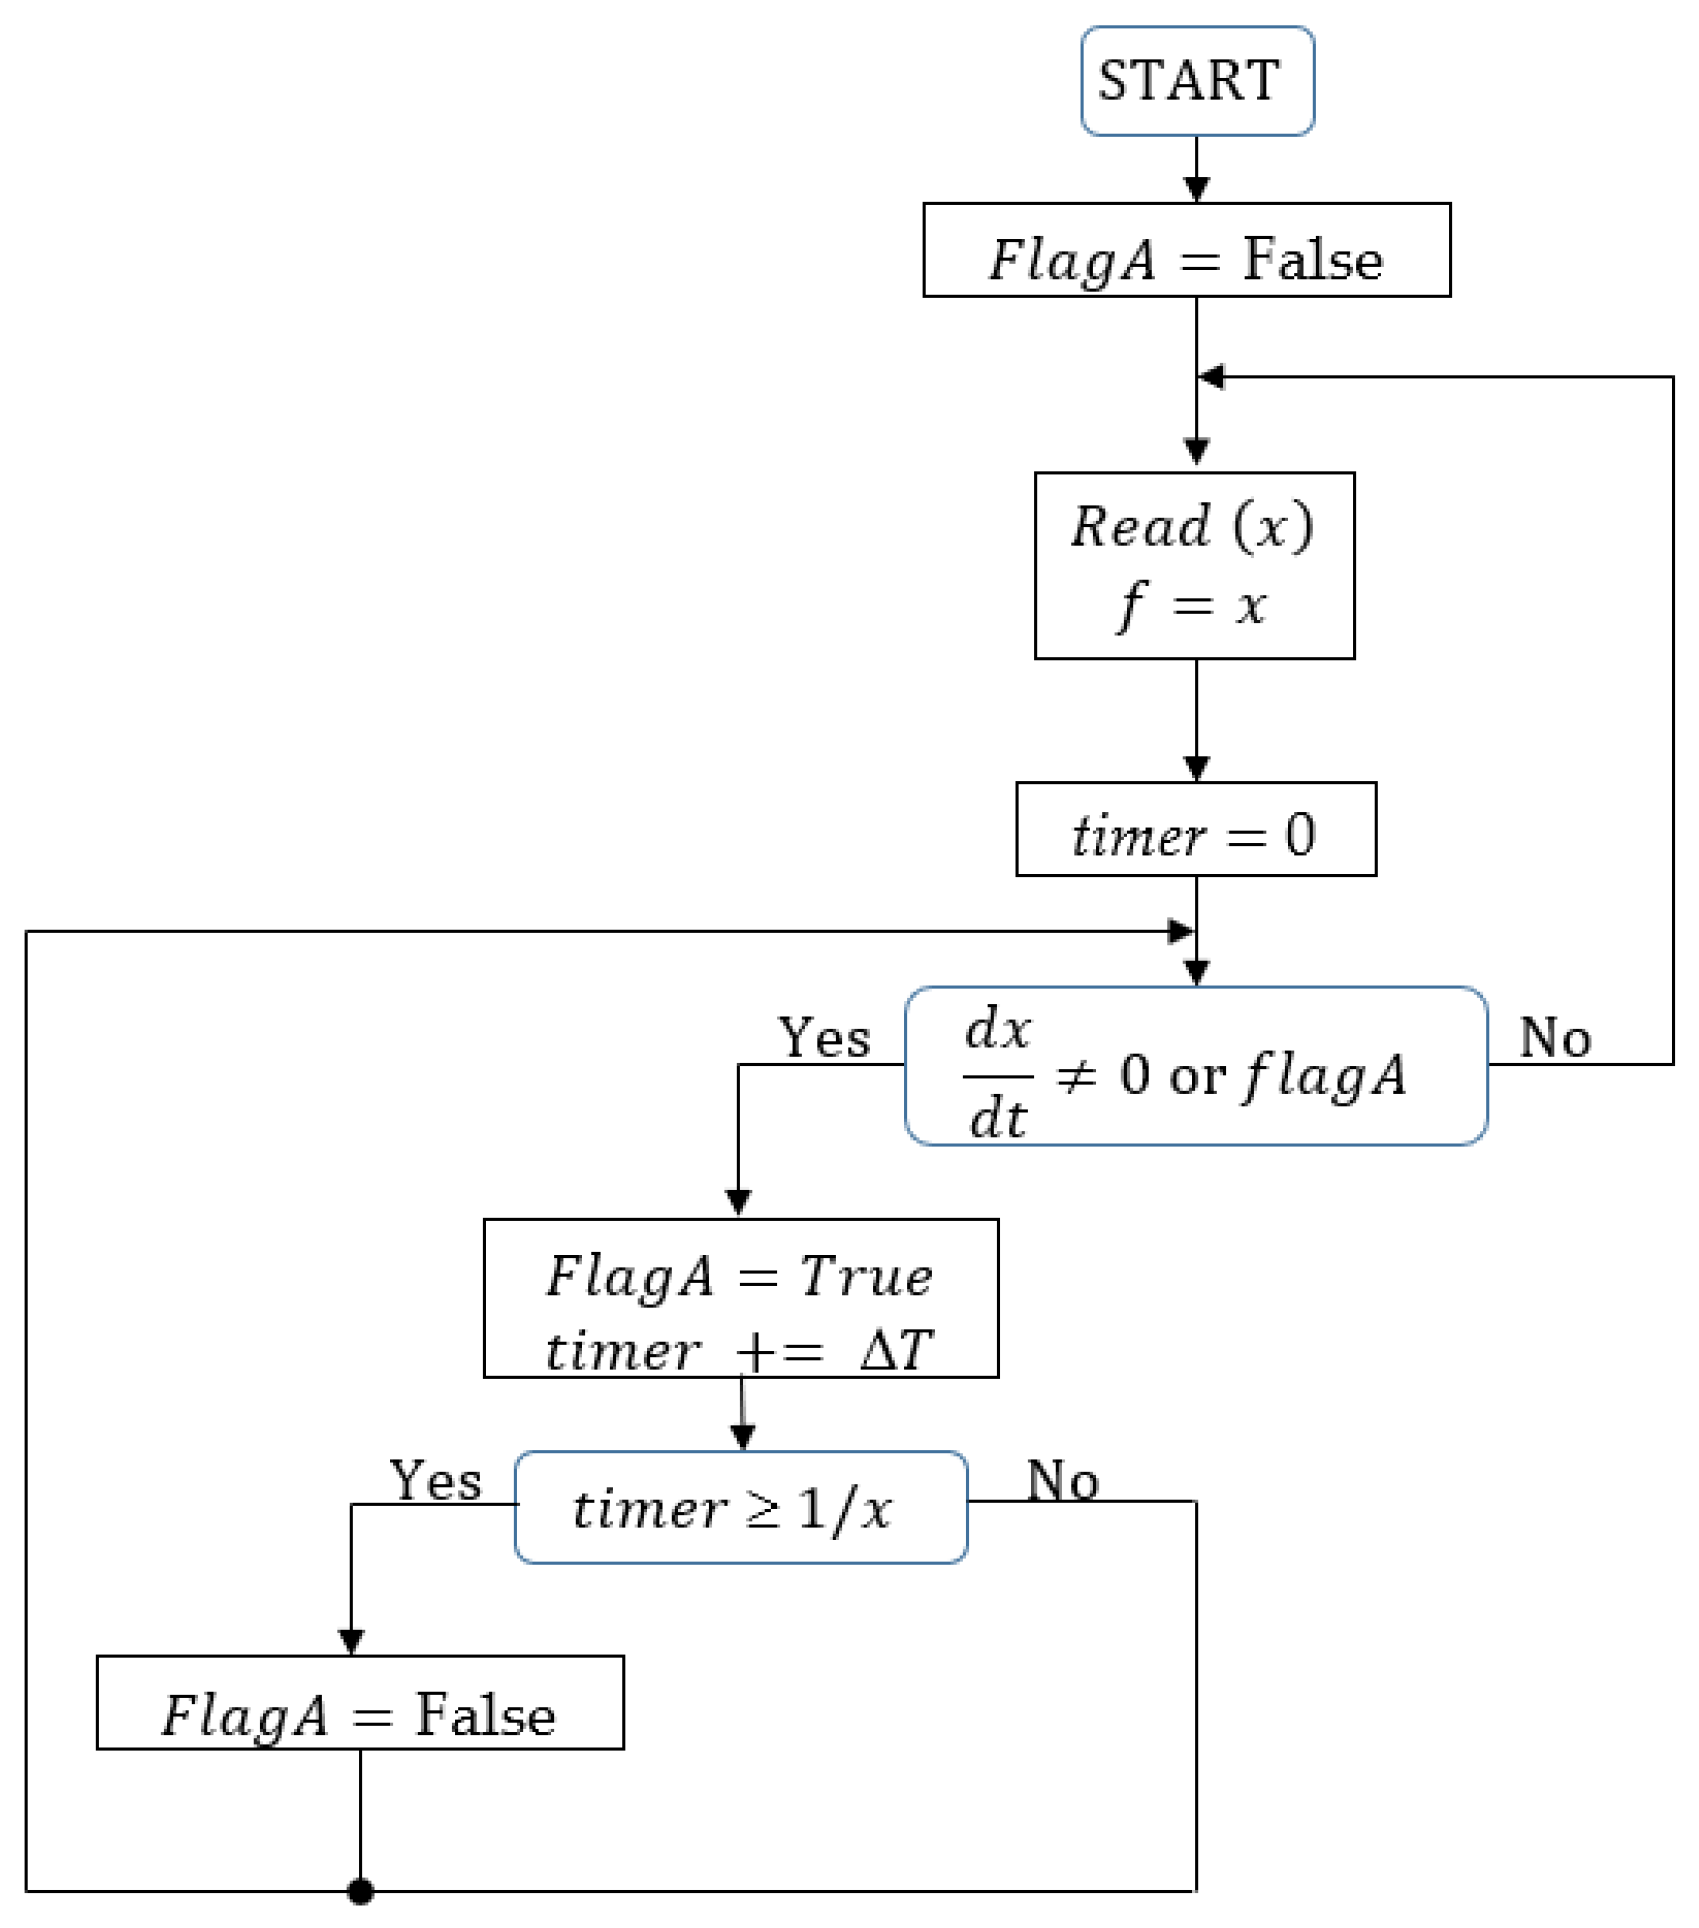
Figure 10.
Graphic illustration describing the adaptive zero-order hold block process.
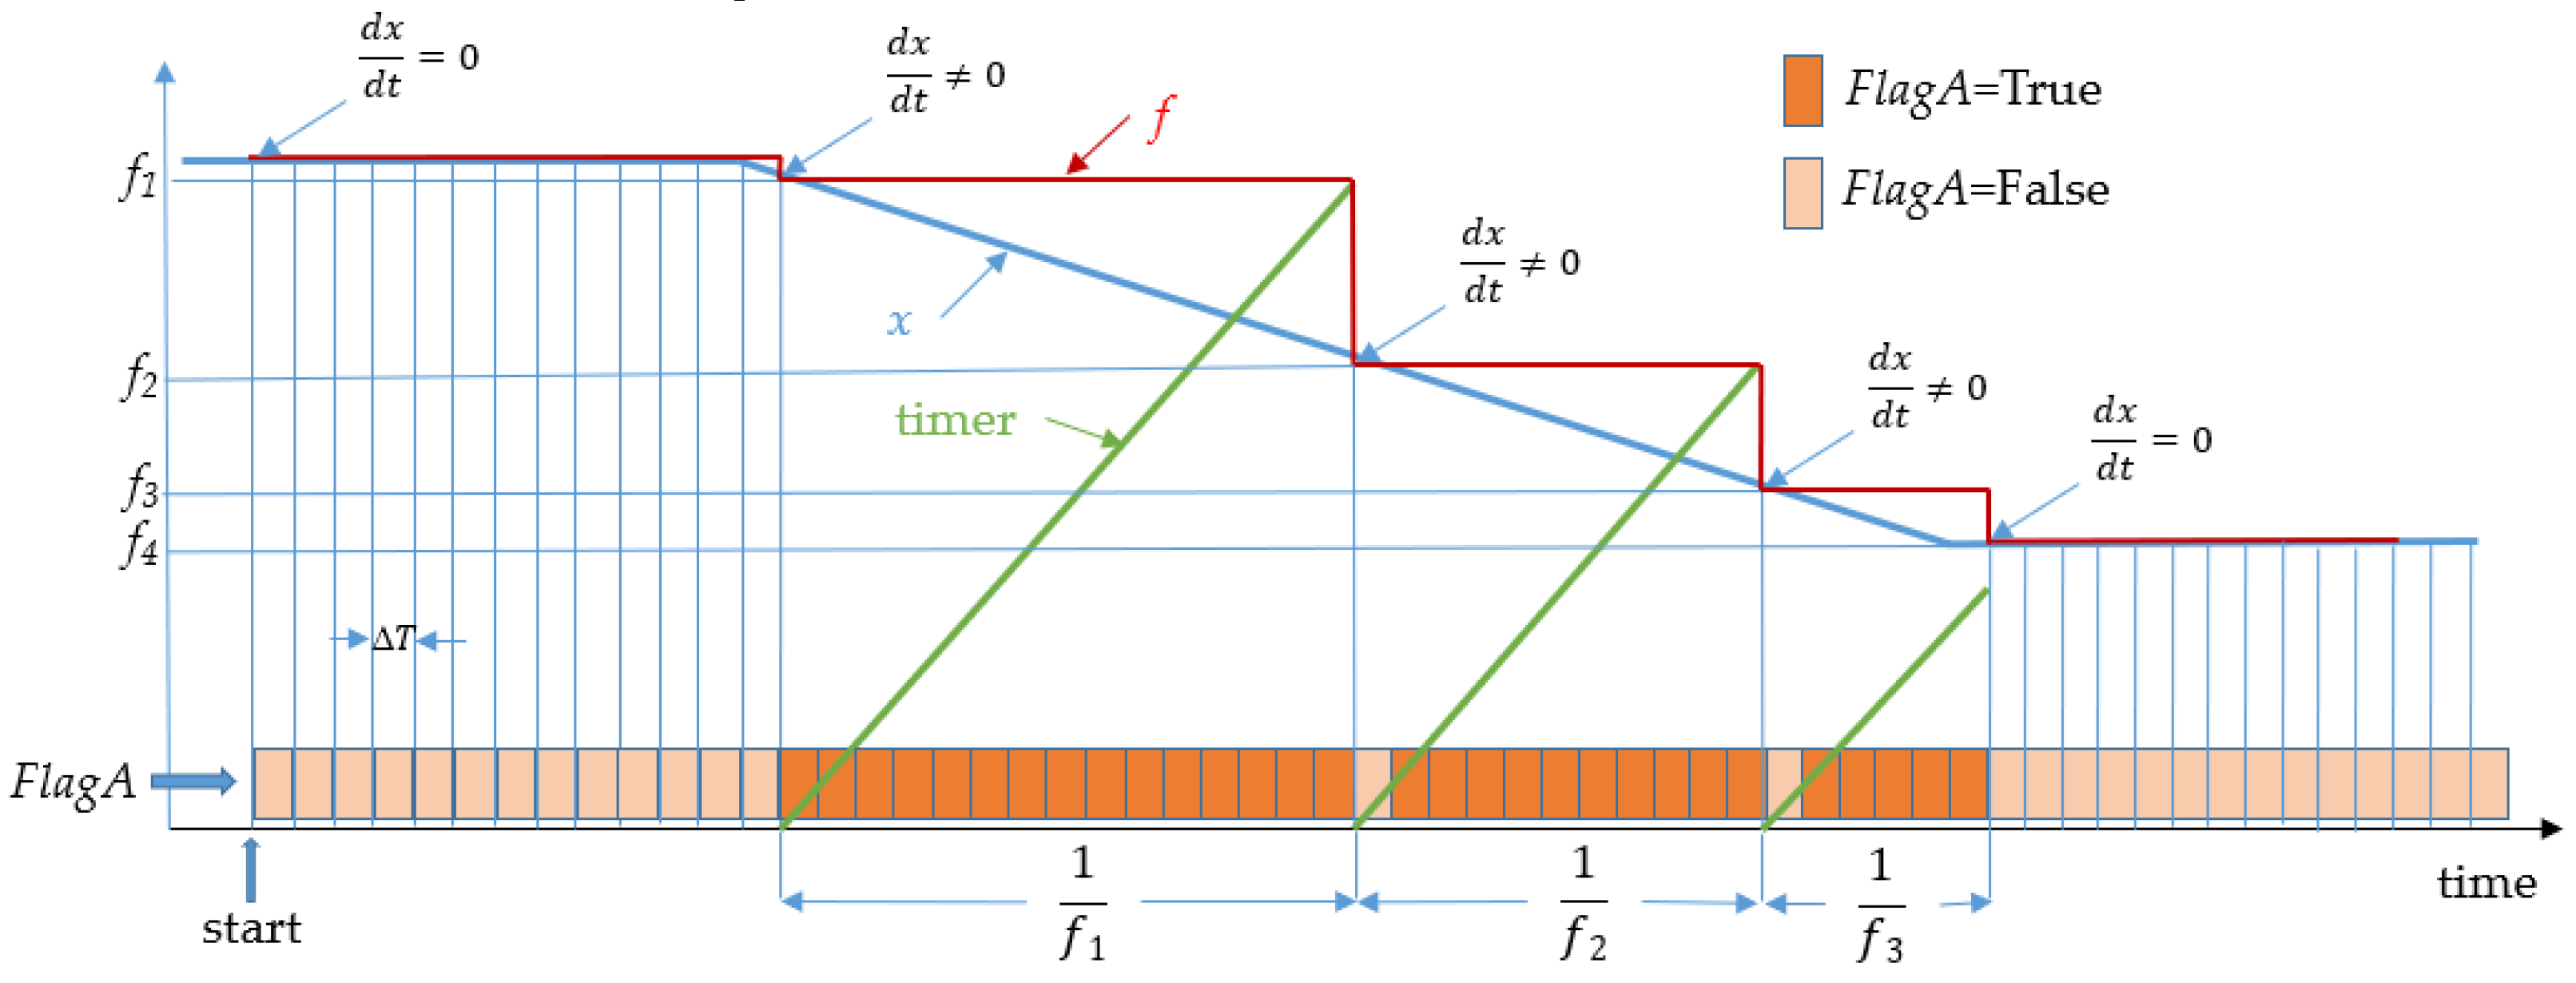
Figure 11.
Structure of the RSG system and waveforms describing the operation of AZOH.
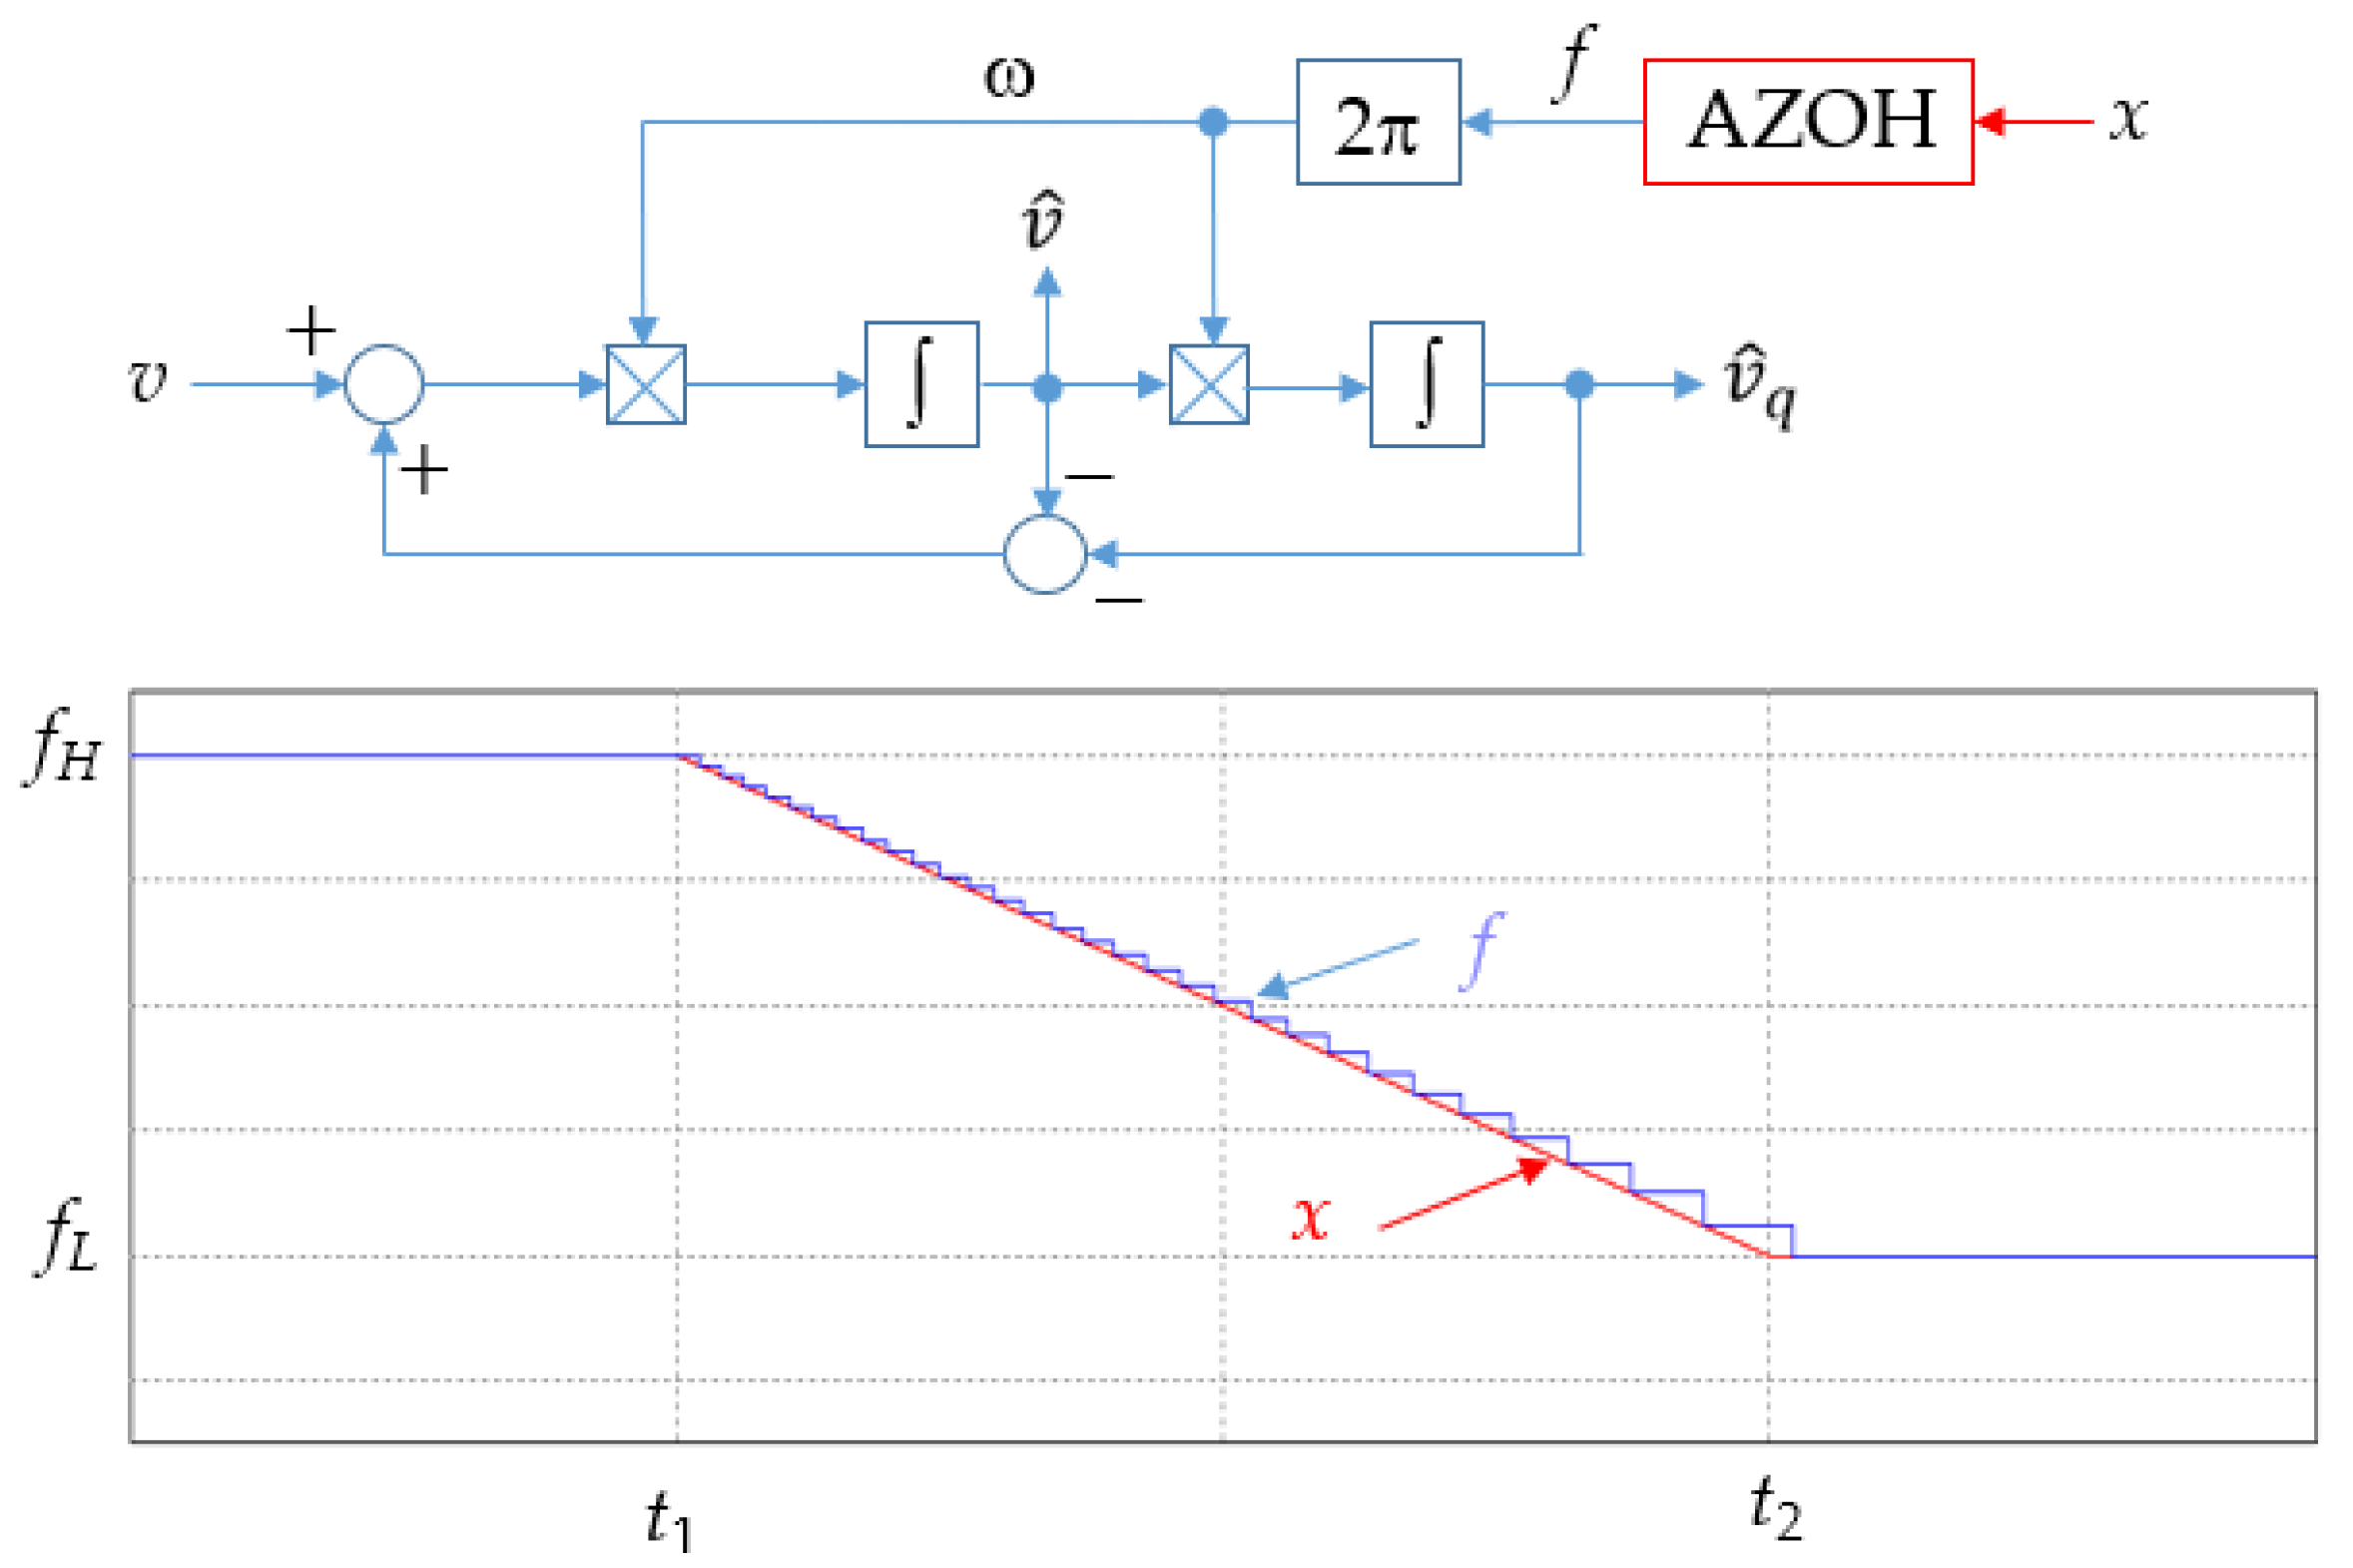
Figure 12.
The proposed system of adaptive regulation of the grid converter.
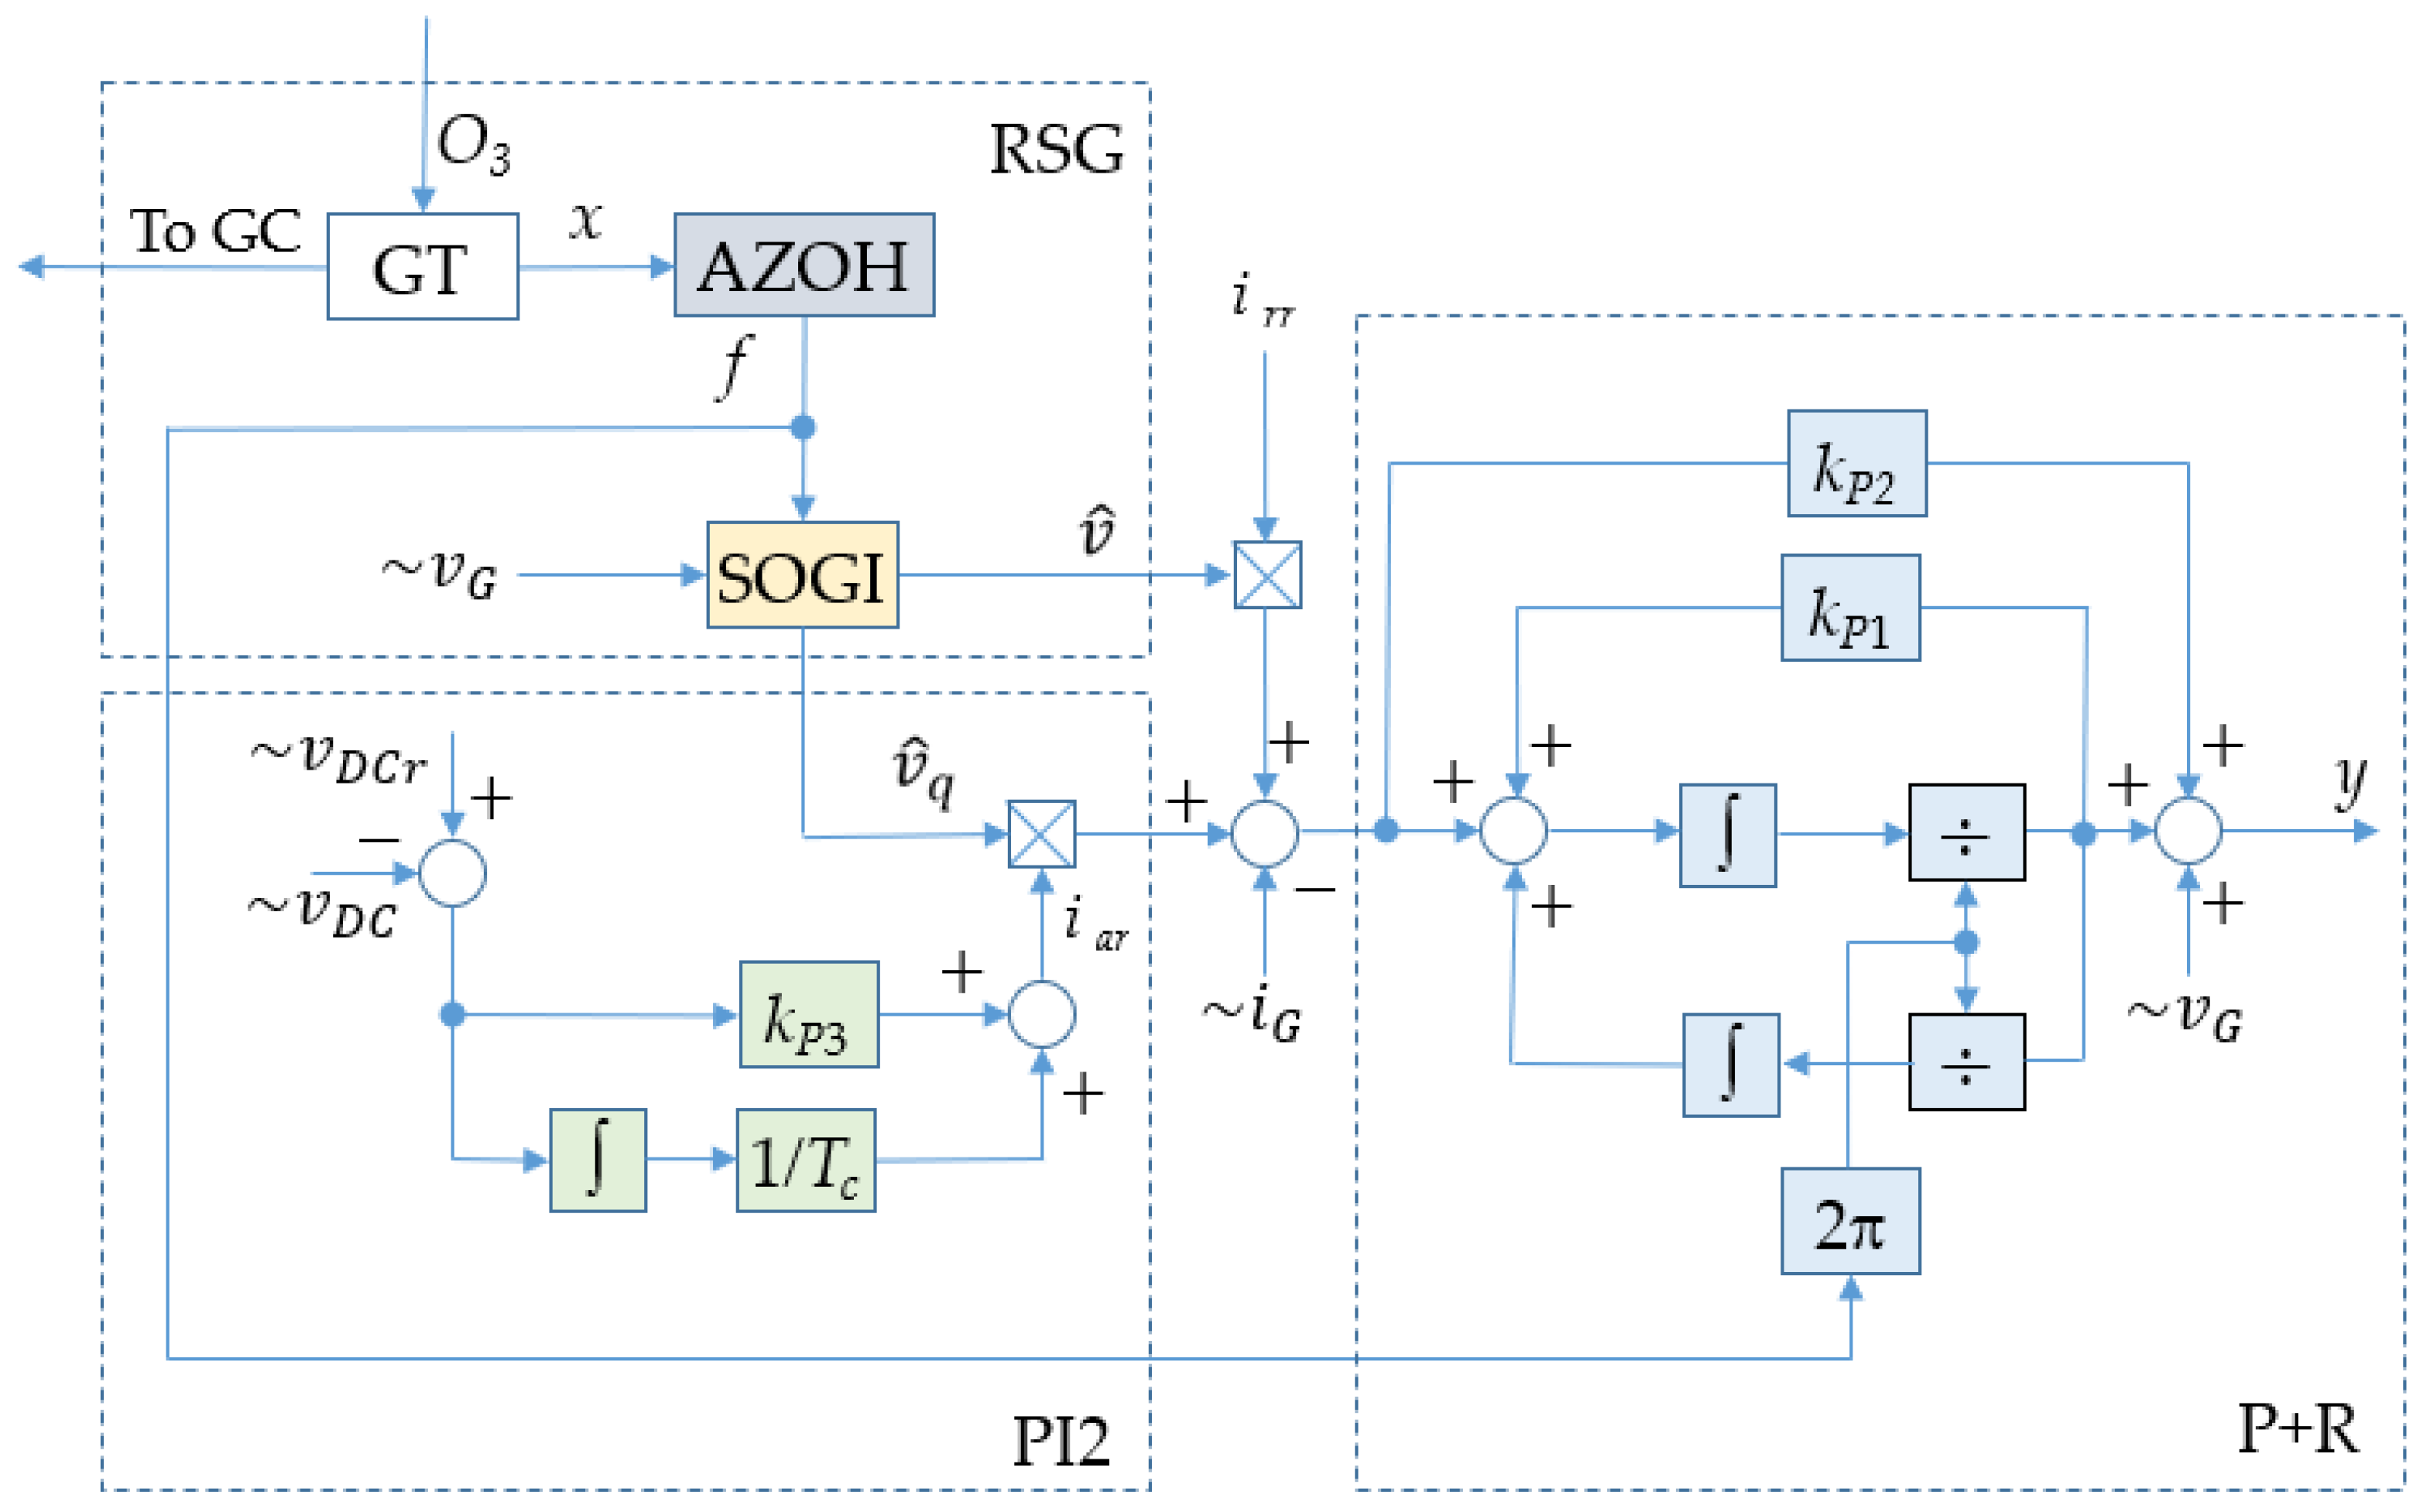
Figure 13.
Test stand designed for testing grid-tied inverters.
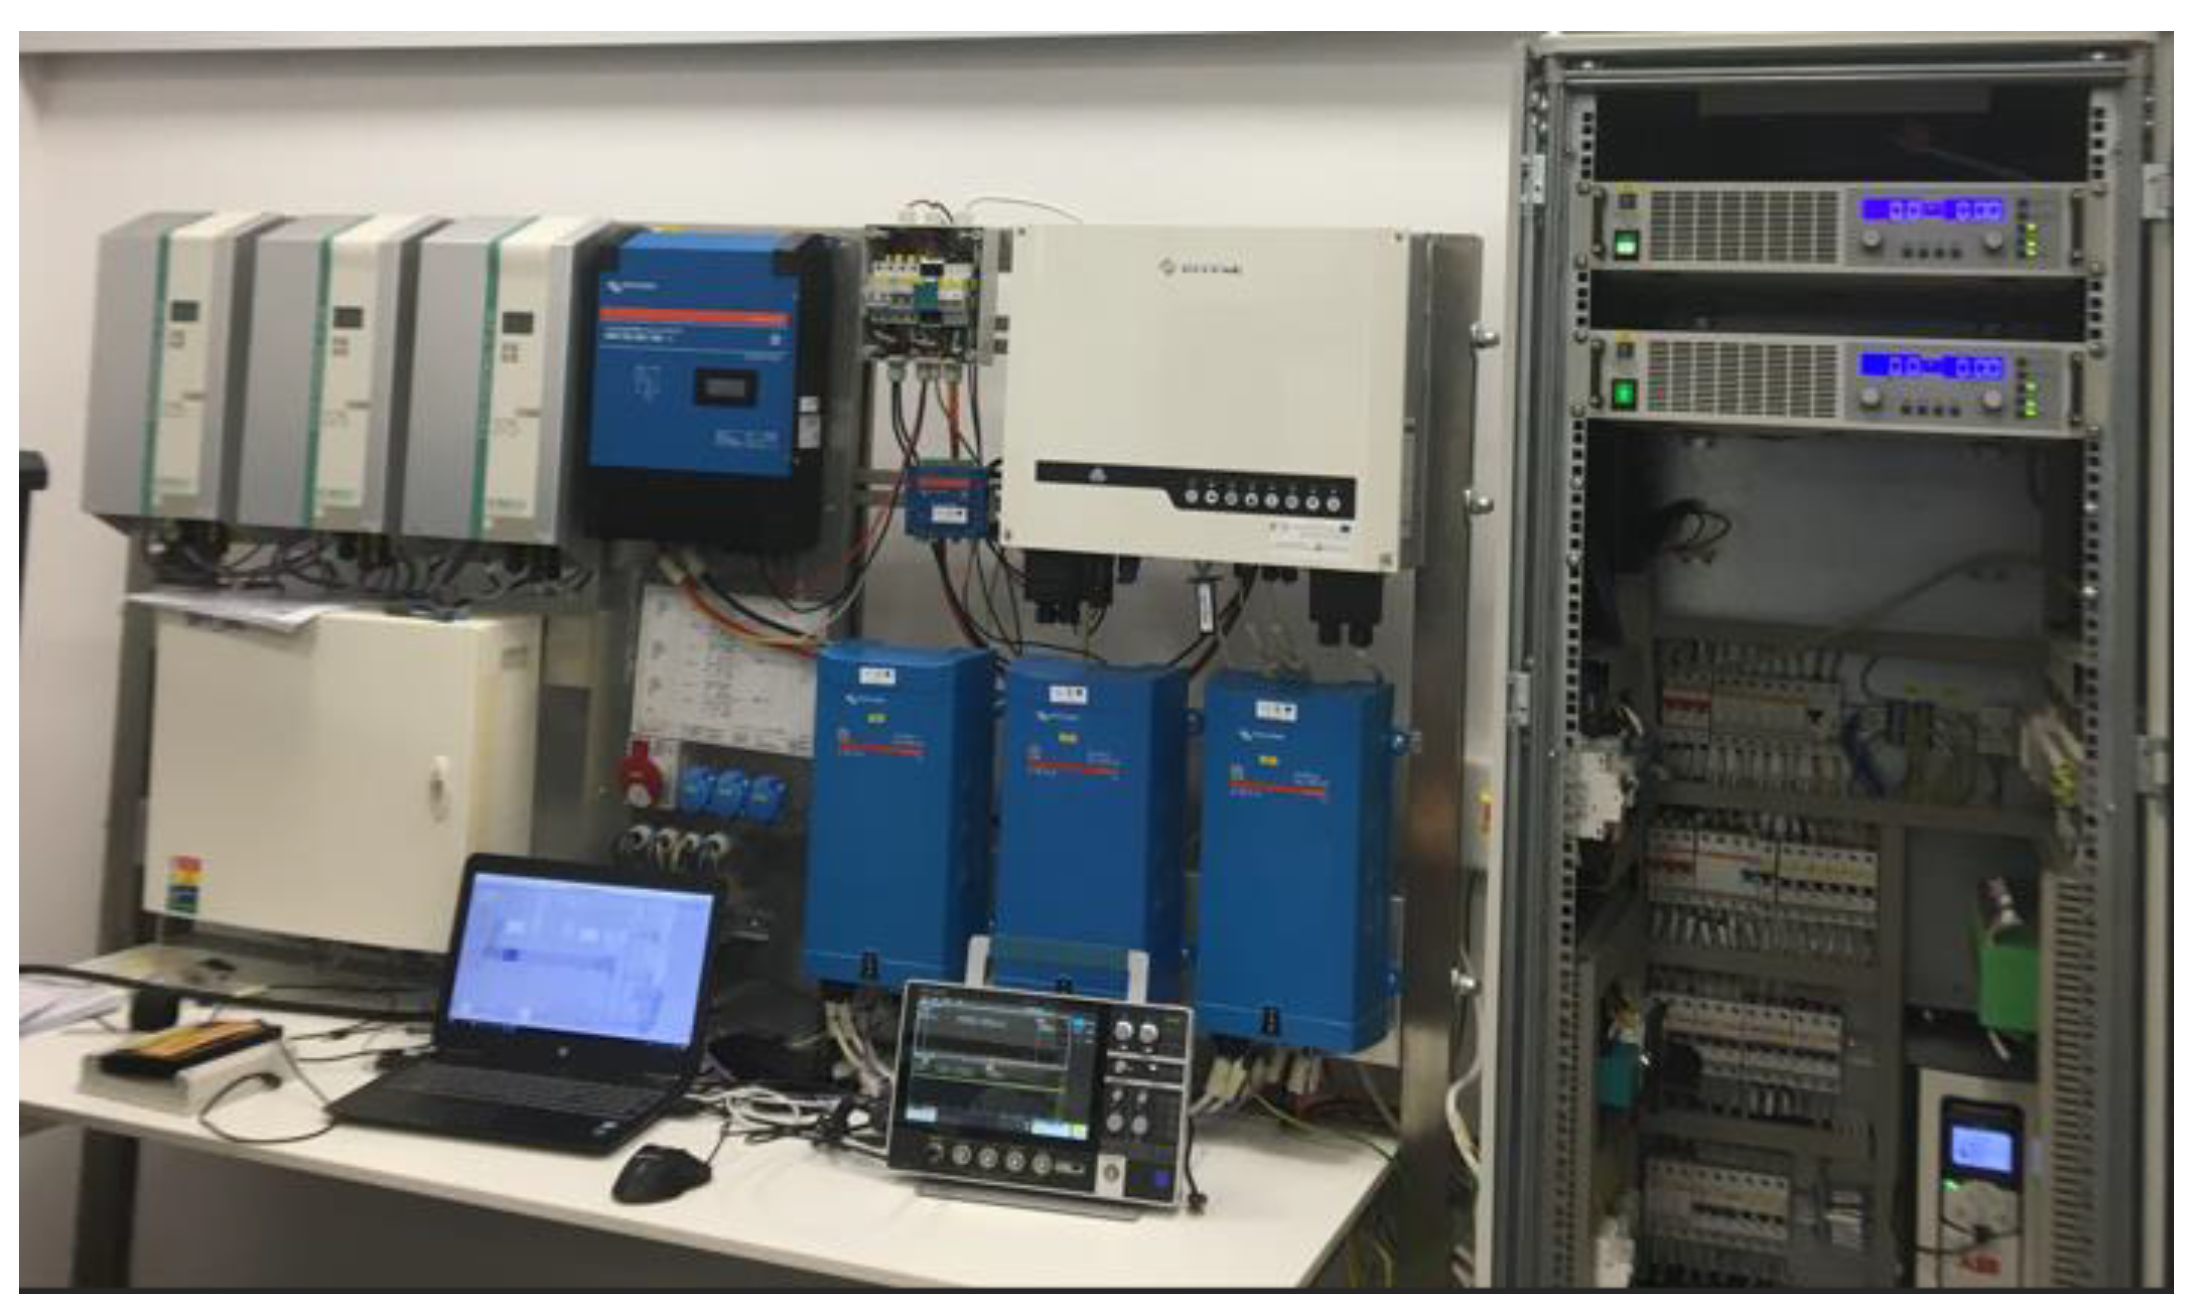
Figure 14.
Trajectory of quadrature signals formed in a generalized second-order integrator for a proposed RSG with AZOH.
Figure 14.
Trajectory of quadrature signals formed in a generalized second-order integrator for a proposed RSG with AZOH.
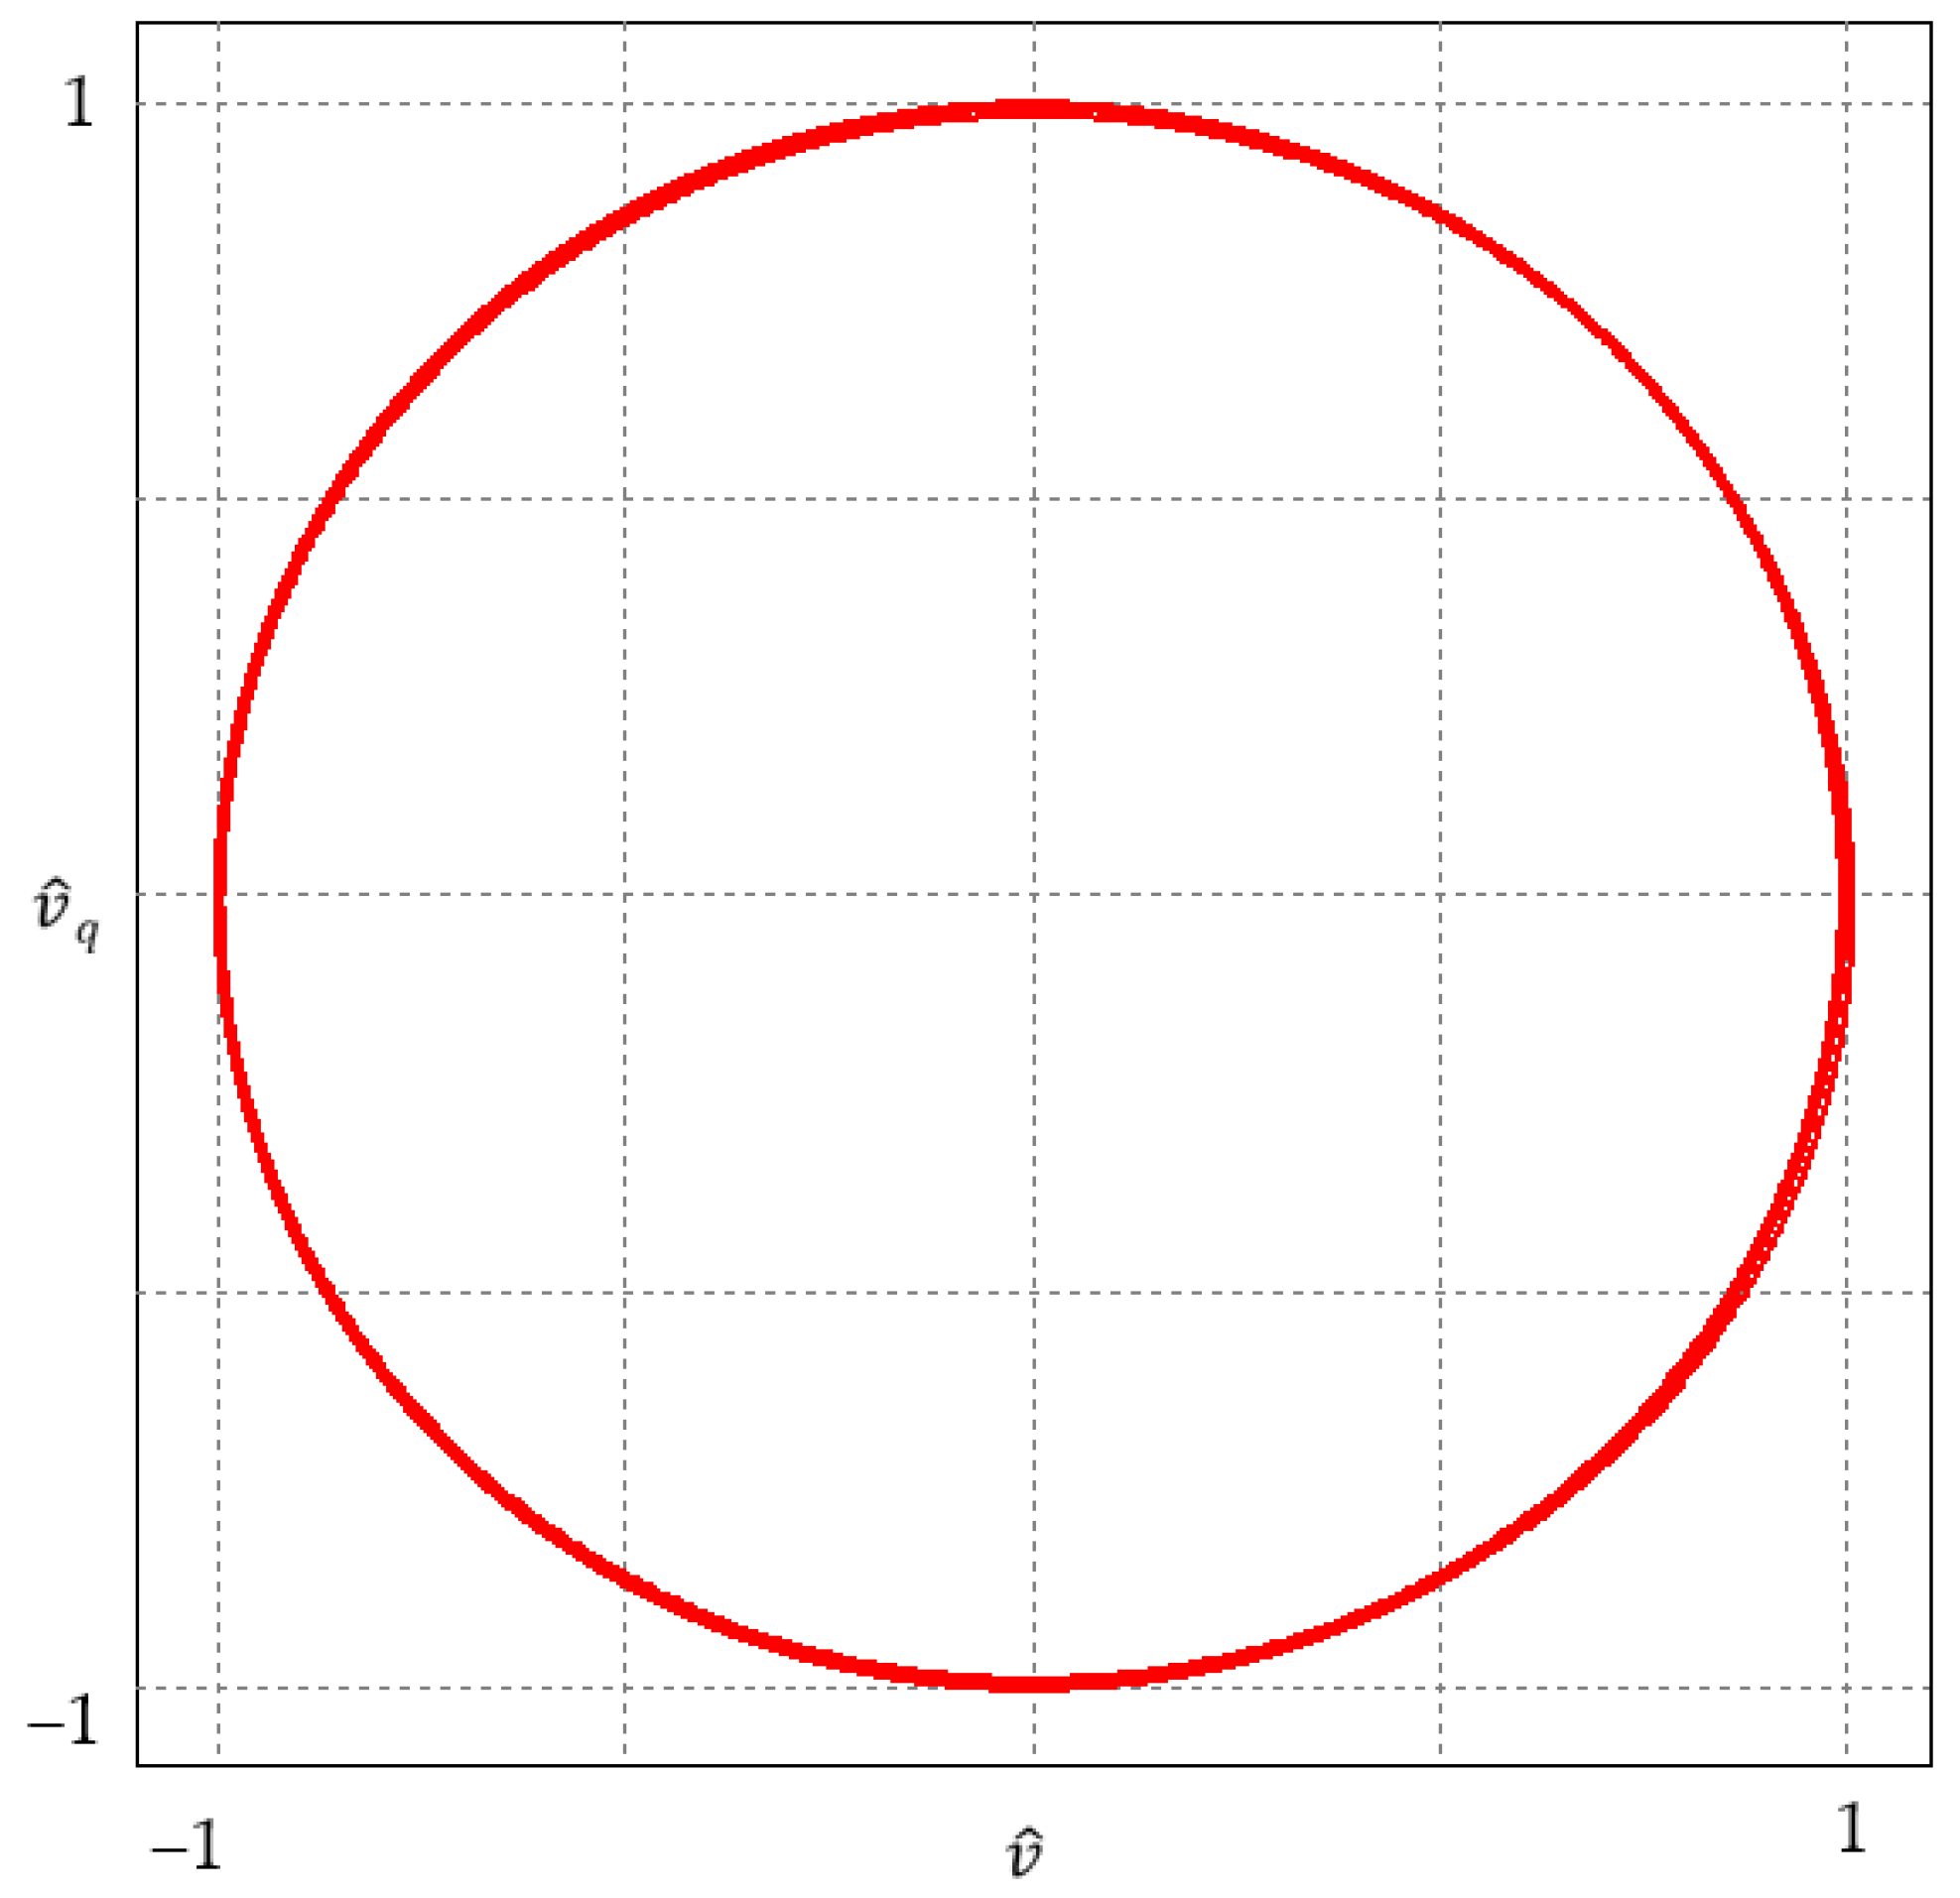
Figure 15.
The trajectory modulus of quadrature signals with a frequency drop of 1.42 Hz per millisecond.
Figure 15.
The trajectory modulus of quadrature signals with a frequency drop of 1.42 Hz per millisecond.
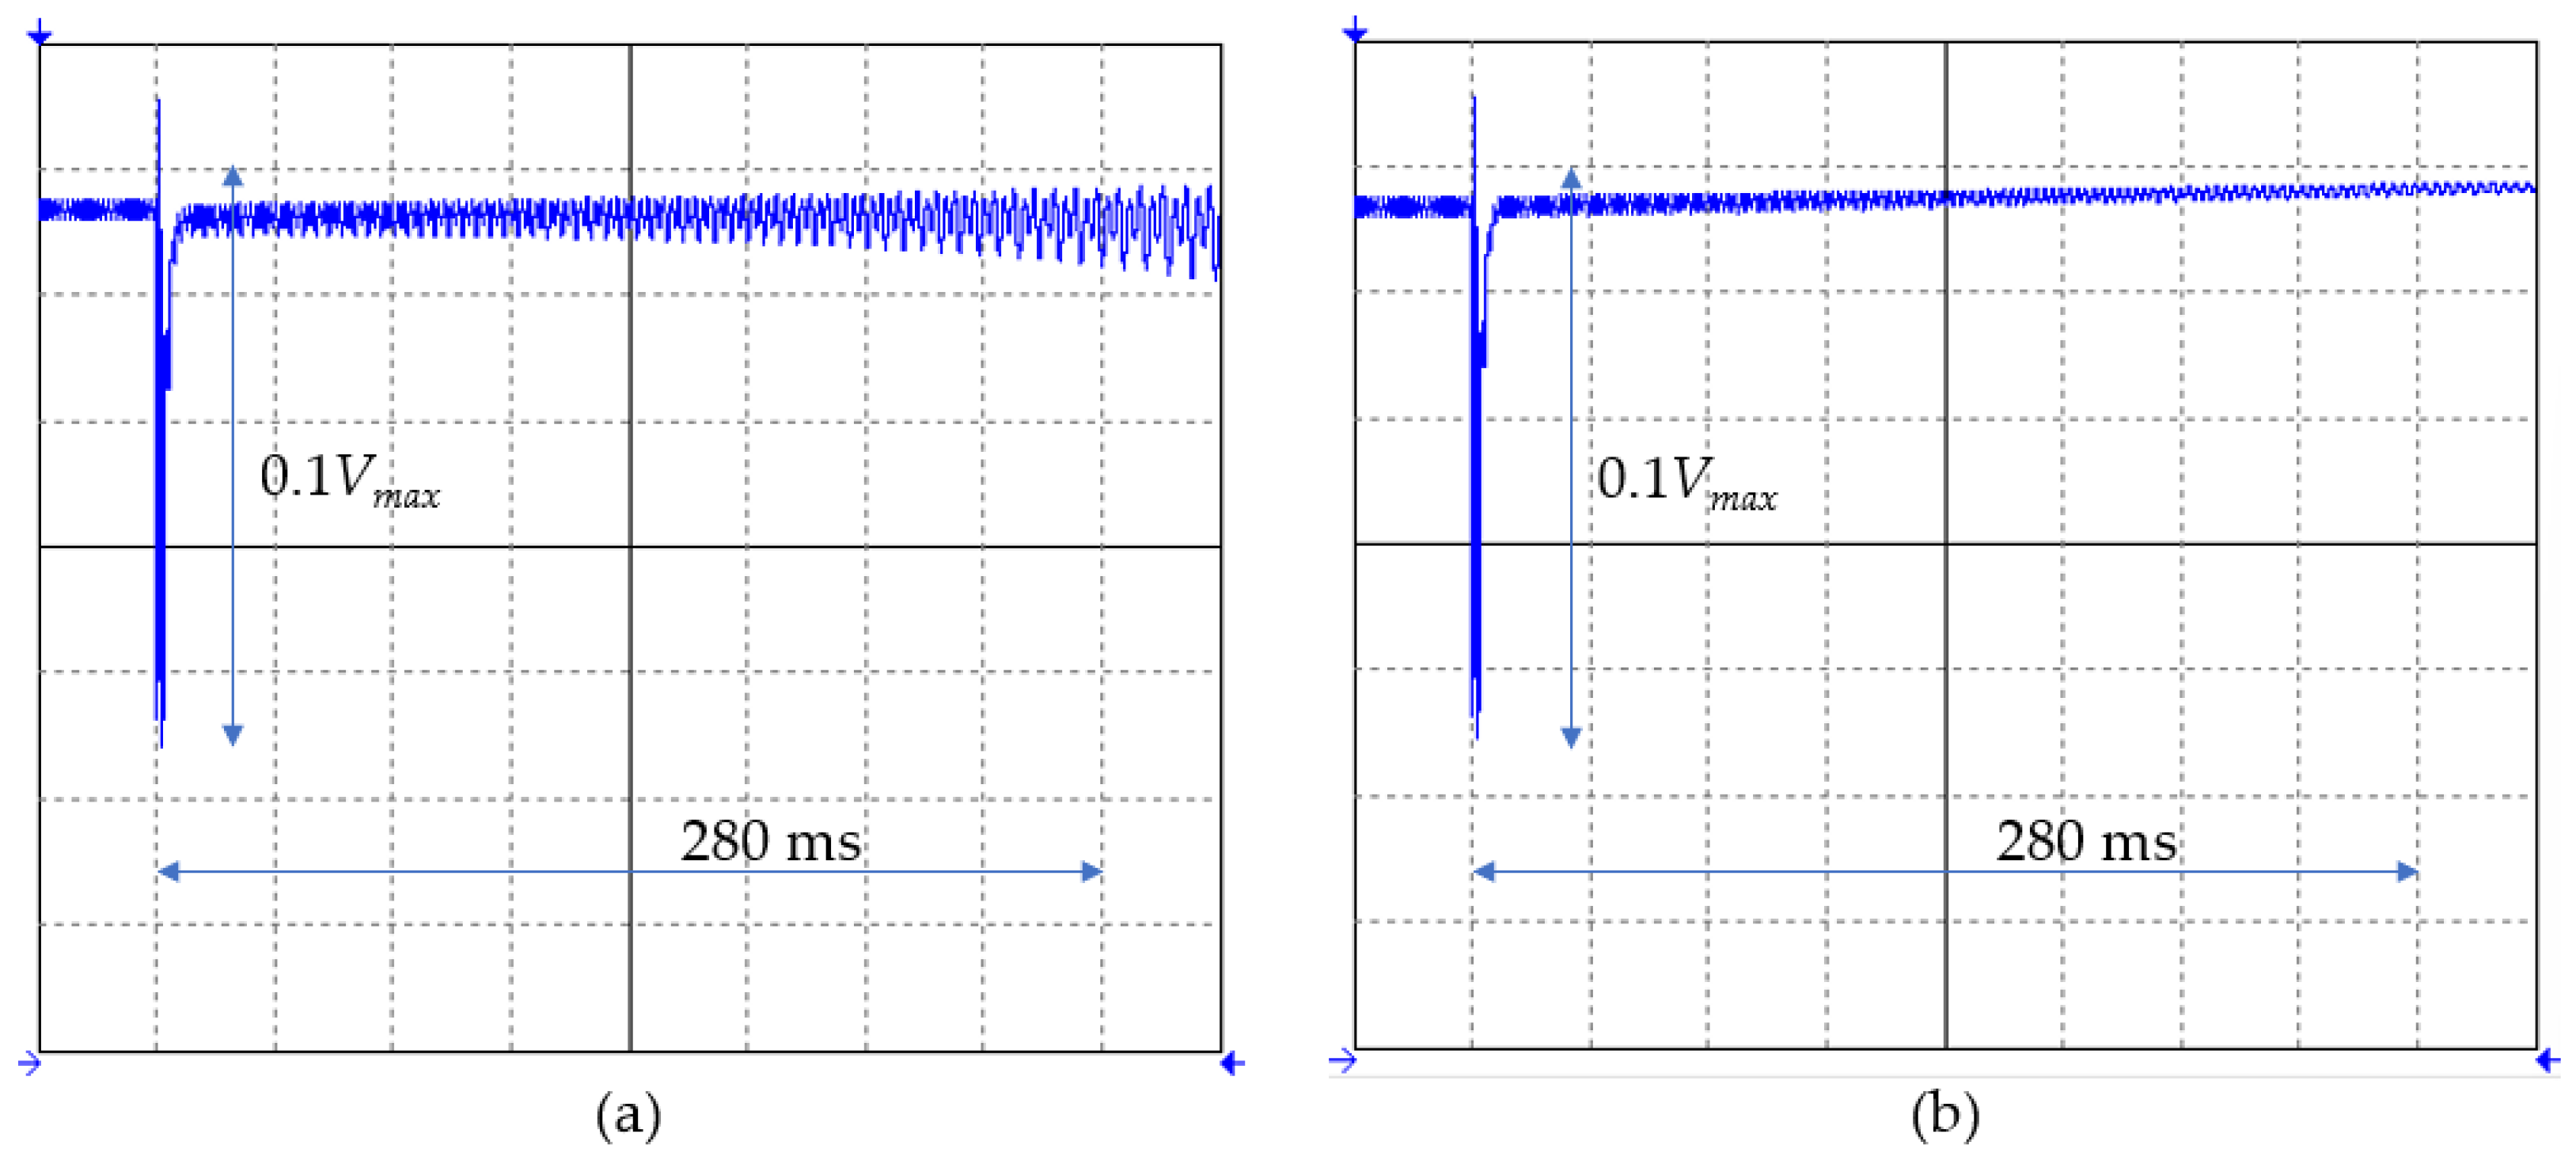
Figure 16.
The trajectory modulus of quadrature signals with a frequency drop of 2.84 Hz per millisecond.
Figure 16.
The trajectory modulus of quadrature signals with a frequency drop of 2.84 Hz per millisecond.
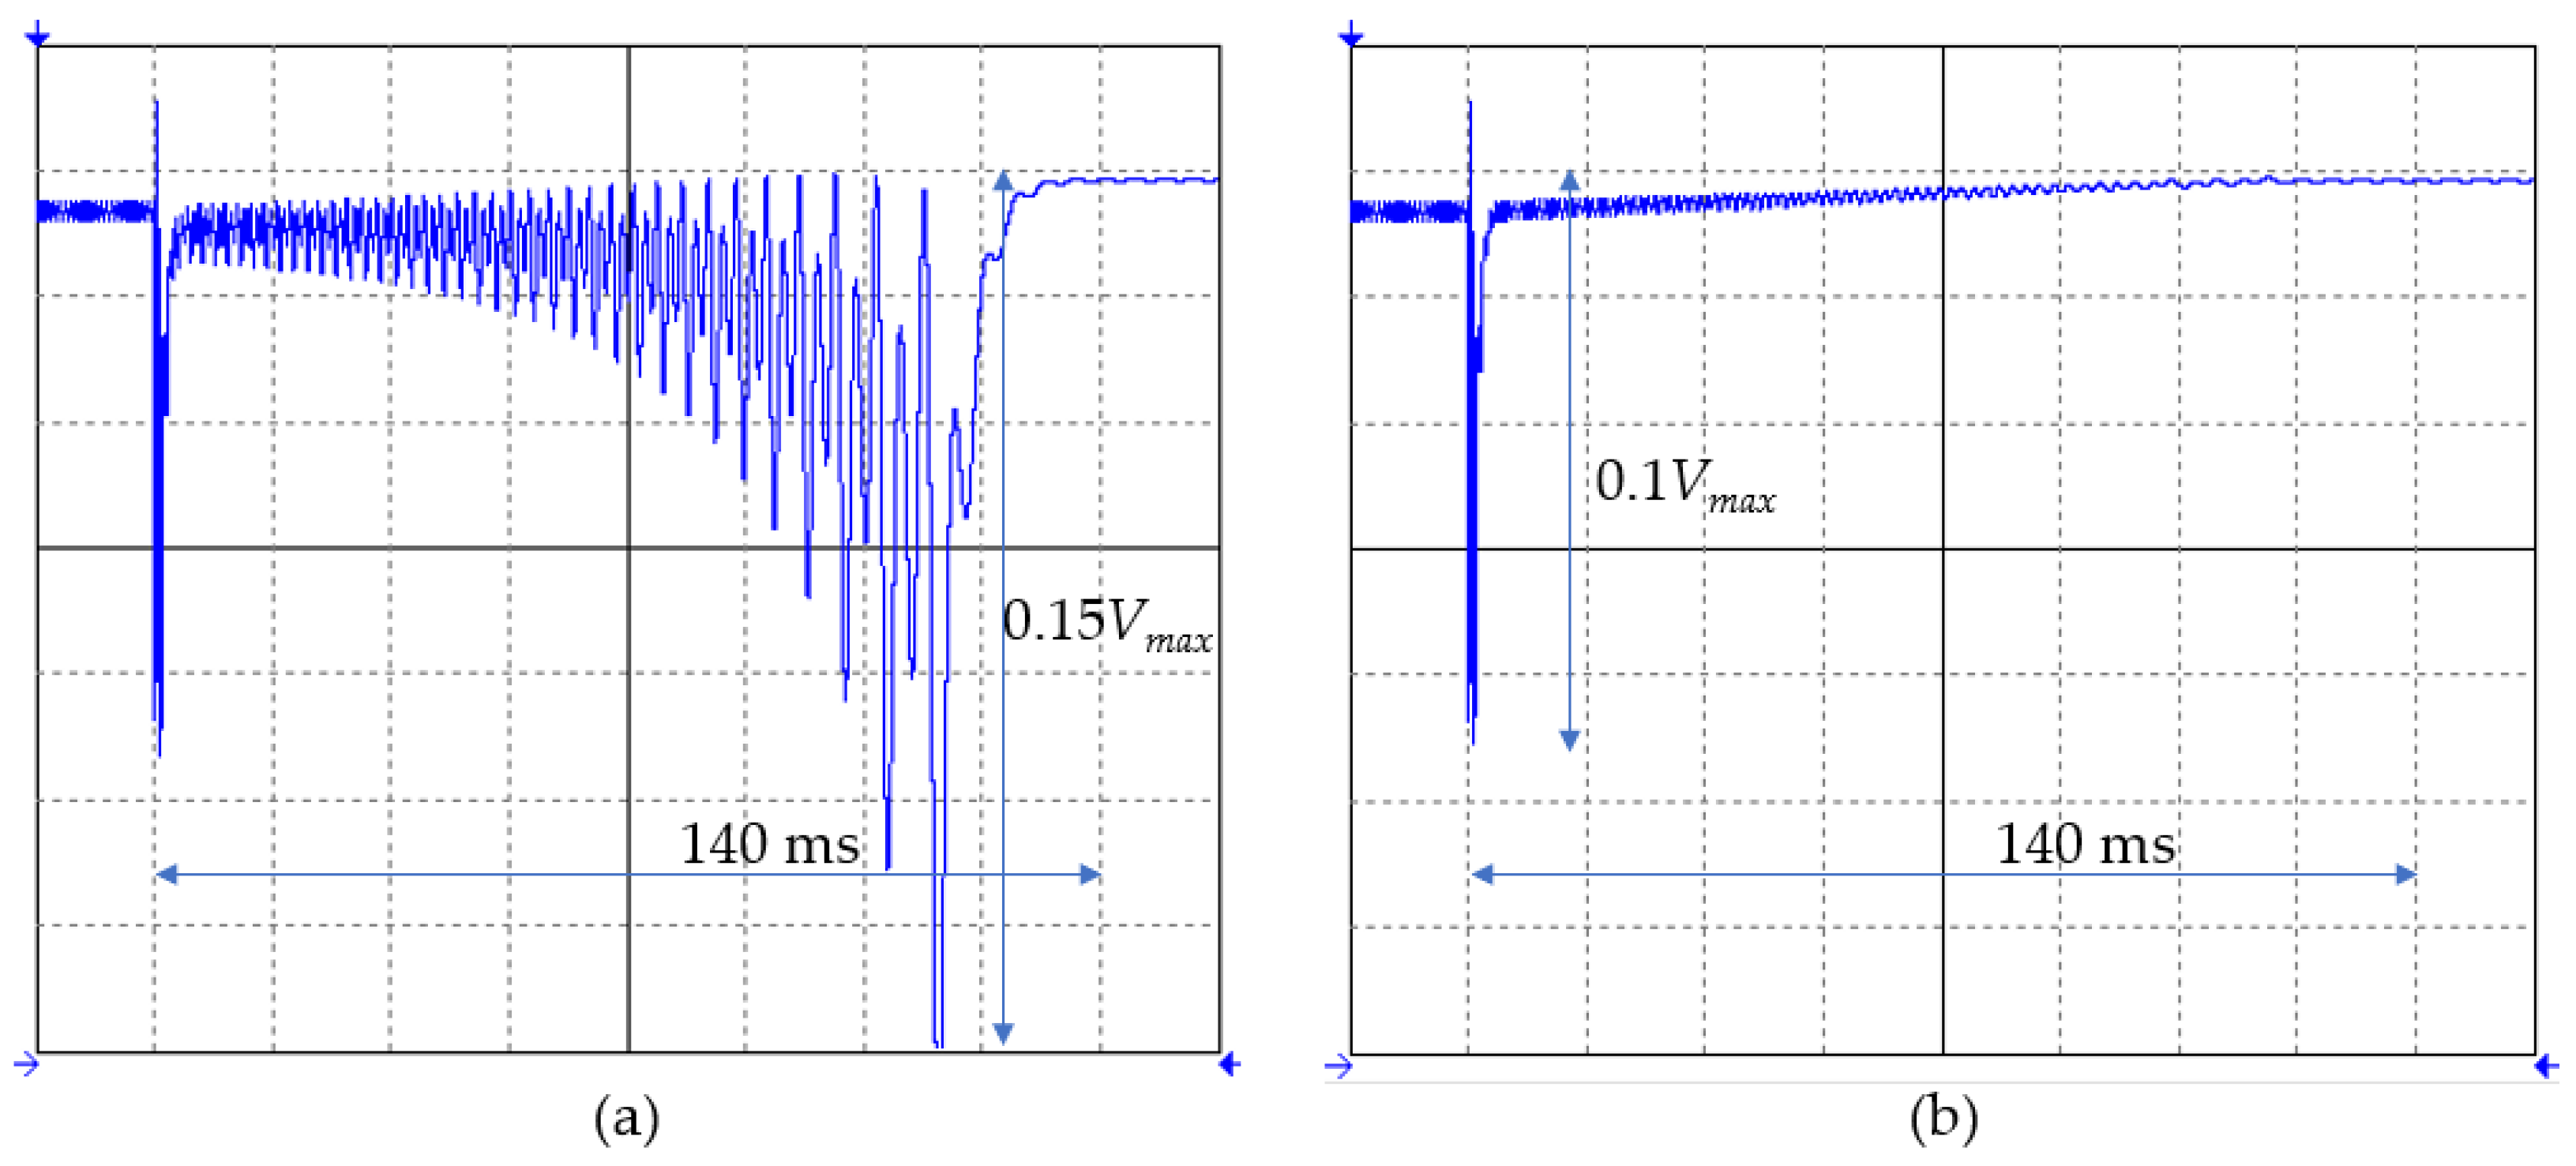
Figure 17.
The trajectory modulus of quadrature signals with a frequency drop of 13.3 Hz per millisecond.
Figure 17.
The trajectory modulus of quadrature signals with a frequency drop of 13.3 Hz per millisecond.
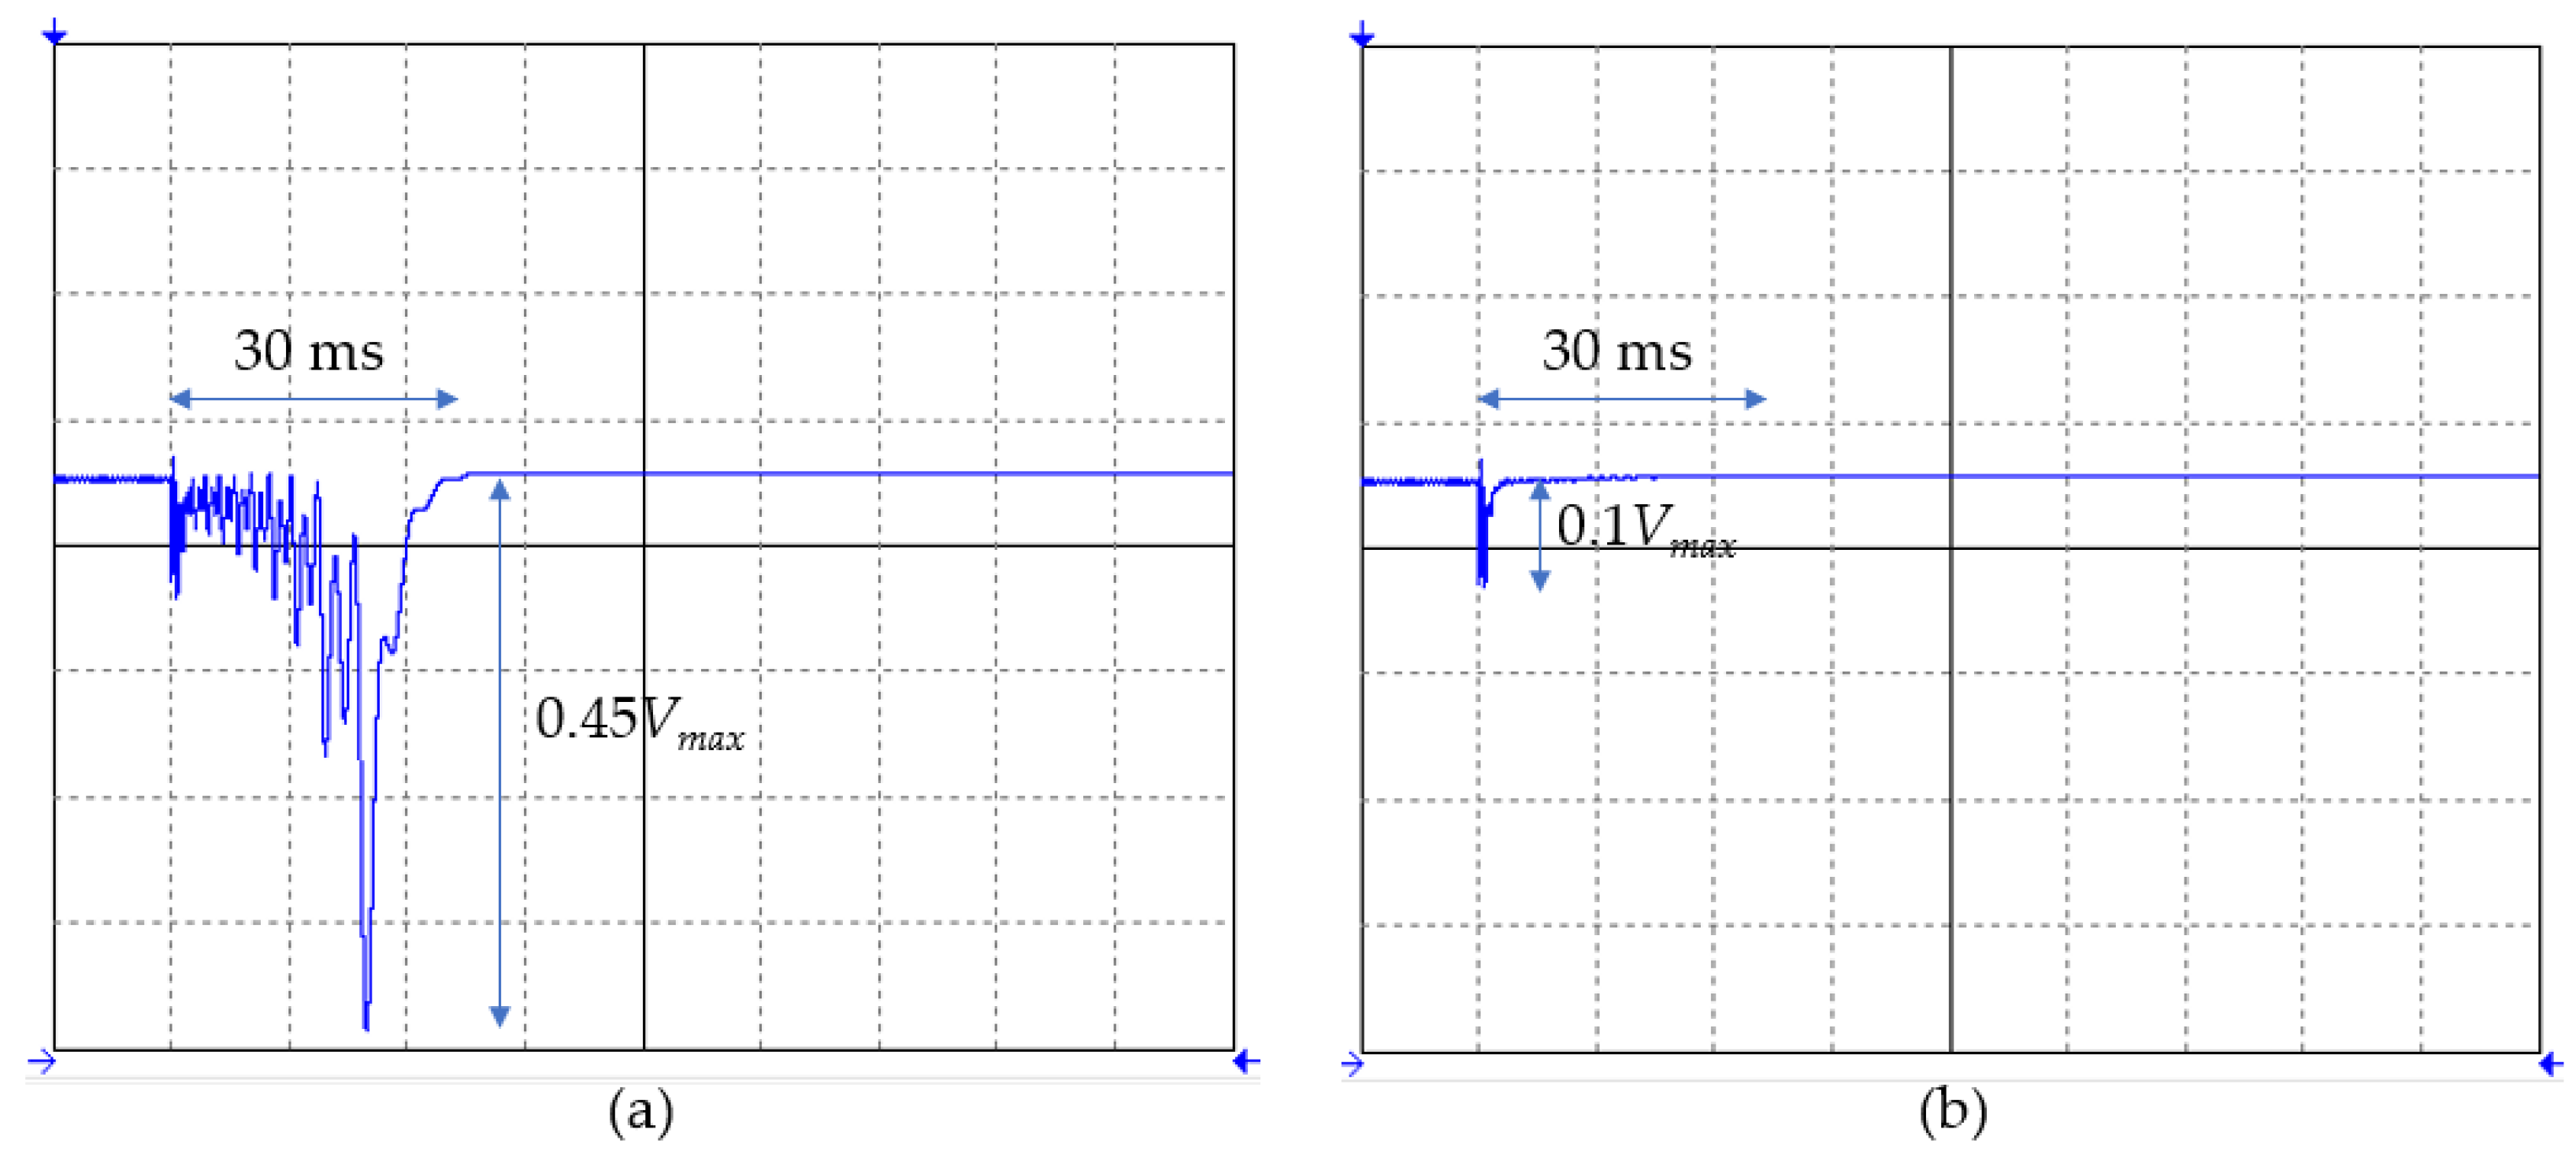
Figure 18.
Percentage change in amplitude of the quadrature signal versus steepness of frequency change.
Figure 18.
Percentage change in amplitude of the quadrature signal versus steepness of frequency change.
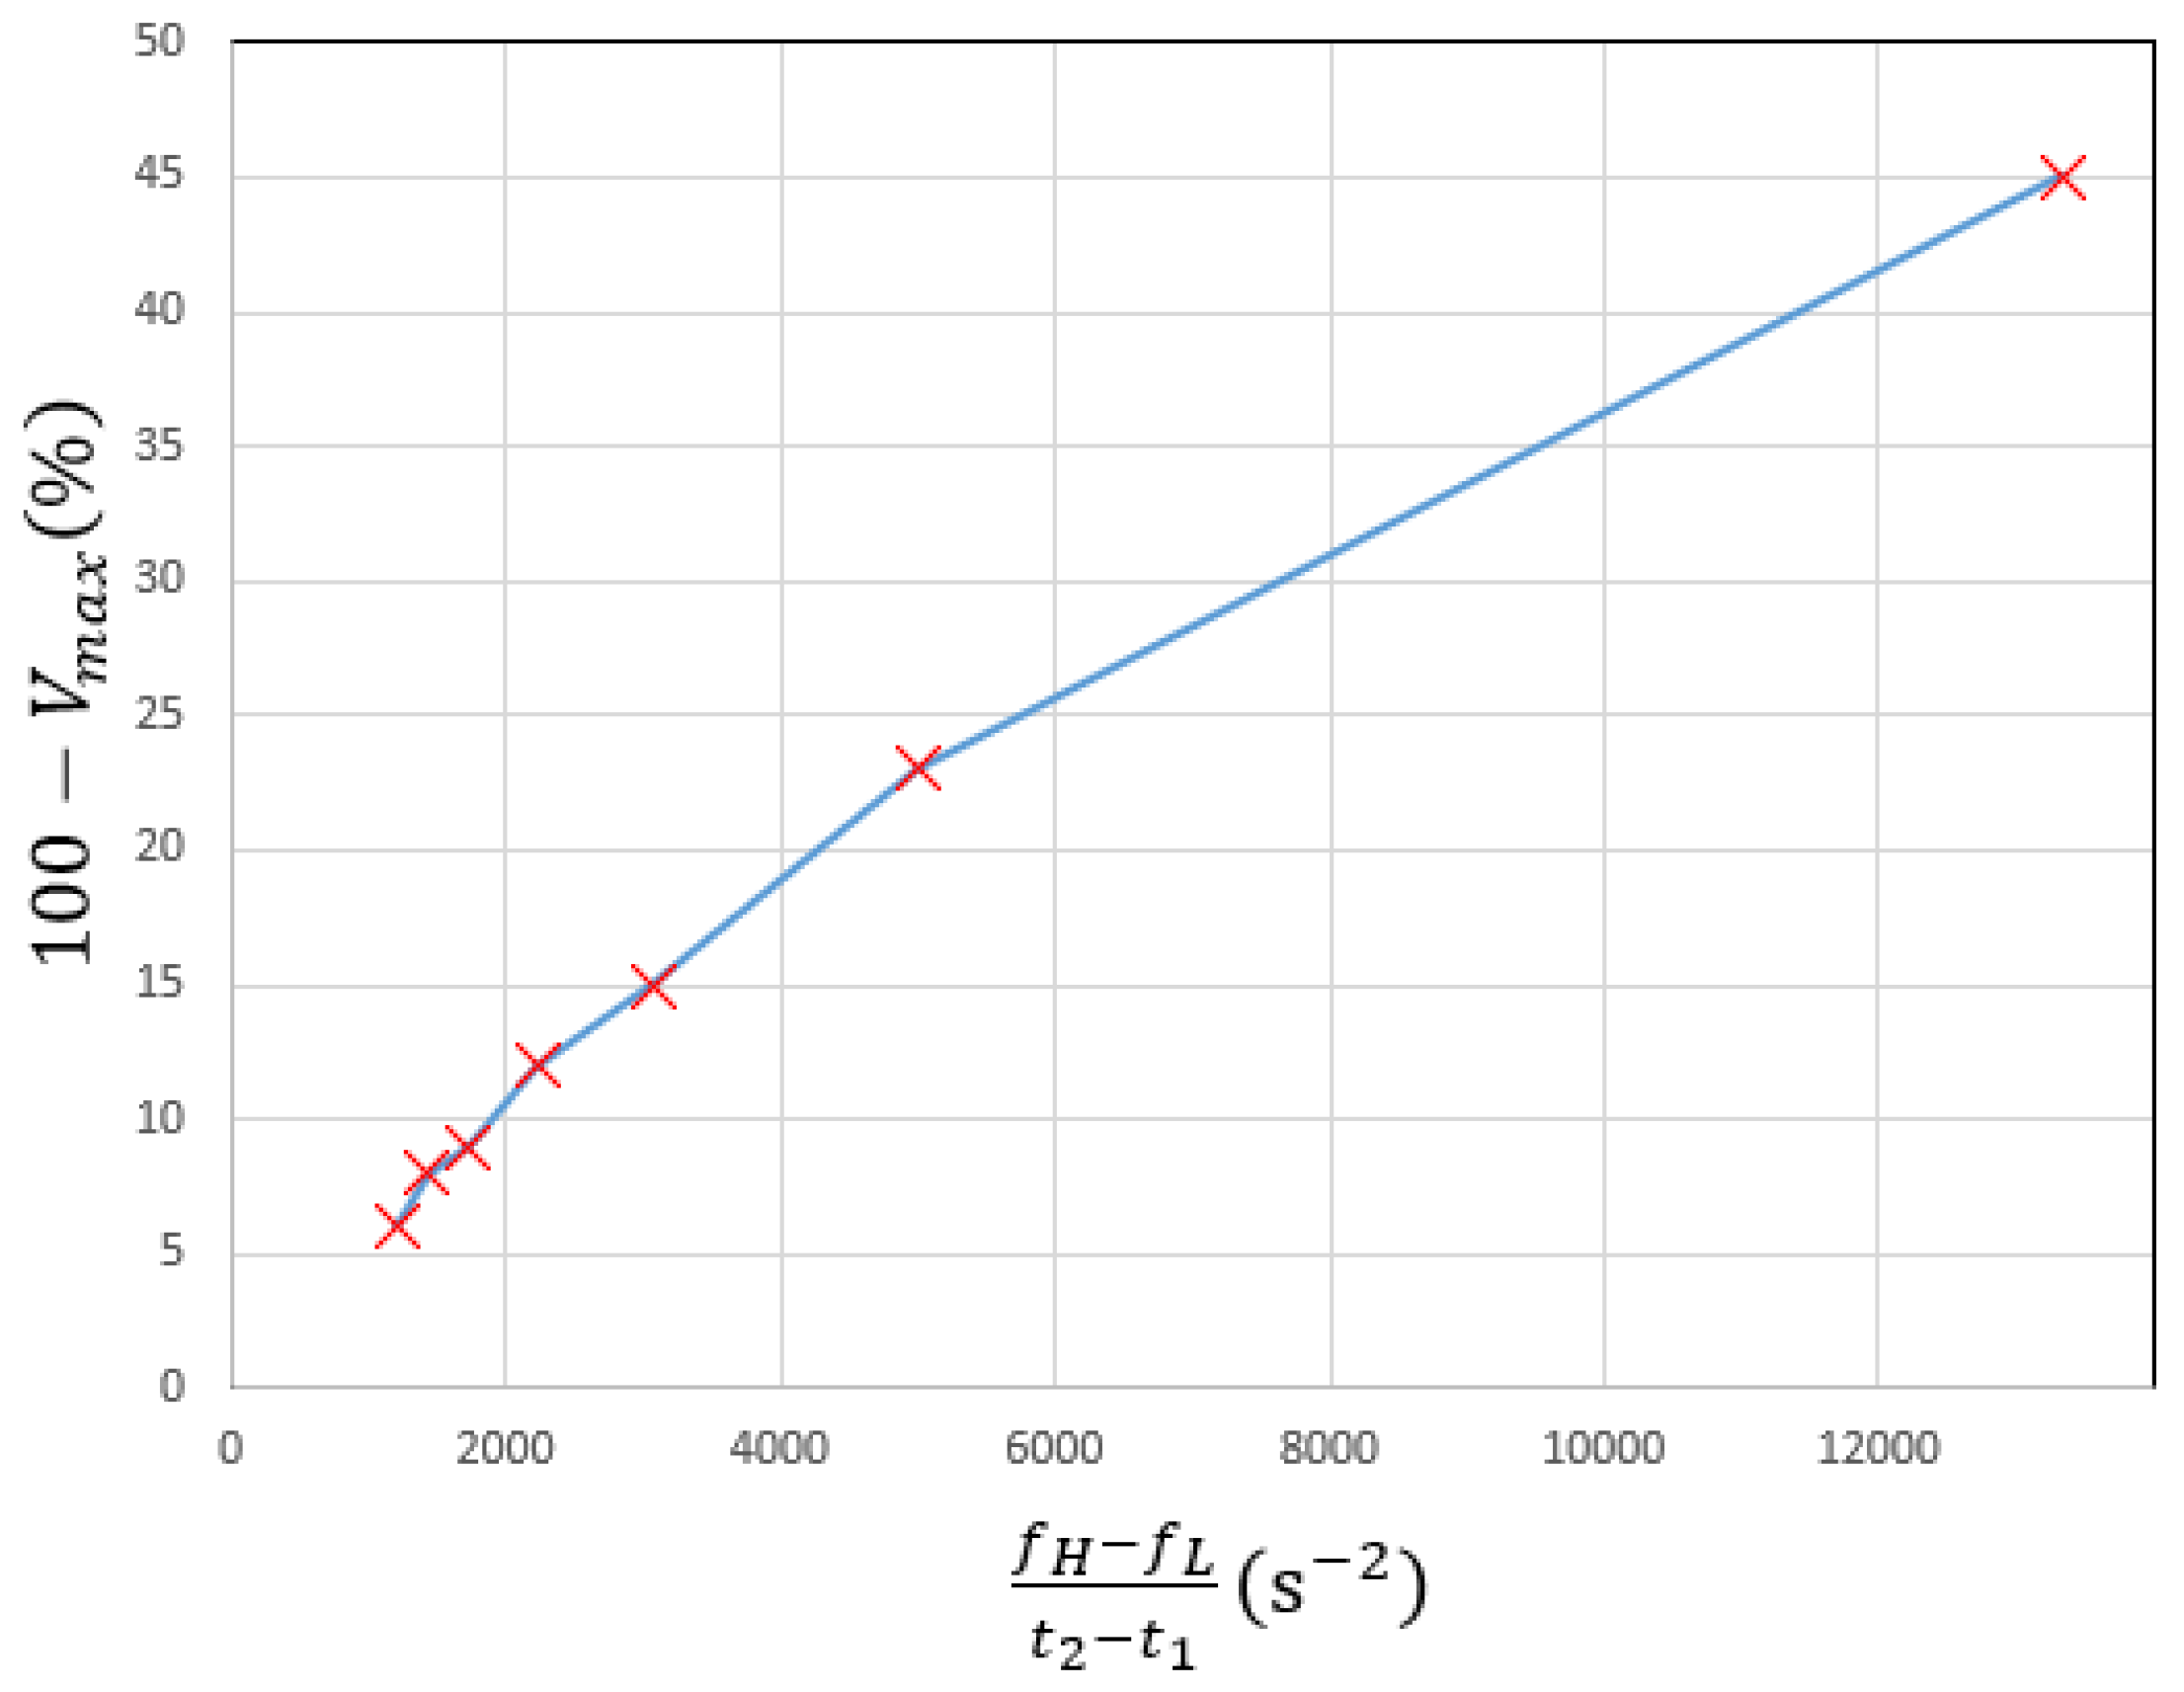
Figure 19.
Current and voltage waveforms of the mains inverter measured on bus 2 with nonzero active component and zero reactive component.
Figure 19.
Current and voltage waveforms of the mains inverter measured on bus 2 with nonzero active component and zero reactive component.
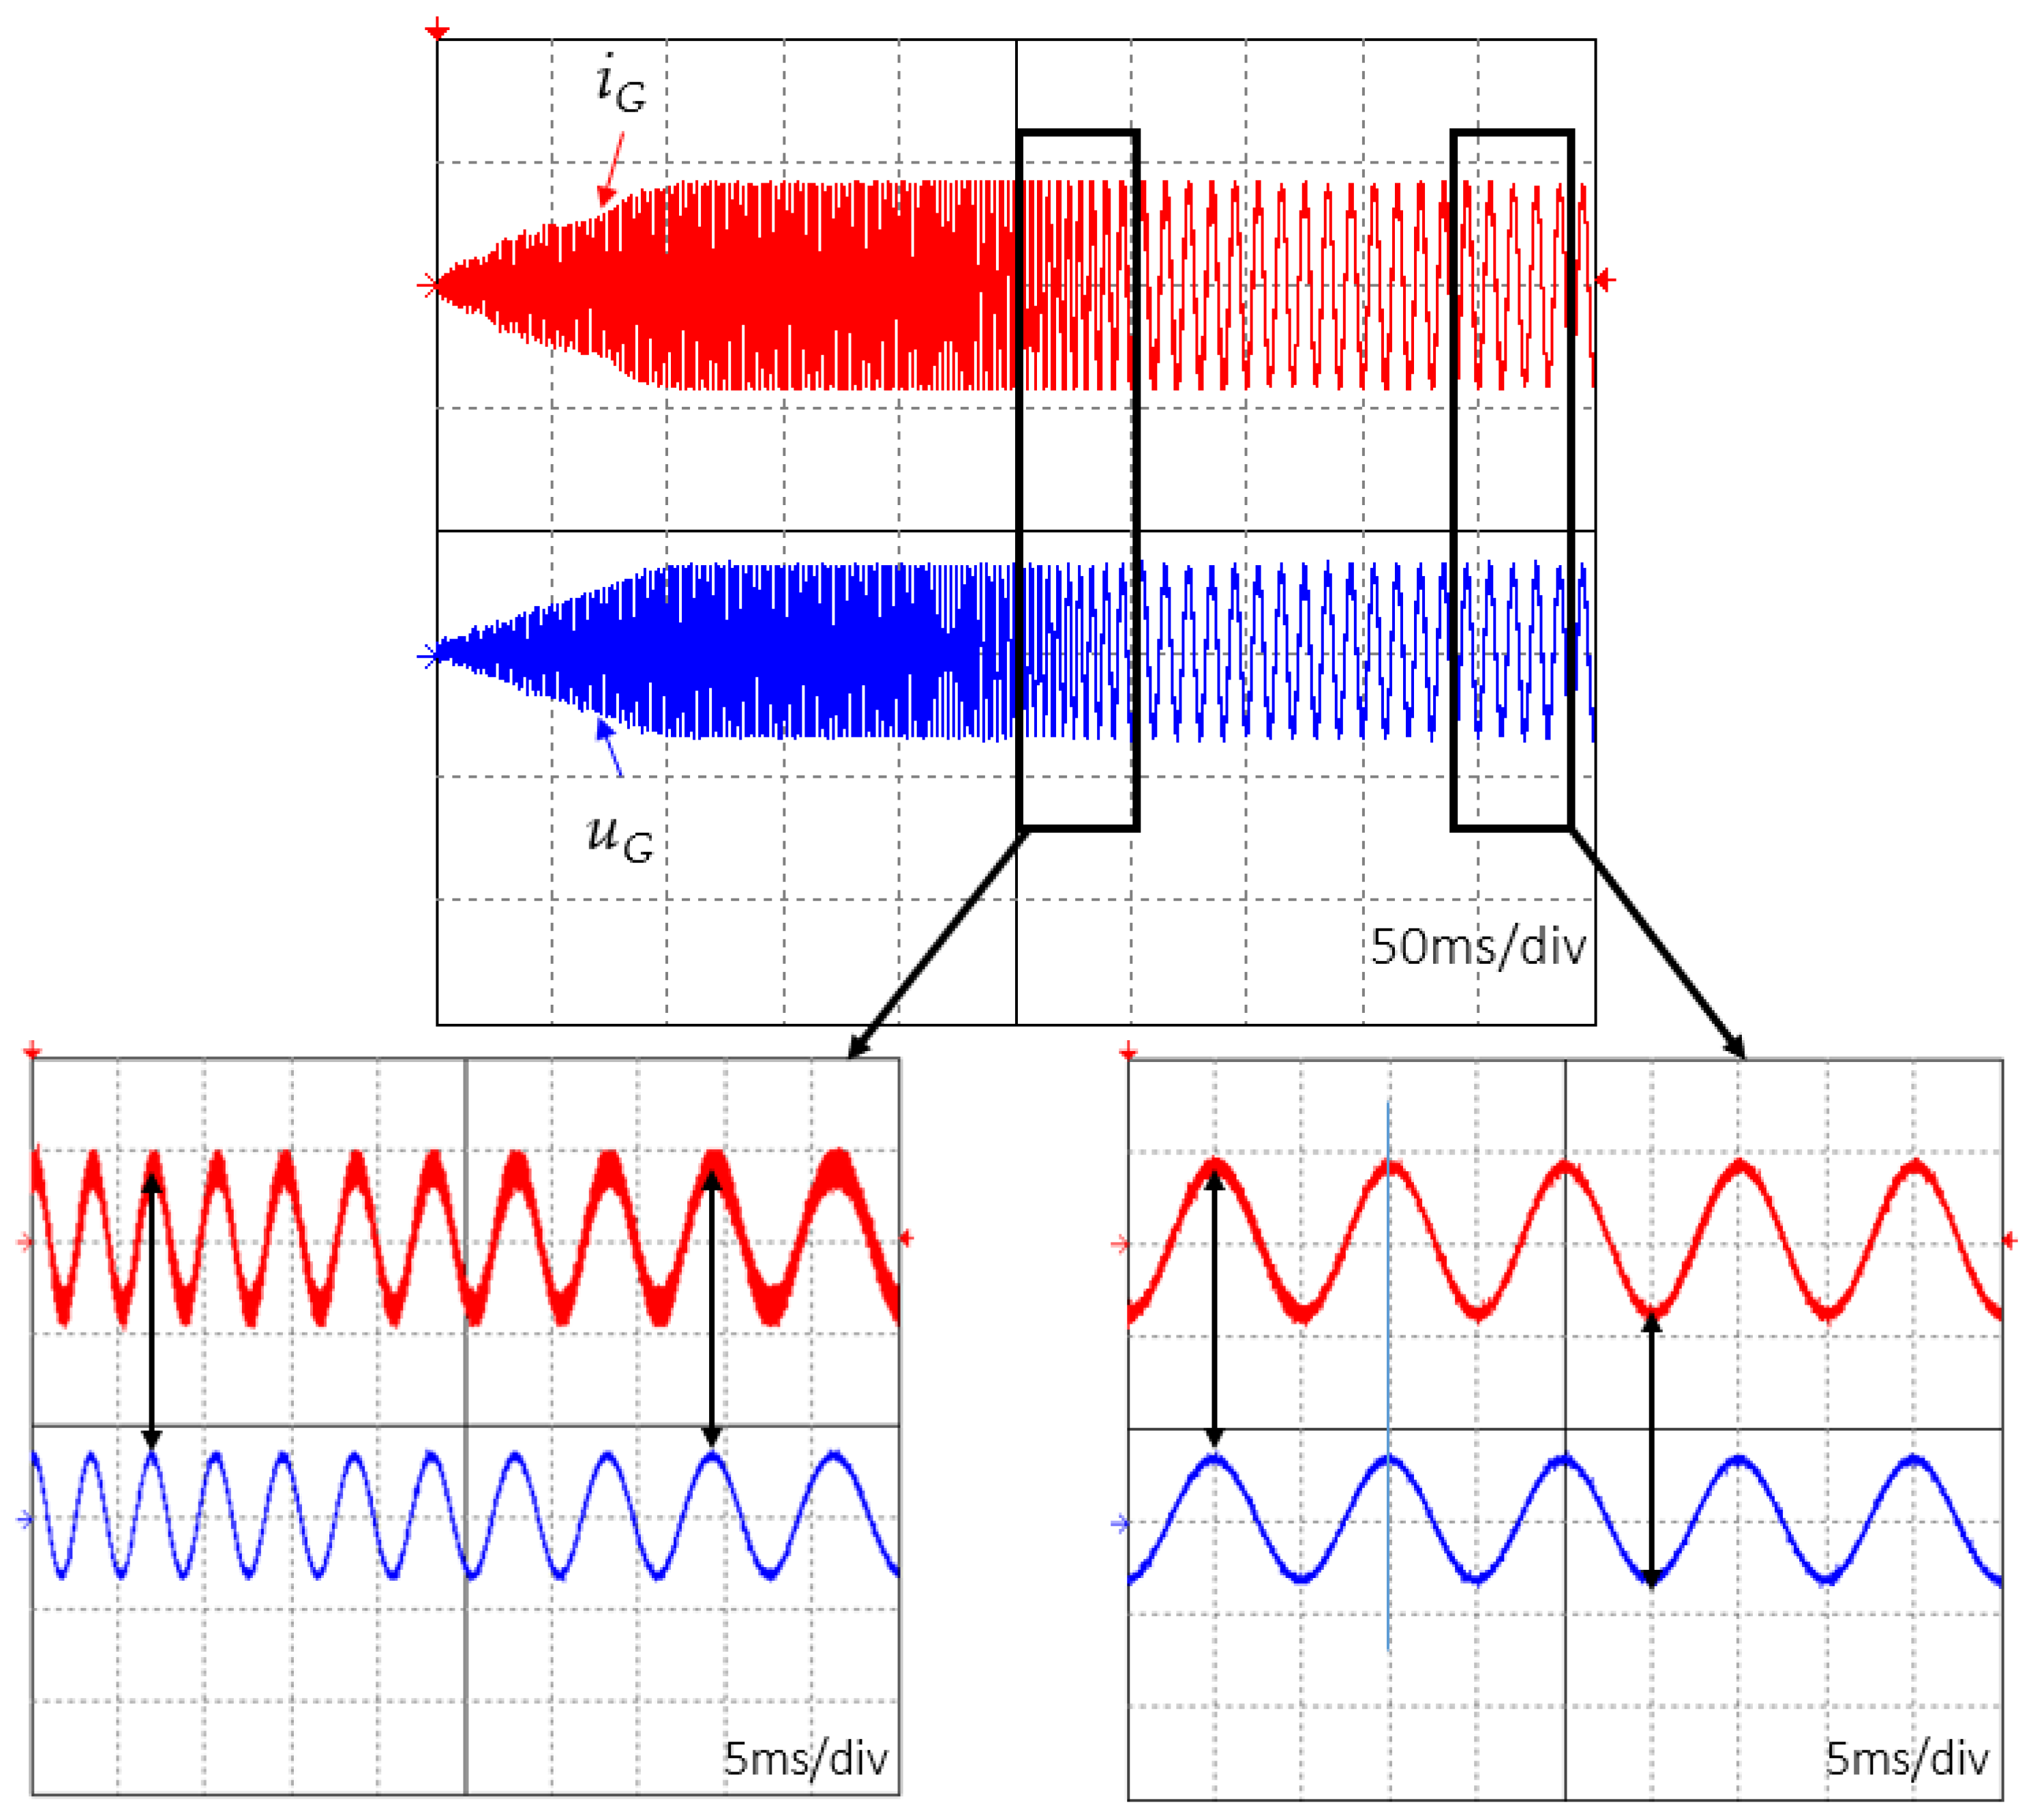
Figure 20.
Current and voltage waveforms of the mains inverter measured on bus 2 with the same active and reactive component.
Figure 20.
Current and voltage waveforms of the mains inverter measured on bus 2 with the same active and reactive component.
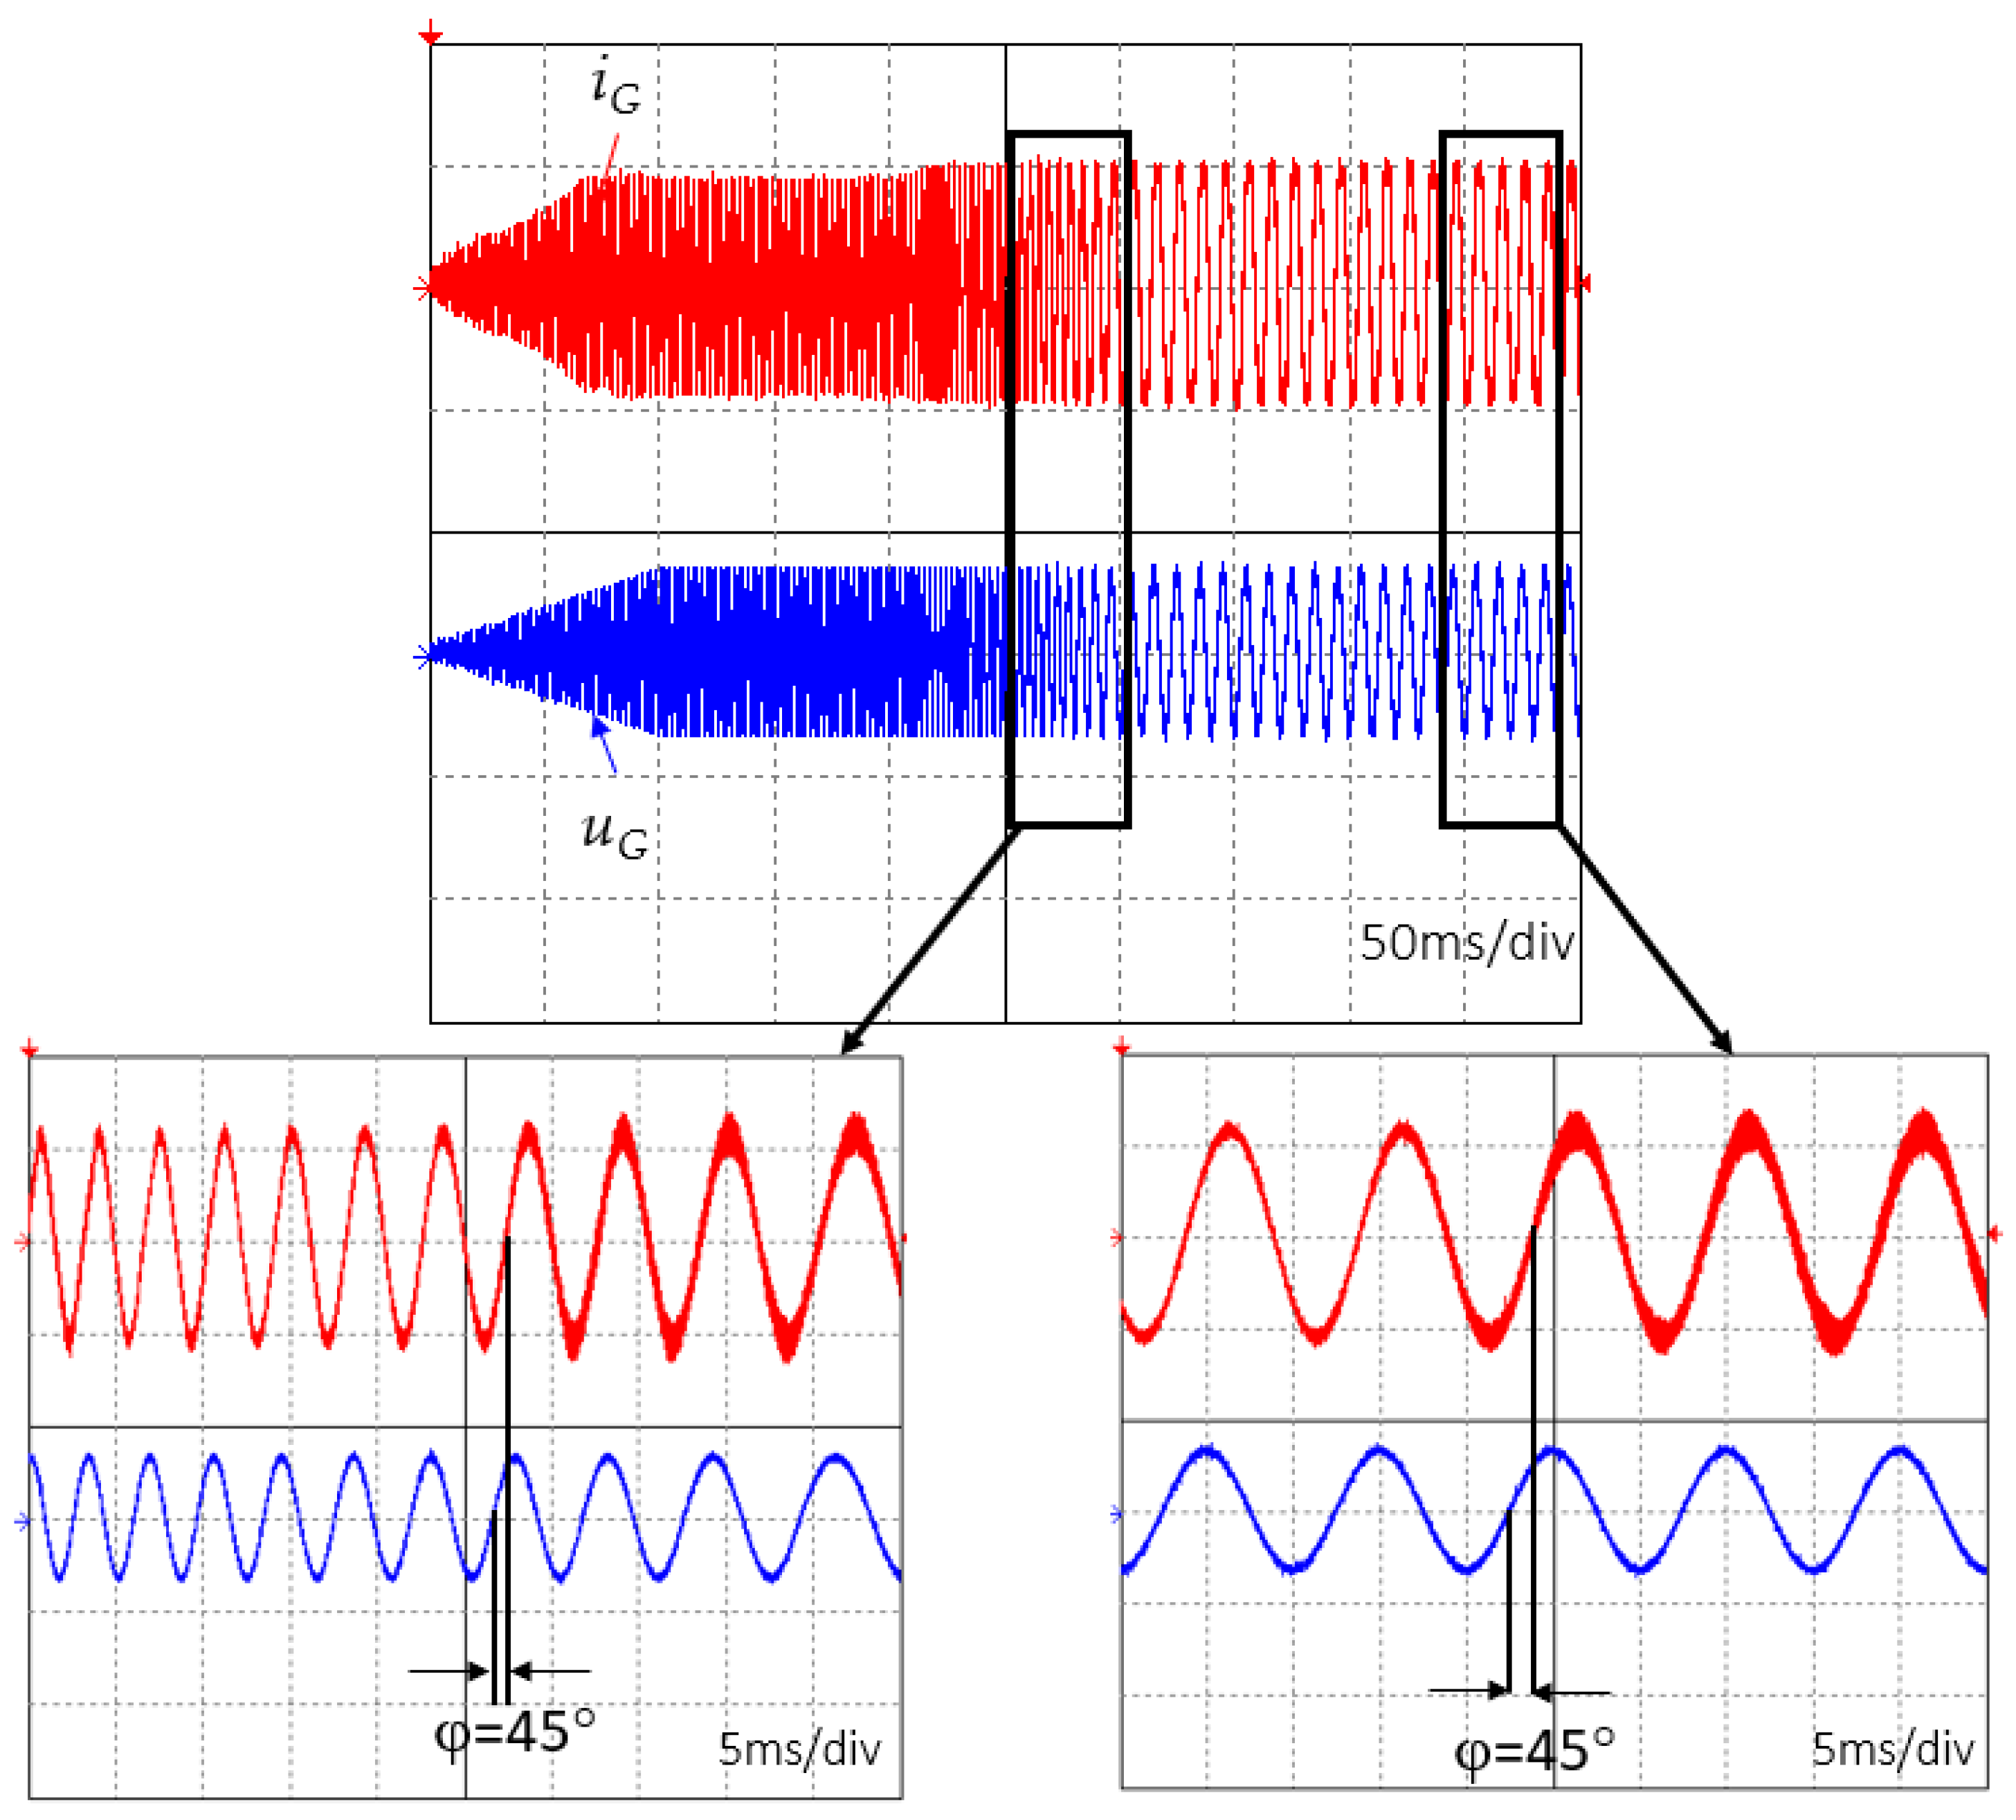

Table 1.
Control system parameters.
| PI | PI2 | P+R |
|---|---|---|
Disclaimer/Publisher’s Note: The statements, opinions and data contained in all publications are solely those of the individual author(s) and contributor(s) and not of MDPI and/or the editor(s). MDPI and/or the editor(s) disclaim responsibility for any injury to people or property resulting from any ideas, methods, instructions or products referred to in the content. |
© 2024 by the authors. Licensee MDPI, Basel, Switzerland. This article is an open access article distributed under the terms and conditions of the Creative Commons Attribution (CC BY) license (http://creativecommons.org/licenses/by/4.0/).
Copyright: This open access article is published under a Creative Commons CC BY 4.0 license, which permit the free download, distribution, and reuse, provided that the author and preprint are cited in any reuse.


