Submitted:
19 November 2024
Posted:
20 November 2024
You are already at the latest version
Abstract
Currently, heating in electric ovens is generally achieved using heaters placed on the top and bottom surfaces. In some advanced ovens, heaters are installed on the back surface, allowing 3D heating. However, in these ovens, temperature measurements are obtained from a single point, making temperature control unreliable. Additionally, because there are no heaters on the left, right, or front surfaces of the oven, homogeneous heating is not possible with this type of oven. In this study, a unique electric oven equipped with heaters and temperature sensors on all six surfaces was designed and produced. Subsequently, the heating model of the oven was derived using the Ziegler-Nichols tangent method, and the gain factors for the proportional (P), proportional-integral (PI), and proportional-integral-derivative (PID) controllers were determined. Furthermore, real-time digital control of the oven was performed using on-off, P, PI, and PID controllers. The experimental results showed that homogeneous heating could only be achieved when all panels were energized. Additionally, the PI and PID controllers stabilized the system with a maximum steady-state error of 4 °C in all cases, demonstrating the accuracy of the derived system model and adequacy of the implemented control system.
Keywords:
Homogeneous heating
; PID tuning
; Temperature control
; Ziegler-Nichol’s tangent method
1. Introduction
Electric furnaces are frequently used in industry and in daily life. Generally, the heating process in these furnaces is performed by taking measurements from a single point using heaters placed on the lower and upper surfaces of the furnace. Therefore, it cannot be determined whether the thermal change in the inner chamber of the furnace is homogeneous. In the literature, the temperature changes in electric furnaces are modeled as first-order plus delay (FOPDT) [1,3]. In line with this model, although different techniques are used for temperature control of the device, proportional plus integral plus differential (PID) control stands out because of its simplicity, performance, and stability [4,5,6,7]. Temperature control of the vacuum sintering furnace was performed in [8]. In this study, traditional PID control, fuzzy control, and auto-adjusted fuzzy-PID control were compared. In [9], a system model of an electric furnace was proposed, and simulation studies of classical PID and fractional-order PID control methods were conducted according to this system model. Furnace temperature control using three PID tuning techniques, namely Ziegler Nichols (ZN), Cohen Coon (CC) and Chien, Hrones & Reswick (CHR) of the PID parameters is proposed in [10]. In [11], temperature control of the heat-pump solar-assisted drying system was carried out using a PID controller. The operating stability of the system was investigated by drying the red pepper. In [12], traditional PID controllers and intelligent control techniques such as fuzzy PID, fuzzy self-adjusting PID, fuzzy immunity PID, and expert PID were compared to eliminate the large overshoot and big swing problem in furnace temperature control. In [13], an adaptive fuzzy control technique was used to control the temperature of the electric furnace. The efficiency of the technique used was compared with that of classical PID and traditional fuzzy controller techniques. In [14], a proportional integral (PI) controller was used to control an inter-heated thermal turbine. The gain parameters Kp and Ki of the PI controller were adjusted using particle swarm optimization (PSO). In [15], temperature control of an electric furnace was performed using a fuzzy PID controller. The performance of the applied control technique was compared with that of a traditional PID controller. A linear low-order model for the temperature control of a tempering furnace was proposed in [16], and a model predictive control was applied. To validate the performance of the proposed model and adaptive observer-based model predictive control, simulation studies were performed, and its performance was compared with that of a PI controller and a nonlinear model predictive controller. Temperature control of biofuel furnaces was realized in [17] using a PID controller. In this study, the Kp, Ki, and Kd parameters were determined using a trial-and-error method. The optimum Kp, Ki, and Kd weighting factors were determined based on the system control performance, steady-state error, overshoot size, rise time, and settling time. By combining the simple nature of PID control with the strong reasoning of fuzzy rules, an adaptive fuzzy PID controller for a resistive furnace system was designed in [18]. The efficiency of the proposed method was compared with that of a conventional PID controller. In [19], a heat-pump solar-collector dryer was designed and controlled using a PID controller. In this study, temperature control, with an accuracy of approximately ± 0.369 °C, was performed at a reference temperature of 40 °C. In [20], temperature control of a glass melting furnace was carried out for a television picture tube. As a control method, a hybrid control system was proposed by combining a fuzzy logic controller and a PI controller. The proposed hybrid controller was implemented in a real production furnace at the Samsung-Corning Company, Suwon, Korea, and its performance was investigated. Although different control theories for furnace temperature control have been proposed in these studies, none of them investigated the homogeneity of the thermal change in the heater chamber of the furnaces.
In the literature, the distribution of thermal changes in heater chambers of different furnace types has been investigated. In [21], three-dimensional temperature measurement of a gas-fired pilot tube furnace was performed. The temperature distribution of the furnace was determined using the DRESOR method based on radiation image processing technology, with the help of four flame image detectors placed in the heater chamber. The accuracy of the measurement results was compared with the data obtained using the thermocouples. In [22], a three-dimensional temperature distribution in large-scale boiler furnaces was visualized. Radiative energy images were obtained using cameras placed around the furnace. A modified Tikhonov regularization method was proposed to obtain a three-dimensional temperature distribution using these data. In [23], a one-dimensional mathematical model describing the gas flow of a tunnel kiln, heat transfer between the brick and air, and evaporation of bound water in the brick was proposed, and simulation studies were conducted. In [24], a new tomography detector was proposed to determine the three-dimensional flame temperature distribution in a furnace. The proposed sensor was used to detect the three-dimensional temperature distribution of semi-industrial fuel-oil flames. The performance results of the proposed sensor were compared with those obtained using color pyrometry. In [25], the temperature change in an aluminum melting furnace was observed using optical sensors. A light receiving camera was placed in the upper part of the oven. Using this camera, a new method was proposed that allows the user to objectively evaluate the melting process in the furnace. In [26], a three-dimensional temperature distribution was observed in a tangentially fired furnace. Flame images inside the furnace were measured at different angles using a camera placed inside the furnace. To determine the three-dimensional thermal distribution in the inner chamber of the furnace with minimum error, the measurements obtained from different angles were combined with the proposed solution algorithm. The efficiency and applicability of the proposed algorithm were verified through experimental tests. In [27], the three-dimensional homogeneous thermal change in reflow furnaces depending on the internal convectional coefficient was investigated. A three-dimensional internal convection coefficient map of the reflow oven was obtained from the data obtained using the measuring probes. Based on this map, the convection efficiency of the heater chamber of the reflow brazing furnace was investigated. The results of these studies indicate that homogeneous temperature distribution in the heater chamber of the oven cannot be achieved with the heating process applied from a single region.
In this study, a three-dimensional heating electric furnace was designed, fabricated, and controlled. The heaters and PT100 temperature sensors were located on all six inner surfaces of the oven to achieve homogeneous heat distribution in the chamber. PID control of the heaters on the entire surface was performed separately with the help of the driver cards. Thus, the heating process from the x-, y-, and z-axes of the furnace was conducted in three dimensions. The system model of the furnace and Kp, Ki, and Kd parameters were determined using the ZN method. The on-off, proportional (P), proportional plus integral (PI), and proportional plus integral plus derivative (PID) control methods were applied to the furnace. The time responses of the applied control techniques such as overshoot, rise time, offset error, integration of absolute error (IAE), integration of square error (ISE), integration of time-weighted absolute error (ITAE), and integration of time-weighted square error (ITSE) metrics were calculated and analyzed. In addition, the noise originating from the network was minimized by applying zero-crossing circuits to the driver unit. The results of the experimental studies indicated that a homogeneous thermal distribution was achieved in the heater chamber of the furnace within an acceptable error range. The original contributions of this study are as follows.
- An original oven with heaters and temperature sensors on six surfaces was designed, modeled, and temperature controlled.
- Temperature measurements were taken at six different points inside the oven, and each heater on the six surfaces of the oven was controlled separately.
- It was demonstrated that homogeneous heating is not possible in electric ovens unless there are heaters on all six surfaces and the temperature of each heater is controlled.
- The heaters were switched at zero crossings of the main voltage to prevent sudden current draws and noise generation on the mains.
2. Materials and Methods
2.1. The On-Off Control
The on–off control system is the simplest control method, and it is frequently encountered in industry and in our daily lives [28]. This system is used in heaters, air conditioners, ovens, combined boilers, and many other devices. In the on-off control technique, a set point is determined according to the state of the system to be operated. If the system has a value below this set point, it continues to operate. If the system produces a value greater than the set point, it stops working and attempts to fix the system at the set point [29]. There are no intermediate values for an ideal on-off control system. In other words, the system oscillates at a set point and performs continuous opening and closing operations. This causes the lifetime of the system used during the continuous opening and closing process, and the components that make up the system to decrease. For this reason, a band gap or hysteresis below and above the system set value is generated, and the system is prevented from being continuously on and off [30]. Thus, more accurate operation of the system is ensured, and the durability of the system units is extended. This control system can also be used to control parameters, such as temperature, pressure, speed, acceleration, and position.
2.2. PID Control
PID control is widely used in control systems because of its sensitivity and practicality. PID control systems are generally used to control unstable systems [31]. In this control method, the control signal is obtained by combining three proportional, derivative, and integral actions [32]. Here, an integral action is used to minimize and eliminate the offset error in large changes in the system. Derivative actions are generally used to reduce errors that occur during sudden changes. Thus, the error is maintained within the desired limits using PID control in situations that may occur in the system [33]. Figure 1 shows a block diagram of the PID-controlled system.
As shown in the block diagram in Figure 1, the error signal (e(t)) is obtained from the difference between the system output and set point [34,35]. The up(t), ui(t), and ud(t) control signals were obtained after the error signal passed through the differential, proportional, and integral modes, respectively. A mathematical description of the PID controller is given in (1) [36,37].
By taking the Laplace transform of (1), (2) can be obtained.
The transfer function of the PID controller is obtained by arranging (2) and is defined as in (3) [38].
2.3. Error Area Based Performance Criteria
The error area is defined as the area between the system response curve and the reference curve. The commonly used error area criteria in the literature are given by Eq. (4), (5), (6), and (7) [39].
Where t is the time, T is the period, and |.| shows the absolute values.
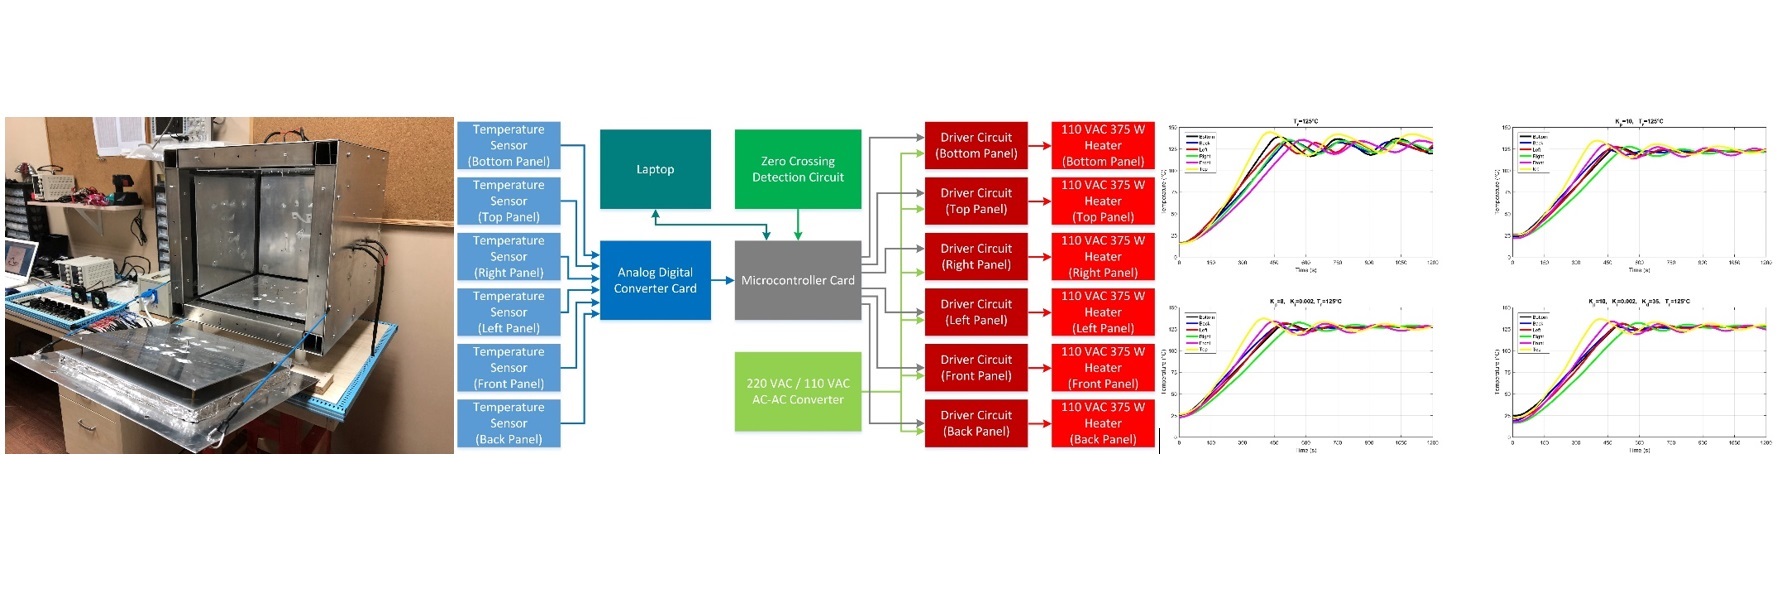
2.4. General Description of the System
A block diagram of the digitally controlled electric furnace is shown in Figure 2. The furnace consisted of three main components: mechanical, electrical, and software components. The mechanical part consisted of the outer main body of the oven, heaters, and sensors. The second component, the electrical unit, has a microcontroller card, zero-crossing detection circuit, ADC card, and driver circuits. The third and last component, the software part, consists of the control software running on a laptop computer and the embedded software running on the microcontroller.
2.5. Mechanical Part
The mechanical component of the electric furnace was produced in three stages. In the first stage, the main body of the electric furnace was formed, and the furnace was produced as a 60 cm × 60 cm × 60 cm cube. The oven was composed of four 60 cm × 5 cm × 5 cm and 12 50 cm × 5 cm × 50 cm aluminum profiles. Subsequently, the panels of the electric furnace were formed. Aluminum plates (60 cm × 60 cm) were used in the panels, and each panel consisted of five layers. An aluminum plate of 45 cm × 45 cm × 0.3 cm to radiate the heat generated by the resistance. The second layer contains a 375 W heater and a PT100 temperature sensor. The third layer was an aluminum plate with dimensions of 45 cm × 45 cm × 0.3 cm and fixed to the second layer with a copper distance of 2 cm. The fourth layer was filled with 2.2 cm thick rock wool that could withstand a temperature of 750 °C to provide thermal insulation. A 60 cm × 60 cm × 0.3 cm aluminum plate was used on the fifth layer to form the outer surface of the oven. The mechanical part of the electric furnace was completed by combining the panels and cup. Figure 3 shows a general view of the oven.
2.6. Electrical Part
The electrical component consists of three basic components. The first is the converter unit, which converts the analog data received from the sensors to digital data. The second part is the zero-cross-detection circuit, which enables the driver board to trigger. The last unit was the heater driver board.
2.6.1. Analog Digital Converter Card
The ADC card digitally converts the temperature detected by the PT100 sensor. Temperature changes in the resistors caused resistance changes in the PT100 sensor. This resistance change was transformed into a voltage change with the ADC interface card. Subsequently, this voltage change was digitized with an Arduino Mega microcontroller card and transferred to a laptop via the USB port. A schematic diagram of the ADC interface card produced in Figure 4 and a printed circuit board drawing are shown in Figure 5.
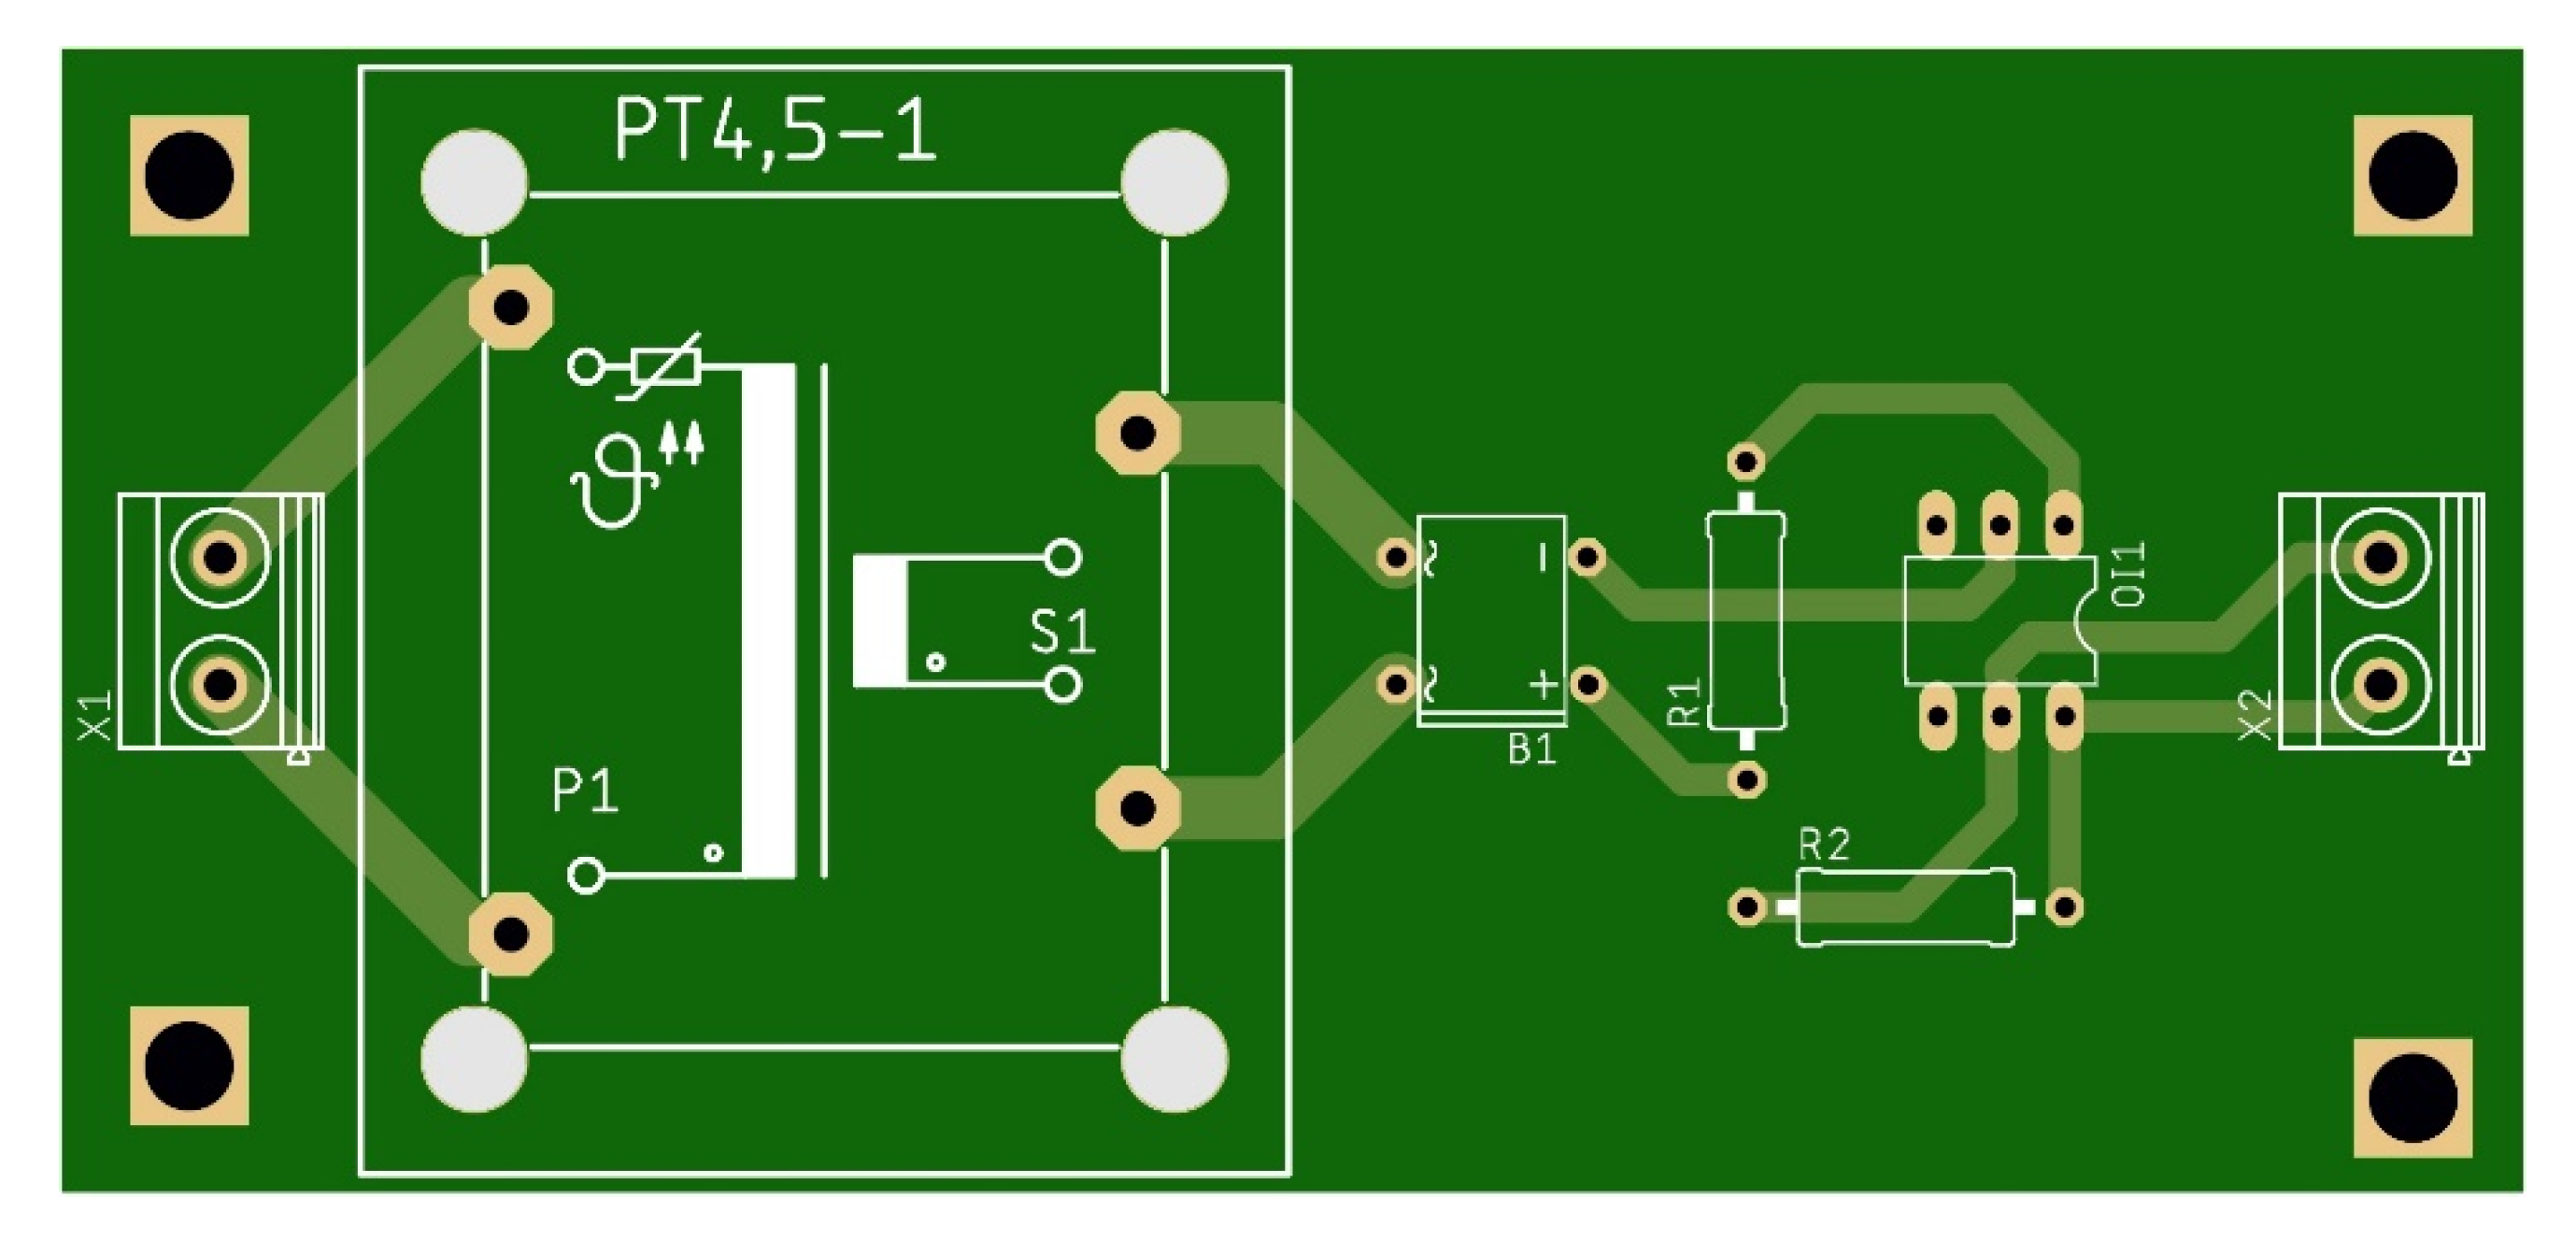
2.6.2. Zero-crossing detection circuit
Resistance heaters with a power of 375 W were placed on each surface of the electric furnace to provide homogeneous heating. The resistance heaters were independently controlled by pulse-width-modulated (PWM) trigger signals. Trigger signals are provided by a microcontroller card in 1 ms steps in a 100 ms period. To prevent the system from being affected by disturbing signals that may arise from the network, the trigger signal and zero-cross detection circuit are run simultaneously. A schematic of the zero-crossing circuit is shown in Figure 4, and a printed circuit diagram is shown in Figure 5. Zero crossings of the network frequency were detected using an H11L1 integrated circuit. The supply voltage required for the operation of H11L1 is provided by a 2 W transformer, 1.5 A bridge diode, and 12 VDC provided with the LM7805 linear voltage regulator and peripheral elements. H11L1 generates a pulse with an amplitude of 5 V and a width of 500 μs for each zero crossing.
Figure 6.
Schematic of the zero-cross detection circuit.
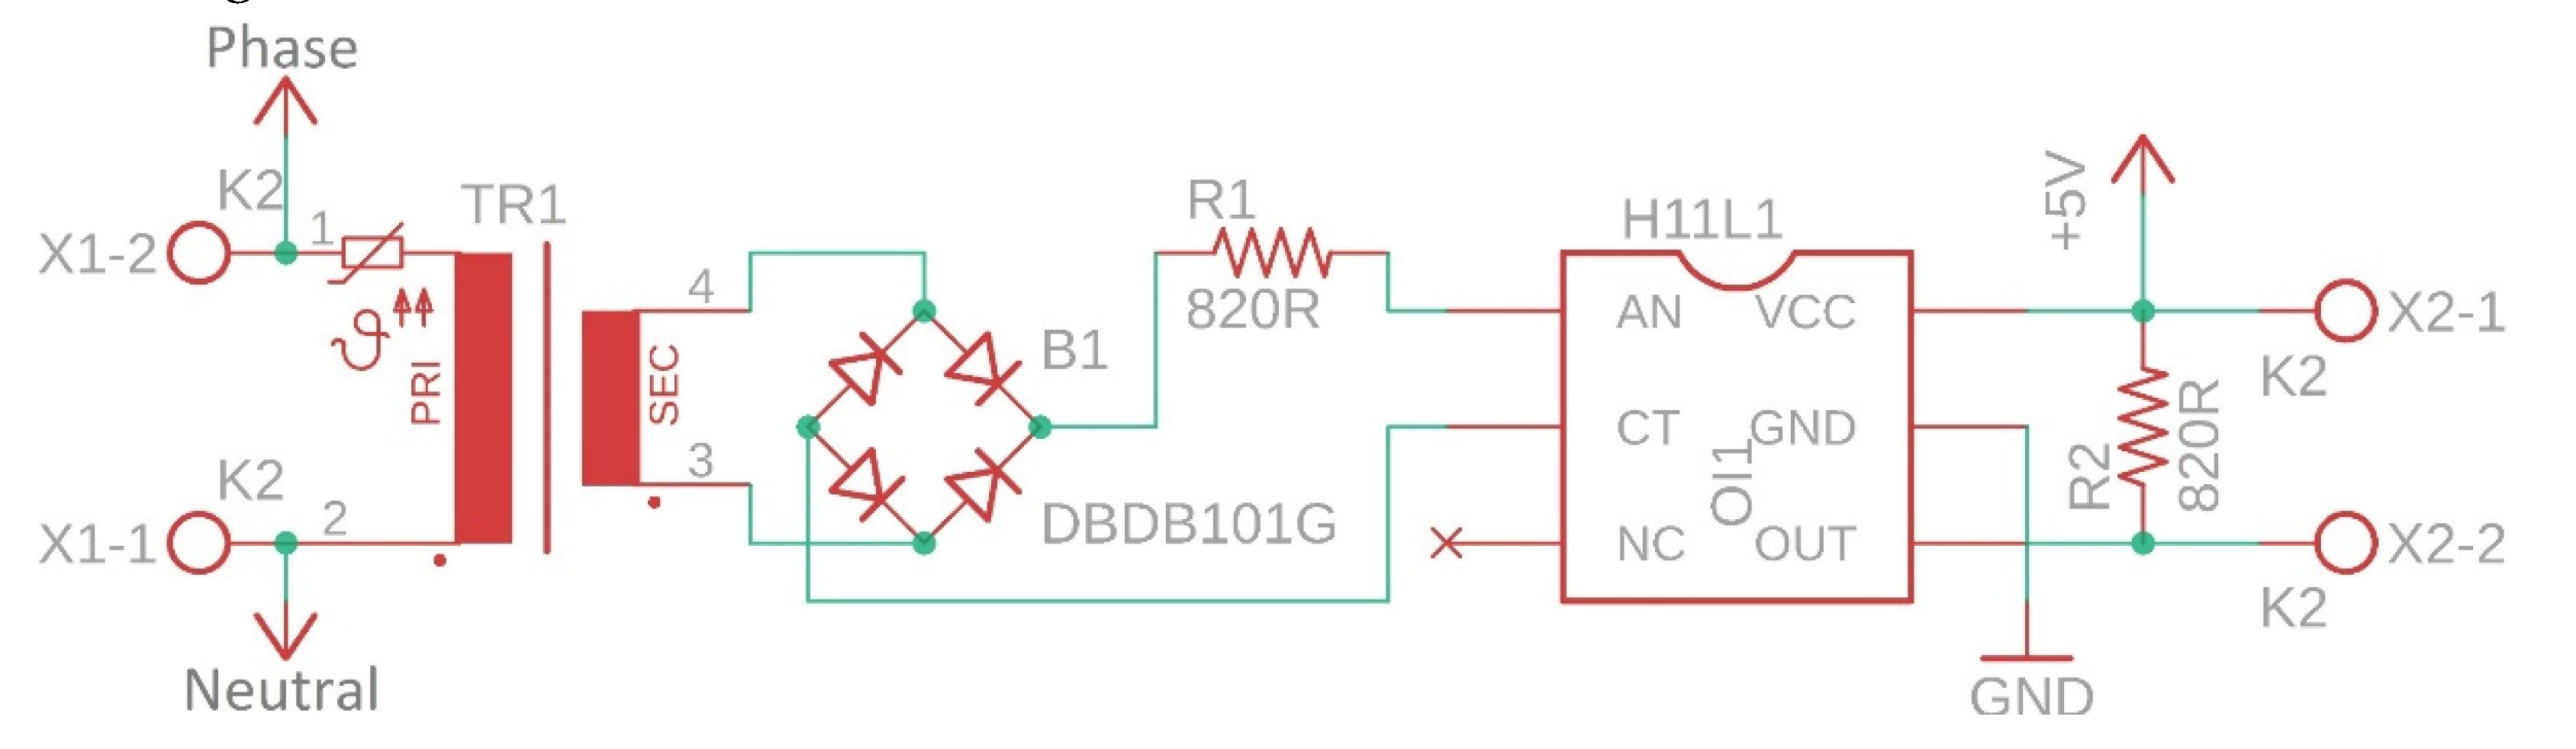
Figure 7.
Printed circuit board drawing of zero cross detection circuit.
With the zero-cross detection circuit, the triac is always placed into conduction or occlusion at zero crossings. Thus, the current at the time of switching becomes zero and soft switching is performed. Otherwise, excessive currents can be drawn instantaneously during the furnace operation, and noise is generated at the network voltage.
Driver circuit:
The implemented driver circuit consists of a 35 A 1000 V rectifier bridge diode, MOC3010 optically isolated triac driver, and BTA41 triac. After the main voltage was rectified by the bridge diode, it was applied to the input end of the resistance. The output end of the heater was connected to a 41 A 600 V triac with a dynamic resistance of 10 mΩ. The trigger signal from the controller card was applied to BTA41 through MOC3010 optically insulated triac driver integration. Thus, the heater was operated at different power levels using a trigger signal. A schematic of the driver circuit is shown in Figure 8, and a printed circuit board drawing is shown in Figure 9.
The main control panel of the electric furnace was realized by combining a microcontroller card, ADC card, zero-crossing detection circuit, and driver cards. Figure 10 shows the control panel.
2.7. Software Part
The software part consists of programs on a laptop and controller card. With these programs, the temperature control of the electric furnace was realized in real time using on-off, P, PI, and PID control methods.
2.7.1. Control software:
The control software receives the temperature of each panel in real time on the microcontroller card via the USB port and determines the instantaneous error by comparing it with the specified reference temperatures. The temperature error was applied as an input to the on-off, P, PI, and PID controllers, and the duty ratios required for each heater were calculated. The duty ratios were between 0% and 100% with a resolution of 1 %. These values are then transferred to the controller card via the USB port. This process occurred every second.
2.7.2. Controller software:
The control card functions as a data capture card between the computer and controlled system. It generates control signals and triggers driver circuits according to the duty values received from the computer and the output of the zero-crossing detection circuit. It also measures the panel temperatures and transmits them to a computer in real time.
2.8. System Modeling and Determination of PID Parameters
The designed electric furnace was a first order plus dead time (FOPDT) system. Ziegler-Nichols step response method was used in modeling the furnace. In the system modeling, a unit step function is first applied to the system input. The system model was determined from the obtained output signal using the Ziegler–Nichols step-response method. Figure 11 shows the output response of the system. (8) is used when modelling the system using the Ziegler-Nichols step response method [40,41].
From the graph in Figure 11, K = 153.50, T = 789, and L = 64 are obtained. Using these values, the system model was determined, as given in (9).
When determining the system parameters, the measurement errors of the sensors and transducers and the disturbance signals affecting the system must be considered [42]. Therefore, the system parameters are optimized based on these disturbances. Thus, the most suitable PID parameters for the electric furnace are determined. Table 2 presents the optimized PID parameters.
3. Results
In this section, the temperature control of the furnace that performs three-dimensional heating has been carried out, and the obtained results are presented. The reference temperature was set to 125 °C, and the gain factors of the P, PI, and PID controllers were considered, as shown in Table 2.
3.1. Temperature Control of a Single Panel
In this section, only the bottom panel is energized in the given experimental results. The temperature variations of the six panels are shown in Figure 12, and the control signals applied to the panels are shown in Figure 13. In Figure12, it can be observed that when the on-off control is applied, the panel temperature fluctuates around the reference temperature line. Additionally, it was observed that the P controller produced a steady-state error, whereas the steady-state error was significantly reduced by the PI and PID controllers.
In Figure 12, it can be observed that when only the bottom panel is energized, the temperatures of the other panels also change. In Figure 12, the temperatures of the right, left, front, and rear panels increased by less than 5 °C. However, the temperature of the top panel increases by approximately 25 °C. This was due to an increase in the heated air. In addition, the temperature distributions of the panels indicate that homogeneous heating is not possible with a single panel
The performance metrics of the four control methods are presented in Table 3. For each control method, the error-area-based performance values (IAE, ISE, ITAE, and ITSE) were calculated and are listed in the table. As shown in Table 3, the lowest rise time was obtained with the on-off controller. This was because the bottom panel operated at full power until it reached the reference temperature. However, this led to an overshoot of 10.34%. Additionally, the system was stabilized in the shortest time with the least steady-state error using the PID controller. Finally, in terms of the performance criteria based on the error area, the best performance was achieved with the PI controller.
3.2. Temperature Control of Two Panels
The temperature changes in the panels when the bottom and back panels were energized are shown in Figure 14, and the control signals are shown in Figure 15. In Figure 14, it is observed that when the on-off control is applied, the panel temperatures oscillate around the reference temperature, and the system does not stabilize. Additionally, it was observed that the P controller stabilized the system but produced an offset error. Finally, this error is reduced to a negligible level when the PI and PID controllers are used.
In Figure 14, when the bottom and rear panels are energized, temperature control is maintained at the reference value using the PI and PID controllers. Additionally, because the front panel was geometrically far from the bottom and rear panels, the temperature change was the least (less than 10 °C). The right and left panels, equidistant from the bottom and rear panels, respectively, show a moderate temperature change (less than 20 °C). The top panel, owing to the rising heated air, experienced the most significant temperature change (less than 40 °C).
In Figure 14, when two panels are energized, the temperature distribution inside the furnace is more homogeneous compared to the situation where only one panel is energized. However, there is still a significant temperature difference between the energized and non-energized panels, indicating that homogeneous heating is not possible with only two panels.
As shown in Table 4 and Table 5, the lowest rise time was obtained with the on-off control. However, the overshoot at panel temperatures exceeded 4%. Additionally, the system stabilized in the shortest time and with the least steady-state error using the PID controller. Finally, based on the error area criteria, the best temperature control performance was achieved using the PID controller.
3.3. Temperature Control of Three Panels
In the three-panel scenario, the bottom, back, and left panels are energized, and the temperature changes of the panels are shown in Figure 16, whereas the control signals are presented in Figure 17. As with the single-panel and two-panel cases, the on-off controller caused the panel temperatures to oscillate around the reference value and failed to stabilize the system. Similarly, the P controller stabilized the system but produced a steady-state error. Finally, the PI and PID controllers, owing to their integral action, stabilized the system, with the steady-state error reduced to a negligible level. In Figure 16, when the three panels are energized, the bottom, rear, and left panels reach the reference temperatures using the PI and PID controllers. Additionally, the temperature change of the front panel was low, the temperature change of the right panel was moderate, and the temperature change of the top panel was high. However, there is still a significant temperature difference between the energized and non-energized panels, indicating that homogeneous heating could not be achieved.
As shown in Table 6 and Table 8, the lowest rise time was achieved with the on-off control. However, the overshoot rate exceeded 5%. In addition, the PID controller stabilized the system in the shortest time with the least steady-state error. Furthermore, based on the error area criteria, the PID controller exhibited the best performance. From Table 7, it is evident that the PID controller achieved the best results across all performance criteria.
3.4. Temperature Control of Four Panels
When the bottom, back, left, and right panels are energized, the temperature changes of the panels are as shown in Figure 18, and the control signals are as shown in Figure 19. In the on-off control, the temperatures of the four energized panels oscillated around the reference temperature. In contrast to the P, PI, and PID controls, the temperatures of the bottom, rear, left, and right panels reach the reference temperature with a lower steady-state error at 4 °C.
In Figure 18, the four energized panels reached the reference temperature with the P, PI, and PID controls. However, the front panel temperature was lower (less than 15 °C) and the upper panel was significantly affected (less than 40 °C) compared to the four energized panels. Additionally, there was a significant temperature difference between the four energized panels and two non-energized panels. Therefore, homogeneous heating could not be achieved using the four panels.
3.5. Temperature Control of Five Panels
The temperature changes of the panels when the bottom, back, left, right, and front panels are energized are shown in Figure 20, and the control signals applied to the panels are shown in Figure 21. Similarly, in the on-off control, the panel temperatures fluctuate around the reference temperature, and the system has not stabilized. However, with P, PI, and PID control, the panel temperatures approached the reference value with a steady-state error of less than 4 °C, achieving system stability.
The five energized panels increased the temperature of the unenergized top panel from 25 to 70 °C. However, this value was well below the reference temperature, and homogeneous heating could not be achieved with the five energized panels.
In Table 13, Table 14, Table 15, Table 16 and Table 17, considering the error-area-based performance criteria, the PI controller demonstrated the best performance. Additionally, the temperature control stabilized in the shortest time with the PI controller in Table 13 and Table 14, and with the PID controller in Table 15, Table 16 and Table 17. Moreover, the lowest offset error was achieved with the PID controller, as shown in Table 13, Table 14, Table 15, Table 16 and Table 17.
2.6. Temperature Control of Six Panels
When all panels are energized, the change in panel temperatures over time is shown in Figure 22, and the control signals are shown in Figure 23. The on-off controller could not stabilize the system, causing the panel temperatures to oscillate around the reference value. In contrast, the P, PI, and PID controllers stabilized the system and reduced the steady-state error to below 4 ºC. Figure 22 clearly shows that homogeneous heating can only be achieved when all panels are energized.
In Table 18, Table 19, Table 20, Table 21, Table 22 and Table 23, it can be observed that the system stabilizes in the shortest time with the least steady-state error using the PID controller. In addition, considering the error-area-based performance criteria, the PI controller provides a better performance.
4. Conclusion
In modern electric ovens, heating is generally performed with heaters placed on the top and bottom surfaces. In some special ovens, a heater is placed on the back surface of the oven to provide three-dimensional heating. However, when heaters are placed on the top, bottom, and back surfaces of an electric oven, homogeneous heating cannot be achieved. Additionally, because the oven temperature is measured from a single point, and the top, bottom, and back heaters are energized according to the same control signal, the temperature control error in such ovens can reach dozens of degrees Celsius. In this study, unlike similar studies, the design, analysis, production, and control of an original electric oven with heaters and temperature sensors on six surfaces was carried out. The temperature of each of the six heaters on the six surfaces of the oven was measured separately and energized according to the six different control signals. Thus, the temperature of each panel was maintained at the set reference temperature. The temperature control of the implemented unique oven was conducted using on-off, P, PI, and PID controllers. The oven heating model was derived using the Ziegler-Nichols tangent method. Using this system model, the gain factors of the P, PI, and PID controllers were calculated and optimized. The experimental results demonstrate the accuracy of the obtained system model and optimized gain factors.
When the experimental results were examined, it was observed that with on-off control, the panel temperature fluctuated around the reference value, and the system could not reach stability. In contrast, the system achieved stability with the P, PI, and PID controllers. The P controller generally produced a steady-state error, whereas the PI and PID controllers reduced the steady-state error to below 1 °C in the case of one, two, and three energized panels, and to below 4 °C in the case of four, five, and six energized panels.
The temperature control of the implemented oven was carried out for one, two, three, four, five, and six panels. The experimental results revealed that homogeneous heating was not possible unless all six panels were energized, and temperature control was applied. Therefore, it is not possible to achieve homogeneous heating with modern electric ovens that provide three-dimensional heating, as used today. This result is a novel contribution of this study to literature.
Finally, each of the six heaters was energized and de-energized at the zero crossings of the mains voltage. Because the heaters were switched when the main voltage was 0 V, the sudden current drawing from the mains and noise generation on the mains were prevented.
References
- Hu, X.; Zou, Q.; Zou, H. Design and apllication of fractional order predictive functional control for industirial heating furnace. IEEE Access. 2018, 6, 66565-66575. [CrossRef]
- Zhang, R.; Xue, A.; Gao, F. Temperature control of industrial coke furnace using novel state space model predictive control. IEEE Trans. on Ind. Inf. 2017, 10, 2084 – 2092.
- Moon, U. A practical multiloop controller design for temperature control of a tv glass furnace. IEEE Trans. on Control Syst. Technol. 2007 15, 1137 – 1142,.
- Grassi, E.; Tsakalis, K. PID controller tuning by frequency loop-shaping application to diffusion furnace temperature control. IEEE Trans. on Control Syst. Technol. 2000, 8, 842 – 847.
- Hambali, N.; Ang, R.; Ishak, A.; Janin, Z. Various PID controller tuning for air temperature oven system. 2014 IEEE International Conference on Smart Instrumentation, Measurement and Applications (ICSIMA), Kuala Lumpur, Malaysia, 25-25 November 2014, pp. 1-5.
- Kumar, Y.V.P.; Rajesh, A.; Yugandhar, S.; Srikanth, V. Cascaded PID controller design for heating furnace temperature control. IOSR J., vol. 8, pp. 76-83, 2013.
- Zhang, J.; Li, H.; Ma, K.; Xue, L.; Han, B.; Dong, Y.; Tan, Y.; Gu, C. Design of PID temperature control system based on stm32. Materials Science and Engineering, 2018, 322, pp. 1-10.
- Junming, X.; Haiming, Z.; Lingyun, J.; Rui, Z. Based on Fuzzy - PID Self-Tuning Temperature Control System of the Furnace, International Conference on Electric Information and Control Engineering, Wuhan, China, 15-17 April 2011, pp. 1203-1206.
- Yanmei, W.; Yanzhu, Z.; Baoyu, W. The Control Research of PID in Heating-Furnace System, International Conference on Business Management and Electronic Information, Guangzhou, China, 13-15 May 2011, pp. 260-263.
- Hambali, N.; Janin, Z.; Samsudin, N.; Ishak, A. Process Controllability for air Temperature Oven System Using Open-Loop Reformulated Tangent Method, IEEE International Conference on Smart Instrumentation Measurement and Applications, Kuala Lumpur, Malaysia, 25-27 November 2013, pp. 1-6.
- Aktas, M.; Ceylan, İ.; Dogan, H.; Aktekeli, Z. Designing, Manufacturing and Performance Experiments of Heat Pumb Red Pepper Dryer Assisted Solar Energy. J. of Thermal Scien. and Technol., 2010, 30, 111-120.
- Zheng, F.; Lu, Y.; Fu, S.; Research on Temperature Control of Heating Furnace with Intelligent Proportional Integral Derivative Control Algorithm. Thermal Science, 2020, 24, 3069-3077.
- Teng, F.; Li, H. Adaptive Fuzzy Control for the Electric Furnace. 2009 IEEE International Conference on Intelligent Computing and Intelligent Systems, Shanghai, China, 20-22 November 2009, pp. 439-443.
- Gözde, H., Toplamacıoglu, M. C.; Kocaarslan, İ.; Şenol, M. A. Particle Swarm Optimization Based PI- Controller Design to Load-Frequency Control of a Two Area Reheat Thermal Power System. J. of Thermal Science and Technology, 2010, 30, 13-21.
- Han, Y.; Jinling, J.; Guangjian, C.; Xizhen, C. Temperature Control of Electric Furnace Based on Fuzzy PID. 2011 International Coriference on Electronics and Optoelectronics (ICEOE 2011), Dalian, China, 29-31 July 2011, pp. 41-44.
- Seo, M.; Ban, J.; Cho, M.; Cho, B.; Koo, Y.; Kim, S. W. Low-Order Model Identification and Adaptive Observer Based Predictive Control for Strip Temperature of Heating Section in Annealin Furnace. IEEE Access. 2021, 9, 53720-53734. [CrossRef]
- Budianto, A.; Pambudi, W. S.; Sumari, S.; Yulianto, A. PID Control Design for Biofuel Furnace using Arduino. Telecommunication, Computing, Electronics and Control (TELKOMNIKA), 2018, 16, 3016-3023.
- Cao, J.; Ye, Q.; Li, P. Resistance Furnace Temperature Control System Based on OPC and MATLAB, Measurement and Control. 2015, 48, 60-64.
- Gürel, A.; E.; Ceylan, İ.; Yılmaz, S. Experimantal Analyses of Heat Pump and Parabolic Trough Solar Fluidized Bed Dryer. J. of Thermal Science and Technology, 2015 35, 107-115,.
- Moon, U.; Lee, K. Y. Hybrid Algorithm with Fuzzy System and Conventional PI Control for the Temperature Control of TV Glass Furnace. IEEE Transactions on Control Systems Technology, 2003, 11, 548–554. [CrossRef]
- Cheng, Q.; Zhang, X.; Wang, Z.; Zhou, H.; Shao, S. Simultaneous Measurement of Three-Dimensional Temperature Distributions and Radiative Properties Based on Radiation Image Processing Technology in a Gas-Fired Pilot Tubular Furnace, Heat Transfer Engineering, 2014, 35, 770-779.
- Zhou, H. Z. S.; Han, D.; Sheng, F.; Zehng, G. G. Visualization of three-dimensional temperature distributions in a large-scale furnace via regularized reconstruction from radiative energy images: numerical studies. Journal of Quantitative Spectroscopy & Radiative Transfer, vol. 2002, 72, 361–383.
- Mancuhan, E.; Küçükada, K.; Alpman, E. Mathematical Modeling and Simulation of The Preheating Zone of a Tunnel Kiln. J. of Thermal Science and Technology, 2010, 31, 79-86.
- Correia, D. P.; Ferra, P.; Caldeira-Pıres, A. Flame Three-Dimensional Tomography Sensor for In-Furnace Diagnostics, Proceedings of the Combustion Institute, 2000, 28, 431-438.
- Langner, S. M.; Stonis, M.; Semrau, H.; Sauke, O.; Harchegani, L. H.; Behrens, A. Monitoring of an Aluminum Melting Furnace by Means of a 3D Light-Field Camera. 2017 IEEE International Conference on Industrial Engineering and Engineering Management (IEEM), Singapore, 10-13 December 2017, pp. 784-788.
- Wei, Z.; Ge, H.; Wang, L.; Li, Z. 3-D Temperature Reconstruction of the Flame Field in a Tangentially Fired Furnace. IEEE Transactions on Instrumnetation and Measurment, 2018, 67, 1929-1939.
- Illes, B.; Krammer, O.; Harsanyi, G.; Illyefavi-Vitez, Z.; Szabo, A. 3D Investigations of the Internal Convection Coefficient and Homogeneity in Reflow Ovens. 2007 30th International Spring Seminar on Electronics Technology (ISSE), Cluj-Napoca, Romania, 09-13 May 2007, pp. 320-325.
- Chesof, A.; Panaudomsup, S.; Cheypoca, T. Evaluation of Explicit Model Predictive Temperature Control for On-Off Air Conditioner. 17th International Conference on Control Automation and Systems. Jeju, Korea (South), 18-21 October 2017, pp. 621-624.
- Sutcliffe, H. The Principle of Reversed Lag Applied to On-Off Temperature Control. Proceedings of the IEE Part B Electronic and Communication Engineering, 1960, 107, 209-215.
- Roots, W.; Woods, J.; On-Off Control of Thermal Processes. IEEE Transactions on Industrial Electronics and Control Instrumentation, vol. 1969, 16, 136-146. [CrossRef]
- Jie, S.; Zhengwei, L.; Xiaojiang, M. The Application of Fuzzy-PID Control in Heating Furnace Control. International Conference on E-Learning E-Business Enterprise Information Systems and E-Government. Hong Kong, China, 05-06 December 2009, pp. 237-240.
- Bolat, E.; Erkan, K.; Postalcioglu, S. Experimental Autotuning PID Control of Temperature Using Microcontroller. The International Conference on Computer as a Tool, Belgrade, Serbia, 21-24 November 2005, pp. 266-269.
- Lin, H.; Wei, L.; Zikun, N. Development of PID Neural Network Control System for Temperature of Resistance Furnace. International Forum on Information Technology and Applications. Chengdu, China, 15-17 May 2009, pp. 205- 208.
- Miao, X.; Hu, C.; Qiao, Y. A Novel Two Variables PID Control Algorithm in Precision Clock Disciplining System. Electronics 2024,13, 3820. [CrossRef]
- Huang, S.; Xiang, H.; Leng, C.; Dai, T.; He, G. Intelligent Regulation of Temperature and Humidity in Vegetable Greenhouses Based on Single Neuron PID Algorithm.
- Aeenmehr, A.; Yazdizadeh, A.; Ghazizadeh, M. Neuro-PID Control of an Industrial Furnace Temperature. Symposium on Industrial Electronics & Applications. Kuala Lumpur, 04-06 October 2009, pp. 768-772.
- Wang, C.; Zhu, B.; Ma, F.; Sun, J. Design of a PID Controller for Microbial Fuel Cells Using Improved Particle Swarm Optimization. Electronics 2024, 13, 3381. [CrossRef]
- Ma, C.; Huang, B.; Basher, M.K.; Rob, M.A.; Jiang, Y. Fuzzy PID Control Design of Mining Electric Locomotive Based on Permanent Magnet Synchronous Motor. Electronics 2024, 13, 1855. [CrossRef]
- Cabuker, A.C.; Almalı, M.N. Metaheuristic Algorithm-Based Proportional–Integrative–Derivative Control of a Twin Rotor Multi Input Multi Output System. Electronics 2024, 13, 3291. [CrossRef]
- Alyoussef, F.; Kaya, I.; Akrad, A. Robust PI-PD Controller Design: Industrial Simulation Case Studies and a Real-Time Application. Electronics 2024, 13, 3362. [CrossRef]
- Li, F.; Yang, L.; Ye, A.; Zhao, Z.; Shen, B. Grouping Neural Network-Based Smith PID Temperature Controller for Multi-Channel Interaction System. Electronics 2024, 13, 697. [CrossRef]
- Silaa, M.Y.; Barambones, O.; Bencherif, A. A Novel Adaptive PID Controller Design for a PEM Fuel Cell Using Stochastic Gradient Descent with Momentum Enhanced by Whale Optimizer. Electronics 2022, 11, 2610. [CrossRef]
Figure 1.
Block diagram of the PID-controlled system.
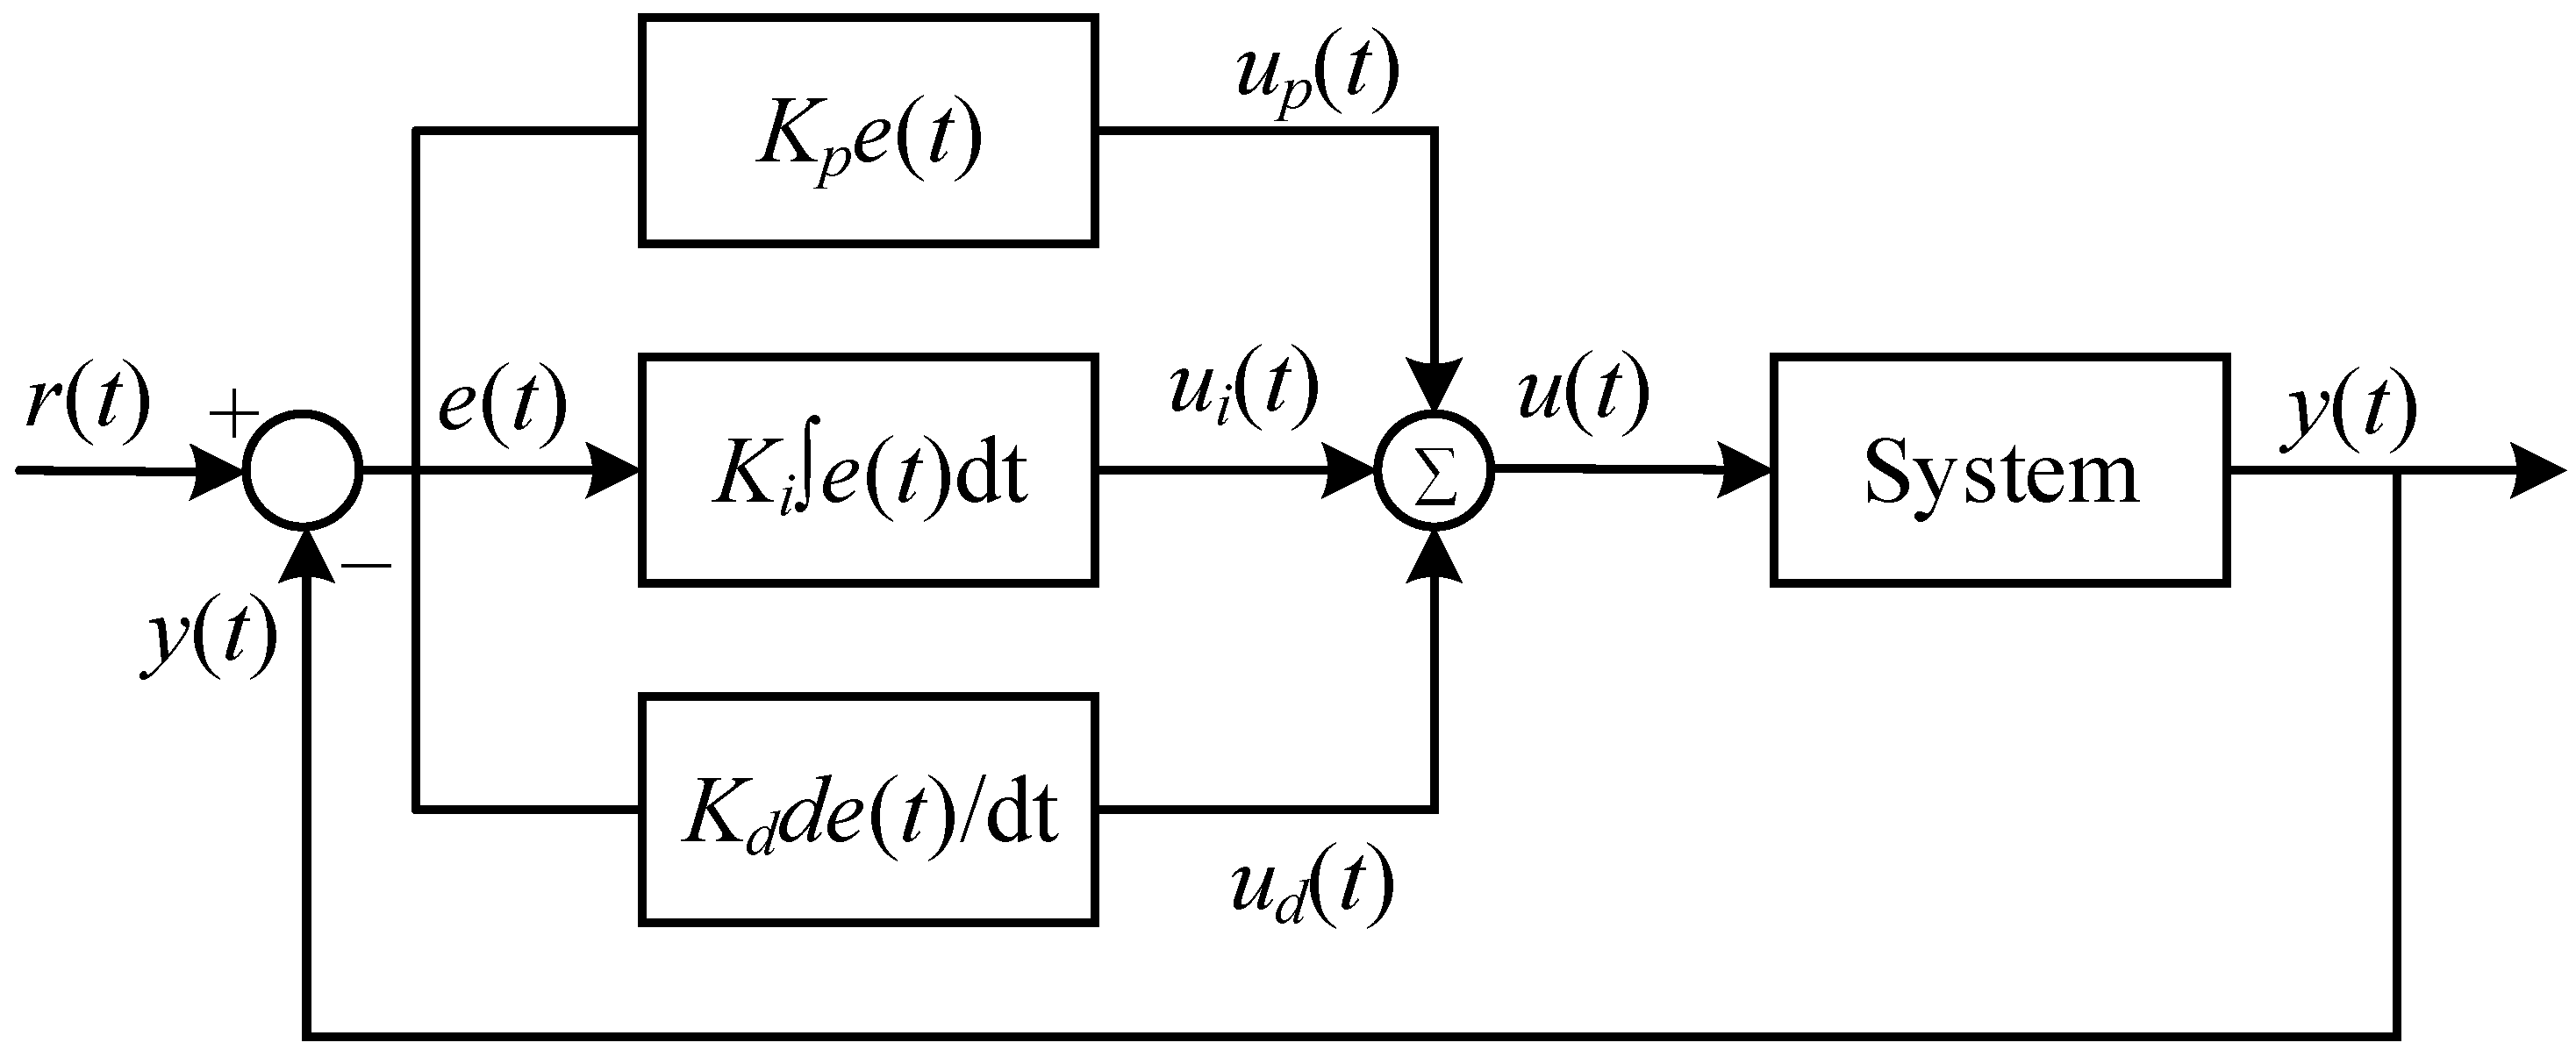
Figure 2.
General block diagram of the system.
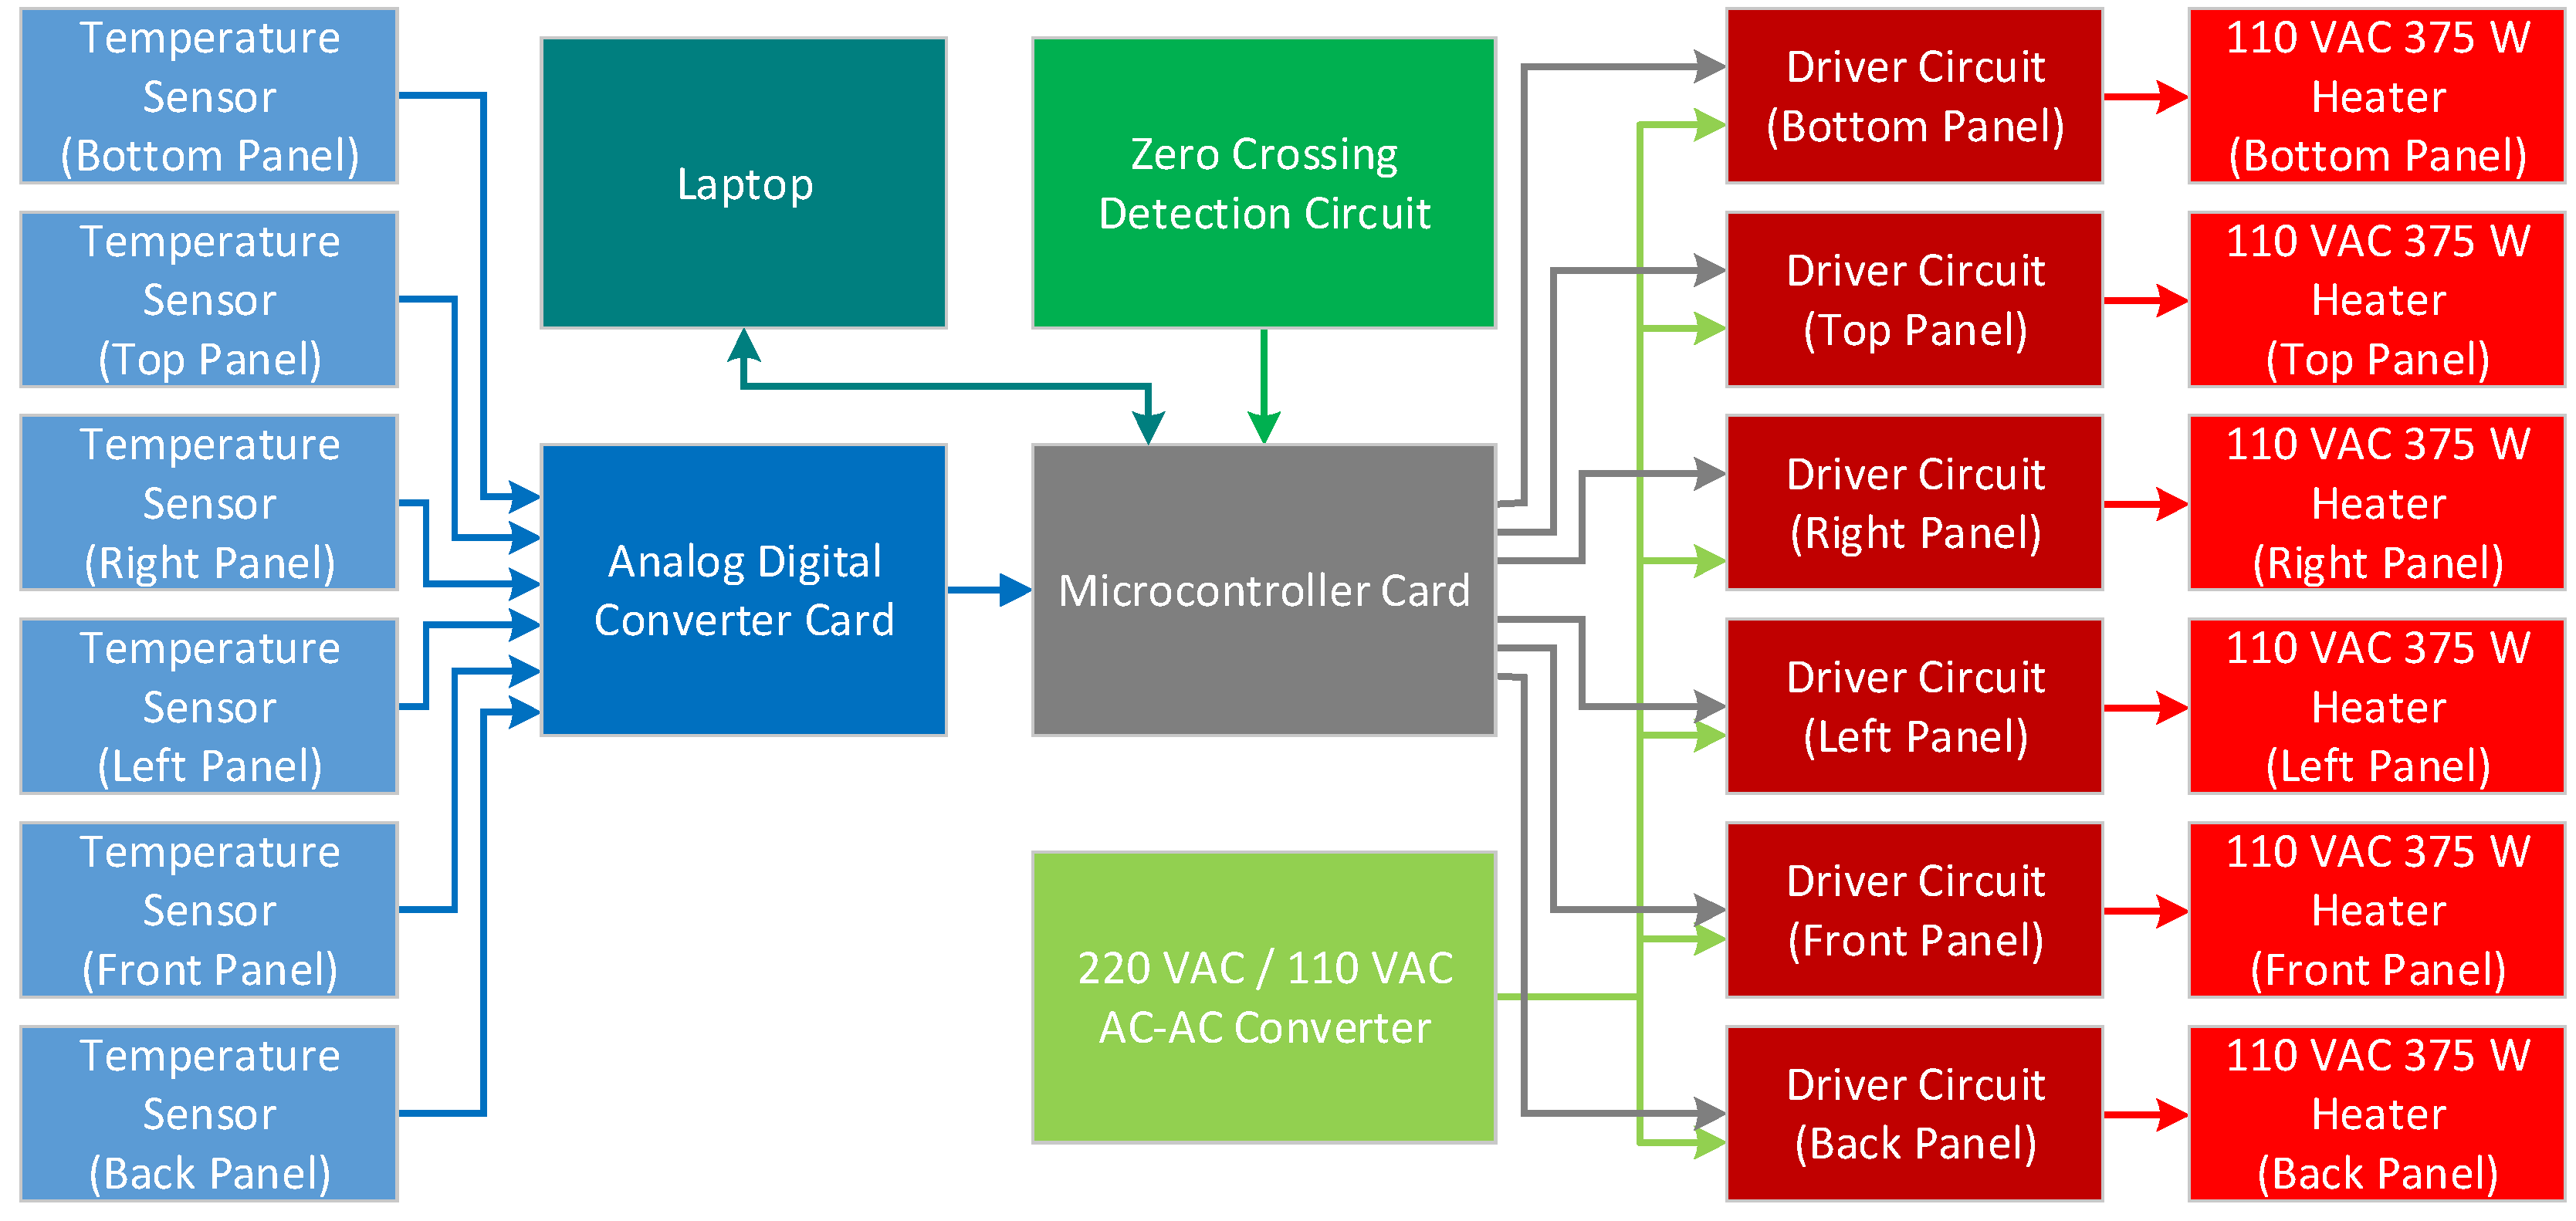
Figure 3.
General view of the oven system.
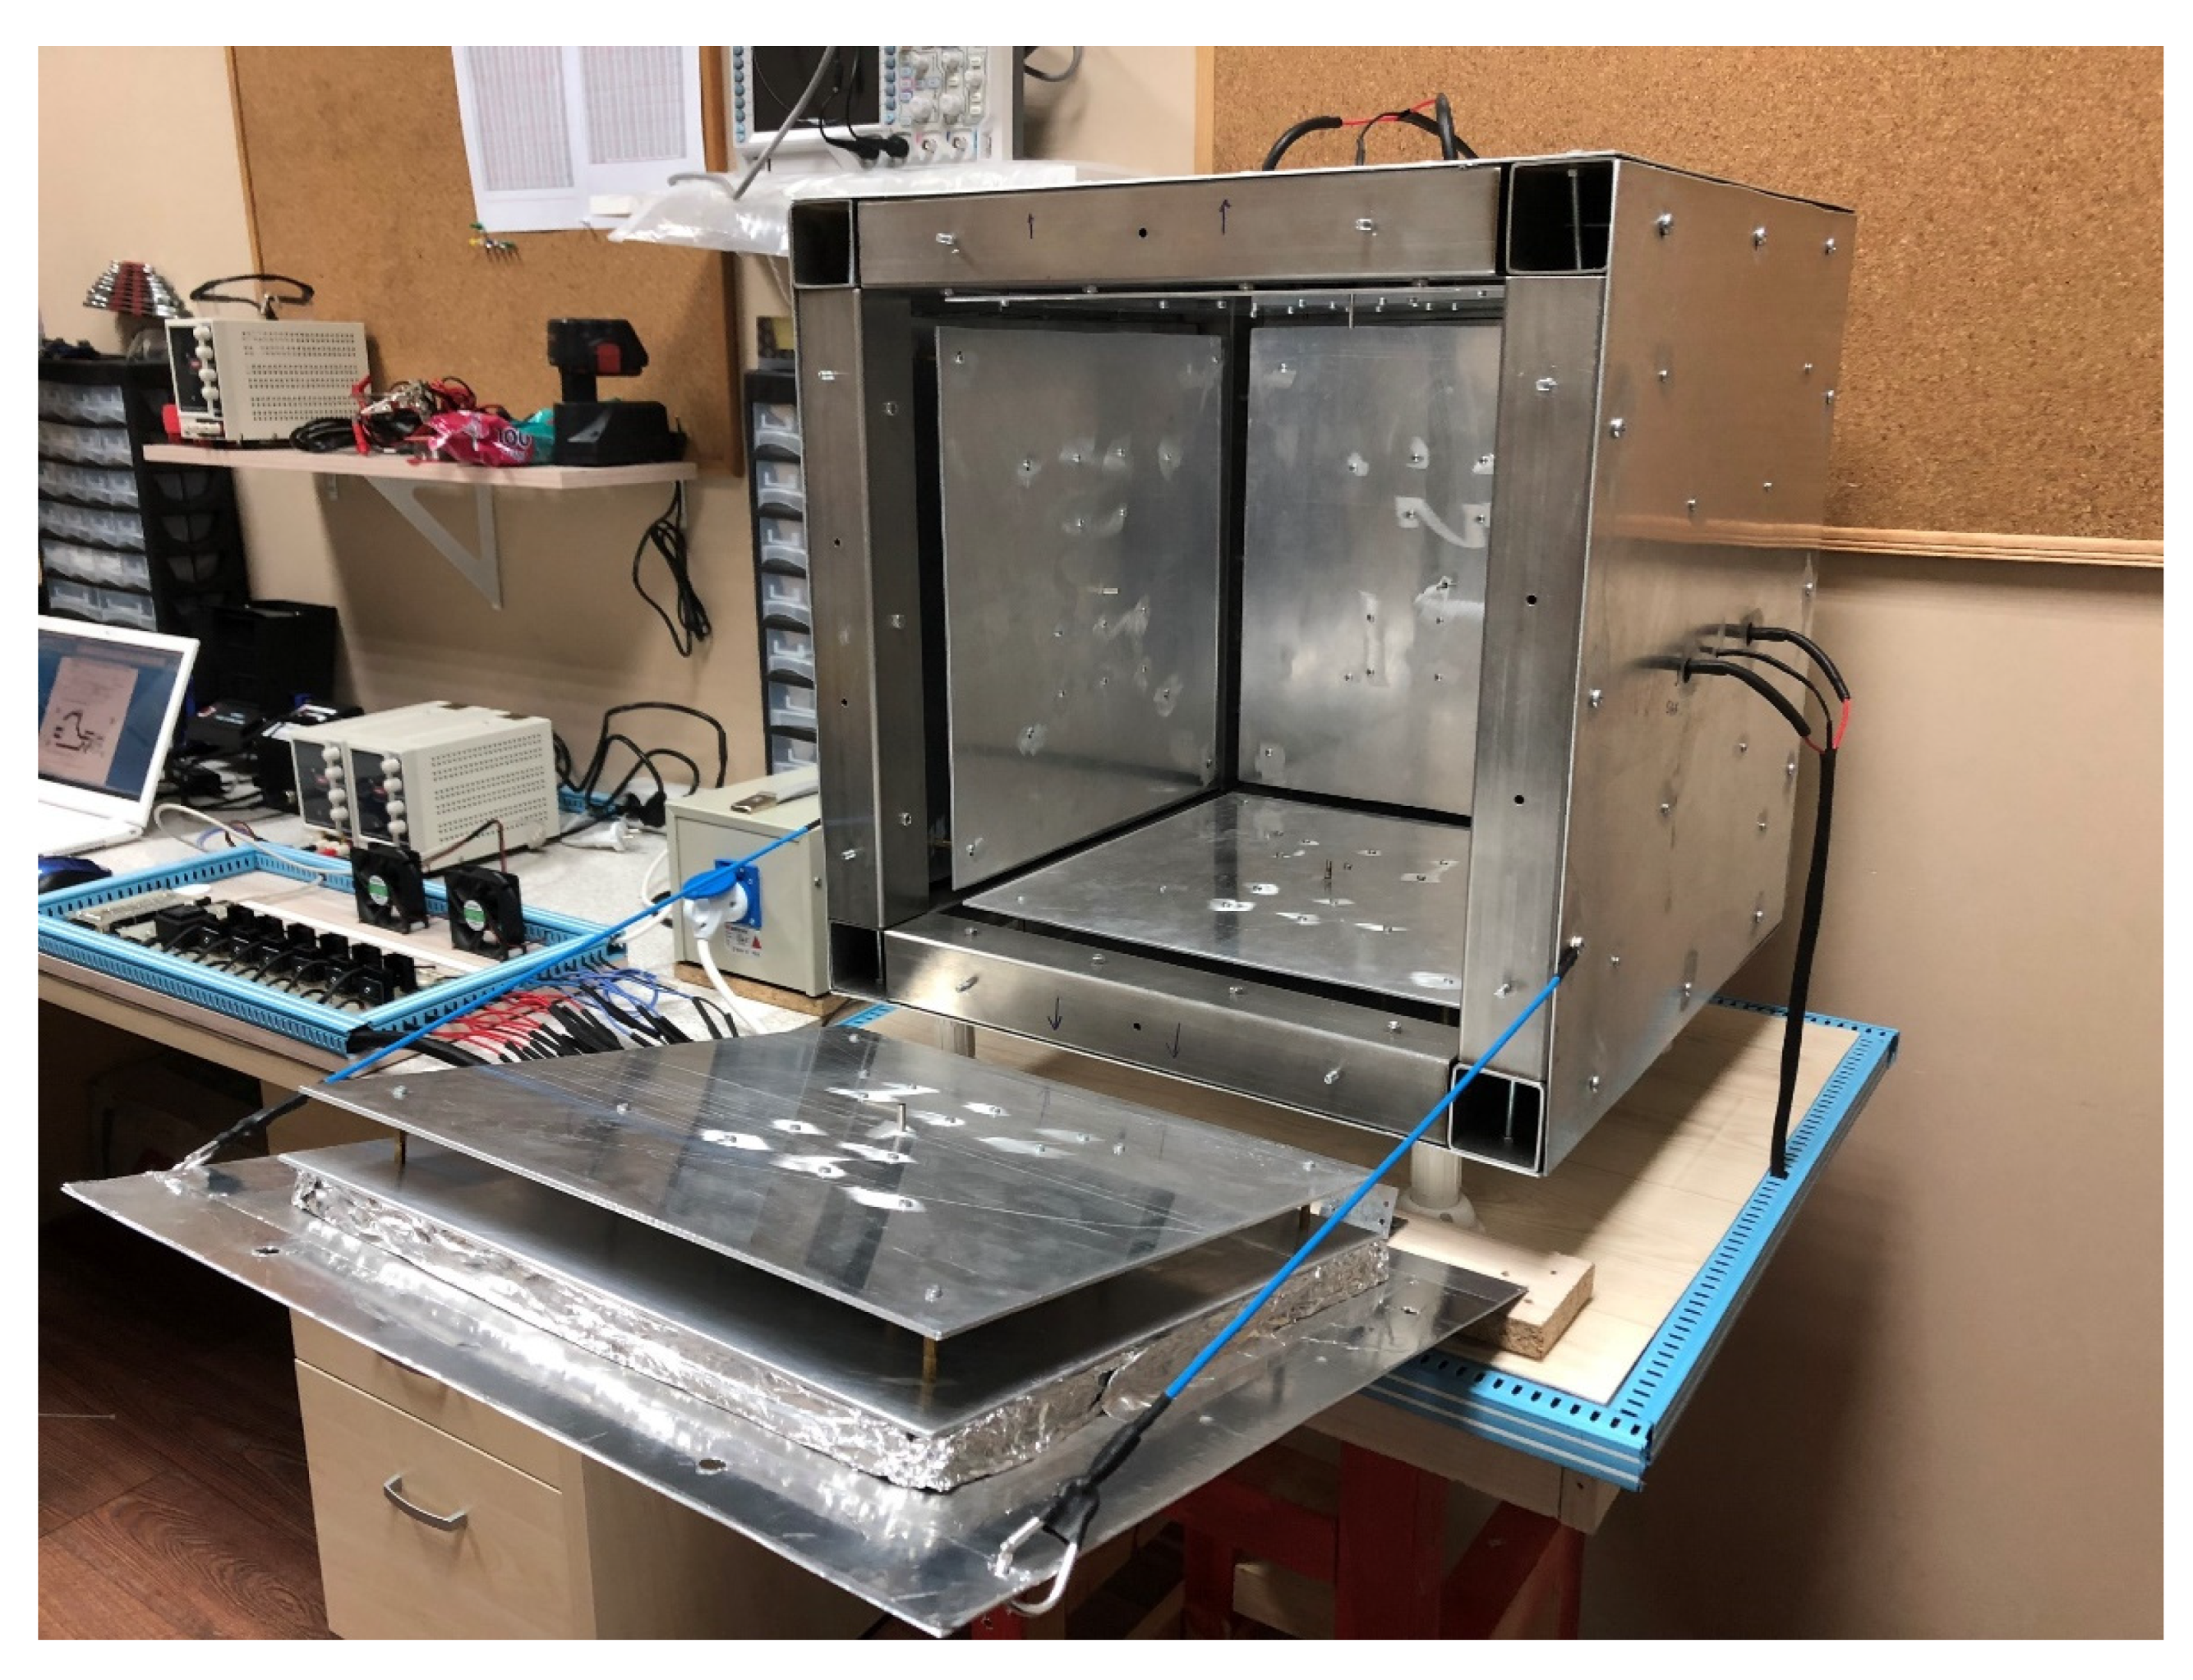
Figure 4.
Schematic of ADC board.
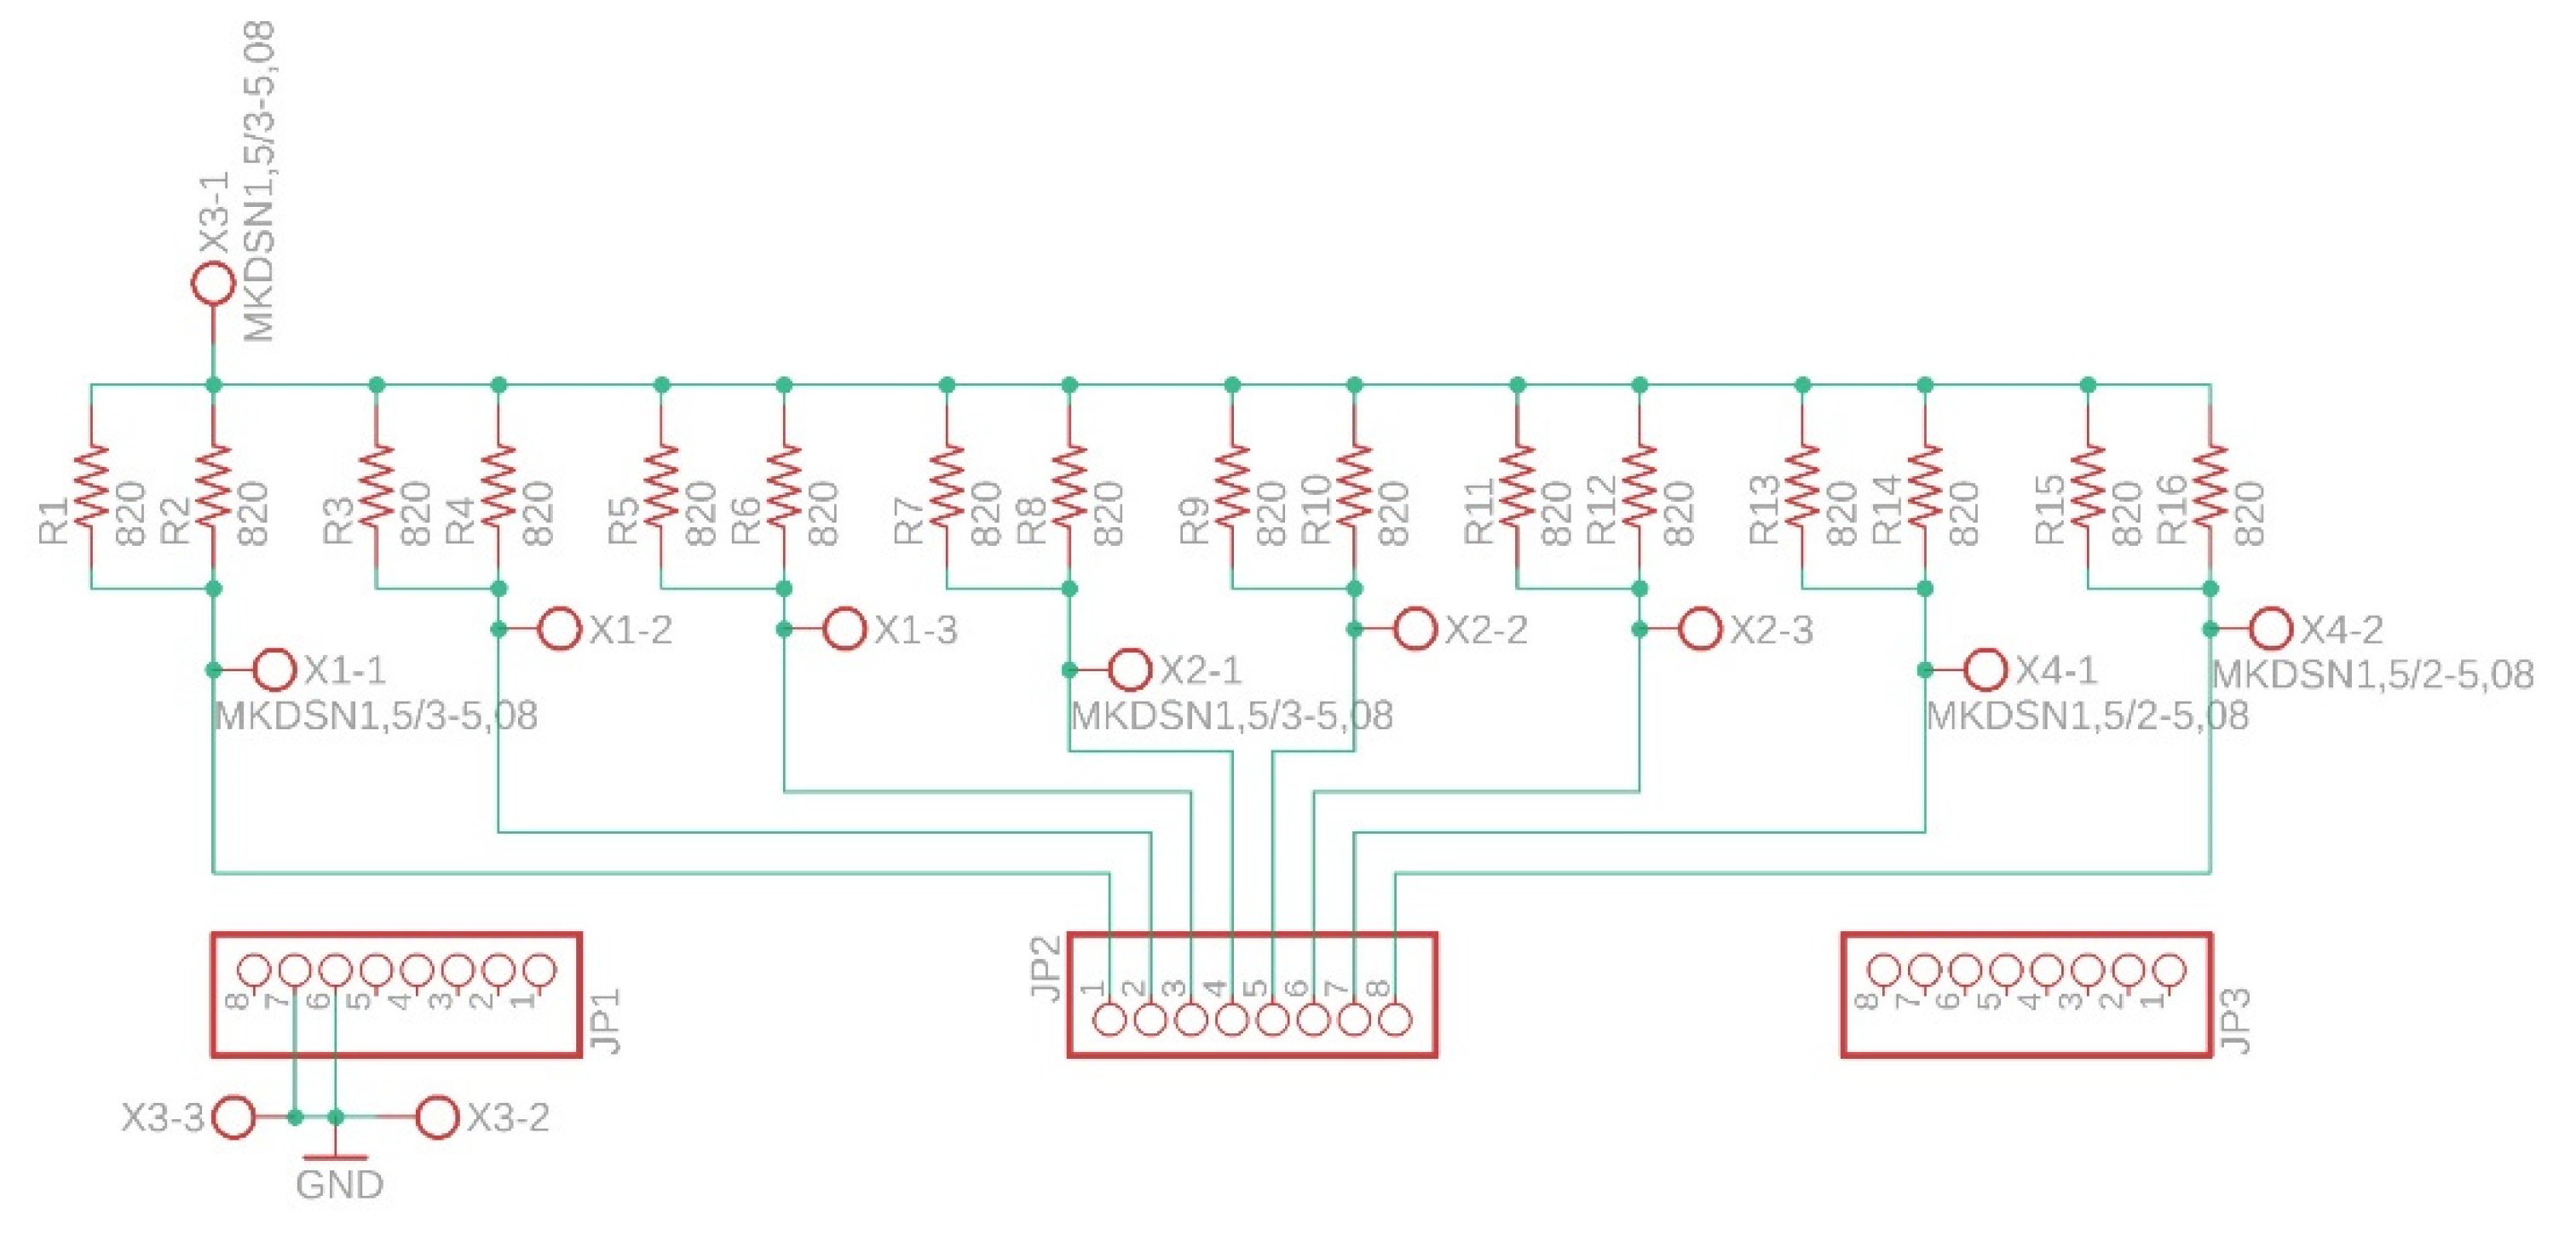
Figure 5.
Printed circuit board drawing of ADC board.
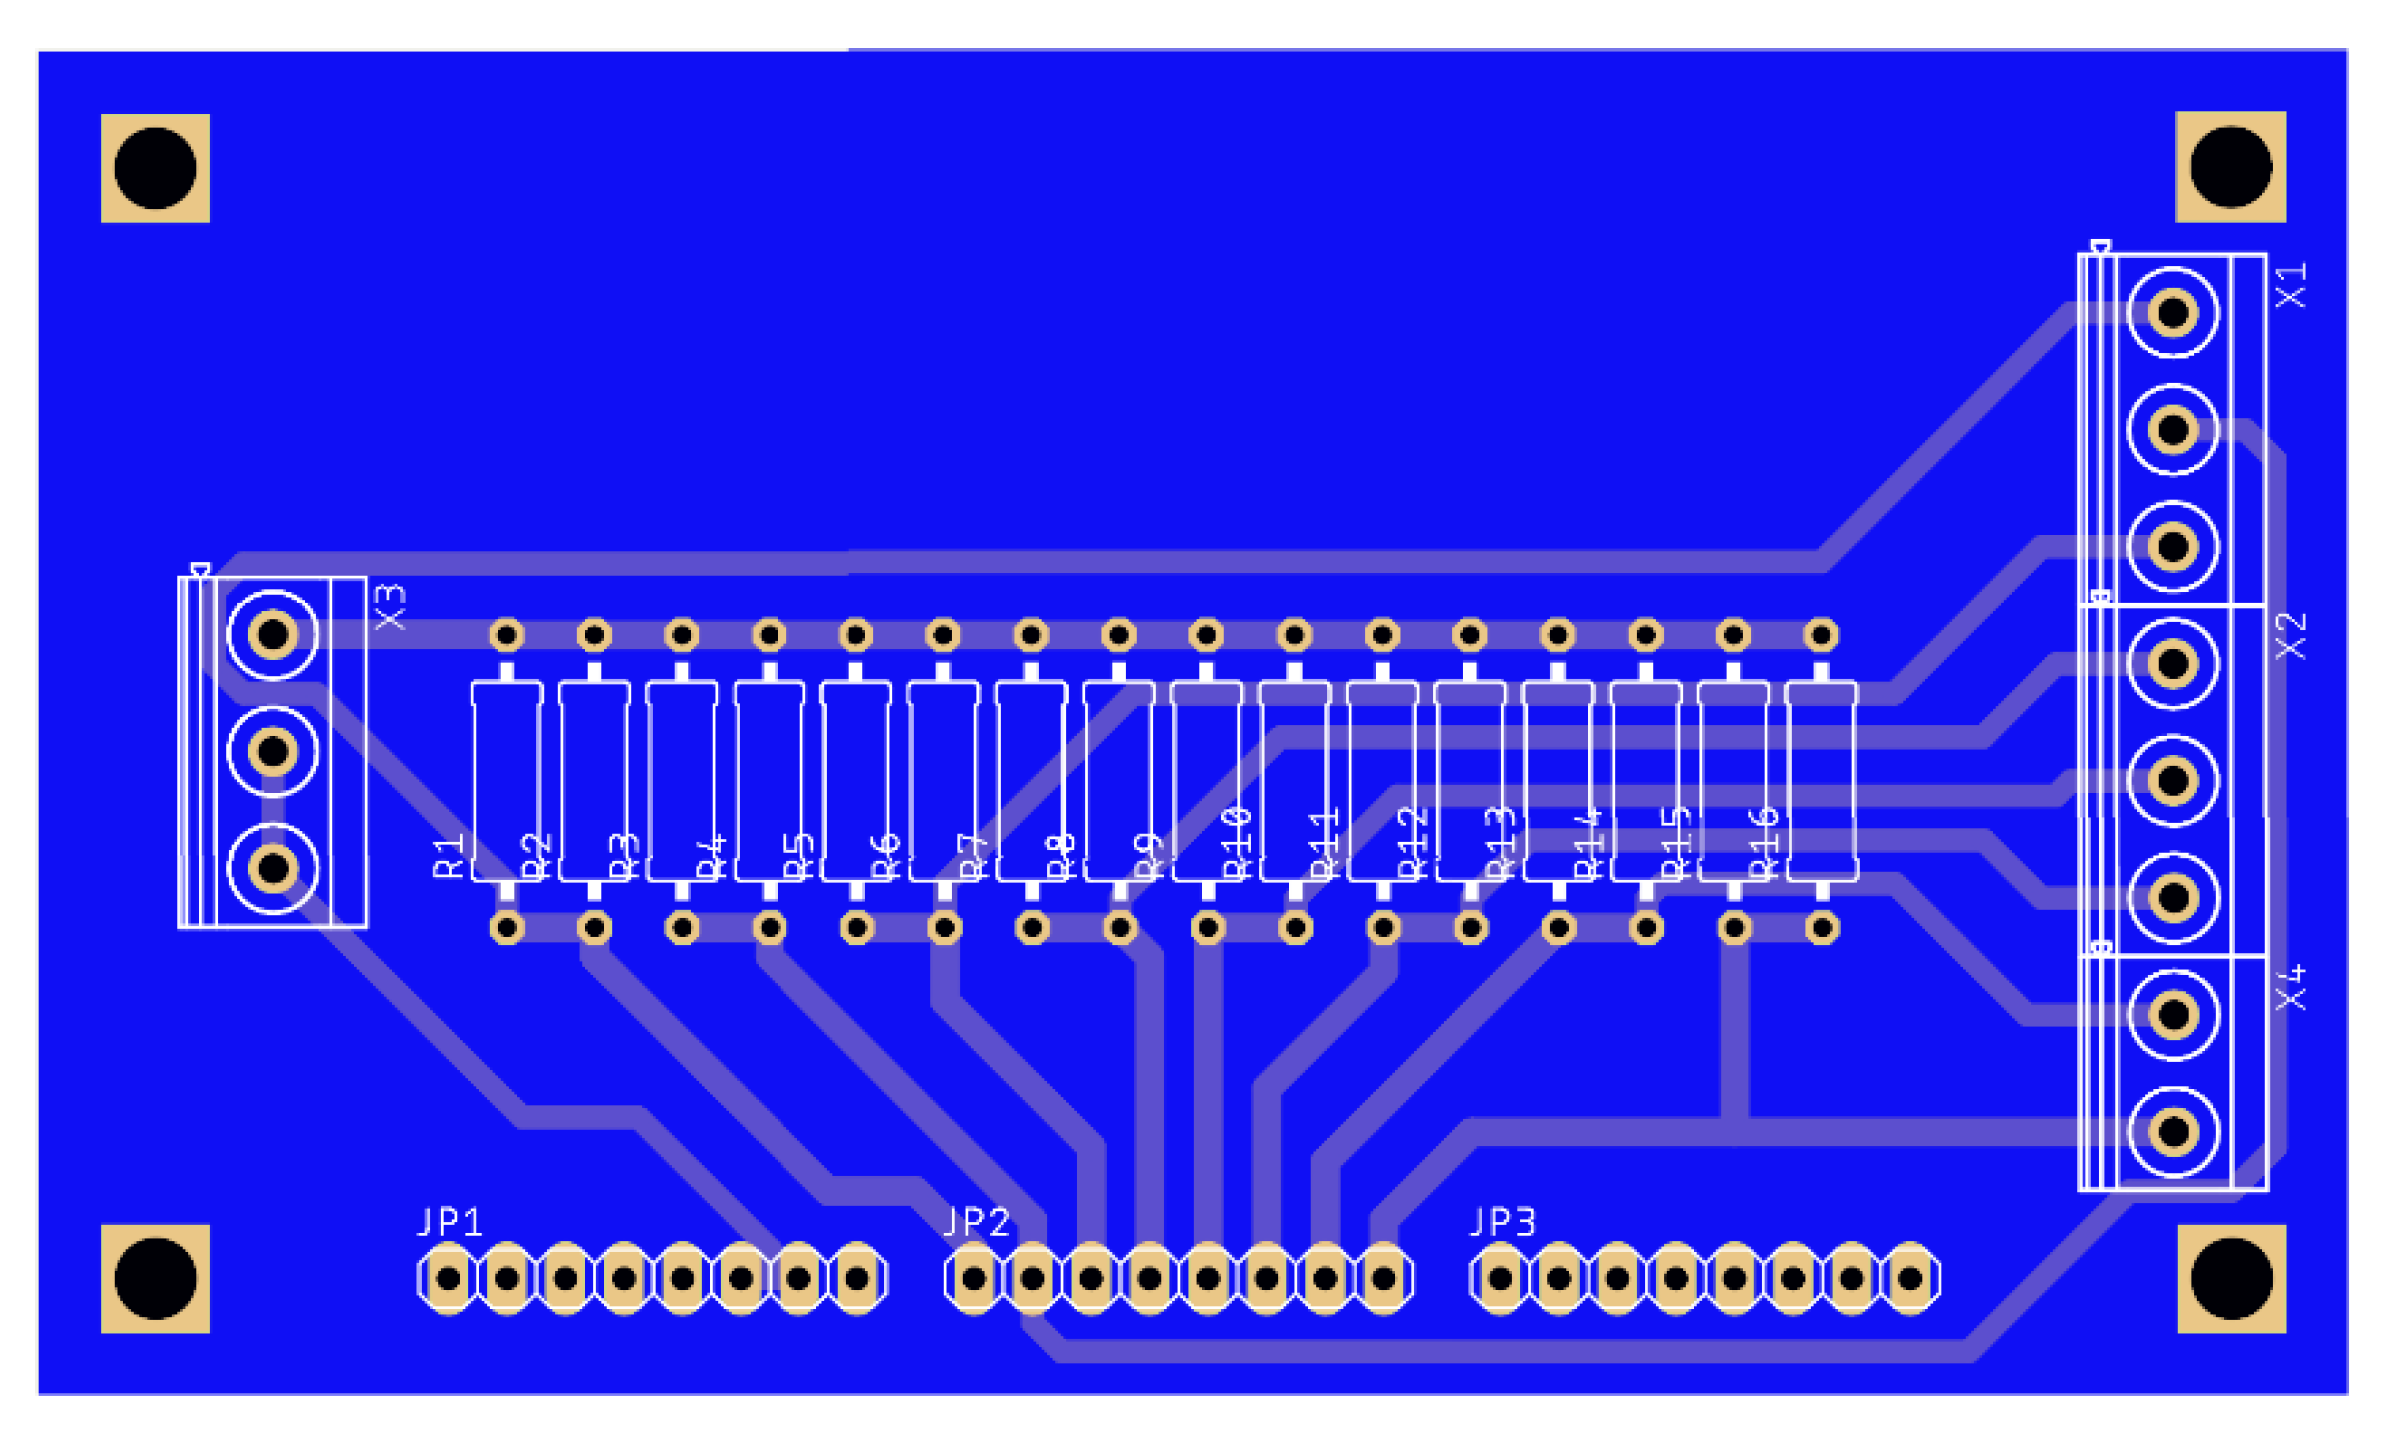
Figure 8.
Schematic of driver circuit.
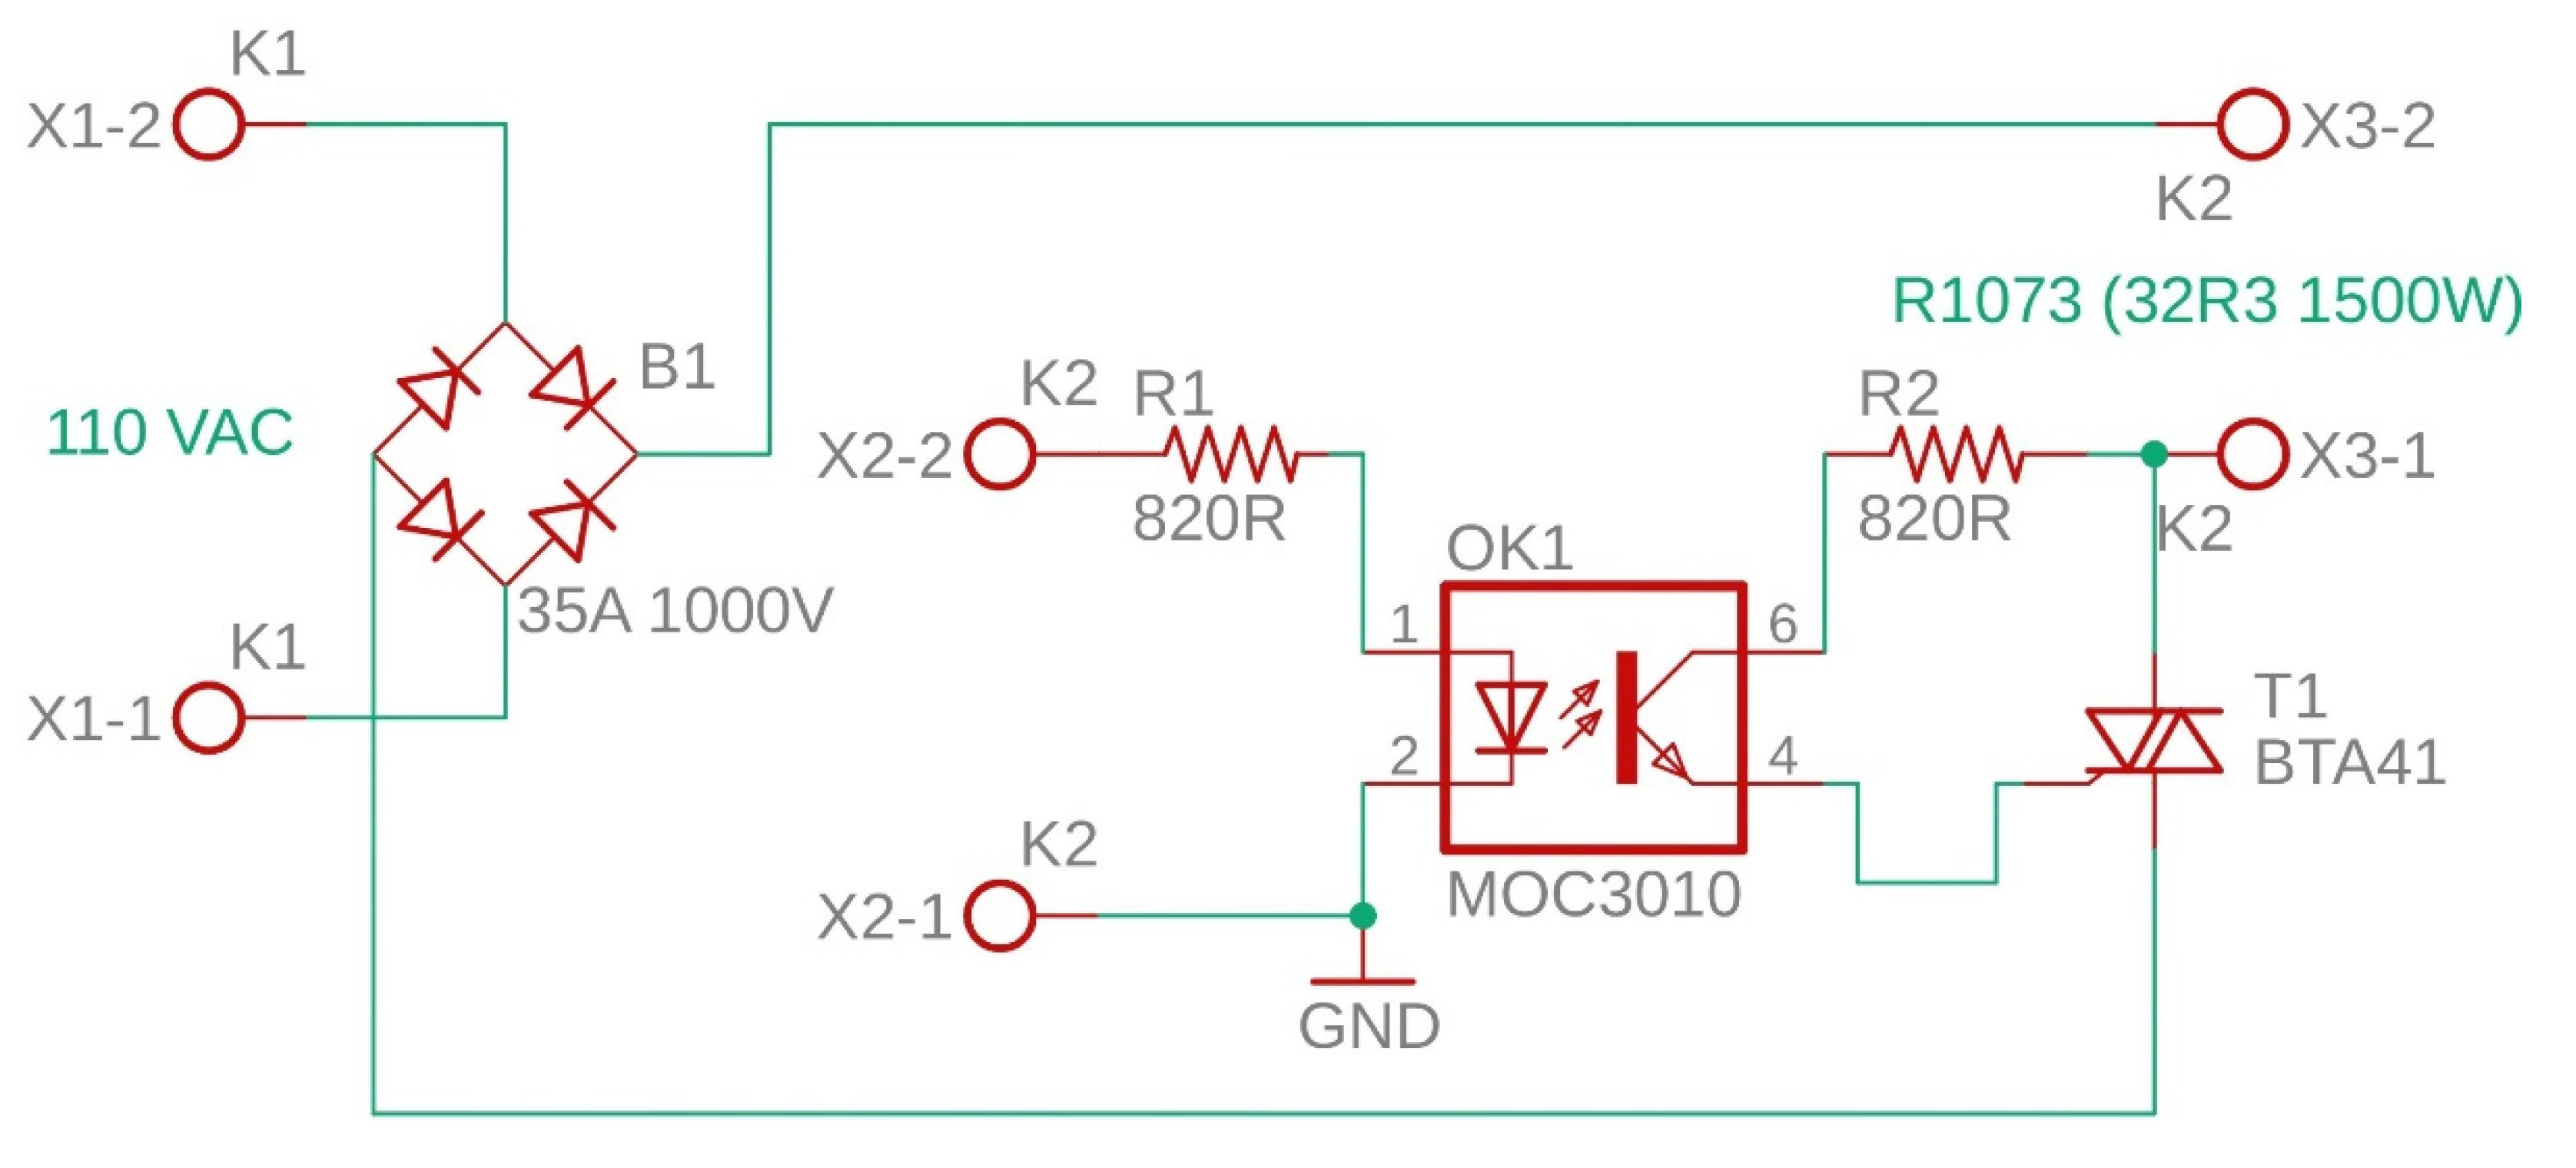
Figure 9.
Printed circuit board drawing of the driver circuit.
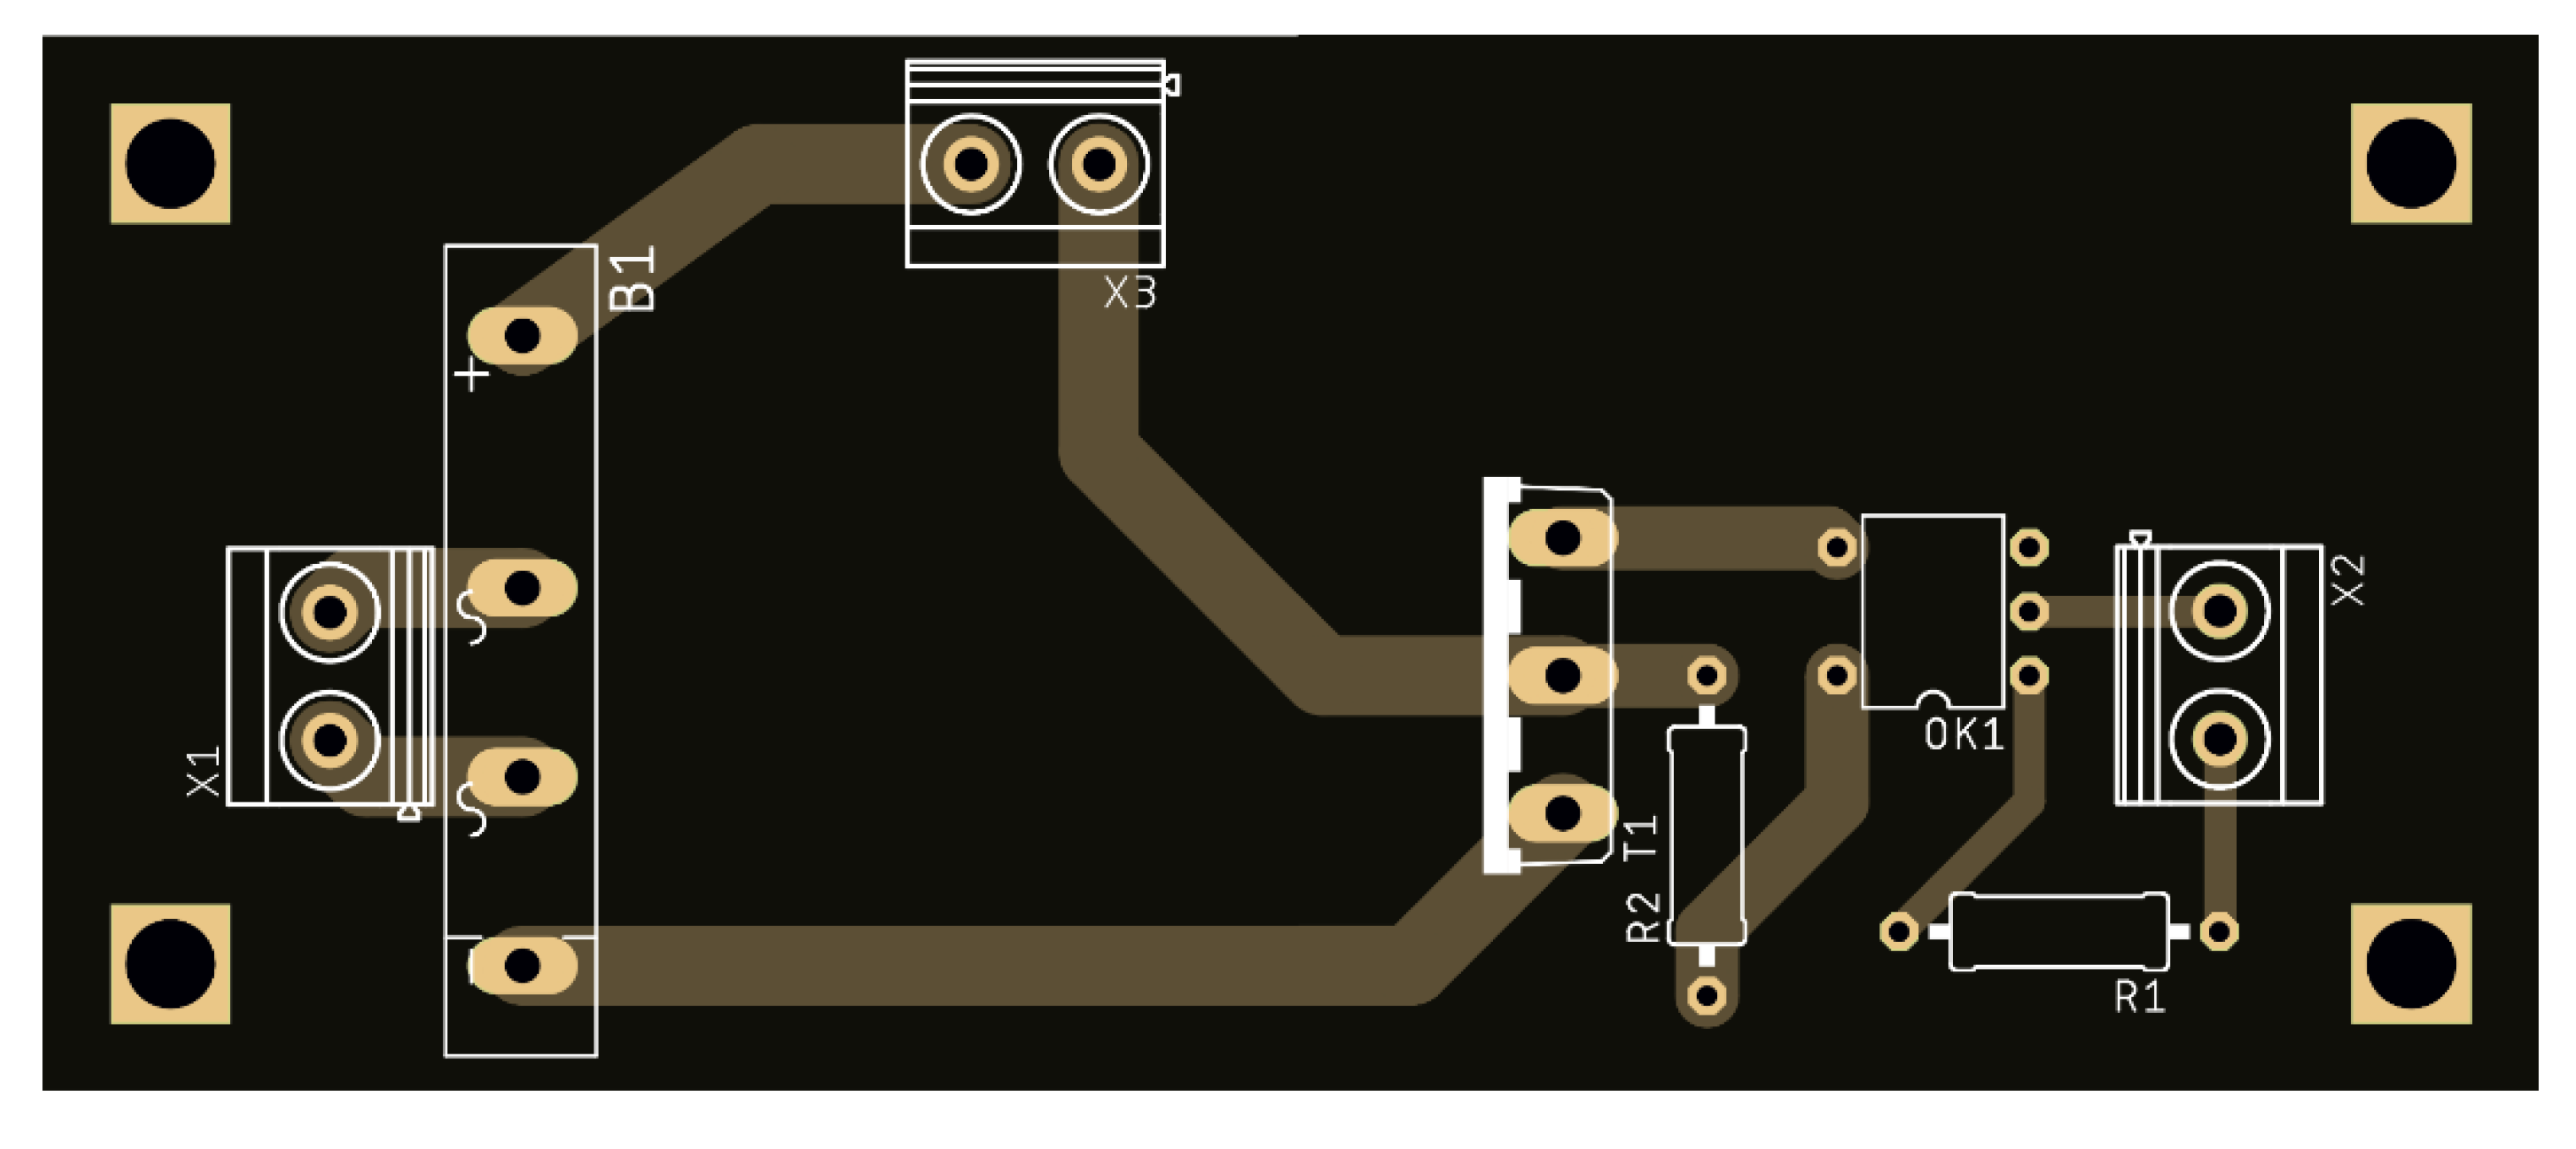
Figure 10.
General view of the main control panel.
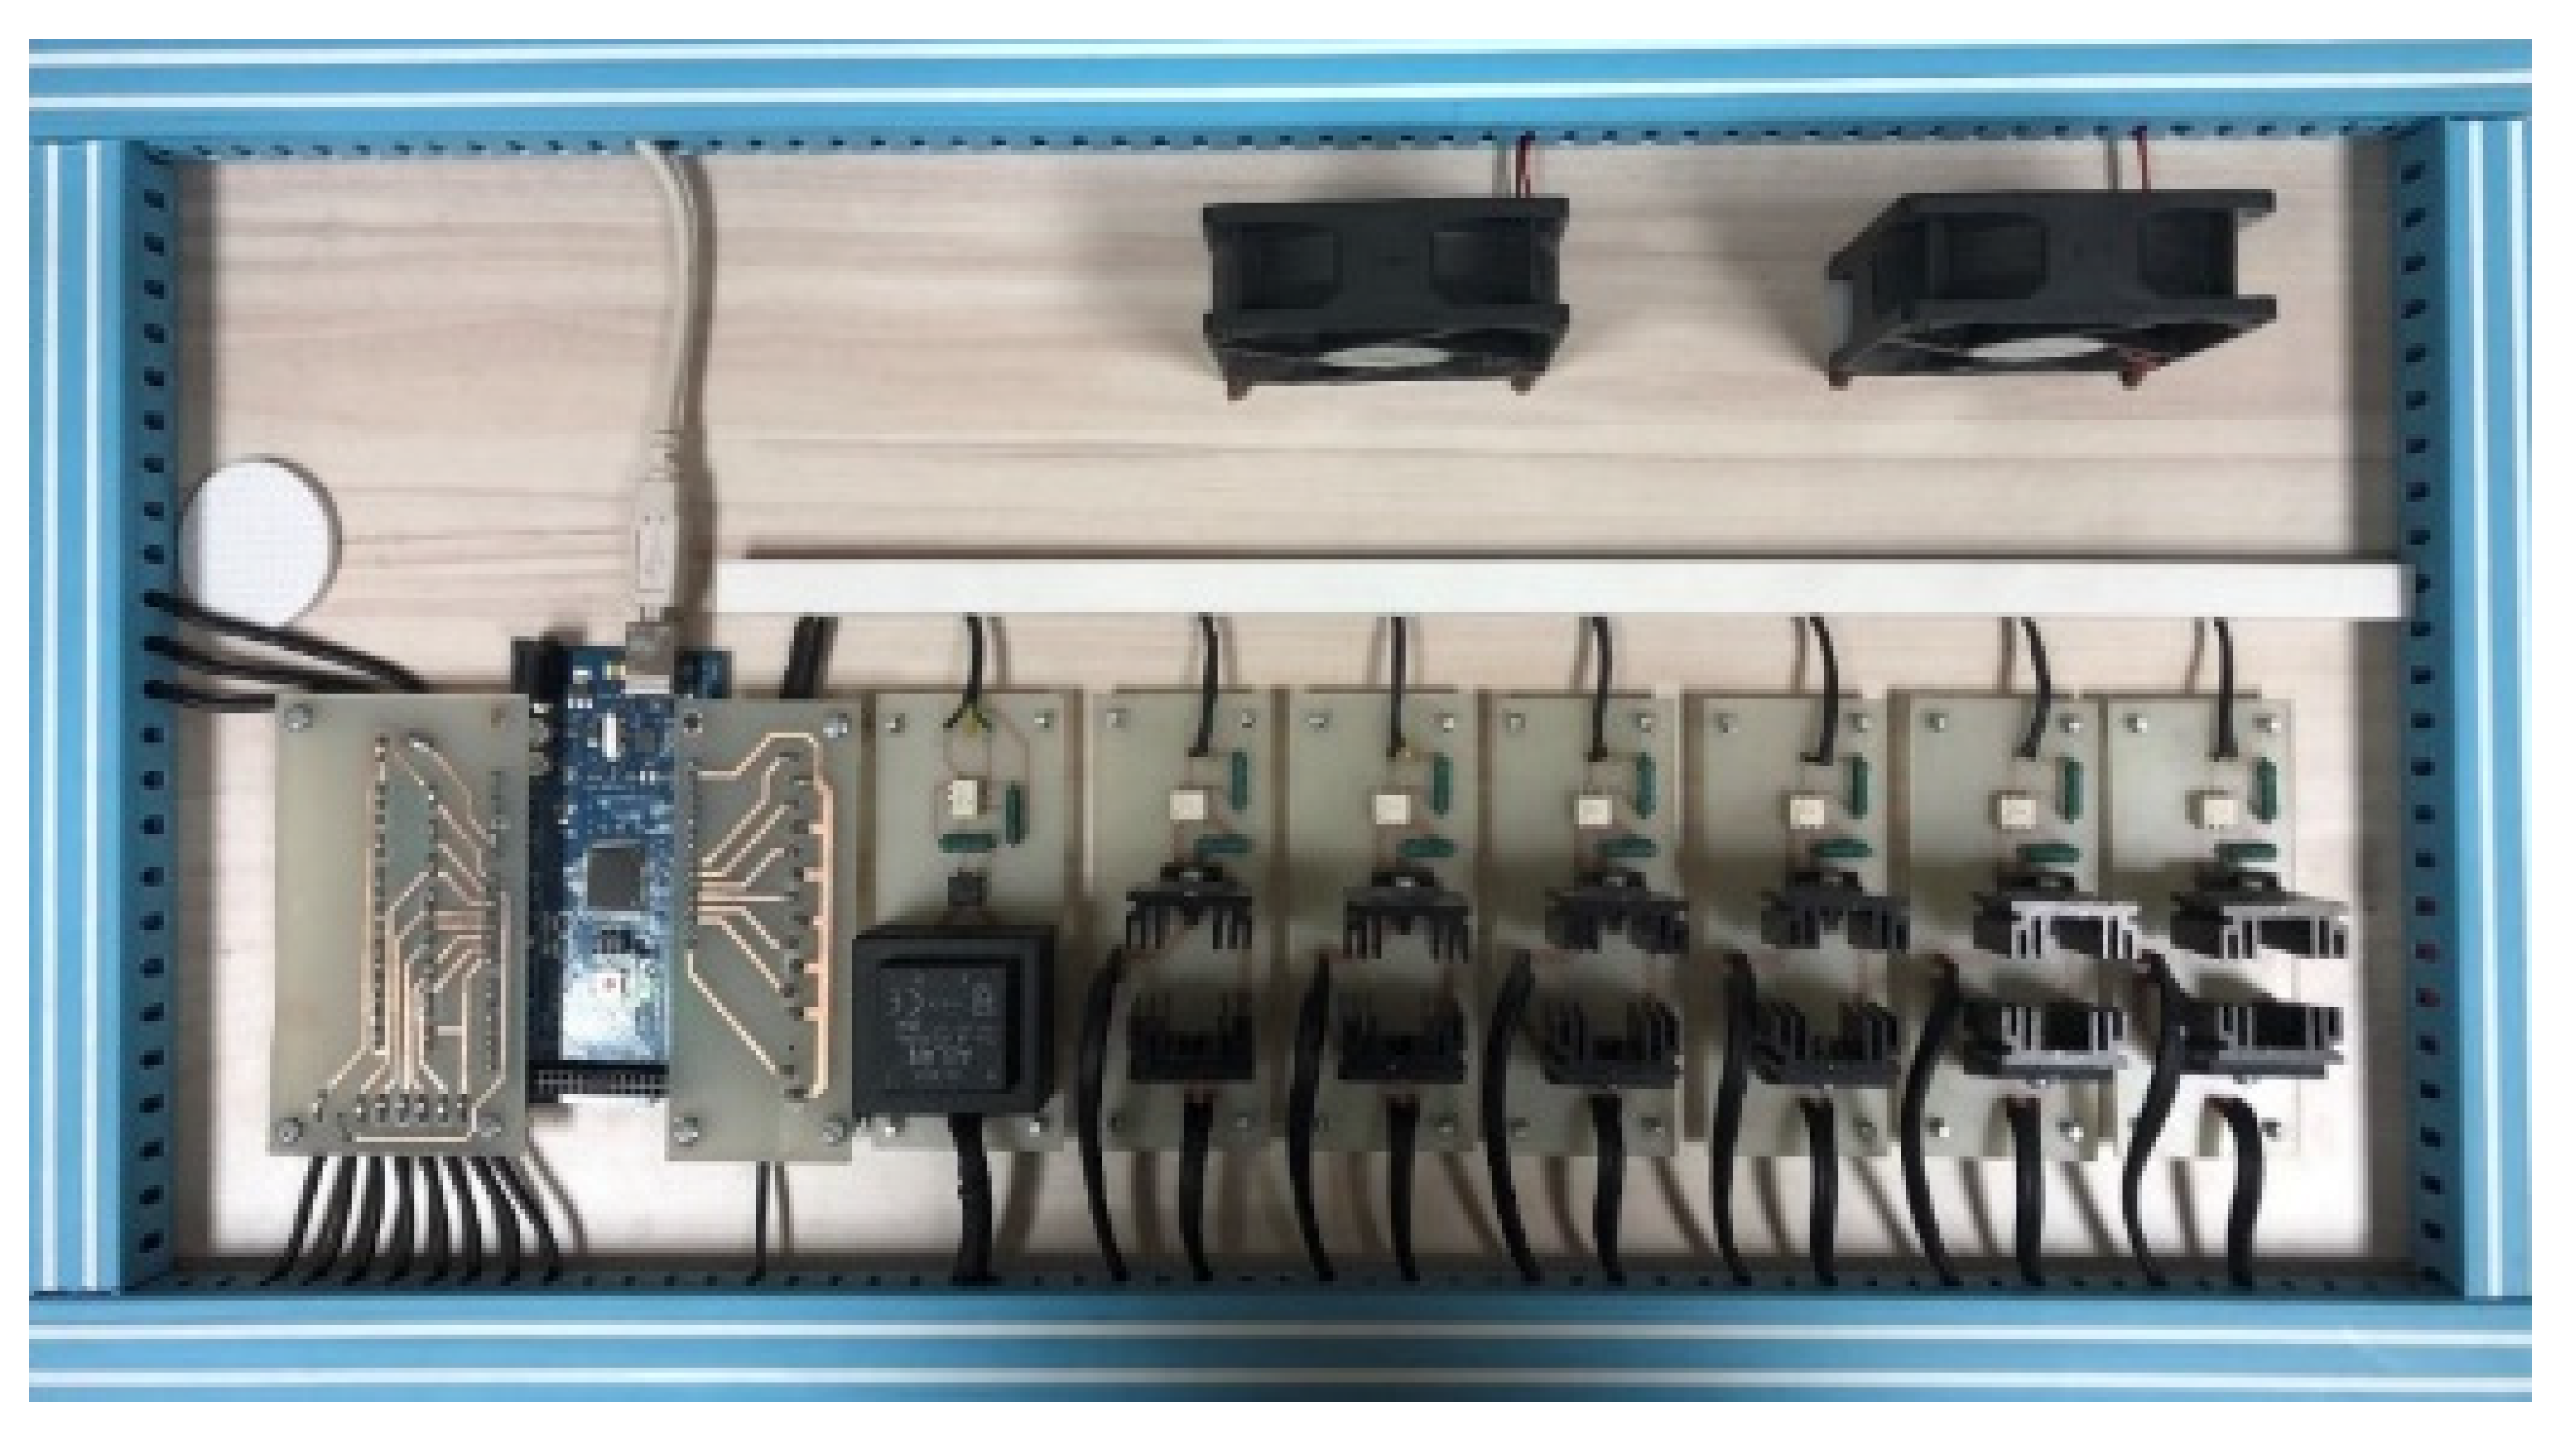
Figure 11.
Step response of the system.
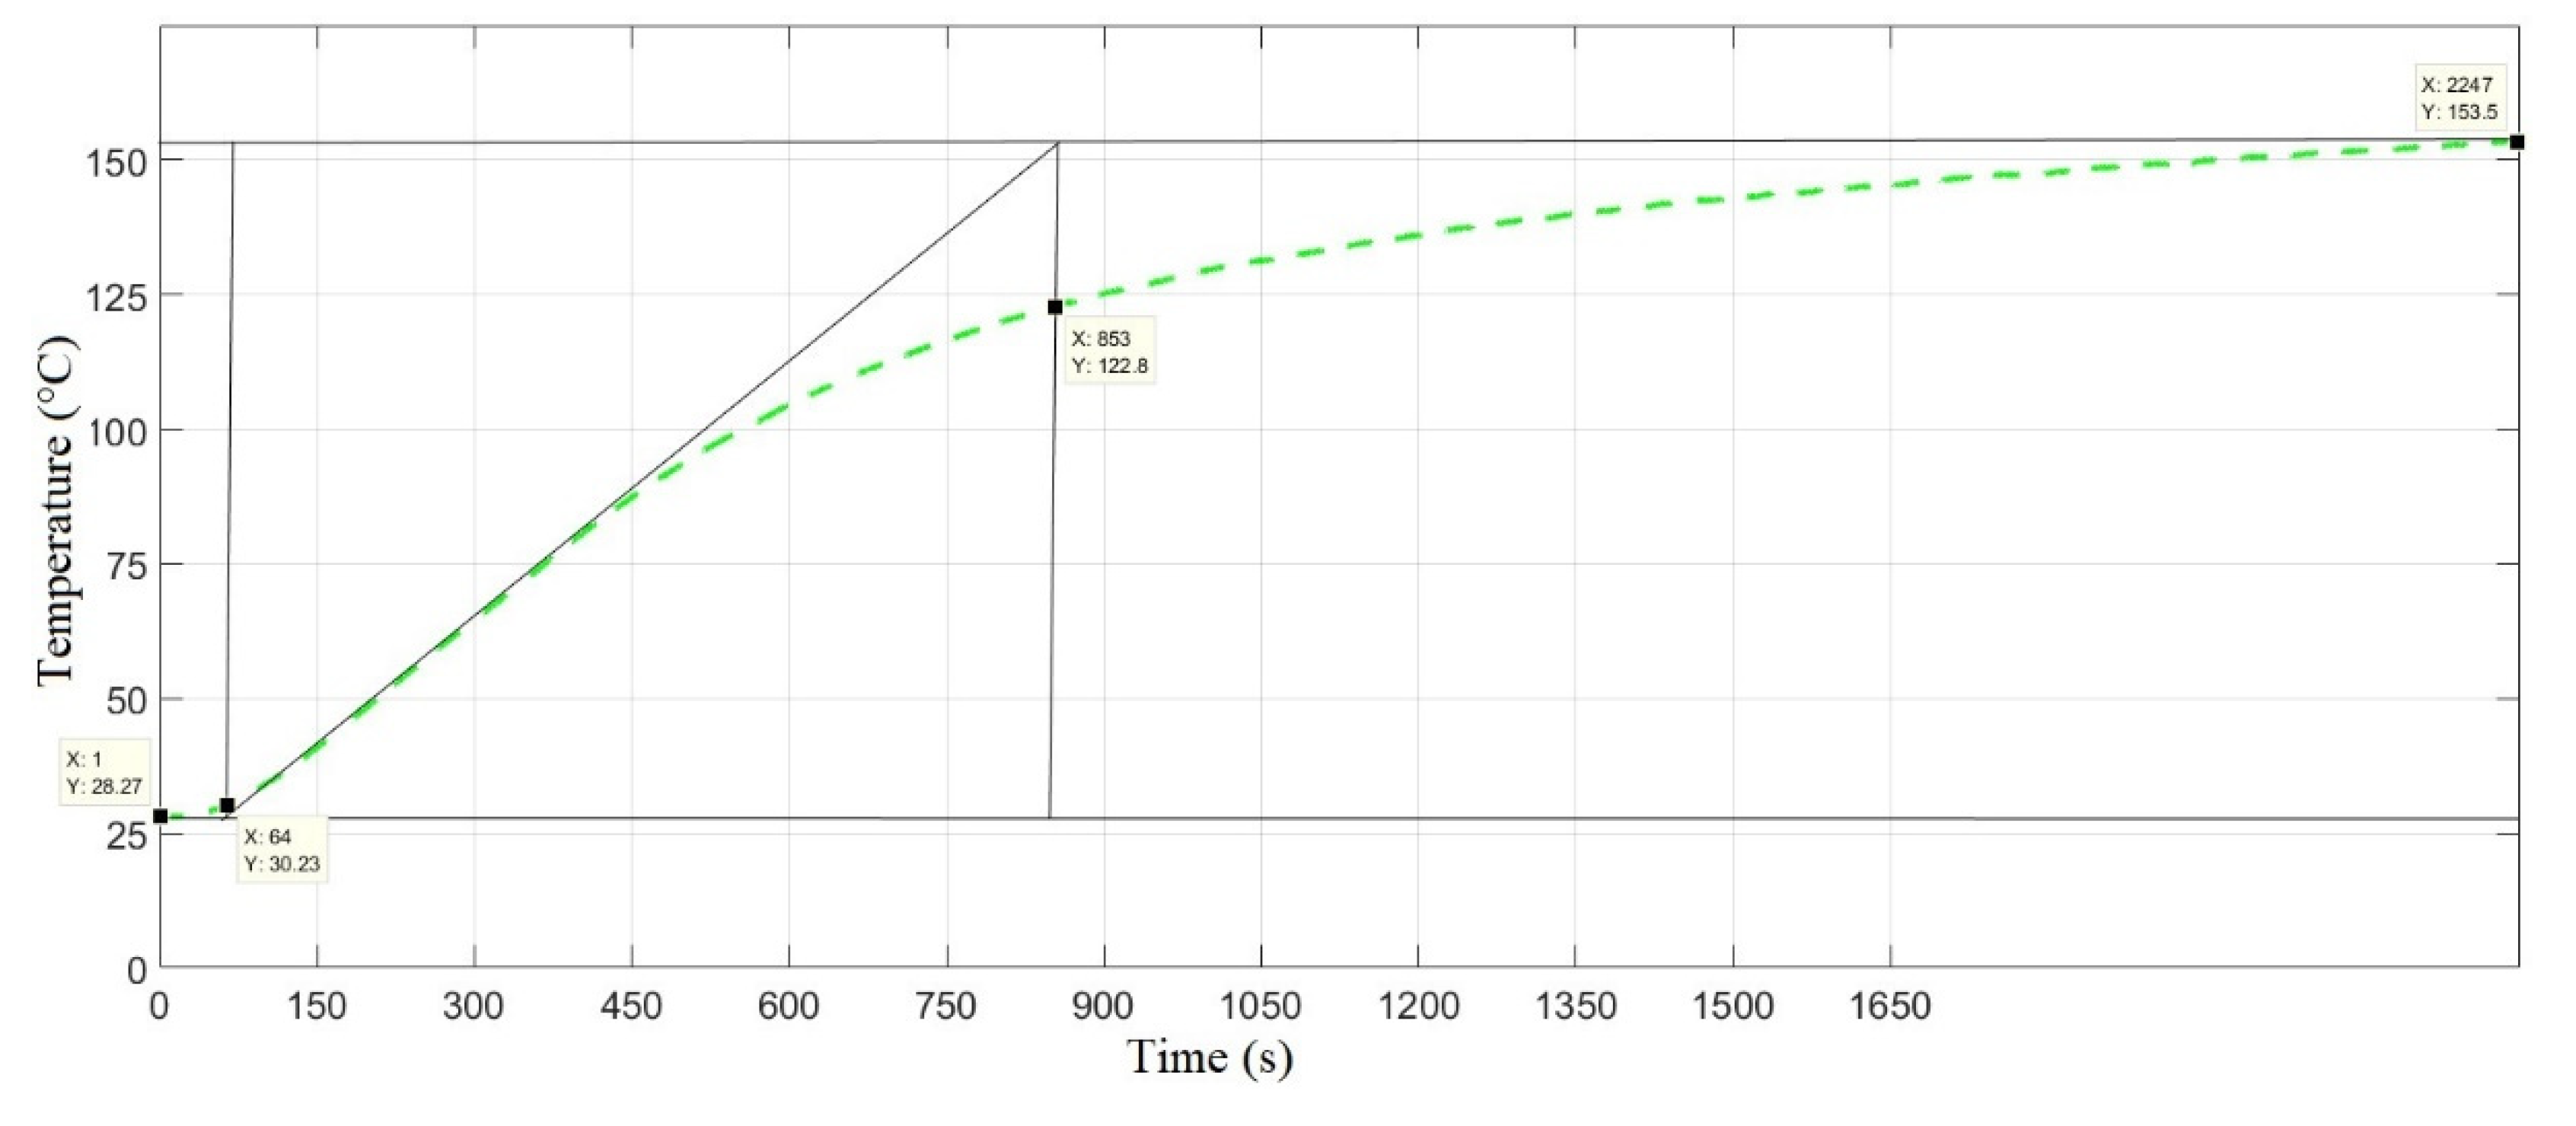
Figure 12.
Temperature change over time for a single panel.
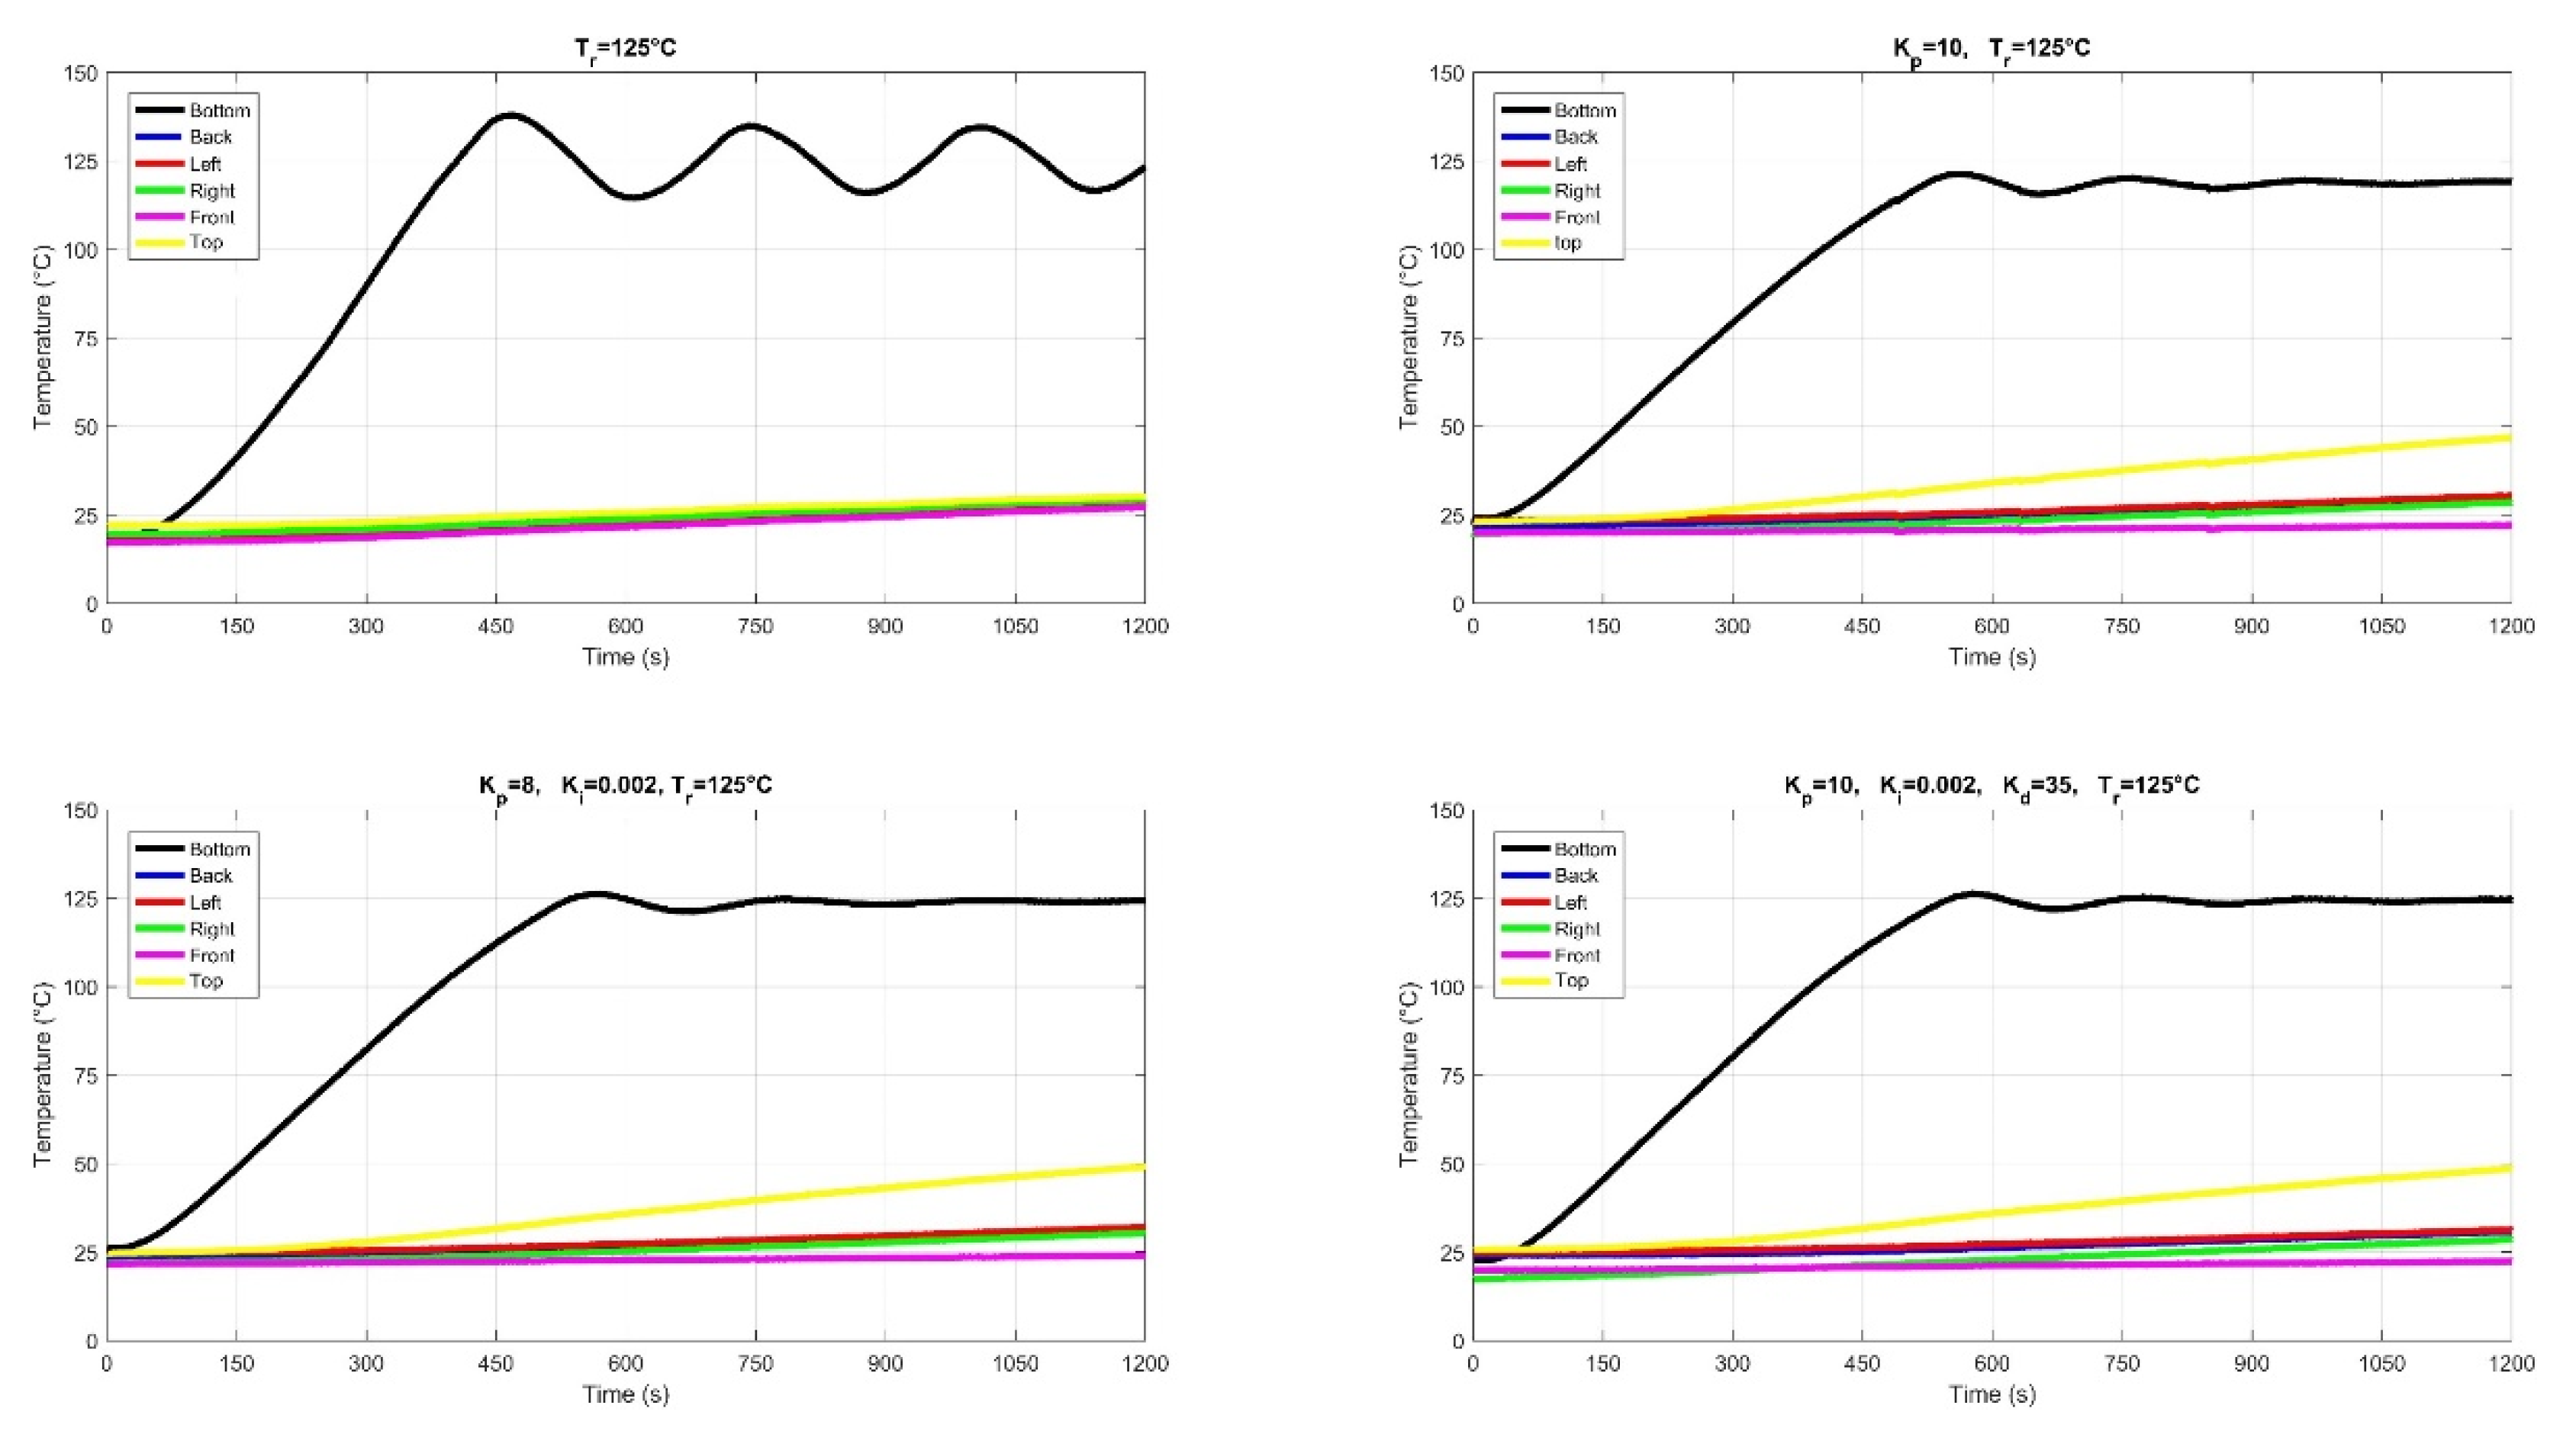
Figure 13.
Change in control signal over time for a single panel.
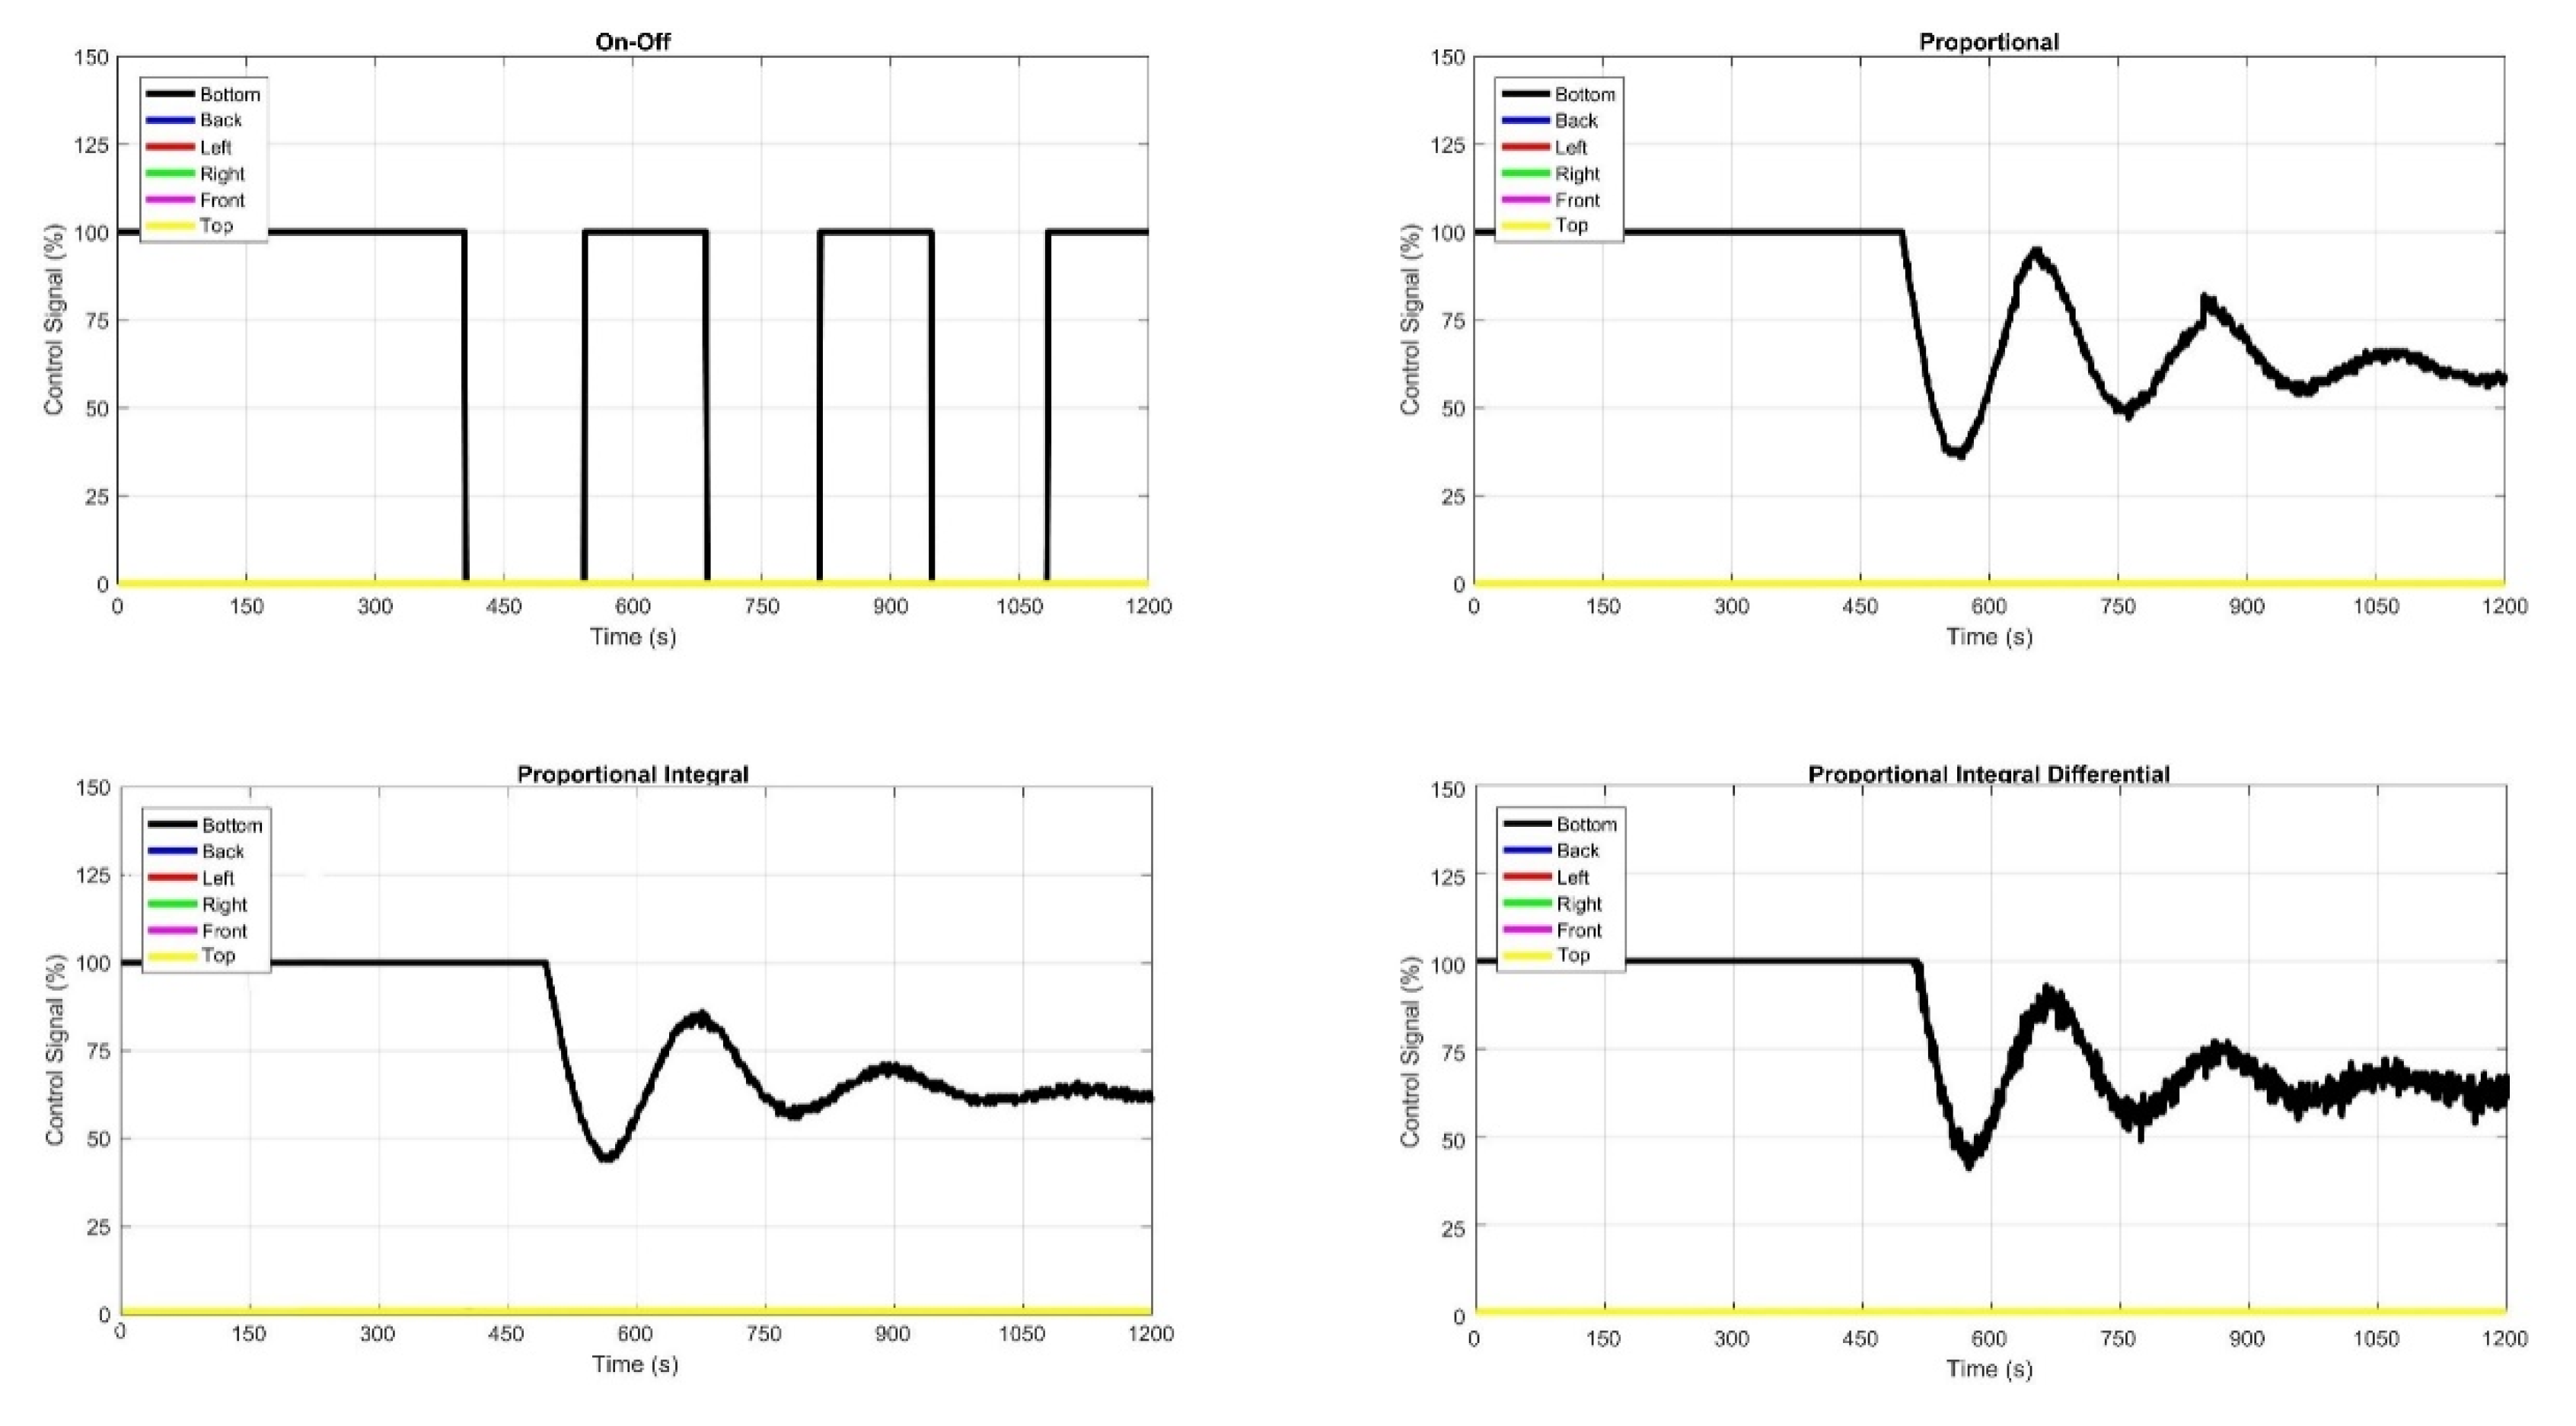
Figure 14.
Temperature changes over time for two panels.
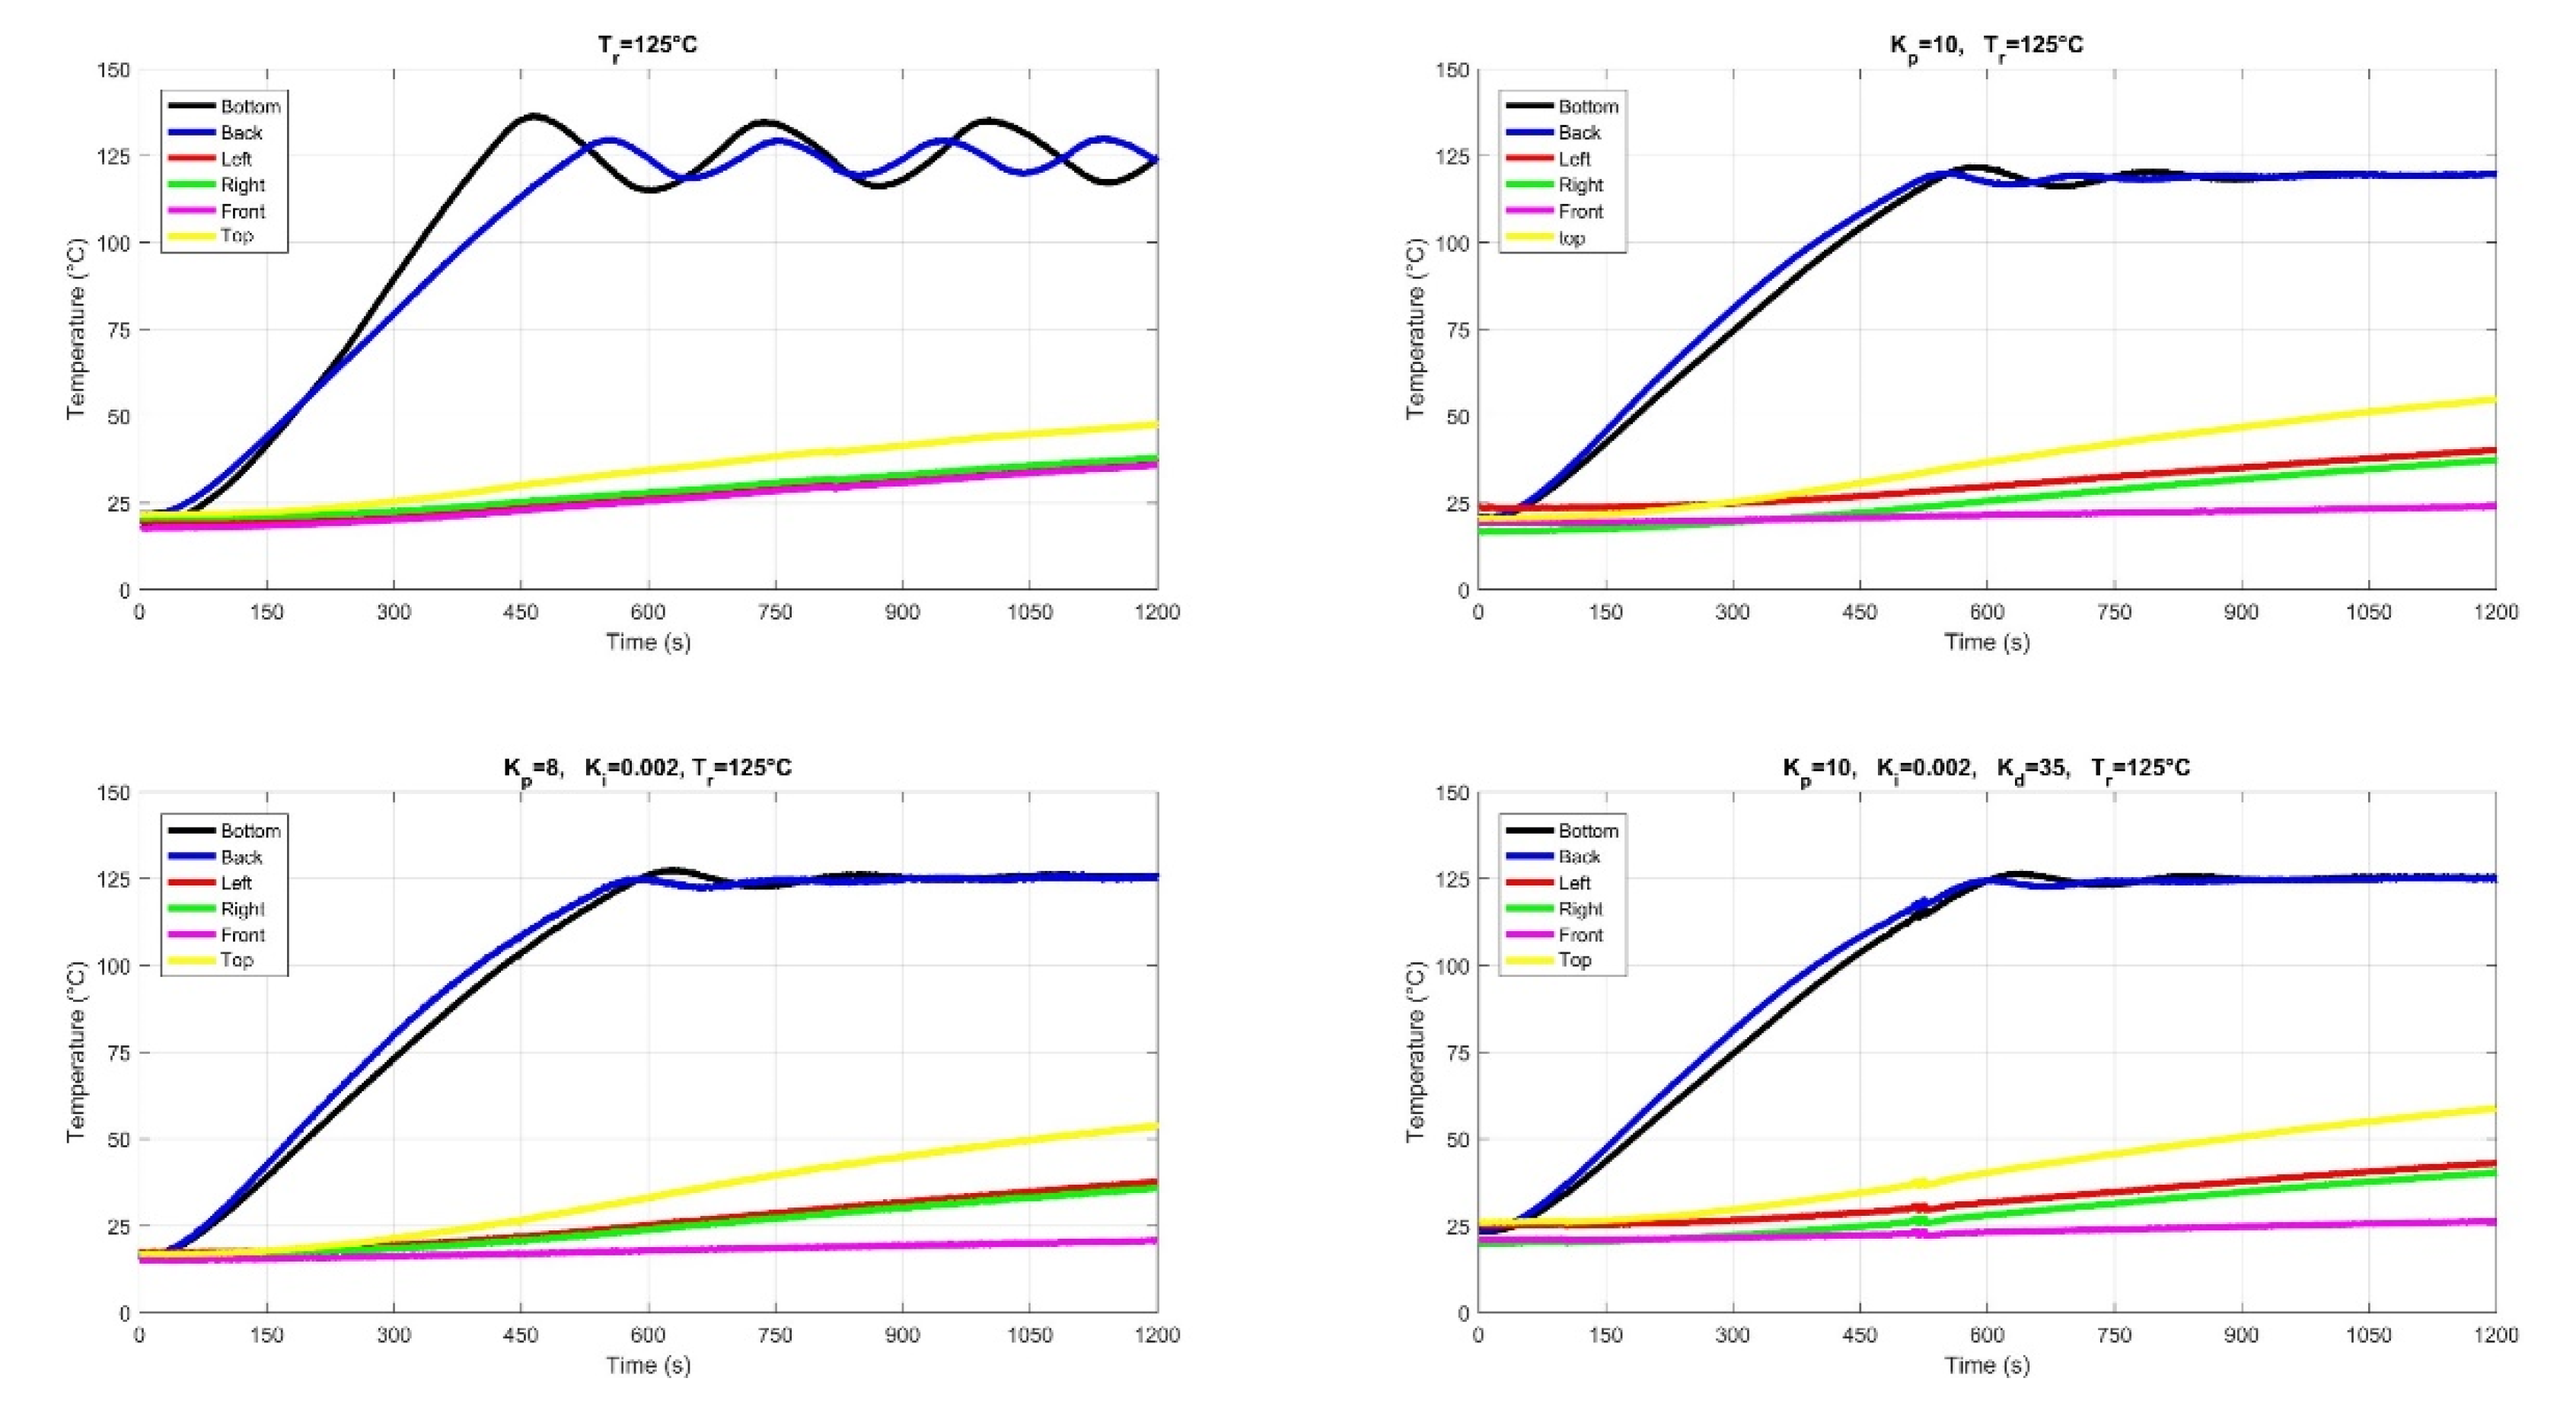
Figure 15.
Change in control signal over time for the two panels.
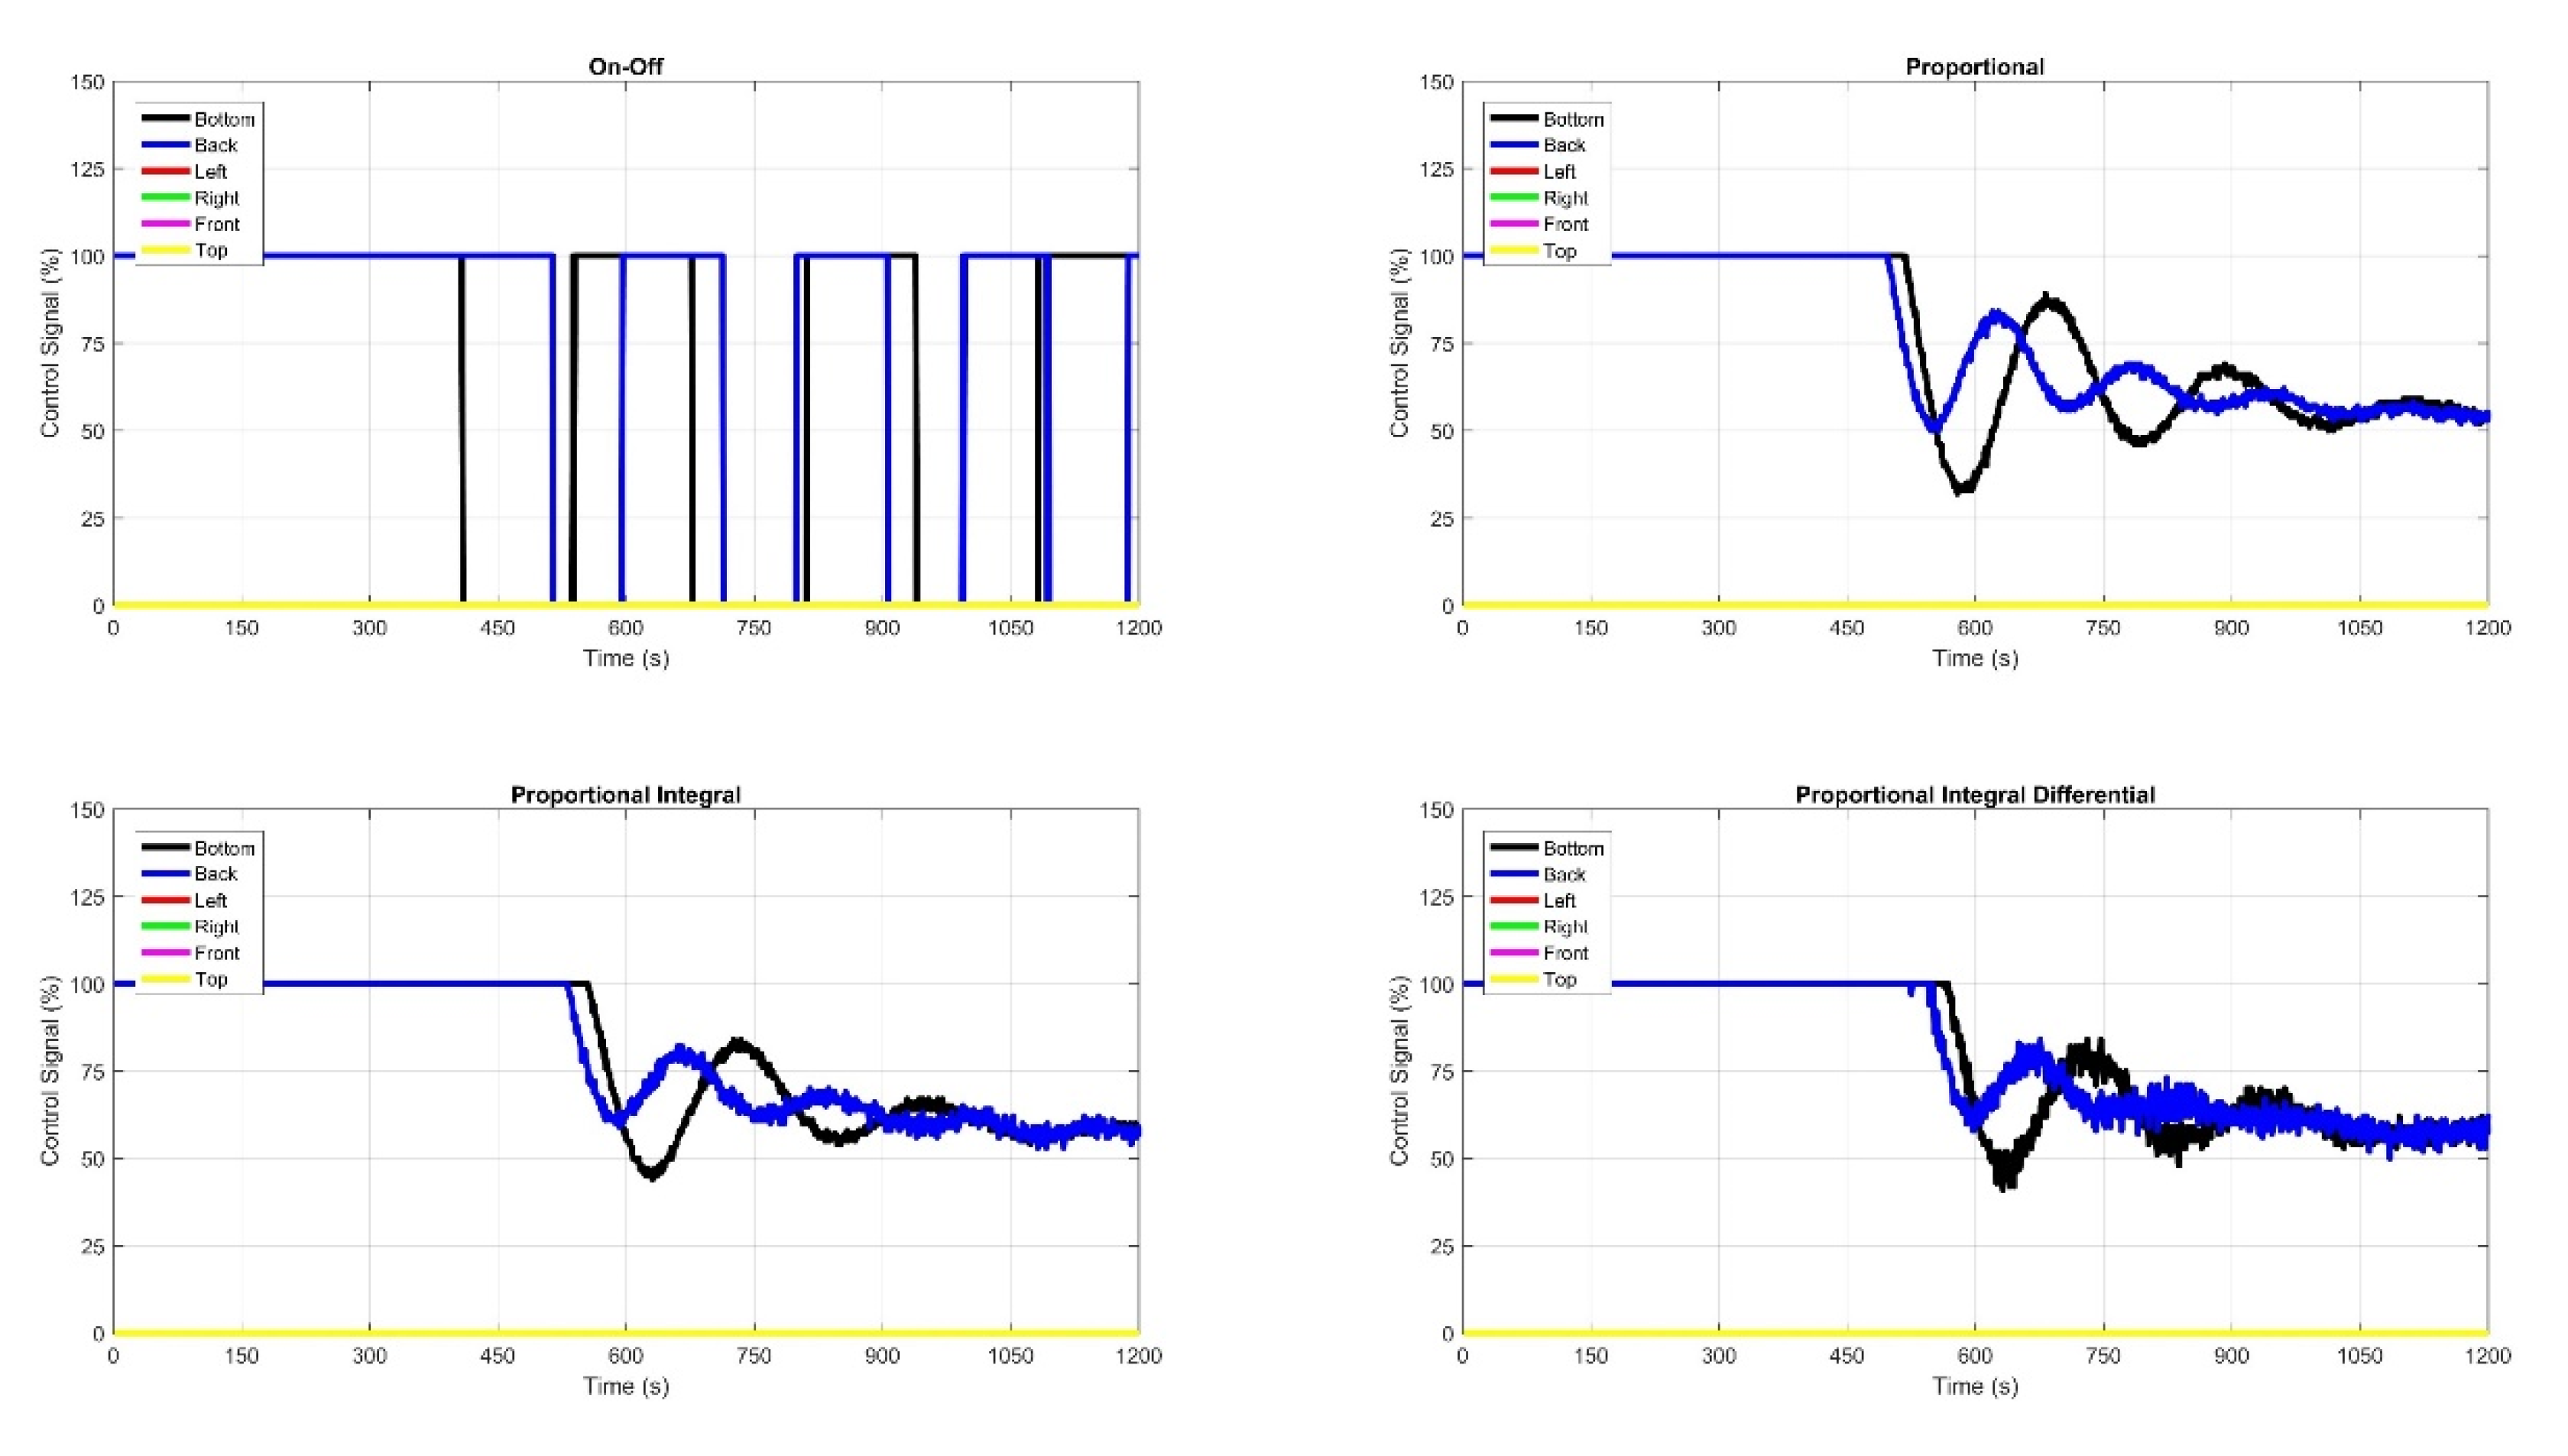
Figure 16.
Temperature changes over time for the three panels.
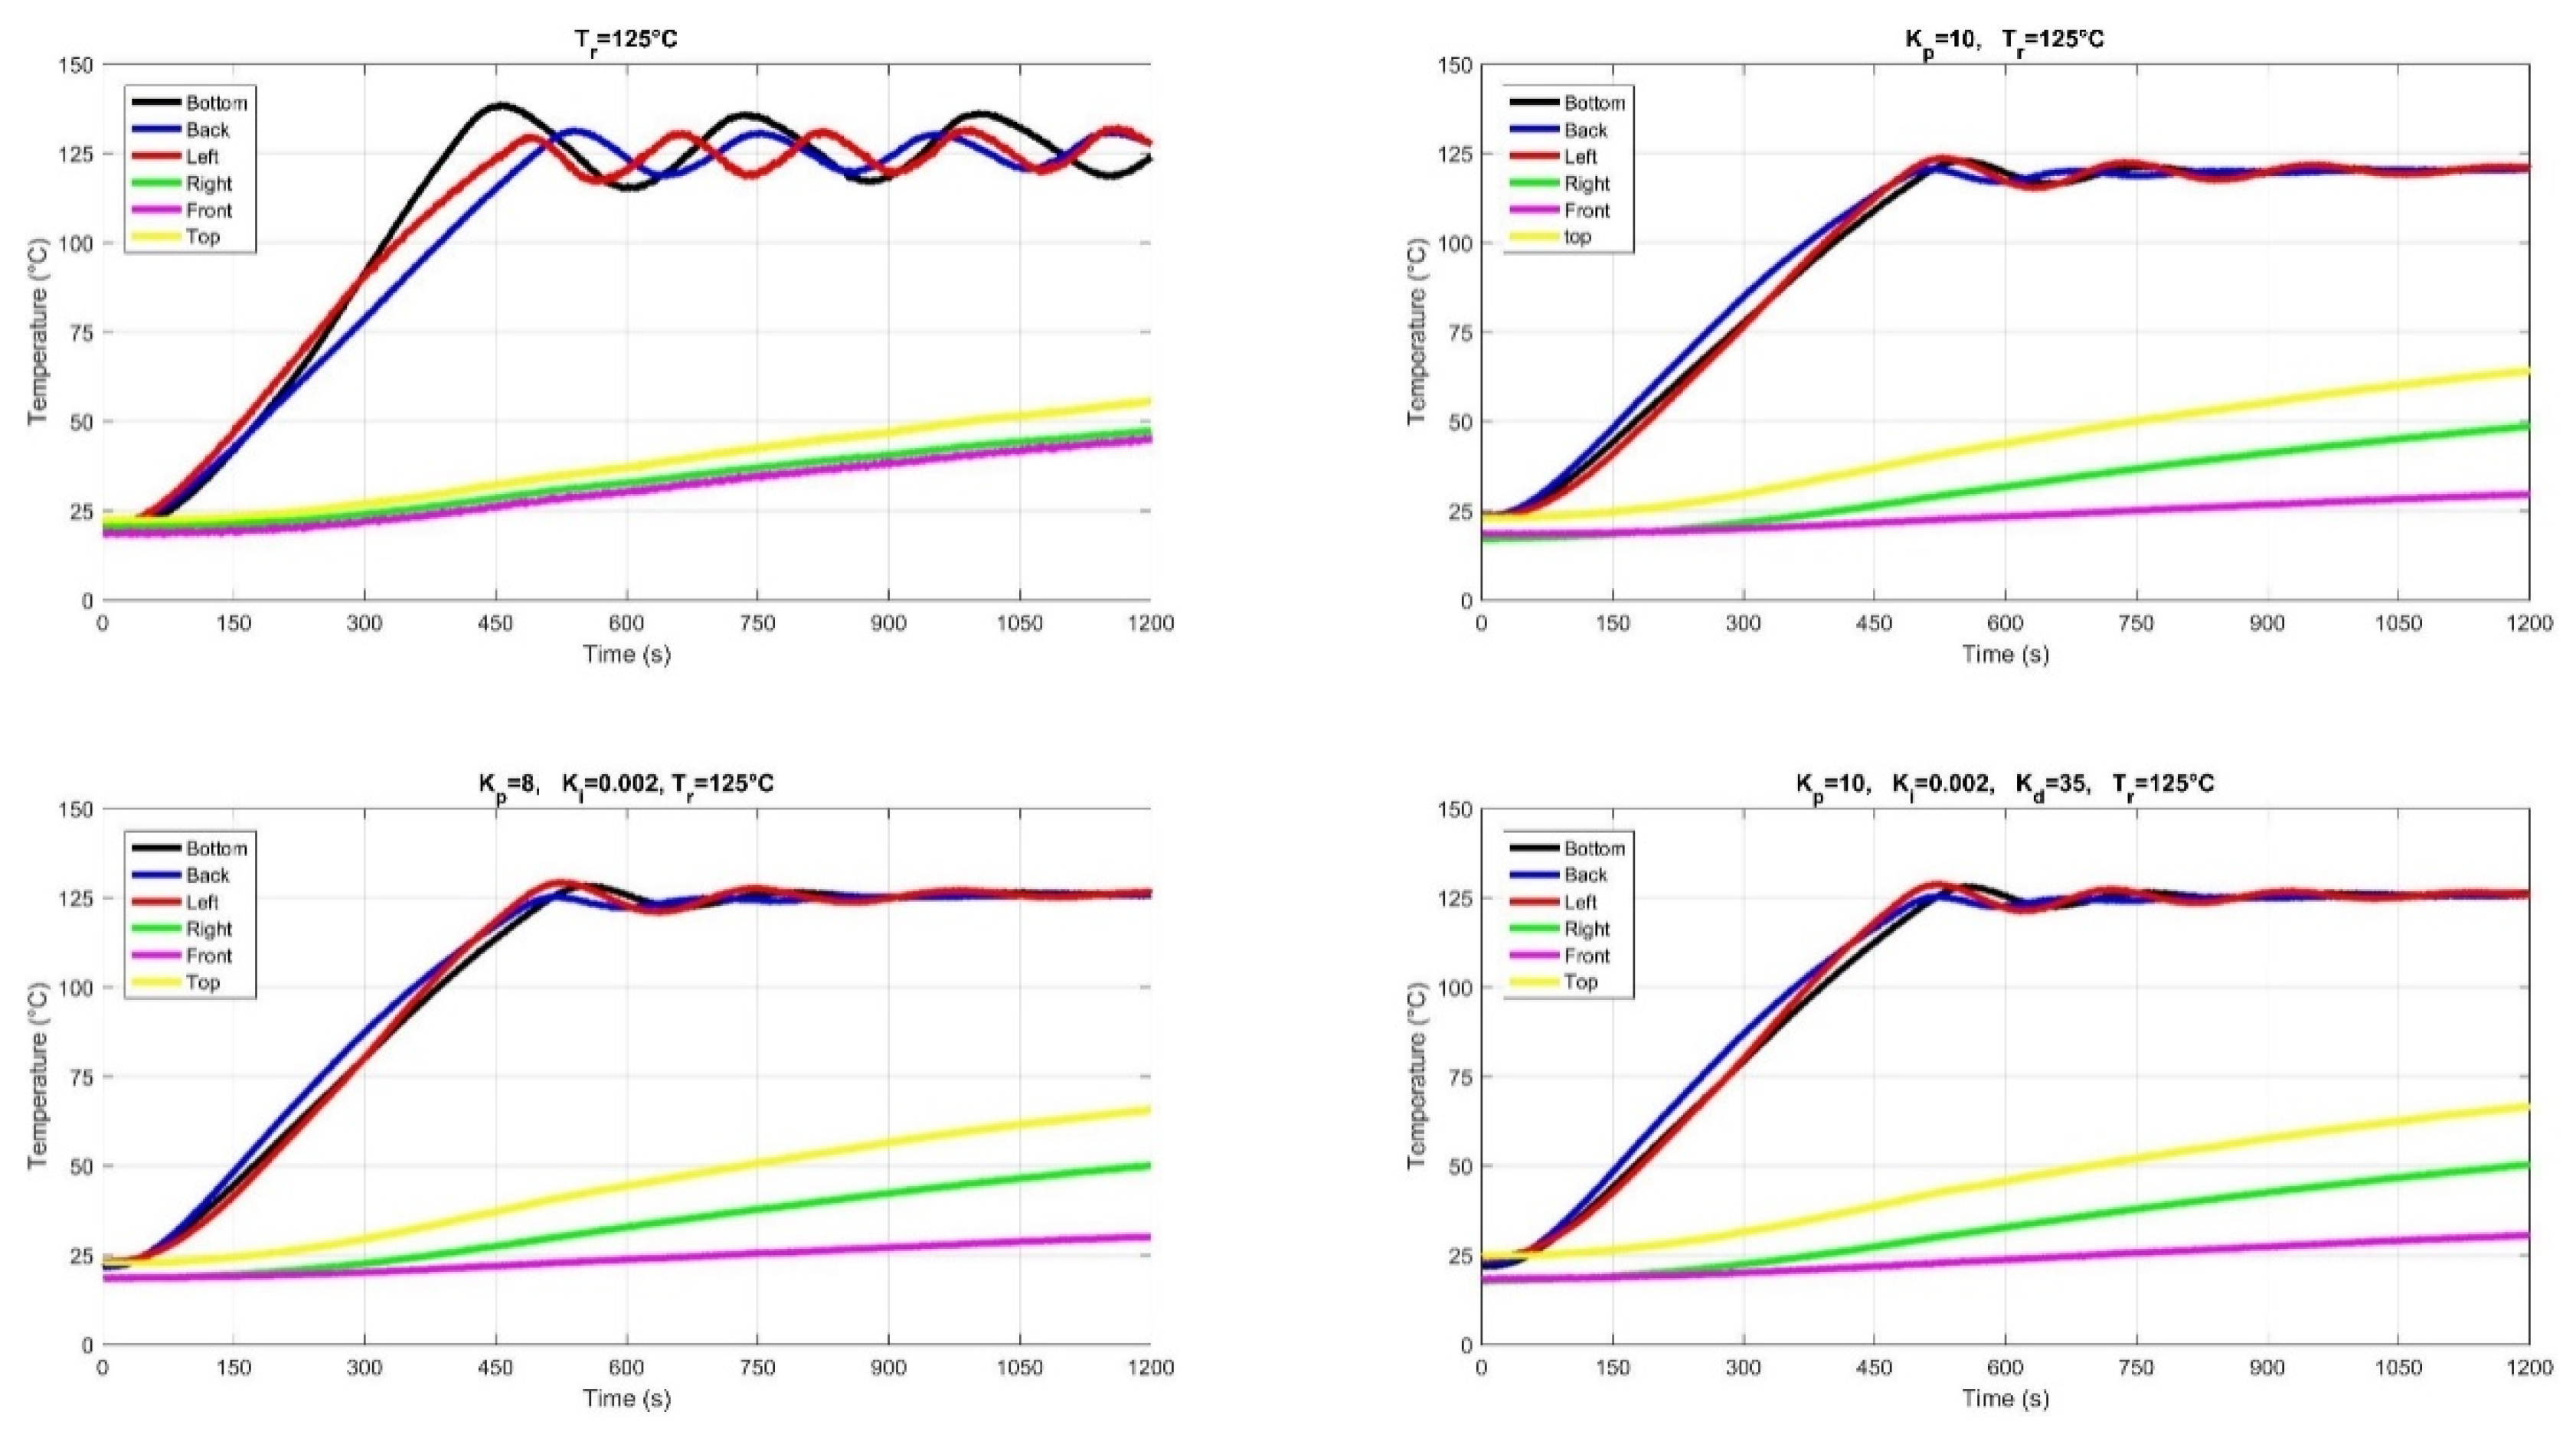
Figure 17.
Change in control signal over time for the three panels.
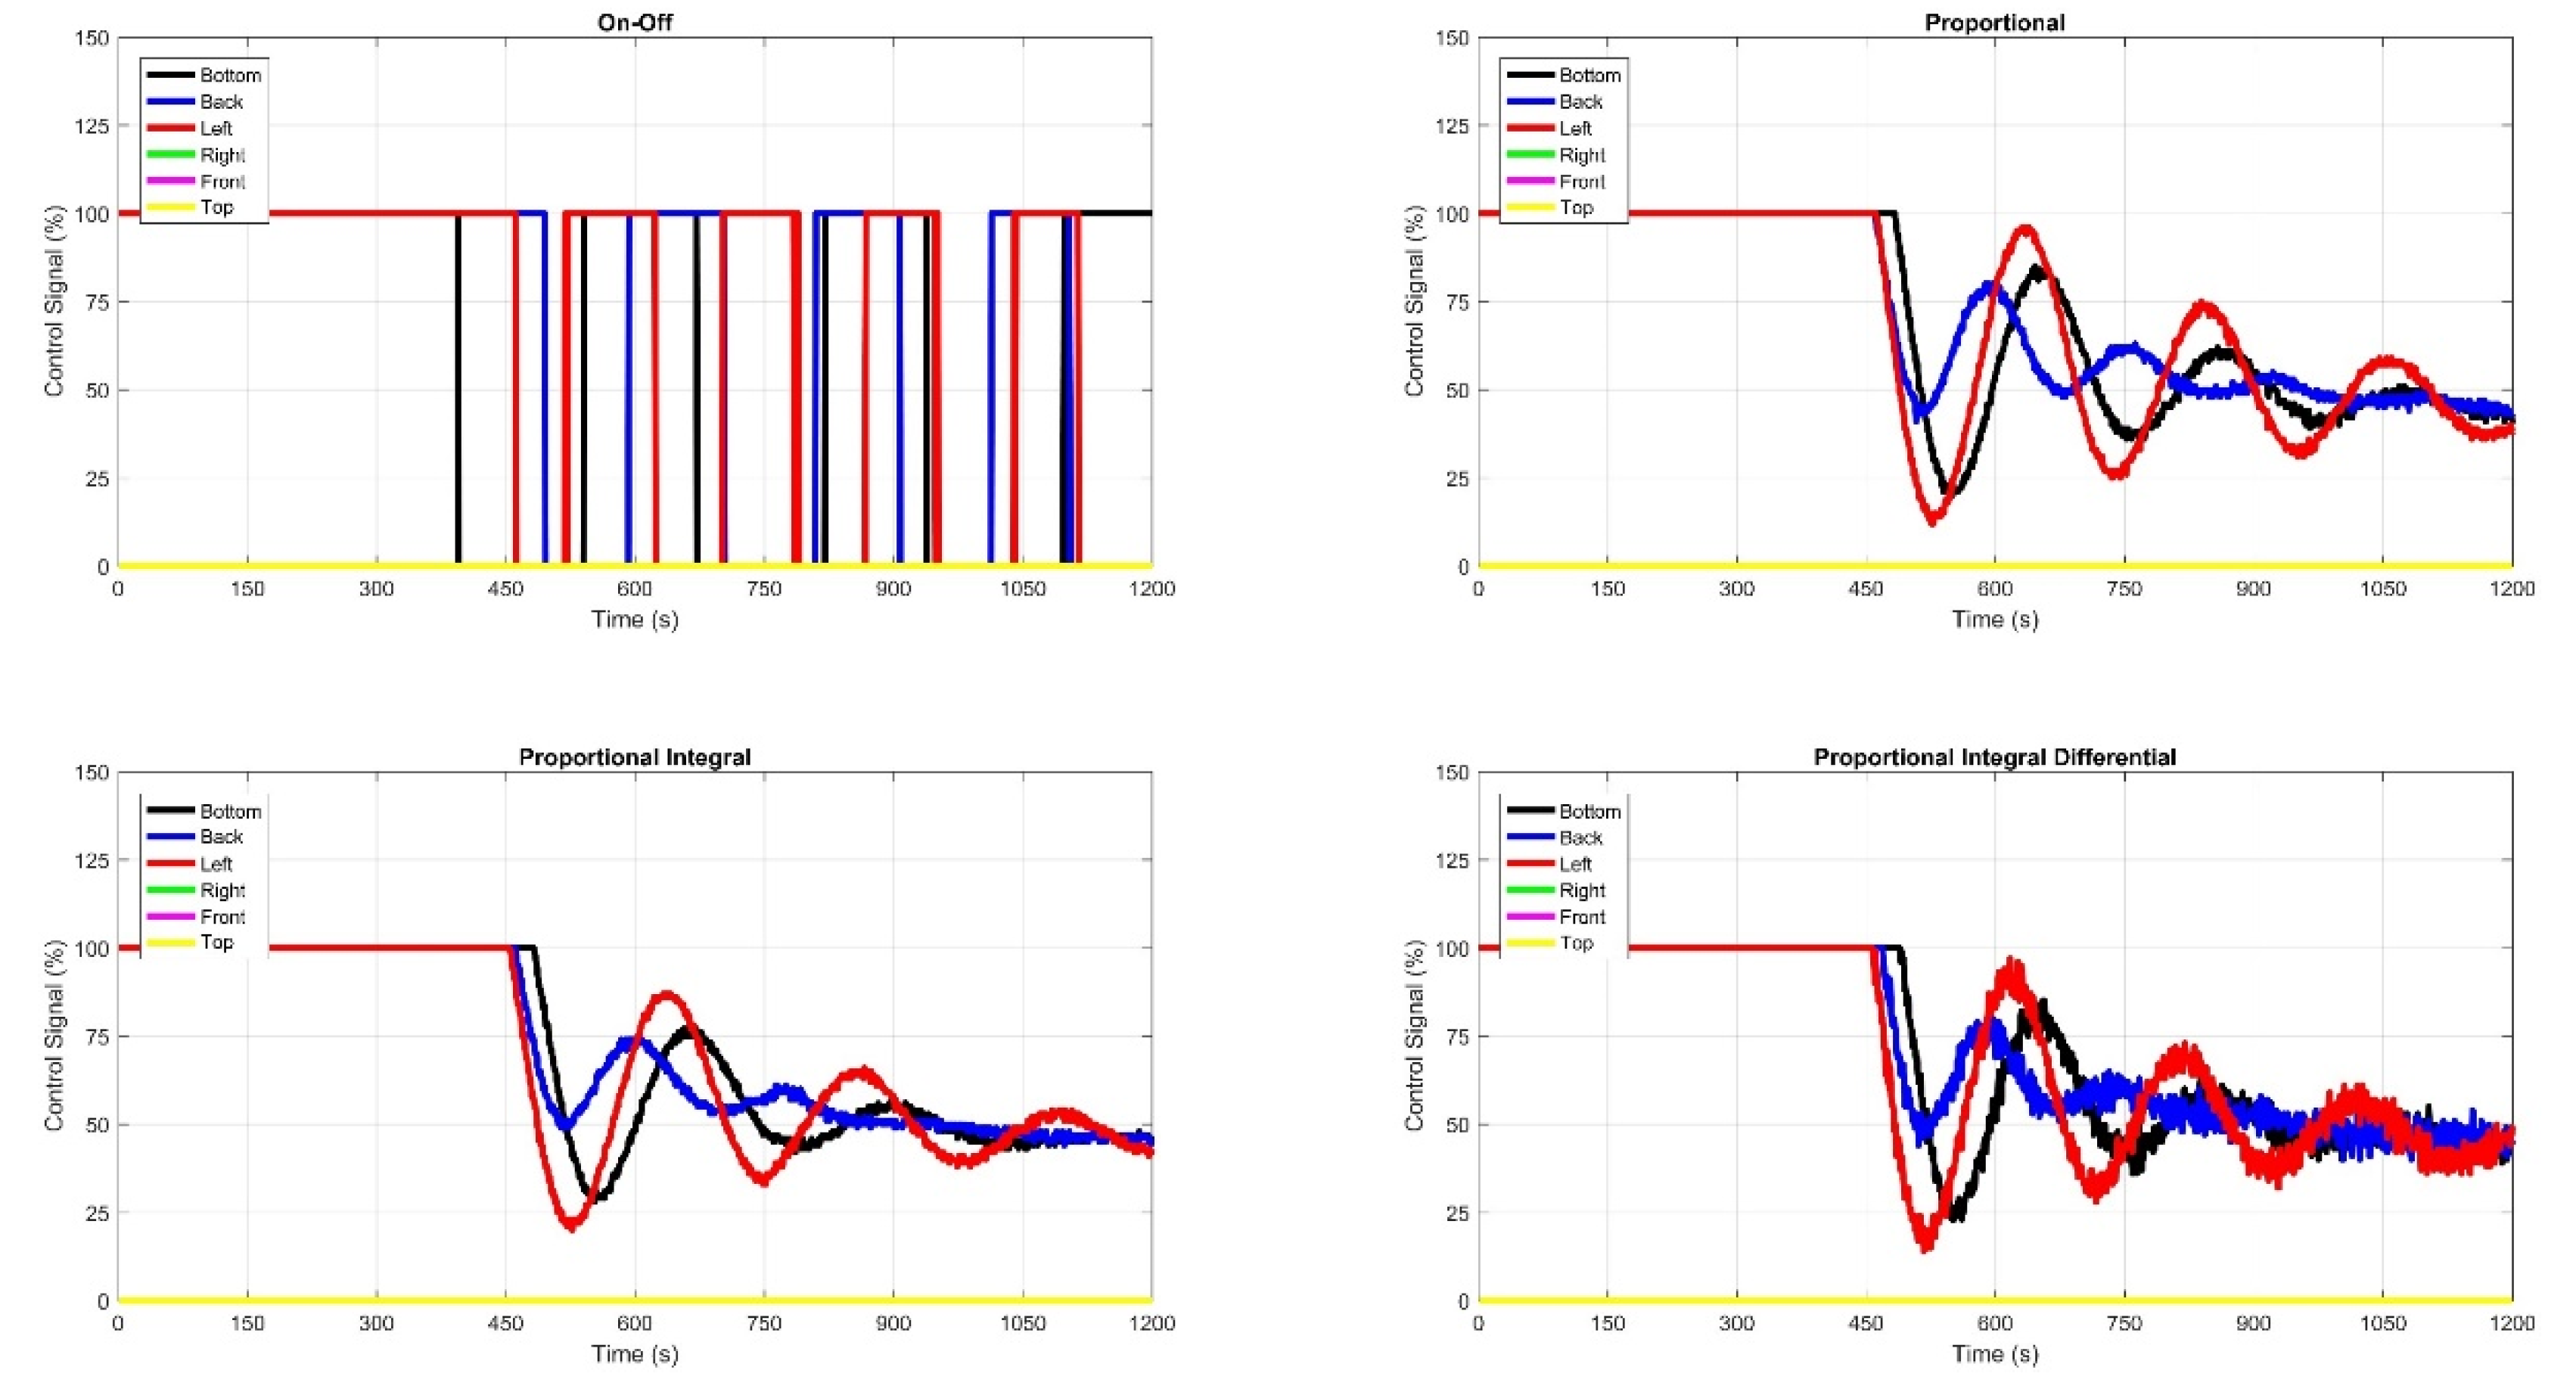
Figure 18.
Temperature changes over time for the four panels.
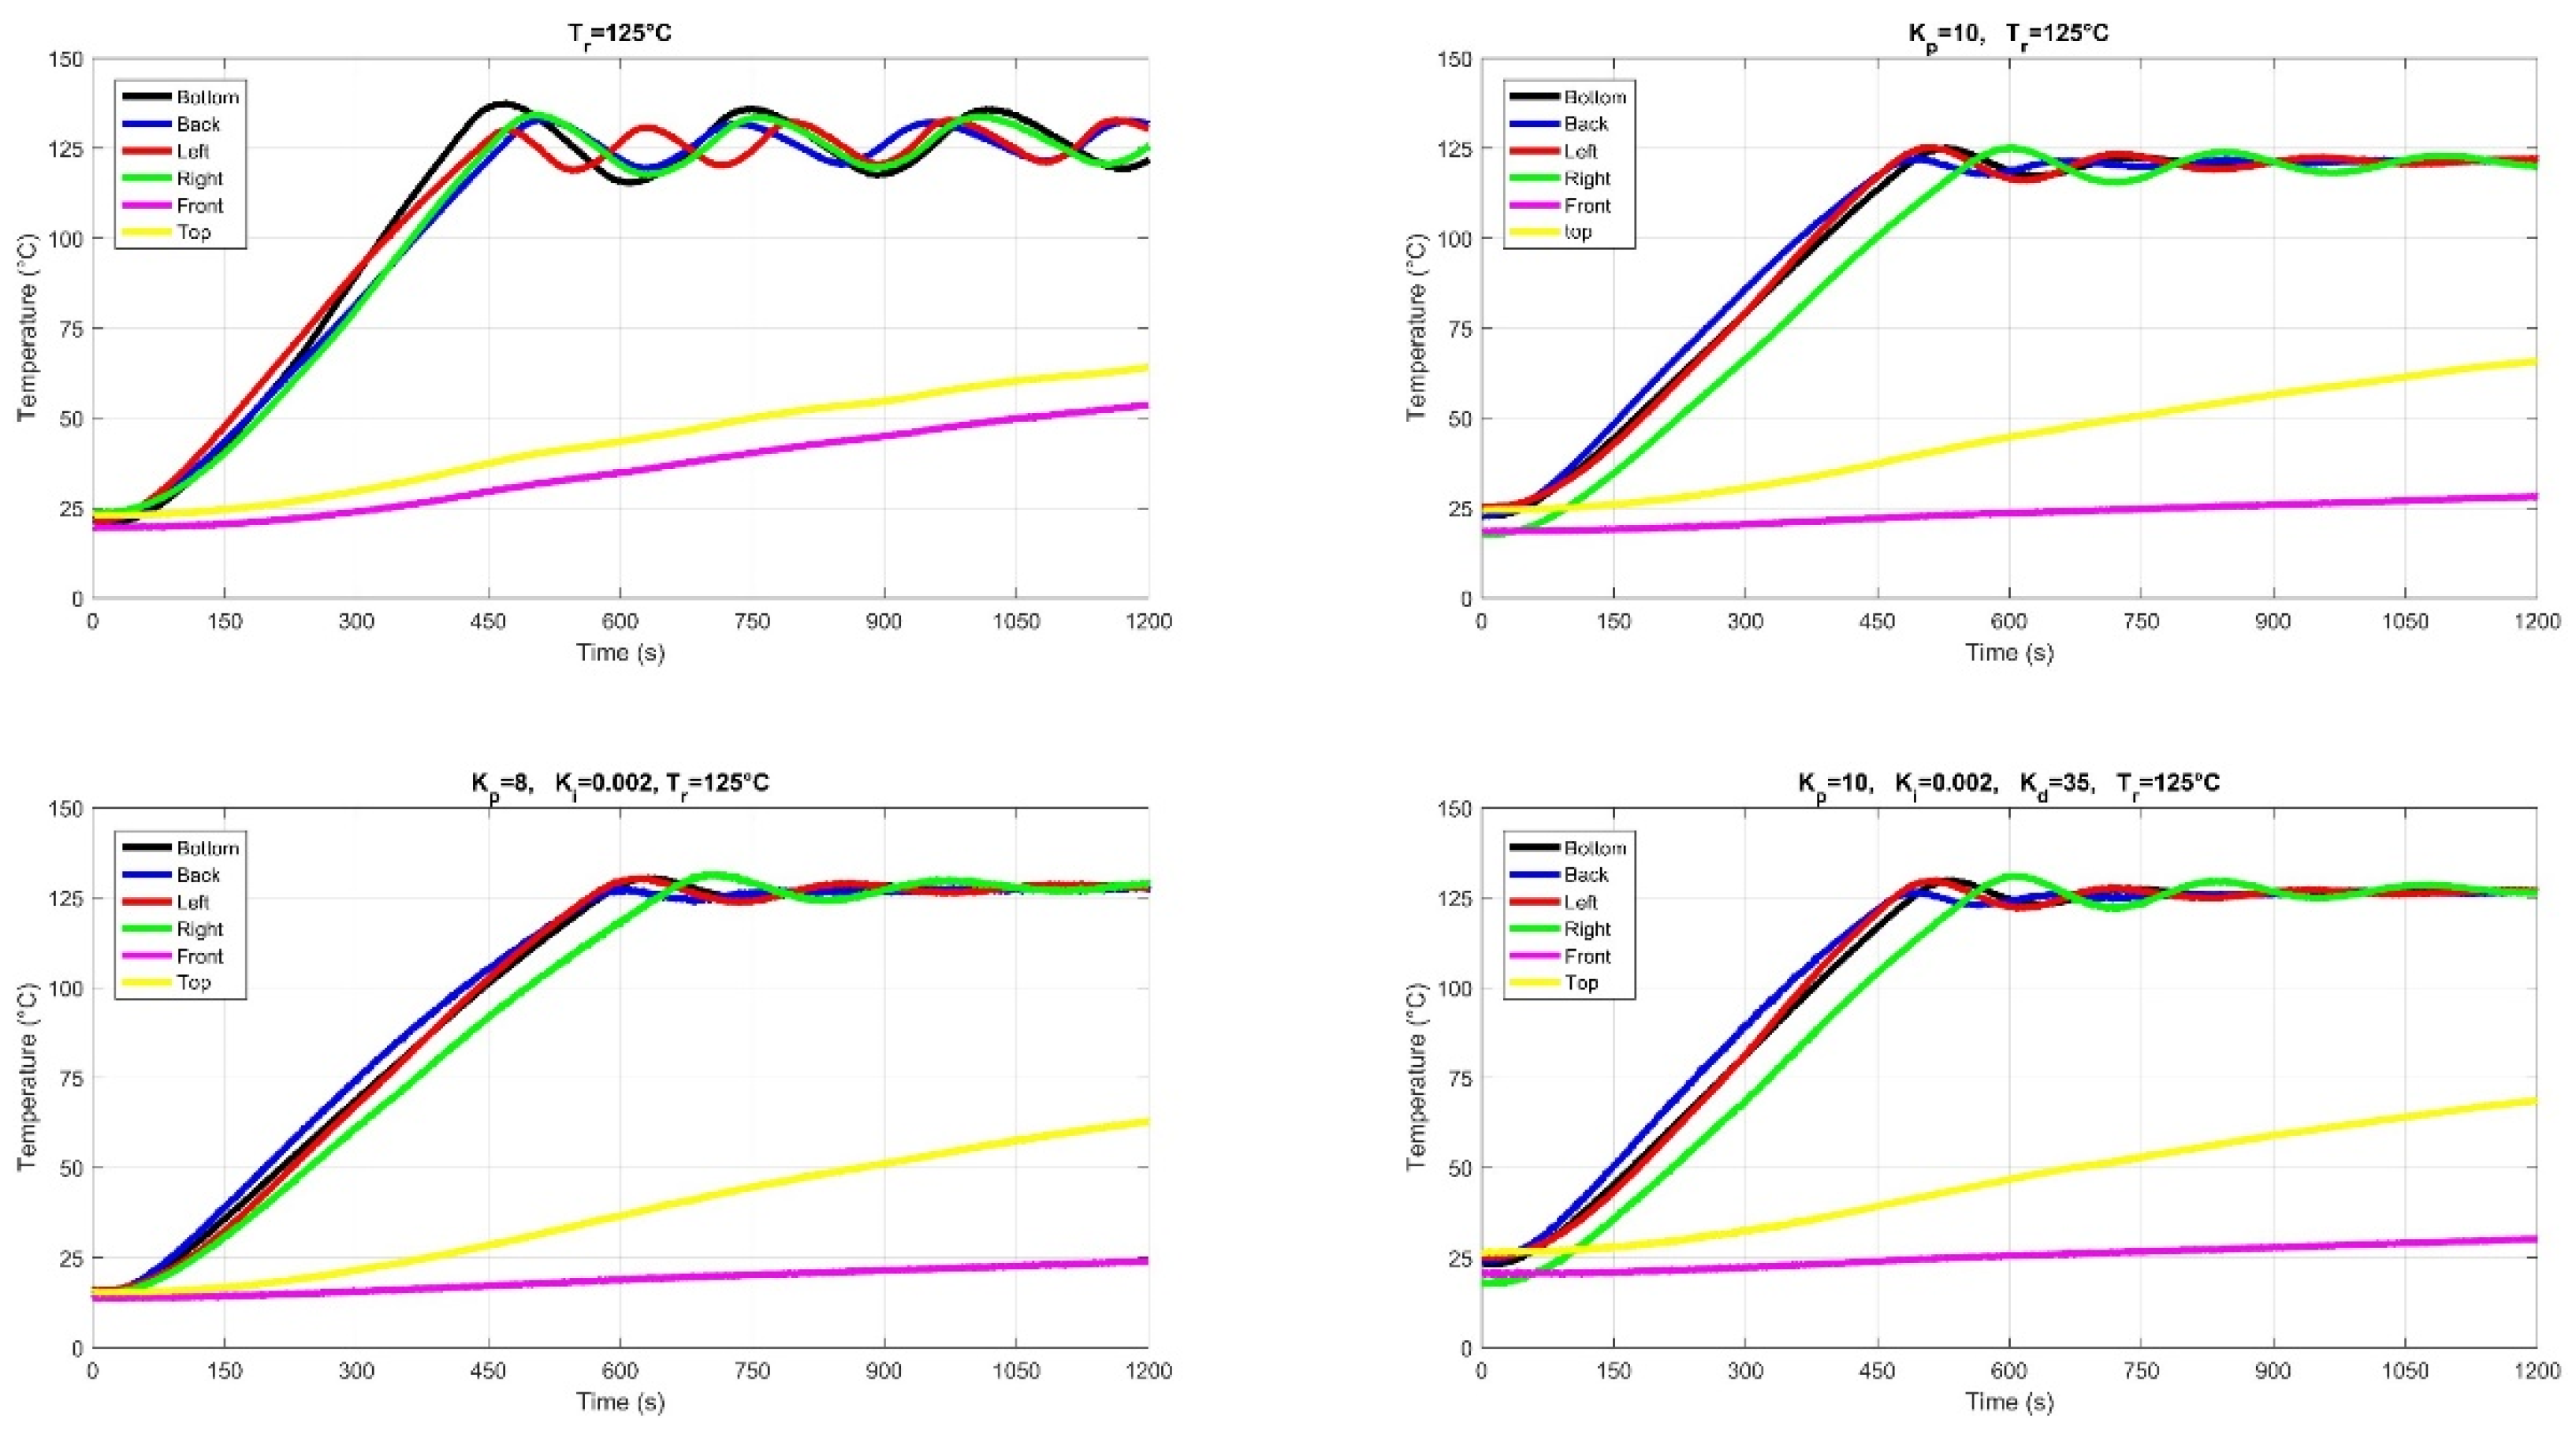
Figure 19.
Change in control signal over time for the four panels.
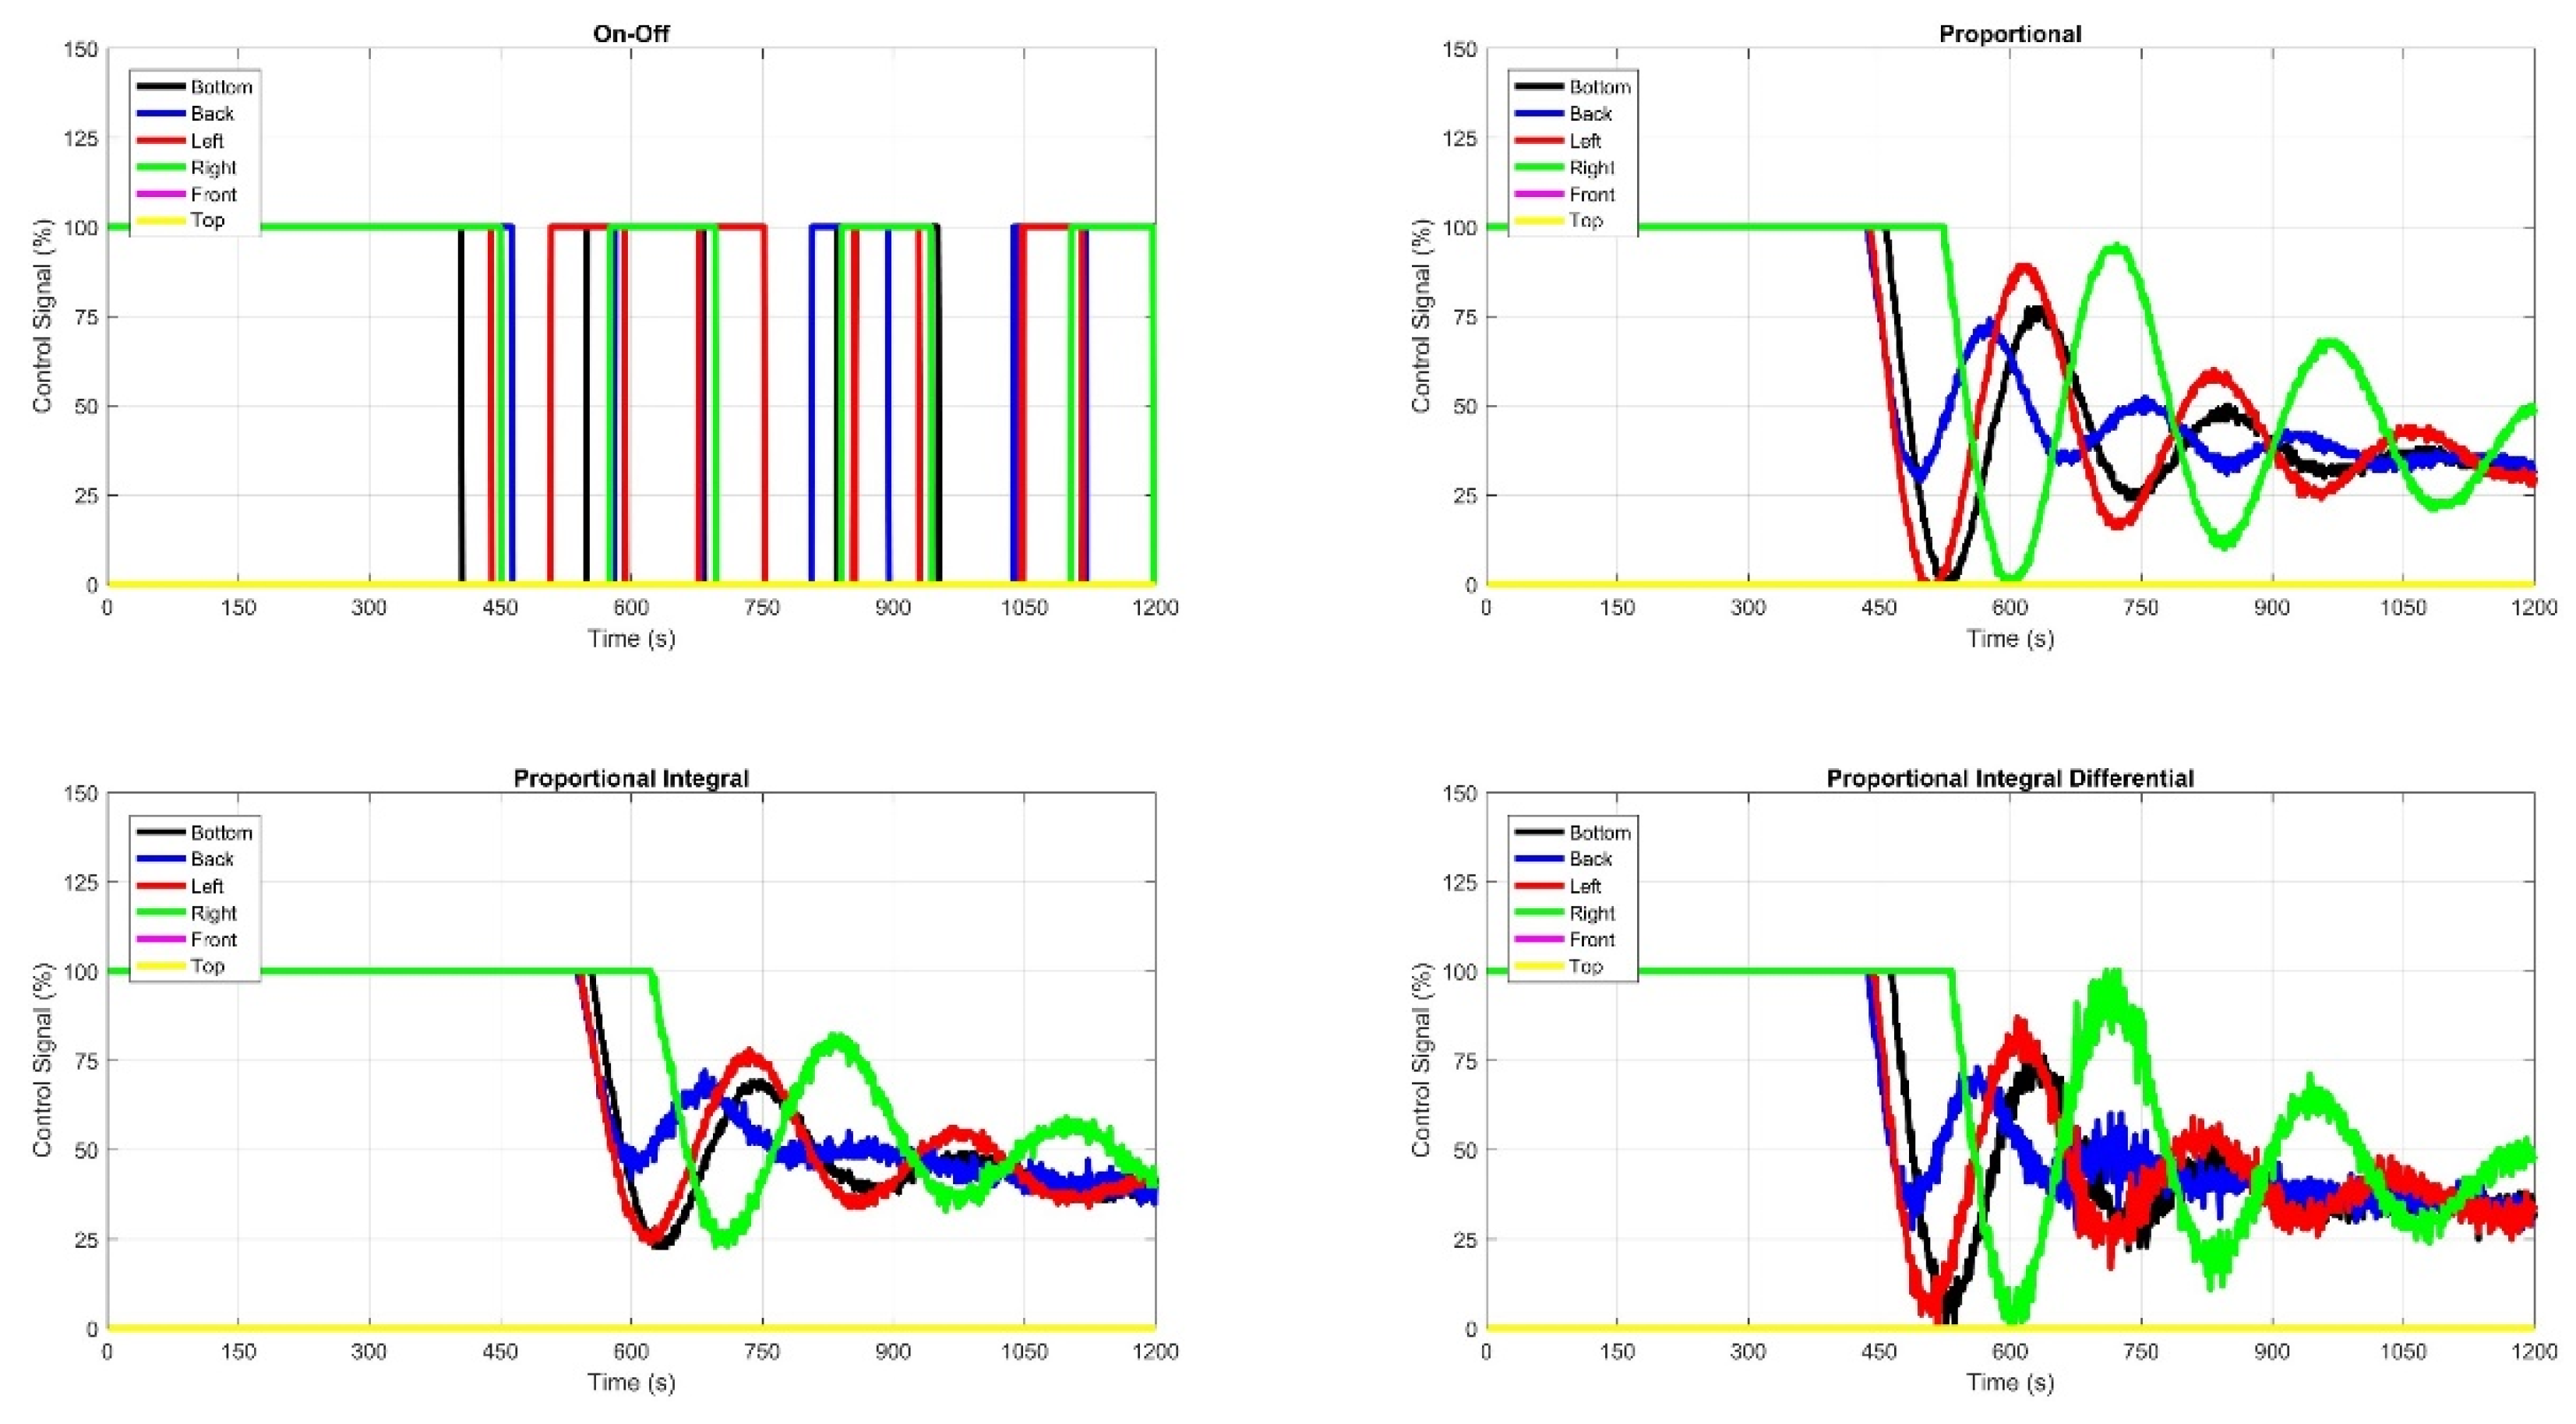
Figure 20.
Temperature changes over time for the five panels.
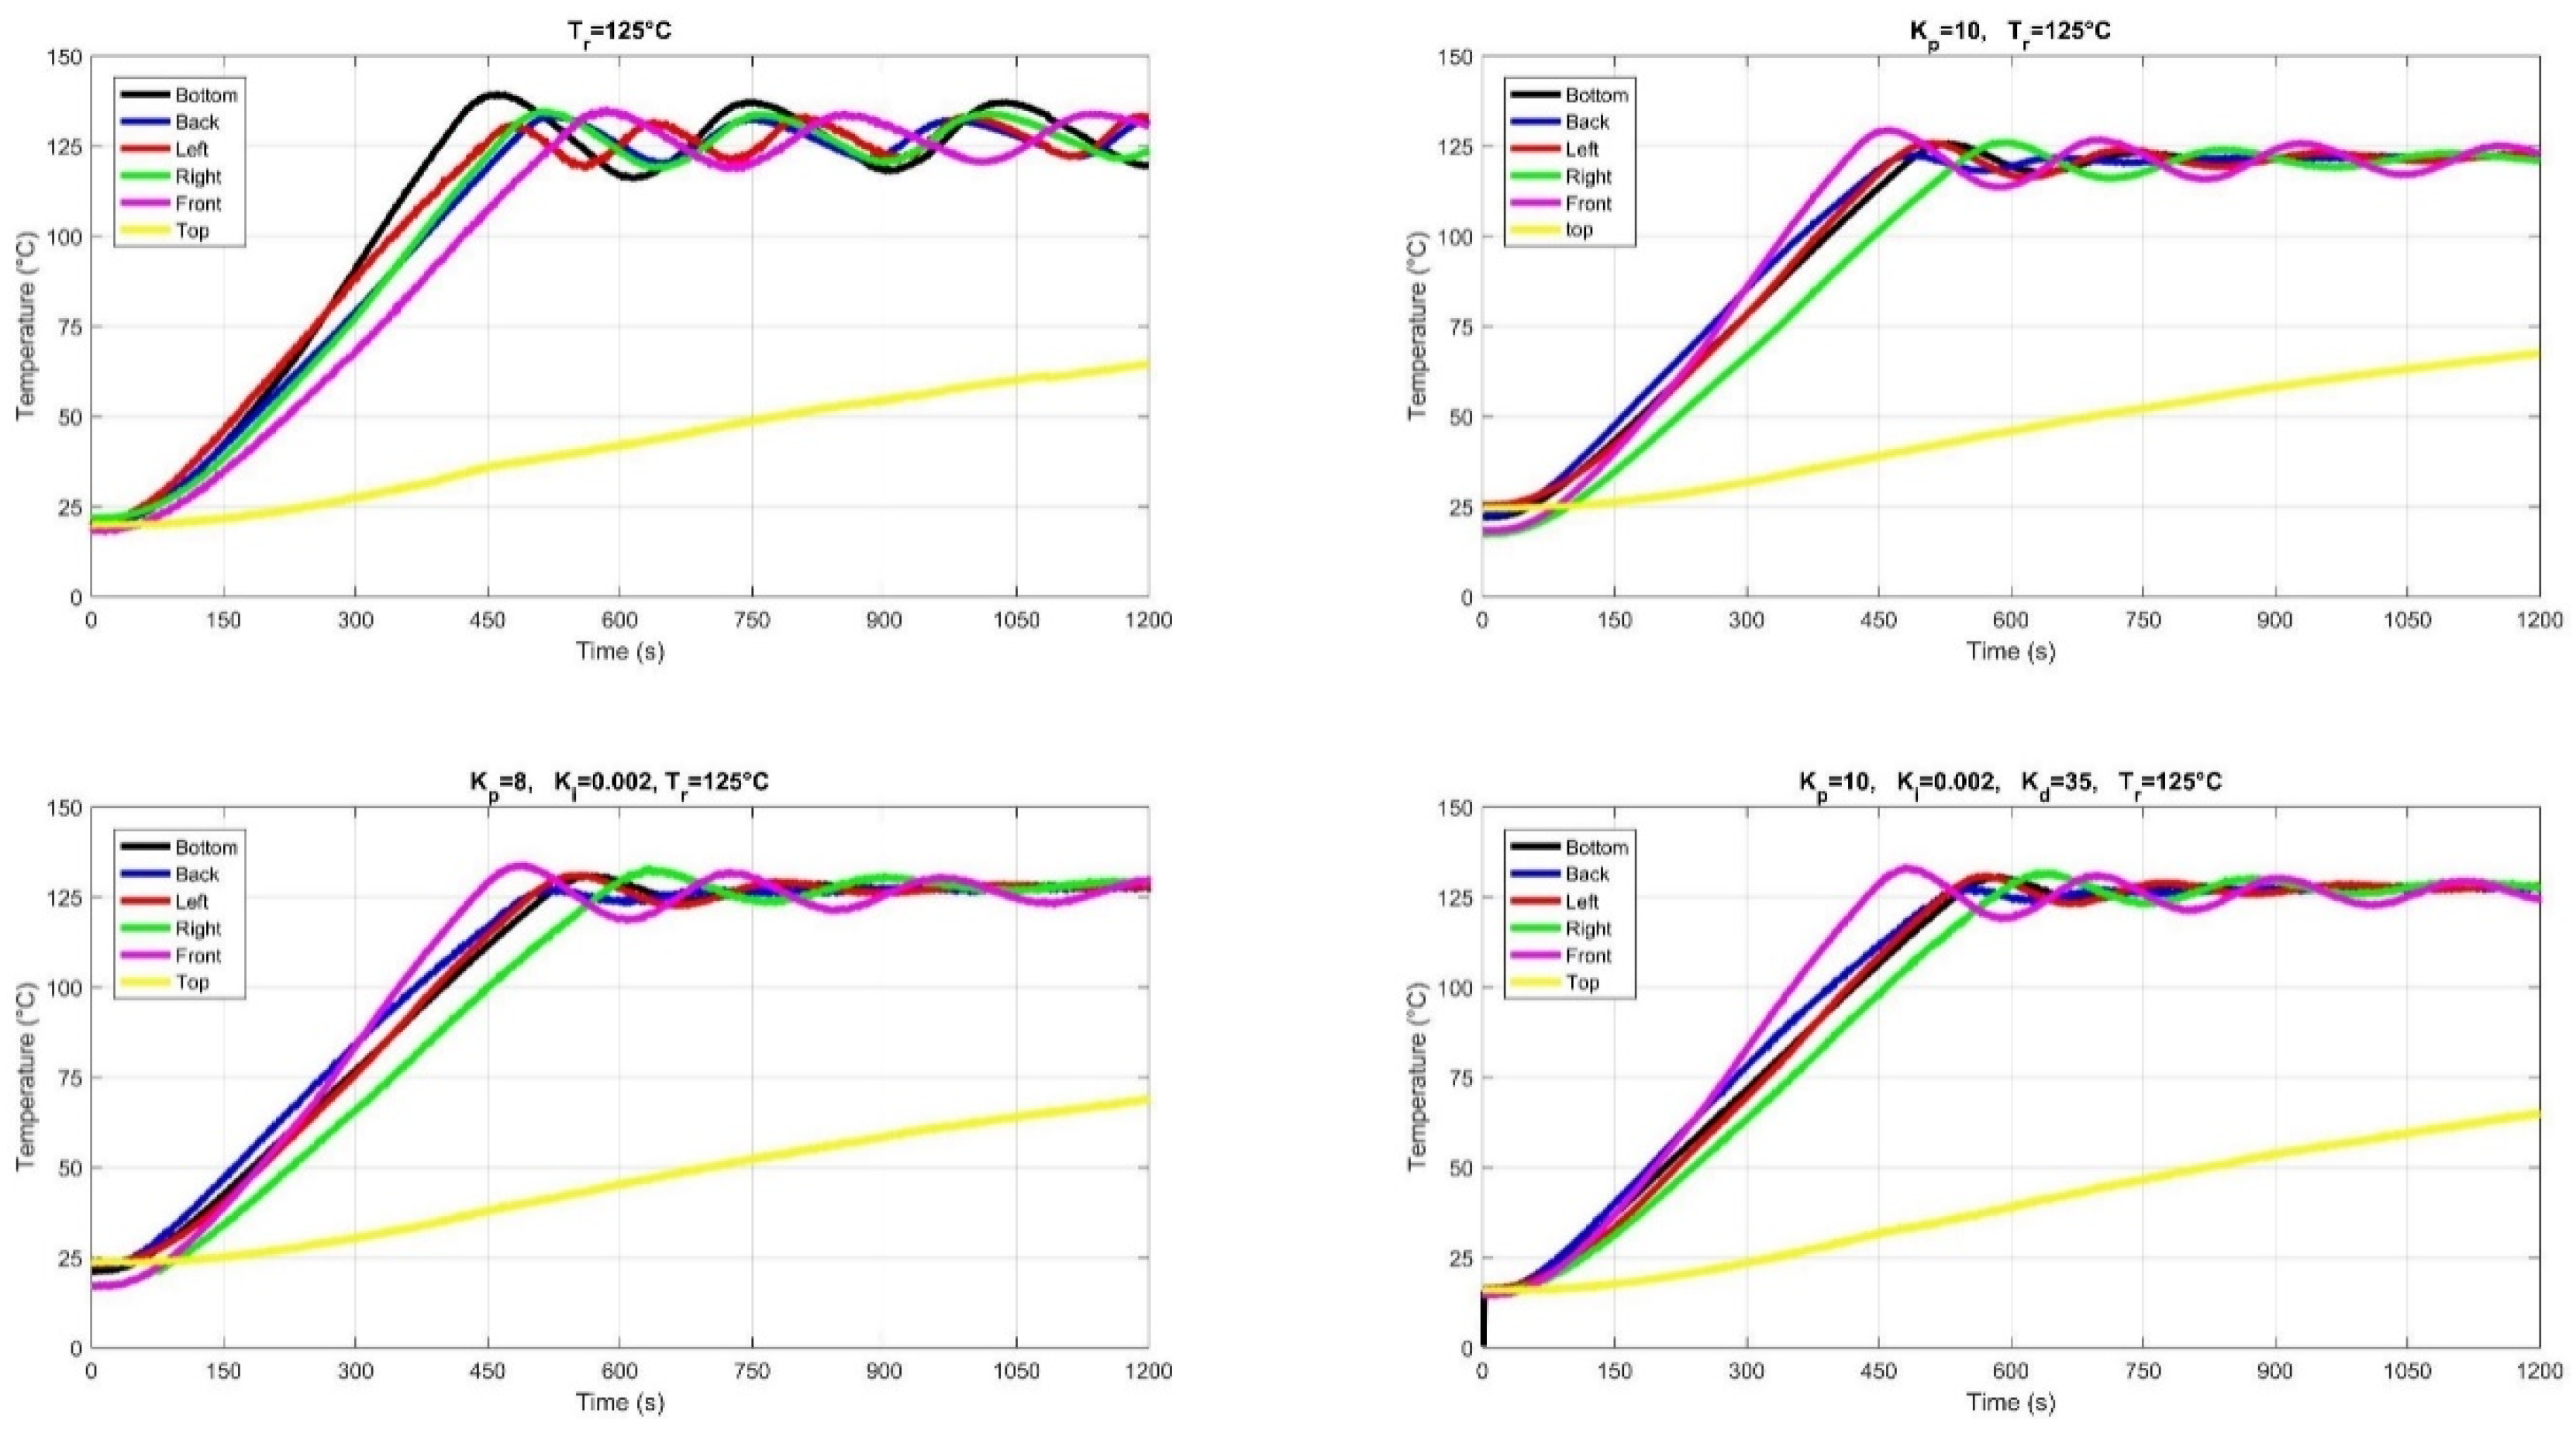
Figure 21.
Change in control signal over time for the five panels.
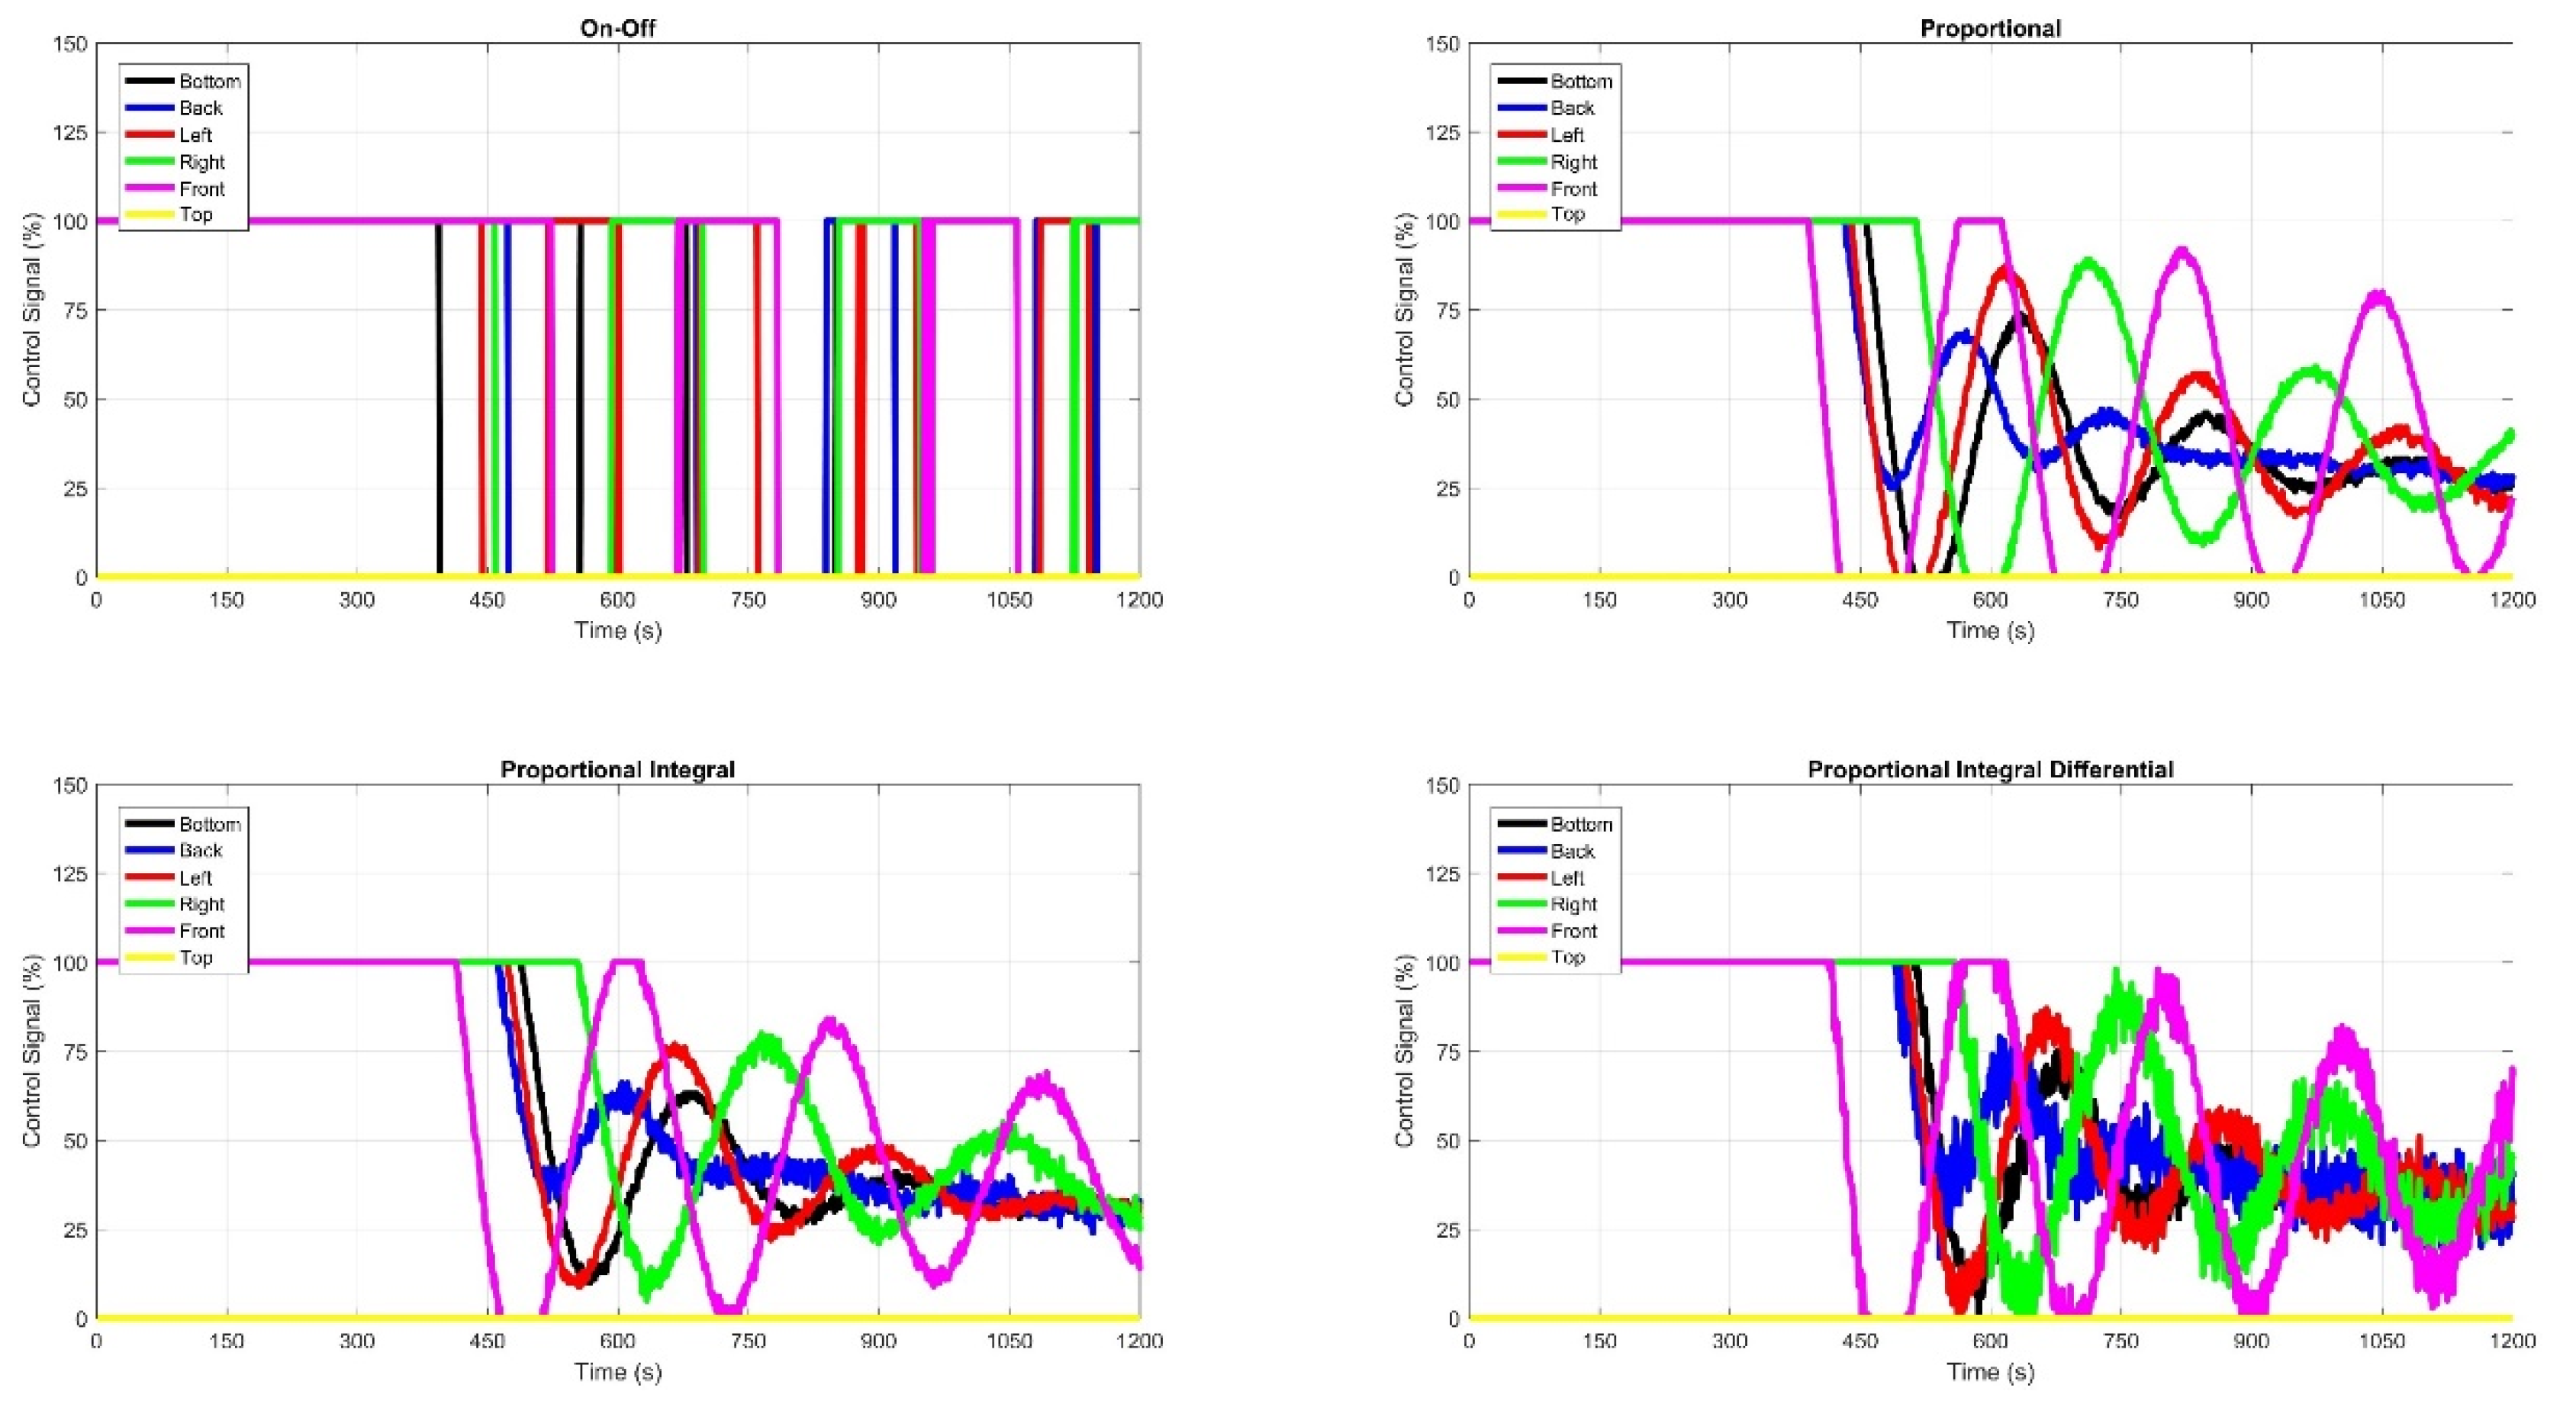
Figure 22.
Temperature changes over time for the six panels.
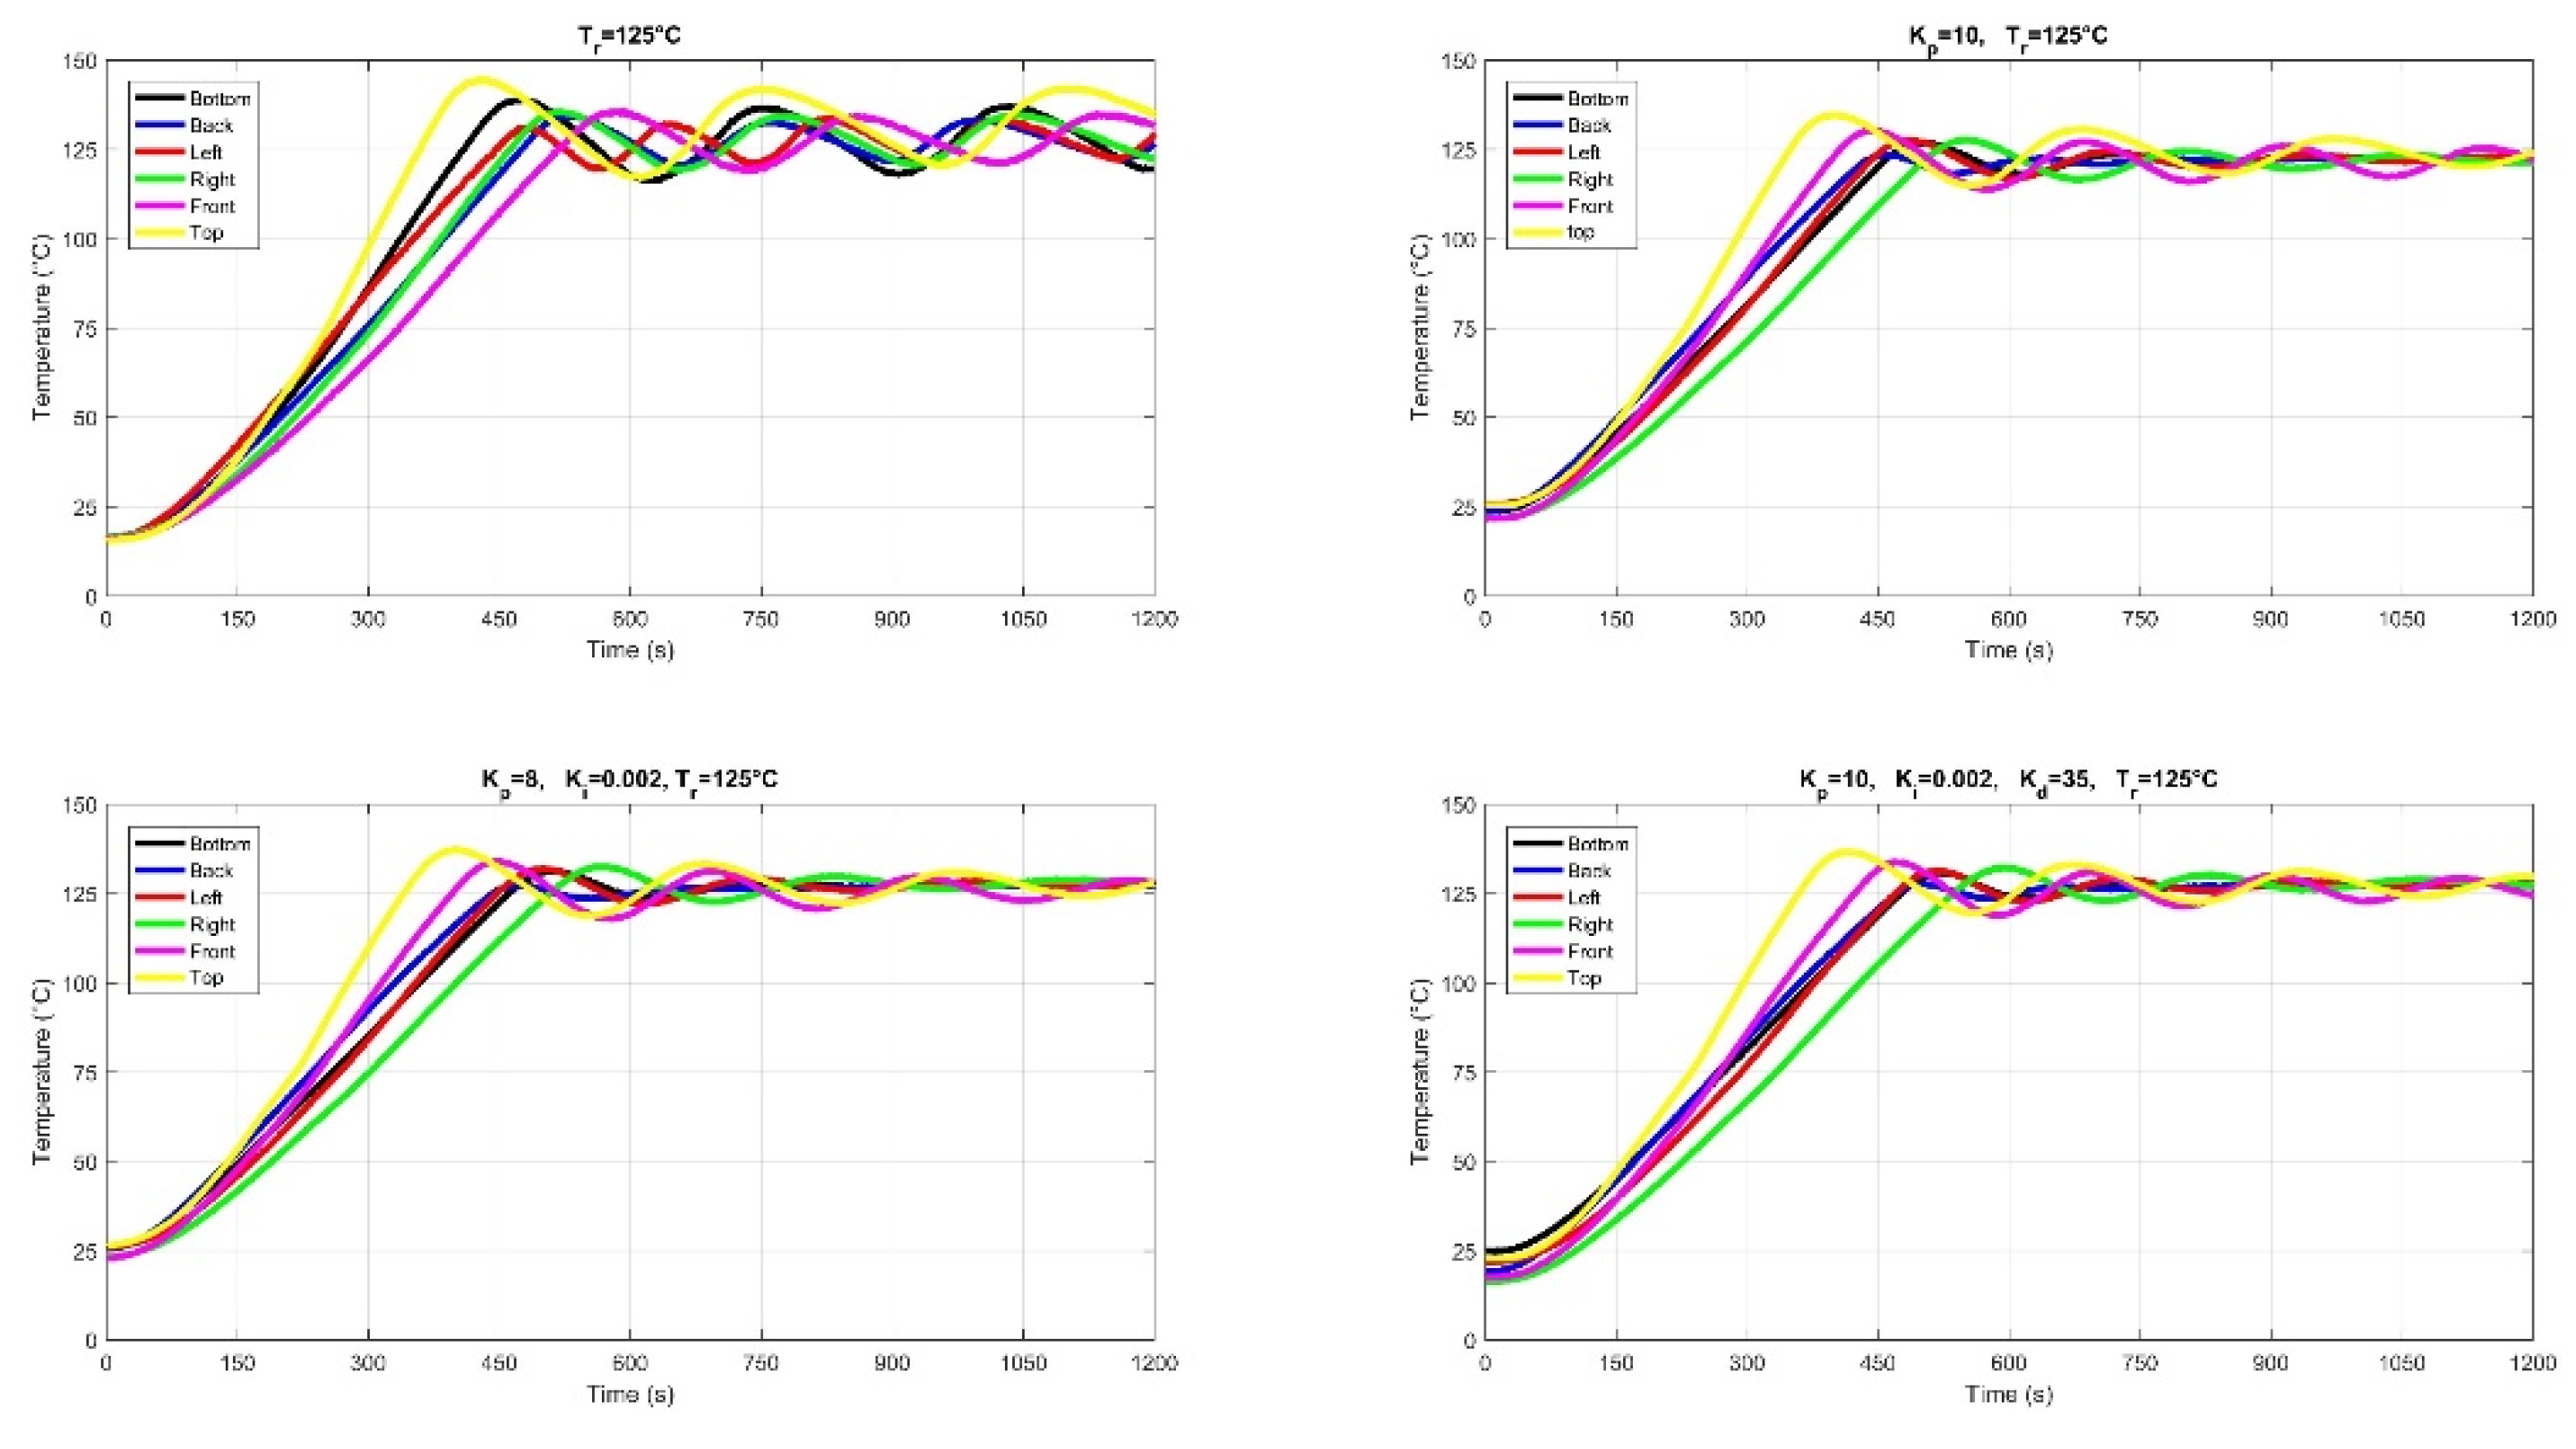
Figure 23.
Change in control signal over time for the six panels.
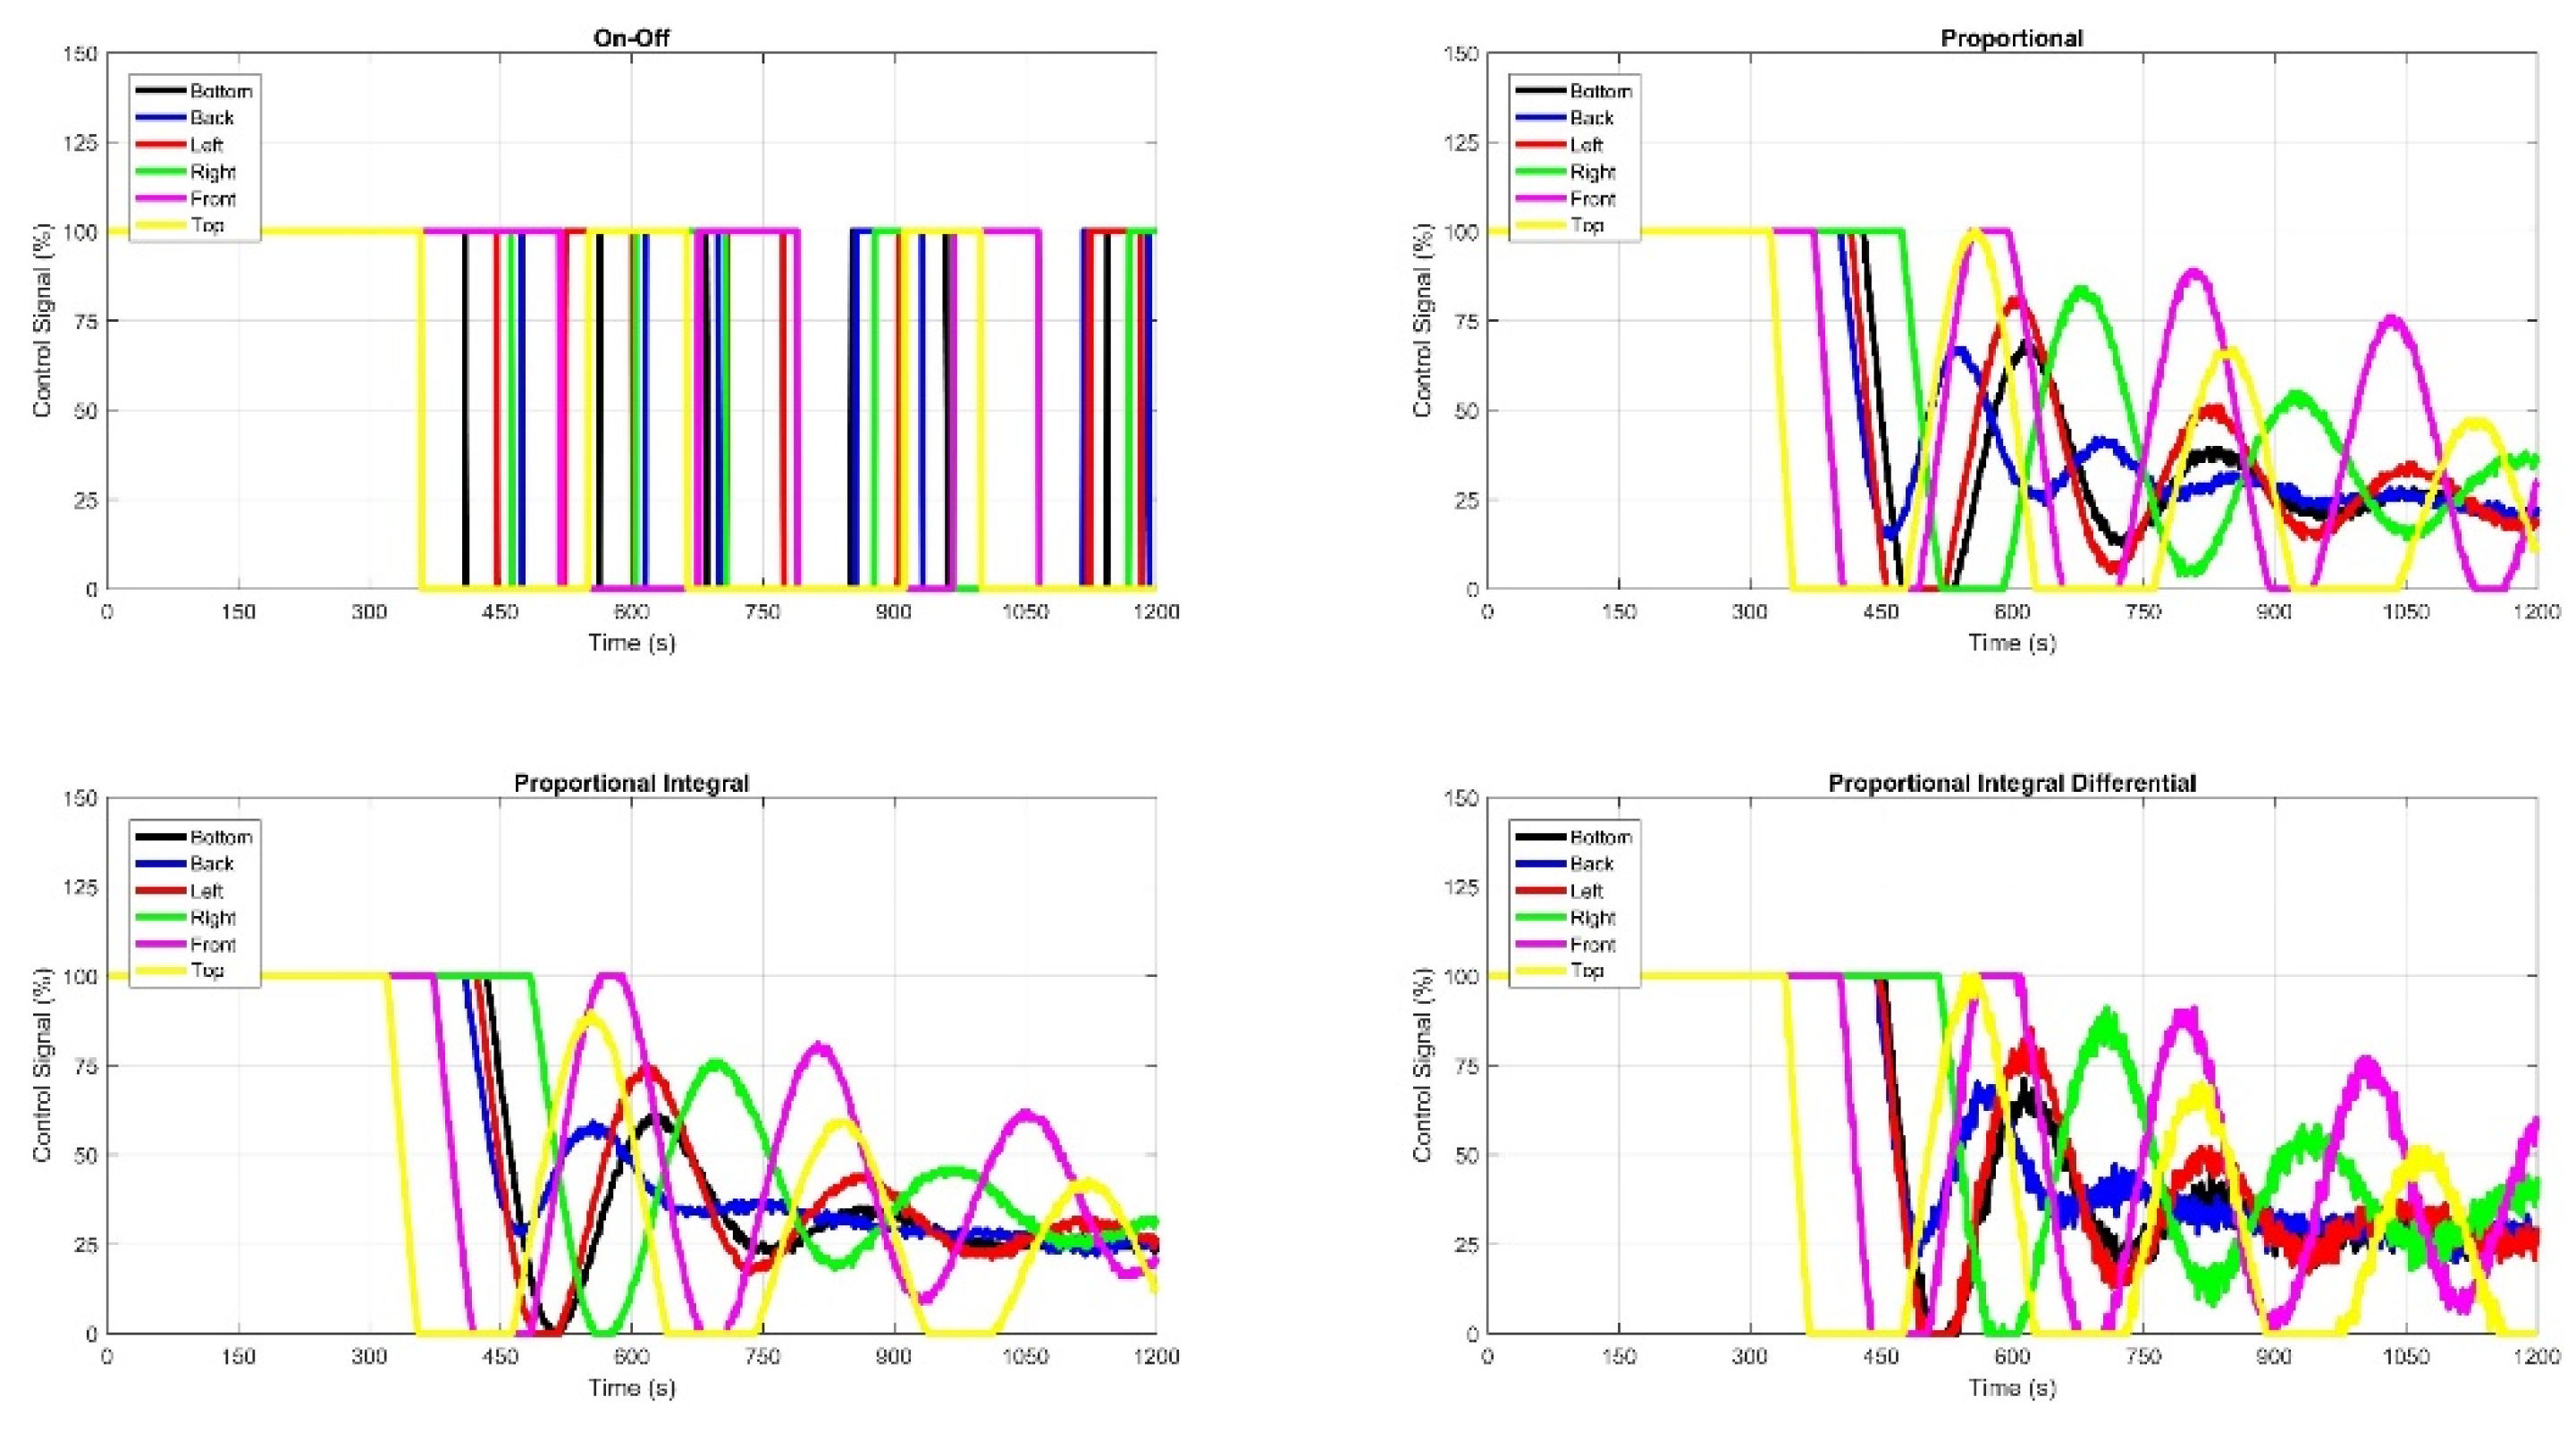

Table 1.
PID parameters found by the Ziegler-Nichols tangent method.
| Controller | Kp | Ki | Kd |
|---|---|---|---|
| P | 12.320 | - | - |
| PI | 11.088 | 0.0047 | - |
| PID | 14.780 | 0.0079 | 35 |
Table 2.
PID parameters after optimization.
| Controller | Kp | Ki | Kd |
|---|---|---|---|
| P | 10 | - | - |
| PI | 8 | 0.002 | - |
| PID | 10 | 0.002 | 35 |
Table 3.
Bottom panel temperature control performance values for single panel case.
| Metric | On/Off | P | PI | PID |
|---|---|---|---|---|
| Overshoot (%) | 10.34 | - | 0.88 | 1.05 |
| Settling Time (s) | - | 1180.00 | 1161.00 | 1140.00 |
| Rise Time (s) | 466.00 | 58.00 | 561.00 | 577.00 |
| Offset Error (°C) | - | 5.90 | 0.80 | 0.50 |
| IAE | 3.07×10⁴ | 3.30×10⁴ | 2.80×10⁴ | 2.91×10⁴ |
| ISE | 2.13×10⁶ | 2.09×10⁶ | 1.92×10⁶ | 2.07×10⁶ |
| ITAE | 7.52×10⁶ | 8.82×10⁶ | 5.37×10⁶ | 5.48×10⁶ |
| ITSE | 2.66×10⁸ | 2.98×10⁸ | 2.46×10⁸ | 2.69×10⁸ |
Table 4.
Bottom panel temperature control performance values for two panel case.
| Metric | On/Off | P | PI | PID |
|---|---|---|---|---|
| Overshoot (%) | 4.03 | - | 0.98 | 1.00 |
| Settling Time (s) | - | 1109.00 | 1144.00 | 1040.00 |
| Rise Time (s) | 555.00 | 556.00 | 585.00 | 601.00 |
| Offset Error (°C) | - | 4.90 | 0.40 | 0.30 |
| IAE | 3.05×10⁴ | 3.28×10⁴ | 3.02×10⁴ | 2.88×10⁴ |
| ISE | 2.13×10⁶ | 2.11×10⁶ | 2.25×10⁶ | 2.00×10⁶ |
| ITAE | 6.63×10⁶ | 8.56×10⁶ | 5.55×10⁶ | 5.44×10⁶ |
| ITSE | 2.80×10⁸ | 2.91×10⁸ | 2.88×10⁸ | 2.63×10⁸ |
Table 5.
Back panel temperature control performance values for two panel case.
| Metric | On/Off | P | PI | PID |
|---|---|---|---|---|
| Overshoot (%) | 9.28 | - | 2.00 | 1.31 |
| Settling Time (s) | - | 1100.00 | 1127.00 | 1099.00 |
| Rise Time (s) | 464.00 | 574.00 | 627.00 | 640.00 |
| Offset Error (°C) | - | 5.70 | 0.30 | 0.20 |
| IAE | 4.04×10⁴ | 3.48×10⁴ | 3.27×10⁴ | 3.12×10⁴ |
| ISE | 5.12×10⁶ | 2.31×10⁶ | 2.46×10⁶ | 2.22×10⁶ |
| ITAE | 7.38×10⁶ | 9.11×10⁶ | 6.45×10⁶ | 6.18×10⁶ |
| ITSE | 4.63×10⁸ | 3.40×10⁸ | 3.42×10⁸ | 3.16×10⁸ |
Table 6.
Bottom panel temperature control performance values for three panel case.
| Metric | On/Off | P | PI | PID |
|---|---|---|---|---|
| Overshoot (%) | 10.83 | - | 2.81 | 2.52 |
| Settling Time (s) | - | 1083.00 | 1150.00 | 1081.00 |
| Rise Time (s) | 454.00 | 550.00 | 553.00 | 555.00 |
| Offset Error (°C) | - | 4.00 | 0.70 | 0.40 |
| IAE | 3.03×10⁴ | 3.25×10⁴ | 2.92×10⁴ | 2.89×10⁴ |
| ISE | 2.09×10⁶ | 2.15×10⁶ | 2.12×10⁶ | 2.09×10⁶ |
| ITAE | 7.35×10⁶ | 8.05×10⁶ | 5.43×10⁶ | 5.40×10⁶ |
| ITSE | 3.59×10⁸ | 3.01×10⁸ | 2.74×10⁸ | 2.68×10⁸ |
Table 7.
Back panel temperature control performance values for three panel case.
| Metric | On/Off | P | PI | PID |
|---|---|---|---|---|
| Overshoot (%) | 4.70 | - | 1.31 | 1.30 |
| Settling Time (s) | - | 1067.00 | 1102.00 | 1063.00 |
| Rise Time (s) | 541.00 | 517.00 | 514.00 | 511.00 |
| Offset Error (°C) | - | 5.15 | 0.90 | 0.40 |
| IAE | 3.09×10⁴ | 3.05×10⁴ | 2.65×10⁴ | 2.64×10⁴ |
| ISE | 2.18×10⁶ | 1.94×10⁶ | 1.91×10⁶ | 1.90×10⁶ |
| ITAE | 6.82×10⁶ | 7.56×10⁶ | 4.50×10⁶ | 4.47×10⁶ |
| ITSE | 2.87×10⁸ | 2.53×10⁸ | 2.25×10⁸ | 2.24×10⁸ |
Table 8.
Left panel temperature control performance values for three panel case.
| Metric | On/Off | P | PI | PID |
|---|---|---|---|---|
| Overshoot (%) | 5.68 | - | 3.46 | 3.09 |
| Settling Time (s) | - | 1128.00 | 1097.00 | 1088.00 |
| Rise Time (s) | 488.00 | 526.00 | 522.00 | 516.00 |
| Offset Error (°C) | - | 4.40 | 0.95 | 0.80 |
| IAE | 3.19×10⁴ | 3.27×10⁴ | 2.89×10⁴ | 2.87×10⁴ |
| ISE | 2.22×10⁶ | 2.23×10⁶ | 2.13×10⁶ | 2.10×10⁶ |
| ITAE | 6.93×10⁶ | 7.99×10⁶ | 5.35×10⁶ | 5.26×10⁶ |
| ITSE | 5.68 | - | 3.46 | 3.09 |
Table 9.
Bottom panel temperature control performance values for four panel case.
| Metric | On/Off | P | PI | PID |
|---|---|---|---|---|
| Overshoot (%) | 9.99 | 0.09 | 4.44 | 3.92 |
| Settling Time (s) | - | 1048.00 | 1116.00 | 1040.00 |
| Rise Time (s) | 455.00 | 528.00 | 632.00 | 534.00 |
| Offset Error (°C) | - | 3.20 | 3.60 | 3.10 |
| IAE | 3.03×10⁴ | 3.09×10⁴ | 3.53×10⁴ | 2.86×10⁴ |
| ISE | 2.08×10⁶ | 2.11×10⁶ | 2.67×10⁶ | 2.03×10⁶ |
| ITAE | 7.37×10⁶ | 7.02×10⁶ | 7.87×10⁶ | 5.50×10⁶ |
| ITSE | 2.60×10⁸ | 2.81×10⁸ | 3.88×10⁸ | 2.58×10⁸ |
Table 10.
Back panel temperature control performance values for four panel case.
| Metric | On/Off | P | PI | PID |
|---|---|---|---|---|
| Overshoot (%) | 6.45 | - | 2,90 | 1.57 |
| Settling Time (s) | - | 1077,00 | 1082,00 | 1030.00 |
| Rise Time (s) | 524.00 | 497,00 | 606,00 | 488.00 |
| Offset Error (°C) | - | 3,95 | 2,20 | 1.90 |
| IAE | 3.01×10⁴ | 2.91×10⁴ | 3.28×10⁴ | 2.54×10⁴ |
| ISE | 2.10×10⁶ | 1.91×10⁶ | 2.46×10⁶ | 1.79×10⁶ |
| ITAE | 6.72×10⁶ | 6.62×10⁶ | 6.82×10⁶ | 4.37×10⁶ |
| ITSE | 2. 69×106 | 2.38×10⁶ | 3.34×10⁶ | 2.06×10⁶ |
Table 11.
Left panel temperature control performance values for four panel case.
| Metric | On/Off | P | PI | PID |
|---|---|---|---|---|
| Overshoot (%) | 6.29 | 0.18 | 4.33 | 3.85 |
| Settling Time (s) | - | 1026.00 | 1041.00 | 1021.00 |
| Rise Time (s) | 477.00 | 505.00 | 612.00 | 510.00 |
| Offset Error (°C) | - | 3.80 | 2.60 | 2.30 |
| IAE | 3.76×10⁴ | 3.07×10⁴ | 3.57×10⁴ | 2.82×10⁴ |
| ISE | 2.89×10⁶ | 2.10×10⁶ | 2.75×10⁶ | 2.04×10⁶ |
| ITAE | 7.06×10⁶ | 6.99×10⁶ | 7.86×10⁶ | 5.30×10⁶ |
| ITSE | 3.60×10⁸ | 2.81×10⁸ | 4.03×10⁸ | 2.58×10⁸ |
Table 12.
Right panel temperature control performance values for four panel case.
| Metric | On/Off | P | PI | PID |
|---|---|---|---|---|
| Overshoot (%) | 7.49 | 0.20 | 5.22 | 4.85 |
| Settling Time (s) | - | 1128.00 | 1164.00 | 1092.00 |
| Rise Time (s) | 583.00 | 599.00 | 700.00 | 605.00 |
| Offset Error (°C) | - | 3.10 | 3.40 | 3.05 |
| IAE | 4.10×10⁴ | 3.68×10⁴ | 3.95×10⁴ | 3.45×10⁴ |
| ISE | 3.16×10⁶ | 2.71×10⁶ | 3.03×10⁶ | 2.60×10⁶ |
| ITAE | 7.12×10⁶ | 5.30×10⁶ | 9.52×10⁶ | 7.44×10⁶ |
| ITSE | 3.86×10⁸ | 4.14×10⁸ | 4.93×10⁸ | 3.78×10⁸ |
Table 13.
Bottom panel temperature control performance values for five panel case.
| Metric | On/Off | P | PI | PID |
|---|---|---|---|---|
| Overshoot (%) | 11.49 | 0.58 | 4.52 | 4.54 |
| Settling Time (s) | - | 1044.00 | 1032.00 | 1037.00 |
| Rise Time (s) | 461.00 | 527.00 | 566.00 | 582.00 |
| Offset Error (°C) | - | 3.00 | 2.30 | 1.90 |
| IAE | 3.10×10⁴ | 3.09×10⁴ | 3.05×10⁴ | 3.37×10⁴ |
| ISE | 3.08×10⁶ | 2.19×10⁶ | 2.16×10⁶ | 2.55×10⁶ |
| ITAE | 7.61×10⁶ | 6.79×10⁶ | 6.61×10⁶ | 7.21×10⁶ |
| ITSE | 3.63×10⁸ | 2.92×10⁸ | 2.90×10⁸ | 3.54×10⁸ |
Table 14.
Back panel temperature control performance values for five panel case.
| Metric | On/Off | P | PI | PID |
|---|---|---|---|---|
| Overshoot (%) | 6.68 | - | 2.86 | 2.76 |
| Settling Time (s) | - | 1055.00 | 1052.00 | 1093.00 |
| Rise Time (s) | 523.00 | 484.00 | 514.00 | 550.00 |
| Offset Error (°C) | - | 3.10 | 2.00 | 1.90 |
| IAE | 3.10×10⁴ | 2.89×10⁴ | 2.79×10⁴ | 3.10×10⁴ |
| ISE | 2.21×10⁶ | 1.97×10⁶ | 1.94×10⁶ | 2.34×10⁶ |
| ITAE | 6.86×10⁶ | 6.32×10⁶ | 5.43×10⁶ | 6.15×10⁶ |
| ITSE | 2.89×10⁸ | 2.42×10⁸ | 2.40×10⁸ | 3.01×10⁸ |
Table 15.
Left panel temperature control performance values for five panel case.
| Metric | On/Off | P | PI | PID |
|---|---|---|---|---|
| Overshoot (%) | 6.62 | 0.62 | 4.82 | 4.07 |
| Settling Time (s) | - | 1117.00 | 1099.00 | 1064.00 |
| Rise Time (s) | 475.00 | 591.00 | 633.00 | 637.00 |
| Offset Error (°C) | - | 2.90 | 2.90 | 2.85 |
| IAE | 4.83×10⁴ | 3.10×10⁴ | 3.05×10⁴ | 3.41×10⁴ |
| ISE | 4.97×10⁶ | 2.18×10⁶ | 2.16×10⁶ | 2.65×10⁶ |
| ITAE | 6.16×10⁶ | 6.76×10⁶ | 6.52×10⁶ | 7.24×10⁶ |
| ITSE | 4.63×10⁸ | 2.95×10⁸ | 2.90×10⁸ | 3.72×10⁸ |
Table 16.
Right panel temperature control performance values for five panel case.
| Metric | On/Off | P | PI | PID |
|---|---|---|---|---|
| Overshoot (%) | 7.69 | 0.79 | 6.34 | 5.34 |
| Settling Time (s) | - | 1100.00 | 1080.00 | 1038.00 |
| Rise Time (s) | 483.00 | 507.00 | 546.00 | 569.00 |
| Offset Error (°C) | - | 3.60 | 2.70 | 2.60 |
| IAE | 3.19×10⁴ | 3.63×10⁴ | 3.65×10⁴ | 3.74×10⁴ |
| ISE | 3.28×10⁶ | 2.74×10⁶ | 2.72×10⁶ | 2.90×10⁶ |
| ITAE | 7.32×10⁶ | 7.24×10⁶ | 8.47×10⁶ | 8.58×10⁶ |
| ITSE | 5.07×10⁸ | 4.12×10⁸ | 4.08×10⁸ | 4.45×10⁸ |
Table 17.
Front panel temperature control performance values for five panel case.
| Metric | On/Off | P | PI | PID |
|---|---|---|---|---|
| Overshoot (%) | 8.02 | 3.54 | 7.05 | 6.54 |
| Settling Time (s) | - | 1114.00 | 1135.00 | 1094.00 |
| Rise Time (s) | 414.00 | 459.00 | 486.00 | 485.00 |
| Offset Error (°C) | - | 3.60 | 2.95 | 2.90 |
| IAE | 3.58×10⁴ | 3.01×10⁴ | 3.00×10⁴ | 3.04×10⁴ |
| ISE | 2.63×10⁶ | 2.24×10⁶ | 2.22×10⁶ | 2.36×10⁶ |
| ITAE | 8.77×10⁶ | 6.51×10⁶ | 6.06×10⁶ | 6.00×10⁶ |
| ITSE | 3.91×10⁸ | 2.74×10⁸ | 2.72×10⁸ | 2.85×10⁸ |
Table 18.
Bottom panel temperature control performance values for six panel case.
| Metric | On/Off | P | PI | PID |
|---|---|---|---|---|
| Overshoot (%) | 11.13 | 1.59 | 9.82 | 4.60 |
| Settling Time (s) | - | 1020.00 | 1004.00 | 919.00 |
| Rise Time (s) | 473.00 | 498.00 | 506.00 | 522.00 |
| Offset Error (°C) | - | 2.70 | 3.30 | 2.65 |
| IAE | 3.20×10⁴ | 2.90×10⁴ | 2.72×10⁴ | 2.85×10⁴ |
| ISE | 2.28×10⁶ | 2.06×10⁶ | 1.83×10⁶ | 1.99×10⁶ |
| ITAE | 7.88×10⁶ | 6.02×10⁶ | 5.52×10⁶ | 5.75×10⁶ |
| ITSE | 2.92×10⁸ | 2.57×10⁸ | 2.26×10⁸ | 2.54×10⁸ |
Table 19.
Back panel temperature control performance values for six panel case.
| Metric | On/Off | P | PI | PID |
|---|---|---|---|---|
| Overshoot (%) | 7.62 | - | 2.34 | 2.42 |
| Settling Time (s) | - | 1009.00 | 1070.00 | 933.00 |
| Rise Time (s) | 430.00 | 461.00 | 468.00 | 500.00 |
| Offset Error (°C) | - | 2.80 | 2.50 | 2.30 |
| IAE | 3.27×10⁴ | 2.71×10⁴ | 2.47×10⁴ | 2.82×10⁴ |
| ISE | 2.42×10⁶ | 1.83×10⁶ | 1.68×10⁶ | 2.06×10⁶ |
| ITAE | 7.23×10⁶ | 5.55×10⁶ | 4.58×10⁶ | 5.39×10⁶ |
| ITSE | 3.22×10⁸ | 2.15×10⁸ | 1.89×10⁸ | 2.48×10⁸ |
Table 20.
Left panel temperature control performance values for six panel case.
| Metric | On/Off | P | PI | PID |
|---|---|---|---|---|
| Overshoot (%) | 6.89 | 2.12 | 5.57 | 5.12 |
| Settling Time (s) | - | 1013.00 | 1110.00 | 981.00 |
| Rise Time (s) | 481.00 | 551.00 | 563.00 | 595.00 |
| Offset Error (°C) | - | 3.05 | 3.80 | 3.00 |
| IAE | 2.98×10⁴ | 2.92×10⁴ | 2.78×10⁴ | 3.05×10⁴ |
| ISE | 2.17×10⁶ | 2.05×10⁶ | 1.93×10⁶ | 2.25×10⁶ |
| ITAE | 6.37×10⁶ | 6.12×10⁶ | 5.58×10⁶ | 6.19×10⁶ |
| ITSE | 2.92×10⁸ | 2.64×10⁸ | 2.40×10⁸ | 2.96×10⁸ |
Table 21.
Right panel temperature control performance values for six panel case.
| Metric | On/Off | P | PI | PID |
|---|---|---|---|---|
| Overshoot (%) | 8.48 | 2.19 | 6.00 | 5.78 |
| Settling Time (s) | - | 1099.00 | 1072.00 | 1011.00 |
| Rise Time (s) | 480.00 | 490.00 | 496.00 | 515.00 |
| Offset Error (°C) | - | 3.00 | 2.50 | 2.10 |
| IAE | 3.40×10⁴ | 3.33×10⁴ | 3.15×10⁴ | 3.53×10⁴ |
| ISE | 2.55×10⁶ | 2.41×10⁶ | 2.22×10⁶ | 2.71×10⁶ |
| ITAE | 7.95×10⁶ | 6.19×10⁶ | 6.89×10⁶ | 7.83×10⁶ |
| ITSE | 3.50×10⁸ | 3.45×10⁸ | 3.09×10⁸ | 3.95×10⁸ |
Table 22.
Front panel temperature control performance values for six panel case.
| Metric | On/Off | P | PI | PID |
|---|---|---|---|---|
| Overshoot (%) | 8.59 | 4.33 | 7.28 | 7.02 |
| Settling Time (s) | - | 1127.00 | 1059.00 | 1035.00 |
| Rise Time (s) | 319.00 | 398.00 | 400.00 | 414.00 |
| Offset Error (°C) | - | 3.70 | 2.90 | 2.40 |
| IAE | 3.69×10⁴ | 2.83×10⁴ | 2.63×10⁴ | 2.93×10⁴ |
| ISE | 2.76×10⁶ | 2.00×10⁶ | 1.82×10⁶ | 2.21×10⁶ |
| ITAE | 9.09×10⁶ | 6.02×10⁶ | 5.20×10⁶ | 5.78×10⁶ |
| ITSE | 4.15×10⁸ | 2.39×10⁸ | 2.05×10⁸ | 2.64×10⁸ |
Table 23.
Top panel temperature control performance values for six panel case.
| Metric | On/Off | P | PI | PID |
|---|---|---|---|---|
| Overshoot (%) | 15.71 | 7.70 | 9.84 | 9.33 |
| Settling Time (s) | - | 1137.00 | 1180.00 | 1135.00 |
| Rise Time (s) | 426.00 | 440.00 | 451.00 | 472.00 |
| Offset Error (°C) | - | 3.20 | 2.80 | 2.75 |
| IAE | 3.31×10⁴ | 2.54×10⁴ | 2.40×10⁴ | 2.61×10⁴ |
| ISE | 2.26×10⁶ | 1.73×10⁶ | 1.58×10⁶ | 1.84×10⁶ |
| ITAE | 9.61×10⁶ | 5.23×10⁶ | 4.78×10⁶ | 5.25×10⁶ |
| ITSE | 3.13×10⁸ | 2.64×10⁸ | 1.65×10⁸ | 2.01×10⁸ |
Disclaimer/Publisher’s Note: The statements, opinions and data contained in all publications are solely those of the individual author(s) and contributor(s) and not of MDPI and/or the editor(s). MDPI and/or the editor(s) disclaim responsibility for any injury to people or property resulting from any ideas, methods, instructions or products referred to in the content. |
© 2024 by the authors. Licensee MDPI, Basel, Switzerland. This article is an open access article distributed under the terms and conditions of the Creative Commons Attribution (CC BY) license (http://creativecommons.org/licenses/by/4.0/).
Copyright: This open access article is published under a Creative Commons CC BY 4.0 license, which permit the free download, distribution, and reuse, provided that the author and preprint are cited in any reuse.


