Preprint
Article

This version is not peer-reviewed.

The Effect of Dietary Patterns on Vascular Aging Using the Brachial–Ankle Index

A peer-reviewed article of this preprint also exists.

Submitted:

18 November 2024

Posted:

20 November 2024

You are already at the latest version

Abstract

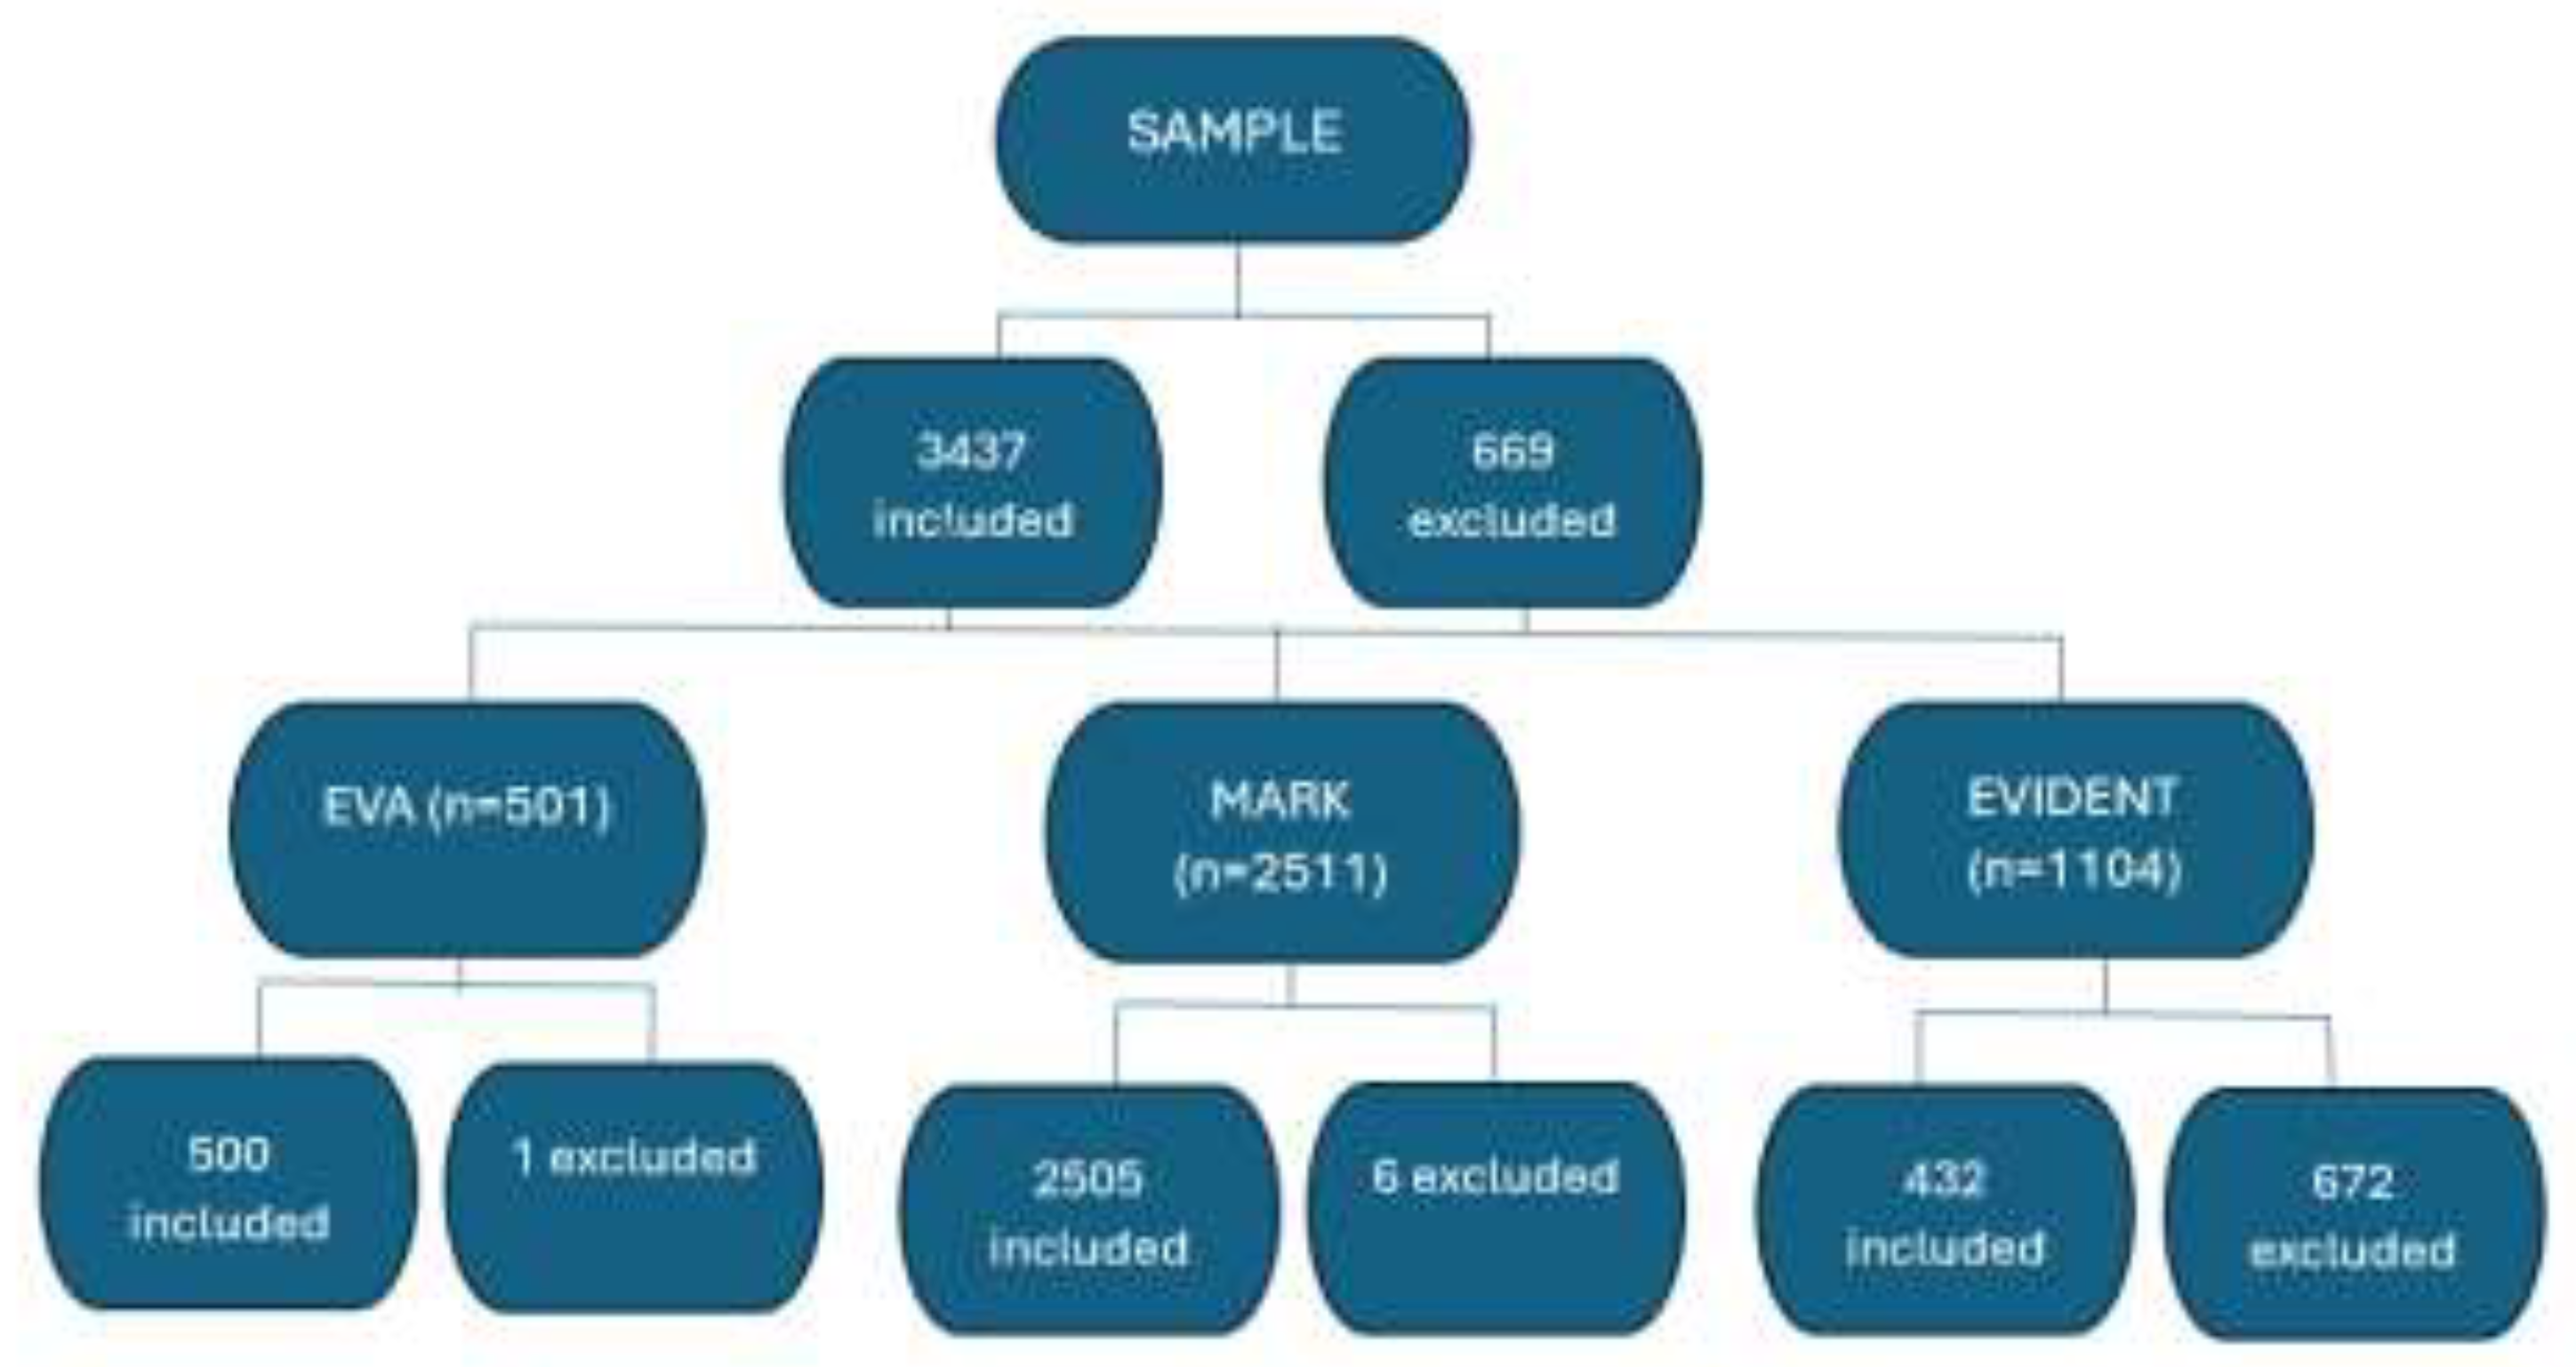
The role of the mediterranean diet (MD) on healthy vascular aging is not fully established. The main objective of this study was to analyze the association between adherence to the MD and vascular aging estimated with ankle brachial pulse wave velocity (ba-PWV) in a Spanish population sample and the differences by sex. Methods: A total of 3437 subjects from the EVA, MARK and EVIDENT studies participated. The ba-PWV was assessed with the Vasera VS-1500® device. Vascular aging was classified as healthy vascular aging (HVA), normal vascular aging (NVA) and early vascular aging (EVA) and adherence to the MD was assessed with the Mediterranean Diet Adherence Screener questionnaire. Results: Mean age was 60.15±9.55 (60.09±9.71 in women; 60.20±9.43 in men). Overall MD adherence was observed in 48.0% of subjects (40% in women; 54% in men). The mean value of ba-PWV was 14.38±2.71 (women 14.24±2.89; men 14.49±2.56). In multinomial logistic regression a positive association was found overall between HVA and NVA (OR=1.751, 95% CI:1.411-2.174, p<0.001), and between HVA and EVA (OR=1.501, 95% CI:1.295-1.740, p<0.001); in women between HVA and NVA (OR=2. 055, 95% CI:1.456-2.901, p<0.001) and between HVA and EVA (OR=1.413, 95% CI:1.124-1.776; p=0.003), in men between HVA and NVA (OR=1.551, 95% CI:1.175-2.047, p=0.002) and between HVA and EVA (OR=1.549, 95% CI:1.275-1.882; p<0.001). Conclusion: The results of this work indicate that greater adherence to the MD is associated with healthier vascular aging.

Keywords: 
;  ;  ;  

1. Introduction

In modern societies, life expectancy has increased significantly, leading to a higher prevalence of diseases associated with aging, such as cardiovascular diseases [1,2,3]. Specifically, the study of vascular aging is essential to find effective preventive measures [4]. One of the main indicators of vascular aging is arterial stiffness [5]. Among the most common ways to measure arterial stiffness is pulse wave velocity (PWV) [3] which assesses the speed with which a pulse wave travels through the arteries; this velocity increases as blood vessels become stiffer so that higher PWV is associated with higher cardiovascular risk [2]. Among the indices that evaluate PWV is the brachial-ankle index (ba-PWV) which measures the velocity of blood displacement between the brachial artery and the tibial artery using an oscillometric method; it is a simple, non-invasive measurement of peripheral arterial stiffness, is considered a good indicator of vascular health [3,6] and shows a strong correlation with age [3]. Knowing the state of vascular health in the adult population is of vital importance since any dysfunction can have harmful effects on health [6].
The study of vascular aging also focuses on preventing or slowing down the negative effects, the objective being to preserve health and vitality, these concepts giving rise to the term “healthy aging” [4]. Early diagnosis and timely therapeutic interventions are the key to success in delaying or preventing aging [3,7]. To promote healthy aging, there are different strategies such as implementing regular physical exercise [8,9], controlling risk factors [10] or maintaining healthy eating habits [11,12,13], especially with suboptimal diets and lifestyles [9,14,15]. This has been reflected in the literature where a comprehensive lifestyle intervention over 30 years was associated with a reduction of risk factors by 80% [10]. It is estimated that about 11 million premature deaths can be attributed to unhealthy dietary factors [16]. Combining diet with other healthy lifestyles could increase life expectancy by 8 to 10 years [14].
Diet seems to have a close relationship with healthy aging; in particular, adherence to the Mediterranean diet (MD) [17] may be associated with a lower cardiovascular risk [18]. The MD [17] exhibits dietary patterns typical of populations located near the Mediterranean Sea, associated with olive-growing areas. In addition, it is associated with decreased rates of chronic diseases, especially cardiovascular and metabolic diseases associated to a greater extent with obesity, which influences a longer life expectancy [13,19]. This diet is characterized by a high consumption of olive oil and plant foods (vegetables, legumes, potatoes, fruits, bread and other cereals, seeds and nuts) and consumption of seasonal, fresh and minimally processed products. It also recommends a moderate consumption of dairy products such as yogurts and cheeses, fish and a moderate-low consumption of poultry. Regarding eggs, no more than 4 per week are recommended [17]. Regarding caloric intake of fats, MD should not exceed 30% of intake, with saturated fats accounting for 8-10% [20,21]. Therefore, lifestyle factors such as diet can modify the aging process [19,22]. MD is considered to be one of the healthiest diets, highlighting its influence in improving vascular aging [1,13].
Good nutrition, lifestyles, and physical activity are the pillars that help to have a healthy aging [1]. Therefore, the aim of this study is to analyze the association between adherence to the MD with vascular aging estimated with ba-PWV and differences by sex in a sample of a Caucasian population without a history of previous cardiovascular disease.

2. Materials and Methods

2.1. Study Design

Descriptive and observational cross-sectional study. The data analyzed correspond to the data recruited in the MARK [23] (NCT01428934), EVIDENT [24] (NCT0108308) and EVA [25] (NCT02623894) studies.

2.2. Ethical Considerations

The three studies selected have been approved by the ethics committee of the Salamanca area. The MARK study [23] with code PI10/02043, the EVIDENT study [24] with code PI83/06/2018 and the EVA study [25] with codes PI15/01039 and PI20/10569. The objectives of the study were explained and participants signed consent before being included in the studies. The norms established in the Declaration of Helsinki and the WHO standards for observational studies were always followed. Data confidentiality was guaranteed throughout the process.

2.3. Study Population

The MARK study [23] is a prospective multicenter cohort study that included 2511 subjects from 6 health centers in 3 autonomous communities. It was conducted between July 2011 and June 2013.
The EVIDENT study [24] was conducted between the months of January 2014 and September 2016 with a follow-up period of 12 months. It is a randomized, controlled, multicenter clinical trial with 2 parallel groups that included a sample of 1104 subjects recruited in primary care.
In the EVA study [25], the population was recruited in 5 health centers between June 2016 and November 2017. From the total population of 43946 subjects, 100 subjects were selected in each decade being 50% male and 50% female following the inclusion and exclusion criteria established in a previous study [25]. The final sample was 501 subjects.
The subjects were selected by random sampling in the general consulting population between 35 and 75 years of age. Figure 1 shows the subjects included and excluded from each of the 3 studies.

2.4. Variables and measuring Instruments

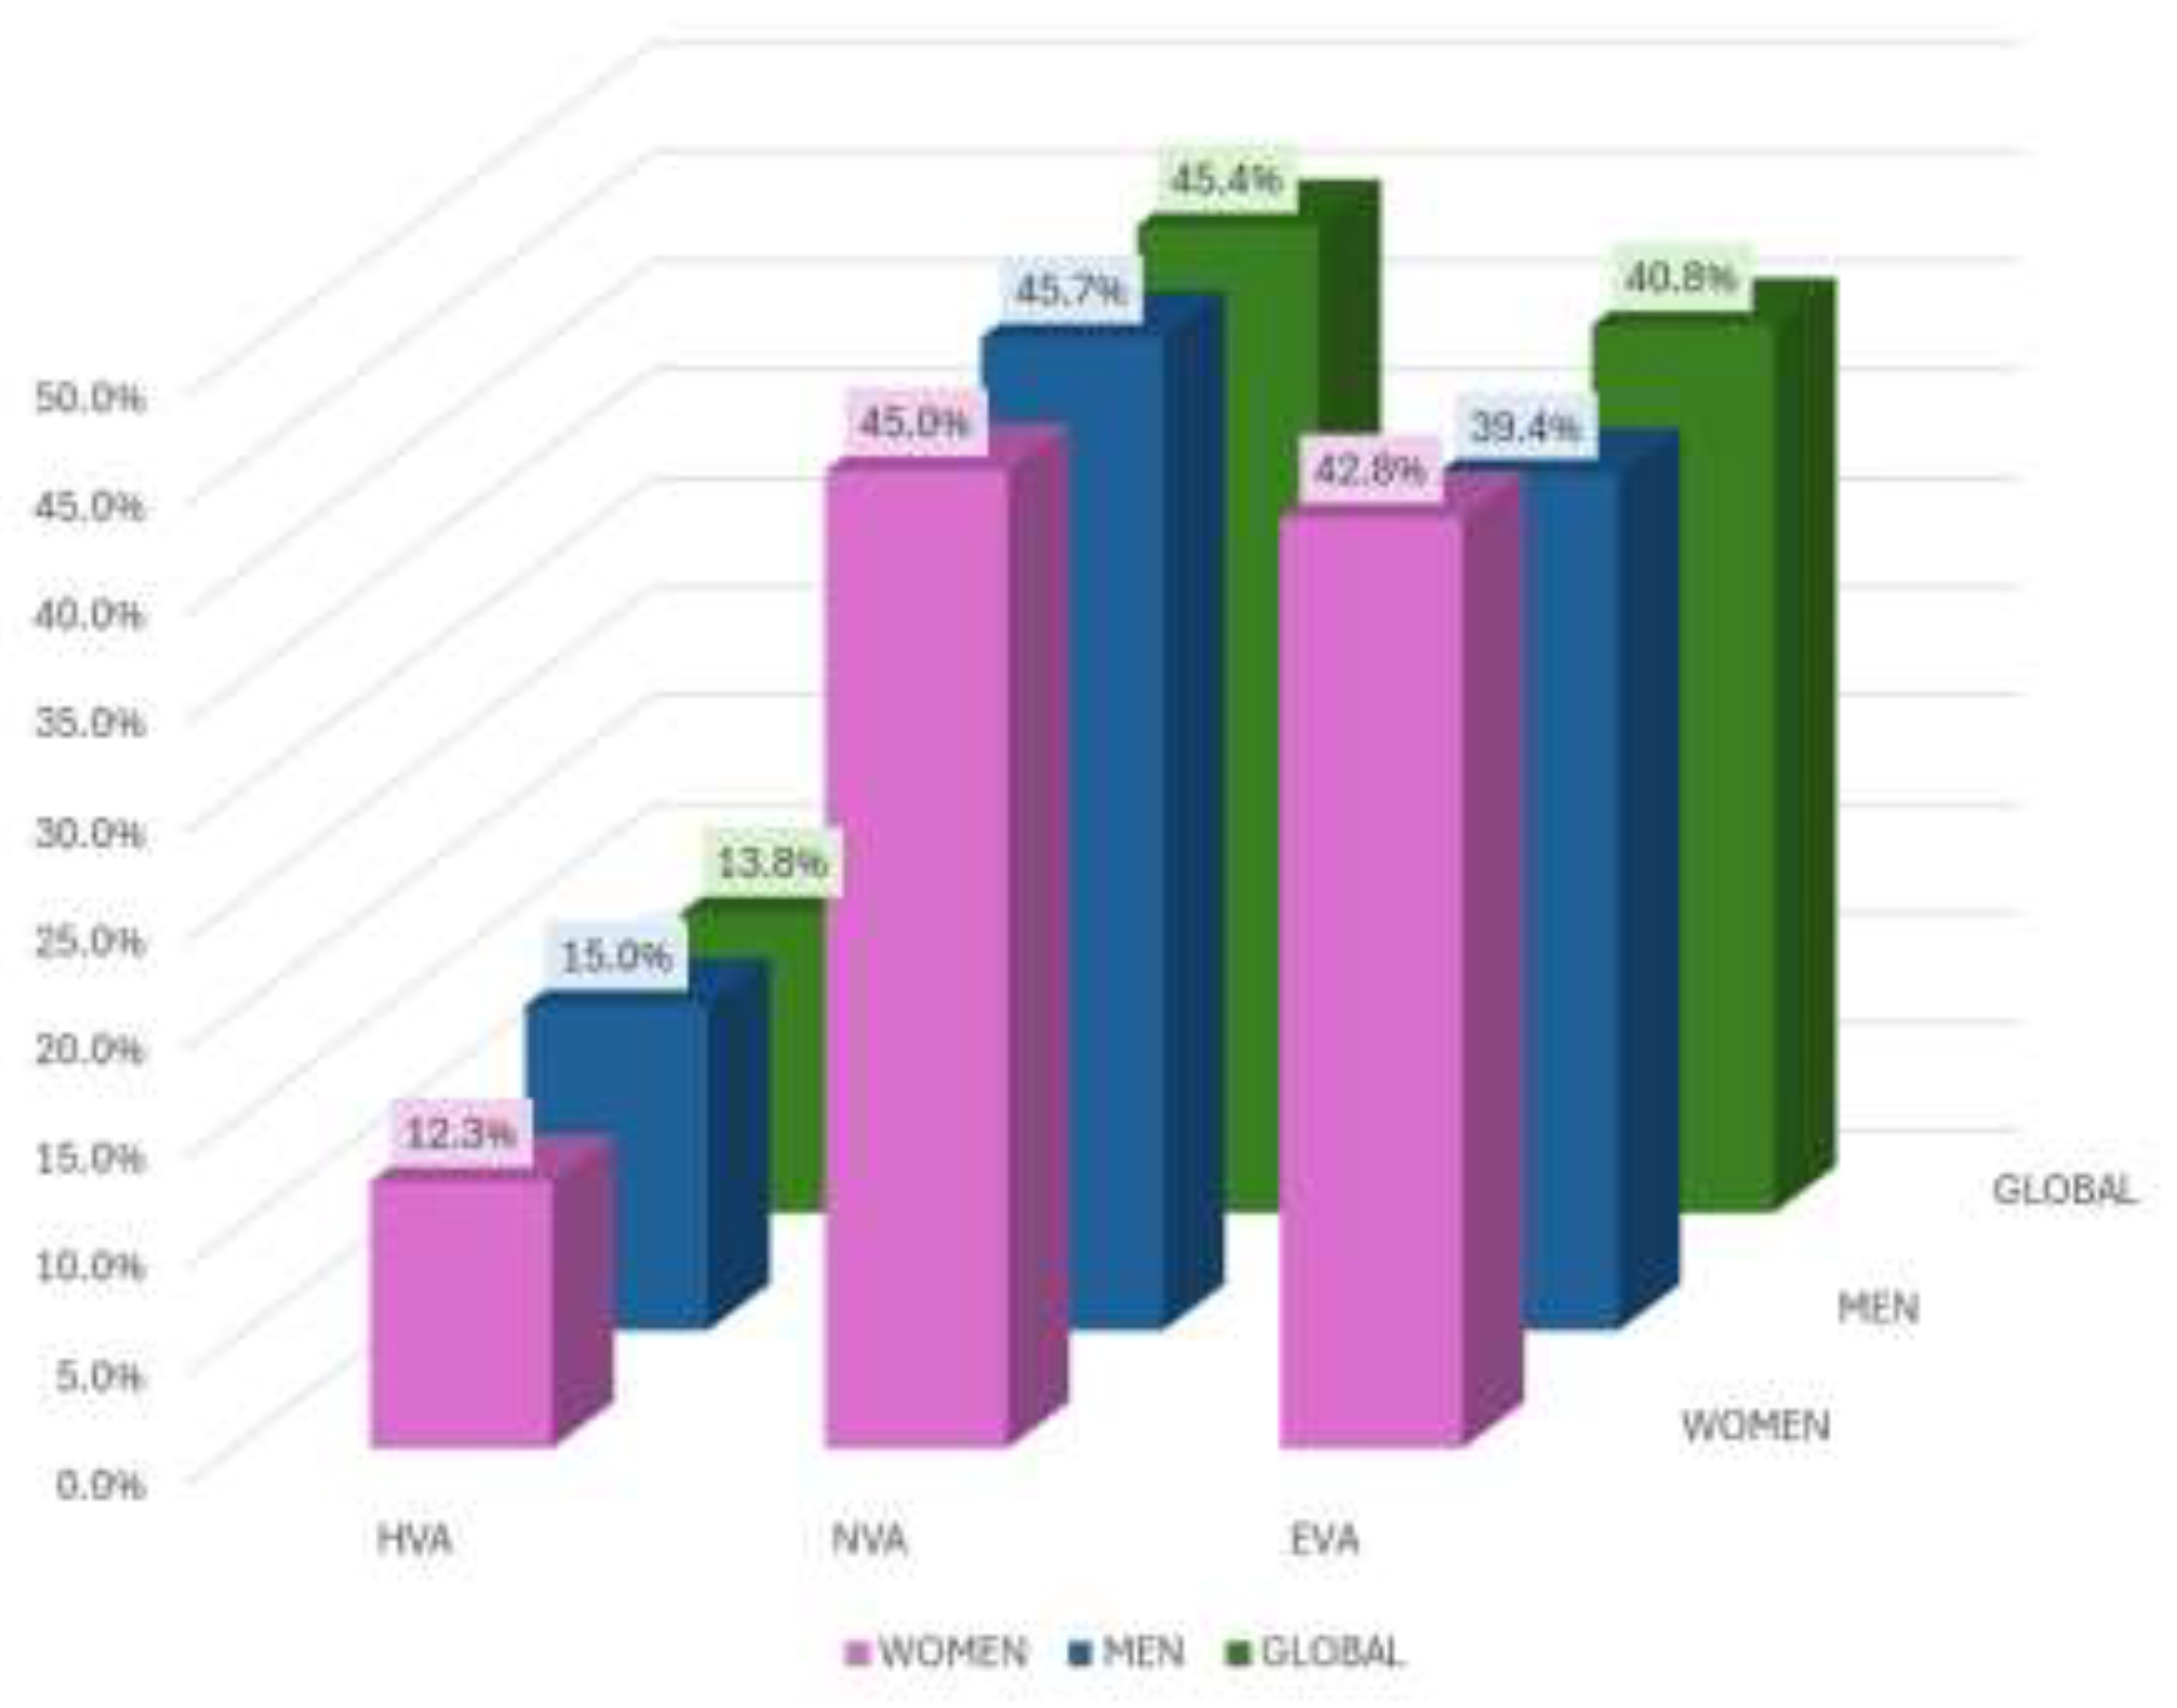
2.4.1. Vascular Aging

The following steps were followed to define vascular aging. First, the values established by the EVA Group as cut-off points estimated with the ba-PWV for both men and women were taken into account [26]. Subjects with values ≤ 25th percentile were classified as HVA, subjects with values between 25th percentile and 75th percentile were classified as NVA and subjects with values ≥75th percentile were classified as EVA. And second, subjects diagnosed with diabetes who belonged to the HVA group were reclassified as NVA [27].

2.4.2. Mediterranean Diet

To determine adherence to the MD, we used the questionnaire validated in the Spanish population, which was used in the PREDIMED study [28]. The Mediterranean Diet Adherence Screener (MEDAS) questionnaire consists of 14 items, 12 of which ask about the frequency of food consumption and 2 of which ask about the eating habits of the Spanish population. Each of the questions can be scored with 0 or 1 point, the final score ranges from 0 to 14 points and adherence to the MD is considered if the score is higher than the median (7 or more points).
To obtain the score: a) consume olive oil as the main cooking fat; b) consume four or more tablespoons of olive oil daily (one tablespoon = 13. 5g); c) consume two or more servings of vegetables; d) consume three or more pieces of fruit; e) consume less than one serving of red or processed meat; f) consume less than one serving of animal fat; g) consume less than one 100ml cup of sweetened beverages; h) eat white meat in greater proportion than red meat; i) consuming seven or more glasses of wine per week; j) consuming three or more servings of legumes; k) consuming three or more servings of fish; l) consuming three or more servings of nuts or dried fruits; m) consuming two or more servings of fried foods and n) consuming less than two baked goods were evaluated with 1 point [28].

2.4.3. Vascular Function

The function was estimated using the brachial-ankle index (ba-PWV) with the VaSera VS-1500® device (Fukuda Denshi, Tokyo, Japan).
The following equation was used to estimate ba-PWV: ba-PWV=((0.5934×height (cm)+14.4724))/tba, where tba is the transmission time of the waves to the ankle [29]. A value less than 0.9 of ba-PWV [30]. For this study, the mean value of the two extremities of ba-PWV was taken into account.

2.4.4. Anthropometric Measurements

Weight, height and blood pressure were taken into account. Hypertension was considered present if the subjects were taking antihypertensive drugs or if their blood pressure values were higher than 140/90 mmHg. They were considered to have type 2 diabetes mellitus if they were taking hypoglycemic agents or if their fasting plasma glucose values were higher than 126mg/dl or higher than 6.5% in the case of HbA1c. Dyslipidemia was considered present if they were taking lipid-lowering drugs or had fasting total cholesterol values higher than 240 mg/dL, low-density lipoprotein cholesterol (LDLc) higher than 160 mg/dL, high-density lipoprotein cholesterol (HDLc) lower than 40 mg/dL in men and lower than 50 mg/dL in women, or triglyceride values higher than 150 mg/dL. Obesity was defined using a BMI value above 30 kg/m2 [31].
In addition, venous blood samples were taken from all participants between 8:00 a.m. and 9:00 a.m.
All measurements were performed by primary care professionals.

2.5. Statistical Analysis

Continuous variables are presented as means ± standard deviations and categorical variables as numbers or percentages. Chi-square tests for percentages and Student's t-tests for continuous variables were used to compare men and women. The ANOVA test was used to compare means between the three aging groups (EVA, HVA, NVA). Multinomial logistic regression was performed to analyze the association between adherence to MD and arterial stiffness, measured through ba-PWV, categorized into three levels according to the 25th and 75th percentile cut-off points. MD was assessed using a numerical scale and was included as a main predictor variable. Regression was adjusted for age, sex, and consumption of antidiabetic, lipid-lowering, and hypertensive drugs. Age, sex, and consumption of lipid-lowering, hypolipidemic, antihypertensive, and lipid-lowering drugs were used as adjustment variables. All analyses were performed by gender and globally. SPSS Statistics for Windows, version 28.0 (IBM Corp, Armonk, NY, USA) was used. A value of p<0.05 was considered as the limit of statistical significance.

3. Results

3.1. Baseline Characteristics

The total sample consisted of 3437 subjects, 500 subjects belonged to the EVA study, 2505 subjects participated in the MARK study and 432 belonged to the EVIDENT study (Figure 1). 43% of the sample consisted of women (n=1468) and the mean age was 60.15±9.55 (60.09±9.71 for women and 60.20±9.43 for men) p=0.728. The score obtained in MD was 5.82±2.03 overall (6.03±1.98 for women and 5.66±2.06 for men) p<0.001. The mean ba-PWV value was 14.38±2.71 (14.24±2.89 for women and 14.49±2.56 for men) p=0.007 (Table 1). This table also shows the values of the drugs used in the treatment of dyslipidemia, diabetes mellitus and hypertension, in addition to the values obtained for cardiovascular risk factors in the overall population and by sex.

3.2. Characteristics of the Subjects in Relation with Vascular Aging and Mediterranean diet

Table 2 shows the differences in the total sample in the MD, cardiovascular risk factors and drugs used in the subjects according to their degree of aging. 14% of the sample (n=475) was classified as HVA; 45% (n=1559) as NVA and the remaining 41% (n=1403) were classified as EVA (Figure 2). The mean age for subjects in the HVA group was 59.39±10.34, (60.28±9.30 for men and 57.93±11.73 for women); for the NVA group it was 60.33±9.78, (60.34±9.60 for men and 60.31±10.04 for women) and for the EVA group it was 60.22±8.98, (60.02±9.29 for men and 60.47±8.59 for women). For the ba-PWV variable, lower velocity was observed for the HVA group with values of 11.60±1.34 (11.91±1.17 for men and 11.08±1.45 for women) than in the NVA groups with values of 13.45±1. 69 (13.59±1.43 for men and 13.25±1.99 for women) and EVA with values of 16.36±2.57 (16.52±2.49 for men and 16.18±2.67 for women) being significant in all cases (p<0.001).
Table 3 shows the differences by sex of the sample in MD, cardiovascular risk factors and drugs used in the subjects according to their degree of aging.
Figure 2 shows the classification according to the degree of aging and origin of the subjects in each of the three studies

3.3. Association between ba-PWV y MD overall and by sex. Multinomial logistic regression.

A multinomial logistic regression was performed to determine the association between ba-PWV and MD, finding a significant relationship both globally and by sex. Globally, a strong association was observed between HVA and NVA (OR=1.751, 95% CI:1.411-2.174, p<0.001), as was the association between HVA and EVA (OR=1.501, 95% CI:1.295-1.740, p<0.001). Women showed an even stronger association between HVA and NVA (OR=2.055, 95% CI:1.456-2.901, p<0.001), and also with EVA (OR=1.413, 95% CI:1.124-1.776, p=0.003). The association was also significant for men, although slightly more moderate: HVA vs. NVA (OR=1.551, 95% CI:1.175-2.047, p=0.002), and HVA vs. EVA (OR=1.549, 95% CI:1.275-1.882, p<0.001) (Table 4).

4. Discussion

This study shows the association between adherence to MD and vascular aging analyzed with the brachial-ankle index (ba-PWV) in a sample of 3437 Caucasian subjects. The most important results found in this work are a strong positive association between HVA and NVA and between HVA and EVA both overall and by sex.
In agreement with a recent review and meta-analysis [32] the MD score was higher in women than in men.
On the other hand, there are several studies showing the benefits of the MD. Among them we can mention the NU-AGE study, with 1296 participants, evaluated whether the MD specifically targeting people over 65 years of age could be effective in shifting the intake of older adults towards a healthy diet [33]. Similarly, Jennings et al. in 2019 found that MD was effective in improving cardiovascular health with significant reductions in blood pressure and arterial stiffness [34].
The study by Assmann et al. with a sample of 3012 participants aged 45 to 65 years investigated the association between adherence to MD in midlife and healthy aging finding that high adherence to MD is favorable in midlife for maintaining good general health during aging [35]. These works are in line with the results shown in this work, finding in the multinomial logistic regression results of the present study show that adherence to MD is associated with lower arterial stiffness, evidenced by the values obtained in all comparisons. This association was observed to a greater extent among individuals belonging to the HVA and NVA groups and between HVA and EVA. Moreover, the association was greater in women especially between HVA and NVA (OR=2.055 vs OR=1.551 in men). It can be deduced that MD is not only associated with a more favorable risk profile but may also be a crucial factor in improving vascular health in the Spanish adult population. Although the values were slightly better in women, significant associations were observed in both sexes, which suggests that better adherence to MD may act as a protector against vascular aging.
It should be noted that studies have also been found in the literature that implement different strategies with the aim of improving health by modifying lifestyles, including adherence to MD, such as adding a yoga program combined with MD, obtaining good results in the intervention group [36] or including new technologies such as a smartphone and smartband, although in the latter case there were no changes in lifestyle related to physical activity or eating habits [37]. More studies are needed to specify the associations between the different strategies that are carried out, as well as to determine to what extent they are effective or to establish the superiority of some over others in improving vascular health in this population.
The present study has a number of limitations. Firstly, the sample is made up of patients without previous cardiovascular disease, so the results cannot be extrapolated to other types of population. On the other hand, the sample analyzed is part of three studies in which the percentage of subjects included is not the same, since the MARK study contributed the greatest number of subjects (2505) compared to EVA (501) or EVIDENT (432). On the other hand, the data were extracted at a single point in time, so it is a cross-sectional study that does not allow us to know cause and effect. However, it is worth highlighting the strengths of the study: it is a study with a large sample recruited from primary care clinics in Spain that investigated adherence to MD in the population of subjects aged 35 to 75 years to determine its association with healthy aging. The study has had a protocolized design that ensures the correct measurement and evaluation of the subjects. The findings of this study underscore the relevance of healthy vascular aging in the prevention of vascular dysfunction, with implications for both public health and gender-differentiated intervention strategies.

5. Conclusions

The results of this study indicate that greater adherence to MD is associated with healthier vascular aging. This suggests the importance of promoting MD as a public health intervention strategy to prevent vascular aging and its consequences.

Author Contributions

Conceptualization, I.L.-R., R.L.-R., and M.A.G.-M.; methodology, I.L.-R., R.L.-R., M.A.G.-M., L.G.-O., and E.R.-S.; formal analysis, M.C.-R. and M.A.G.-M.; investigation, I.L.-R., R.L.-R., L.G.-S., M.G.-S., and L. G.-S.; data curation, M.A.G.-M., E.R.-S., writing—original draft preparation, I.L.-R., R.L.-R., M.G.-S. and L.G.-S.; writing—review and editing, I.L.-R., R.L.-R., and M.A.G.-M.; project administration, M.A.G.-M.; funding acquisition, M.A.G.-M; L.G.-O.. All authors have read and accepted the published version of the manuscript.

Funding

This study was funded by the Regional Health Agency of the Castilla y León government through research projects (GRS 1193/B/15), by the Carlos III Health Institute (ISCIII) of the Ministry of Science and Innovation, by project RD21/0016/0010 of the research network RICAPPS (Red de Investigación en Cronicidad, Atención Primaria y Promoción de la Salud) and by the research project PI21/00454 financed by the Next Generation EU, Recovery and Resilience Mechanism (RRM). Human resources were also obtained through the Castilla y León government research program (INT/M/02/17 and INT/M/04/15), from the biomedical research institute of Salamanca (IBSAL) (IBI21/00001) and the Carlos III Health Institute (INT22/00007). None played any role in the study design, data analysis, reporting of results, or the decision to submit the manuscript for publication.

Institutional Review Board Statement

All personnel involved in this study were trained before the study began. This study was approved by the ethics committee of the Salamanca Health Area Drug Research Ethics Committee.

Informed Consent Statement

Informed consent was obtained from all subjects involved in the study.

Data Availability Statement

The data supporting the findings of this study are available on ZENODO under the DOI doi: 10.5281/zenodo.12166167.

Conflicts of Interest

The authors declare no conflict of interest.

References

  1. Mazza, E.; Ferro, Y.; Pujia, R.; Mare, R.; Maurotti, S.; Montalcini, T.; et al. Mediterranean Diet In Healthy Aging. Journal of Nutrition, Health and Aging 2021, 25, 1076–83. [Google Scholar] [CrossRef] [PubMed]
  2. Sorelli, M.; Perrella, A.; Bocchi, L. Detecting Vascular Age Using the Analysis of Peripheral Pulse. IEEE Trans Biomed Eng. 2018, 65, 2742–50. [Google Scholar] [CrossRef] [PubMed]
  3. Li, A.; Yan, J.; Zhao, Y.; Yu, Z.; Tian, S.; Khan, A.H.; Zhu, Y.; Wu, A.; Zhang, C.; Tian, X.L. Vascular Aging: Assessment and Intervention. Clin Interv Aging. 2023, 18, 1373–95. [Google Scholar] [CrossRef]
  4. Rudnicka, E.; Napierała, P.; Podfigurna, A.; Męczekalski, B.; Smolarczyk, R.; Grymowicz, M. The World Health Organization (WHO) approach to healthy ageing. Maturitas. 2020, 139, 6–11. [Google Scholar] [CrossRef] [PubMed]
  5. Kucharska-Newton, A.M.; Stoner, L.; Meyer, M.L. Determinants of vascular age: An epidemiological perspective. Clin Chem. 2019, 65, 108–18. [Google Scholar] [CrossRef] [PubMed]
  6. Quiñónez-Bareiro, F.; Carnicero, J.A.; Alfaro-Acha, A.; Rosado-Artalejo, C.; Grau-Jimenez, M.C.; Rodriguez-Mañas, L.; et al. Risk of Frailty According to the Values of the Ankle-Brachial Index in the Toledo Study for Healthy Aging. Journal of Frailty and Aging. 2023, 12, 24–9. [Google Scholar] [CrossRef]
  7. Shannon, O.M.; Mendes, I.; Köchl, C.; Mazidi, M.; Ashor, A.W.; Rubele, S.; Minihane, A.M.; Mathers, J.C.; Siervo, M. Mediterranean diet increases endothelial function in adults: A systematic review and meta-Analysis of randomized controlled trials. J Nutr. 2020, 150, 1151–9. [Google Scholar] [CrossRef]
  8. Kim, H.B.; Seo, M.W.; Jung, H.C. Effects of Aerobic vs. Resistance Exercise on Vascular Function and Vascular Endothelial Growth Factor in Older Women. Healthcare (Switzerland). 2023, 11, 2479. [Google Scholar] [CrossRef]
  9. Clayton, Z.S.; Craighead, D.H.; Darvish, S.; Coppock, M.; Ludwig, K.R.; Brunt, V.E.; Seals, D.R.; Rossman, M.J. Promoting healthy cardiovascular aging: emerging topics. J Cardiovasc Aging. 2022, 2, 43. [Google Scholar] [CrossRef]
  10. Nyberg, S.T.; Batty, G.D.; Pentti, J.; Virtanen, M.; Alfredsson, L.; Fransson, E.I.; et al. Obesity and loss of disease-free years owing to major non-communicable diseases: a multicohort study. Lancet Public Health. 2018, 3, e490–7. [Google Scholar] [CrossRef]
  11. Andreo-López, M.C.; Contreras-Bolívar, V.; Muñoz-Torres, M.; García-Fontana, B.; García-Fontana, C. Influence of the Mediterranean Diet on Healthy Aging. Int J Mol Sci. 2023. Int J Mol Sci. 2023, 24, 4491. [Google Scholar] [CrossRef]
  12. Dominguez, L.J.; Veronese, N.; Di Bella, G.; Cusumano, C.; Parisi, A.; Tagliaferri, F.; et al. Mediterranean diet in the management and prevention of obesity. Exp Gerontol. 2023, 174, 112121. [Google Scholar] [CrossRef] [PubMed]
  13. Dominguez, L.J.; Di Bella, G.; Veronese, N.; Barbagallo, M. Impact of mediterranean diet on chronic non-communicable diseases and longevity. Nutrients. 2021, 13, 2028. [Google Scholar] [CrossRef] [PubMed]
  14. Hu, F.B. Diet strategies for promoting healthy aging and longevity: An epidemiological perspective. J Intern Med. 2024, 295, 508–31. [Google Scholar] [CrossRef] [PubMed]
  15. Suardi, C.; Cazzaniga, E.; Graci, S.; Dongo, D.; Palestini, P. Link between viral infections, immune system, inflammation and diet. Int J Environ Res Public Health. 2021, 18, 2455. [Google Scholar] [CrossRef]
  16. Afshin, A.; Sur, P.J.; Fay, K.A.; Cornaby, L.; Ferrara, G.; Salama, J.S.; et al. Health effects of dietary risks in 195 countries, 1990–2017: a systematic analysis for the Global Burden of Disease Study 2017. The Lancet. 2019, 393, 1958–72. [Google Scholar] [CrossRef]
  17. Keys, A.; Menotti, A.; Aravanis, C.; Blackburn, H.; Djordevic, B.S.; Buzina, R.; et al. The Seven Countries Study: 2,289 Deaths in 15 Years. Prev Med. 1984, 13, 141–54. [Google Scholar] [CrossRef]
  18. Estruch, R.; Ros, E.; Salas-Salvadó, J.; Covas, M.I.; Corella, D.; Arós, F.; et al. Primary Prevention of Cardiovascular Disease with a Mediterranean Diet Supplemented with Extra-Virgin Olive Oil or Nuts. New England Journal of Medicine. 2018, 378, e34. [Google Scholar] [CrossRef]
  19. Bonaccio, M.; Di Castelnuovo, A.; Costanzo, S.; Gialluisi, A.; Persichillo, M.; Cerletti, C.; et al. Mediterranean diet and mortality in the elderly: A prospective cohort study and a meta-analysis. British Journal of Nutrition. 2018, 120, 841–54. [Google Scholar] [CrossRef]
  20. Shannon, O.M.; Stephan, B.C.M.; Minihane, A.M.; Mathers, J.C.; Siervo, M. Nitric Oxide Boosting Effects of the Mediterranean Diet: A Potential Mechanism of Action. J Gerontol A Biol Sci Med Sci. 2018, 73, 902–904. [Google Scholar] [CrossRef]
  21. Tosti, V.; Bertozzi, B.; Fontana, L. Health Benefits of the Mediterranean Diet: Metabolic and Molecular Mechanisms. J Gerontol A Biol Sci Med Sci. 2018, 73, 318–326. [Google Scholar] [CrossRef] [PubMed]
  22. Stevenson, E.J.; Shannon, O.M.; Minihane, A.M.; Adamson, A.; Burns, A.; Hill, T.; et al. NuBrain: UK consortium for optimal nutrition for healthy brain ageing. Nutr Bull. 2020, 45, 223–9. [Google Scholar] [CrossRef]
  23. Martí, R.; Parramon, D.; García-Ortiz, L.; Rigo, F.; Gómez-Marcos, M.A.; Sempere, I.; et al. Improving interMediAte Risk management. MARK study. BMC Cardiovasc Disord. 2011, 11, 61. [Google Scholar] [CrossRef] [PubMed]
  24. Recio-Rodríguez, J.I.; Martín-Cantera, C.; González-Viejo, N.; Gómez-Arranz, A.; Arietaleanizbeascoa, M.S.; Schmolling-Guinovart, Y.; et al. Effectiveness of a smartphone application for improving healthy lifestyles, a randomized clinical trial (EVIDENT II): Study protocol. BMC Public Health. 2014, 14, 254. [Google Scholar] [CrossRef]
  25. Gómez-Marcos, M.A.; Martínez-Salgado, C.; González-Sarmiento, R.M.A.; Hernández-Rivas, J.; Sánchez-Fernández, P.L.; Recio-Rodríguez, J.I.; et al. Association between different risk factors and vascular accelerated ageing (EVA study): study protocol for a cross-sectional, descriptive observational study. BMJ Open. 2016, 6, e011031. [Google Scholar] [CrossRef]
  26. Gómez-Sánchez, M.; Patino-Alonso, M.C.; Gómez-Sánchez, L.; Recio-Rodríguez, J.I.; Rodríguez-Sánchez, E.; Maderuelo-Fernández, J.A.; et al. Reference values of arterial stiffness parameters and their association with cardiovascular risk factors in the Spanish population. The EVA Study. Revista Española de Cardiología 2020, 73, 43–52. [Google Scholar] [CrossRef]
  27. Gómez-Sánchez, M.; Gómez-Sánchez, L.; Patino-Alonso, M.C.; Cunha, P.G.; Recio-Rodríguez, J.I.; Alonso-Domínguez, R.; et al. Vascular aging and its relationship with lifestyles and other risk factors in the general Spanish population: EarlyVascular Ageing Study. J Hypertens 2020, 38, 1110–22. [Google Scholar] [CrossRef]
  28. Schröder, H.; Fitó, M.; Estruch, R.; Martínez-González, M.A.; Corella, D.; Salas-Salvadó, J.; et al. A Short screener is valid for assessing mediterranean diet adherence among older spanish men and women. Journal of Nutrition 2011, 141, 1140–5. [Google Scholar] [CrossRef]
  29. Yamashina, A.; Tomiyama, H.; Takeda, K.; Tsuda, H.; Arai, T.; Hirose, K.; et al. Validity, Reproducibility, and Clinical Significance of Noninvasive Brachial-Ankle Pulse Wave Velocity Measurement. Hypertens Res. 2002, 25, 359–64. [Google Scholar] [CrossRef]
  30. Diehm, C.; Allenberg, J.R.; Pittrow, D.; Mahn, M.; Tepohl, G.; Haberl, R.L.; et al. Mortality and vascular morbidity in older adults with asymptomatic versus symptomatic peripheral artery disease. Circulation. 2009, 120, 2053–61. [Google Scholar] [CrossRef]
  31. Mancia, G.; Fagard, R.; Narkiewicz, K.; Redon, J.; Zanchetti, A.; Bohm, M.; et al. The task force for the management ofarterial hypertension of the european society ofhypertension (esh) and of the european society of cardiology (esc). J Hypertens. 2013, 31, 1281–357. [Google Scholar] [CrossRef]
  32. Rose, L.; Wood, A.; Gill, T. Gender differences in adherence and retention in Mediterranean diet interventions with a weight-loss outcome: A systematic review and meta-analysis. Obes Rev. 2024, 25, e13824. [Google Scholar] [CrossRef] [PubMed]
  33. Berendsen, A.A.M.; van de Rest, O.; Feskens, E.J.M.; Santoro, A.; Ostan, R.; Pietruszka, B.; et al. Changes in dietary Intake and Adherence to the NU-AGE diet following a one-year dietary intervention among European older adults—Results of the NU-AGE randomized trial. Nutrients. 2018, 10, 1905. [Google Scholar] [CrossRef] [PubMed]
  34. Jennings, A.; Berendsen, A.M.; De Groot, L.C.P.G.M.; Feskens, E.J.M.; Brzozowska, A.; Sicinska, E.; et al. Mediterranean-style diet improves systolic blood pressure and arterial stiffness in older adults: Results of a 1-year european multi-center trial. Hypertension. 2019, 73, 578–86. [Google Scholar] [CrossRef] [PubMed]
  35. Assmann, K.E.; Adjibade, M.; Andreeva, V.A.; Hercberg, S.; Galan, P.; Kesse-Guyot, E. Association between Adherence to the Mediterranean Diet at Midlife and Healthy Aging in a Cohort of French Adults. Journals of Gerontology - Series A Biological Sciences and Medical Sciences 2018, 73, 347–54. [Google Scholar] [CrossRef]
  36. Carcelén-Fraile, M.D.C.; Martín-Baute, M.R.; Ledesma-Cerrato, M.I.; Castellote-Caballero, Y.; González-Martín, A.M.; Hita-Contreras, F.; et al. Effects of a Yoga Program Combined with a Mediterranean Diet on Nutritional Status and Functional Capacity in Community-Dwelling Older Adults: A Randomized Controlled Clinical Trial. Nutrients. 2024, 16, 1601. [Google Scholar] [CrossRef]
  37. Recio-Rodríguez, J.I.; González-Sánchez, S.; Tamayo-Morales, O.; Gómez-Marcos, M.A.; García-Ortiz, L.; Niño-Martín, V.; et al. Changes in lifestyles, cognitive impairment, quality of life and activity day living after combined use of smartphone and smartband technology: a randomized clinical trial (EVIDENT-Age study). BMC Geriatr. 2022, 22, 782. [Google Scholar] [CrossRef]
Figure 1. This flow chart describes to which study each of the 3437 subjects included in the random sampling selection belonged.
Preprints 139991 g001
Figure 2. Global proportion of subjects with HVA, NVA and EVA.
Preprints 139991 g002
Table 1. General characteristics of the subjects included overall and by sex.
Global (n=3437) Women (n=1468) Men (n=1969) p value
Mediterranean Diet
MD (total score) 5.82±2.03 6.03±1.98 5.66±2.06 <0.001
Adherence to MD, n (%) 1650(48.0) 588(40.1) 1062(53.9) <0.001
Conventional risk factors
Age, (years) 60.15±9.55 60.09±9.71 60.20±9.43 0.728
SBP, (mmHg) 133.45±19.53 128.72±20.55 136.99±17.93 <0.001
DBP, (mmHg) 82.07±10.97 79.64±10.84 83.89±10.71 <0.001
Hypertension, n (%) 2943(85.6) 1309(89.2) 1634(83) <0.001
Antihypertensive drugs, n (%) 1573(45.8) 654(44.6) 919(46.7) 0.217
Total cholesterol, (mg/dl) 216.42±41.11 220.54±42.47 213.34±39.80 <0.001
LDL cholesterol, (mg/dl) 133.09±35.18 132.53±35.94 133.50±34.60 0.426
HDL cholesterol, (mg/dl) 52.54±14.50 57.27±15.77 49.01±12.34 <0.001
Triglycerides, (mg/dl) 133.38±83.74 122.63±68.62 141.42±92.67 <0.001
Dyslipidemia, n (%) 2487(72.4) 1076(73.3) 1411(71.7) 0.289
Lipid–lowering drugs. n (%) 974(28.3) 429(29.2) 545(27.7) 0.320
FPG, (mg/dl) 101.75±31.82 100.24±32.30 102.88±31.42 0.016
HbA1c 5.94±1.05 5.93±1.07 5.94±1.04 0.680
Diabetes mellitus, n (%) 759(22.1) 306(20.8) 453(23.0) 0.131
Hypoglycaemic drugs, n (%) 576(16.8) 234(15.9) 342(17.4) 0.267
Weight, kg 77.52±14.65 70.20±13.31 82.98±13.15 <0.001
Height, cm 164.59±9.46 157.11±6.67 170.17±7.08 <0.001
BMI, (kg/m2) 28.56±4.53 28.47±5.30 28.62±3.86 0.367
WC, cm 98.65±12.07 94.33±12.91 101.87±10.30 <0.001
Obesity, n (%) 1086(31.6) 495(33.7) 591(30.0) 0.021
Arterial stiffness
ba-PWV, m/second 14.38±2.71 14.24±2.89 14.49±2.56 0.007
Values are means ± standard deviations for continuous data and number and proportions for categorical data. MD: mediterranean diet; SBP: systolic blood pressure; DBP: diastolic blood pressure; LDL: low–density lipoprotein;HDL: high–density lipoprotein; FPG: fasting plasma glucose; HbA1c: glycosylated hemoglobin; BMI: body mass index; WC: Waist circumference. p value: differences between men and women.
Table 2. Characteristics of the subjects included with and without healthy vascular aging.
HVA(n=475) NVA(n=1559) EVA(n=1403) p value
Mediterranean Diet
MD (total score) 6.20±2.10 5.98±2.02 5.51±1.99 <0.001
Adherence to MD, n (%) 267(56.2) 805(51.6) 578(41.2) <0.001
Conventional risk factors
Age, (years) 59.39±10.34 60.33±9.78 60.22±8.98 0.207
SBP, (mmHg) 121.03±15.38 129.98±18.57 141.52±18.45 <0.001
DBP, (mmHg) 76.27±10.19 80.23±10.03 86.08±10.80 <0.001
Hypertension, n (%) 455(95.8) 1382(88.6) 1106(78.8) <0.001
Antihypertensive drugs, n (%) 161(33.9) 708(45.4) 704(50.2) <0.001
Total cholesterol, (mg/dl) 211.92±36.34 213.49±41.34 221.18±41.91 <0.001
LDL cholesterol, (mg/dl) 131.25±31.60 131.13±35.51 135.90±35.80 <0.001
HDL cholesterol, (mg/dl) 54.16±13.52 52.99±15.00 51.49±14.17 <0.001
Triglycerides, (mg/dl) 112.48±55.29 128.77±77.38 145.61±95.84 <0.001
Dyslipidemia, n (%) 286(60.2) 1098(70.4) 1103(78.6) <0.001
Lipid–lowering drugs. n (%) 98(20.6) 458(29.4) 418(28.8) <0.001
FPG, (mg/dl) 88.23±11.41 99.13±26.61 109.06±39.17 <0.001
HbA1c 5.46±0.36 5.86±0.90 6.18±1.27 <0.001
Diabetes mellitus, n (%) 0(0.0) 340(21.8) 419(29.9) <0.001
Hypoglycaemic drugs, n (%) 0(0.0) 256(16.4) 320(22.8) <0.001
Weight, kg 77.99±14.49 77.13±14.86 77.93±14.47 0.356
Height, cm 166.71±9.44 164.64±9.38 163.82±9.45 <0.001
BMI, (kg/m2) 28.02±4.40 28.40±4.74 28.90±4.31 <0.001
WC, cm 96.86±11.93 98.14±12.56 99.83±11.44 <0.001
Obesity, n (%) 123(25.9) 484(31.0) 479(34.1) <0.001
Arterial stiffness
ba-PWV, m/second 11.60±1.34 13.45±1.69 16.36±2.57 <0.001
Values are means ± standard deviations for continuous data and number and proportions for categorical data.HVA: healthy vascular aging; NVA: normal vascular aging; EVA: early vascular aging; MD: Mediterranean Diet; SBP: systolic blood pressure; DBP: diastolic blood pressure; LDL: low–density lipoprotein; HDL: high–density lipoprotein; FPG: fasting plasma glucose; HbA1c: glycosylated hemoglobin; BMI: body mass index; WC Waist circumference. p value: differences between groups.
Table 3. Characteristics of the subjects included with and without healthy vascular aging by sex.
HVA(n=475) NVA(n=1559) EVA(n=1403) p value
Men (n=295) Women (n=180) Men (n=899) Women (n=660) Men (n=775) Women (n=628) Men Women
Mediterranean Diet
MD (total score) 5.92±2.11 6.68±2.01 5.85±2.07 6.16±1.93 5.33±1.99 5.72±1.97 <0.001 <0.001
Adherence to MD, n (%) 170(57.6) 97(53.9) 524(58.3) 281(42.6) 368(47.5) 210(43.4) <0.001 <0.001
Conventional risk factors
Age, (years) 60.28±9.30 57.93±11.73 60.34±9.60 60.31±10.04 60.02±9.29 60.47±8.59 0.771 0.025
SBP, (mmHg) 125.70±14.16 113.38±14.23 133.37±15.63 125.37±21.11 145.48±17.95 136.63±17.90 <0.001 <0.001
DBP, (mmHg) 78.46±9.14 72.68±10.80 82.06±9.45 77.75±10.27 88.06±11.13 83.63±9.85 <0.001 <0.001
Hypertension, n (%) 276(93.6) 179(99.4) 781(86.9) 601(91.1) 577(74.5) 529(84.2) <0.001 <0.001
Antihypertensive drugs, n (%) 107(36.3) 54(30.0) 427(47.5) 281(42.6) 385(49.7) 319(50.8) <0.001 <0.001
Total cholesterol, (mg/dl) 214.11±35.88 208.32±36.90 209.48±40.55 218.96±41.82 217.52±39.95 225.71±43.83 <0.001 <0.001
LDL cholesterol, (mg/dl) 135.43±31.75 124.35±30.19 131.07±34.89 131.20±36.36 135.60±35.19 136.26±36.56 0.018 <0.001
HDL cholesterol, (mg/dl) 50.66±11.29 59.95±14.87 48.69±12.01 58.85±16.61 48.75±13.05 54.85±14.78 0.028 <0.001
Triglycerides, (mg/dl) 122.33±60.43 96.39±40.98 135.16±78.53 120.09±79.97 156.03±113.67 132.84±65.76 <0.001 <0.001
Dyslipidemia, n (%) 187(63.4) 99(55.0) 639(71.1) 459(69.5) 585(75.5) 518(82.5) <0.001 <0.001
Lipid–lowering drugs. n (%) 64(21.7) 34(18.9) 266(29.6) 192(29.1) 215(27.7) 203(32.3) 0.031 0.002
FPG, (mg/dl) 90.99±11.13 85.29±10.99 100.86±26.26 96.78±26.94 109.78±39.49 108.17±38.79 <0.001 <0.001
HbA1c 5.49±0.35 5.42±0.38 5.91±0.93 5.79±0.84 6.15±1.24 6.22±1.30 <0.001 <0.001
Diabetes mellitus, n (%) 0(0.0) 0(0.0) 220(24.5) 120(18.2) 233(30.1) 186(29.6) <0.001 <0.001
Hypoglycaemic drugs, n (%) 0(0.0) 0(0.0) 165(18.4) 91(13.8) 177(22.8) 143(22.8) <0.001 <0.001
Weight, kg 82.81±13.32 70.09±12.78 82.67±13.06 69.59±13.82 83.40±13.20 70.87±12.90 0.505 0.228
Height, cm 171.74±6.98 158.47±6.78 170.11±7.02 157.19±6.65 169.64±7.11 156.64±6.61 <0.001 0.006
BMI, (kg/m2) 28.05±3.84 27.98±5.20 28.54±3.93 28.22±5.65 28.92±3.76 28.88±4.91 0.003 0.028
WC, cm 99.98±10.52 91.79±12.37 101.77±10.71 93.18±13.22 102.70±9.62 96.26±12.47 <0.001 <0.001
Obesity, n (%) 71(24.1) 52(28.9) 272(30.3) 212(32.1) 248(32.0) 231(36.8) 0.040 0.072
Arterial stiffness
ba-PWV, m/second 11.91±1.17 11.08±1.45 13.59±1.43 13.25±1.99 16.52±2.49 16.18±2.67 <0.001 <0.001
Values are means ± standard deviations for continuous data and number and proportions for categorical data. HVA: healthy vascular aging; NVA: normal vascular aging; EVA: early vascular aging; MD: mediterranean diet; SBP: systolic blood pressure; DBP: diastolic blood pressure; LDL: low–density lipoprotein; HDL: high–density lipoprotein; FPG: fasting plasma glucose; HbA1c: glycosylated hemoglobin; BMI: body mass index; WC Waist circumference.p value: differences between groups.
Table 4. Association of ba-PWV con MD overall and by sex. Multinomial logistic regression.
Global OR (CI 95%) p
MD
HVA vs NVA 1.751 (1.411 to 2.174) <0.001
HVA vs EVA 1.501 (1.295 to 1.740) <0.001
Women
MD
HVA vs NVA 2.055 (1.456 to 2.901) <0.001
HVA vs EVA 1.413 (1.124 to 1.776) 0.003
Men
MD
HVA vs NVA 1.551 (1.175 to 2.047) 0.002
HVA vs EVA 1.549 (1.275 to 1.882) <0.001
Multinomial logistic regression using ba-PWV as dependent variables. As independent MD and as adjustment variables age, sex, and consumption of antihypertensive drugs, hypoglycemic and lipid-lowering agents). MD: mediterranean diet; HVA: healthy vascular aging; NVA: normal vascular aging; EVA: early vascular aging. OR: odds ratio; CI: confidence interval.
Disclaimer/Publisher’s Note: The statements, opinions and data contained in all publications are solely those of the individual author(s) and contributor(s) and not of MDPI and/or the editor(s). MDPI and/or the editor(s) disclaim responsibility for any injury to people or property resulting from any ideas, methods, instructions or products referred to in the content.
Copyright: This open access article is published under a Creative Commons CC BY 4.0 license, which permit the free download, distribution, and reuse, provided that the author and preprint are cited in any reuse.
Prerpints.org logo

Preprints.org is a free preprint server supported by MDPI in Basel, Switzerland.

Subscribe

Disclaimer

Terms of Use

Privacy Policy

Privacy Settings

© 2025 MDPI (Basel, Switzerland) unless otherwise stated