

Submitted:
19 November 2024
Posted:
19 November 2024
You are already at the latest version
Abstract
Osteoporosis is commonly evaluated using dual-energy X-ray absorptiometry (DXA) for bone mineral density (BMD). Non-contrast computed tomography (CT) scans provide an alternative for opportunistic osteoporosis assessment. This study aimed to evaluate screening thresholds for osteoporosis based on CT attenuation values in Hounsfield units (HU) of L1-L4 vertebrae from abdominal CT scans, compared to DXA assessments of the lumbar spine and hips. Conducted retrospectively over about two years, the analysis included 109 patients who had both CT and DXA scans within 12 months, excluding those with metal artifacts affecting the vertebrae. CT attenuation values in the trabecular region of the vertebrae were measured and compared among three groups based on the lowest T-score from DXA. In a predominantly female cohort (mean age 66.3 years), significant correlations were found between the CT HU values of L1-L4 vertebrae and the lowest T-score. CT HU values differed significantly among normal (17.4%), low bone mass (46.8%), and osteoporosis (35.8%) groups (P < 0.001). A HU threshold of ≤142 at the L1 vertebra showed 91.9% sensitivity and 48.4% specificity, while a threshold of ≤160 HU showed 97.3% sensitivity and 31.3% specificity for screening osteoporosis. In conclusion, this study supports the utility of non-contrast CT with these HU thresholds as an opportunistic osteoporosis assessment.
Keywords:
osteoporosis
; non-contrast computed tomography
; dual-energy x-ray absorptiometry
; Hounsfield units
; bone mineral density
1. Introduction
Osteoporosis is a major public health concern characterized by reduced bone mass and deterioration of bone tissue, leading to increased fracture risk. The condition is often referred to as a “silent disease” due to its asymptomatic nature until a fracture occurs. Thus, effective screening methods are essential for identifying individuals at high risk and implementing preventive measures.
Dual-energy X-ray absorptiometry (DXA) is the gold standard for bone mineral density (BMD) measurement and osteoporosis diagnosis due to its precision and low radiation exposure [1,2,3,4]. However, it is less available in hospitals compared to computed tomography (CT). Quantitative CT (QCT) offers a direct method to assess BMD using CT attenuation [5,6,7,8,9,10]. Many studies suggest that QCT may be more sensitive than DXA for detecting osteoporosis in postmenopausal women, particularly by avoiding the overestimation of BMD associated with factors like spinal degeneration and abdominal aortic calcification. This enhanced sensitivity supports the consideration of QCT as a valuable tool in osteoporosis screening, though it requires calibration for accuracy. In contrast, standard CT scans can also provide BMD assessments in Hounsfield units (HU) without calibration, ensuring consistent interpretation across machines [11,12,13,14,15,16,17,18,19,20,21,22,23,24,25]. Thus, opportunistic screening for osteoporosis by assessing bone density can be considered along with routine CT scans. Thereby, this approach may not only diminish limited resource consumption including time, workloads, and costs, but also minimize additional radiation exposure to the patients.
The International Society for Clinical Densitometry (ISCD) recommends evaluating BMD from CT by selecting 2-3 lumbar vertebrae levels from T12 to L4 [3,4]. However, only the 1st lumbar vertebra (L1) is typically used due to its ease of identification and its common inclusion in CT images of the thorax or abdomen, which enhances the opportunity for bone density assessment in routine clinical settings.
Previous studies have reported the diagnostic performances of applying attenuation of CT ranged from 67% to 100% for sensitivity and 70% to 94% for specificity by using various cutoffs [11,12,13,14,15,16,17,18,19,20,21,22,23,24,25]. Many pivotal studies have supported the use of CT for osteoporosis screening, primarily involving large cohorts of Caucasian patients. One significant analysis, Pickhardt et al. (2013) [11] conducted a retrospective analysis of 1,867 patients who underwent both abdominal CT scans and DXA within six months, measuring CT attenuation in the lumbar spine. They found that a CT attenuation value of L1 vertebra of ≤160 HU had a sensitivity of 90% for osteoporosis screening, while ≤110 HU yielded a specificity exceeding 90%. Buckens et al. (2014) [17] corroborated these findings in a study of 302 participants, confirming that ≤160 HU provided a high sensitivity of 91% for detecting osteoporosis, with a cutoff of ≤80 HU showing a specificity of 90%. Alacreu et al. (2017) [13] further validated the use of CT in assessing BMD in 326 patients, reaffirming the ≤160 HU cutoff with a sensitivity of 91.4% and identifying a threshold of ≤73 HU with a specificity of 90.1%. Li et al. (2018) [15] expanded on these findings by examining CT attenuation in 109 patients and found that a value of ≤136 HU effectively identified osteoporosis, achieving a positive predictive value of 81.2%. Collectively, these studies highlight the potential of CT as a reliable tool for opportunistic screening in clinical practice. However, there is a notable gap in research focusing on Asian populations, which may limit the applicability of these findings. Variations in screening protocols, specific machines, and demographic factors can significantly influence these results.
The ISCD 2019 guidelines emphasize the important of opportunistic CT-based attenuation using Hounsfield Units (HU) for assessing bone health. Specifically, values such as L1 HU < 100 indicate a higher likelihood of osteoporosis, while L1 HU > 150 suggest normal bone density. This approach supports clinical decisions regarding further bone health assessments, particularly in the context of elective orthopedic and spine surgery, where patients may present with various risk factors for impaired bone health.
This research aims to evaluate appropriate screening thresholds for identifying high-risk individuals for osteoporosis using CT, compared to standard osteoporosis diagnosis from DXA measurements, and in relation to other established cutoffs among the Thai population, as the pioneering study of its kind in Southeast Asia.
2. Materials and Methods
This retrospective study adopts a cross-sectional analytic research design aimed at evaluating the association between CT attenuation values and bone mineral density (BMD) in adults. The primary focus is on individuals who have undergone both abdominal CT scans and dual-energy X-ray absorptiometry (DXA) bone density measurements within a defined timeframe.
2.1. Study Population
The target population comprises postmenopausal women and men aged 50 and older. To qualify for inclusion, participants must have received a CT scan of the abdomen or a CT scan of the kidneys, ureters, and bladder (KUB) that included coverage of the lumbar spine (L1-L4), in addition to having a DXA scan performed within a 12-month period, regardless of the order of the tests. The study examines data collected from April 2016 to November 2018.
To maintain the validity of the findings, specific exclusion criteria were established. Participants with metallic implants located in the abdominal region or lower lumbar spine were excluded, as these implants could significantly interfere with CT attenuation measurements, making it impossible to accurately assess any lumbar vertebra.
Data collection encompassed a wide range of variables. Key demographic information was gathered, including age, sex, weight, height, and body mass index (BMI). In addition to these measurements, medical histories were carefully reviewed to identify underlying conditions associated with bone loss, such as primary hyperparathyroidism, chronic renal failure, hyperthyroidism, and Cushing’s syndrome. The study also took into account medications that could contribute to bone density reduction, including steroids, aromatase inhibitors, and levothyroxine, as well as treatments aimed at reducing bone resorption, such as antiresorptive drugs. A history of fragility fractures was also collected to assess its impact on osteoporosis risk. [26,27,28,29,30]
2.2. Protocol of DXA and CT Scans
Bone mineral density (BMD) assessments were performed on patients using Hologic Discovery DXA scanners (Hologic, Bedford, MA), focusing on key anatomical sites including the lumbar spine, femoral neck, and total hip. For diagnostic purposes, the analysis considered the lowest T-score obtained from these regions, adhering to the World Health Organization (WHO) classification criteria for osteoporosis:
T-score ≤ -2.5: Osteoporosis
-2.5 < T-score < -1.0: Low bone mass
T-score ≥ -1.0: Normal
These three categories of patients, based on the lowest T-score, were used to correlate with the mean CT attenuation values. Additionally, the presence of a history of fragility fractures was incorporated into the classification criteria alongside the T-score to refine the classification according to WHO criteria.
CT scans of the abdomen or CT scan of the KUB system covering the lumbar spine (L1-L4) were conducted using Philips Healthcare equipment, with all imaging performed with or without contrast. The series selected for CT attenuation measurement was strictly limited to non-contrast-enhanced CT images, as this approach eliminates the potential for contrast agents to interfere with the precise evaluation of bone mineral density.
2.3. CT Attenuation Measurement
CT attenuation values for each L1-L4 vertebrae were measured on axial images from non-contrast CT scans, using bone window setting. The measurement was performed at the midpoint of each vertebra’s height, with the Region of Interest (ROI) placed specifically on the trabecular bone. The ROI was drawn as large as possible, avoiding areas with artifacts, degenerative changes, bone islands, or hemangioma, as shown in Figure 1. The results are reported in Hounsfield units (HU) [11].
If the patient had vertebral compression graded at Grade I or higher based on the Semiquantitative Grading for Vertebral Fracture, that vertebral level was excluded from analysis, while the remaining levels were measured as usual.
If any vertebral level could not be measured—whether due to the presence of metal artifacts or complete compression of all measured vertebrae—the subject was excluded from the study.
CT attenuation values were analyzed as mean CT attenuation in Hounsfield units (HU) for each vertebrae and area of measurement in mm².
Each vertebra was measured twice with at least a one-month interval to assess the reliability of the measurement. The PACS (Picture Archiving and Communication System) of the hospital was used to ensure consistency and standardization in the imaging process.
2.4. Statistical Analysis
The statistical analysis included several key components. Descriptive statistics were used to present continuous data as means with standard deviations (SD) or median with range, as appropriate, while categorical data were reported as frequencies and percentages. For assessing the reliability of CT attenuation measurement, the intraclass correlation coefficient (ICC) was applied using a two-way random effects model. One-way ANOVA assessed differences in mean CT attenuation values among groups. Post hoc analyses using the least-significant difference method were performed if significant differences were found. Empirical ROC curve analysis was carried out with osteoporosis designated as a true positive while low bone mass and normal were considered false positives. Threshold as screening tools were selected to ensure a sensitivity of 90% or higher, especially at level L1 vertebra, and the value with the highest Youden’s index, combined with a specificity of 90% or more, was analyzed for comparison with previous studies. Finally, the characteristic performance was assessed by evaluating sensitivity, specificity, accuracy, positive and negative predictive values, odds ratios, and likelihood ratios. These metrics were compared with values from Pickhardt et al. [11]. All the analyses were done by using STATA 12 with a level of significance at 5%.
3. Results
3.1. Study Population Characteristics
After applying the inclusion and exclusion criteria, 109 patients who underwent both abdominal CT and DXA within a 12-month interval were identified. The median interval between the two examinations was 139 days (range: 2–364 days), with 57.8% of the patients having an interval greater than six months. The majority of these patients were female (107 patients, 98.2%), with a mean age of 66.3 years (SD 11.2).
Subjects were categorized into three groups based on the diagnosis derived from the lowest T-score on DXA (lumbar spine and hip). The majority of patients were diagnosed with low bone mass, followed by osteoporosis, and then normal bone mass, as detailed in Table 1. Although a trend suggested that patients in the osteoporosis group were older than those in the low bone mass and normal groups, the overall age distribution did not differ significantly among the groups. However, the mean BMI of patients in the osteoporosis and low bone mass groups was significantly lower compared to the normal group (p = 0.004 and p = 0.004, respectively).
. When both T-scores and a history of fragility fractures were incorporated into the classification criteria, the classification system was refined, leading to the formation of four distinct groups. This revised approach allowed for a more comprehensive categorization, taking into account both bone density and clinical risk factors associated with fractures. By using these refined criteria, 10 patients were reclassified from the osteoporosis group to the established osteoporosis group, reflecting their higher risk profile due to prior fragility fractures. Additionally, 9 patients who were initially classified within the low bone mass group and 1 patient from the normal group were moved into the osteoporosis category. This reclassification, illustrated in Figure 2.
3.2. CT Attenuation Values
The number of assessable vertebrae at each level from L1 to L4 varied among the 109 participants due to factors such as metallic artifacts and vertebral collapse. Some vertebrae were excluded from the analysis according to Genant’s semiquantitative method, which recommends excluding vertebrae with compression fractures at grade I or higher. This approach led to fewer vertebrae being included at each level than the total number of participants. Specifically, the analysis included 101 vertebrae at L1, 104 at L2, 100 at L3, and 105 at L4.
CT attenuation measurements demonstrated excellent reliability, with an ICC exceeding 0.96 for all vertebrae and a mean difference of approximately 1-4 HU, despite lower ICC values and greater differences when considering the measurement areas, as detailed in Table 2.
The lowest CT attenuation values for L1-L4 showed a moderate correlation with the lowest T-score, with a Pearson correlation coefficient of 0.542 (95% CI: 0.388, 0.667). When considering DXA diagnostic groups, CT attenuation values revealed significant differences across groups and their post-hoc comparisons (p-value < 0.05). The mean CT attenuation values were highest in the normal bone mass group and lowest in the osteoporosis group, illustrating a trend in which lower attenuation corresponds with lower BMD, as shown in Figure 3 and Appendix A Table A1.
The results of this study highlight the importance of considering the measurement area for CT attenuation across different lumbar spine levels (L1-L4). This factor may impact the accuracy and reliability of the measurements. To analyze this further, the average measurement areas were categorized into three subgroups based on the lowest T-score derived from the lumbar spine, femoral neck, and total hip.
The analysis revealed no significant differences among the osteoporosis, low bone mass, and normal bone mass groups for L1-L4. This indicates that the size of the measurement area does not significantly influence the categorization of bone mass in these three groups, as indicated in Appendix A Table A2.. These findings underscore the need to consider the measurement area when assessing CT attenuation, as it could play a crucial role in evaluating the risk of osteoporosis within the population.
Figure 4 illustrates distinct differences in mean CT attenuation values of patients in different groups: panel (a) depicts a patient classified in the normal bone mass group, while panel (b) shows a patient in the osteoporosis group.
3.3. Screening Value Analysis
The mean CT attenuation values for each lumbar vertebra (L1-L4) were analyzed to determine appropriate screening thresholds that could distinguish osteoporosis from low bone mass and normal bone mass. Screening thresholds were selected to achieve a sensitivity of 90% or higher across all vertebrae. Additional analyses were performed specifically for L1, focusing on identifying CT attenuation values that would meet a specificity of 90% or higher (≤ 94 HU) and the highest Youden’s index (≤ 128 HU). The study also evaluated the cutoff previously reported by Pickhardt et al. [11]. These threshold analyses are detailed in Table 3, providing an in-depth look at diagnostic performance for screening.
4. Discussion
This study aimed to identify appropriate screening values to differentiate individuals at high risk for osteoporosis from those at lower risk and subsequently confirm high-risk cases using standard DXA measurements. We measured and averaged CT attenuation values at the trabecular bone of L1-L4 vertebrae and categorized patients into three groups based on the diagnosis derived from the lowest T-score obtained from DXA (lumbar spine and hip). Our findings indicate that the mean CT attenuation in individuals diagnosed with osteoporosis was significantly lower than that in individuals with low bone mass and normal bone mass. This suggests that CT attenuation values align with bone mass measurements obtained through standard methods, with lower CT attenuation reflecting lower bone mass. Furthermore, this measurement demonstrates reliability, with differences of only a few HU, despite minor variations in the measurement area.
Diagnostic criteria for osteoporosis typically involve the lowest T-score from either the lumbar spine, femoral neck, or total hip. Consequently, we used average CT attenuation from L1-L4 vertebrae, grouped by these criteria, to determine screening values. Our results showed that sensitivity for detecting osteoporosis exceeded 90% at L1-L4 for specific CT attenuation thresholds: ≤142 HU at L1 (91.9%), ≤138 HU at L2 (91.7%), ≤128 HU at L3 (91.2%), and ≤133 HU at L4 (92.1%). Specificity for these thresholds ranged from 38.3% to 48.4%. Consistent with the 2015 ISCD Official Positions-Part III, which recommends assessing the lumbar spine from T12-L4, the study emphasizes the L1 vertebra due to its ease of identification and frequent inclusion in chest or abdominal CT scans, enhancing osteoporosis screening opportunities. L2, L3, and L4 vertebrae may be somewhat comparable to L1 in their screening efficacy; thus, if L1 is unavailable, using L2, L3, or L4 could still provide some valuable diagnostic information. Comparing our findings with the study by Pickhardt et al. [11], where a threshold of ≤160 HU had a sensitivity of >90% and ≤110 HU had a specificity of >90%, it was found that the ≤160 HU threshold still provided a high sensitivity (97.3%) in this study, exceeding the sensitivity of ≤142 HU found in this research. Notably, the specificity of over 90% in this study was achieved with the ≤94 HU threshold, which had a specificity of 90.6%. This comparison confirms the utility of the ≤160 HU threshold for high-sensitivity screening. Similarly, Alacreu et al. [13] reported that ≤160 HU at L1 maintained high sensitivity (91.4%) but noted that ≤73 HU provided specificity >90%, while ≤116 HU balanced sensitivity and specificity.
Studies from Buckens et al. (2015) [17] and Li et al. (2018) [15] also showed varying thresholds. Buckens et al. found L1 ≤160 HU to have high sensitivity (91%) and L1 ≤80 HU to offer high specificity (90%). Li et al. found that ≤175 HU had 94.1% sensitivity, closely aligning with Pickhardt et al., though their study used different ROI sizes and measurement methods.
The discrepancies in results across studies can be attributed to differences in ethnicity, sample size, equipment used, measurement methods, and the interval between CT and DXA scans. These variables significantly influence the outcomes of osteoporosis screening and diagnosis. One major factor is ethnicity, as variations in bone density and structure can occur among different racial and ethnic groups. This diversity can lead to differing baseline values for CT attenuation and T-scores, ultimately affecting diagnostic accuracy. Additionally, sample size plays a critical role; larger, more diverse cohorts may yield more generalizable results, while smaller studies may produce findings that are not representative of the broader population.
The type of equipment used also contributes to variability in results. Different CT and DXA machines may have distinct calibration settings, imaging protocols, and sensitivity levels, all of which can impact the measurements obtained. Furthermore, the methodologies employed for measuring CT attenuation can vary, with some studies using different regions of interest (ROI) or measurement techniques, leading to inconsistent findings. Moreover, the interval between CT and DXA scans is crucial. Most studies recommend a time frame of no more than 6 months between the two assessments to ensure that changes in bone density are accurately captured. However, this study opted for a 12-month interval due to the limited number of patients who underwent both tests within a 6-month period. This longer interval may introduce additional variability, as changes in bone density can occur over time, particularly in individuals at higher risk for osteoporosis.
There are other considerations in this study. The analysis is based solely on grouping samples according to the lowest T-score criteria and does not account for patients with fragility fractures. As a result, 9 patients with low bone mass and 1 with normal bone mass who had fractures and should have been diagnosed with osteoporosis were still classified as non-osteoporotic. Additionally, the study did not adjust for potential confounding factors that could influence CT attenuation values and osteoporosis risk. The association between CT attenuation values of each lumbar vertebra (L1-L4) and the T-score or BMD for each vertebra was not explored in detail. Finally, this study did not explore the practical benefits of applying these CT attenuation values in real-life scenarios, such as changes in treatment or follow-up, which could be addressed in future research.
In terms of application, the choice of CT attenuation values for osteoporosis screening depends on the examination’s purpose. For screening, a threshold with high sensitivity is preferred. This study identified a threshold of ≤142 HU at L1 or ≤160 HU at L1, both offering high sensitivity and confirmed in various studies. Using a high-sensitivity threshold reduces the likelihood of missing osteoporosis in individuals with higher HU values, while those with lower HU values are referred for DXA confirmation. This approach enhances the detection of osteoporosis cases, allowing for timely treatment planning before fractures occur, thereby improving patient quality of life.
In personal practice, combining DXA with CT attenuation values provides several advantages beyond screening for osteoporosis. This approach enhances the overall assessment of bone health by allowing for a more detailed evaluation of trabecular bone quality, which is crucial in identifying patients at risk for fractures, especially in cases where BMD by DXA may be inaccurate due to factors such as severe bone spur formation or sclerosis, aortic calcifications, and obesity. This is particularly important for patients at high risk for osteoporosis, such as those with low trabecular bone scores or a history of low-trauma fractures. By incorporating CT attenuation values, clinicians can obtain a more accurate depiction of bone health, ultimately guiding better clinical decisions.
The effectiveness of using CT for opportunistic screening has been demonstrated in several studies [11,12,13,14,15,16,17,18,19,20,21,22,23,24,25]. Additionally, systematic reviews and meta-analyses confirm that CT-based methods can provide accurate assessments comparable to DXA, potentially enhancing screening programs.
5. Conclusions
This research demonstrates that abdominal CT scans, conducted for various clinical indications, can serve as a valuable screening tool for identifying individuals at high risk for osteoporosis, provided that appropriate screening values are utilized. This not only aids in efficient patient management but also contributes to overall healthcare resource optimization by reducing the need for additional radiation exposure and repeat imaging. This study identified a threshold of ≤142 HU at L1 and ≤160 HU at L1, both of which offer high sensitivity and have been confirmed in various studies. Notably, the threshold of ≤160 HU at L1 provides a higher sensitivity compared to ≤142 HU. These thresholds align with previously established values while offering a practical solution for utilizing existing CT scan data.
In conclusion, the findings emphasize the feasibility of integrating CT attenuation measurements into osteoporosis screening protocols, highlighting the importance of continuous refinement of these parameters to enhance diagnostic accuracy and patient care. Future investigations should further explore the longitudinal impact of using CT attenuation as a routine screening method in diverse populations, ultimately contributing to improved osteoporosis management and patient outcomes.
Author Contributions
Conceptualization, M.C., C.S. (Chanika Sritara), and K.T.; methodology, M.C., C.S. (Chanika Sritara), and K.T.; investigation, M.C, C.S. (Chanika Sritara) and K.T.; resources, M.C., N.C., C.S. (Chaiyawat Suppasilp) and W.C.; writing—original draft preparation, M.C, C.S. (Chaiyawat Suppasilp) and K.T; writing—review and editing, C.S. (Chanika Sritara), N.C., C.S. (Chaiyawat Suppasilp), W.C., S.P., A.K., C.S. (Chaninart Sakulpisuti), and K.T., and; visualization, M.C., C.S. (Chanika Sritara), and K.T.; supervision, C.S. (Chanika Sritara), C.S. (Chaiyawat Suppasilp), and. K.T.; project administration, K.T. All authors have read and agreed to the published version of the manuscript.
Funding
This review article received no external funding, and the APC was funded by the Faculty of Medicine Ramathibodi Hospital, Mahidol University.
Institutional Review Board Statement
The study was conducted according to the guidelines of the Declaration of Helsinki and approved by the Institutional Review Board of the Faculty of Medicine Ramathibodi Hospital (MURA2018/888 and date of approval 3 Dec 2018).
Informed Consent Statement
Patient consent was waived due to retrospective study design for available imaging.
Data Availability Statement
The data presented in this study are available on request from the corresponding author.
Conflicts of Interest
The authors declare no conflicts of interest.
Appendix A

Table A1.
Mean CT attenuation values of L1-L4 vertebrae categorized by the DXA diagnosis by the lowest T-score.
Table A1.
Mean CT attenuation values of L1-L4 vertebrae categorized by the DXA diagnosis by the lowest T-score.
| Lumbar Level |
CT attenuation (Hounsfield unit), mean ± SD | |||
|---|---|---|---|---|
| Lowest T-score | ANOVA test P-value |
|||
| osteoporosis | low bone mass | normal | ||
| L1 | 95.50 ± 34.57 | 134.33± 49.27 | 165.80 ± 39.64 | < 0.001 |
| L2 | 89.50 ± 33.06 | 116.87 ± 49.16 | 155.06± 41.43 | < 0.001 |
| L3 | 83.07 ± 29.94 | 117.45 ± 45.69 | 143.85 ± 42.94 | < 0.001 |
| L4 | 83.54 ± 31.28 | 116.23 ± 45.91 | 154.34 ± 41.74 | < 0.001 |
Table A2.
Area size of the region of interest (ROI) used to measure CT attenuation of L1-L4 vertebrae categorized by the DXA diagnosis by the lowest T-score.
Table A2.
Area size of the region of interest (ROI) used to measure CT attenuation of L1-L4 vertebrae categorized by the DXA diagnosis by the lowest T-score.
| Lumbar Level |
Area of ROI (mm2) mean ± SD | |||
|---|---|---|---|---|
| Lowest T-score | ANOVA test P-value |
|||
| osteoporosis | low bone mass | normal | ||
| L1 | 538.85 ± 90.18 | 520.89 ± 93.34 | 514.43 ± 112.60 | 0.589 |
| L2 | 593.17 ± 95.59 | 595.93 ± 116.07 | 574.84 ± 119.86 | 0.771 |
| L3 | 649.57 ± 101.16 | 639.68 ± 139.64 | 628.52 ± 118.72 | 0.835 |
| L4 | 706.59 ± 131.05 | 652.94 ± 154.41 | 624.57 ± 135.36 | 0.085 |
References
- Kanis JA, McCloskey EV, Johansson H, Oden A, Melton LJ 3rd, Khaltaev N. A reference standard for the description of osteoporosis. Bone. 2008;42(3):467-75.
- Genant HK, Cooper C, Poor G, Reid I, Ehrlich G, Kanis J, et al. Interim report and recommendations of the World Health Organization Task-Force for Osteoporosis. Osteoporos Int. 1999;10(4):259-64.
- World Health Organization. Prevention and management of osteoporosis: report of a WHO scientific group. Geneva: World Health Organization; 2003.
- International Society for Clinical Densitometry. 2019 ISCD Official Positions - Adult. West Hartford, CT: ISCD; 2019.
- Ward RJ, Schauer D, Datz L, et al. ACR Appropriateness Criteria® Osteoporosis and Bone Mineral Density. J Am Coll Radiol. 2017;14(5).
- Zysset P, Qin L, Lang T, Khosla S, Leslie WD, Shepherd JA, et al. Clinical use of quantitative computed tomography–based finite element analysis of the hip and spine in the management of osteoporosis in adults: the 2015 ISCD official positions—Part II. J Clin Densitom. 2015;18(3):359-92.
- Leonhardt Y, May P, Gordijenko O, Koeppen-Ursic VA, Brandhorst H, Zimmer C, et al. Opportunistic QCT bone mineral density measurements predicting osteoporotic fractures: a use case in a prospective clinical cohort. Front Endocrinol (Lausanne). 2020 Nov 9;11:586352. [CrossRef] [PubMed] [PubMed Central]
- Pickhardt PJ, Lee LJ, del Rio AM, Lauder T, Bruce RJ, Summers RM, et al. Simultaneous screening for osteoporosis at CT colonography: bone mineral density assessment using MDCT attenuation techniques compared with the DXA reference standard. J Bone Miner Res. 2011 Sep;26(9):2194-203. [CrossRef] [PubMed]
- Li N, Li XM, Xu L, Sun WJ, Cheng XG, Tian W. Comparison of QCT and DXA: osteoporosis detection rates in postmenopausal women. Int J Endocrinol. 2013;2013:895474. [CrossRef]
- Xu XM, Li N, Li K, Li XY, Zhang P, Xuan YJ, et al. Discordance in diagnosis of osteoporosis by quantitative computed tomography and dual-energy X-ray absorptiometry in Chinese elderly men. J Orthop Transl. 2019;18:59-64. [CrossRef]
- Pickhardt PJ, Pooler BD, Lauder T, Munoz Del Rio A, Bruce RJ, Binkley N. Opportunistic screening for osteoporosis using abdominal computed tomography scans obtained for other indications. Ann Intern Med. 2013;158(8):588-95.
- Schreiber JJ, Anderson PA, Hsu WK. Use of computed tomography for assessing bone mineral density. Neurosurg Focus. 2014;37(1).
- Alacreu E, Moratal D, Arana E. Opportunistic screening for osteoporosis by routine CT in Southern Europe. Osteoporos Int. 2017;28(3):983-90.
- Jang S, Graffy PM, Ziemlewicz TJ, et al. Opportunistic osteoporosis screening at routine abdominal and thoracic CT: normative L1 trabecular attenuation values in more than 20,000 adults. Radiology. 2019;291(2):360-7.
- Li YL, Wong KH, Law MW, Fang BX, Lau VW, Vardhanabuti VV, Lee VK, Cheng AK, Ho WY, Lam W. Opportunistic screening for osteoporosis in abdominal computed tomography for Chinese population. Arch Osteoporos. 2018;13(1):76.
- Lee SJ, Binkley N, Lubner MG, et al. Opportunistic screening for osteoporosis using the sagittal reconstruction from routine abdominal CT for combined assessment of vertebral fractures and density. Osteoporos Int. 2015;27(3):1131-6.
- Buckens CF, Dijkhuis G, Keizer BD, et al. Opportunistic screening for osteoporosis on routine computed tomography? An external validation study. Eur Radiol. 2015;25(7):2074-9.
- Islamian JP, Garoosi I, Fard KA, Abdollahi MR. Comparison between the MDCT and the DXA scanners in the evaluation of BMD in the lumbar spine densitometry. Egypt J Radiol Nucl Med. 2016;47(3):961-7.
- Pickhardt PJ, Lee LJ, del Rio AM, et al. Simultaneous screening for osteoporosis at CT colonography: bone mineral density assessment using MDCT attenuation techniques compared with the DXA reference standard. J Bone Miner Res. 2011;26(9):2194-203.
- Kim KJ, Kim DH, Lee JI, Choi BK, Han IH, Nam KH. Hounsfield units on lumbar computed tomography for predicting regional bone mineral density. Open Med (Wars). 2019; 14:545-51.
- Lee S, Chung CK, Oh SH, Park SB. Correlation between bone mineral density measured by dual-energy X-ray absorptiometry and Hounsfield units measured by diagnostic CT in lumbar spine. J Korean Neurosurg Soc. 2013 Nov;54(5):384-9.
- Hendrickson NR, Pickhardt PJ, Del Rio AM, Rosas HG, Anderson PA. Bone mineral density T-scores derived from CT attenuation numbers (Hounsfield units): clinical utility and correlation with dual-energy X-ray absorptiometry. Iowa Orthop J. 2018; 38:25-31.
- Choi MK, Kim SM, Lim JK. Diagnostic efficacy of Hounsfield units in spine CT for the assessment of real bone mineral density of degenerative spine: correlation study between T-scores determined by DEXA scan and Hounsfield units from CT. Acta Neurochir (Wien). 2016 Jul;158(7):1421-7.
- van Oostwaard M. Osteoporosis and the nature of fragility fracture: an overview. In: Hertz K, Santy-Tomlinson J, editors. Fragility fracture nursing: holistic care and management of the orthogeriatric patient [Internet]. Cham (CH): Springer; 2018. Chapter 1. Available online: https://www.ncbi.nlm.nih.gov/books/NBK543829/. [CrossRef]
- National Institute for Health and Care Excellence (NICE). Osteoporosis: assessing the risk of fragility fracture. London: NICE; 2017 Feb. (NICE Clinical Guidelines, No. 146). Available online: https://www.ncbi.nlm.nih.gov/books/NBK554920/.
- Pasco JA, et al. The population burden of fractures originates in women with osteopenia, not osteoporosis. Osteoporos Int. 2006;17(9):1404-9.
- Kanis JA, et al. The burden of osteoporotic fractures: a method for setting intervention thresholds. Osteoporos Int. 2001;12(5):417-27.
- Johnell O, Kanis JA. An estimate of the worldwide prevalence and disability associated with osteoporotic fractures. Osteoporos Int. 2006;17:1726-33. [PubMed].
- Emohare O, Cagan A, Morgan R, Davis R, Asis M, Switzer J, Polly DW Jr. The use of computed tomography attenuation to evaluate osteoporosis following acute fractures of the thoracic and lumbar vertebra. Geriatr Orthop Surg Rehabil. 2014 Jun;5(2):50-5. [CrossRef] [PubMed]
- Tay WL, Chui CK, Ong SH, Ng ACM. Osteoporosis screening using areal bone mineral density estimation from diagnostic CT images. Acad Radiol. 2012;19(10):1273-82. [CrossRef]
Figure 1.
The method for measuring CT attenuation values in cross-sectional images involves placing the region of interest (ROI) specifically on the trabecular bone area. In this approach, M represents the mean CT attenuation value.
Figure 1.
The method for measuring CT attenuation values in cross-sectional images involves placing the region of interest (ROI) specifically on the trabecular bone area. In this approach, M represents the mean CT attenuation value.
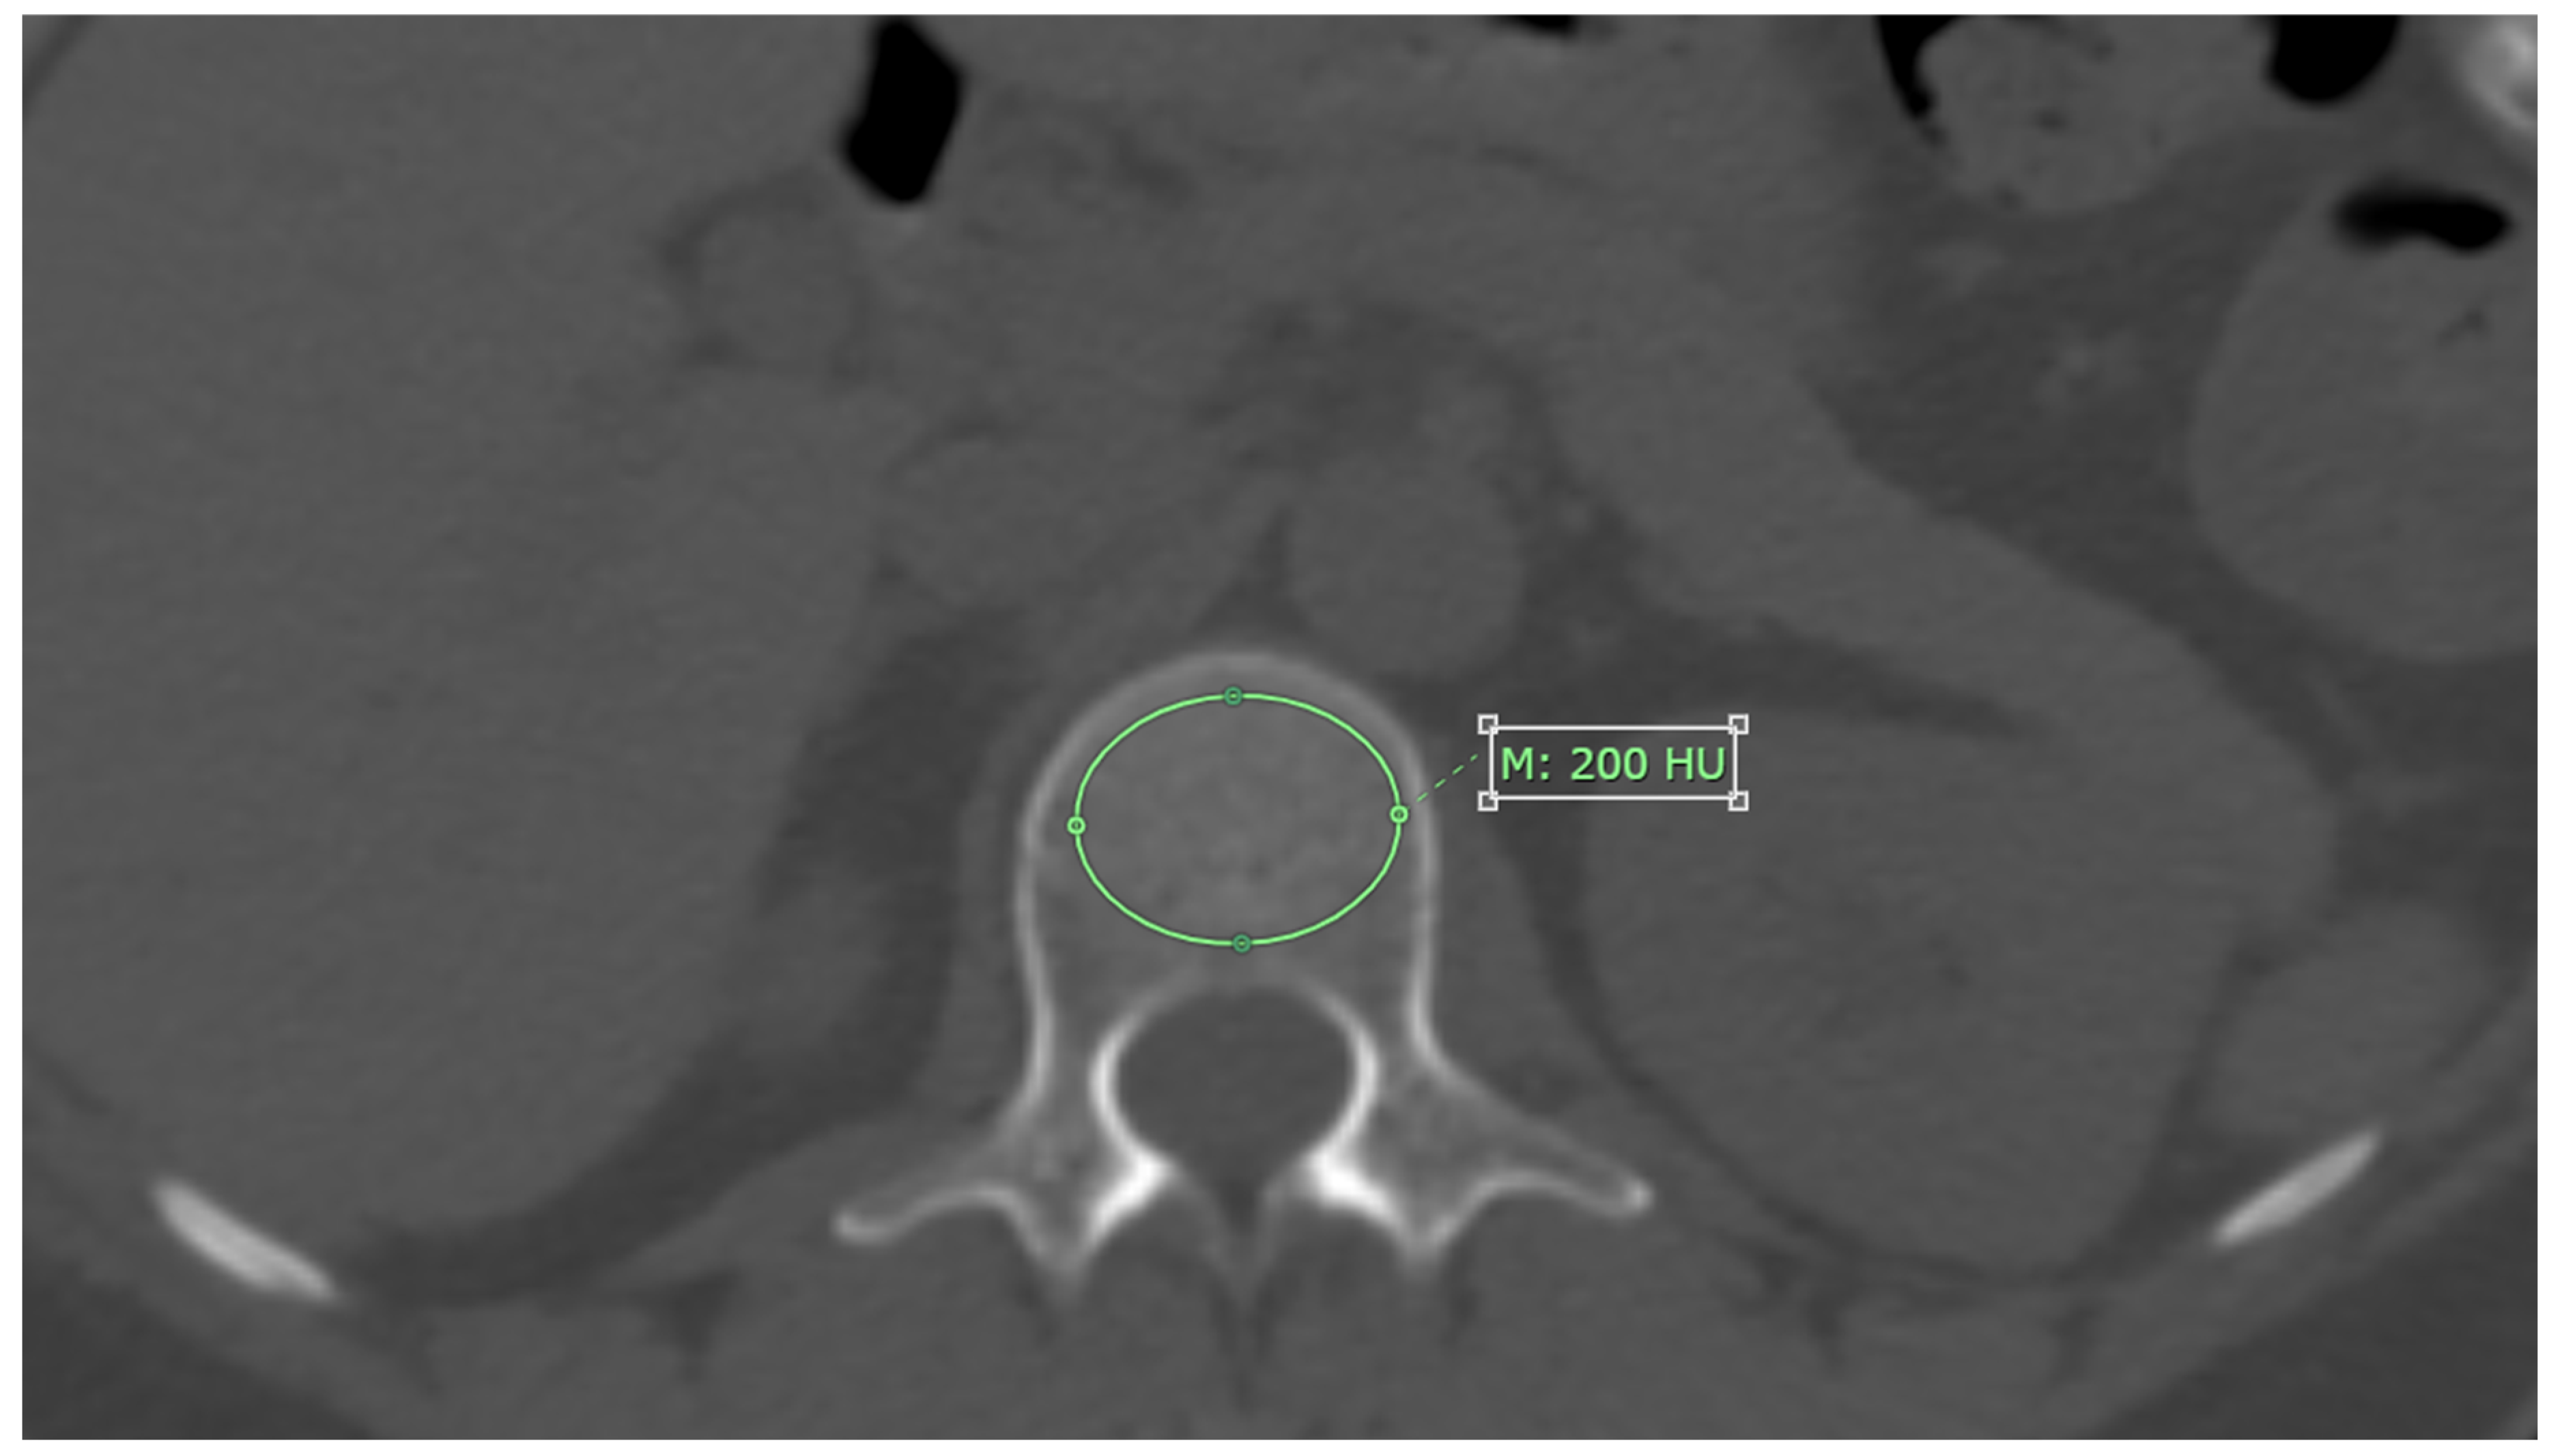
Figure 2.
Diagnosis types based on the lowest T-score and history of fragility fracture.
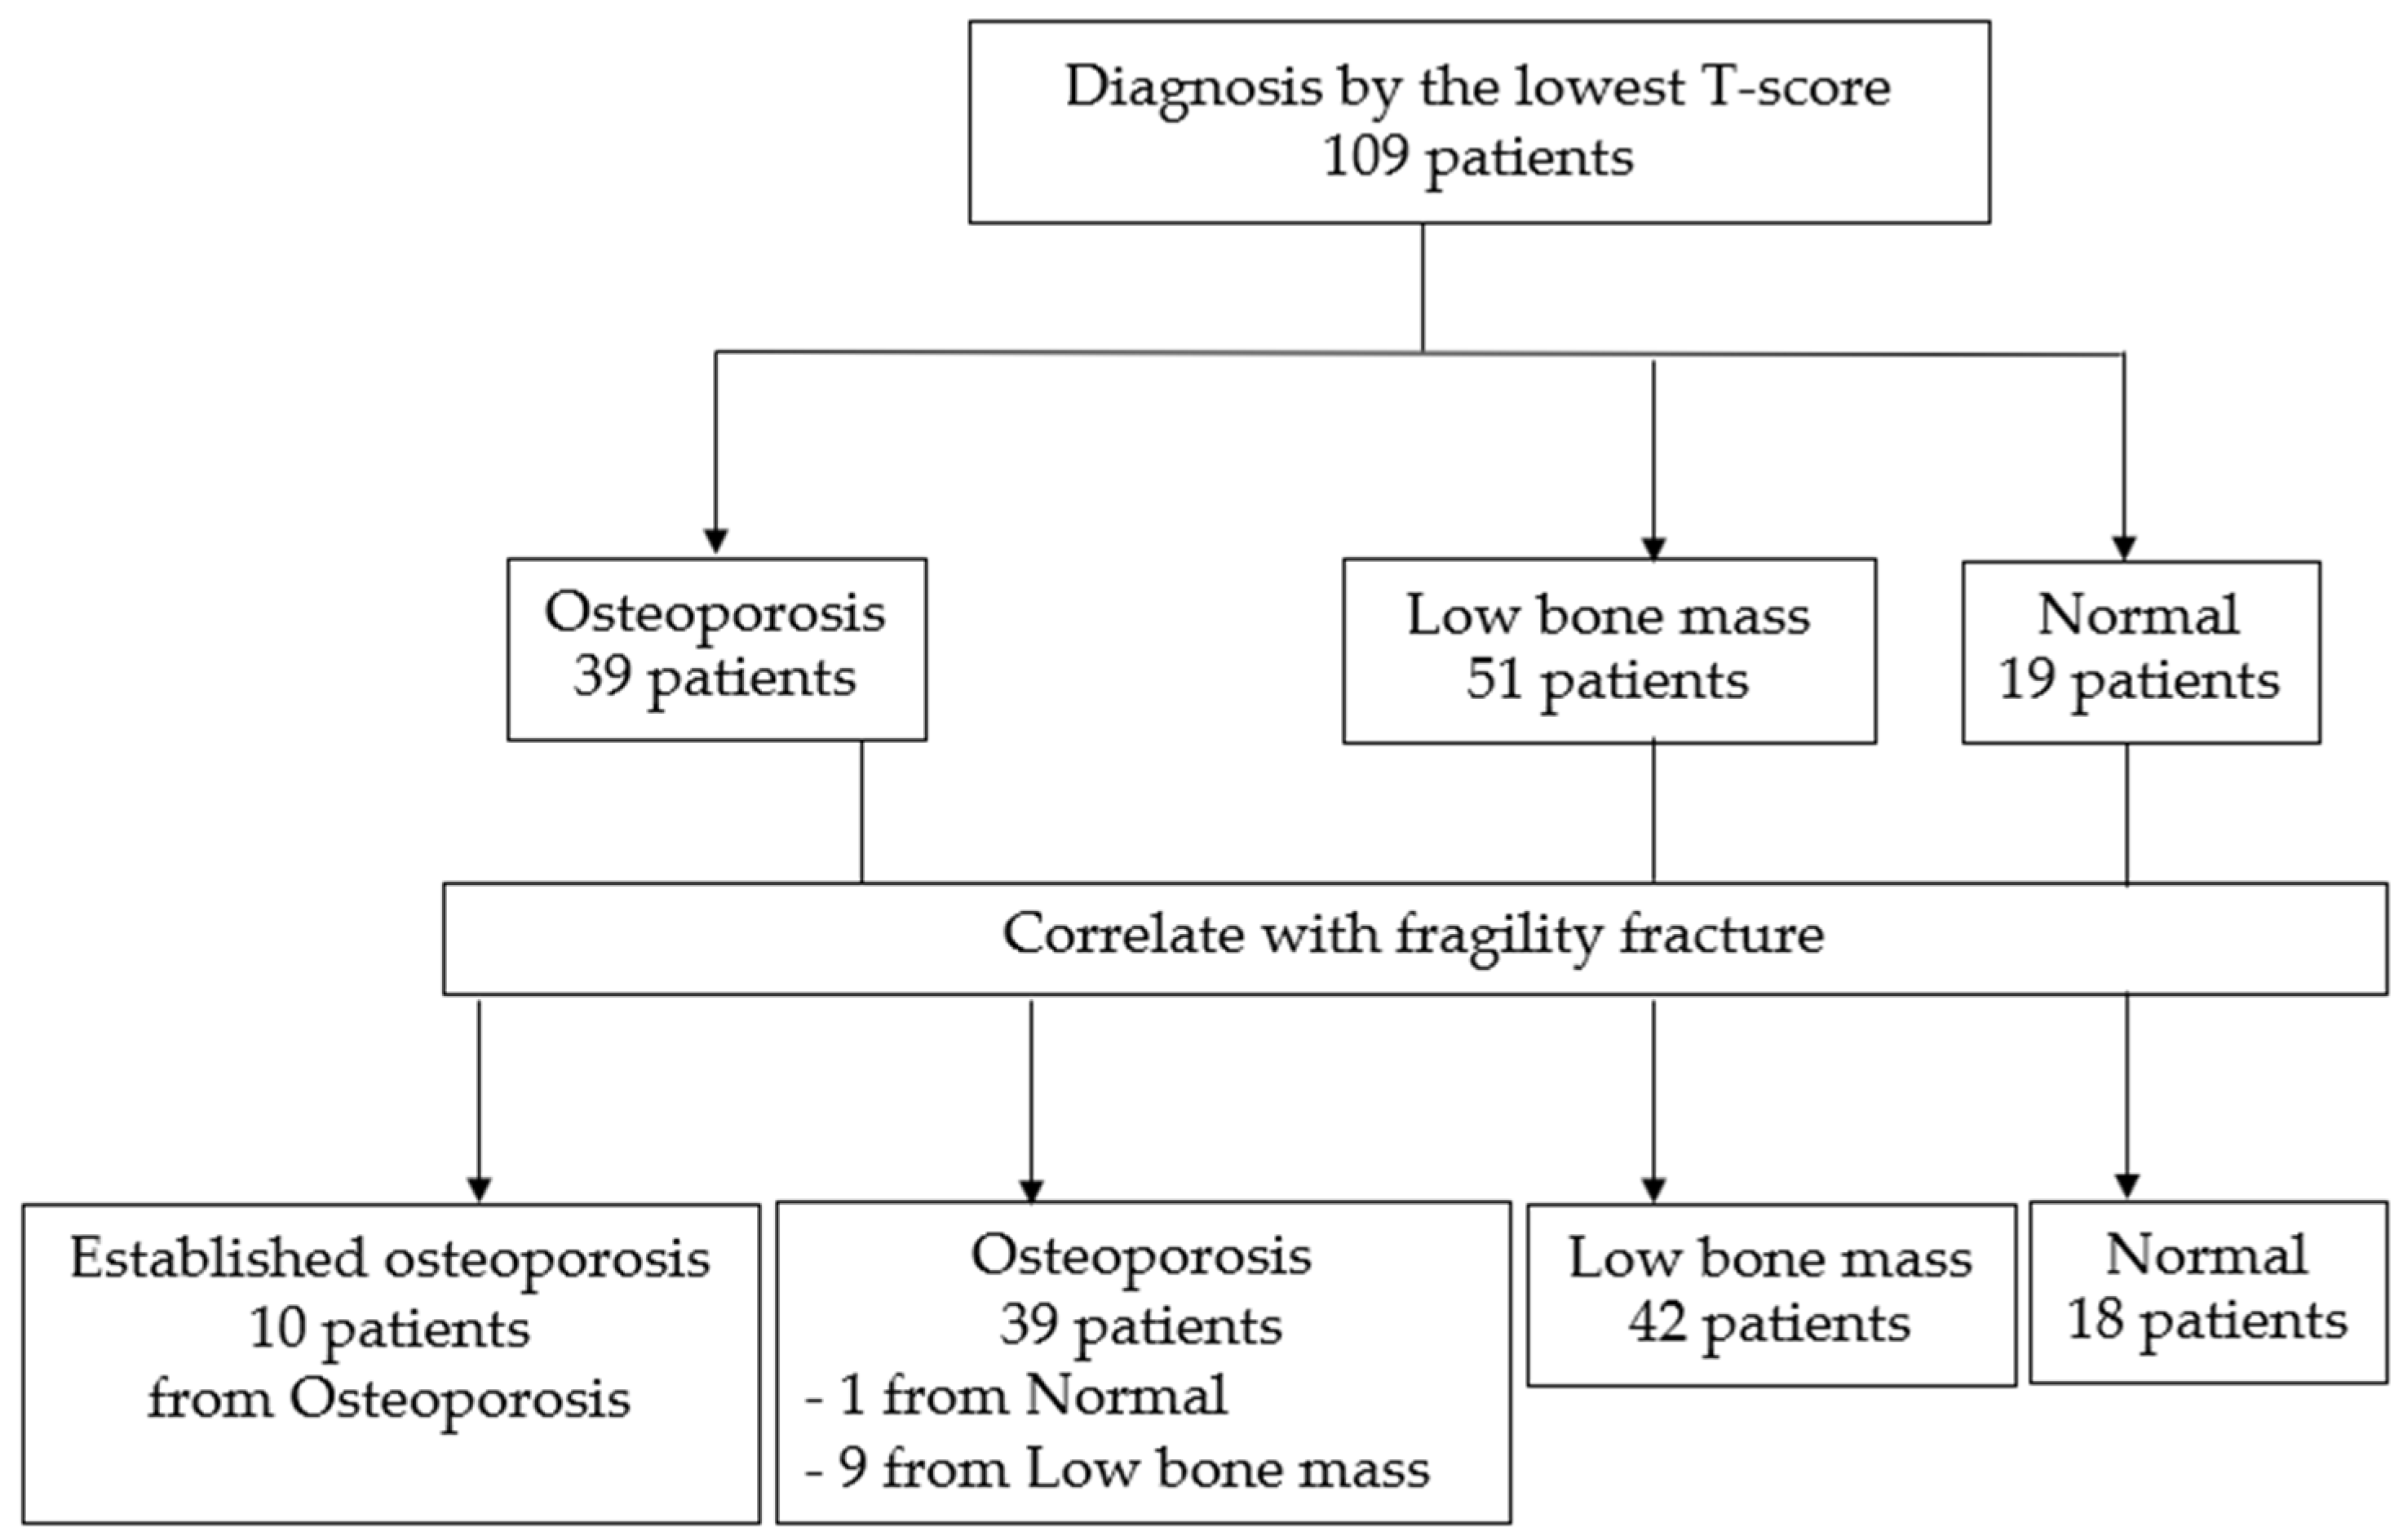
Figure 3.
Mean CT attenuation values of L1-L4 vertebrae categorized by the DXA diagnosis by the lowest T-score.
Figure 3.
Mean CT attenuation values of L1-L4 vertebrae categorized by the DXA diagnosis by the lowest T-score.
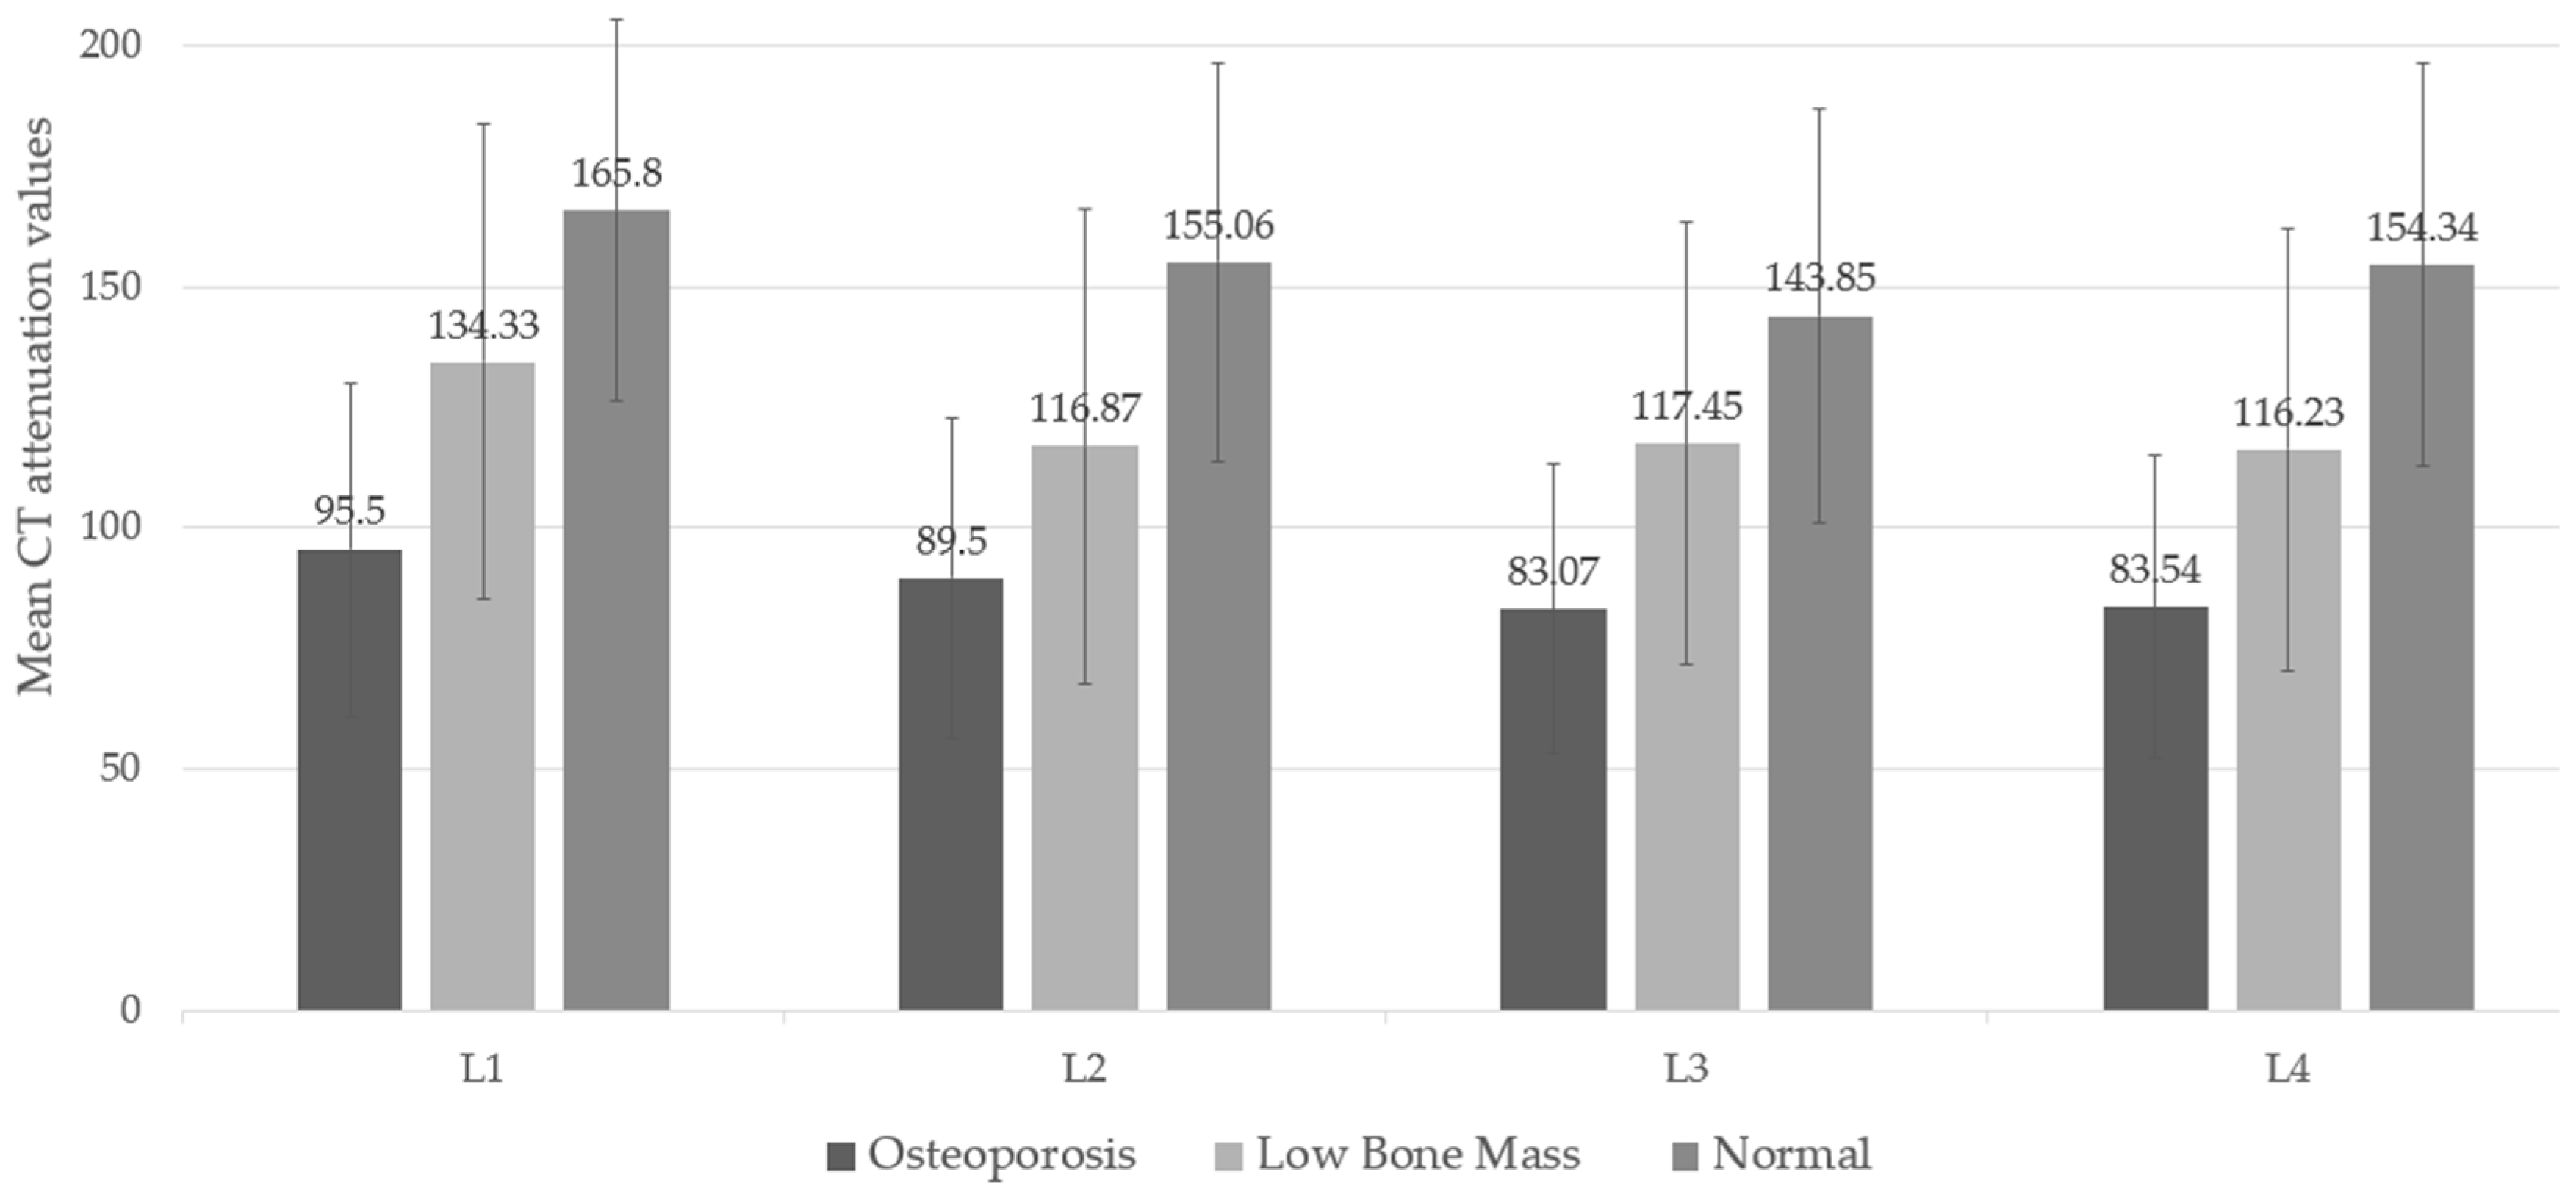
Figure 4.
Mean CT attenuation of patients in different groups. Panel (a) illustrates a patient classified in the normal bone mass group based on the lowest T-score from DXA, exhibiting a mean CT attenuation of approximately 211 Hounsfield Units (HU). In contrast, panel (b) depicts a patient in the osteoporosis group, characterized by a significantly lower mean CT attenuation of 80.5 HU. This comparison underscores the distinct differences in bone density as measured by CT attenuation values across these classifications.
Figure 4.
Mean CT attenuation of patients in different groups. Panel (a) illustrates a patient classified in the normal bone mass group based on the lowest T-score from DXA, exhibiting a mean CT attenuation of approximately 211 Hounsfield Units (HU). In contrast, panel (b) depicts a patient in the osteoporosis group, characterized by a significantly lower mean CT attenuation of 80.5 HU. This comparison underscores the distinct differences in bone density as measured by CT attenuation values across these classifications.
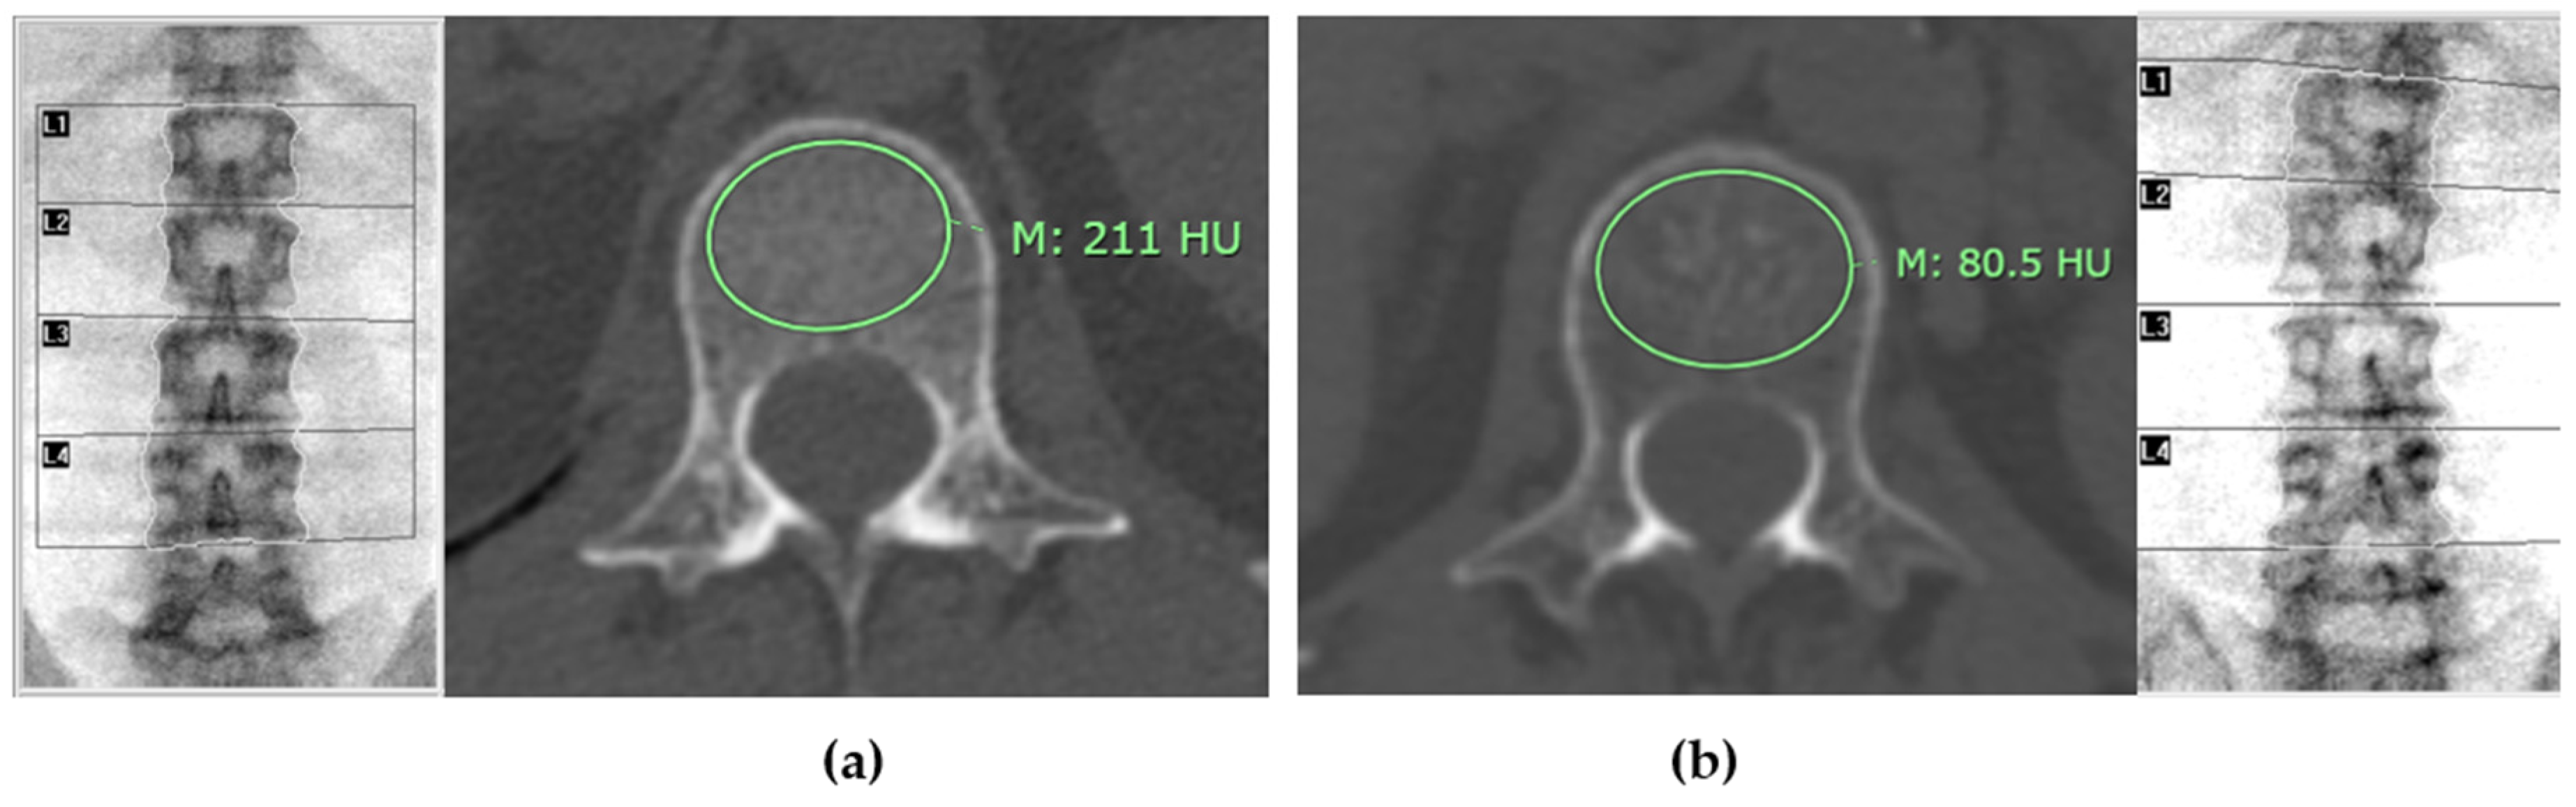
Table 1.
Characteristics by diagnosis based on the lowest T-score.
| Characteristic | Total n = 109 (100%) | Osteoporosis n = 39 (35.8%) | Low Bone Mass n = 51 (46.8%) | Normal n = 19 (17.4%) | p-value |
|---|---|---|---|---|---|
| Diagnosis based on the Lowest T-score | 109 (100) | 39 (35.8) | 51 (46.8) | 19 (17.4) | |
| Age (years), mean ± SD | 66.32 ± 11.24 | 67.64 ± 10.62 | 65.67 ± 11.27 | 65.37 ± 12.86 | 0.660 |
| Gender |
0.314 |
||||
| - Female | 107 (98.2) | 39 (36.4) | 49 (45.8) | 19 (17.8) | |
| - Male | 2 (1.8) | - | 2 (100) | - | |
| BMI (kg/m²), mean ± SD | 24.2 ± 4.4 | 23.4 ± 4.5 | 23.6 ± 3.8 | 27.3 ± 4.8 | 0.003 |
| Underlying Conditions Causing Bone Loss | 21 (19.3) | 8 (38.1) | 10 (47.6) | 3 (14.3) | 0.909 |
| Medications Causing Bone Loss | 23 (21.1) | 8 (34.8) | 12 (52.2) | 3 (13.0) | 0.775 |
| Medication Reducing Bone Resorption | 67 (61.5) | 25 (37.3) | 31 (46.3) | 11 (16.4) | 0.893 |
| Days between CT and DXA (days), median (range) | 139 (2-364) | 143 (15-332) | 139 (2-364) | 112 (14-293) | 0.443# 0.498 |
| - 6 months or less | 46 (42.2) | 16 (34.8) | 24 (52.2) | 6 (13.0) | |
| - 6 – 12 months | 63 (57.8) | 23 (36.5) | 27 (42.9) | 13 (20.6) |
# Kruskal-Wallis test.
Table 2.
Reliability of CT attenuation measurement of L1-L4 vertebrae.
| Measures | Difference (95%CI) | ICC (95%CI) | p-value |
|---|---|---|---|
| HU | |||
| L1 | 1.307 (-0.327, 2.942) | 0.986 (0.979, 0.990) | <0.001 |
| L2 | 0.456 (-0.620, 1.531) | 0.994 (0.990, 0.996) | <0.001 |
| L3 | 0.878 (-0.789, 2.544) | 0.983 (0.975, 0.989) | <0.001 |
| L4 | 1.425 (-0.936, 3.787) | 0.966 (0.951, 0.977) | <0.001 |
| Area | |||
| L1 | 17.403 (4.901, 29.904) | 0.755 (0.649, 0.83) | <0.001 |
| L2 | 19.143 (8.626, 29.661) | 0.870 (0.798, 0.916) | <0.001 |
| L3 | 40.362 (22.805, 57.919) | 0.738 (0.574, 0.834) | <0.001 |
| L4 | 55.140 (36.108, 74.171) | 0.714 (0.486, 0.831) | <0.001 |
Table 3.
CT attenuation values of L1-L4 vertebrae for screening individuals at risk of osteoporosis.
Table 3.
CT attenuation values of L1-L4 vertebrae for screening individuals at risk of osteoporosis.
| Level | HU | Sensitivity (95% CI) |
Specificity (95% CI) |
Accuracy (95% CI) |
LR+ (95% CI) |
LR- (95% CI) |
PPV (95% CI) |
NPV (95% CI) |
|---|---|---|---|---|---|---|---|---|
|
L1 |
≤ 94 | 48.7 (31.9-65.6) |
90.6 (80.7-96.5) |
75.2 (65.7-83.3) |
5.2 (2.3-11.9) |
0.6 (0.4-0. 8) |
75 (56.7-87.3) |
75.3 (68.8-80.8) |
| ≤ 128 | 86.1 (70.5-95.3) |
62.5 (49.5-74.3) |
71.0 (61.1-79.6) |
2.3 (1.6-3.2) |
0.2 (0.1-0.5) |
56.4 (47.8-64.5) |
88.9 (77.6-94.9) |
|
| ≤ 142 | 91.9 (78.1-98.3) |
48.4 (35.8-61.3) |
64.41 (54.2-73.6) |
1.8 (1.4-2.3) |
0.2 (0.1-0.5) |
50.8 (44.4-57.1) |
91.2 (77.2-96.9) |
|
|
≤ 160 |
97.3 (85.8-99.9) |
31.3 (20.2-44.1) |
55.5 (45.2-65.3) |
1.4 (1.2-1.7) |
0.1 (0.01-0.6) |
45 (40.1-49.3) |
95.2 (73.7-99.3) |
|
| L2 | ≤ 138 | 91.7 (77.5-98.3) |
38.3 (26.7-50.8) |
56.7 (46.7-66.4) |
1.5 (1.2-1.8) |
0.2 (0.07-0.7) |
44.0 (38.9-49.3) |
89.7 (73.8-96.4) |
| L3 | ≤ 128 | 91.2 (76.3-98.1) |
43.9 (31.7-56.7) |
60.0 (49.7-69.7) |
1.6 (1.3-2.1) |
0.2 (0.07-0.6) |
45.6 (39.8-51.5) |
90.6 (76.0-96.7) |
| L4 | ≤ 133 | 92.1 (78.6-98.3) |
40.3 (28.5-53.0) |
59.1 (49.0-68.6) |
1.5 (1.2-1.9) |
0.2 (0.06-0.6) |
46.7 (41.3-52.1) |
90.0 (74.5-96.5) |
Disclaimer/Publisher’s Note: The statements, opinions and data contained in all publications are solely those of the individual author(s) and contributor(s) and not of MDPI and/or the editor(s). MDPI and/or the editor(s) disclaim responsibility for any injury to people or property resulting from any ideas, methods, instructions or products referred to in the content. |
© 2024 by the authors. Licensee MDPI, Basel, Switzerland. This article is an open access article distributed under the terms and conditions of the Creative Commons Attribution (CC BY) license (https://creativecommons.org/licenses/by/4.0/).
Copyright: This open access article is published under a Creative Commons CC BY 4.0 license, which permit the free download, distribution, and reuse, provided that the author and preprint are cited in any reuse.


