
Submitted:
18 November 2024
Posted:
20 November 2024
You are already at the latest version
Abstract
The paper addresses the fatigue resistance, fracture behavior and damage tolerance of a new type of ultrahigh-strength bar for prestressing concrete made of a low-alloy lath martensitic steel. The fracture tests showed that the bar steel has a medium-high fracture toughness of 75 MPa√m and a fatigue cracking resistance that fits the Paris-Erdogan Law as most of Eurocode 3 structural steels. The damage tolerance analysis combines two Failure Assessment Diagrams – FADs, respectively involving the damage level and the toughness, and yielding capacity influences on the failure of the bar steel. The location of the experimental failure data in the FADs indicate that the steel is endowed with a combination of strength, ductility and toughness able to prevent unexpected failures. The damage micro-mechanisms revealed from the examination of broken specimens differ from fatigue to fracture cracking, but in a manner consistent with the observed mechanical behavior and microstructure of the bar steel.
Keywords:
lath martensitic steel
; fracture toughness
; fatigue resistance
; damage tolerance
1. Introduction
The accurate geometrical configuration and reliable loading control provided by the high-strength steel bars for pre- or post-stressed concrete make them a versatile tool for applying the sustainability and resilience criteria incorporated in the modern technical codes [1,2], especially those affecting construction and rehabilitation of critical structures for public safety such as tunnels, gas storage tanks, but above all bridges, both in prestressed and cable-stayed variants [3,4,5,6,7]. However, the minimum tensile strength required for these steel bars is 1 GPa, [8,9], which severely limits the types of bars available to this end. In the case of the bars with pearlitic microstructure, such a high-tensile strength is acquired by applying adequate heat treatments to hot-rolled rods during manufacturing. Despite this, the bars exhibit moderate ductility, low toughness and limited resistance to stress corrosion cracking under constant or fluctuating carrying loads [4].
In the last two decades, new types of martensitic steel bars that meet the tensile strength requirement have been developed with the aim of improving toughness and enhancing the ductile-brittle transition temperature [10,11,12,13]. Their improved properties are a consequence of the hierarchical microstructure of the steel, which results by dividing the prior austenite grains into several structural units with different length scales, i.e. lath, sub-block, block and packet [6]. In addition, the steel may contain small angular patches of retained austenite and discrete inclusions related to microalloying [14,15]. It is generally accepted that the addition of Cr, Ni, Ti, V and Mo significantly improves the mechanical properties of lath martensite steel bars, even though there is a degree of controversy regarding the detrimental effect of their hierarchical microstructure on fatigue crack propagation [16,17]. In response to such a major concern in relation to the structural use of these bars, a considerable research effort has been dedicated to the assessment of the fatigue cracking resistance, especially in the second stage of fatigue, i.e., once the cracking process is initiated [18,19]. The results showed that the crack propagation direction may change when the crack encounters hard phase particles or boundaries of martensitic blocks with different orientations, though it can be arrested at martensitic packet boundaries [20,21,22,23,24].
The paper addresses the fatigue, fracture resistance and damage tolerance of a new type of ultrahigh-strength bars made of a lath martensitic steel, designed and manufactured for prestressing concrete structures. The steel toughness was evaluated by fracture testing two different types of fatigue-cracked samples, namely, short bar specimens (SBS) and notched cylindrical tensile specimens (NCT). The data acquired during fatigue cracking of NCTs was used for determining the fatigue cracking resistance of the bar steel in the growth stage of the fatigue process. The damage tolerance was analyzed on the basis of two failure assessment diagrams (FAD). In the first one, the failure loads of the fatigue-cracked NCTs were plotted against the cracked area in relative terms, with the bearing load capacity of the specimen and its cross section in smooth condition as respective load and area units. This first FAD includes the theoretically predicted failure loads for processes respectively controlled by the yielding capacity and toughness of the bar steel. The second FAD provides an engineering procedure which allow understanding the influences of toughness and ductility on the bar steel failure. The analysis of the failure micro-mechanisms involved in the fatigue and fracture processes, performed with a scanning electron microscope (SEM) and an energy-dispersive X-ray analyzer (EDX), complements the macroscopic evaluation of the fracture behavior of the bar steel.
2. Material and Testing Procedures
2.1. Material Characteristics
The tested ultrahigh-strength lath martensitic steel comes from 23 mm diameter bars, manufactured by hot-rolling and subsequent tempering, and being offered as a new steel product for prestressing of concrete. Table 1 gives the chemical composition determined by atomic emission spectrometry (AES) and Table 2, the mechanical characteristics obtained by tensile testing 5 mm diameter cylindrical specimens, machine-cut parallel to the bar axis.
The SEM image in Figure 1a shows that the main microstructure of the bars is lath martensite, successively grouped in randomly arranged blocks and packets formed by dividing the prior austenite grains. In addition, Figure 1a reveals some disperse globular inclusions able to influence the bar steel fracture.
2.2. Fracture Toughness and Fatigue Resistance Testing Procedures
The fracture toughness of the steel was determined on the basis of ASTM E1304 [27] procedure which involves the use of a short-bar specimen (SBS), with a geometrical configuration compatible with the dimensions of the studied bars. In order to assure the fracture test validity, conditioned by the crack growth in the small-scale yielding regime, the chevron notches of the three tested SBSs were fatigue precracked. This involved applying approximately 12000 loading cycles in the load rage of 0.5 to 3 kN, at a frequency of 8 Hz, to a set of three tested specimens (Figure 1b), of thickness B=12 mm and length W=17.4 mm. A crack mouth opening displacement (CMOD) extensometer was firstly used to control the fatigue cracking progress, and secondly the crack extension, during the fracture tests.
The fatigue behavior of the bar material was assessed by means of cyclic tensile tests made with 5 mm diameter cylindrical specimens, in accordance with the sketch given in Figure 1c. Each specimen was surface notched to a depth of 0.5 mm before being subjected to several cyclic loading steps at room temperature, at a frequency of 8 Hz. During each step, the load amplitude was maintained constant, and decreased between each two successive steps by 20%, to assure that the applied load is constantly well below the yield strength of the specimen in the corresponding cracked condition. In order to maximize the number of experimental data, after each loading step, the specimens were unloaded and the cracked areas were progressively marked by heat tinting. In addition, the crack size was determined from the specimen stiffness obtained after each fatigue step by measuring the load-CMOD curve slope during the static unloading process. The CMOD measurements were made by using a resistive extensometer, mounted on the surface of the specimen, just ahead of the notch, on 12.5 mm length. At the end of each fatigue test, the specimens were broken in tension. The failure loads together with the final crack dimensions were further used to find out the critical stress intensity factor Kc, for its further comparison with the determined fracture toughness measured from the SBS tests.
Lastly, the fracture morphologies in the fatigue crack propagation regime and in the final rupture phases of the steel were examined by SEM on the fracture surfaces of the tested specimens.
3. Fracture Toughness and Fatigue Resistance of The Bar Steel
3.1. Fracture Toughness and Critical Stress Intensity Factor
Figure 2 shows the plots of the applied tensile load vs. CMOD obtained from the fracture tests of the SBSs together with the testing sketch and the image of one of the fractured surfaces. The first graph (Figure 2a) indicates that the crack front remains stationary until the critical load is reached and the specimen suddenly collapses. In the other two cases (Figure 2b,c), the collapse is preceded by a number of pop-ins under decreasingly lower loads, so that the first of them was identified as being the fracture load Pm (Table 3).
According to ASTM E1304 [27], the yield stress sys = 988 MPa of the tested steel and the selected thickness, B = 12 mm, of the SBS specimen meet the condition to obtain a valid fracture toughness KIc, because the measured toughness values were lower than the limit sys (0.8 B)1/2 = 110 MPa m1/2. The bar steel fracture toughness KIc was obtained by particularizing Eq (1) and Eq (2) for the experimental values of the fracture load Pm and the fatigue crack depth a, the latter measured by optical microscopy on the fracture surfaces of specimens and expressed as a fraction of the length of specimen, ã = a/W [28]:
Table 3 gives the results of the three fracture tests, according to which the mean value of 75 MPam1/2 is a reliable estimate for the fracture toughness KIc of the steel. This qualifies the analyzed bar steel as a medium-high toughness steel and reduces the risk of brittle behavior if the bars are used for structural engineering applications.
Figure 3a shows representative load-CMOD data obtained from the post-fatigue tensile fracture tests of cylindrical specimens. The large plastic deformation experienced by them before fracture is entirely incompatible with the small-scale regime necessary for the stress intensity factor K to control the crack tip stress field. Despite this, K was computed by particularizing Equations (3) and (4) for the maximum tensile load F, the specimen radius R, the optically measured maximum crack depth a, (Figure 3b), and the crack width b (Figure 1c), given that the ratios ξ = a/b and z = a/(2R) appear in the applied expression of K [27,28].
The crack dimensions a and c used in Equations (3) and (4) are those of the fatigue crack fronts (Figure 3b), as optically measured on the SEM images of fractured surfaces of tested specimen.
The stress intensity factors given in Table 4 present mean and scatter values quantitatively comparable to the fracture toughness given in Table 3. The average value of the critical stress intensity factors thus computed, of 81 MPa√m, is only 8% higher than the fracture toughness found from the tested short bar specimens.
3.2. Fatigue Resistance
Figure 4a shows the elliptical crack fronts developed on FC1 and FC2 specimens under the action of the different steps of cyclic loading to which they were subjected. The heat tinting at 250 0C applied for 15 min at the end of each fatigue step allowed identification and measurement of each front on the fractured surface of all five tested specimens (FC1-FC5). The results are given in Figure 4b and illustrate the dependence of the crack depth, expressed as a fraction a/2R of the specimen diameter, on the number of fatigue cycles. The plots indicate the tendency of the crack to initiate and grow when more than 10,000 loading cycles are exceeded. In addition, the correlation between the crack depth a and the cracked area Af is shown in dimensionless terms in Figure 5a, expressed as respective fractions a/R and Af/A0 of the specimen radius R and the uncracked area A0. These results allow the mean crack growth rate da/∆N and the mean stress intensity factor range DK at the deepest point of the crack front to be computed for each fatigue step and then matched in a logarithmic plot to determine whether they obey the Paris-Erdogan Law:
given that in this equation ∆K and da/dN are respectively the applied stress intensity range at each fatigue cycle and the crack growth per fatigue cycle.
According to the stress intensity factor K given by Equations (3) and (4) for the tested crack configuration, ∆K becomes:
where R is the specimen radius and a and c, the semi-axes of the crack front for the applied load range, ∆F. Then, Equation (5) was particularized for the load range applied during each loading step and for the mean values of the elliptic crack semi-axes measured at the initial and final crack fronts of the step. The resulting pairs of values (∆K, da/dN) are plotted as blue dots in Figure 5b, and confirm that the fatigue cracking of the tested steel follows the Paris-Erdogan Law with constants: m = 3 and C = 4.45 · 10–12 MPa-3m-1/2/cycle. The values of these constants reflect a typical fatigue resistance of ferrite-pearlite structural steels, significantly higher than that of martensitic steels [29].
4. Damage Tolerance of the Bar Steel
Two Failures Assessment Diagrams (FADs) given in Figure 6a and Figure 6b are used to analyze the results of the previous fracture tests of the fatigue-cracked cylindrical specimens.
In Figure 6a, the experimental fracture data, namely the failure loads Pmax are plotted vs. the cracked areas Af using as respective units the bearing load capacity P0 and the cross section A0 of specimens, in undamaged condition. In addition, the diagram contains the theoretical failure predictions for plastic collapse PY and brittle fracture PF. The plastic collapse occur with the resistant ligament subjected to either pure tensile load (Line 1) or combined tension and bending load (Line 2), and depends on the compliance of the specimen to deflect transversely and align the ligament centroid with the load line. In both cases, the measured tensile strength of the bar steel is assumed to be the ideal yield strength that determines the plastic collapse. Consequently, Line 1 is given by:
while, according to [30], if the aspect ratio of the crack front given by the quotient a/c belongs to the interval [0, 1], with 0 defining the straight crack front and 1 the circular crack front, Line 2 can be approximated by:
Then, assuming that the stress intensity factor K in the linear elastic regime controls the brittle fracture resulting from the stress and strain concentration at the crack tip given, K can be used for design purposes, as loading action vs. fracture toughness Kc as material resistance indicator. The load PF that would cause the brittle fracture of the bar steel can be predicted from the Equation (3) and Equation (4), by particularizing the stress intensity factor K for the value of 75 MPa√m measured as fracture toughness Kc in the tests performed with pre-cracked chevron notched specimens. This prediction would generally result in an area, if plotted in the diagram shown in Figure 6a, rather than in a single curve, because two independent variables determine the crack geometry. However, given that the crack aspect ratios measured on the fracture surfaces of cylindrical specimens hardly deviate from the mean value of 1.26, a single curve, corresponding to this mean value, has been plotted as Line 3, in Figure 6a.
The positions occupied by the experimental failure data in the diagram given in Figure 6a, when compared with the Line 1, Line 2 and Line 3, indicate that no failure preceding plastic collapse and caused by toughness occurs, even though they fit around Line 3. This is due to the resistant ligament of the specimens that progressively displaces towards the load line. The transversal compliance provided by the crack produces high enough stresses to surpass the tensile-bending collapse load, theoretically predicted by Equation (8), but capable of approaching the pure tensile collapse, given by Equation (7). However, toughness controlled failure (Line 3) prevents this from being reached, so that pure tensile plastic collapse does not occur.
The failure assessment diagram adopted by Eurocode 3 for design of steel structures against brittle failure [1] has also been used to assess the damage tolerance of the bar steel resulted from the tested cylindrical specimens. This involved computing for each specimen the stress intensity factor at fracture and the plastic collapse load by means of Equations (8) and (7). Then, the experimental failure stress intensity factor and the failure load of the specimens were plotted in the diagram given in Figure 6b after being expressed as fractions of Kr and Lr of fracture toughness (Kc = 76 MPa√m) and plastic collapse load, respectively. The safe criterion of Eurocode 3 is that the design actions determine points in the diagram inside the area bounded by the ordinate with abscissa 1 and the curve given by the equation:
For structural members and components that obey this safety criterion, the points corresponding to failure actions instead of design actions must satisfy the opposite condition when brought into the diagram, that is, occupy positions outside the safety zone, otherwise the design actions would be at the same time failure actions and the safety criterion would not be met. As shown in Figure 6b, this is the case of data corresponding to the cracked cylindrical specimens when tested up to fracture. All these experimental data points are grouped in an area outside the safety zone, close to its vertex, indicating that the steel fails well beyond the limit jointly determined by fracture toughness and yielding capacity. In fact, all specimen failures occur for loads approaching the tensile bearing capacity of the resistant ligament.
5. Fracture Micro-Mechanisms of the Bar Steel
The SEM images illustrating the fracture features of FC2 specimen are provided in Figure 7. The red dashed line indicates the longitudinal cut (Figure 7a) that allowed the analysis of fatigue cracking and final fracture morphologies. As can be seen in Figure 7b, at macroscopic level, the almost straight fatigue crack path is followed by a slightly inclined zigzag fracture. These crack paths are respectively influenced by the microstructure of fine lath martensite obtained by microalloying a medium carbon steel due to inhibited growth of prior austenite grains, and by the respective types and sizes of inclusions, thus generated.
Figure 7c shows a higher magnification detail of the little tortuous, fatigue cracking path, together with the microstructure lying below. Thus, it can be observed that the deviation of the fatigue crack path from a straight line is small because the predominant propagation takes place through the boundaries of the martensitic blocks. Nevertheless, some higher angles induced by the change in the crack path direction can be also seen in Figure 7c. These occur at the boundaries of martensitic packets or in the proximity of spherical inclusions, which behave as cracking barriers. This behavior is consistent with the SEM image of the fatigue surface shown in Figure 7e, which illustrates a complex topography consisting of quasi-cleavage facets, secondary cracks at blocks or packets boundaries, and small dimples around inclusions. The images in Figure 8a,b capture closely a small spherical inclusion of Al2O3, of less than 1.5 mm diameter, found on the fatigue path. The little developed dimple around it indicates a relatively weak contribution to the fatigue generated damage into the bar steel matrix.
Figure 7d provides detail of the resistant ligament of FC2 specimen fractured in-tension after interrupting the fatigue testing. The zigzag fracture path shown is due to both rupture and decohesion of martensite packets. The fracture surface given in Figure 7f add new insights related to the morphology, of ductile appearance, with fine dimples on dis-bonded or ruptured packets of martensite and larger voids generated around inclusions of spherical or prismatic shapes (Figure 8c,e). According to the corresponding EDX maps shown in Figure 8d,f, these are sulfide (MnS) and nitride (TiN) inclusions with sizes comparable to those of the aluminum oxide (Al2O3) detected on the fatigue crack path. Therefore, despite the weak contribution of these inclusions to fatigue damage, they are determinant in case of tensile fracture of the bar steel.
6. Conclusions
The experimental results of this research show that the studied ultrahigh-strength lath martensite bars produced for structural purposes are endowed with a moderately high toughness of approximately 75 MPa√m, obey the Paris-Erdogan Law with the exponent m=3, and, as most structural steels combine in the due proportion high enough toughness and ductility able to avoid brittle, premature failure even in case of significant stress concentrators.
The damage tolerance analysis carried out from tensile testing of pre-cracked cylindrical specimens shows that the combination of ductility and toughness of the bar steel prevents premature tensile failures even in presence of severe damage. The analysis was based on the joint use of two failure assessment diagrams, which allow the separation of toughness and ductility effects on the bearing capacity of the tested cracked configurations.
The damage micro-mechanisms of fatigue and tensile fracture revealed from the examination of broken specimens are consistent with the mechanical behavior and the microstructure of the bar steel.
Author Contributions
Conceptualization, M.I. and A.V.; methodology, P.S. and E.S; validation, M.I. and P.S.; formal analysis, P.S.; investigation, P.S., M.I., A.V. and E.S.; resources, M.I. and A.V.; writing—original draft preparation, M.I. and P.S.; writing—review and editing, M.I. and A.V. All authors have read and agreed to the published version of the manuscript.
Funding
The authors are gratefully acknowledging the RTI-2018-097221-B-I00 grant funded by MCIN/AEI/10.13039/ 501100011033 and the “ERDF A Way of Making Europe”, as well as PRE-2019-088263 grant funded by MCIN/AEI/ 10.13039/501100011033 and the “ESF Investing in Your Future”.
Data Availability Statement
The data presented in this study are available at the request of the corresponding author for privacy and ethical reasons.
Acknowledgments
In this section, you can acknowledge any support given which is not covered by the author contribution or funding sections. This may include administrative and technical support, or donations in kind (e.g., materials used for experiments).
Conflicts of Interest
The authors declare no conflicts of interest. The funders had no role in the design of the study; in the collection, analyses, or interpretation of data; in the writing of the manuscript; or in the decision to publish the results.
References
- EN 1993-1-10 (2005) Eurocode 3: Design of steel structures - Part 1-10: Material toughness and through-thickness properties.
- EN 1993-1-9 (2005) Eurocode 3: Design of steel structures - Part 1-9: Fatigue.
- ACI Committee 222, 222.2R-14 Report on Corrosion of Prestressing Steels, 2014.
- Abela, M.C.; Landis, E. Estimating the remaining service life of in-situ grouted post-tension anchors using flaw tolerance limit plots. Eng Fail Anal 2024, 162, 108349. [Google Scholar] [CrossRef]
- Valiente, A.; Pérez-Guerrero, M.; Iordachescu, M. New testing method for assessing the cracking sensibility of stressed tendon rods in aggressive environments. Eng. Fail. Anal 2016, 68, 244–253. [Google Scholar] [CrossRef]
- Okada, K.; Shibata, A.; Takeda, Y.; Tsuji, N. Crystallographic analysis of fatigue fracture initiation in 8Ni-0.1C martensitic steel. Int J Fatigue 2021, 143, 105921. [Google Scholar] [CrossRef]
- ASTM A722-15, Standard Specification for High-Strength Bars for Prestressing Concrete, 2015.
- prEN 10138-4, Prestressing steels – Part 4: Bars, CEN, 2005.
- ASTM A722-15, Standard Specification for High-Strength Bars for Prestressing Concrete, 2015.
- Morris, J.W. On the Ductile-Brittle Transition in Lath Martensitic Steel. ISIJ International 2011, 51(10), 1569–1575. [Google Scholar] [CrossRef]
- Morris, J.W.; Kinney, C.; Pytlewski, K.; Adachi, Y. Microstructure and cleavage in lath martensitic steels. Sci Technol Adv Mater 2013, 14, 014208. [Google Scholar] [CrossRef]
- Wang, C.; Wang, M.; Shi, J.; Hui, W.; Dong, H. Effect of microstructural refinement on the toughness of low carbon martensitic steel. Scripta Mater 2008, 58(6), 492–495. [Google Scholar] [CrossRef]
- Liang, Y.; Long, S.; Xu, P.; Lu, Y.; Jiang, Y.; Liang, Y.; Yang, M. The important role of martensite laths to fracture toughness for the ductile fracture controlled by the strain in EA4T axle steel. Mater Sci Eng A 2017, 695, 154–164. [Google Scholar] [CrossRef]
- Li, Y.J.; Choi, P.; Goto, S.; Borchers, C.; Raabe, D.; Kirchheim, R. Evolution of strength and microstructure during annealing of heavily cold-drawn 6.3 GP hypereutectoide pearlitic steel wire. Acta Mater 2012, 9(9), 4005–4016. [Google Scholar]
- Deng, Y.; Liang, Y.; Zhao, F.; Xu, F.; Yang, M.; Long, S. Influence of Microstructure on Tensile Properties and Fatigue Crack Propagation Behavior for Lath Martensitic Steel. Crystals 2023, 13(9), 1392. [Google Scholar] [CrossRef]
- Li, S.; Zhu, G.; Kang, Y. Effect of substructure on mechanical properties and fracture behavior of lath martensite in 0.1C–1.1Si–1.7Mn steel. J Alloys Compd 2016, 675, 104–115. [Google Scholar] [CrossRef]
- Shin, S.E.; Nambu, S.; Kim, H.; Inoue, J.; Koseki, T.; Lee, S.J. Evaluation of factors influencing the lath martensitic deformation behavior of multi-layered steels. Mater Sci Eng A 2020, 785, 139353. [Google Scholar] [CrossRef]
- Zhang, Y.; Wang, S.; Xu, G.T.; Wang, G.; Zhao, M.H. Effect of Microstructure on Fatigue-Crack Propagation of 18CrNiMo7-6 High-Strength Steel. Int J Fatigue 2022, 163, 107027. [Google Scholar] [CrossRef]
- Iordachescu, M.; Valiente, A.; Pérez-Guerrero, M.; Elices, M. Environment-assisted failure of structural tendons for construction and building applications. Constr. Build. Mat. 2018, 159, 499–507. [Google Scholar] [CrossRef]
- Bui, T.P.; Miyashita, Y.; Mutoh, Y.; Morikage, Y.; Tagawa, T.; Handa, T.; Otsuka, Y. Fatigue crack deflection and branching behavior of low carbon steel under mechanically large grain condition. Int J Fatigue 2021, 148, 106217. [Google Scholar] [CrossRef]
- Zhou, T.; Yu, H.; Wang, S. Effect of microstructural types on toughness and microstructural optimization of ultra-heavy steel plate: EBSD analysis and microscopic fracture mechanism. Mater Sci Eng A 2016, 658, 150–158. [Google Scholar] [CrossRef]
- Zhang, Y.; Wang, S.; Xu, G.T.; Wang, G.; Zhao, M.H. Effect of Microstructure on Fatigue-Crack Propagation of 18CrNiMo7-6 High-Strength Steel. Int J Fatigue 2022, 163, 107027. [Google Scholar] [CrossRef]
- Liu, H.-Q.; Wang, C.-M.; Zhang, H.; Huang, Z.-Y.; Wang, Q.-Y.; Chen, Q. Effects of metallic microstructures on fatigue fracture of Q345 steel. J Iron Steel Res Int 2020, 27(6), 702–709. [Google Scholar] [CrossRef]
- Carter, S.T.; Rotella, J.; Agyei, R.F.; Xiao, X.; Sangid, M.D. Measuring fatigue crack deflections via cracking of constituent particles in AA7050 via in situ x-ray synchrotron-based micro-tomography. Int J Fatigue 2018, 116, 490–504. [Google Scholar] [CrossRef]
- ASTM E1304. Standard test method for plane-strain (Chevron-Notch) fracture toughness of metallic materials; 2001.
- Bubsey, R.; Munz, D.; Pierce, W.; Shannon, J. Compliance calibration of the short rod chevron-notch specimen for fracture toughness testing of brittle materials. Int J Fract 1982, 18(2), 125–133. [Google Scholar] [CrossRef]
- Shih, Y.-S.; Chen, J.-J. The stress intensity factor study of an elliptical cracked shaft. Nucl Eng Des 2002, 214, 137–145. [Google Scholar] [CrossRef]
- Toribio, J.; Álvarez, N.; González, B.; Matos, J.C. A critical review of stress intensity factor solutions for surface cracks in round bars subjected to tension loading. Eng Fail Anal 2009, 16, 794–809. [Google Scholar] [CrossRef]
- Barsom, J.M.; Rolfe, S.T. Fatigue and fracture control in structures: application of fracture mechanics. 3rd ed. ASTM, 1999.
- De Abreu, M.; Iordachescu, M.; Valiente, A. Effects of hydrogen assisted stress corrosion on damage tolerance of a high-strength duplex stainless steel wire for prestressing concrete. Constr Build Mat 2014, 66, 38–44. [Google Scholar] [CrossRef]
Figure 1.
a) SEM image of the bar steel microstructure; The geometry and the test configuration of: b) Short-Bar Specimen (B =12 mm, W=17.4 mm); c) Notched cylindrical specimen; (a, c – semi-axes of the ellipse assimilated to the fatigue crack front, R – specimen radius).
Figure 1.
a) SEM image of the bar steel microstructure; The geometry and the test configuration of: b) Short-Bar Specimen (B =12 mm, W=17.4 mm); c) Notched cylindrical specimen; (a, c – semi-axes of the ellipse assimilated to the fatigue crack front, R – specimen radius).
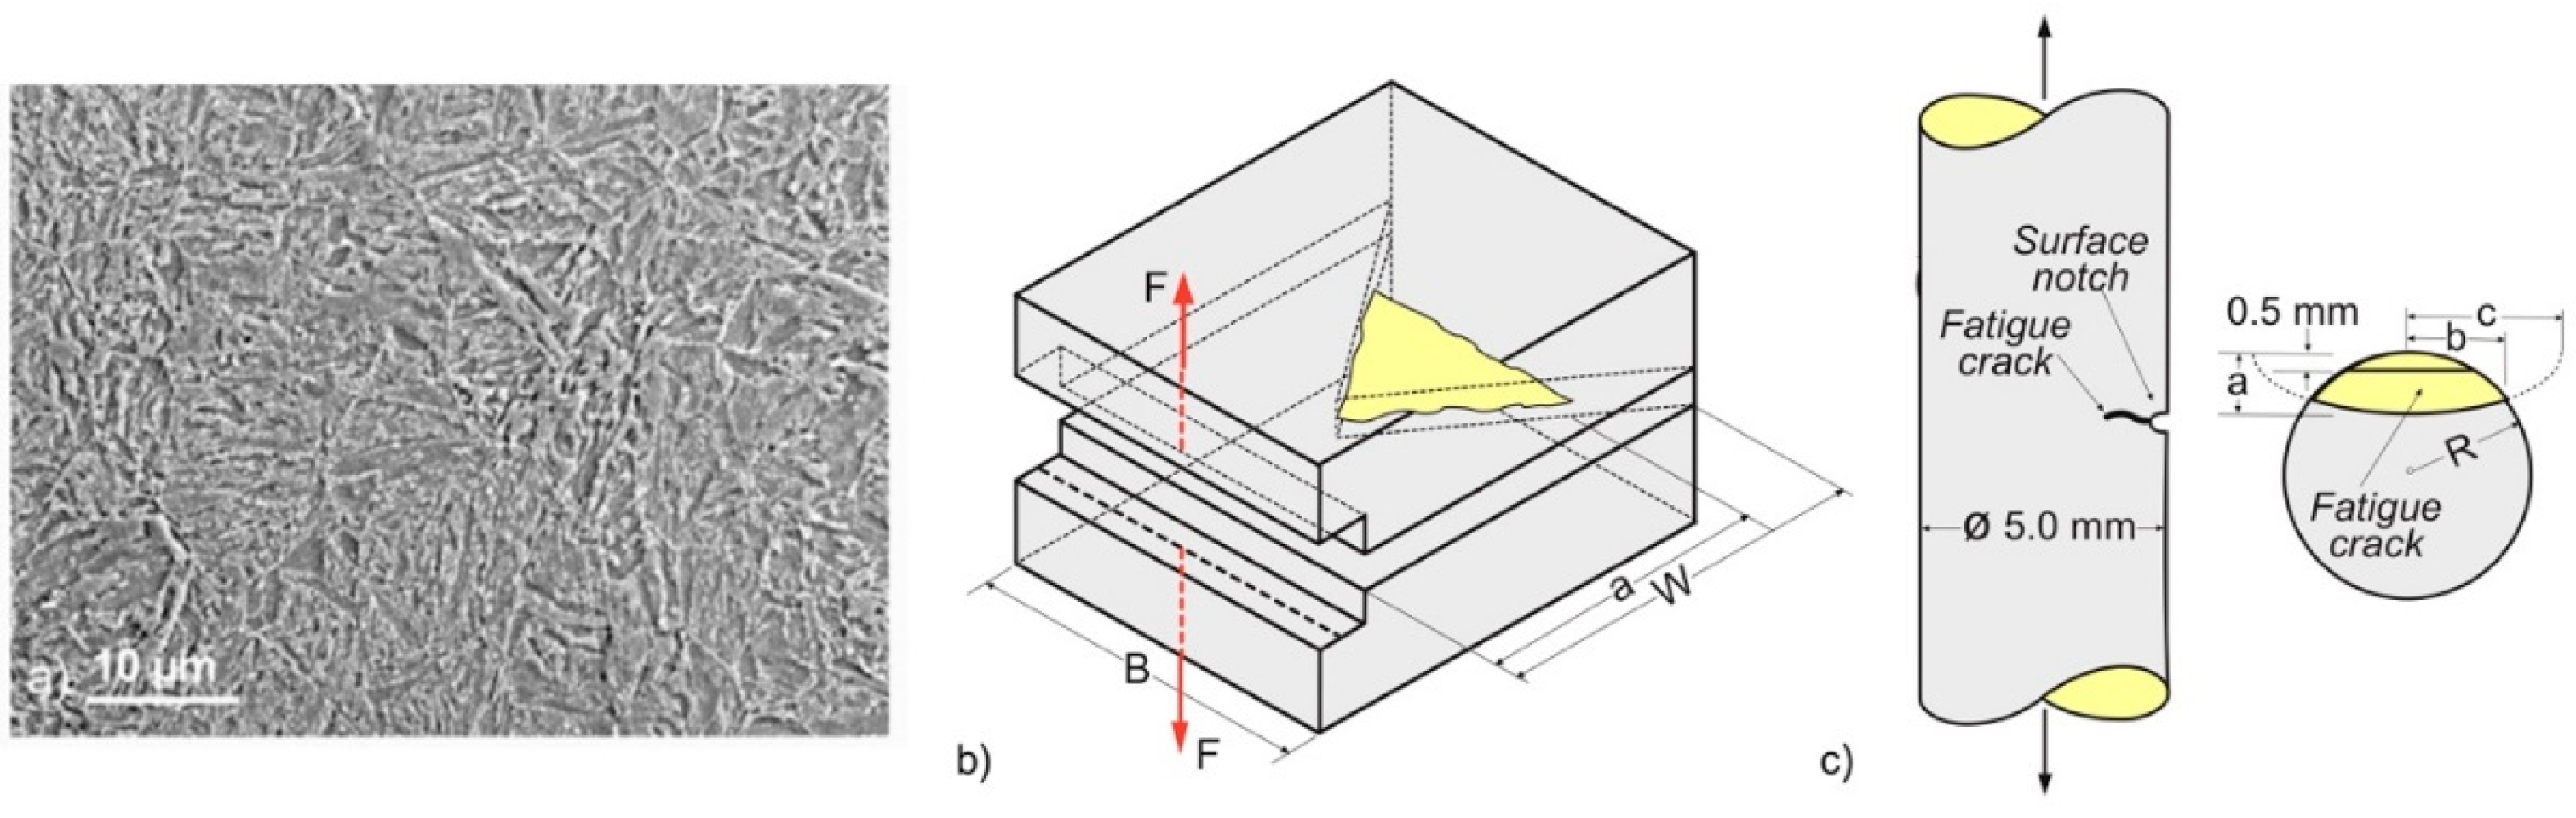
Figure 2.
Testing sketch, load-CMOD plots of specimens: a) SBS_1; b) SBS_2; c) SBS_3, and the image of one of the fracture surfaces.
Figure 2.
Testing sketch, load-CMOD plots of specimens: a) SBS_1; b) SBS_2; c) SBS_3, and the image of one of the fracture surfaces.
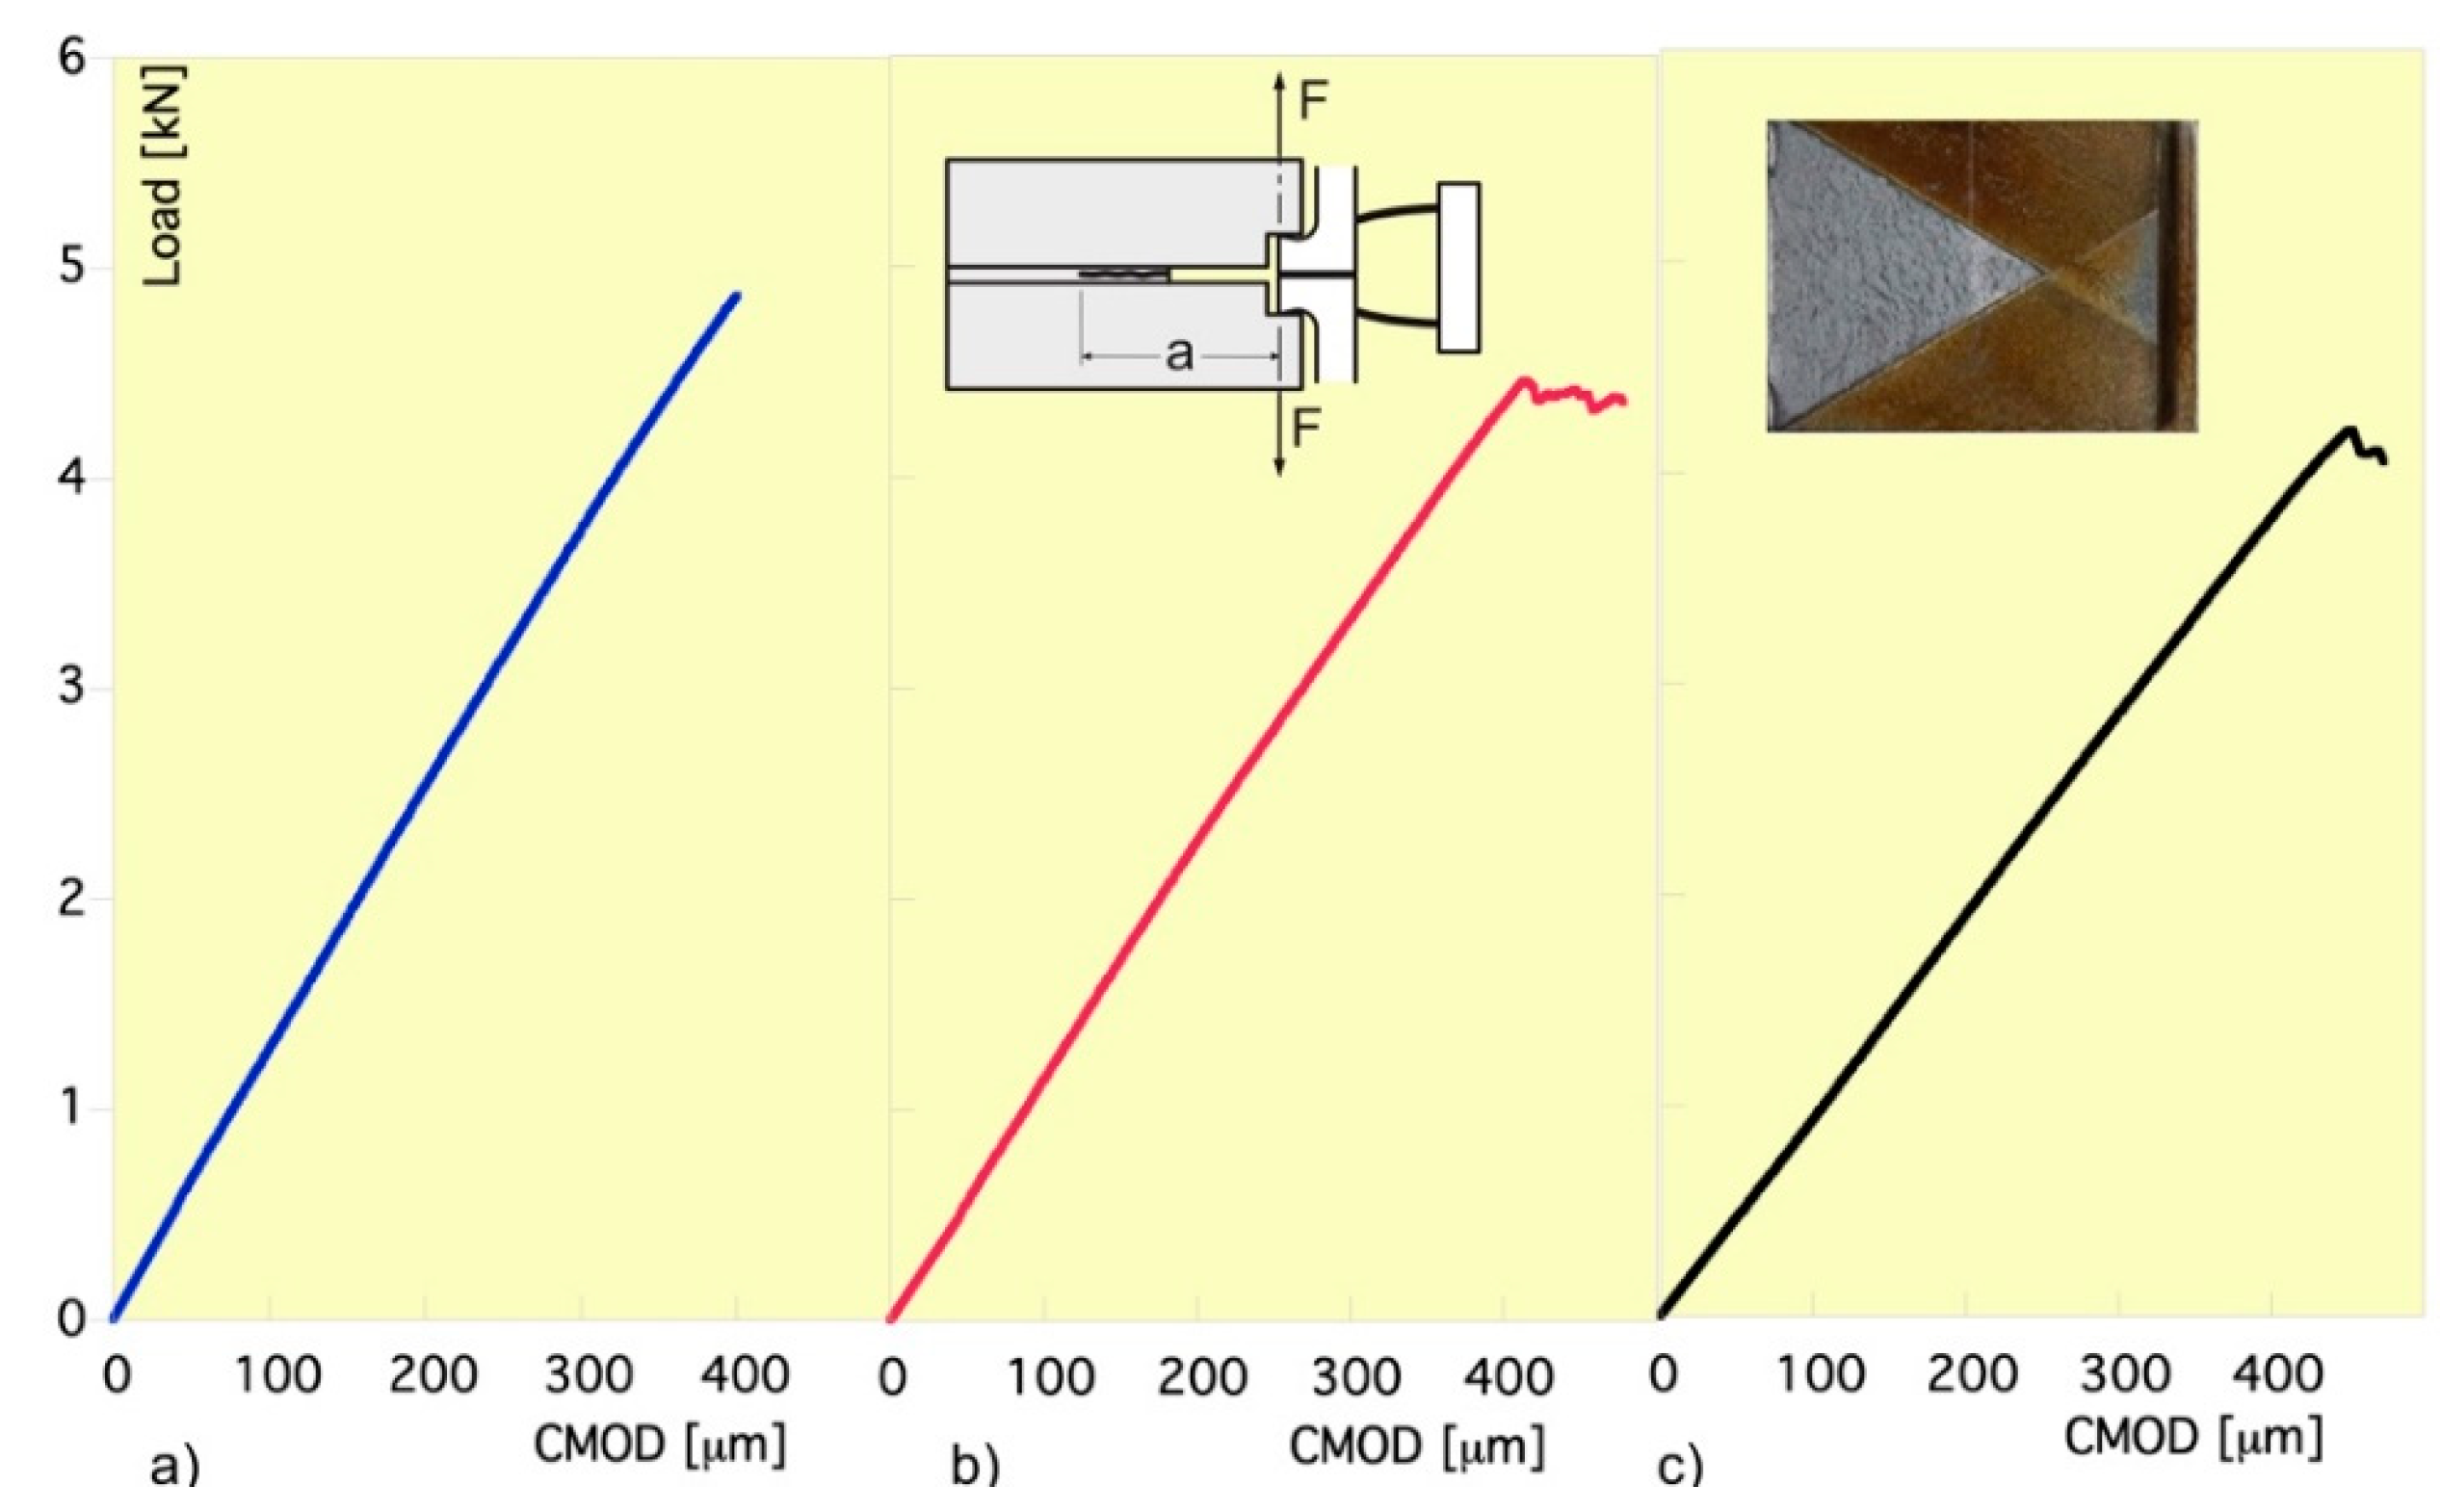
Figure 3.
Representative: a) tensile load-CMOD plots obtained from the post-fatigue tensile tests of cylindrical specimens; b) SEM images illustrating the fracture surfaces of distinct tested specimens.
Figure 3.
Representative: a) tensile load-CMOD plots obtained from the post-fatigue tensile tests of cylindrical specimens; b) SEM images illustrating the fracture surfaces of distinct tested specimens.
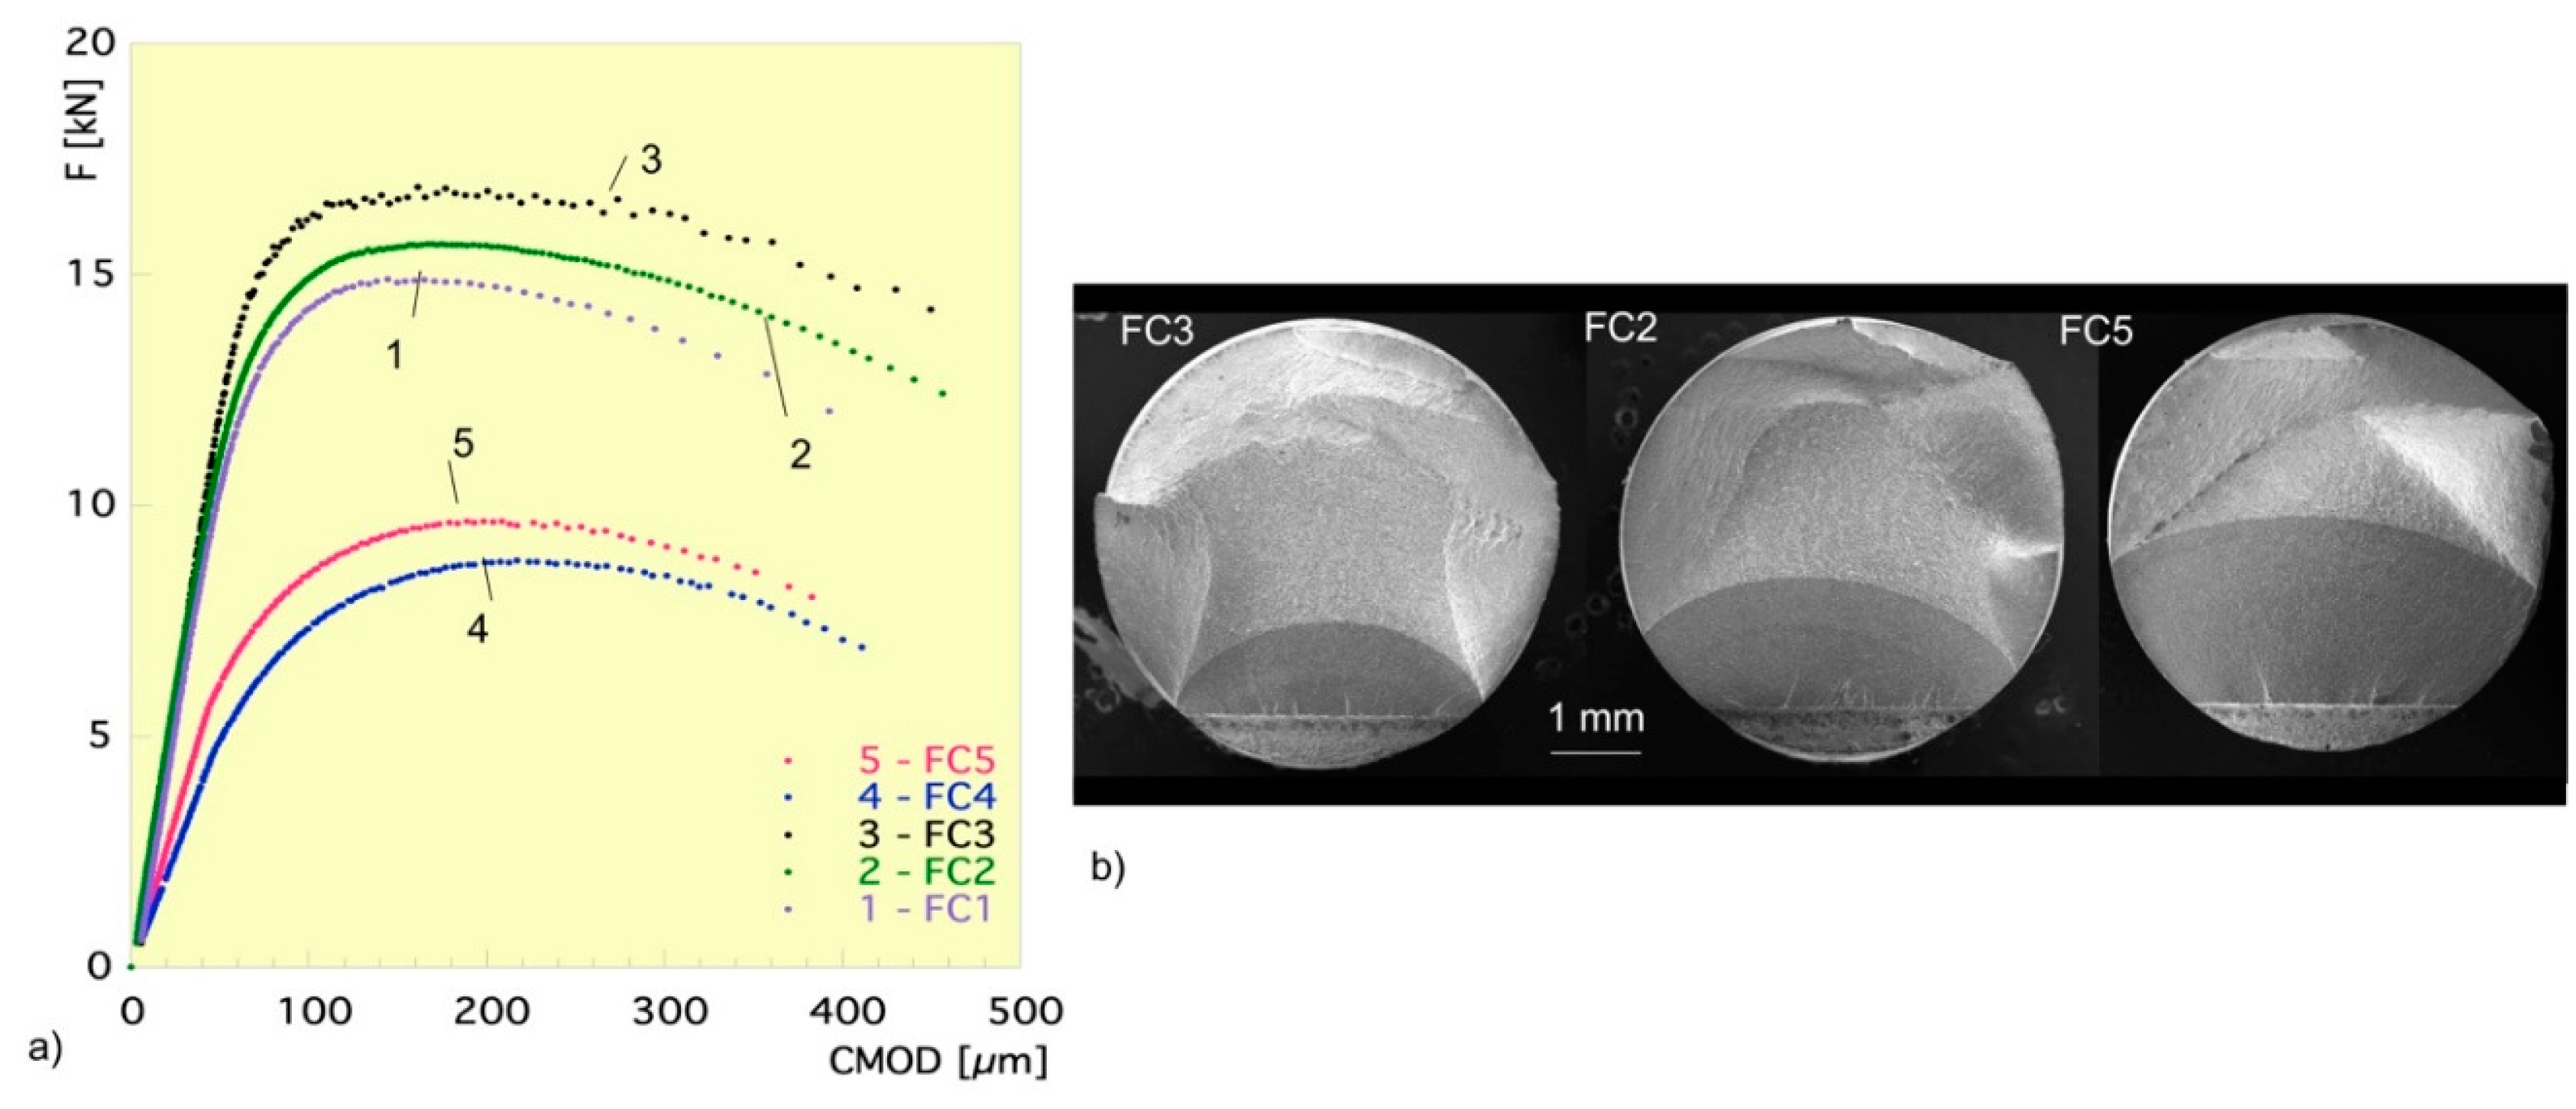
Figure 4.
a) Relative crack depth a/2R as function of specimen diameter vs. number of fatigue cycles, N; b) Fracture surfaces of specimens with marked fatigue loading steps.
Figure 4.
a) Relative crack depth a/2R as function of specimen diameter vs. number of fatigue cycles, N; b) Fracture surfaces of specimens with marked fatigue loading steps.
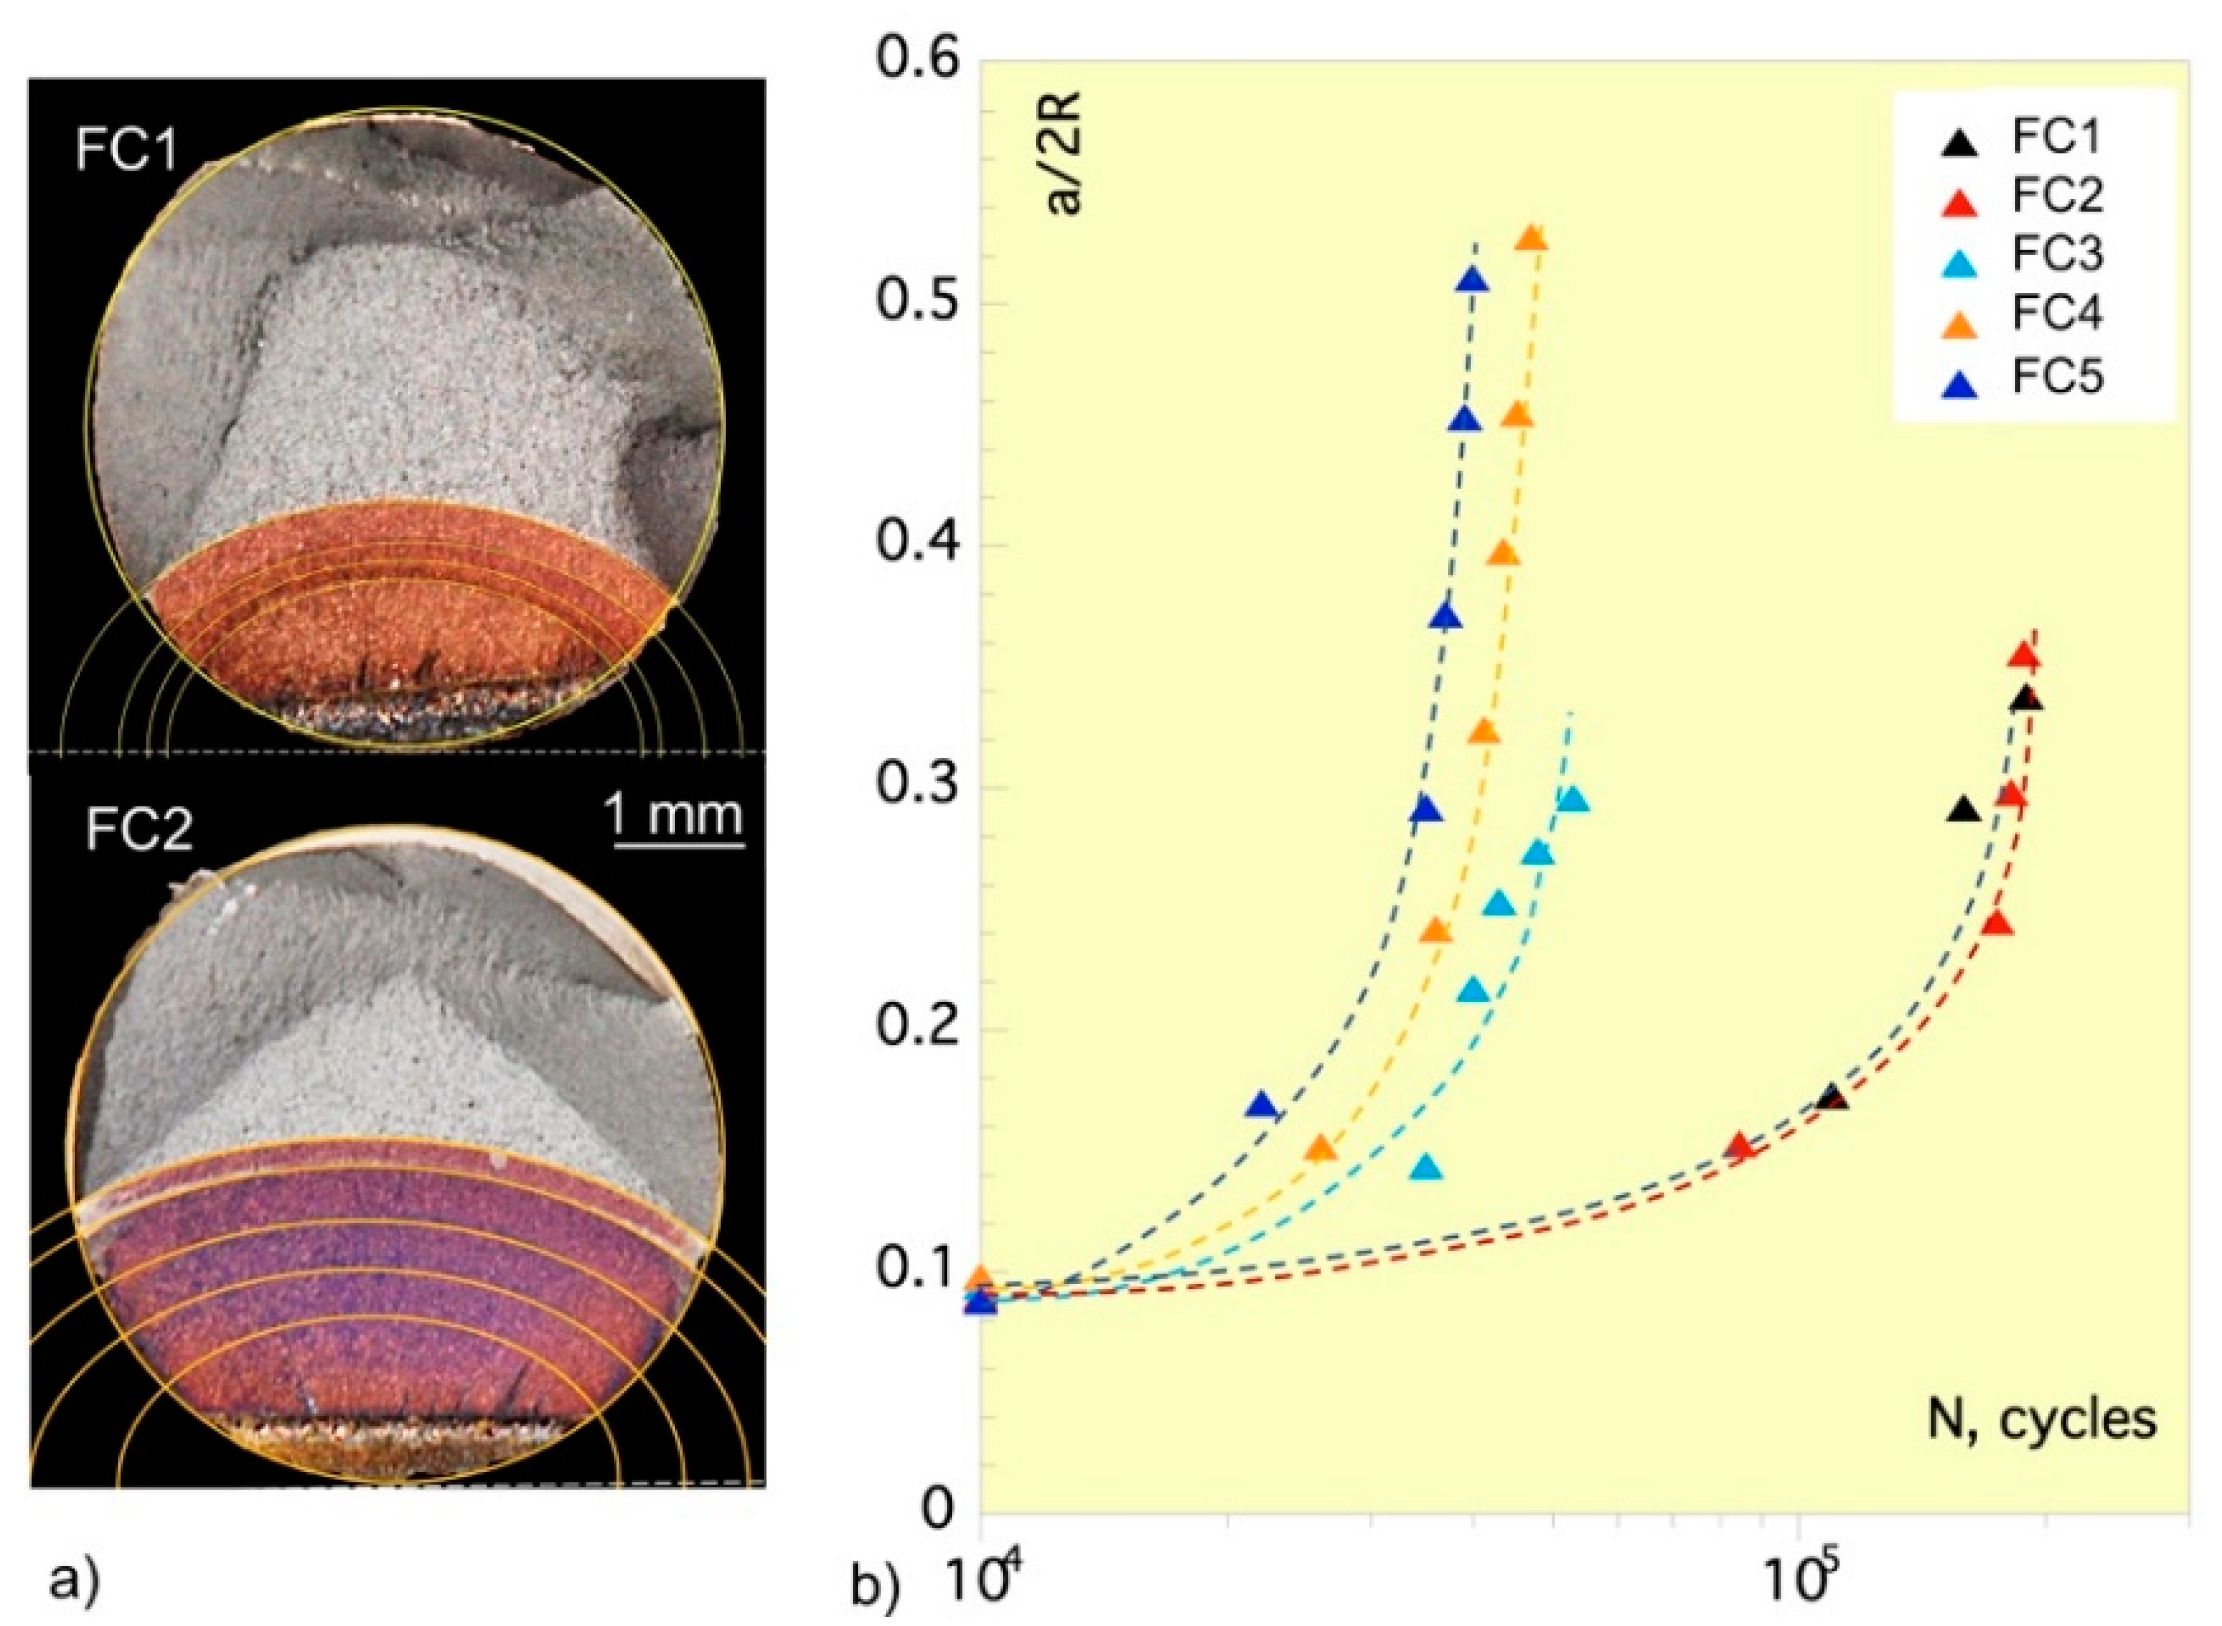
Figure 5.
a) Relative crack depth a/R as function of specimen radius vs. relative fatigue cracked area Af /A0 as function of uncracked area; b) The Paris-Erdogan law obtained from the experimental data of FC1-FC5 tests.
Figure 5.
a) Relative crack depth a/R as function of specimen radius vs. relative fatigue cracked area Af /A0 as function of uncracked area; b) The Paris-Erdogan law obtained from the experimental data of FC1-FC5 tests.
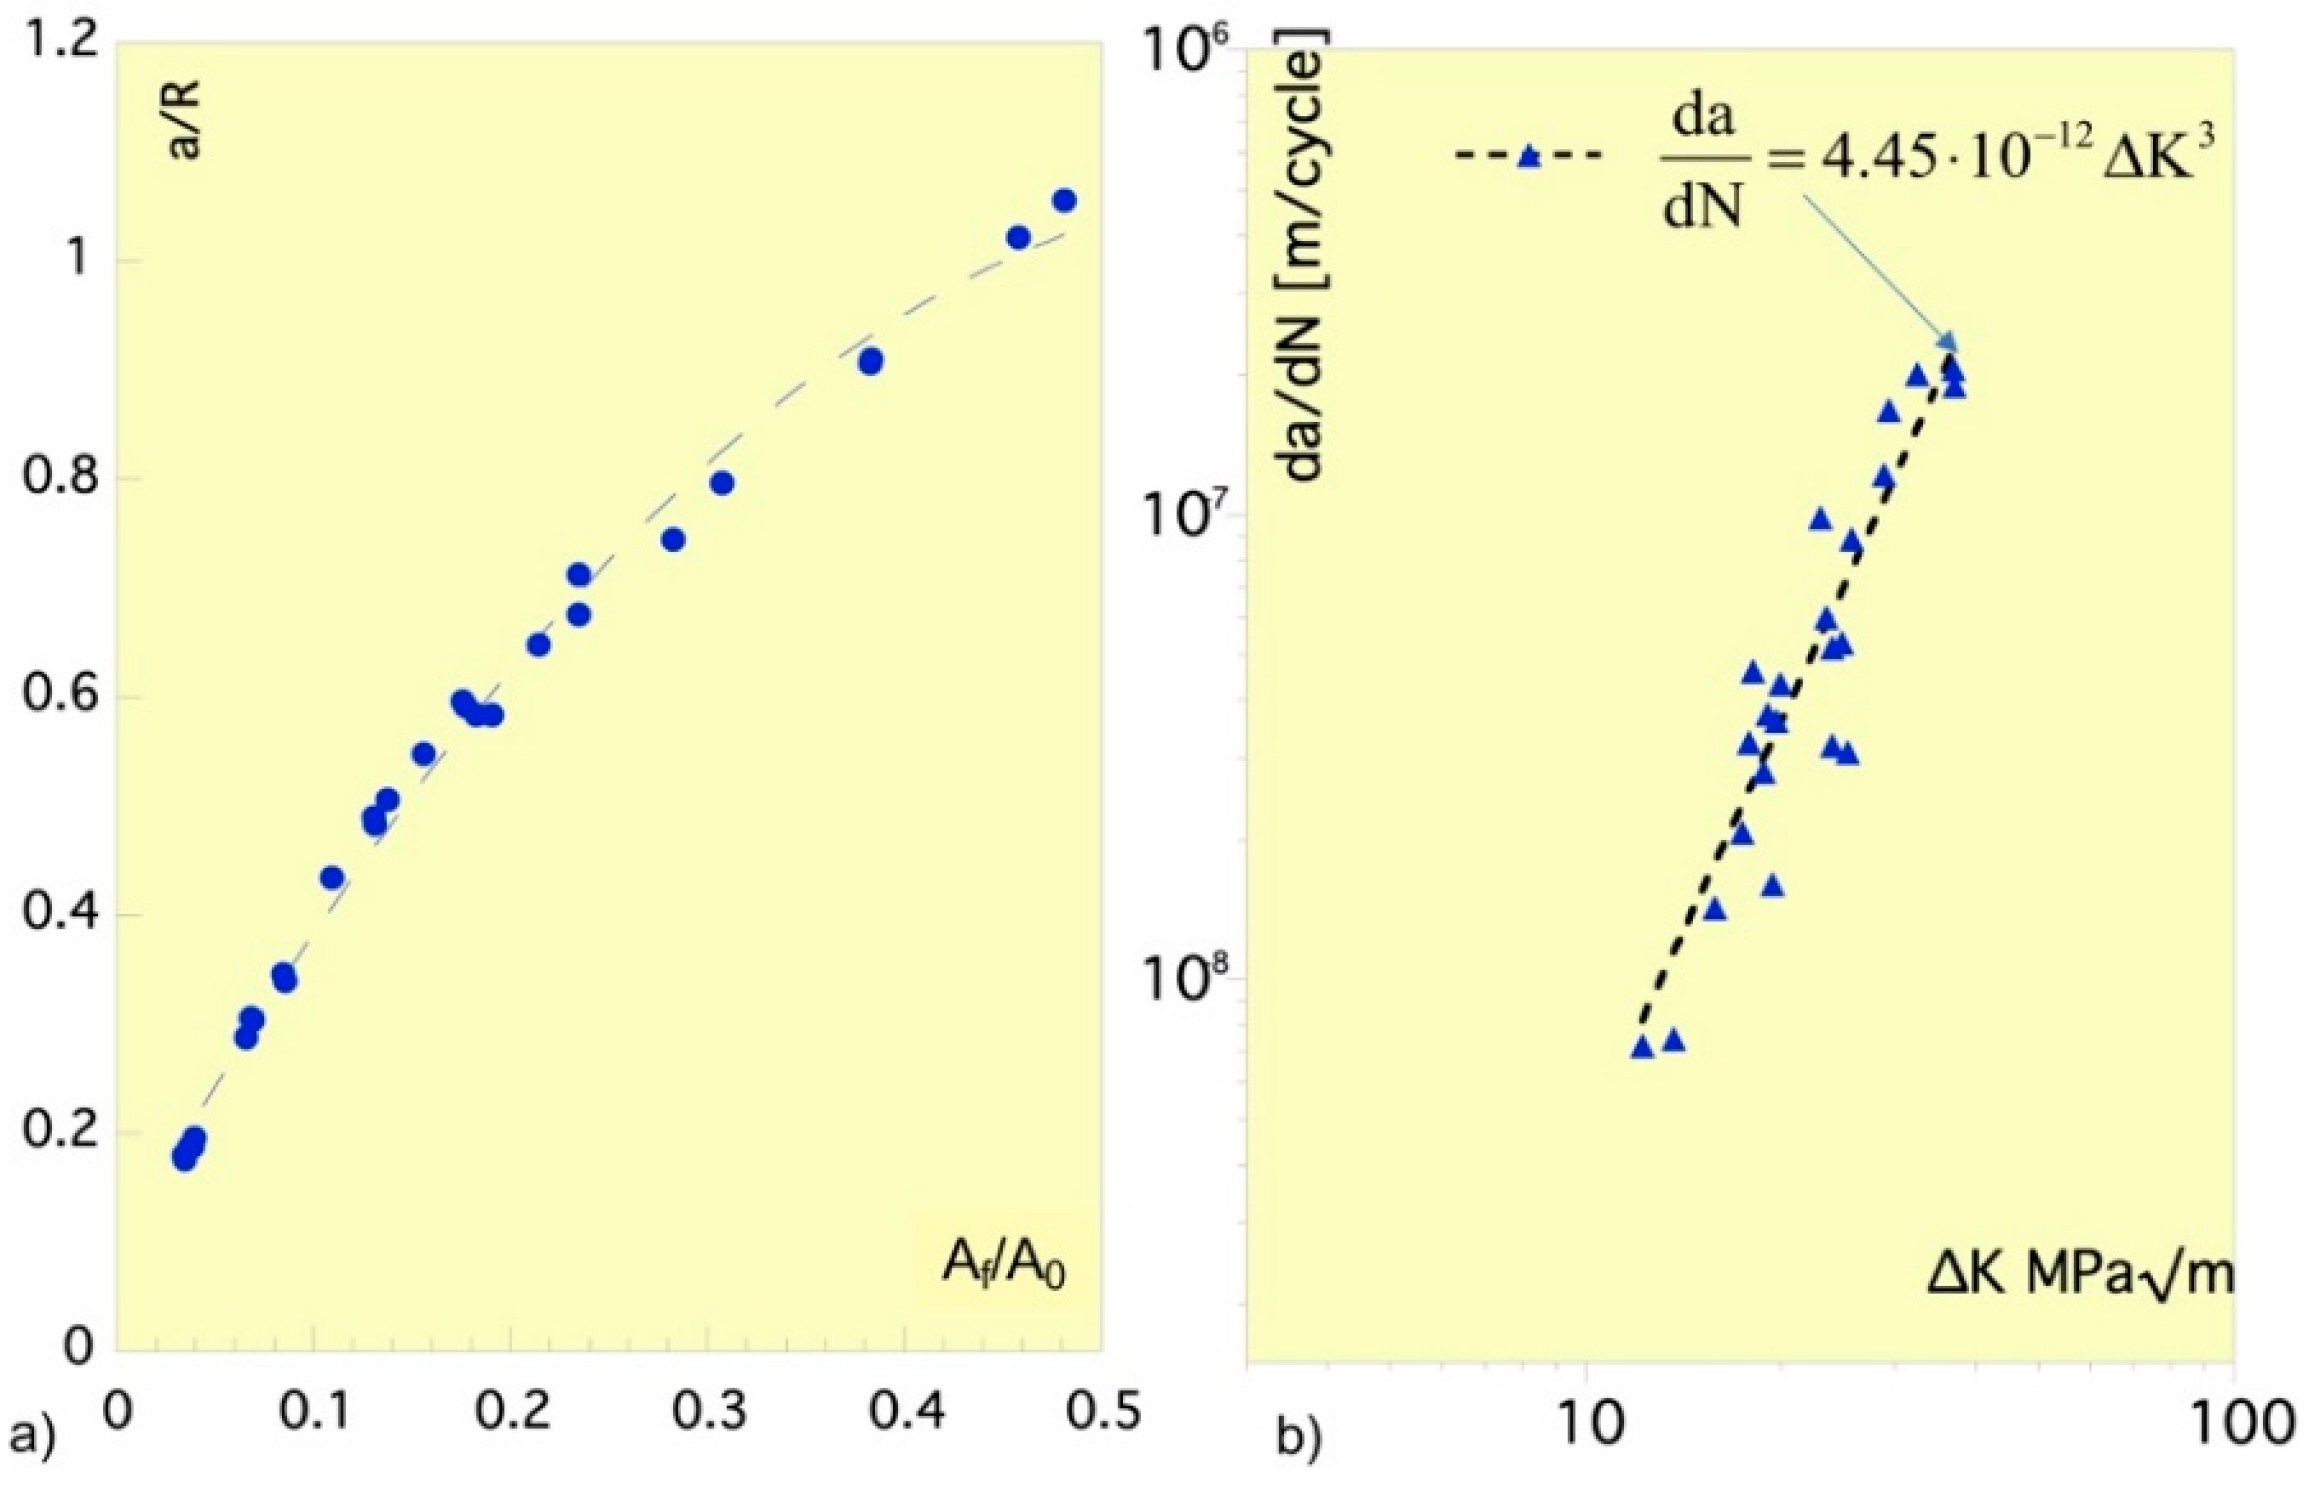
Figure 6.
Failure Assessment Diagrams, with experimental data, involving: a) damage level; b) toughness and yielding capacity effects.
Figure 6.
Failure Assessment Diagrams, with experimental data, involving: a) damage level; b) toughness and yielding capacity effects.
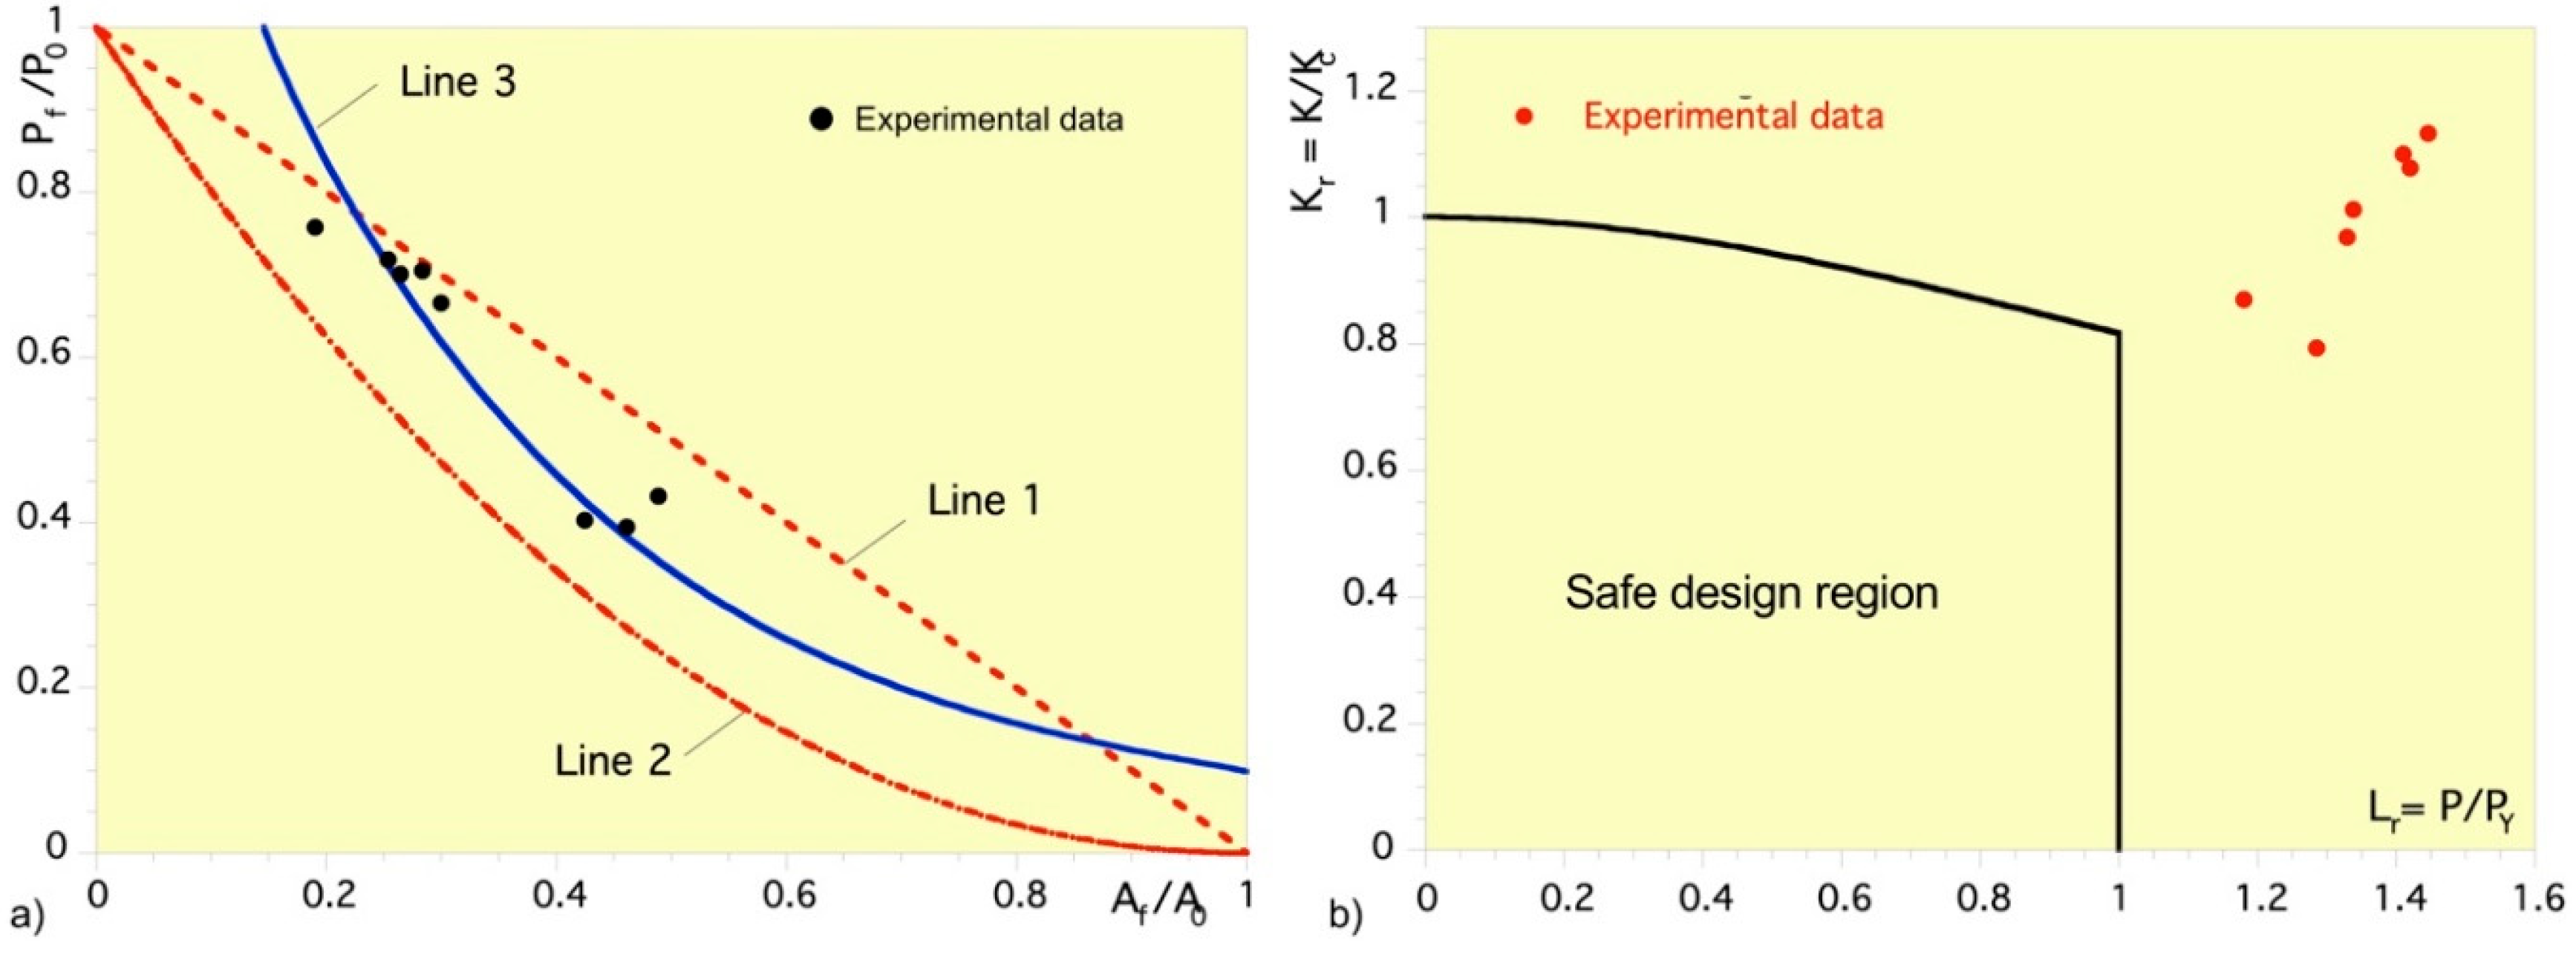
Figure 7.
SEM images illustrating the cracking features of the FC2 specimen: a) macroscopic image of the fracture surface; b) detail of the longitudinal section capturing the fatigue and fracture crack paths; higher magnification details of b) showing the cracking paths of: c) fatigue and d) fracture; surface topography of: e) fatigue and f) fracture (white arrows indicate the cracking direction).
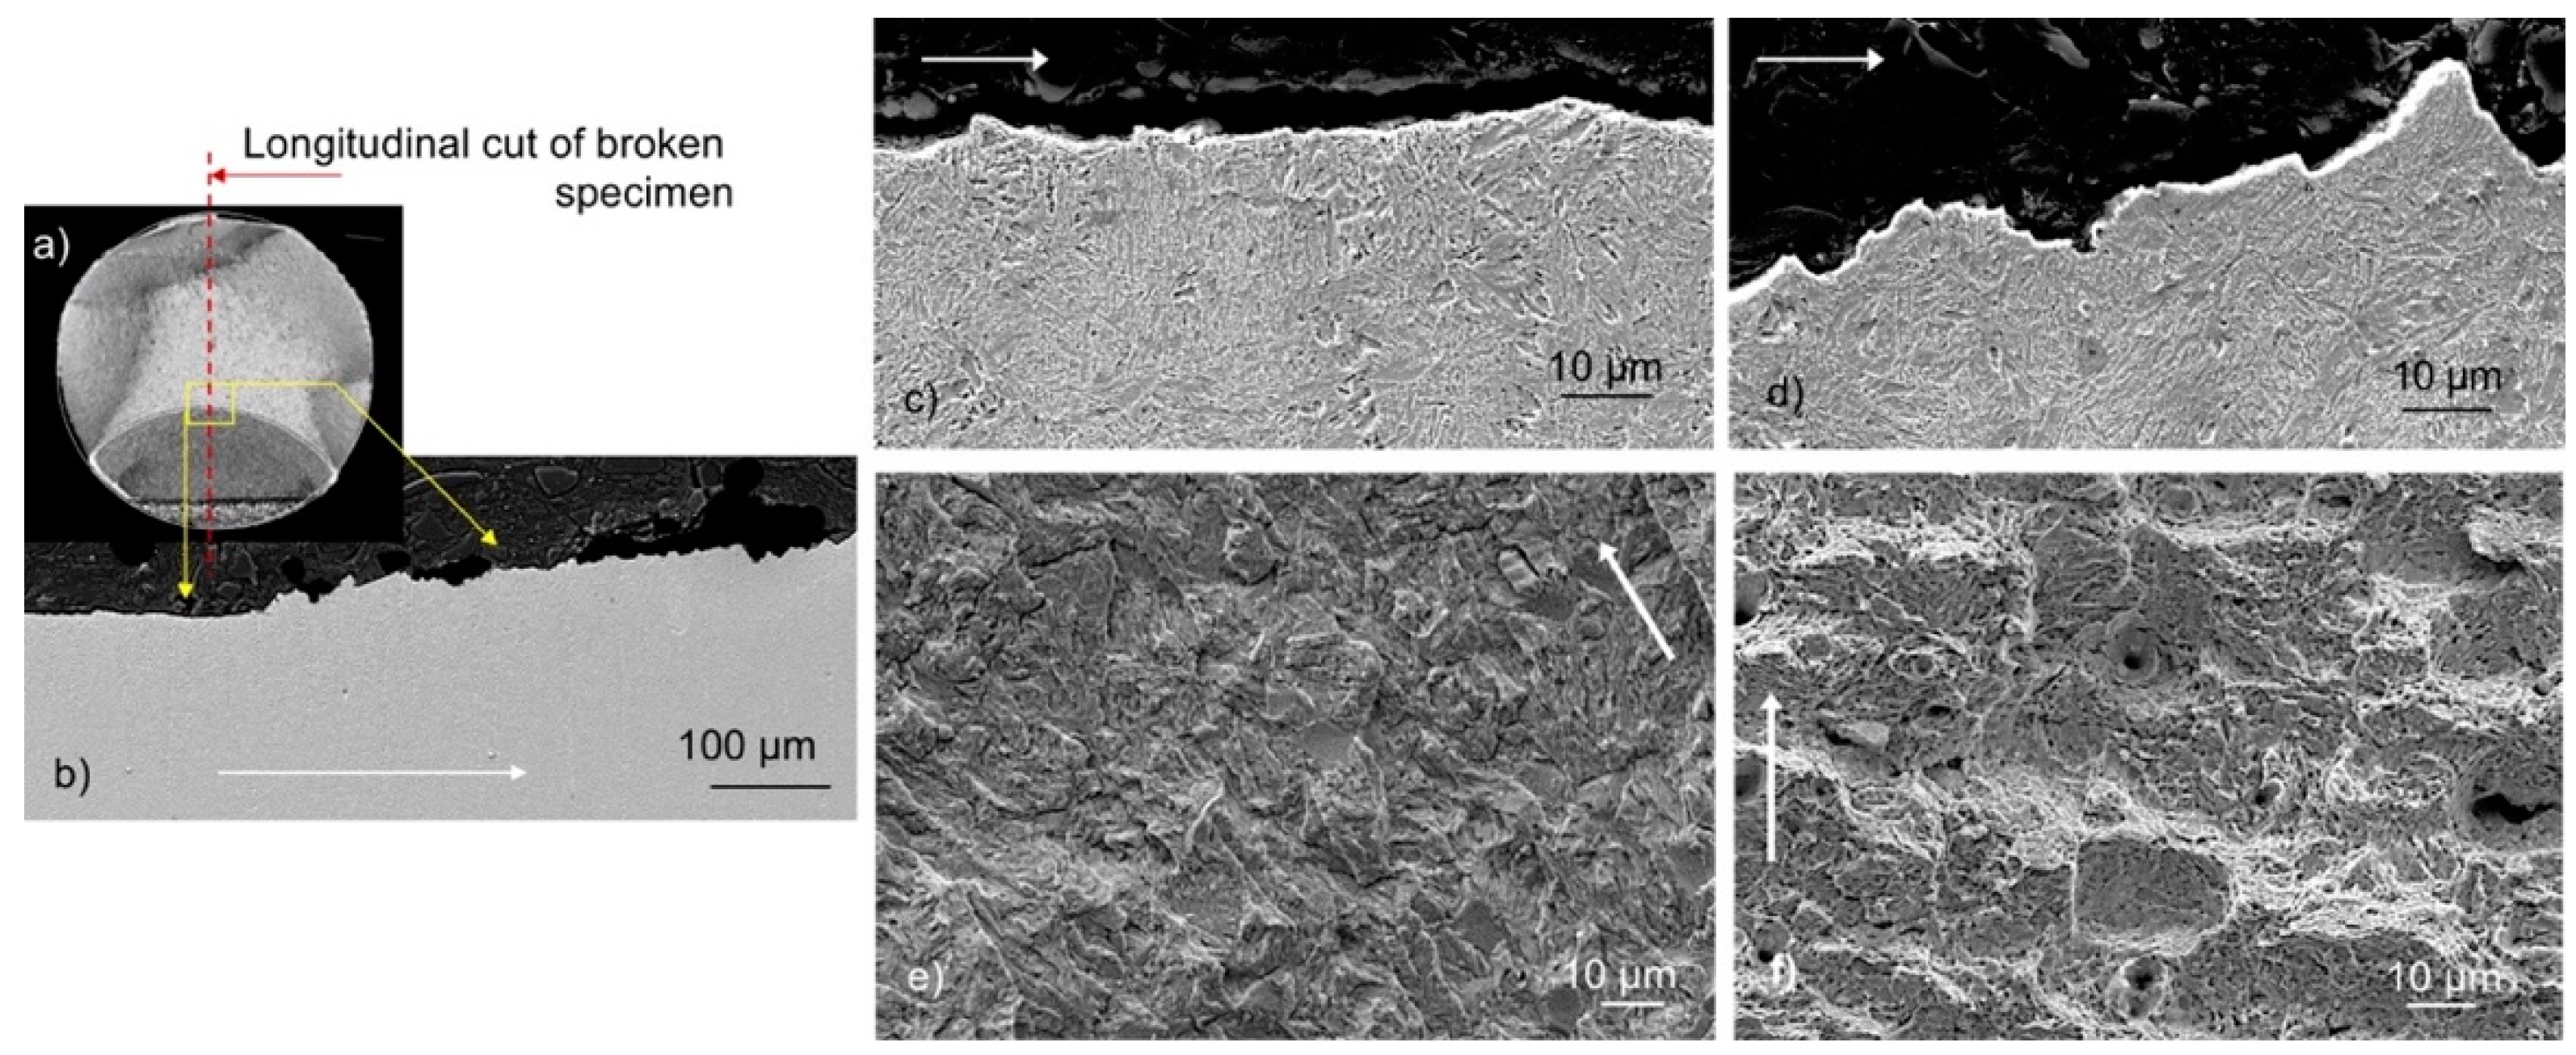
Figure 8.
SEM details and EDX maps of FC2 specimen showing the morphology of: a, b) the fatigue crack path with an Al2O3 inclusion; c, d) the fracture crack path with a MnS inclusion; e, f) the fracture crack path with a TiN inclusion.
Figure 8.
SEM details and EDX maps of FC2 specimen showing the morphology of: a, b) the fatigue crack path with an Al2O3 inclusion; c, d) the fracture crack path with a MnS inclusion; e, f) the fracture crack path with a TiN inclusion.
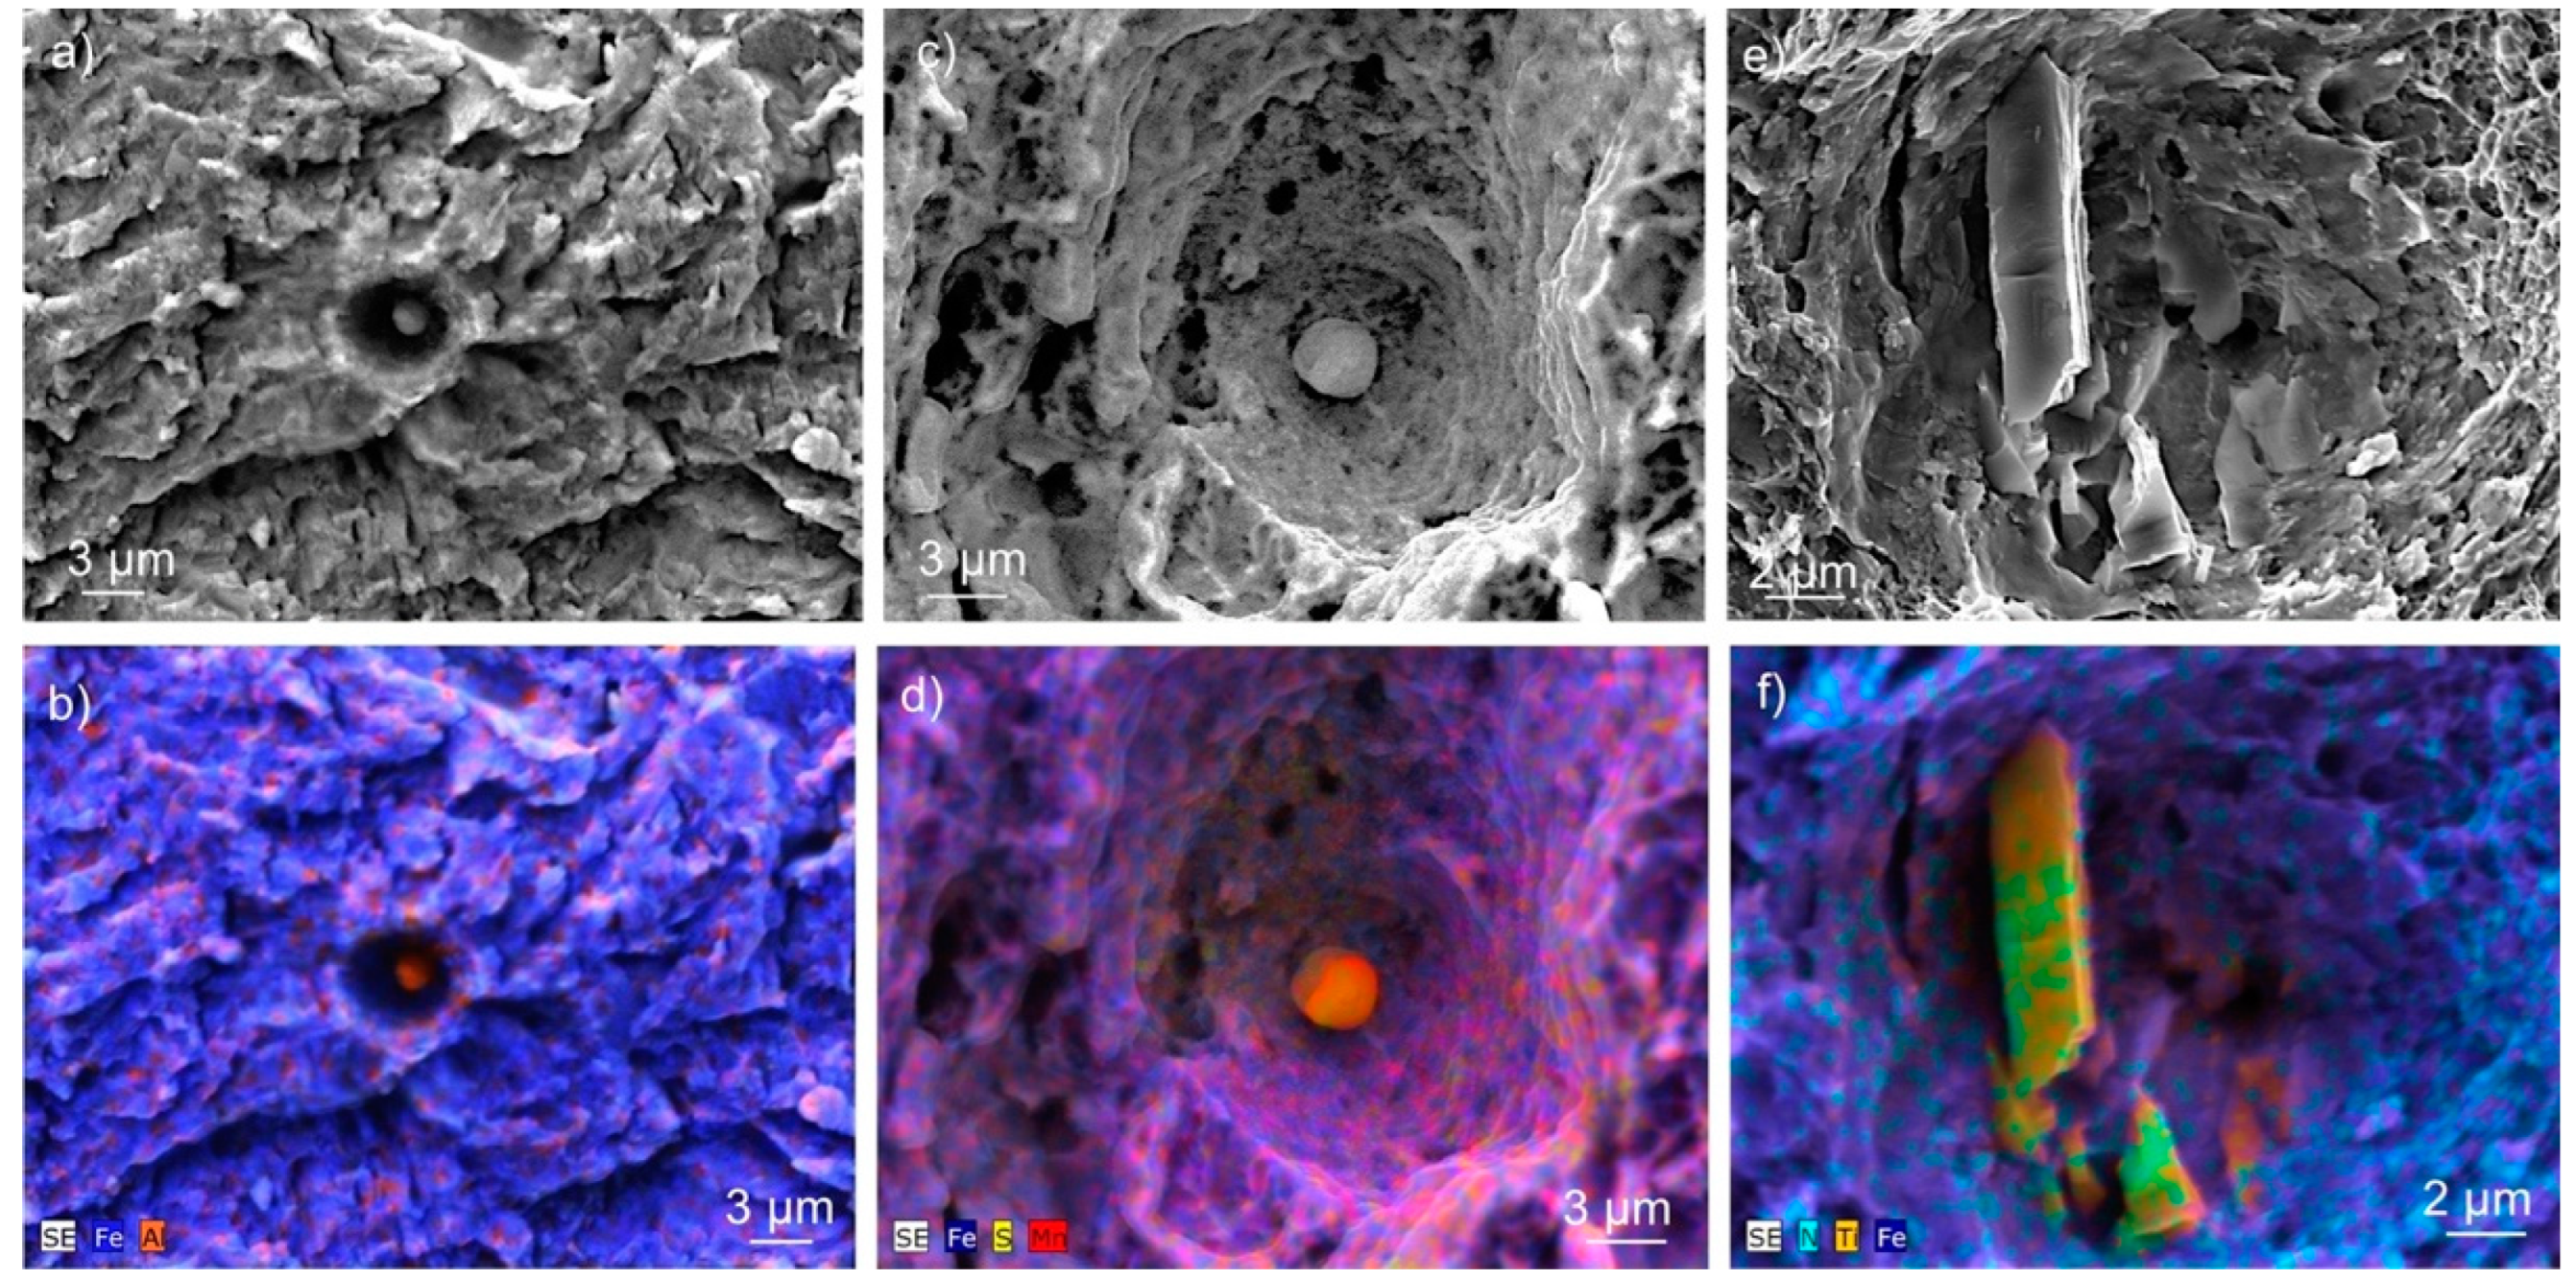

Table 1.
Chemical composition of the studied steel bars.
| C | Mn | Si | P | S | Cu | Ni | Cr | Mo | Ti | V | Fe |
| 0.45 | 0.65 | 1.77 | 0.017 | 0.004 | 0.01 | 0.06 | 0.15 | 0.02 | 0.03 | 0.003 | Bal |
Table 2.
Mechanical properties the studied steel bars.
| Elastic modulus, [GPa] | Yield strength, [MPa] | Tensile strength [MPa] | [%] of maximum uniform elongation |
| 220 | 988 | 1138 | 8 |
Table 3.
Fracture tests data and results obtained with the SBS specimens.
| Tested specimen | Crack length a [mm] |
Load, Pm [kN] | a/W | Y(a/W) | KIc [MPa m1/2] |
| SBS_1 | 9.45 | 4.87 | 0.54 | 25.38 | 78.23 |
| SBS_2 | 10.22 | 4.46 | 0.59 | 25.92 | 73.03 |
| SBS_3 | 17.4 | 4.20 | 0.64 | 27.36 | 72.59 |
Average: 75 MPa m1/2.
Table 4.
Stress intensity factors at fracture of fatigue cracked cylindrical specimens (F0 = 22.34 kN).
Table 4.
Stress intensity factors at fracture of fatigue cracked cylindrical specimens (F0 = 22.34 kN).
| Tested specimen | Crack depth a [mm] |
Max. load, F [kN] | YA | Kc [MPa m1/2] |
| FC1 | 2.08 | 14.89 | 1.400 | 83.64 |
| FC2 | 1.92 | 15.67 | 1.260 | 76.96 |
| FC3 | 1.55 | 16.93 | 1.100 | 66.3 |
| FC4 | 2.86 | 8.77 | 2.160 | 86.08 |
| FC5 | 2.64 | 9.63 | 2.170 | 97.73 |
| FC6 | 1.87 | 16.05 | 1.180 | 73.66 |
| FC7 | 1.94 | 15.76 | 1.310 | 81.93 |
Average: 81 MPa m1/2.
Disclaimer/Publisher’s Note: The statements, opinions and data contained in all publications are solely those of the individual author(s) and contributor(s) and not of MDPI and/or the editor(s). MDPI and/or the editor(s) disclaim responsibility for any injury to people or property resulting from any ideas, methods, instructions or products referred to in the content. |
© 2024 by the authors. Licensee MDPI, Basel, Switzerland. This article is an open access article distributed under the terms and conditions of the Creative Commons Attribution (CC BY) license (https://creativecommons.org/licenses/by/4.0/).
Copyright: This open access article is published under a Creative Commons CC BY 4.0 license, which permit the free download, distribution, and reuse, provided that the author and preprint are cited in any reuse.


