
Submitted:
19 November 2024
Posted:
19 November 2024
You are already at the latest version
Abstract
Knowledge of experimentally obtained values of elastic deformations of rubber springs induced by applied compressive forces of known magnitudes is essential for the selection of rubber springs with optimal properties, which are used in vibration machines. This paper deals with the laboratory measurement of the characteristics of rubber springs using two types of sensors that sense the instantaneous value of the compressive force acting on the compressed spring. By sensory monitoring of the pressure forces acting on the springs supporting the trough of vibratory conveyors, it is possible to analyse, diagnose and automate the working operation of vibration machines in practice. The characteristics of eight types of rubber springs were measured in two ways on laboratory equipment, and the spring stiffnesses were calculated from the measured data. Experiments have shown that the actual stiffnesses of rubber springs are lower compared to the values stated by the manufacturer, in the least favourable case by 33.6%. It has been shown by measurements that at the beginning of the loading of the rubber spring, its compression is gradual, and the stiffness increases slowly, which is defined as the progressivity of the spring.
Keywords:
force sensor
; rubber spring
; elastic deformation
; spring characteristics and stiffness
1. Introduction
The current global trend of digitalization referred to as "Industry 4.0" [1,2,3] and the related automation of production places requirements in terms of inspection, diagnostics and monitoring of parts, components and machines as a whole, along with conveying equipment, which are an essential part of production.
The purpose of this study is to monitor, diagnose and fully control the working operation of vibration machines based on sensor measurements of the compressive forces acting on rubber springs (which are digital inputs). The monitoring, detection and analysis of the measured signals by the sensors enables the optimal data inputs to be set up to control the drive of the vibration machine.
Steel [4] or rubber springs are widely used in industrial operations to dampen vibrations transmitted to the substructure of vibration machines. Smooth-running conveying equipment, namely vibratory conveyors with microshafts [5] or vibrating sorters with mechanical exciter [6], electromagnetic vibrators [7,8] or vibration exciters consisting of a pair of vibration electric motors [9,10] use the harmonic vibration of the trough or sorting screens [11,12] to move grains of bulk material.
A list of published works in the field of vibration transport was prepared by the authors M. A. Parameswaran and S. Ganapathy in the article [13].
In the article [14] Z. V. Despotovic et al. presents a mathematical model of a resonant linear vibrating conveyor driven by an electromagnetic excitation force. Derivation of the mathematical model is based on the kinetic and potential energies, dissipative function of the mechanical system, and Lagrangian formulation.
In the article [15], the authors E. M. Sloot and N. P. Kruyt present a method for measuring the coefficient of friction between granular material and a vibratory conveyor. In this paper, a theoretical and experimental study was made of the conveying speed [16] with which granular materials are transported by vibratory conveyors.
In the article [17], a new design solution of a vibrating conveyor was presented and analysed, which, despite the phasing of the vibrators, enables the feed material to be transported along the chute at a constant speed.
In [18] L.L. Howell et al. investigates the spring stiffness equivalent to a pseudo-rigid body and new modeling equations are proposed therein. The result is a simplified method of modelling the force/deflection relationships of large-deflection members in compliant mechanisms.
The articles [19,20] represent a structural design as well as a created 3D model used for subsequent physical implementation of a validation device that allows for measuring the force as well as the shortening of a coiled pressure spring during laboratory experiments.
In the article [21], the author R. Lefanti et al. an evaluation of the reliability of the elastomeric silentblock based on the shape factor and the materials used was developed.
In the article [22], J. Ziobro presents a mechanical calculation of the silentblock model. Based on the model, he performed a 3D numerical analysis using two types of rubber bushings with different hardness.
These studies [23,24,25,26], for example, deal with the analysis of the characteristic properties of silent blocks used in automobiles.
R. K. Luo and W. X. Wu in the article [27] state that the purpose of the FE analysis is to obtain improved fatigue life of the spring. It is shown in the paper that a quasi-static simulation for rubber springs using nonlinear software can provide good indication for product design and failure analysis.
M. Berg in [28] proposed a nonlinear dynamic model of a rubber spring and focused on the representation of the mechanical behavior of rubber suspension components in rail vehicle dynamics.
For the analysis of railway vehicle dynamics, in the article [29] by R. Luo et al. designed a simple and more accurate nonlinear rubber spring model. The characteristics of dynamic stiffness and damping are investigated through both simulations and lab tests with various displacement amplitude and frequency.
In the article [30], H. Shi and P. Wu created a nonlinear dynamic model for a rubber spring and subsequently used it to describe the mechanical behavior of rubber mounts in the suspension system of a railroad vehicle. In this paper, the dynamic stiffness and damping characteristics in relation to the applied displacement amplitude and frequency were investigated by means of simulations and measurements.
J. Austin et al. in [31] report that soft springs provide higher torque resolution at the cost of system bandwidth, whereas stiff springs provide a fast response but lower torque resolution. Nonlinear springs potentially incorporate the benefits of both soft and stiff springs, but such springs are often large. An nonlinear sprin design was recently proposed that combines a variable radius cam with a rubber elastic element, enabling a compact spring design.
The main objective of the study was to use sensors to detect the magnitude of the compressive force acting on the rubber spring, thus enabling monitoring, data collection and storage for the purpose of autonomous operation of vibration machines. The ability to detect the actual instantaneous magnitudes of the applied forces by sensors in real time and to use these digital values to communicate with the control unit allows for increasing the safety and reliability of the operation of the vibration machine [31,32] and its key machine parts, which can also include springs. A significant aspect is the reduction of the risk of accidents both during maintenance and working activities and the assurance of functionality without the need for human presence due to the use of automation and sensor monitoring.
2. Materials and Methods
Vibrating
conveyors/sorters use the inertial forces on the individual grains of the
conveyed material to move/sort the material. The inertial forces are generated
by the harmonic oscillating motion of the trough (micro-rotor conveyors), see Figure 1, in which the material particles are separated from the
trough surface at a certain phase of the transport time (the vertical component
of the acceleration of the oscillating motion is greater than the acceleration
due to gravity).
The source of the harmonic oscillations is the exciter, which is usually firmly connected to the trough. The trough is supported/suspended by steel or rubber (silent block) springs. The springs allow the trough to perform harmonic motion and at the same time prevent the transmission of dynamic forces to the substructure, for this reason there is an attempt to select springs with the lowest possible stiffness ss [N·m-1]. The stiffness of the springs also determines whether the vibration machine will operate in the sub-resonant (z < 1), resonant (z = 0.85÷0.95) or supra-resonant (z > 1÷5) zone, where z = w/w0, w = 2-p-f [s-1] is the operating frequency of the machine, f [Hz] is the frequency of vibration generated by the exciter, w0 [s-1] is the natural frequency of the machine (1). The stiffness of the springs supporting the trough of mass m [kg] (including the mass of the conveyed material placed on the trough) can be determined according to (1).
In many springs that are in use, especially in the case of the frequently used helical springs or rubber springs, the dependence of the deformation (compression) x [m] due to the applied force F [N] is almost linear [20], and in graphical expression it is a line. The slope of this line gives the spring stiffness ss [N·m-1], which is a constant expressing the force required to deform the spring per unit [4]. In the case of a direct proportionality between force and deflection, such behaviour can be expressed mathematically by Hooke's law (2).
where F [N] is the spring force, x [m] x [m] is the spring deflection from the resting state.
A body suspended by a spring, or supported by a spring, is one of the simplest mechanical oscillators, i.e. a system that performs oscillations. If damping is neglected, a body of mass m [kg] on a spring of stiffness ss [N·m-1] performs harmonic oscillations of natural angular frequency ω0 [rad·s-1] (1).
The spring characteristic is generally a curve expressing the dependence between the force acting on the spring and its elastic deformation. The area under the curve corresponds to the delivered work W [J] (3) required for a certain deformation of the spring or the accumulated potential energy Ep [J] of the loaded spring.
In order to verify the catalogue values [34] of the stiffness of rubber springs, a laboratory device was designed and constructed which allows to measure the elastic deformation of rubber springs, which are called "silent blocks", depending on the magnitude of the applied compressive force, using sensors [35,36] and positioning units with a digital indicator [37]. This was carried out in a laboratory at the Department of Machine and Industrial Design, Faculty of Mechanical Engineering, VSB-Technical University of Ostrava.
Figure 2 presents the first variation of the measurement of compression rubber spring characteristics. The bolt of the tested silent block 3 was attached to the sled of the positioning unit (long positioning table PT7312-PA [37]) 4. The measurements were carried out on a total of 8 types of silent blocks, made of NR/SBR rubber with a hardness of 55°shA, with the bolt having an M6 thread. Four silent blocks were of diameter D = 20 mm and lengths H0 = 10, 15, 20 and 25 mm, while the remaining four silent blocks were of diameter D = 25 mm and lengths H0 = 15, 20, 25 and 30 mm. The positioning unit 4 was attached to the steel frame 1 of the laboratory apparatus similarly to digital force gauge DST-220A [35] with a measuring range of 0÷1000 N.
By manually rotating the locking bolt of the positioning unit 4 in the appropriate direction, the shank of the rubber spring bolt 3 was brought closer/farther away from the measuring surface of the digital force gauge 2. At the moment when the shank of the bolt of the rubber spring 3 reached the measuring surface of the digital force gauge 2, the digital indicator of the positioning unit 4 and the digital force gauge 2 were reset. By turning the locking bolt of the positioning unit 4, the sled was moved vertically by the desired amount Li [m]. The value of the applied compressive force Fcom,i [N] was read on the digital force gauge 2 for the compression value Li [m] (i.e. the length of the rubber spring Hi = H0 - Hi [m]) of the rubber spring 3.
The procedure was repeated until the predetermined maximum compression Li = Li = Lmax [m] of the rubber spring 3. By turning the locking bolt of the positioning unit 4 in the reverse direction, the values of the compressive force Frel,i [N] at the compression value Li [m] of the rubber spring 3 were measured on the digital force gauge 2. The values of the measured compressive forces by the digital force gauge 2 can be recorded using the Force Logger software [38] and saved on a computer.
Figure 3 presents the second variation of measuring the characteristics of a compression rubber spring. tension pressure sensor C9B 2 [36] with a measuring range of 0÷1000 N was mechanically attached to the sled of the horizontally positioned positioning unit 4.
By manually rotating the locking bolt of the vertically positioned positioning unit 4 in the appropriate direction, the shank of the rubber spring screw 3 was brought closer/farther away from the measuring surface of the tension pressure sensor 2. Using the DEWESoft X2 SP5 software [39], the signals of the measured quantity (pressure forces Fcom,i [N]) were recorded, having been detected by the DEWESoft DS-NET measuring apparatus [40], see Figure 4.
The cable of the tension pressure sensor C9B-1 kN, see Figure 4, fitted with a D-Sub 9-pin plug, was connected to the DS NET BR4 module [40]. The RJ45 connectors of the network cable connect the DS GATE module [40] to a PC (ASUS K72JR-TY131) running the DEWESoft X2 SP5 software [39].
The constructed laboratory device that allows detection of the magnitude of compressive forces acting on rubber springs is presented in Figure 5.
3. Results
Compressive forces of compressed rubber springs φ20 mm, with lengths in unloaded state H0 = 10, 15, 20 and 25 mm and φ25 mm, H0 = 15, 20, 25 and 30 mm were measured on the laboratory equipment, see Figure 5. All types of rubber springs were made of NR/SBR rubber with a hardness of 55°shA.
The values of n times repeated measurements of compressive forces under the same technical conditions were, for individual compression of rubber springs, displayed in the software Force Logger [38] using the digital force gauge DST-220A or in the software DEWESoft X2 SP5 using the tension pressure sensor C9B and recorded in tables, see 3.1 and 3.2.
3.1. Subsection
Table 1 shows the measured values of the compressive force Fcom,i [N] of a silent block φ20 mm with a length in the unloaded state of H0 = 10 mm during its compression, i.e. deformation Li [m]. Also presented in Table 1 are the measured values of the compressive force Frel,i [N] when the silent block is released from the length Hi = H0 - Li [m]. The maximum possible compression of the silent block is Li = Lmax [m], from which the minimum silent block length HN = H0 – L.max [m] can be expressed.
The resulting calculated compression force Fcom [N] or release force Frel [N] of the form (4), using Student's distribution [41], is given in Table 1 (through to Table 4)
where Fcom (Frel) [N] is the arithmetic mean of all (n = 5 - number of repeated measurements) measured values of Fcom,i (Frel,i) [N], κα,n [-] is the marginal error, tα,n [-] (t5%,5 = 2.78) is the Student's coefficient for the risk α [%] (α = 5%) and the confounding coefficient P [%] (P = 95%) [41], s [-] is the sample standard deviation of the arithmetic mean.
Table 2 shows the measured values of the compressive force Fcom,i [N] and Frel,i [N] when compressing and releasing a silent block φ20 mm with length in the unloaded state of H0 = 15 mm. In [34] the maximum compression Lmax = 3.75 mm, the maximum load Fmax = 352 N and the stiffness of the silent block ss = 94 N·mm-1 are given for this type of silent block.
Table 3 shows the measured values of the compressive force Fcom,i [N] and Frel,i [N] when compressing and releasing a silent block φ20 mm with length in the unloaded state of H0 = 20 mm. In [34] the maximum compression Lmax = 5 mm, the maximum load Fmax = 260 N and the stiffness of the silent block ss = 52 N·mm-1 are given for this type of silent block.
Table 4 shows the measured values of the compressive force Fcom,i [N] and Frel,i [N] when compressing and releasing a silent block φ20 mm with length in the unloaded state of H0 = 25 mm. In [34] the maximum compression Lmax = 6.25 mm, the maximum load Fmax = 310 N and the stiffness of the silent block ss = 50 N·mm-1 are given for this type of silent block.

Table 4.
Rubber spring D = 20 mm, length when not loaded H0 = 25 mm.
| i | 1 | 2 | 3 | 4 | 5 | ||||||||||
| Li | Fcom,1 | Frel,1 | Fcom,2 | Frel,2 | Fcom,3 | Frel,3 | Fcom,4 | Frel,4 | Fcom,5 | Frel,5 | Fcom 1 | κ5%,5 | Frel 1 | κ5%,5 | sscom,i |
| mm | N | N·mm-1 | |||||||||||||
| 0 | 0 | 0 | 0 | 0 | 0 | 0 | 0 | 0 | 0 | 0 | 0 | 0 | 0 | 0 | - |
| 1.0 | 50 | 36 | 48 | 38 | 49 | 38 | 48 | 38 | 49 | 39 | 48.8 | 1.1 | 37.8 | 1.3 | 48.8 |
| 2.0 | 95 | 78 | 95 | 81 | 95 | 82 | 93 | 80 | 94 | 82 | 94.4 | 1.3 | 80.6 | 2.2 | 47.2 |
| 4.0 | 194 | 163 | 190 | 168 | 190 | 171 | 187 | 169 | 189 | 171 | 190.0 | 2.8 | 168.4 | 4.0 | 47.5 |
| 6.0 | 292 | 258 | 288 | 264 | 286 | 264 | 283 | 262 | 287 | 264 | 287.2 | 3.9 | 262.4 | 3.3 | 47.9 |
| 8.0 | 402 | 375 | 399 | 380 | 397 | 382 | 392 | 378 | 391 | 380 | 396.2 | 6.5 | 379.0 | 3.5 | 49.5 |
| 9.0 | 456 | 456 | 459 | 459 | 462 | 462 | 456 | 456 | 459 | 459 | 458.4 | 3.3 | 458.4 | 3.3 | 50.9 |
1 see Figure 6
Figure 6.
Graph of the dependence of the compressive force acting on a rubber spring φ20 mm with length in the unloaded state H0 = 10÷25 mm and its elastic deformation. H0 ( ) 10 mm, (
 ) 15 mm, (
 ) 20 mm, (
 ) 25 mm.
) 10 mm, () 15 mm, () 20 mm, () 25 mm.
Figure 6.
Graph of the dependence of the compressive force acting on a rubber spring φ20 mm with length in the unloaded state H0 = 10÷25 mm and its elastic deformation. H0 () 10 mm, () 15 mm, () 20 mm, () 25 mm.
) 10 mm, () 15 mm, () 20 mm, () 25 mm.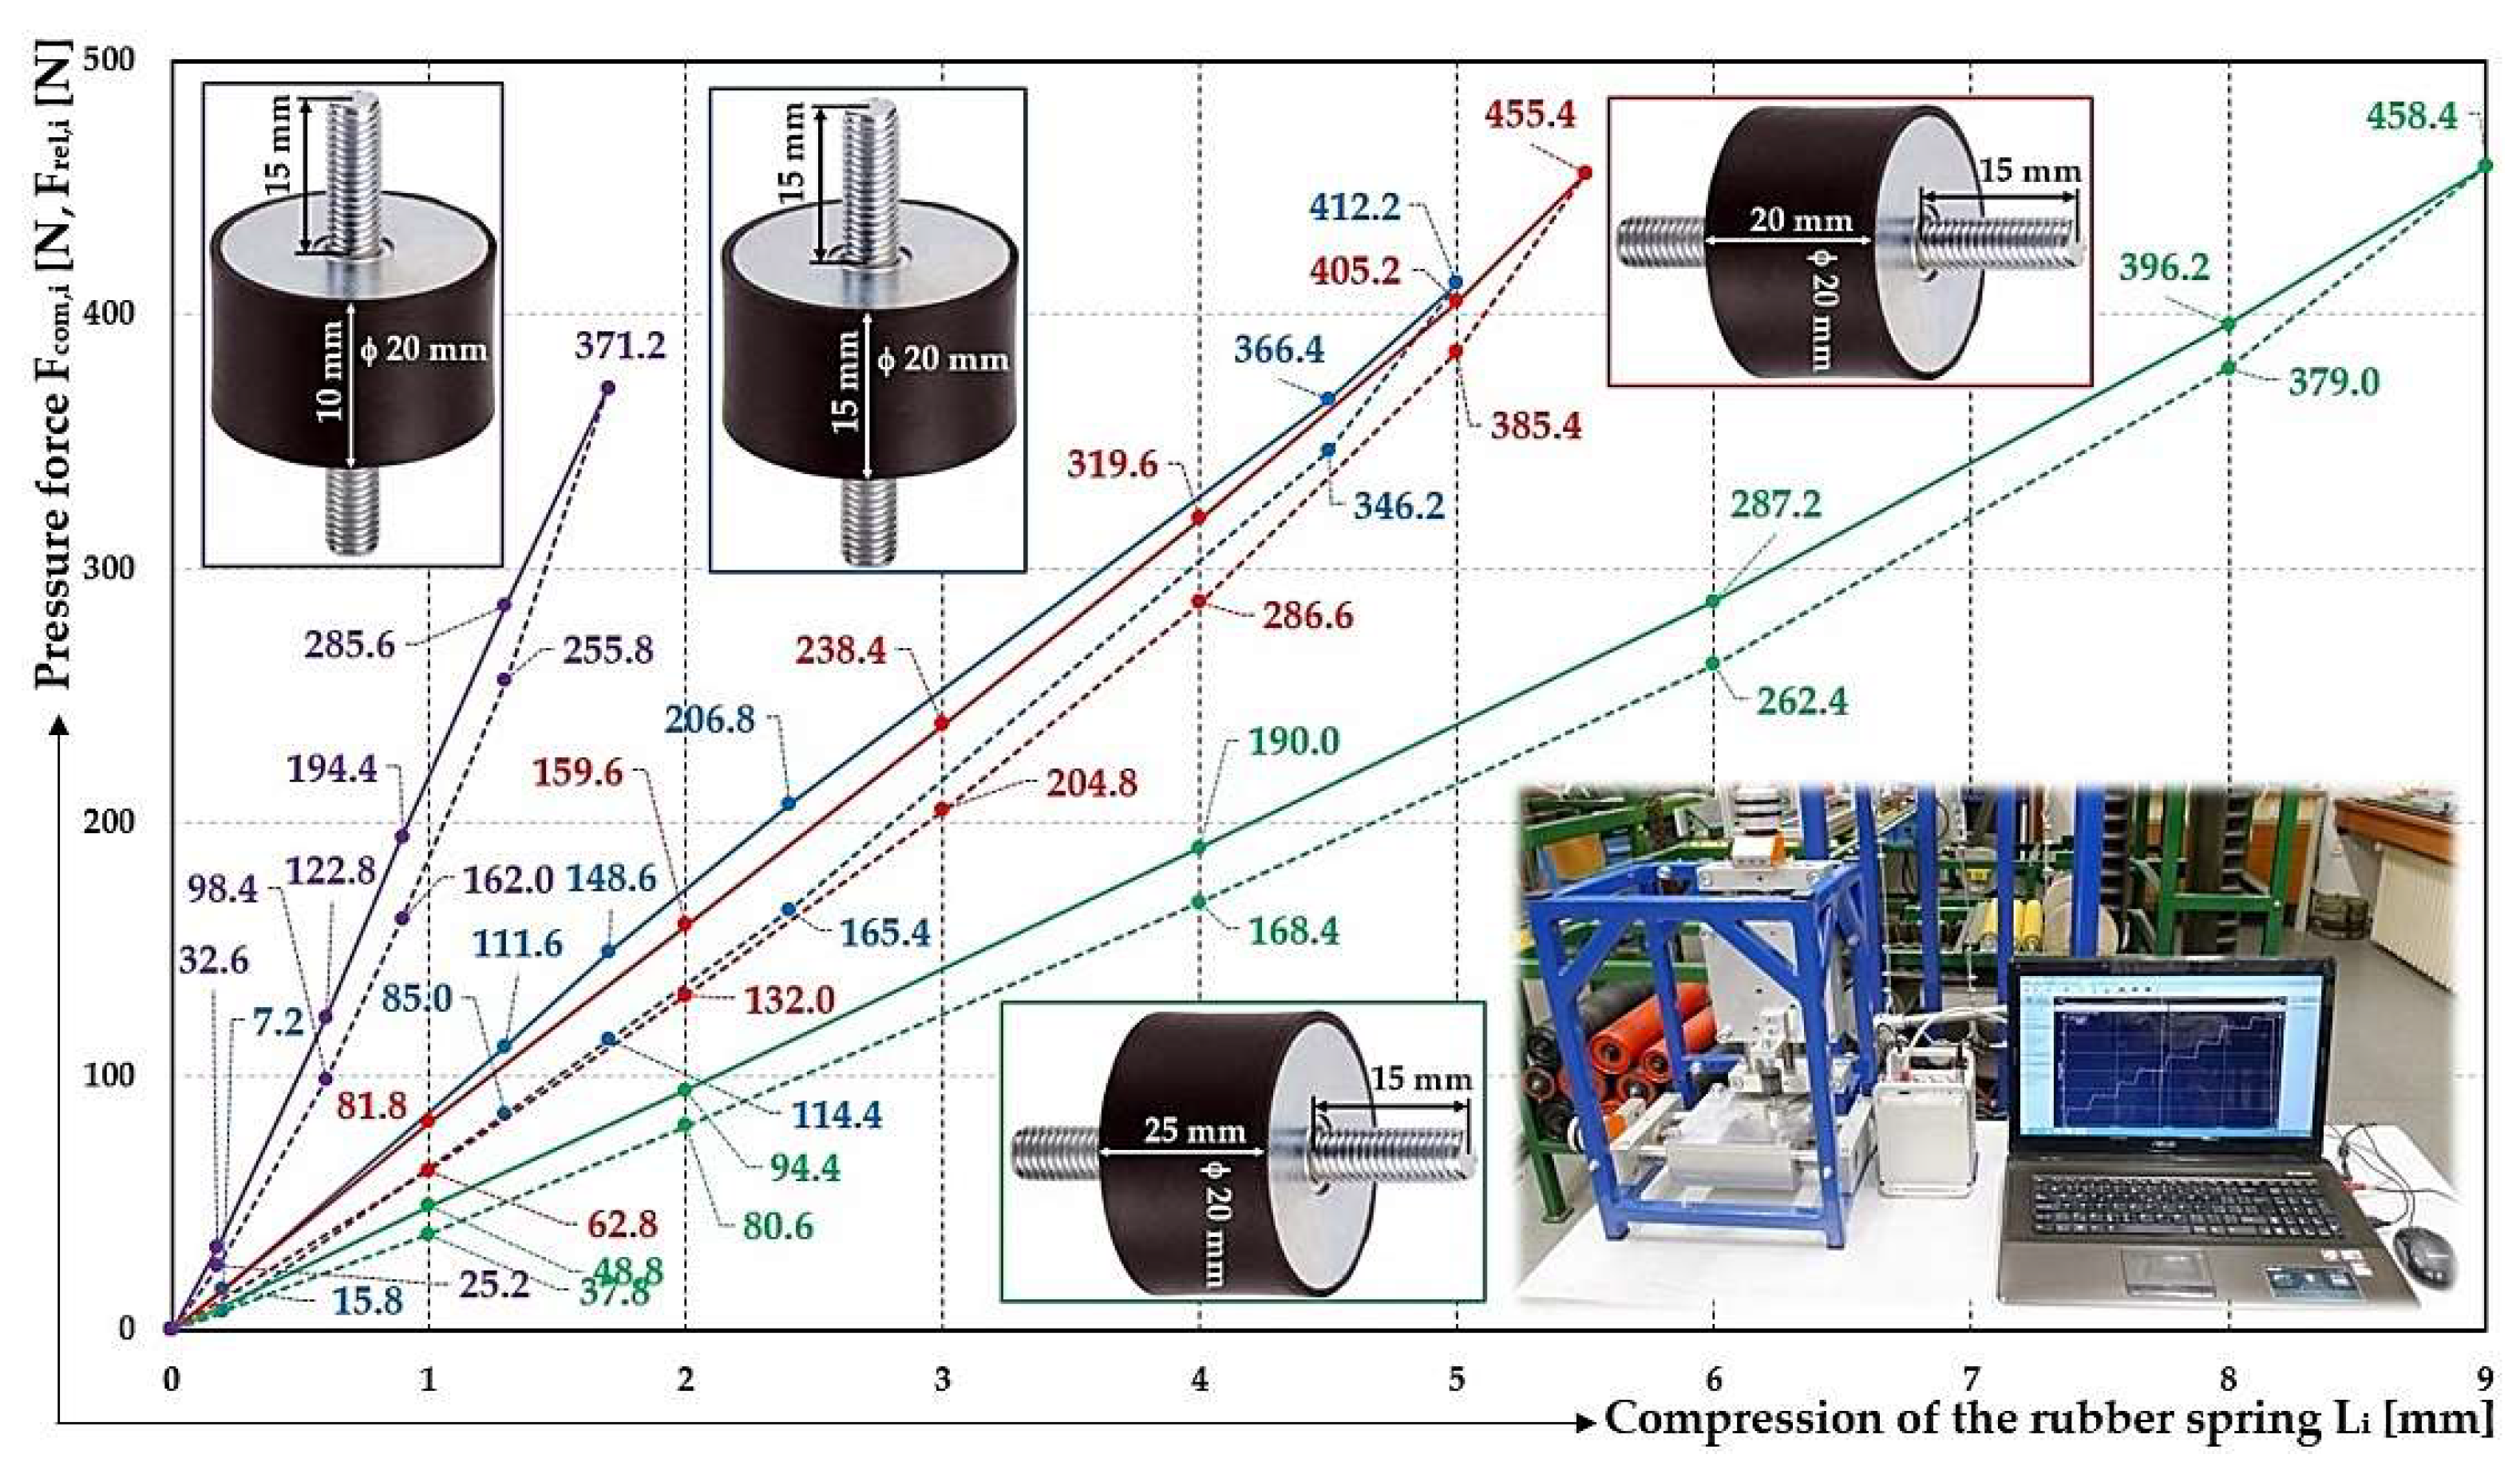
Figure 7.
Graph of the dependence of the compressive force acting on a rubber spring φ25 mm with length in the unloaded state H0 = 15÷30 mm and its elastic deformation. H0 () 15 mm, () 20 mm, () 25 mm, () 30 mm.
) 15 mm, () 20 mm, () 25 mm, () 30 mm.
Figure 7.
Graph of the dependence of the compressive force acting on a rubber spring φ25 mm with length in the unloaded state H0 = 15÷30 mm and its elastic deformation. H0 () 15 mm, () 20 mm, () 25 mm, () 30 mm.
) 15 mm, () 20 mm, () 25 mm, () 30 mm.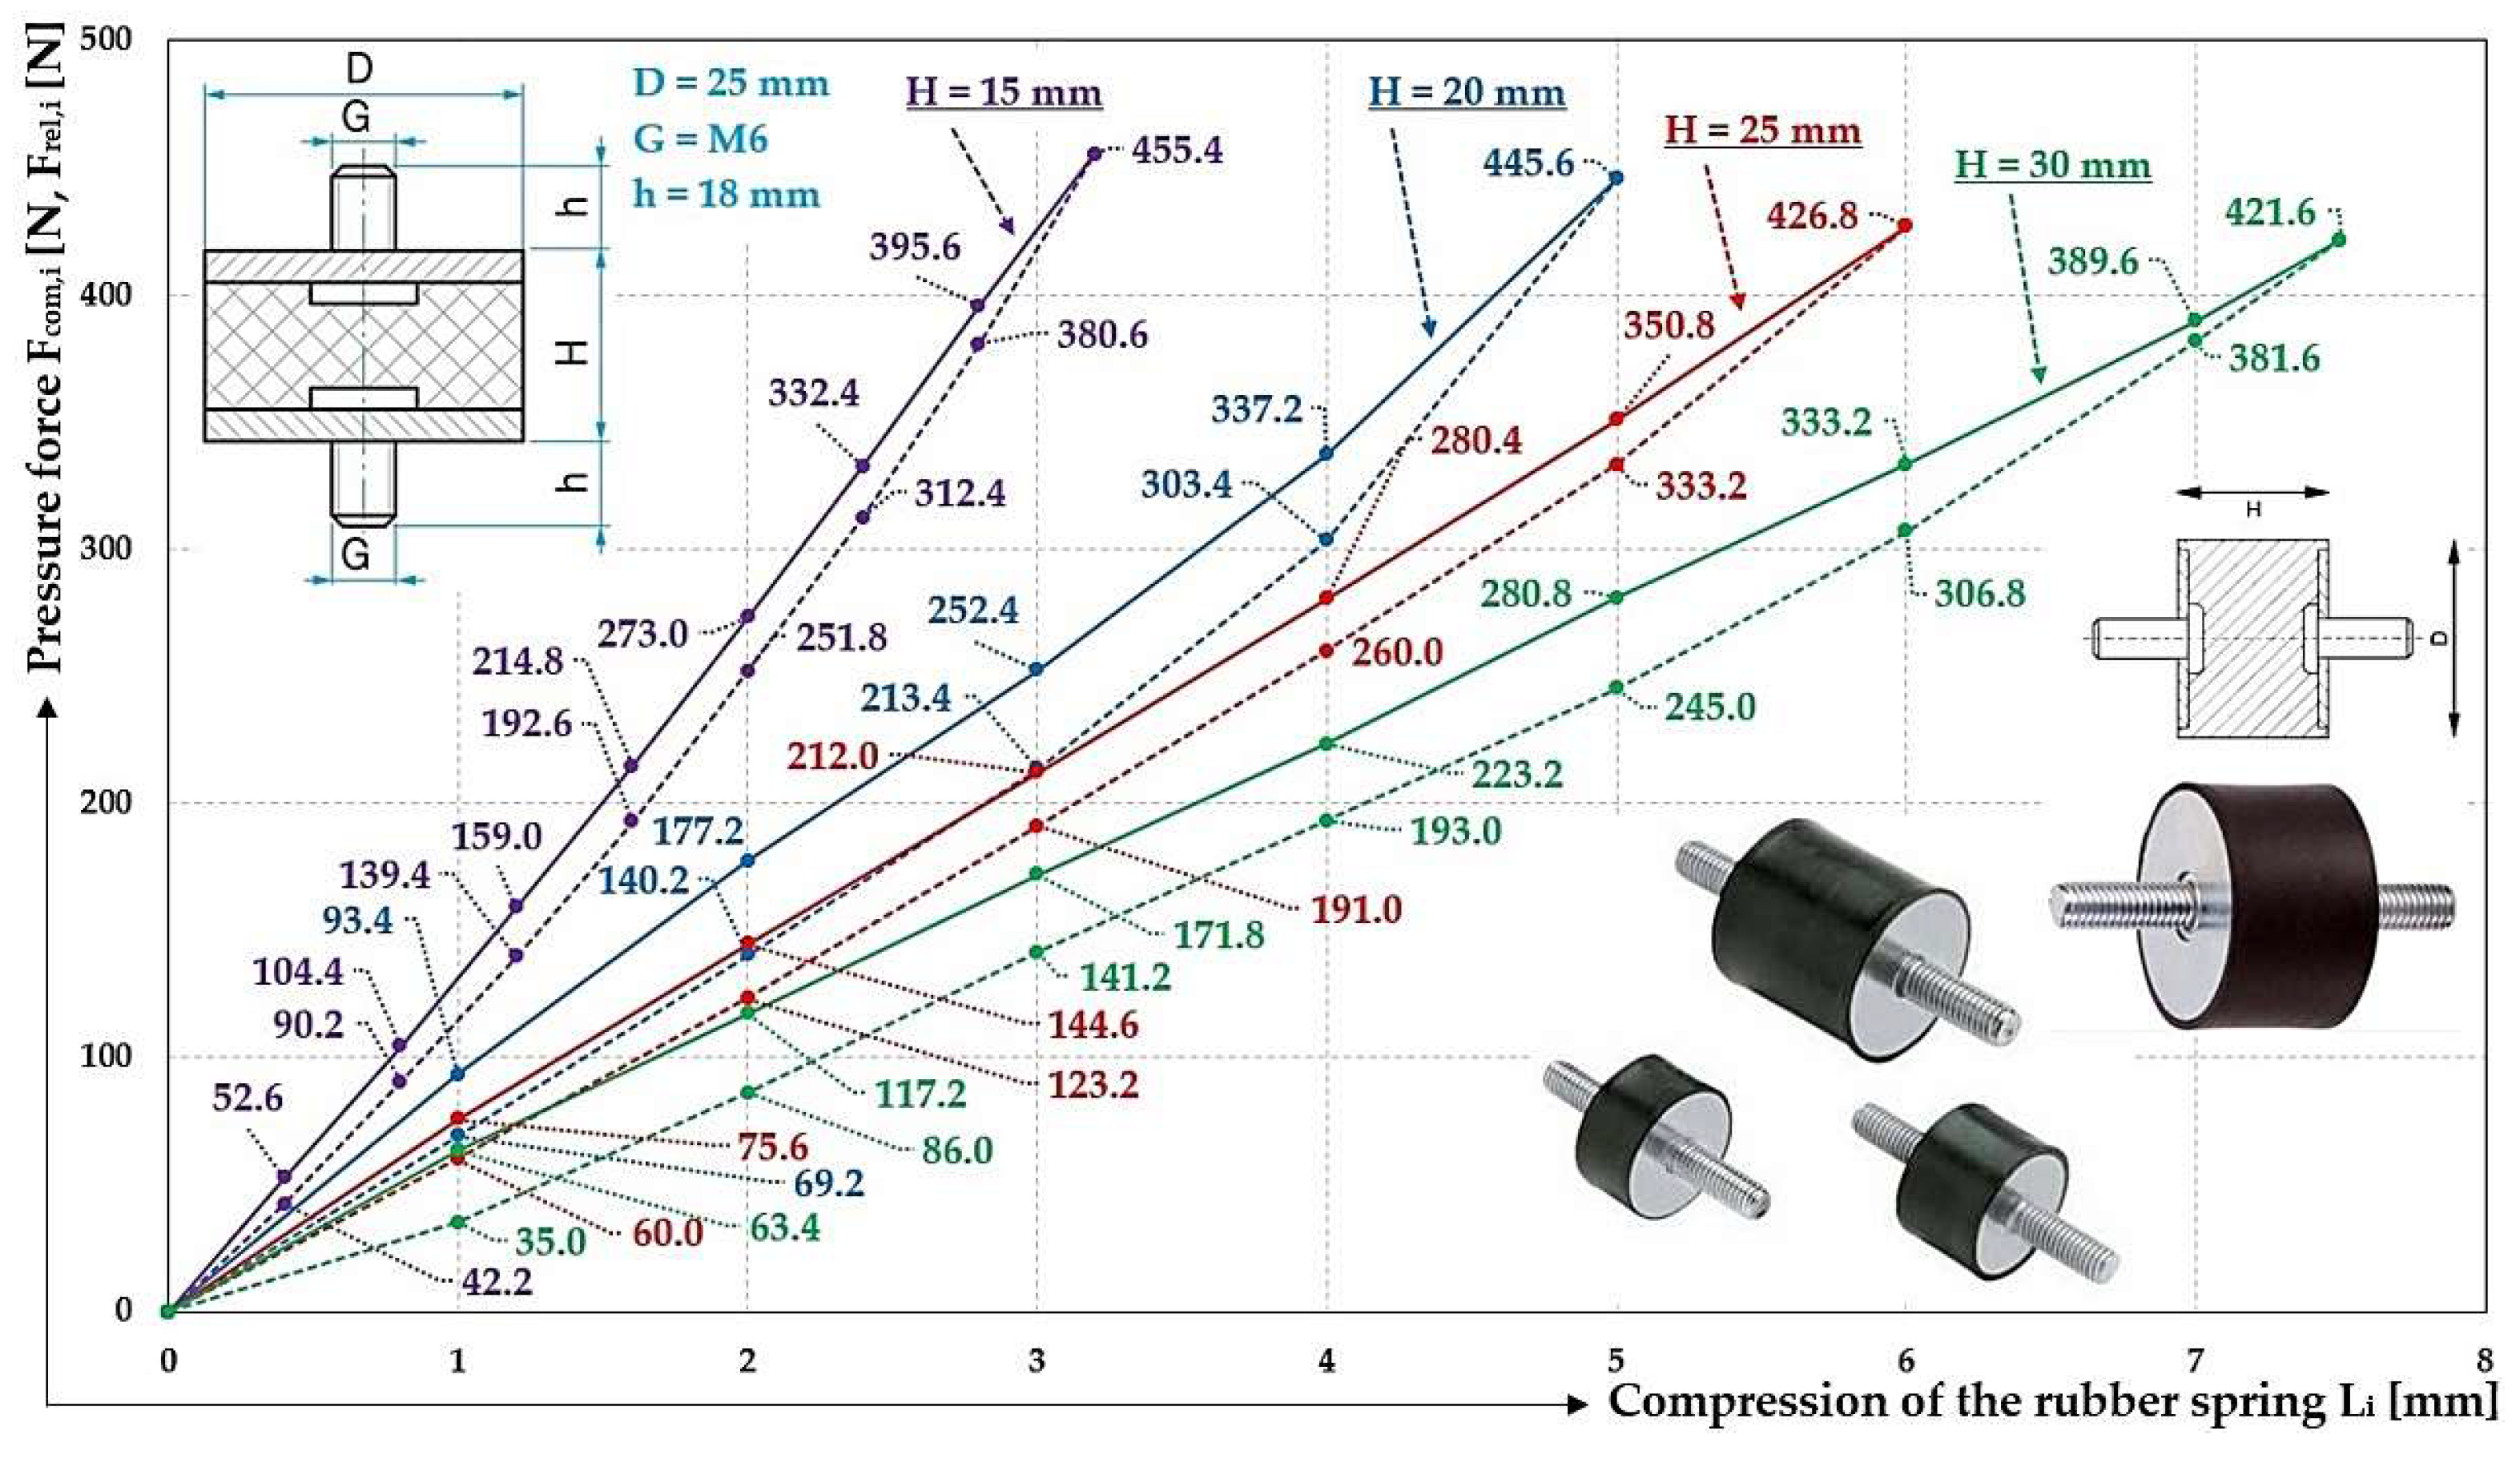
Table 5 shows the measured values of the compressive force Fcom,i [N] of a silent block φ25 mm with a length in the unloaded state of H0 = 15 mm during its compression, i.e. deformation Li [m]. Also presented in Table 5 are the measured values of the compressive force Frel,i [N] when the silent block is released from the length Hi = H0 - Li [m]. In [34] the maximum compression Lmax = 3.75 mm, the maximum load Fmax = 687 N and the stiffness of the silent block ss = 183 N·mm-1 are given for this type of silent block.
Table 6 shows the measured values of the compressive force Fcom,i [N] and Frel,i [N] when compressing and releasing a silent block φ25 mm with length in the unloaded state of H0 = 20 mm. In [34] the maximum compression Lmax = 5 mm, the maximum load Fmax = 602 N and the stiffness of the silent block ss = 120 N·mm-1 are given for this type of silent block.
Table 7 shows the measured values of the compressive force Fcom,i [N] and Frel,i [N] when compressing and releasing a silent block φ25 mm with length in the unloaded state of H0 = 25 mm. In [34] the maximum compression Lmax = 6.25 mm, the maximum load Fmax = 675 N and the stiffness of the silent block ss = 108 N·mm-1 are given for this type of silent block.
Table 8 shows the measured values of the compressive force Fcom,i [N] and Frel,i [N] when compressing and releasing a silent block φ25 mm with length in the unloaded state of H0 = 30 mm. In [34] the maximum compression Lmax = 7.5 mm, the maximum load Fmax = 562 N and the stiffness of the silent block ss = 75 N·mm-1 are given for this type of silent block.
3.2. Subsection
The following tables (Table 9 to Table 12) show the measured values of the compressive forces Fcom,i [N] of the silent blocks (φ20 mm and φ25 mm with unloaded length H0 = 10 to 30 mm) during their compression, i.e. deformation Li [m]. The tables show the values of Fcom [N], which is the arithmetic mean of all (n = 3 number of replicate measurements) measured values of Fcom,i [N] and κα,n [-], which is the marginal error. tα,n [-] t5%,3 = 4.30) is the Student's coefficient for the risk α [%] (α = 5%) and the confounding coefficient P [%] (P = 95%) [41].
Figure 10 and Figure 11 present the values of the measured compressive forces, randomly selected from Table 9. In case of interest, it is possible, upon written request by e-mail to the authors of this paper, to receive all measured data in data files with DXD extension (DEWESoft software) or XLS, XLSX (Microsoft Excel software). The same applies to the following presented tables.
Figure 11 Measured values of the compressive force Fcom,i [N] during compression Li [mm] of a rubber spring of diameter D = 20 mm, length H0 (a) 15 mm, (b) 20 mm.
Figure 10.
Measured values of the compressive force Fcom,i [N] during compression Li [mm] of a rubber spring of diameter D = 20 mm, length H0 = 10 mm. Compressive force Fcom,1 (a) 52.3 N, (b) 108.1 N.
Figure 10.
Measured values of the compressive force Fcom,i [N] during compression Li [mm] of a rubber spring of diameter D = 20 mm, length H0 = 10 mm. Compressive force Fcom,1 (a) 52.3 N, (b) 108.1 N.
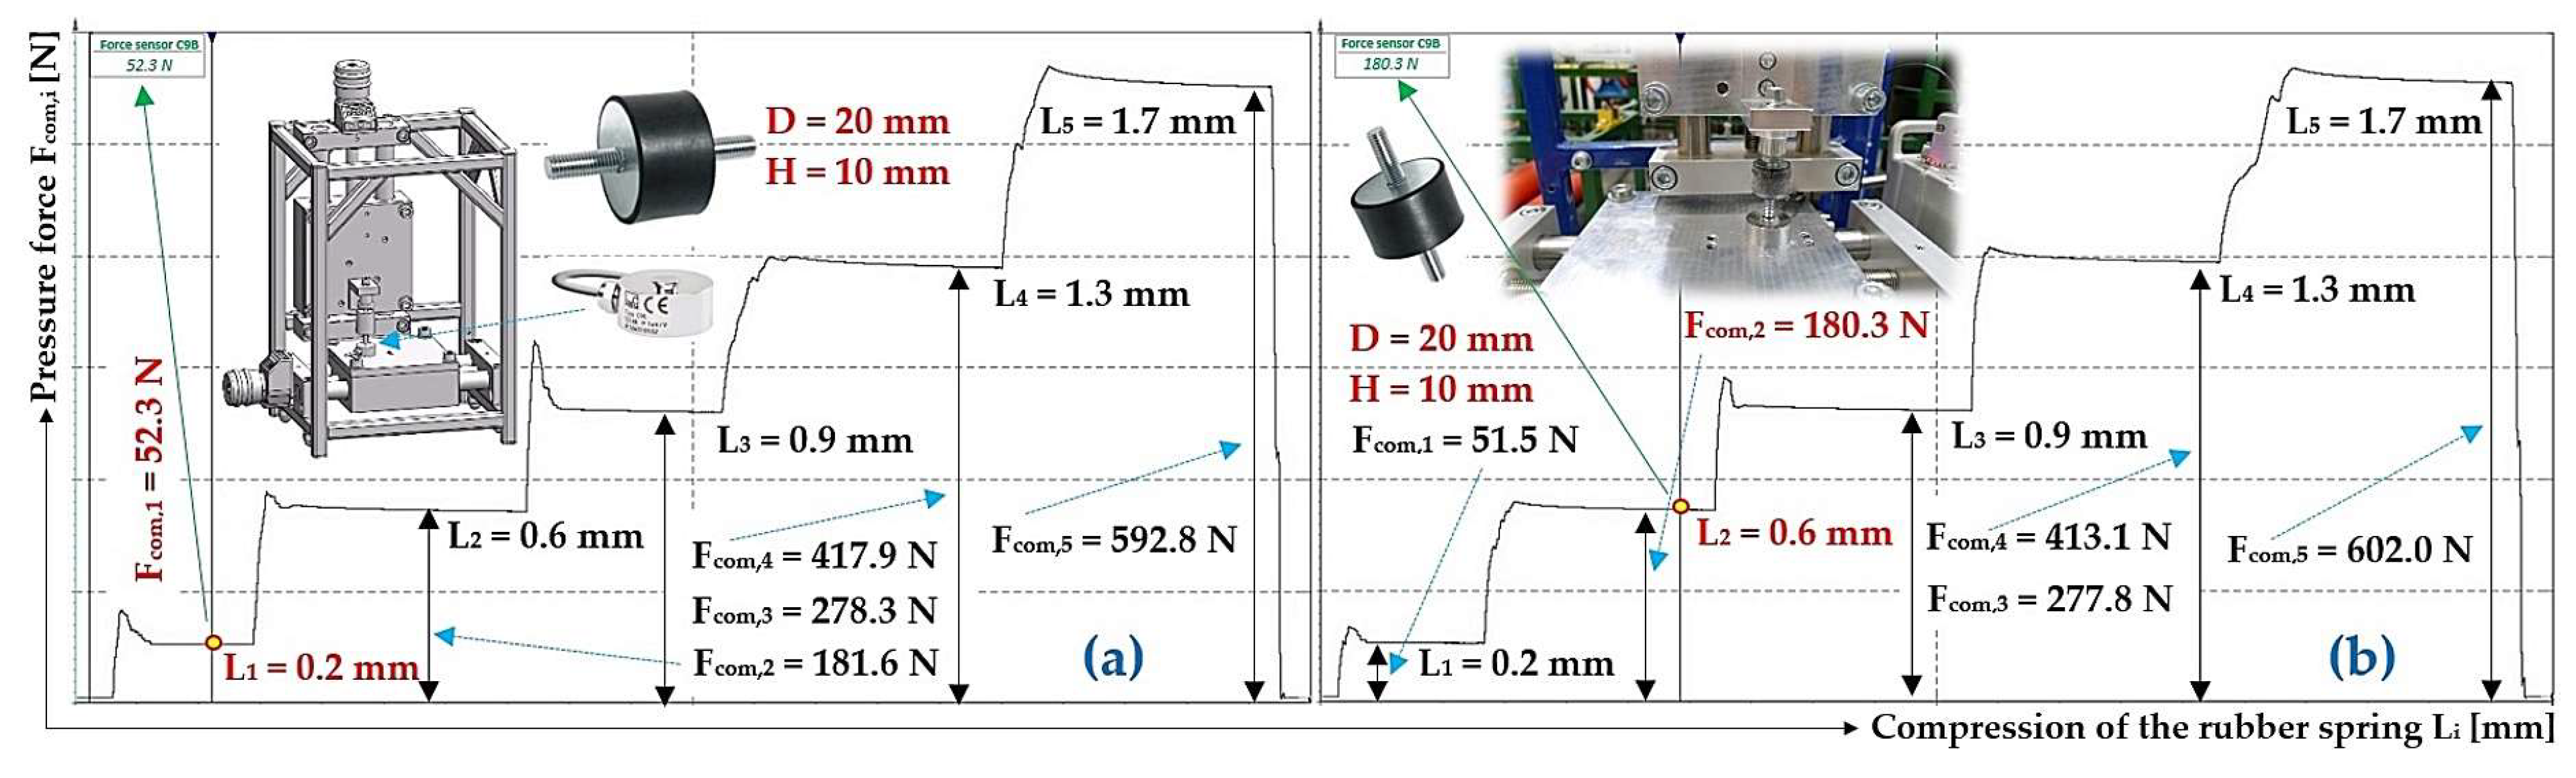
Figure 11.
Measured values of the compressive force Fcom,i [N] during compression Li [mm] of a rubber spring of diameter D = 20 mm, length H0 = 10 mm. Compressive force Fcom,1 (a) 15 mm, (b) 20 mm.
Figure 11.
Measured values of the compressive force Fcom,i [N] during compression Li [mm] of a rubber spring of diameter D = 20 mm, length H0 = 10 mm. Compressive force Fcom,1 (a) 15 mm, (b) 20 mm.
Figure 12.
Measured values of the compressive force Fcom,i [N] during compression Li [mm] of a rubber spring of diameter D = 20 mm and 25 mm, length H0 (a) 25 mm, (b) 15 mm.
Figure 12.
Measured values of the compressive force Fcom,i [N] during compression Li [mm] of a rubber spring of diameter D = 20 mm and 25 mm, length H0 (a) 25 mm, (b) 15 mm.
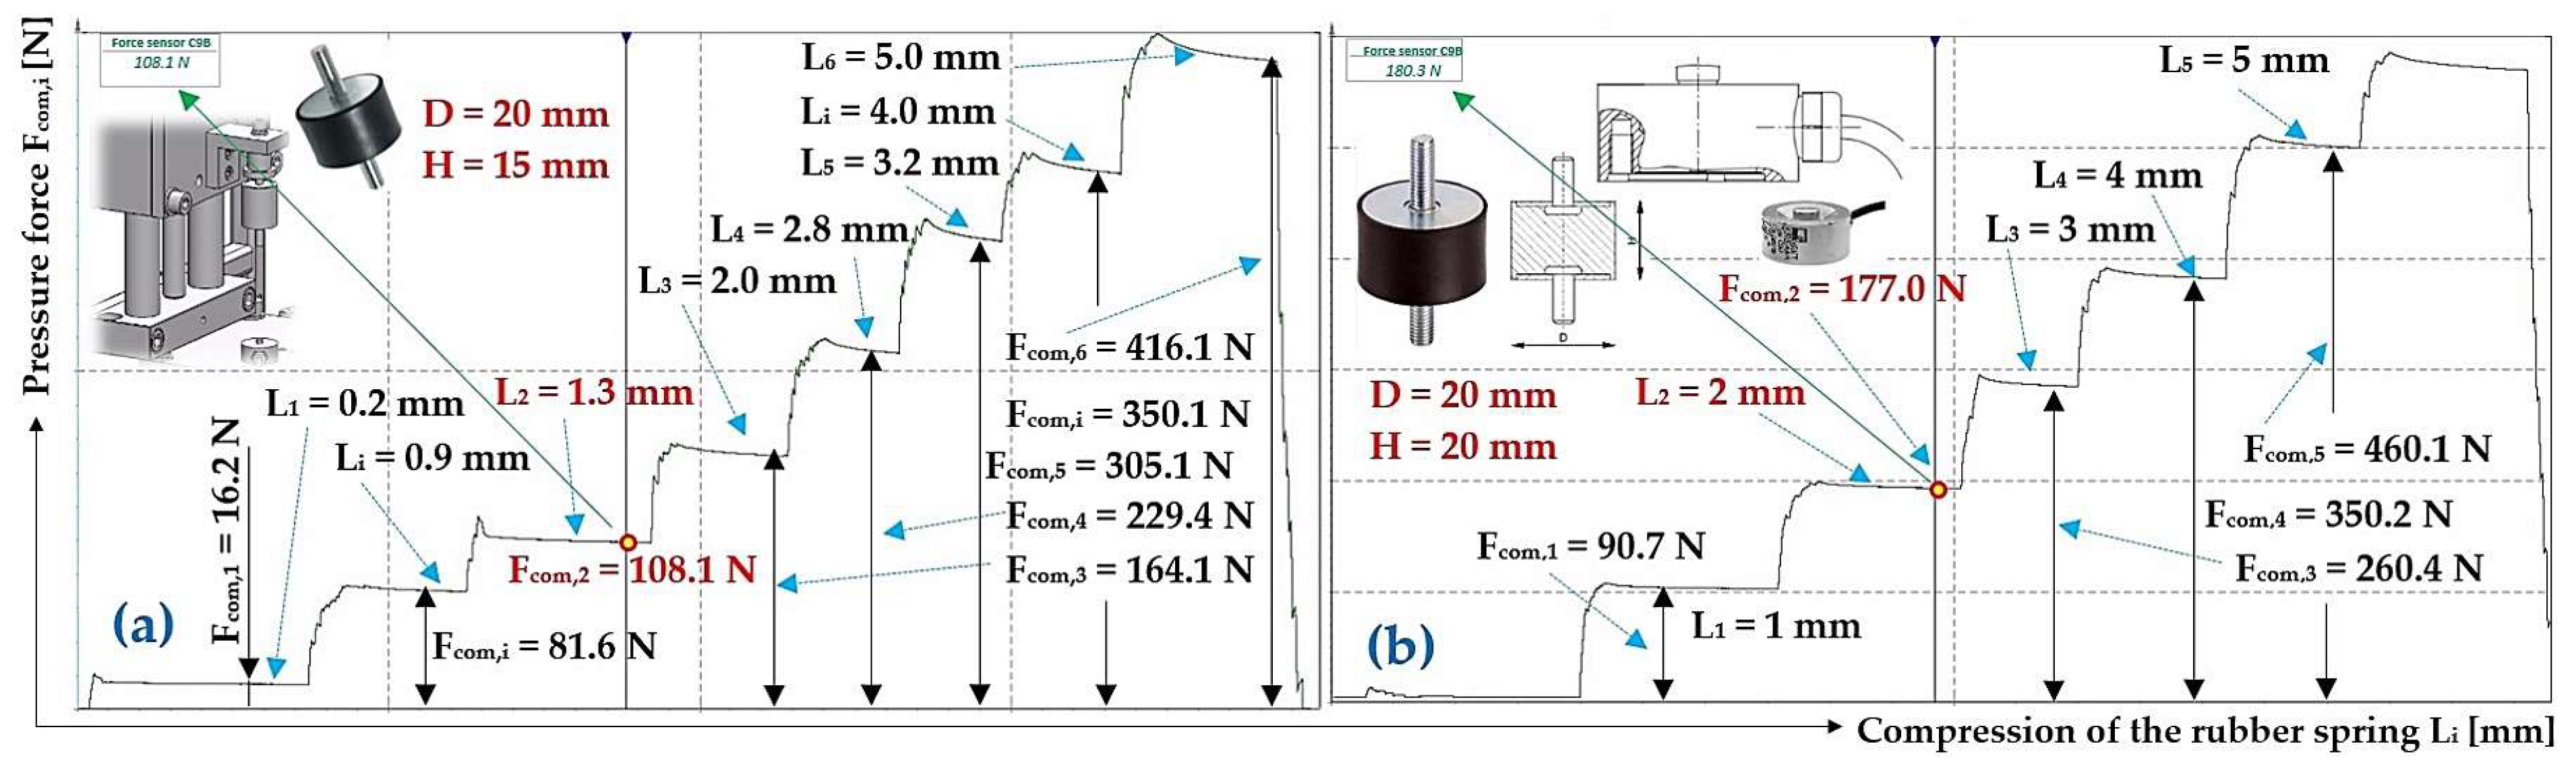
Figure 13.
Measured values of the compressive force Fcom,i [N] during compression Li [mm] of a rubber spring of diameter D = 25 mm, length H0 (a) 20 mm, (b) 55 mm.
Figure 13.
Measured values of the compressive force Fcom,i [N] during compression Li [mm] of a rubber spring of diameter D = 25 mm, length H0 (a) 20 mm, (b) 55 mm.
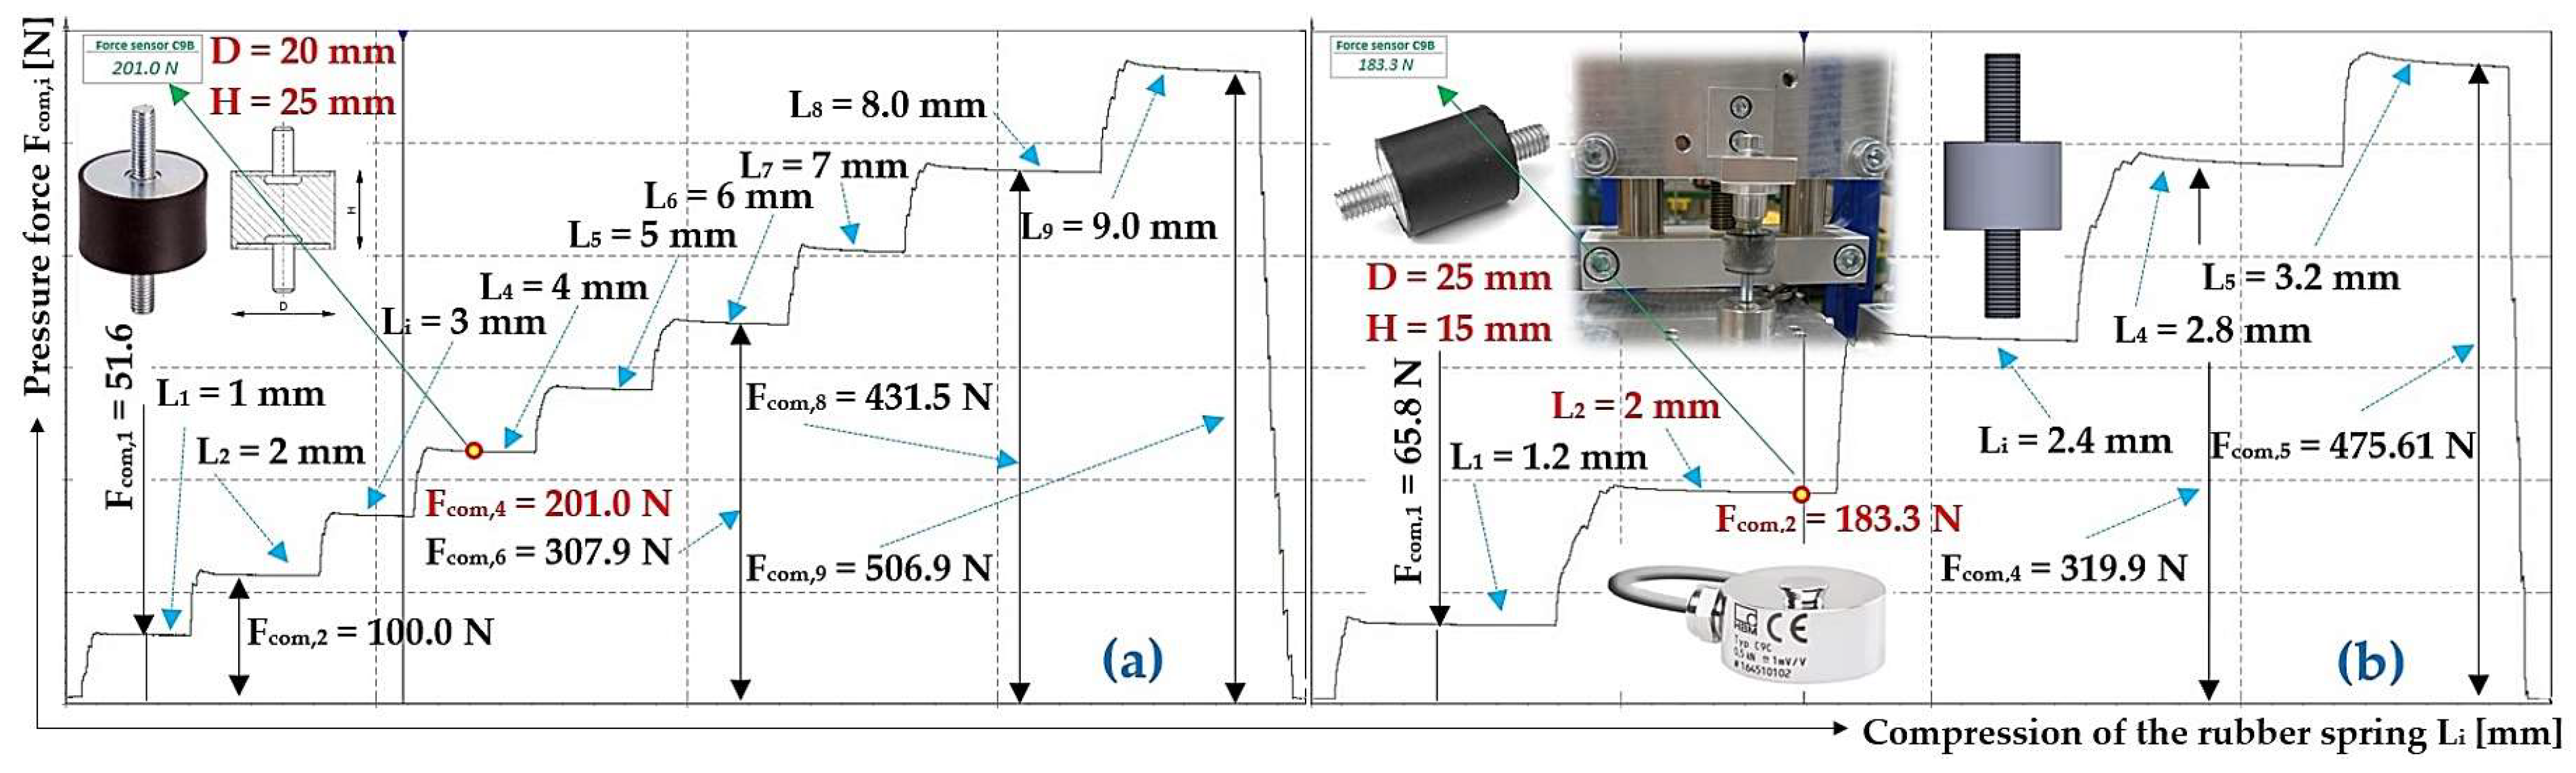
Figure 14 shows the comparison of measured compressive forces Fcom,i [N] by digital force gauge DST-220A and tension pressure sensor C9B during compression of rubber springs of diameter D = 20 mm with lengths in unloaded state of H0 = 10÷25 mm. The numerical values of the compressive forces Fcom [N], see Table 1 to Table 4, given for the solid curves correspond to measurement variant 1 (see Chapter 3.1), the values of the compressive forces Fcom [N], see Table 9 and Table 10, given for the broken curves correspond to measurement variation 2 (see Chapter 3.2).
Figure 15 shows the comparison of measured compressive forces Fcom,i [N] with the digital force gauge DST-220A and the tension pressure sensor C9B during compression of rubber springs of diameter D = 25 mm with lengths in the unloaded state H0 = 15÷30 mm. The numerical values of the pressure forces Fcom,i [N], see Table 5 to Table 8, given for the solid curves correspond to measurement variation 1 (see Chapter 3.1), the values of the pressure forces Fcom, [N], see Table 11 and Table 12, given for the dashed curves correspond to measurement variation 2 (see Chapter 3.2).
4. Discussion
Rubber springs made of elastic material (rubber) are used for various mechanical applications because of their ability to be deformed and then return to their original shape. They can effectively absorb and dampen shocks or vibrations, making them suitable for use in automotive, machinery or conveying equipment where vibration needs to be eliminated.
The measurements of the compressive forces acting on the rubber springs presented in Figure 6 and Figure 7 confirmed that the rubber springs have a progressive characteristic [42]. Progressive rubber springs [43,44] change their resistance to compression slowly at first and then more steeply, i.e. parabolically, with increasing load.
In Table 1 to Table 8, the stiffnesses of the rubber springs sscom,i [N·mm-1] φ20 mm and φ25 mm are calculated from the measured values of the compressive forces with the digital force gauge DST-220A acting on the rubber spring Fcom,i [N] and its elastic deformation Li [m] during compression.
From the measured values, the calculated arithmetic average of the spring stiffness φ20 mm and the unloaded length H0 = 15 mm, see Table 2, takes the value sscom = 83.7 N·mm-1, in [34] it is stated that ss = 94 N·mm-1, which implies that sscom [N·mm-1] is 89.0% of ss [N·mm-1].
The arithmetic diameter of the spring stiffness φ20 mm and the length in the unloaded state H0 = 20 mm, see Table 3, takes the value sscom = 80.8 N·mm-1, in [34] it is given as ss = 52 N·mm-1, which implies that sscom [N·mm-1] is 155.4% of ss [N·mm-1].
The arithmetic diameter of the spring stiffness φ20 mm and the length in the unloaded state H0 = 25 mm, see Table 4, takes the value sscom = 48.6 N·mm-1, in [34] it is given as ss = 50 N·mm-1, which implies that sscom [N·mm-1] is 97.2% of ss [N·mm-1].
The arithmetic diameter of the spring stiffness φ25 mm and the length in the unloaded state H0 = 15 mm, see Table 5, takes the value sscom = 135.9 N·mm-1, in [34] it is given as ss = 183 N·mm-1, which implies that sscom [N·mm-1] is 74.3% of ss [N·mm-1].
The arithmetic diameter of the spring stiffness φ25 mm and the length in the unloaded state H0 = 20 mm, see Table 6, takes the value sscom = 87.9 N·mm-1, in [34] it is given as ss = 120 N·mm-1, which implies that sscom [N·mm-1] is 73.3% of ss [N·mm-1].
The arithmetic diameter of the spring stiffness φ25 mm and the length in the unloaded state H0 = 25 mm, see Table 7, takes the value sscom = 71.7 N·mm-1, in [34] it is given as ss = 108 N·mm-1, which implies that sscom [N·mm-1] is 66.4% of ss [N·mm-1].
The arithmetic diameter of the spring stiffness φ25 mm and the length in the unloaded state H0 = 30 mm, see Table 8, takes the value sscom = 57.3 N·mm-1, in [34] it is given as ss = 75 N·mm-1, which implies that sscom [N·mm-1] is 76.4% of ss [N·mm-1].
In Table 9 to Table 12, the stiffnesses of the rubber spring sscom,i [N·mm-1] φ20mm and φ25 mm are calculated from the measured values of the compressive forces of the tension pressure sensor C9B acting on the rubber spring Fcom,i [N] and its elastic deformation Li [m] during compression.
The arithmetic average of the spring stiffness φ20 mm and the unloaded length H0 = 15 mm calculated from the measured values, see Table 9, takes the value sscom = 83.3 N·mm-1, and in [34] it is given as ss = 94 N·mm-1, which implies that sscom [N·mm-1] is 88.6% of ss [N·mm-1].
The arithmetic diameter of the spring stiffness φ20 mm and the length in the unloaded state H0 = 20 mm, see Table 10, takes the value sscom = 88.6 N·mm-1, in [34] it is given as ss = 52 N·mm-1, which implies that sscom [N·mm-1] is 171% of ss [N·mm-1].
The arithmetic diameter of the spring stiffness φ20 mm and the length in the unloaded state H0 = 25 mm, see Table 10, takes the value sscom = 52.2 N·mm-1, in [34] it is given as ss = 50 N·mm-1, which implies that sscom [N·mm-1] is 104.4% of ss [N·mm-1].
The arithmetic diameter of the spring stiffness φ25 mm and the length in the unloaded state H0 = 15 mm, see Table 11, takes the value sscom = 162.1 N·mm-1, in [34] it is given as ss = 183 N·mm-1, which implies that sscom [N·mm-1] is 88.6% of ss [N·mm-1].
The arithmetic diameter of the spring stiffness φ25 mm and the length in the unloaded state H0 = 20 mm, see Table 11, takes the value sscom = 94.6 N·mm-1, in [34] it is given as ss = 120 N·mm-1, which implies that sscom [N·mm-1] is 78.8% of ss [N·mm-1].
The arithmetic diameter of the spring stiffness φ25 mm and the length in the unloaded state H0 = 25 mm, see Table 12, takes the value sscom = 75 N·mm-1, in [34] it is given as ss = 108 N·mm-1, which implies that sscom [N·mm-1] is 96.4% of ss [N·mm-1].
The arithmetic diameter of the spring stiffness φ25 mm and the length in the unloaded state H0 = 30 mm, see Table 11, takes the value sscom = 65.3 N·mm-1, in [34] it is given as ss = 75 N·mm-1, which implies that sscom [N·mm-1] is 87.1% of ss [N·mm-1].
The measured values given in Table 1 to Table 12 show that the stiffnesses of rubber springs sscom,i [N·mm-1]are lower (except for the rubber spring φ20 mm in length in the unloaded state H0 = 20 mm, see Table 3 and Table 10 and H0 = 25 mm, see Table 11) than the stiffness values of rubber springs of identical dimensions given in [34].
It is known that in the case of a linear spring, the resistance of the spring to compression increases linearly with increasing load. Progressive springs, which include rubber springs, first change their resistance to compression slowly with increasing load and then more steeply, i.e. parabolically. It follows that the stiffness of a progressive spring is not a constant, but changes (increases) depending on its compression.
It is therefore not possible to define the stiffness of a rubber spring as a constant, as is stated for example in [45]. From the measured values of the compressive forces (linear data set) Fcom,i [N] during compression of the rubber springs, linear trend lines were plotted in Microsoft Excel, see Figure 8. The trend line is the function that best describes the data, it is a linear function, the graphical presentation of which is a straight line. The trend line function is found by the least squares method. It can be seen from Figure 8 that the smaller diameter rubber springs (D = 20 mm) exhibit lower stiffness relative to the larger diameter rubber springs (D = 25 mm). It is also true that shorter length rubber springs have a higher stiffness than longer length rubber springs of the same diameter. Rubber springs of shorter lengths can be subjected to less maximum compression and more maximum load than rubber springs of longer length of the same diameter.
Sensors applied to an actual working vibration machine are able to control its working activity or to control certain technical parameters to a certain extent. In the case of vibration machines, sensors can, for example, detect the load applied to the springs that support the trough/sorting screens. The correct operation of a particular vibration machine can be monitored automatically from the detection of spring stiffnesses determined precisely in advance in the laboratory (e.g. according to the procedure described in Chapter 3 of this paper). In vibrating machines, the instantaneous values of the compressive forces acting on the springs can be measured during their working operations and the amount of conveyed/sorted material on the trough/sorting surface can be tracked according to the applied load.
5. Conclusions
Measuring the characteristics of rubber springs is an important process that involves testing not only stiffness and elasticity, but also behaviour under long-term or cyclic loading, which is essential to ensure the reliability and serviceability of springs in various applications.
In this paper, the compressive forces acting on rubber springs during their compression were measured on laboratory equipment using sensors. The relationship between the force acting on the spring and its elastic deformation can be used as an input value for control, diagnosis and monitoring of vibrating machines. Vibrating machines in the form of vibrating conveyors or sorters, using an electromagnetic vibration exciter as the source of excitation force, transmit high frequency vibrations to the substrate. By supporting the trough of vibratory conveyors with rubber springs of suitable stiffness, these springs can capture the high frequency oscillatory motion and attenuate the noise due to the high self-attenuation capability of the rubber.
The measurements carried out in a laboratory at the Department of Machine and Industrial Design, Faculty of Mechanical Engineering, VSB-Technical University of Ostrava confirmed the progressivity of the rubber springs. The progressivity of a spring can be defined by the fact that its stiffness increases with increasing compression of the spring; the characteristic of the spring is not a straight line but an exponential. It has been shown that at half the compression, a rubber spring has less stiffness than a steel coil spring.
It is an attempt to select the most optimal spring from the actual stiffnesses of the measured rubber springs and use it as a spring to support the trough of a laboratory vibrating conveyor, which uses a single-phase asynchronous vibration motor to excite the trough vibrations. On the vibrating conveyor used in the study, sensors detect and the DEWESoft DS-NET measuring instrument monitor the pressure force acting on a selected number (or all) of the rubber springs supporting the trough of the vibrating conveyor. The electrical signal obtained by the tension pressure sensor will be used as an input parameter (digital input) to administer the automated operation and control of the vibrating conveyor, which fits with the current trend of digitalization and related automation of production known as Industry 4.0.
Author Contributions
Conceptualization, L.H.; methodology, L.H.; software, M.K.; validation, L.K. and J.B.; formal analysis, L.H.; investigation, L.H. and J.S.; resources, J.B.; data curation, J.S.; writing—original draft preparation, L.H.; writing—review and editing, L.H.; visualization, L.H. and E.N.; supervision, L.K.; project administration, L.H.; funding acquisition, L.H. All authors have read and agreed to the published version of the manuscript.
Funding
This research was funded by “Research and innovation of modern processes and technologies in industrial practice”, grant number SP2024/001” and was funded by MŠMT ČR (Ministry of education youth and sports).
Data Availability Statement
Measured data of force values Fcom,i [N], listed from Table 9 to Table 12 and processed using DEWESoft® X2 SP5X software and measured data of pressure forces Fcom,i [N], listed from Table 1 to Table 12 and processed using DEWESoft X software, can be sent in case of interest, by prior written agreement, in *.XLSX (Microsoft Excel) format.
Conflicts of Interest
The authors declare no conflict of interest. The funders had no role in the design of the study; in the collection, analyses, or interpretation of data; in the writing of the manuscript; or in the decision to publish the results.
References
- Lasi, H.; Fettke, P.; Kemper, H.G.; Feld, T.; Hoffmann, M. Industry 4.0. Business & information systems engineering, 2014, Volume 6, pp. 239–242.
- Ghobakhloo, M. Industry 4.0, digitization, and opportunities for sustainability. Journal of cleaner production, 2020; 252, 119869.
- Devezas, T.; Sarygulov, A. Industry 4.0, 2017 Basel: Springer.
- Hrabovský, L.; Dluhoš, D. Calibration of Transducers and of a Coil Compression Spring Constant on the Testing Equipment Simulating the Process of a Pallet Positioning in a Rack Cell. Open Eng. 2019, 9, 631–640. [Google Scholar] [CrossRef]
- Zurovec, D.; Hlosta, J.; Gelnar, D.; Necas, J.; Zegzulka, J. The behavior of fly ash on the vibrating vertical conveyor. Inżynieria Mineralna, 2017; Volume 18(1), pp. 183–188.
- Anekar, N.; Ruiwale, V.V.; Nimbalkar, S.; Rao, P. Design and testing of unbalanced mass mechanical vibration exciter. International Journal of Research in Engineering and Technology, 2014; Volume 3(8), pp. 107–112.
- Winkler, G. Analysing the vibrating conveyor. International Journal of Mechanical Sciences, 1978; Volume 20(9), pp. 561–570.
- Electromagnetic Vibrator. Available online: https://syntronmh.com/en/products/electromagnetic-vibrator (accessed on 3 January 2024).
- Simsek, E.; Wirtz, S.; Scherer, V.; Kruggel-Emden, H.; Grochowski, R.; Walzel, P. An Experimental and Numerical Study of Transversal Dispersion of Granular Material on a Vibrating Conveyor. Part. Sci. Technol. 2008, 26, 177–196. [Google Scholar] [CrossRef]
- Vibration motors. Available online: https://www.bevi.com/products/electric-motors/vibration-motors (accessed on 22 March 2024).
- Noga, S.; Skrzat, A.; Stachowicz, F. Dynamic analysis of vibrating screener system. In Journal of Physics: Conference Series 2013; Vol. 451, No. 1, p. 012028. IOP Publishing.
- Feliks, J.; Tomach, P. The Impact of Vibrating Screen Startup Time on Vibration Amplitude and Energy Consumption in Transient State. Energies 2023, 16, 7129. [Google Scholar] [CrossRef]
- Parameswaran, M.; Ganapathy, S. Vibratory conveying—analysis and design: A review. Mech. Mach. Theory 1979, 14, 89–97. [Google Scholar] [CrossRef]
- Despotović. V.; Urukalo, D.; Lečić, M.R.; Ćosić, A. Mathematical modeling of resonant linear vibratory conveyor with electromagnetic excitation: simulations and experimental results. Appl. Math. Model. 2017, 41, 1–24. [Google Scholar] [CrossRef]
- Sloot, E.; Kruyt, N. Theoretical and experimental study of the transport of granular materials by inclined vibratory conveyors. Powder Technol. 1996, 87, 203–210. [Google Scholar] [CrossRef]
- Kipriyanov, F.; Savinykh, P. The results of the study of the vibratory conveying machine operating modes. Transp. Res. Procedia 2022, 63, 721–729. [Google Scholar] [CrossRef]
- Czubak, P. Analysis of the New Solution of the Vibratory Conveyor. Arch. Met. Mater. 2013, 58, 1037–1043. [Google Scholar] [CrossRef]
- Howell, L.L.; Midha, A. Evaluation of equivalent spring stiffness for use in a pseudo-rigid-body model of large-deflection compliant mechanisms. In International Design Engineering Technical Conferences and Computers and Information in Engineering Conference 1994, September; (Vol. 12846, pp. 405-412). American Society of Mechanical Engineers.
- Hrabovský, L. Validation Device for the Stiffness of Cylindrical Coiled Pressure Springs. Acta Mech. Slovaca 2020, 24, 42–48. [Google Scholar] [CrossRef]
- Hrabovský, L.; Molnár, V.; Kotajný, G.; Kuľka, J. Pallet Fixing Lock, Determination of Shear Resistance and Spring Stiffness. Adv. Sci. Technol. Res. J. 2020, 14, 190–197. [Google Scholar] [CrossRef] [PubMed]
- Lefanti, R.; Ando, M.; Sukumaran, J. Fatigue and damage analysis of elastomeric silent block in light aircrafts. Mater. Des. 2013, 52, 384–392. [Google Scholar] [CrossRef]
- Ziobro, J. ANALYSIS OF SUSPENSION ELEMENT OF CAR BODY ON THE EXAMPLE SILENTBLOCK. Adv. Sci. Technol. Res. J. 2015, 9, 125–129. [Google Scholar] [CrossRef] [PubMed]
- Öztürk, B.; Kara, F. Finite Element-Based Simulation of Cooling Rate on the Material Properties of an Automobile Silent Block. Adv. Mater. Sci. Eng. 2020, 2020. [Google Scholar] [CrossRef]
- Fedotov, А.I.; Tikhov-Tinnikov, D.А.; Baradiev, V.S. Simulation of process of functioning silent blocks of car suspension. In International Conference" Aviamechanical engineering and transport"2018, May; (AVENT 2018) (pp. 135-140). Atlantis Press.
- Hatekar, H.; Anthonysamy, B.; Saishanker, V.; Pavuluri, L.; Pahwa, G.S. Silent block bush design and optimization for pick-up truck leaf spring 2017; (No. 2017-01-0455). SAE Technical Paper.
- Misol, M.; Algermissen, S.; Monner, H.P. Experimental study of an active window for silent and comfortable vehicle cabins. In Adaptive, tolerant and efficient composite structures 2012; (pp. 439-447). Berlin, Heidelberg: Springer Berlin Heidelberg.
- Luo, R.; Wu, W. Fatigue failure analysis of anti-vibration rubber spring. Eng. Fail. Anal. 2006, 13, 110–116. [Google Scholar] [CrossRef]
- Berg, M. A Non-Linear Rubber Spring Model for Rail Vehicle Dynamics Analysis. Veh. Syst. Dyn. 1998, 30, 197–212. [Google Scholar] [CrossRef]
- Luo, R.; Shi, H.; Guo, J.; Huang, L.; Wang, J. A nonlinear rubber spring model for the dynamics simulation of a high-speed train. Veh. Syst. Dyn. 2019, 58, 1367–1384. [Google Scholar] [CrossRef]
- Shi, H.; Wu, P. A nonlinear rubber spring model containing fractional derivatives for use in railroad vehicle dynamic analysis. Proc. Inst. Mech. Eng. Part F: J. Rail Rapid Transit 2016, 230, 1745–1759. [Google Scholar] [CrossRef]
- Austin, J. , Schepelmann, A., & Geyer, H. Control and evaluation of series elastic actuators with nonlinear rubber springs. In 2015 IEEE/RSJ International Conference on Intelligent Robots and Systems (IROS). 2015, September; (pp. 6563-6568). IEEE.
- Hsieh, W.-H.; Tsai, C.-H. Design and Analysis of a Novel Vibrating Conveyor. Adv. Sci. Lett. 2012, 9, 62–67. [Google Scholar] [CrossRef]
- Rade, D.A.; De Albuquerque, E.B.; Figueira, L.C.; Carvalho, J.C.M. Piezoelectric Driving of Vibration Conveyors: An Experimental Assessment. Sensors 2013, 13, 9174–9182. [Google Scholar] [CrossRef] [PubMed]
- Silent block ELESA a GANTER. Available online: https://www.elesa-ganter.cz/static/catalogues/files/Silentbloky.pdf (accessed on 16. June 2023).
- DST-220A Digital Force Gauge. Available online: https://imada.com/products/dst-220a-digital-force-gauge/ (accessed on 21 July 2023).
- C9C - miniature pressure sensor. Available online: https://www.hbm.cz/en/produkty/kategorie/c9c/ (accessed on 13 May 2023).
- Positioning systems manually operated. Available online: https://mnsystems.cz/images/mm/Katalog/02_pt-system_19-07-10_dt-eng_katalog-mme_1.pdf (accessed on 28 November 2024).
- Data Acquisition Software Force Logger Series. Available online: https://www.forcegauge.net/pdf/fl_e.pdf (accessed on 18 February 2022).
- DewesoftX previous releases. Available online: https://dewesoft.com/download/dewesoftx-previous-releases (accessed on 9 June 2023).
- DEWESoft General Catalog. Available online: https://d36j349d8rqm96.cloudfront.net/3/6/Dewesoft-DS-NET-Manual-EN.pdf (accessed on 2 May 2021).
- Madr. V.; Knejzlik, J.; Kopecny, I.; Novotny, I. Fyzikální Měření (In English: Physical Measurement); SNTL: Czech Republic, 1991; p. 304.V. Madr, J, Knejzlik, J. Kopecny and I. Novotny, “Fyzikální měření”, (In English: Physical measurements), SNTL Praha, ISBN 80-03-00266-4, 1991.
- Thaijaroen, W.; Harrison, A. Nonlinear dynamic modelling of rubber isolators using six parameters based on parabolic spring, springpot, and smooth-slip friction element. Polym. Test. 2010, 29, 857–865. [Google Scholar] [CrossRef]
- Moulton, A. E. , & Turner, P. W. (1956). Rubber springs for vehicle suspension. Proceedings of the Institution of Mechanical Engineers: Automobile Division, 10(1), 17-41.
- Sun, B. , Xu, Z., & Zhang, X. (2008). Parametric optimization of rubber spring of construction vehicle suspension. In Global Design to Gain a Competitive Edge: An Holistic and Collaborative Design Approach based on Computational Tools (pp. 571-580). Springer London.
- Cylindrical silent blocks type A (screw/screw). Available online: https://www.rubber.cz/silentbloky-valcove-typ-a (accessed on 2 May 2021).
Figure 1.
Model of vibrating conveyor with asynchronous single-phase vibrating electric motor. 1 - trough, 2 - vibration exciter with unbalanced masses (unbalanced), 3 - silent block, 4 - frame.
Figure 1.
Model of vibrating conveyor with asynchronous single-phase vibrating electric motor. 1 - trough, 2 - vibration exciter with unbalanced masses (unbalanced), 3 - silent block, 4 - frame.
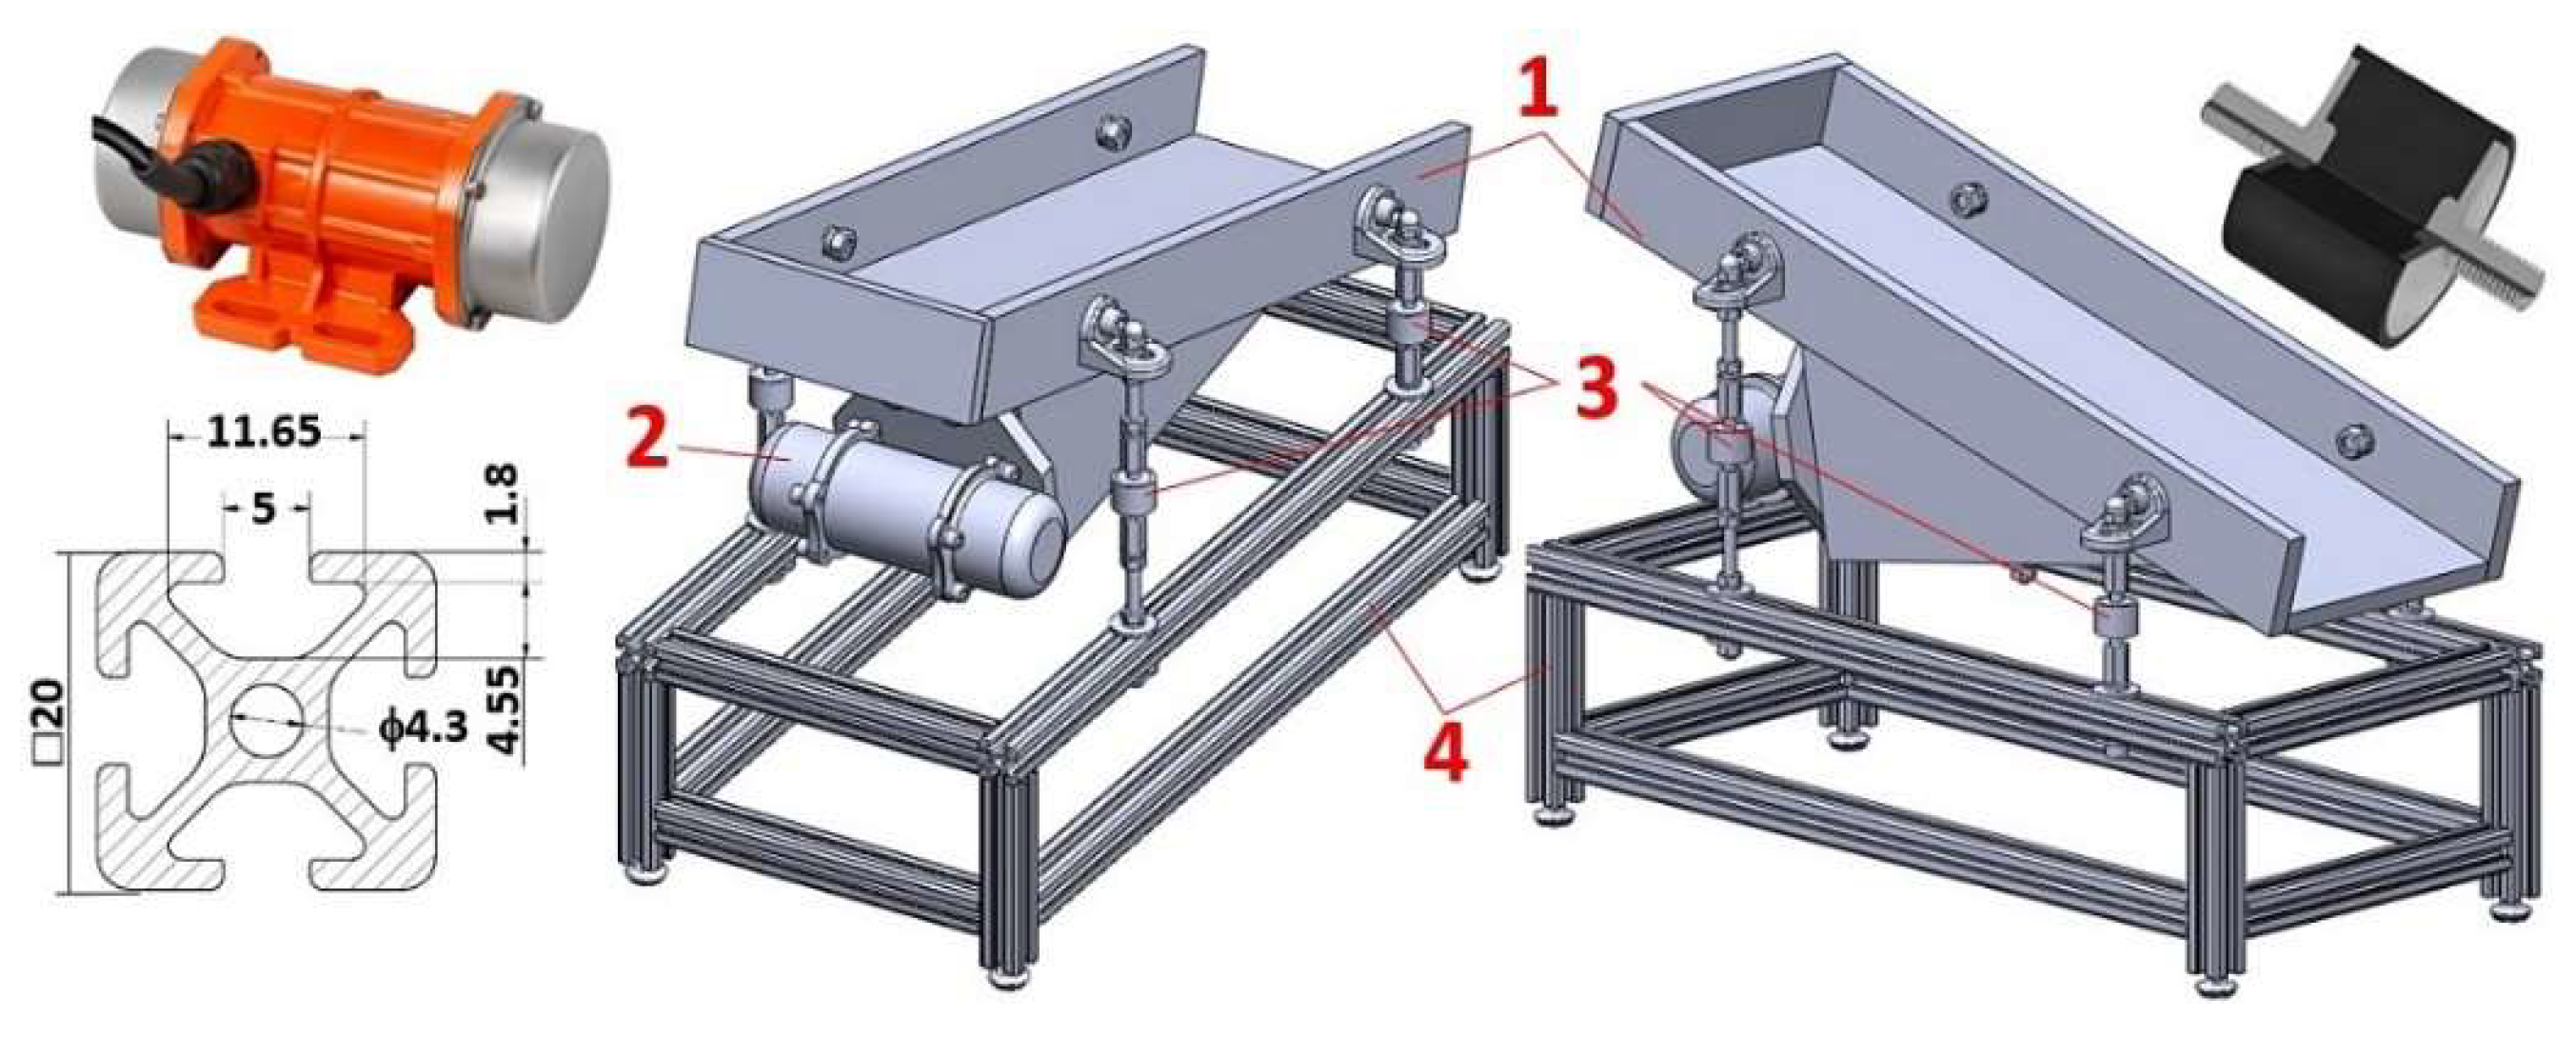
Figure 2.
Laboratory device detecting rubber spring characteristics - Variation 1, (a ) 3D model created in SolidWorks™ Premium 2012´64 SP5.0 software, (b) 2D sketch created in AutoCAD software. 1 - steel frame, 2 - digital force gauge, 3 - silent block, 4 - positioning unit.
Figure 2.
Laboratory device detecting rubber spring characteristics - Variation 1, (a ) 3D model created in SolidWorks™ Premium 2012´64 SP5.0 software, (b) 2D sketch created in AutoCAD software. 1 - steel frame, 2 - digital force gauge, 3 - silent block, 4 - positioning unit.
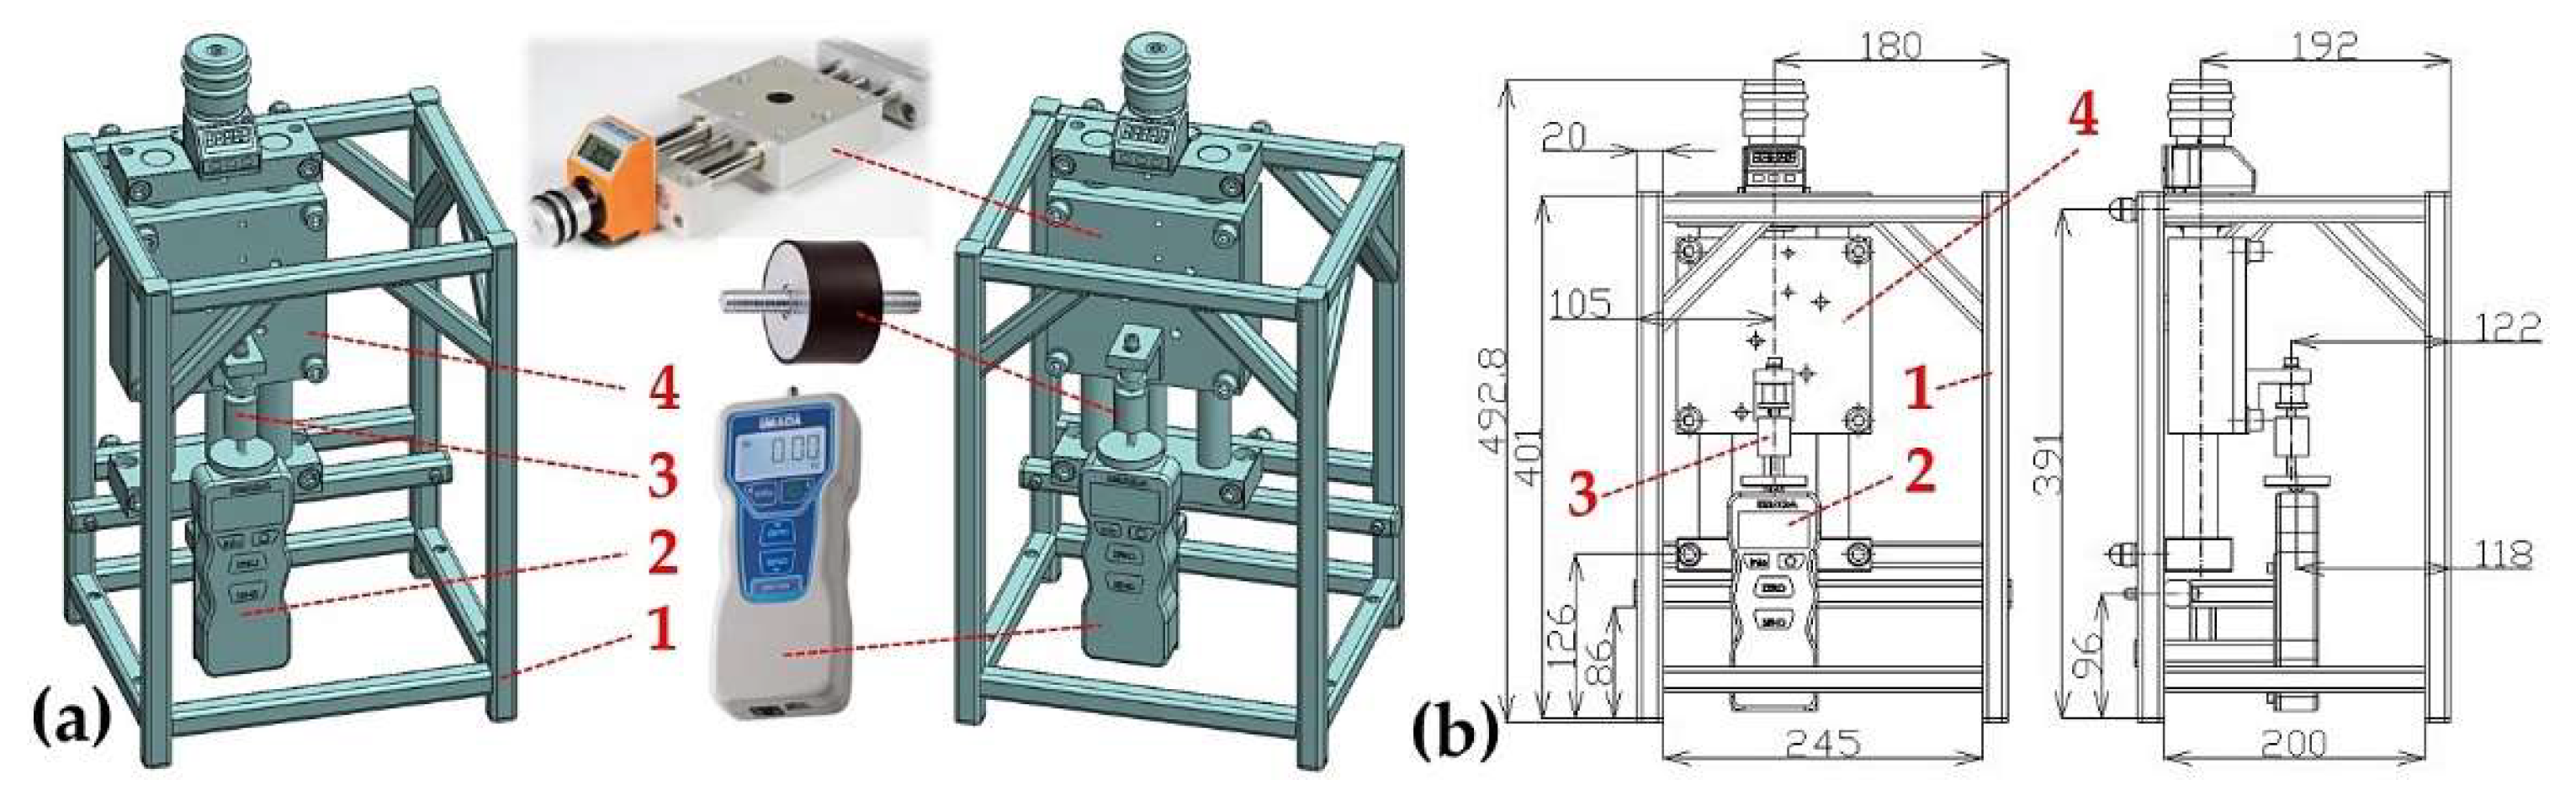
Figure 3.
Laboratory device detecting rubber spring characteristics - Variation 2, (a ) 3D model created in SolidWorks™ Premium 2012´64 SP5.0 software, (b) 2D sketch created in AutoCAD software. 1 - steel frame, 2 - digital force gauge, 3 - silent block, 4 - positioning unit.
Figure 3.
Laboratory device detecting rubber spring characteristics - Variation 2, (a ) 3D model created in SolidWorks™ Premium 2012´64 SP5.0 software, (b) 2D sketch created in AutoCAD software. 1 - steel frame, 2 - digital force gauge, 3 - silent block, 4 - positioning unit.
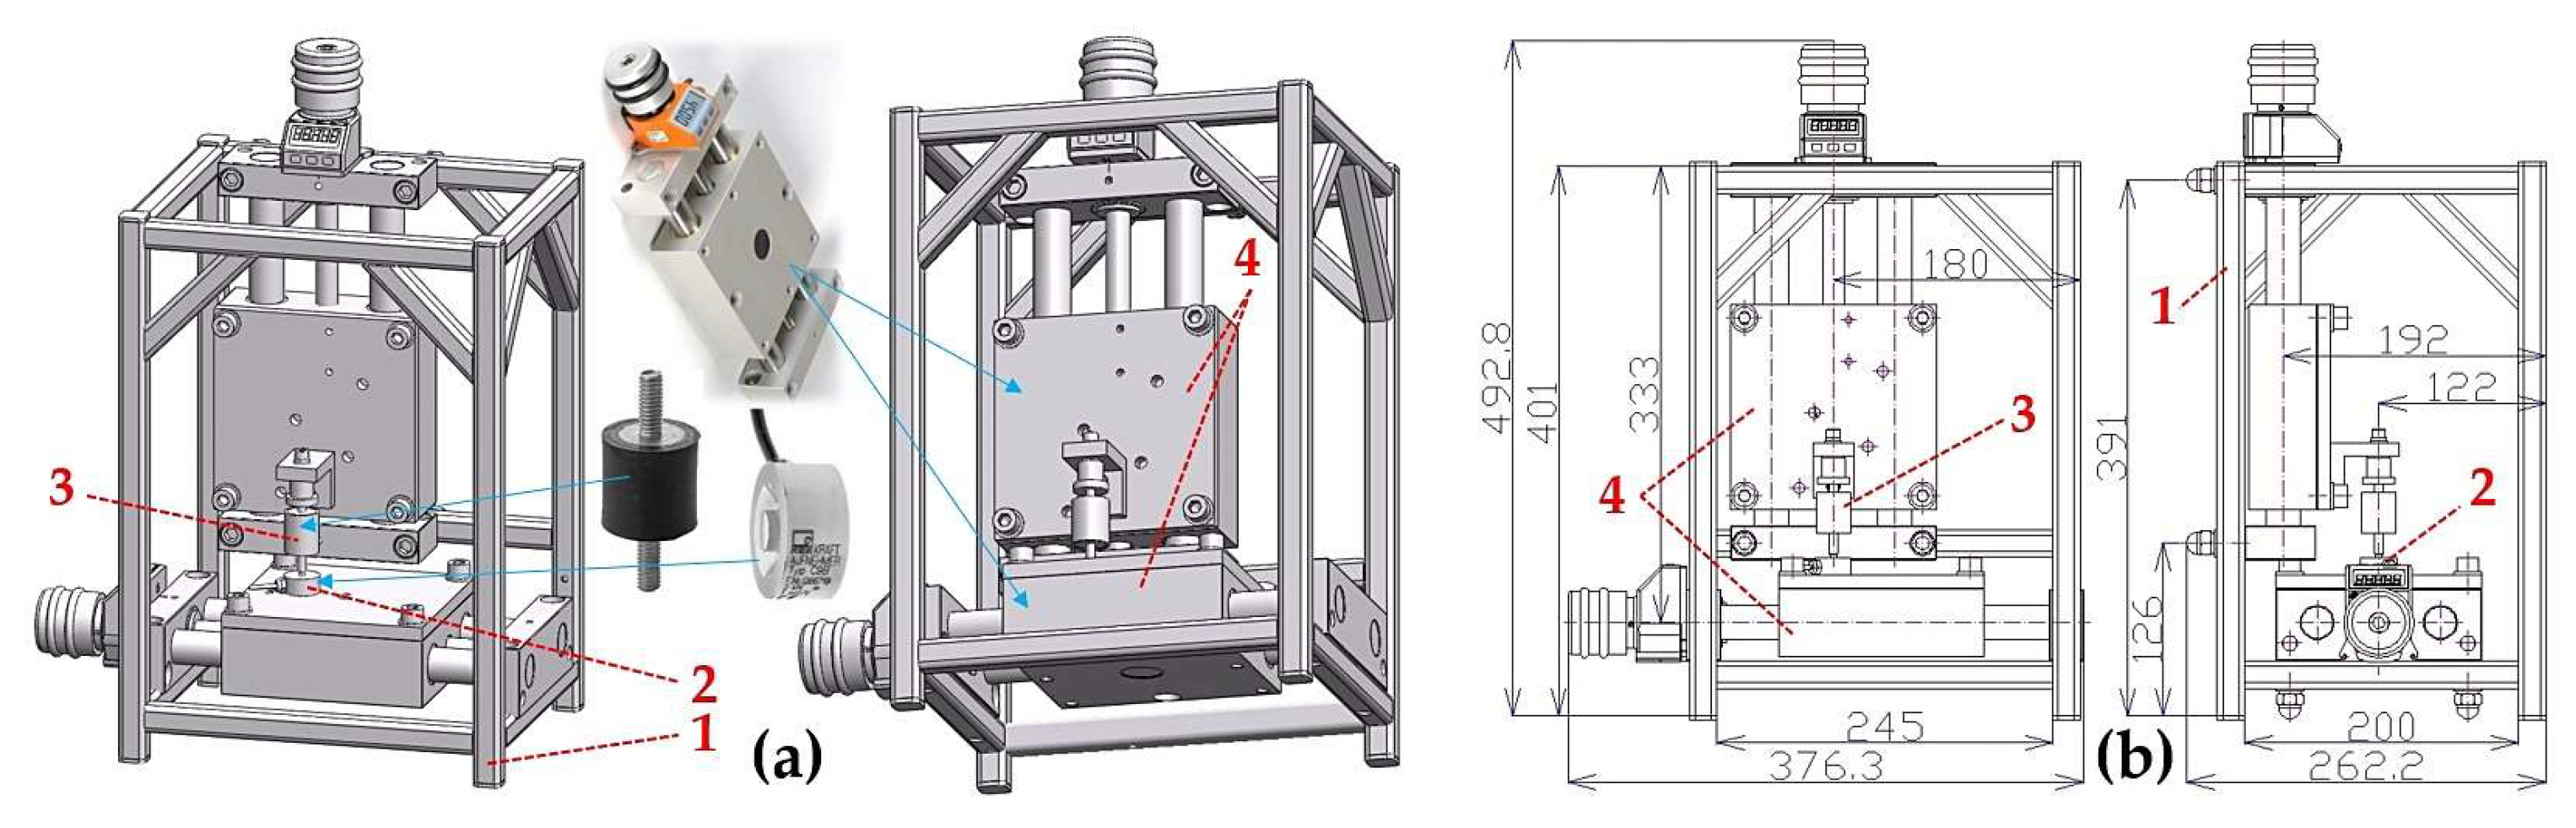
Figure 4.
Measurement chain - a sequence of interconnected instruments and devices enabling the detection and processing of measured signals.
Figure 4.
Measurement chain - a sequence of interconnected instruments and devices enabling the detection and processing of measured signals.
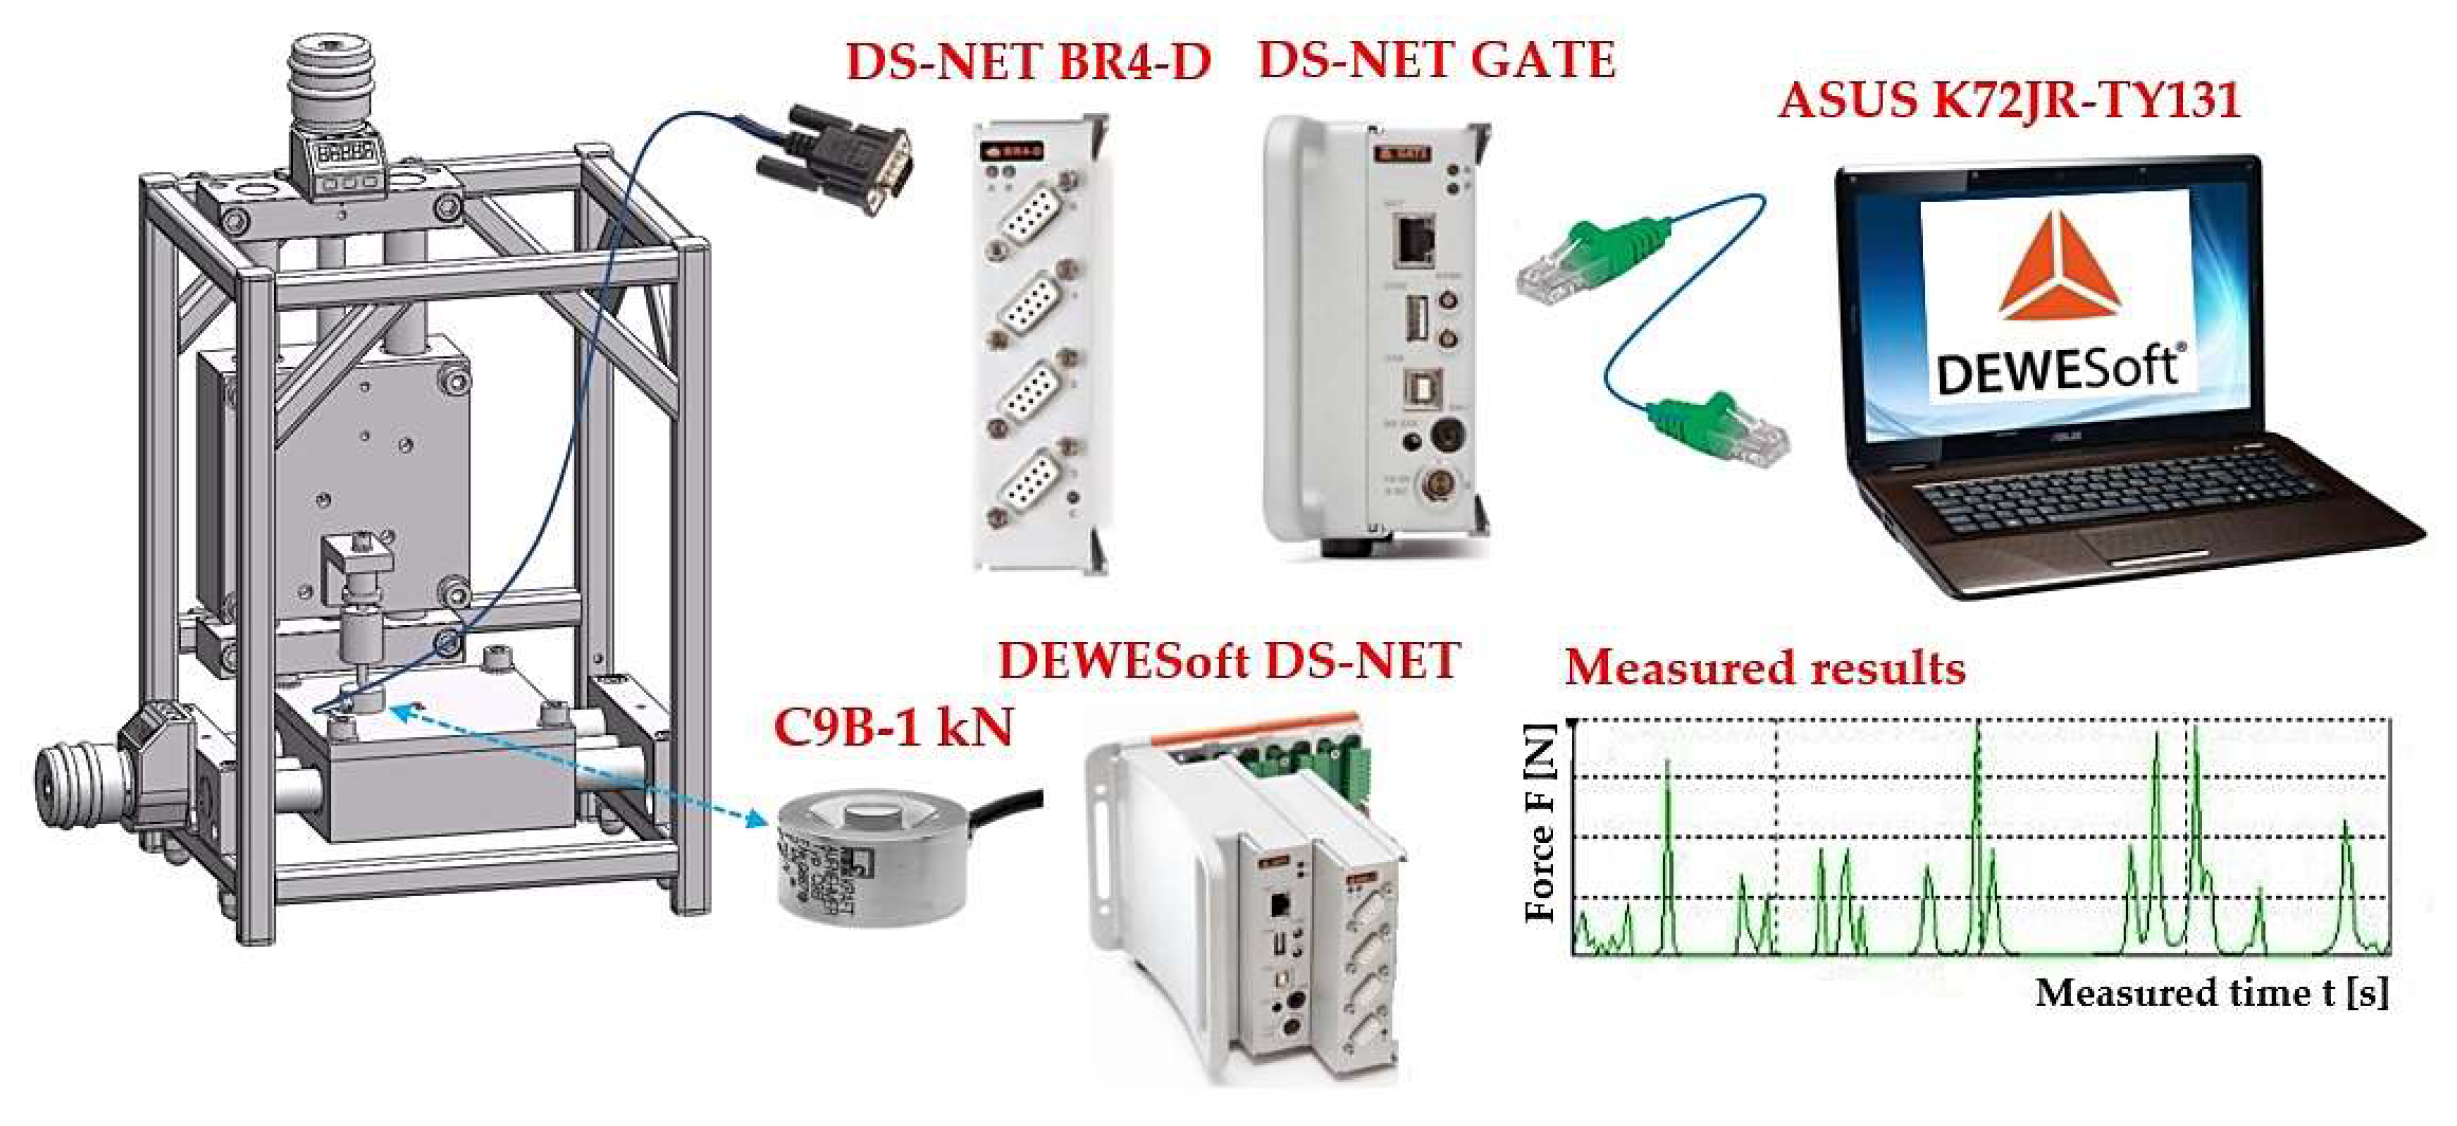
Figure 5.
Measurement of the rubber spring compressive force with (a) digital force gauge DST-220A, (b) tension pressure sensor C9B-1 kN.
Figure 5.
Measurement of the rubber spring compressive force with (a) digital force gauge DST-220A, (b) tension pressure sensor C9B-1 kN.
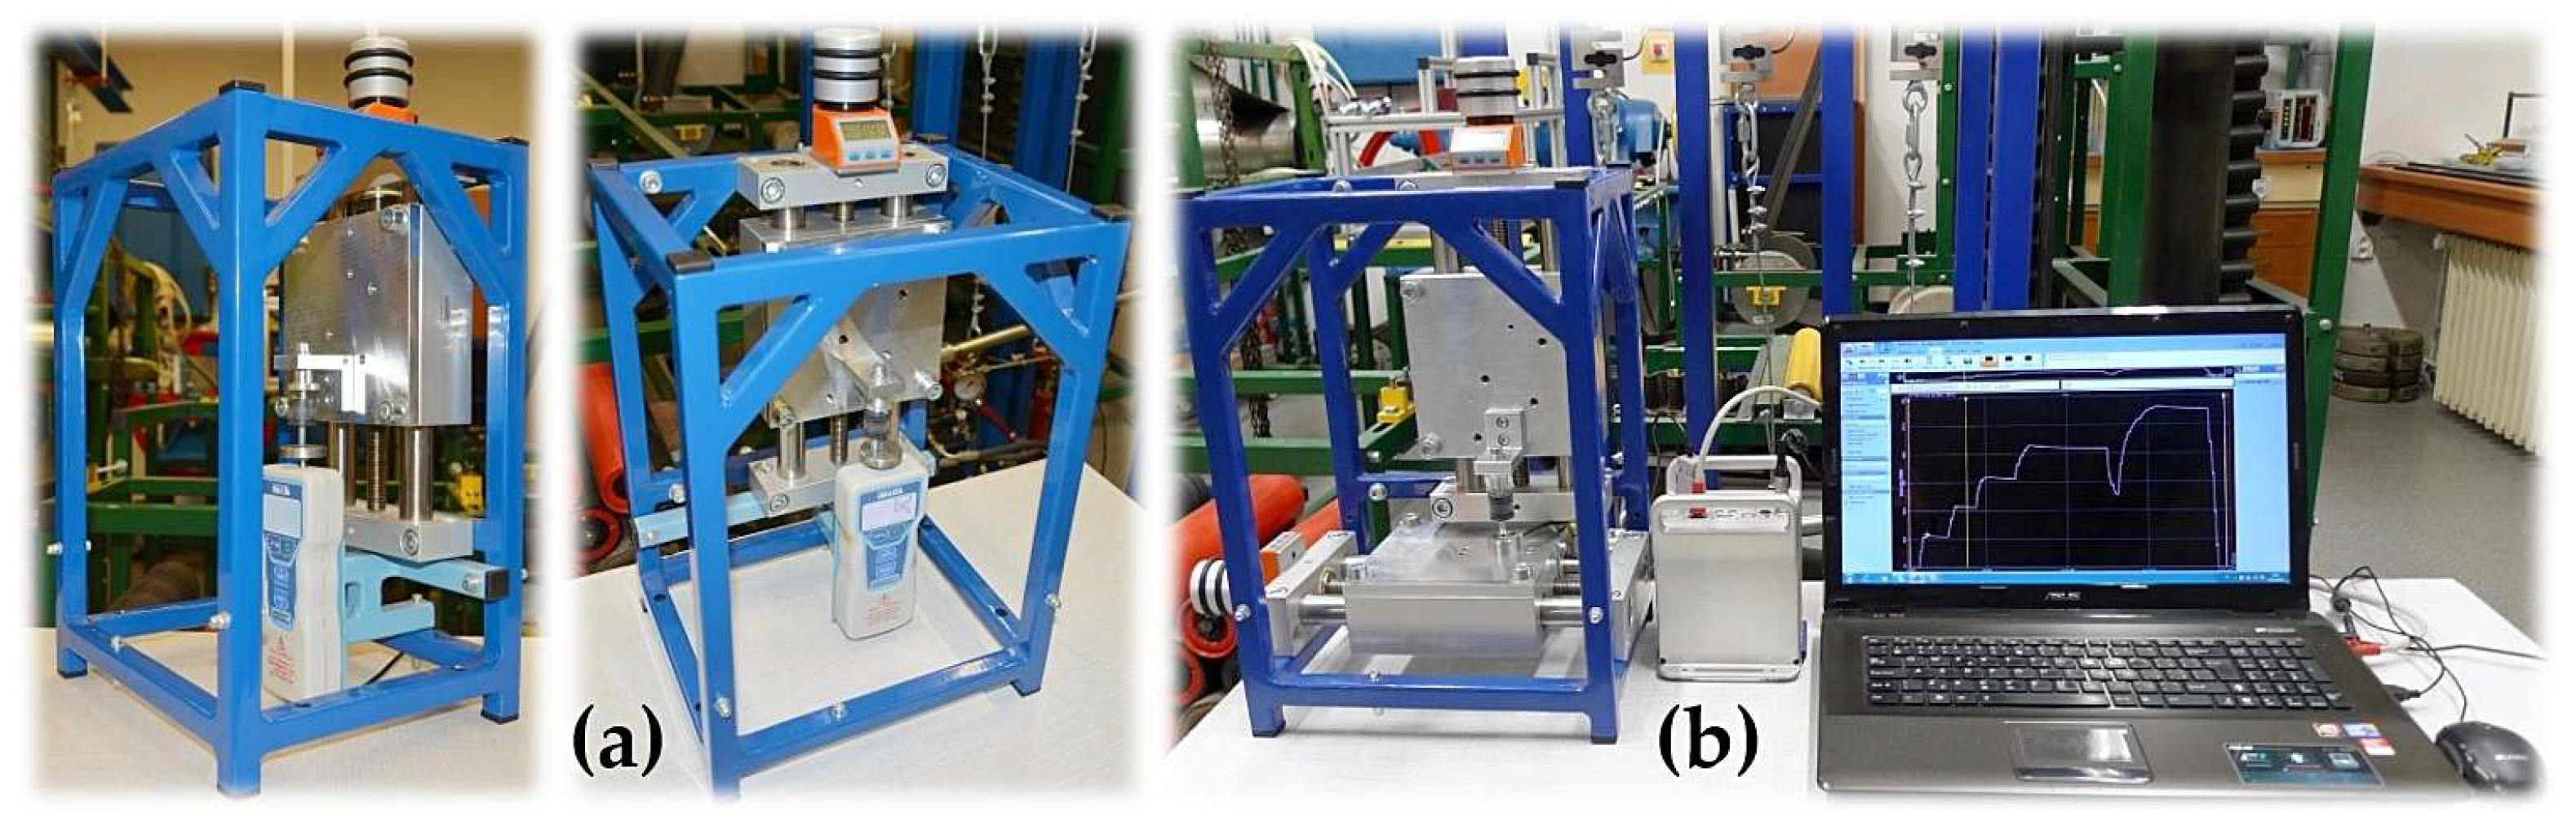
Figure 8.
Equation of the trend lines of the measured forces acting on the silent blocks during elastic deformation.
Figure 8.
Equation of the trend lines of the measured forces acting on the silent blocks during elastic deformation.
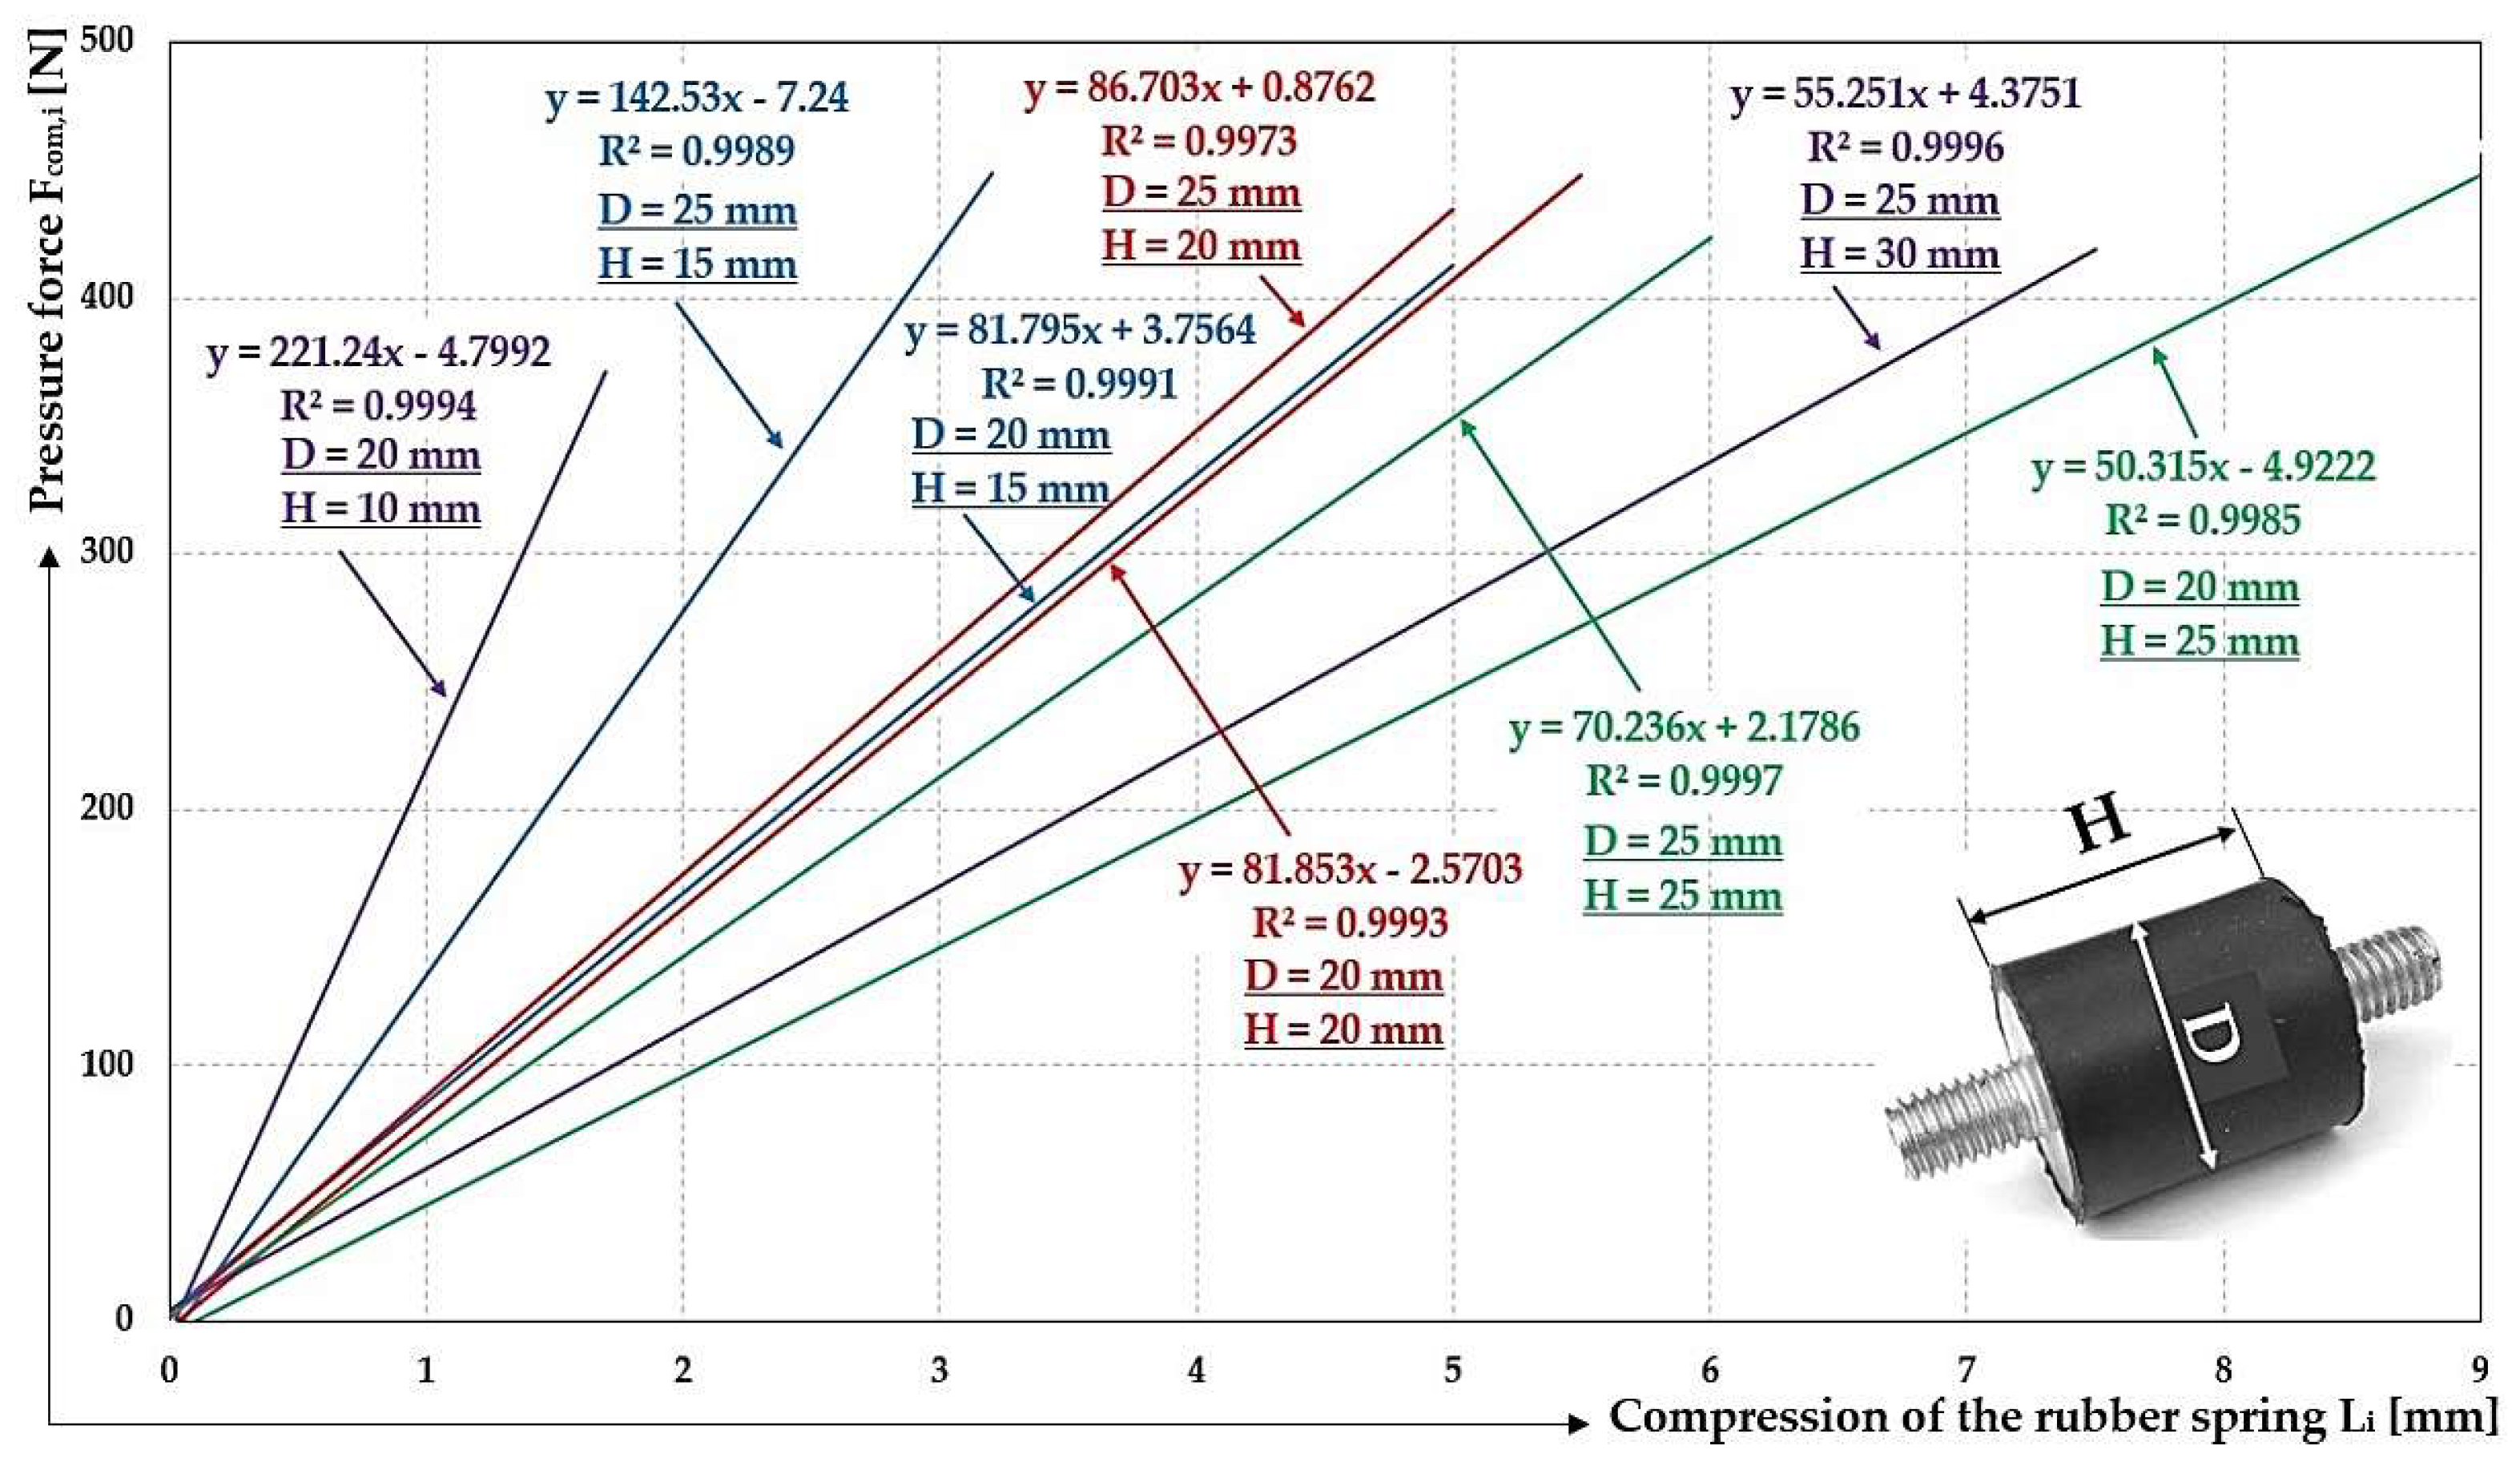
Figure 9.
Measured values of the compressive force Fcom,3 [N] at compression Li [mm] of a rubber spring of diameter D = 20 mm, with length in unloaded state H0 = 10 mm.
Figure 9.
Measured values of the compressive force Fcom,3 [N] at compression Li [mm] of a rubber spring of diameter D = 20 mm, with length in unloaded state H0 = 10 mm.
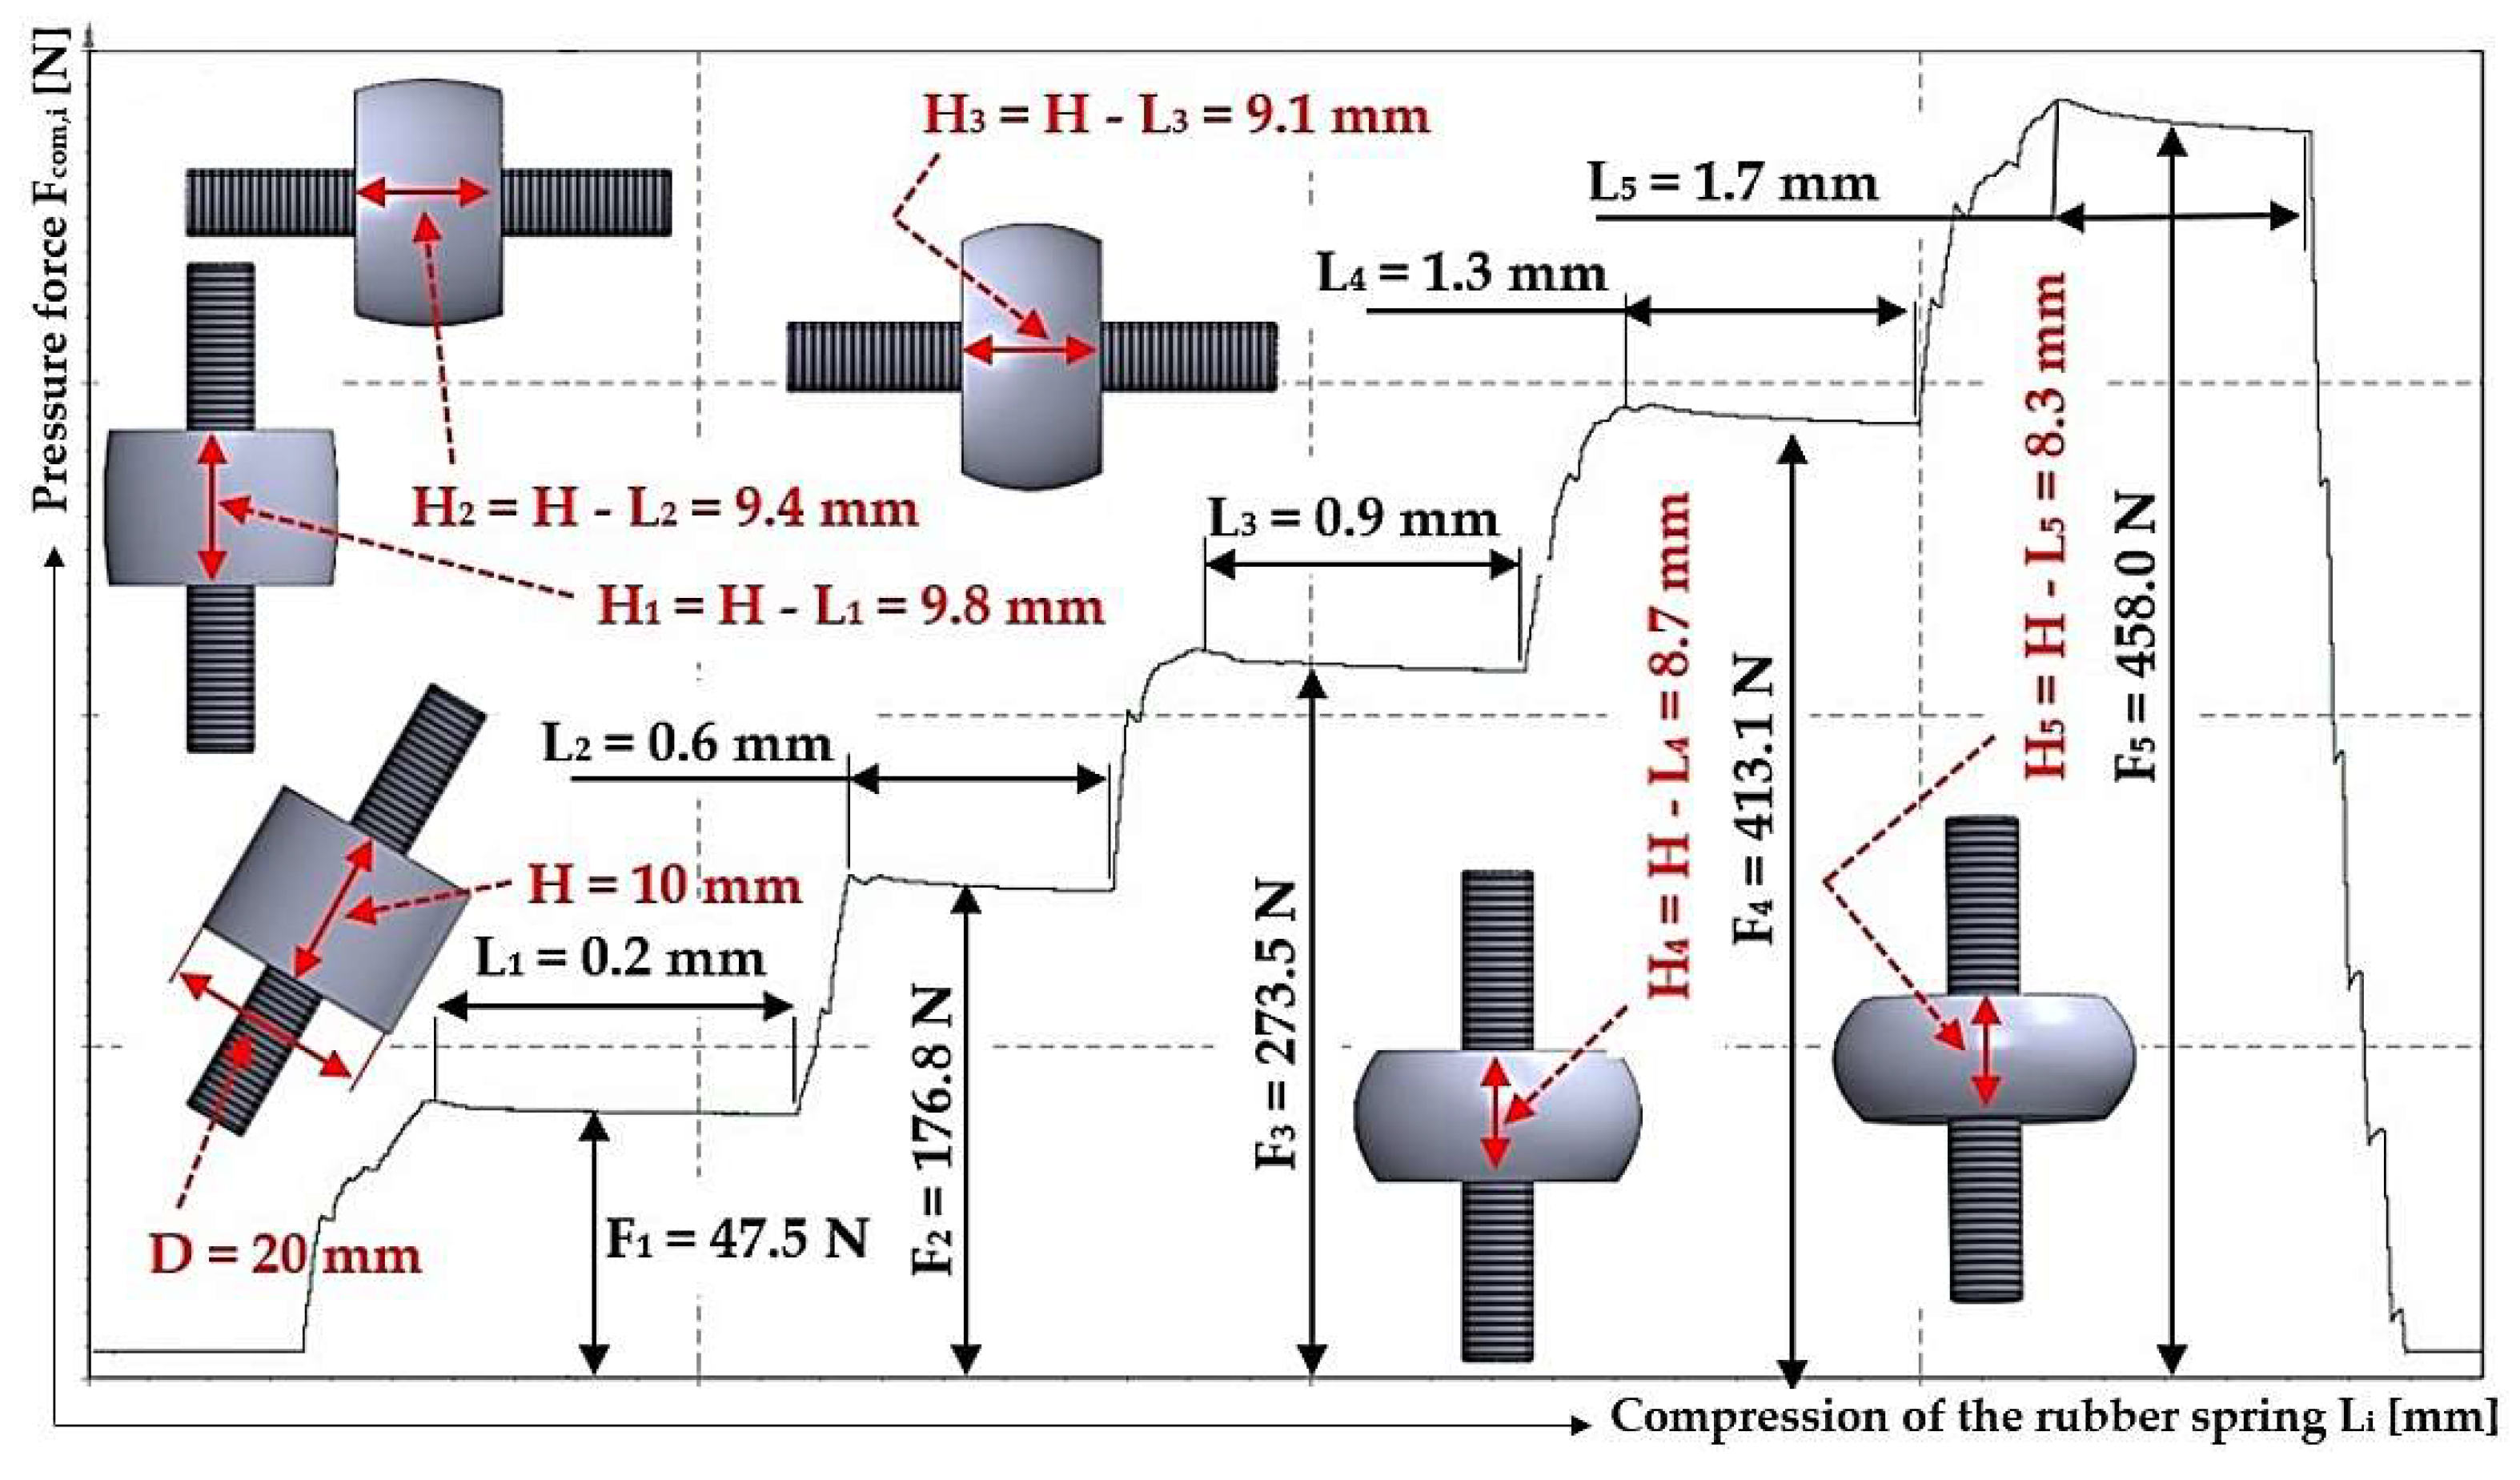
Figure 14.
Measured values of compressive forces Fcom,i [N] of rubber spring D = 20 mm by digital force gauge DST-220A (solid curves) and tension pressure sensor C9B (dashed curves). Spring length in unloaded state H0 [mm] () 10, () 15, () 20, () 25.
) 10, () 15, () 20, () 25.
Figure 14.
Measured values of compressive forces Fcom,i [N] of rubber spring D = 20 mm by digital force gauge DST-220A (solid curves) and tension pressure sensor C9B (dashed curves). Spring length in unloaded state H0 [mm] () 10, () 15, () 20, () 25.
) 10, () 15, () 20, () 25.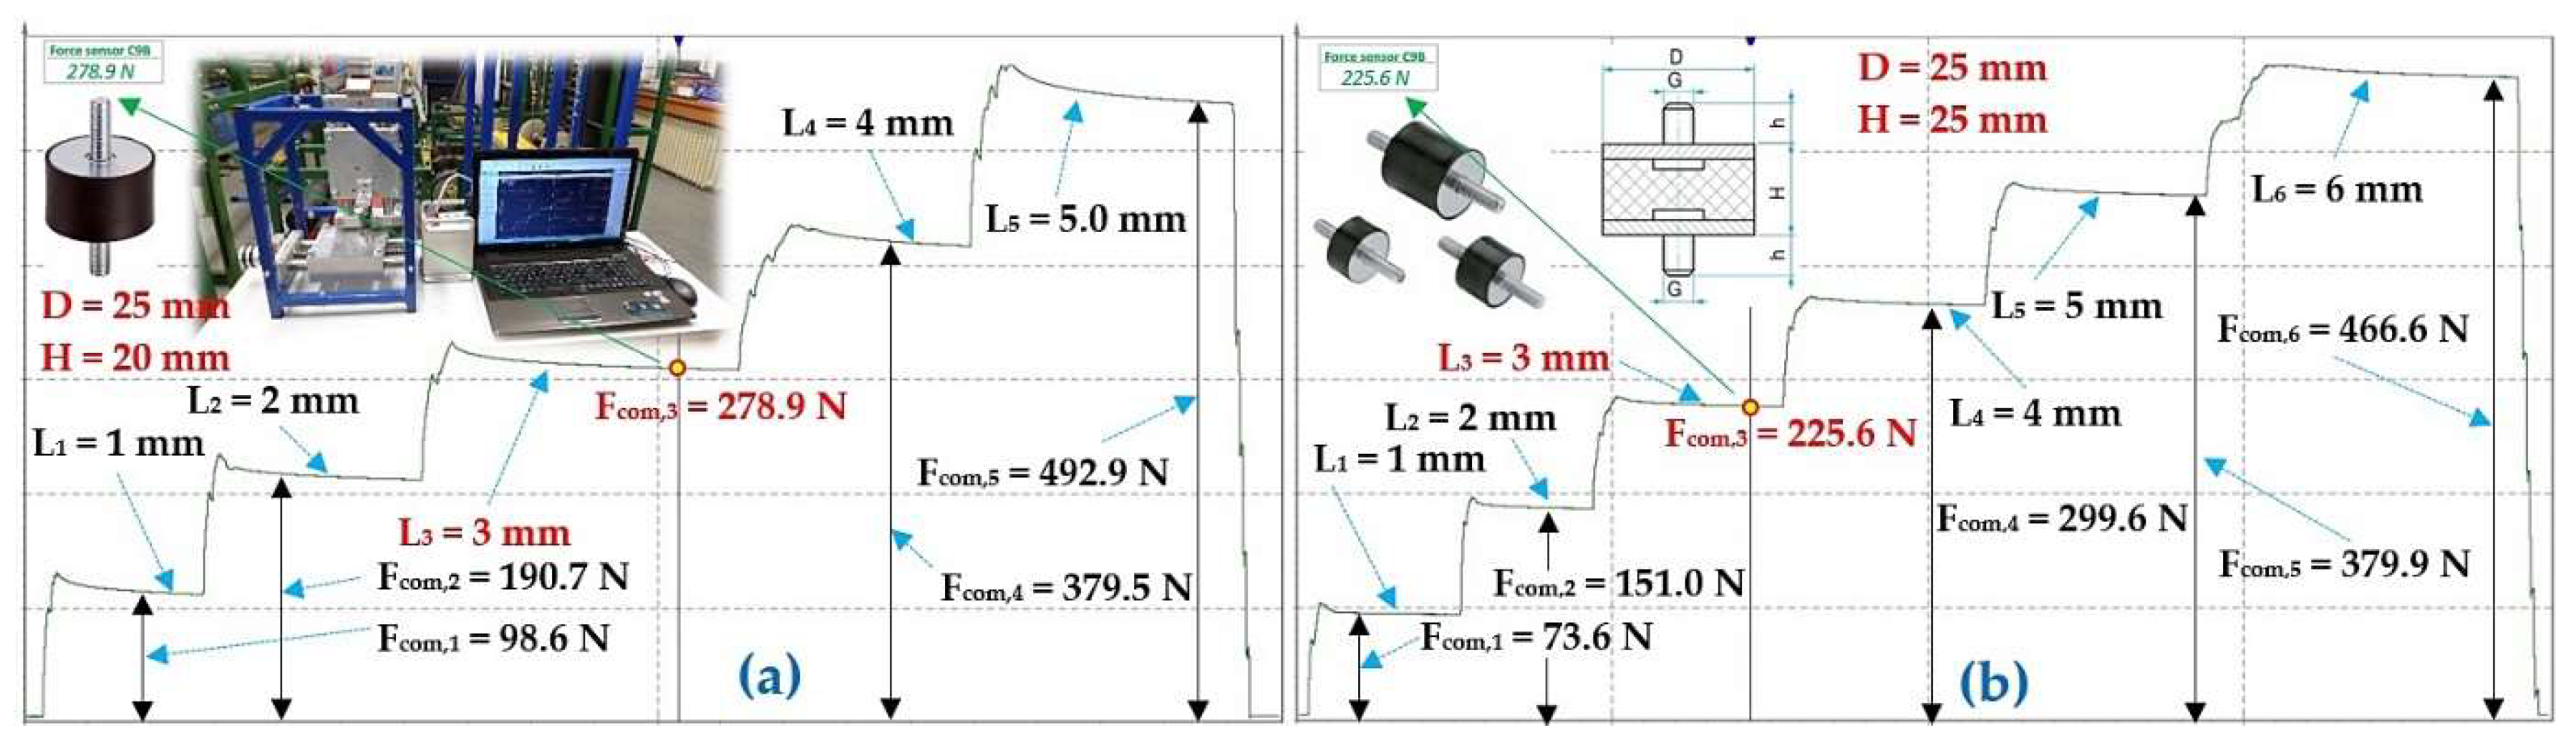
Figure 15.
Measured values of compressive forces Fcom,i [N] of rubber spring D = 25 mm by digital force gauge DST-220A (solid curves) and tension pressure sensor C9B (dashed curves). Spring length in unloaded state H0 [mm] () 15, () 20, () 25, () 30.
) 15, () 20, () 25, () 30.
Figure 15.
Measured values of compressive forces Fcom,i [N] of rubber spring D = 25 mm by digital force gauge DST-220A (solid curves) and tension pressure sensor C9B (dashed curves). Spring length in unloaded state H0 [mm] () 15, () 20, () 25, () 30.
) 15, () 20, () 25, () 30.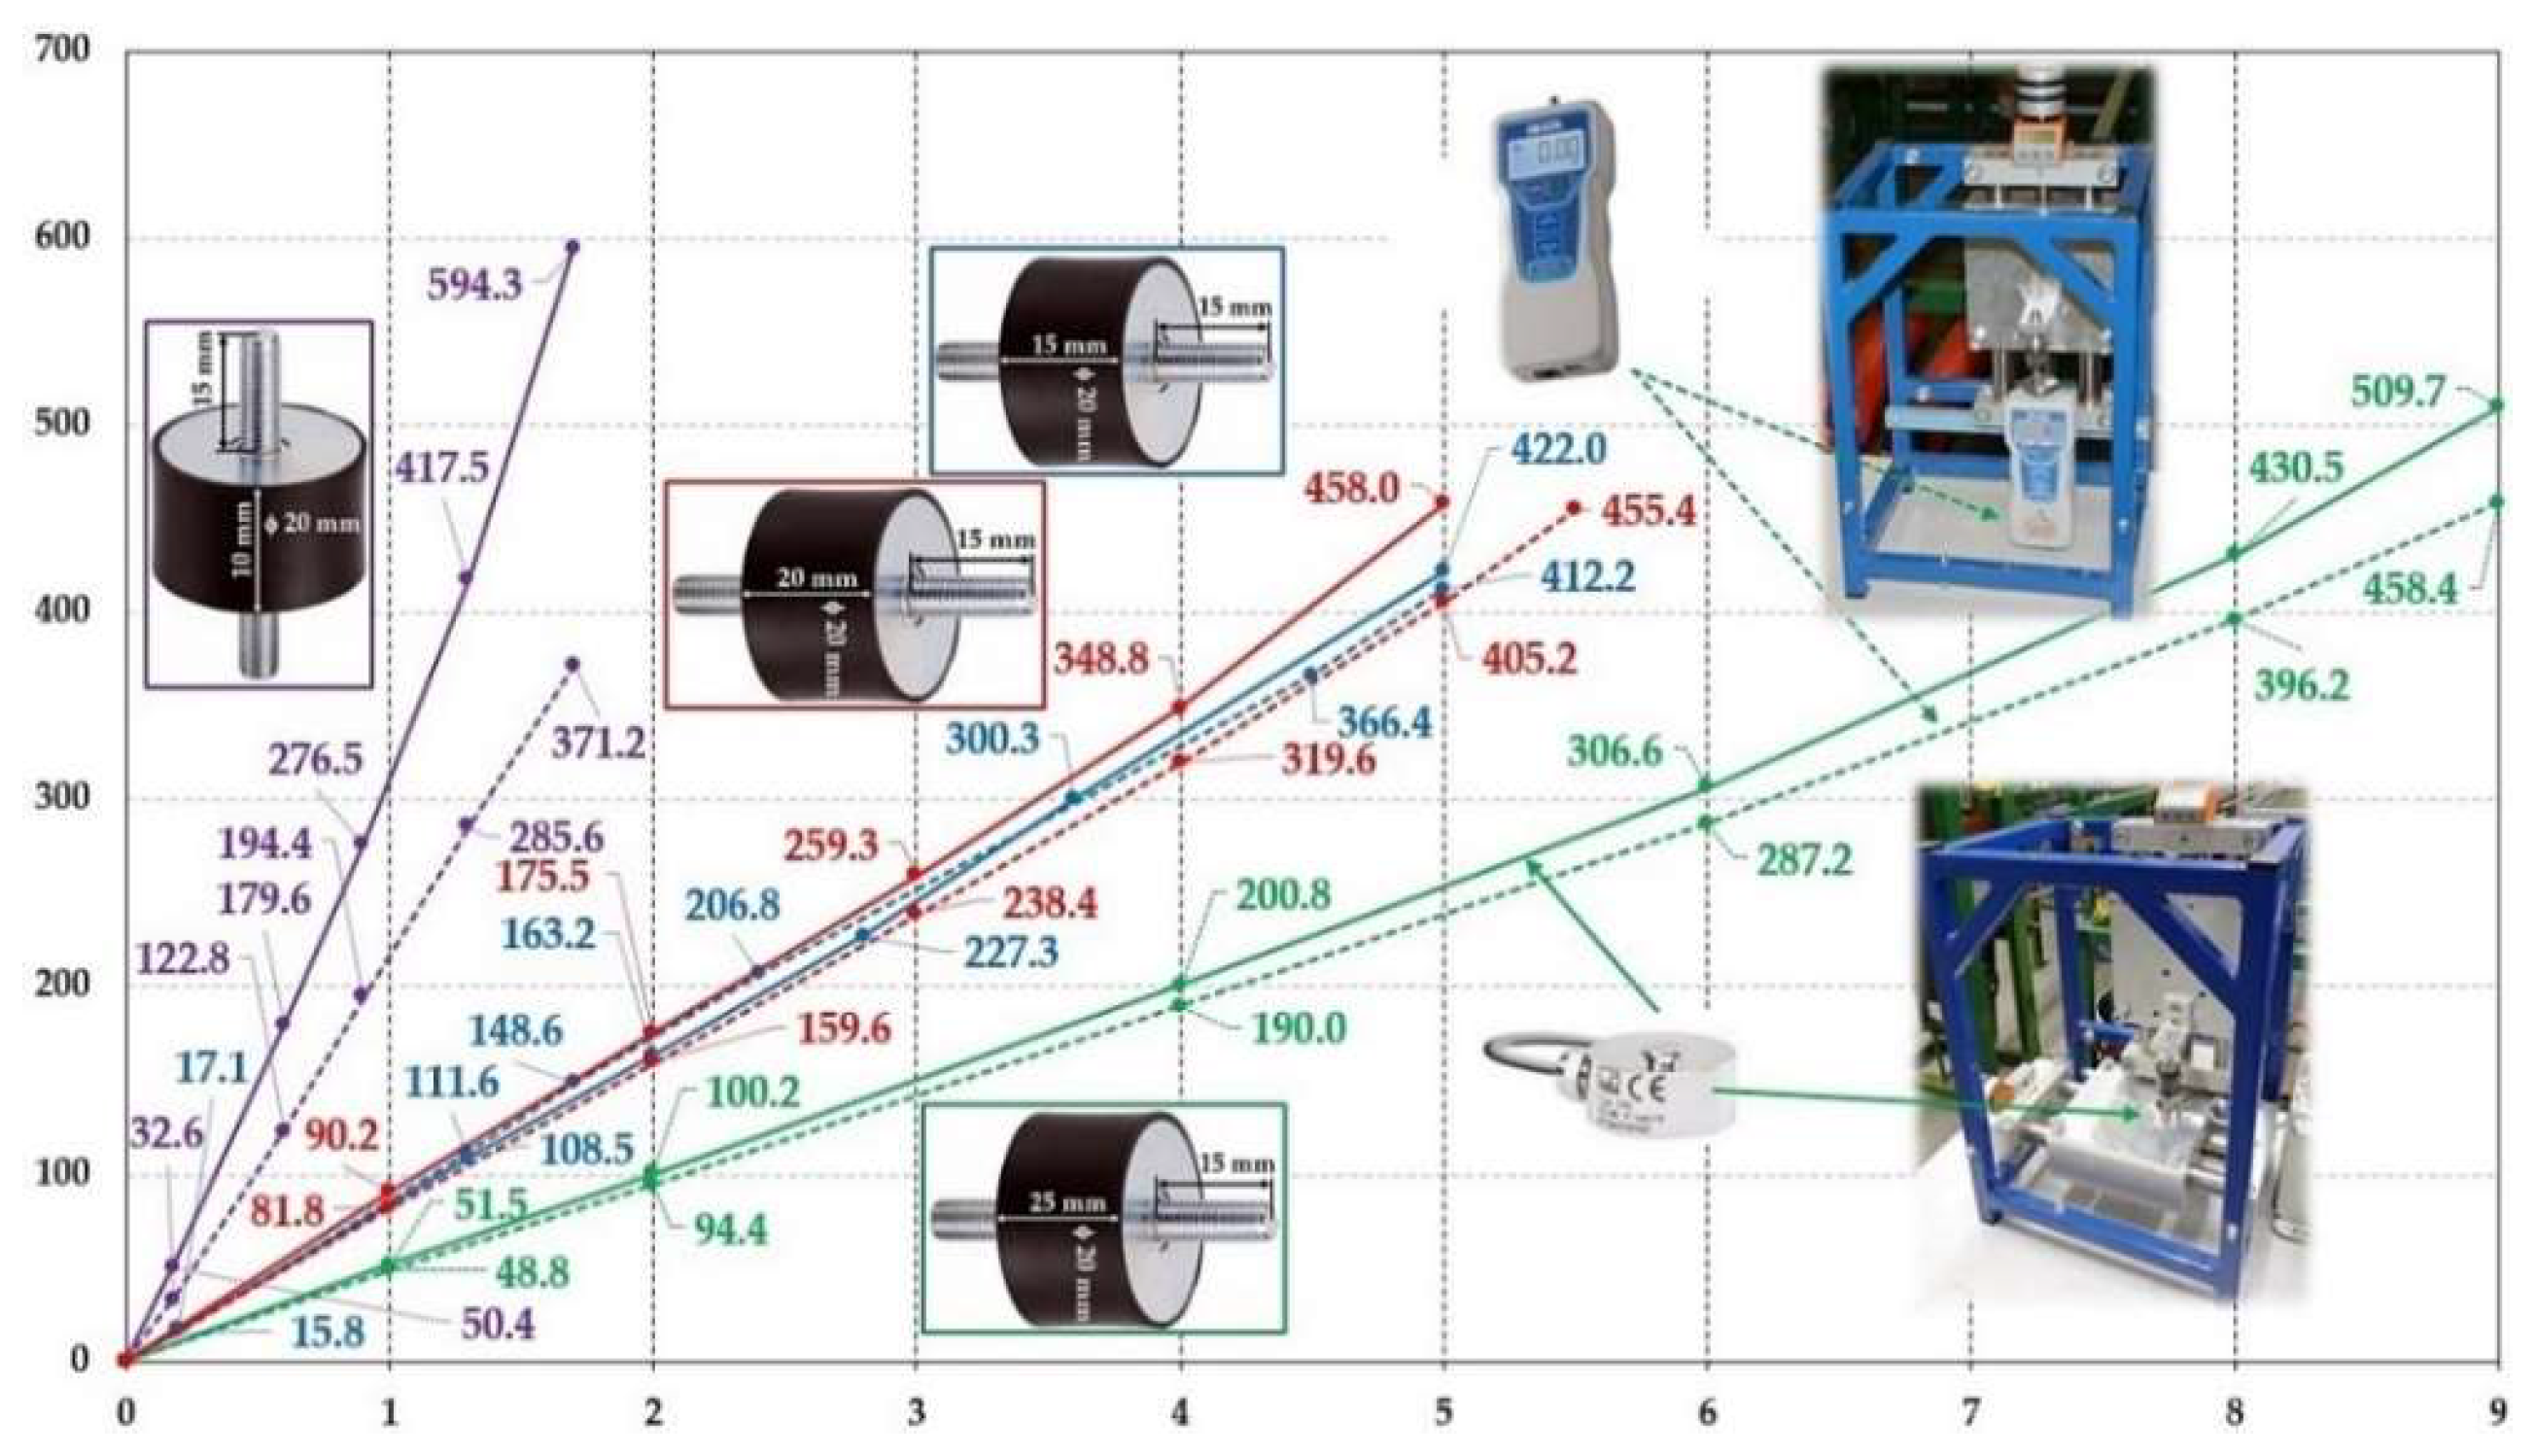
Table 1.
Rubber spring D = 20 mm, length when not loaded H0 = 10 mm.
| i | 1 | 2 | 3 | 4 | 5 | ||||||||||
| Li | Fcom,1 | Frel,1 | Fcom,2 | Frel,2 | Fcom,3 | Frel,3 | Fcom,4 | Frel,4 | Fcom,5 | Frel,5 | Fcom1 | κ5%,5 | Frel1 | κ5%,5 | sscom,i |
| mm | N | N·mm-1 | |||||||||||||
| 0 | 0 | 0 | 0 | 0 | 0 | 0 | 0 | 0 | 0 | 0 | 0 | 0 | 0 | 0 | - |
| 0.2 | 31 | 23 | 34 | 24 | 34 | 27 | 32 | 25 | 32 | 27 | 32.6 | 2.0 | 25.2 | 2.5 | 181.1 |
| 0.6 | 119 | 96 | 126 | 99 | 124 | 99 | 121 | 100 | 124 | 98 | 122.8 | 3.9 | 98.4 | 2.0 | 204.7 |
| 0.9 | 201 | 158 | 193 | 162 | 194 | 167 | 191 | 161 | 193 | 162 | 194.4 | 4.6 | 162.0 | 3.5 | 216.0 |
| 1.3 | 287 | 252 | 286 | 256 | 287 | 257 | 283 | 258 | 285 | 256 | 285.6 | 2.2 | 255.8 | 2.6 | 219.7 |
| 1.7 | 369 | 369 | 371 | 371 | 373 | 373 | 371 | 371 | 372 | 372 | 371.2 | 1.8 | 371.2 | 1.8 | 218.4 |
1 see Figure 6
Table 2.
Rubber spring D = 20 mm, length when not loaded H0 = 15 mm.
| i | 1 | 2 | 3 | 4 | 5 | ||||||||||
| Li | Fcom,1 | Frel,1 | Fcom,2 | Frel,2 | Fcom,3 | Frel,3 | Fcom,4 | Frel,4 | Fcom,5 | Frel,5 | Fcom 1 | κ5%,5 | Frel 1 | κ5%,5 | sscom,1 |
| mm | N | N·mm-1 | |||||||||||||
| 0 | 0 | 0 | 0 | 0 | 0 | 0 | 0 | 0 | 0 | 0 | 0 | 0 | 0 | 0 | - |
| 0.2 | 16 | 7 | 16 | 7 | 17 | 7 | 14 | 8 | 16 | 7 | 15.8 | 1.3 | 7.2 | 0.6 | 79.0 |
| 1.3 | 116 | 83 | 111 | 87 | 107 | 85 | 115 | 86 | 109 | 84 | 116.6 | 5.4 | 85.0 | 2.1 | 85.8 |
| 2.0 | 155 | 110 | 150 | 115 | 148 | 72 | 144 | 117 | 146 | 115 | 148.6 | 5.4 | 114.4 | 3.1 | 87.4 |
| 2.8 | 213 | 161 | 208 | 166 | 148 | 115 | 203 | 168 | 205 | 165 | 206.8 | 5.1 | 165.4 | 3.3 | 86.2 |
| 4.5 | 366 | 342 | 365 | 346 | 368 | 346 | 369 | 349 | 364 | 348 | 366.4 | 2.9 | 346.2 | 3.2 | 81.4 |
| 5.0 | 405 | 405 | 415 | 415 | 414 | 414 | 413 | 413 | 414 | 414 | 412.2 | 5.0 | 412.2 | 5.0 | 82.4 |
1 see Figure 6
Table 3.
Rubber spring D = 20 mm, length when not loaded H0 = 20 mm.
| i | 1 | 2 | 3 | 4 | 5 | ||||||||||
| Li | Fcom,1 | Frel,1 | Fcom,2 | Frel,2 | Fcom,3 | Frel,3 | Fcom,4 | Frel,4 | Fcom,5 | Frel,5 | Fcom 1 | κ5%,5 | Frel 1 | κ5%,5 | sscom,i |
| mm | N | N·mm-1 | |||||||||||||
| 0 | 0 | 0 | 0 | 0 | 0 | 0 | 0 | 0 | 0 | 0 | 0 | 0 | 0 | 0 | - |
| 1.0 | 81 | 62 | 84 | 64 | 81 | 62 | 82 | 62 | 81 | 64 | 81.8 | 1.7 | 62.8 | 1.7 | 81.8 |
| 2.0 | 159 | 128 | 163 | 134 | 159 | 133 | 159 | 131 | 158 | 134 | 159.6 | 2.4 | 132.0 | 3.5 | 79.8 |
| 3.0 | 239 | 198 | 242 | 207 | 238 | 205 | 237 | 206 | 236 | 208 | 238.4 | 2.9 | 204.8 | 4.7 | 79.5 |
| 4.0 | 319 | 282 | 323 | 288 | 319 | 287 | 318 | 286 | 319 | 290 | 319.6 | 2.4 | 286.6 | 3.6 | 79.9 |
| 5.0 | 397 | 381 | 411 | 389 | 405 | 385 | 406 | 384 | 407 | 388 | 405.2 | 5.8 | 385.4 | 4.3 | 81.0 |
| 5.5 | 452 | 452 | 458 | 458 | 455 | 455 | 454 | 454 | 458 | 458 | 455.4 | 3.6 | 455.4 | 3.6 | 82.8 |
1 see Figure 6
Table 5.
Rubber spring D = 25 mm, length when not loaded H0 = 15 mm.
| i | 1 | 2 | 3 | 4 | 5 | ||||||||||
| Li | Fcom,1 | Frel,1 | Fcom,2 | Frel,2 | Fcom,3 | Frel,3 | Fcom,4 | Frel,4 | Fcom,5 | Frel,5 | Fcom 1 | κ5%,5 | Frel 1 | κ5%,5 | sscom,i |
| mm | N | N·mm-1 | |||||||||||||
| 0 | 0 | 0 | 0 | 0 | 0 | 0 | 0 | 0 | 0 | 0 | 0 | 0 | 0 | 0 | - |
| 0.4 | 54 | 42 | 53 | 43 | 52 | 42 | 51 | 42 | 53 | 42 | 52.6 | 1.5 | 42.2 | 0.6 | 131.5 |
| 0.8 | 106 | 89 | 105 | 91 | 104 | 91 | 103 | 90 | 104 | 90 | 104.4 | 1.5 | 90.2 | 1.1 | 130.5 |
| 1.2 | 159 | 139 | 161 | 139 | 160 | 138 | 157 | 141 | 158 | 140 | 159.0 | 0.1 | 139.4 | 1.5 | 132.5 |
| 1.6 | 215 | 192 | 217 | 194 | 215 | 193 | 213 | 191 | 214 | 193 | 214.8 | 1.8 | 192.6 | 1.5 | 134.3 |
| 2.0 | 272 | 252 | 275 | 251 | 272 | 251 | 272 | 253 | 274 | 252 | 273.0 | 2.1 | 251.8 | 1.1 | 136.5 |
| 2.4 | 331 | 310 | 335 | 312 | 332 | 313 | 331 | 314 | 333 | 313 | 332.4 | 2.2 | 312.4 | 2.0 | 138.5 |
| 2.8 | 396 | 379 | 397 | 378 | 396 | 382 | 394 | 382 | 395 | 382 | 395.6 | 1.5 | 380.6 | 2.9 | 141.3 |
| 3.2 | 454 | 454 | 453 | 453 | 457 | 457 | 456 | 456 | 457 | 457 | 455.4 | 2.6 | 455.4 | 2.6 | 142.3 |
1 see Figure 7
Table 6.
Rubber spring D = 25 mm, length when not loaded H0 = 20 mm.
| i | 1 | 2 | 3 | 4 | 5 | ||||||||||
| Li | Fcom,1 | Frel,1 | Fcom,2 | Frel,2 | Fcom,3 | Frel,3 | Fcom,4 | Frel,4 | Fcom,5 | Frel,5 | Fcom 1 | κ5%,5 | Frel 1 | κ5%,5 | sscom,i |
| mm | N | N·mm-1 | |||||||||||||
| 0 | 0 | 0 | 0 | 0 | 0 | 0 | 0 | 0 | 0 | 0 | 0 | 0 | 0 | 0 | - |
| 1.0 | 93 | 71 | 95 | 65 | 94 | 71 | 91 | 69 | 94 | 70 | 93.4 | 2.0 | 69.2 | 3.1 | 93.4 |
| 2.0 | 176 | 140 | 178 | 139 | 179 | 141 | 174 | 141 | 179 | 140 | 177.2 | 3.1 | 140.2 | 1.1 | 88.6 |
| 3.0 | 251 | 213 | 256 | 214 | 254 | 214 | 249 | 213 | 252 | 213 | 252.4 | 3.6 | 213.4 | 3.6 | 84.1 |
| 4.0 | 337 | 303 | 341 | 304 | 339 | 303 | 333 | 304 | 336 | 303 | 337.2 | 3.9 | 303.4 | 0.8 | 84.3 |
| 5.0 | 446 | 446 | 447 | 447 | 446 | 446 | 444 | 444 | 445 | 445 | 445.6 | 1.5 | 445.6 | 1.5 | 89.1 |
1 see Figure 7
Table 7.
Rubber spring D = 25 mm, length when not loaded H0 = 25 mm.
| i | 1 | 2 | 3 | 4 | 5 | ||||||||||
| Li | Fcom,1 | Frel,1 | Fcom,2 | Frel,2 | Fcom,3 | Frel,3 | Fcom,4 | Frel,4 | Fcom,5 | Frel,5 | Fcom 1 | κ5%,5 | Frel 1 | κ5%,5 | sscom,i |
| mm | N | N·mm-1 | |||||||||||||
| 0 | 0 | 0 | 0 | 0 | 0 | 0 | 0 | 0 | 0 | 0 | 0 | 0 | 0 | 0 | - |
| 1.0 | 77 | 60 | 74 | 58 | 76 | 61 | 76 | 61 | 75 | 60 | 75.6 | 1.5 | 60.0 | 1.4 | 75.6 |
| 2.0 | 146 | 123 | 144 | 122 | 144 | 125 | 145 | 122 | 144 | 124 | 144.6 | 1.3 | 123.2 | 1.8 | 72.3 |
| 3.0 | 214 | 189 | 212 | 191 | 211 | 192 | 212 | 192 | 211 | 191 | 212.0 | 1.4 | 191.0 | 1.4 | 70.7 |
| 4.0 | 279 | 256 | 281 | 259 | 280 | 261 | 281 | 262 | 281 | 262 | 280.4 | 1.3 | 260.0 | 3.5 | 70.1 |
| 5.0 | 347 | 331 | 352 | 335 | 351 | 334 | 353 | 334 | 351 | 332 | 350.8 | 2.6 | 333.2 | 2.4 | 70.2 |
| 6.0 | 424 | 424 | 426 | 426 | 428 | 428 | 429 | 429 | 427 | 427 | 426.8 | 2.5 | 426.8 | 2.5 | 71.1 |
1 see Figure 7
Table 8.
Rubber spring D = 25 mm, length when not loaded H0 = 30 mm.
| i | 1 | 2 | 3 | 4 | 5 | ||||||||||
| Li | Fcom,1 | Frel,1 | Fcom,2 | Frel,2 | Fcom,3 | Frel,3 | Fcom,4 | Frel,4 | Fcom,5 | Frel,5 | Fcom 1 | κ5%,5 | Frel 1 | κ5%,5 | sscom,i |
| mm | N | N·mm-1 | |||||||||||||
| 0 | 0 | 0 | 0 | 0 | 0 | 0 | 0 | 0 | 0 | 0 | 0 | 0 | 0 | 0 | - |
| 1.0 | 66 | 33 | 62 | 36 | 64 | 37 | 61 | 36 | 64 | 33 | 63.4 | 2.6 | 35.0 | 2.8 | 63.4 |
| 2.0 | 118 | 89 | 122 | 86 | 117 | 84 | 116 | 86 | 113 | 85 | 117.2 | 3.9 | 86.0 | 2.1 | 58.6 |
| 3.0 | 169 | 139 | 176 | 142 | 168 | 139 | 174 | 143 | 172 | 143 | 171.6 | 5.0 | 141.2 | 3.1 | 57.3 |
| 4.0 | 223 | 191 | 227 | 191 | 219 | 193 | 229 | 196 | 218 | 194 | 223.2 | 6.7 | 193.0 | 2.8 | 55.8 |
| 5.0 | 279 | 246 | 276 | 238 | 282 | 249 | 286 | 241 | 281 | 251 | 280.8 | 4.6 | 245.0 | 7.7 | 56.2 |
| 6.0 | 357 | 307 | 349 | 299 | 354 | 312 | 355 | 303 | 351 | 313 | 353.2 | 4.5 | 306.8 | 8.1 | 55.5 |
| 7.0 | 381 | 378 | 383 | 379 | 392 | 382 | 398 | 386 | 394 | 383 | 389.6 | 10.6 | 381.6 | 4.3 | 55.7 |
| 7.5 | 419 | 419 | 412 | 412 | 423 | 423 | 426 | 426 | 428 | 428 | 421.6 | 8.5 | 421.6 | 8.5 | 56.2 |
1 see Figure 7
Table 9.
Rubber spring D = 20 mm, length when not loaded H0 = 10 mm and 15 mm.
| i | 1 | 2 | 3 | i | 1 | 2 | 3 | ||||||
| Li | Fcom,1 | Fcom,2 | Fcom,3 3 | Fcom | κ5%,3 | ss,com | Li | Fcom,1 | Fcom,2 | Fcom,3 | Fcom | κ5%,3 | sscom,i |
| mm | N | N·mm-1 | mm | N | N·mm-1 | ||||||||
| 0 | 0 | 0 | 0 | 0 | 0 | - | 0 | 0 | 0 | 0 | 0 | 0 | - |
| 0.2 | 52.3 1 | 51.5 | 47.5 | 50.4 | 4.6 | 280.2 | 0.2 | 16.2 | 16.8 | 18.3 | 17.1 | 1.9 | 85.5 |
| 0.6 | 181.6 | 180.3 2 | 176.8 | 179.6 | 4.3 | 299.3 | 1.3 | 108.1 4 | 108.5 | 108.8 | 108.5 | 0.6 | 83.4 |
| 0.9 | 278.3 | 277.8 | 273.5 | 276.5 | 4.7 | 307.3 | 2.0 | 164.1 | 162.9 | 162.6 | 163.2 | 1.4 | 81.6 |
| 1.3 | 417.9 | 421.4 | 413.1 | 417.5 | 6.8 | 321.1 | 2.8 | 229.4 | 226.6 | 225.8 | 227.3 | 3.3 | 81.2 |
| 1.7 | 592.8 | 602.0 | 588.0 | 594.3 | 12.0 | 349.6 | 3.6 | 305.1 | 297.3 | 298.4 | 300.3 | 7.5 | 83.4 |
| 5.0 | 416.1 | 422.4 | 427.5 | 422.0 | 9.2 | 84.4 | |||||||
Table 10.
Rubber spring D = 25 mm, length when not loaded H0 = 20 mm and 25 mm.
| i | 1 | 2 | 3 | i | 1 | 2 | 3 | ||||||
| Li | Fcom,1 | Fcom,2 | Fcom,3 | Fcom | κ5%,3 | sscom,i | Li | Fcom,1 | Fcom,2 | Fcom,3 | Fcom | κ5%,3 | sscom,i |
| mm | N | N·mm-1 | mm | N | N·mm-1 | ||||||||
| 0 | 0 | 0 | 0 | 0 | 0 | - | 0 | 0 | 0 | 0 | 0 | 0 | - |
| 1 | 90.7 | 90.8 | 89.2 | 90.2 | 1.6 | 90.2 | 1 | 51.6 | 51.1 | 51.7 | 51.5 | 0.6 | 51.5 |
| 2 | 177.0 1 | 177.1 | 172.4 | 175.5 | 4.8 | 87.8 | 2 | 100.0 | 100.3 | 100.4 | 100.2 | 0.4 | 50.1 |
| 3 | 260.4 | 260.5 | 256.9 | 259.3 | 3.7 | 86.4 | 4 | 201.0 2 | 200.6 | 200.8 | 200.8 | 0.3 | 50.2 |
| 4 | 350.2 | 350.3 | 345.9 | 348.8 | 4.5 | 87.2 | 6 | 307.9 | 306.1 | 305.9 | 306.6 | 2.0 | 51.1 |
| 5 | 460.1 | 460.2 | 453.7 | 458.0 | 6.7 | 91.6 | 8 | 431.5 | 430.5 | 429.6 | 430.5 | 1.5 | 53.8 |
| 9 | 506.9 | 510.6 | 511.5 | 509.7 | 4.3 | 56.6 | |||||||
Table 11.
Rubber spring D = 25 mm, length when not loaded H0 = 15 mm and 20 mm.
| i | 1 | 2 | 3 | i | 1 | 2 | 3 | ||||||
| Li | Fcom,1 | Fcom,2 | Fcom,3 | Fcom | κ5%,3 | sscom,i | Li | Fcom,1 | Fcom,2 | Fcom,3 | Fcom | κ5%,3 | sscom,i |
| mm | N | N·mm-1 | mm | N | N·mm-1 | ||||||||
| 0 | 0 | 0 | 0 | 0 | 0 | - | 0 | 0 | 0 | 0 | 0 | 0 | - |
| 1.2 | 65.8 | 59.6 | 61.0 | 62.1 | 5.7 | 151.0 | 1 | 98.6 | 95.0 | 93.7 | 95.8 | 4.4 | 95.8 |
| 2 | 183.81 | 178.9 | 181.0 | 181.2 | 4.0 | 158.6 | 2 | 190.7 | 186.0 | 185.5 | 187.4 | 5.1 | 93.7 |
| 2.8 | 319.9 | 315.0 | 316.9 | 317.3 | 4.1 | 169.2 | 3 | 278.9 2 | 272.7 | 271.9 | 274.5 | 6.8 | 91.5 |
| 3.2 | 475.6 | 471.6 | 473.7 | 473.6 | 3.2 | 176.2 | 4 | 379.5 | 367.9 | 366.8 | 371.4 | 12.6 | 92.9 |
| 5 | 492.9 | 496.8 | 494.7 | 494.8 | 3.1 | 99.0 | |||||||
Table 12.
Rubber spring D = 25 mm, length when not loaded H0 = 25 mm and 30 mm.
| i | 1 | 2 | 3 | i | 1 | 2 | 3 | ||||||
| Li | Fcom,1 | Fcom,2 | Fcom,3 | Fcom | κ5%,3 | sscom,i | Li | Fcom,1 | Fcom,2 | Fcom,3 | Fcom | κ5%,3 | sscom,i |
| mm | N | N·mm-1 | mm | N | N·mm-1 | ||||||||
| 0 | 0 | 0 | 0 | 0 | 0 | - | 0 | 0 | 0 | 0 | 0 | 0 | - |
| 1 | 71.3 | 73.6 | 73.1 | 72.7 | 2.1 | 72.7 | 1 | 72.6 | 69.5 | 71.3 | 71.1 | 2.5 | 71.1 |
| 2 | 149.0 | 151.0 | 150.4 | 150.1 | 1.8 | 75.1 | 2 | 136.0 | 133.0 | 134.6 | 134.5 | 2.4 | 67.3 |
| 3 | 223.9 | 225.61 | 224.7 | 224.7 | 1.3 | 74.9 | 3 | 197.6 | 194.8 | 196.1 | 196.2 | 2.2 | 65.4 |
| 4 | 298.9 | 299.6 | 299.3 | 299.3 | 0.6 | 74.8 | 4 | 256.5 | 253.9 | 257.6 | 256.0 | 3.3 | 64.0 |
| 5 | 374.7 | 379.9 | 375.1 | 376.6 | 5.2 | 75.3 | 5 | 316.9 | 314.4 | 313.9 | 315.1 | 2.8 | 63.0 |
| 6 | 462.7 | 466.6 | 464.6 | 464.6 | 3.1 | 77.4 | 6 | 381.4 | 378.6 | 376.2 | 378.7 | 4.1 | 63.1 |
| 7 | 448.8 | 447.7 | 447.0 | 447.8 | 1.5 | 64.0 | |||||||
| 7.5 | 482.8 | 486.4 | 482.9 | 484.0 | 3.7 | 64.5 | |||||||
1 see Figure 13(b).
Disclaimer/Publisher’s Note: The statements, opinions and data contained in all publications are solely those of the individual author(s) and contributor(s) and not of MDPI and/or the editor(s). MDPI and/or the editor(s) disclaim responsibility for any injury to people or property resulting from any ideas, methods, instructions or products referred to in the content. |
© 2024 by the authors. Licensee MDPI, Basel, Switzerland. This article is an open access article distributed under the terms and conditions of the Creative Commons Attribution (CC BY) license (https://creativecommons.org/licenses/by/4.0/).
Copyright: This open access article is published under a Creative Commons CC BY 4.0 license, which permit the free download, distribution, and reuse, provided that the author and preprint are cited in any reuse.


