Submitted:
18 November 2024
Posted:
20 November 2024
You are already at the latest version
Abstract
Cyberspace maps aid in understanding complex, abstract cyberspace. With rapid Internet growth, cyberspace complexity has significantly increased. Traditional cyberspace maps are designed for professionals and remain challenging for non-professionals to interpret. Ordinary users often struggle with vast information and complex networks, making traditional visualization tools insufficient for public needs and calling for more intuitive representations. This study uses the metaphor of cyberspace as a familiar geographical space to simplify the understanding of internal relationships. Based on autonomous system (AS) connectivity data, a "node-link" model is created to illustrate network interactions and dependencies, forming a foundation for analysis. The GMap algorithm visualizes AS connectivity data of countries, converting them into an intuitive map for clear visualization of network composition and dynamics. Network potential and national influence in network space are considered to enhance map practicality and accuracy. A web-geography metaphor model integrates scientific and geographical elements, improving readability. The optimized GMap algorithm includes a comprehensive network strength index, displaying both connectivity and relative country strength in cyberspace. This metaphorical approach aims to simplify information complexity, making cyberspace more accessible to the general public.
Keywords:
cyberspace
; cyberspace map
; metaphor theory
; GMap algorithm
; cyber potential
1. Introduction
In the current era of information explosion, cyberspace has become an integral part of human society. Cyberspace maps have long served as crucial tools for understanding and interpreting cyberspace since its early stages of development [1]. Employing cyberspace maps to model, analyze, and represent cyberspace facilitates more precise insights into the complex interconnections within network structures, data flows, and information dissemination. Research on cyberspace mapping has garnered significant attention and acknowledgment within the fields of surveying and information science, leading to numerous pivotal findings. However, the inherent characteristics of virtualization and boundlessness in cyberspace pose challenges for traditional mapping approaches, such as map projections, symbol design, and visualization techniques. Therefore, it is essential to adopt metaphorical methods to transform abstract and complex aspects of cyberspace into more intuitive and comprehensible visual forms, thus enhancing users’ cognition and understanding of cyberspace.
The use of metaphor maps to depict elements of cyberspace and information flow has been the subject of various studies. For instance, Ming Tusol et al. mapped information from cyberspace onto geographic coordinates, creating visual representations that illustrate the relationship between cyberspace and physical geographic space, as well as the impact of cyberspace on real-world geography [2,3,4,5]. Angela et al. developed a user-focused cultural network map using global website traffic data [6]. Lu Zi et al. examined the differences between China’s physical geographic space and virtual space by analyzing connection frequency at the provincial level, connection patterns based on the backbone network, and connection speeds between urban nodes, producing corresponding maps [7]. The "Galaxy Map" by Ruslan Enikeev visualized the largest 350,000 websites on the Internet [8]. Inspired by space exploration, Holmquist created a "Planet" map representing websites as planets, galaxies, solar systems, and asteroid fields [9]. Chen et al. introduced the D-Map visualization method, using metaphor maps to simulate information dissemination processes within social networks [10]. WISE J A used contour lines as a metaphor to represent news maps, indicating the importance or popularity of news events through variations in line structure [11]. Xin Rui et al. analyzed spatial metaphor expressions of non-spatial data using the Gosper curve and metaphor map principles [12]. Liu Longhui et al. proposed methods for constructing metaphorical Gosper maps and cyberspace topographic maps [13]. Qi Kai et al. visualized resource nodes in cyberspace as ontologies, utilizing peaks and contour lines from traditional geographic space as visualization metaphors [14].
The concept of "cyber potential" is derived from "geopolitical potential," representing a country’s or region’s influence and capabilities in network technology, information control, data flow, and network security relative to other countries or regions within global cyberspace. It reflects a nation’s competitiveness, influence, and dominance in international network affairs. Currently, the characterization and depiction of cyber potential are primarily conveyed through indicator models and thematic visualizations. Prominent methods for evaluating national network strength include the Belfer National Cyber Power Index (NCPI) [15], the Global Cybersecurity Index (GCI) [16], the Cyber Readiness Index 2.0 (CRI 2.0) [17], and the Cyber Power Index (CPI) [18]. By integrating both soft and hard powers associated with cyberspace, national network strength is thematically expressed through specialized symbols; the more advanced a country’s cyberspace infrastructure, the greater its network strength. Visualizing a country’s influence within cyberspace facilitates the analysis of control capabilities, expansion trends, cooperative relationships, and their impacts on cybersecurity, stability, and development [19]. For instance, Leetaru et al. performed a visual analysis of Twitter activity using Twitter data and geographic information systems to reveal global usage patterns and activity levels, thereby highlighting the sphere of influence of various regions in cyberspace [20].
In summary, the application of metaphorical methods for modeling and visualizing the cyberspace environment has emerged as a significant approach in current cyberspace map visualization. The depiction of cyber potential serves as a representation of the foundational cyberspace environment. A cyber potential map can function as a "base map" for layering other thematic information related to cyberspace. However, current research on modeling and visualizing network potential has the following limitations: (1) Representing cyberspace strength using indicators and charts often fails to intuitively express the scope of influence and accurately describe the neighboring relationships of countries in virtual space; (2) Methods that use hierarchical structures struggle to fully capture the "connection" characteristic inherent in network logic; (3) Relying solely on the number and density of cyber connections overlooks critical hard power elements such as network infrastructure, economic power, and military capability.
To address these challenges, this study applies metaphorical mapping theory and methods, focusing on the fundamental attributes of cyberspace, and constructs a metaphorical mapping model between cyber potential and administrative division maps using the GMap algorithm and foundational data such as cyberspace links. By incorporating processes such as graph embedding, graph clustering, and spatial layout, a cyber potential metaphorical map is generated. This map serves as a "base map" for overlaying various thematic elements of cyberspace, enabling experiments such as cyberspace potential s and connectivity analyses.
2. Research Approach
"Metaphor" is a concept rooted in linguistics [21], where its core involves the unconventional juxtaposition of familiar and unfamiliar elements to deepen understanding and comprehension of the unfamiliar [22,23]. The relationship between the tenor and the vehicle forms the fundamental structure of a metaphor. The tenor represents the primary subject or original concept of the metaphor, whereas the vehicle is the specific element used to illustrate or describe the tenor. A metaphorical map is a technique that employs a map as a medium to visually convey abstract data, performing a transfer based on the similarity between the tenor and the vehicle. This transfer enables the vehicle to visually represent the attributes of the tenor effectively [24].
Cyber potential refers to the capability of a country, organization, or individual to control information and data in cyberspace and exert influence, control, or perform cyber operations targeting other entities. It encompasses both defensive and security capabilities, as well as the ability to leverage network technology and information resources to influence economic, political, and social domains.
Maps use boundaries, outlines, and territorial areas to delineate the borders, locations, and sizes of countries, providing an intuitive understanding of geographical space. Therefore, this study proposes using the geographical representation of a country’s area, boundary lines, and location to metaphorically represent the scope of a country’s influence in cyberspace, as illustrated in Figure 1.
The ontology of "cyber potential" encompasses a foundational understanding of the cyber environment, requiring insights into the influence range of various countries in cyberspace, communication dynamics, and critical nodes. The metaphor of an "administrative division map" primarily represents the territorial extent of a country or region, structure of administrative divisions, locations of administrative centers, and transportation networks [25]. Although these two concepts exist in different spatial domains, they share significant similarities that form the basis for the metaphorical expression of a cyber potential map. The structure of an administrative division map can be utilized to represent the influence range in cyberspace. The selection and emphasis of specific characteristics in the metaphor for creative interpretation of the ontology are essential to forming visual metaphors in metaphorical maps. The metaphor of an "administrative division map" includes various components such as residential areas, roads, water systems, and administrative regions. The area of an administrative region represents the size of the geographic territory it covers, whereas boundaries delineate the geographical extent. Roads symbolize the connectivity network between regions, illustrating transportation accessibility between cities. Hub cities indicate critical positions within the transportation network [26]. The "cyber potential map" ontology must convey the influence range of cyberspace for different countries, boundaries of influence, connectivity between countries, and critical network connection nodes. By aligning the shared characteristics of these map metaphors, similarities can be accentuated, enabling the visual representation of the metaphorical map through symbolization. The influence range of cyberspace will be depicted using area symbols in various colors, whereas the backbone network will be represented through line symbols analogous to road networks. Network backbone connections at the autonomous system (AS), POP, routing, and Internet Protocol (IP) levels will correspond to different road classifications. Visual variables, such as color and line thickness, will be employed to represent different levels of network connections. Key network nodes will be illustrated as point symbols of varying levels.
As shown in Figure 2, the approach for constructing the cyber potential metaphor map involves mapping the "virtual, borderless" nature of cyberspace onto a "tangible, bounded" cyber potential map [27]. The primary steps include the following:
(1) Network node-link data graphing. Utilize foundational network resource data such as AS, domain name system (DNS), IP, and vulnerabilities to construct a "node-link" association graph, generating the cyberspace link graph.
(2) Mapping the cyberspace link graph to a two-dimensional (2D) plane. Using graph embedding algorithms, map the high-dimensional cyberspace "graph" to nodes on a 2D plane, similar to geographic "map projections."
(3) Clustering cyberspace nodes based on countries. Use K-means and modularity optimization algorithms to cluster discrete 2D network nodes.
(4) Layout of national influence sectors based on force-directed layout. Calculate the cyber potential of each country based on the syber potential indicator system and optimize the force-directed layout according to the direct connections of each country’s AS.
(5) Using a map coloring algorithm, render the various national sectors in cyberspace, ultimately forming the network potential metaphor map.
3. Materials and Methods
The cyber potential metaphor map takes cyberspace power as its subject and uses geographic maps as its metaphor, employing familiar geographic map elements to represent the complex and abstract nature of cyberspace. This study constructs the network potential metaphor map using the GMap algorithm. The GMap algorithm is a data visualization technique rooted in map metaphors, enabling 2D map visualization from network connection data through processes such as graph embedding, graph clustering, and boundary generation. Initially, the algorithm converts the relational dataset into a graphical representation and then applies an embedding algorithm to project the graph into 2D space. Clustering analysis is subsequently performed to ensure that similar vertices cluster together to form distinct regions. Finally, a graphic resembling a geographic map is produced based on vertex positions, where internal boundaries separate clusters and external boundaries follow the overall contour, effectively representing complex data in a form similar to a geographic map [28,29,30,31,32,33].
3.1. Graph Embedding in Cyberspace Data
Graph embedding algorithms are processes that map graph data (typically high-dimensional dense matrices) to low-dimensional dense vectors [34]. Network AS connection data represent high-dimensional graph connection data. This study employs the DeepWalk algorithm to achieve dimensionality reduction, mapping network connection graph data to a 2D plane. DeepWalk integrates the Random Walk and Word2vec algorithms into my graph-structured data [35,36], with the main steps illustrated in Figure 3:
(1) Random Walk Sampling of Node Sequences: Starting from each node in the AS-connected network graph, a random walk sampling is performed to gather locally associated data. This involves selecting the next node based on a predefined strategy from the current node and repeating the process to generate multiple node sequences;
(2) Learning representational vectors using the skip-gram model: These node sequences are utilized as training data and input into the skip-gram model. During training, the skip-gram model aims to learn the contextual relationships between nodes, focusing on nodes that co-occur in random walks to generate a low-dimensional vector representation for each node;
(3) The sampled data are trained using the skip-gram model to obtain vectorized node representations, maximizing node co-occurrence while employing hierarchical softmax for large-scale classification;
(4) Compute the embeddings for each node in the graph.
The following is the pseudocode for embedding AS connection data into a 2D plane using the DeepWalk algorithm:

Table 1.
AS Connection Data Graph Embedding.
| Algorithm 1: AS Connection Data Graph Embedding |
| Input: AS connection graph G (V, E) |
| Window size ω |
| Output dimension d |
| Number of paths starting from each node γ |
| Length of each path t |
| Output: Matrix representing hidden information Φ∈R∣V∣×d |
| 1. Randomly initializeΦ |
| 2. Construct Hierarchical Softmax |
| 3. Perform γ random walks for each node |
| 4. Shuffle the nodes in the network |
| 5. Generate random walks of length t starting from each node |
| 6. Update parameters using the skip-gram model with gradient methods based on the generated random walks |
3.2. Cyberspace Graph Clustering Algorithm
3.2.1. Country AS Clustering Based on K-means
The K-means algorithm is an iterative clustering analysis algorithm designed to partition n objects in a dataset into k clusters, minimizing the sum of distances from each object to the center of its assigned cluster (the mean point or centroid) [37]. The distance is typically measured using the Euclidean distance. The specific steps (see Figure 4 and Figure 5) include:
(1) Use "country names" as initial cluster centers, selecting k data points at random as the initial cluster centers. First, select a country name randomly as the first initial cluster center. For each unselected AS number, calculate its minimum distance to the existing cluster centers and select the next cluster center based on the probability distribution of this distance. This approach ensures that K-means maintains a significant distance between initial cluster centers, helping to avoid local optima.
(2) Calculate the distance between each node and the cluster centers. For each data point in the dataset, compute its Euclidean distance to each cluster center and assign it to the nearest cluster center. The calculation formula is as follows:
where (x ) denotes the AS point, ci denotes the i-th cluster center, d denotes the data dimension (usually 2D), and xj and cij denote the values of x and ci in the j-th dimension, respectively.
(3) Recalculate the cluster center. For each cluster (country), recalculate its cluster center, which is the average of all data points within that cluster. The formula is as follows:
where Si denotes the set of data points for the i th cluster (country), and |Si| denotes the number of data points in the set (the number of AS numbers).
(4) Clustering iteration. The allocation and update steps are iteratively executed until all AS numbers of a country are grouped within the same cluster (country), and the AS numbers of different countries remain distinct across clusters. At this point, the clustering process terminates.
3.2.2. National Node Modularity Optimization Algorithm
After applying the K-means algorithm for clustering analysis, the partition quality is often suboptimal. Whereas the subgraphs may visually appear connected, the connections between nodes are weak. Additionally, overlaps between clusters of different countries can occur, and varying initializations may lead to inconsistent clustering results, indicating a lack of stability. The modularity of the clustering results is relatively low, exhibiting weak internal connections and stronger inter-country connections. Therefore, modularity optimization of the clustering results is necessary. Modularity optimization typically results in higher-quality community partitions, characterized by stronger internal connections and sparser connections between different countries. It also reduces overlap between clusters, clarifying the overall distribution structure. Additionally, modularity optimization can substantially enhance the modularity of clustering results, producing consistent and high-modularity country partitions even under different initialization conditions. This enhances stability and reduces sensitivity to initialization, leading to similar clustering outcomes across various initializations.
Modularity is used to measure and evaluate the quality of the algorithm’s network structure partitioning [38]. Therefore, the modularity of the initial clustering results can be calculated, and optimizing modularity can strengthen the internal cohesion of clusters and improve clustering stability. The calculation formula for modularity is as follows:
where Q represents modularity, and a larger Q indicates higher clustering quality. The range of Q is [-0.5, 1], where a Q value closer to 1 signifies better clustering quality, implying that connections within AS connection domains are stronger, whereas those between AS connection domains are sparser. Conversely, a Q value closer to -0.5 reflects poorer clustering quality, potentially resulting from overlapping connection domains or weak internal connections. In practical applications, a Q value between 0.3 and 0.7 is typically considered indicative of good clustering performance. Within this range, connections within connection domains are stronger than those between them while avoiding issues of excessively dispersed connection domains due to a high Q or overlapping domains due to a low Q value [39]. Thus, a Q value between 0.3 and 0.7 represents a balance, suggesting that the clustering results have sufficient structure without excessive aggregation or dispersion, making the partitioning of connection domains more practical and suited for real-world applications. Let m represent the number of edges in the graph, Aij denote the elements of the adjacency matrix A, ω represent the edge weight between nodes i and j, and ki and kj indicate the number of neighboring nodes for nodes i and j, respectively, when i and j belong to the same country, &(ci,cj) = 1; when i and j do not belong to the same country, &(ci,cj) = 0.
First, construct a bipartite graph based on the connections after clustering, where each node corresponds to two vertices representing whether it is in the current cluster. Next, for each node i, use variable Ci to store its cluster number, and thereafter traverse every other node j to calculate the edge weight between i and j, as well as their respective cluster numbers Ci and Cj. If Ci = Cj, then add ωij to the modularity calculation; otherwise, make no modifications. Finally, the total modularity is calculated using the formula. Select the pair of nodes with the highest modularity gain from all node pairs, merge them into the same cluster, and update the bipartite graph and modularity to achieve the optimal final clustering result.
3.3. Spatial Layout Algorithm of Comprehensive Cyber Potential Indicators
3.3.1. Construction of the Cyber Potential Indicator System
The number of cyberspace AS, links, IP addresses, and vulnerabilities can partially reflect the robustness of cyberspace infrastructure and the communication capabilities of network links, but they do not provide a comprehensive assessment of cyber potential.
(1) Cyberspace technical strength: This encompasses the construction of network infrastructure, level of research and development in network technology, and development level of the information technology industry, which can be indicated by the number of national IPs and ASNs.
(2) Cyberspace security capability: This pertains to a country’s ability to secure its cyberspace, defend against cyberattacks, and manage network security incidents, reflected by the number of vulnerabilities present in the national network.
(3) Information control and dissemination capability: This involves a country’s capacity to regulate online information, guide public opinion, and disseminate culture and values via online platforms, represented by the number of secure Internet servers.
(4) International cooperation and diplomacy: This includes participation in global Internet governance and the level of cooperation with other countries in network technology and cybersecurity, indicated by the number of AS connections between countries.
(5) Legal regulations and policy environment in cyberspace: This includes the completeness of legal regulations in cyberspace and the extent to which policies support the network economy and innovation, which can be reflected by the Internet penetration rate.
The Belfer NCPI evaluates the cyber capabilities of 30 countries with a focus on assessing the objectives of seven nations [15]. This index incorporates 32 intention indicators and 29 capability indicators, using data sourced from public information. However, the NCPI primarily considers subjective factors related to a country’s influence, governance, and legal frameworks in cyberspace. For a comprehensive assessment of a country’s cyber strength, objective capabilities, such as the number of AS domains and DNS, should be emphasized. Therefore, this study constructs a model for the cyber potential indicator system based on the NCPI index, involving the following steps:
(1) Design the influencing factors of cyber potential, including cyberspace technical strength, cyberspace security capability, international cooperation and diplomacy, economic strength, military strength, population size, and technological level;
(2) Design indicators: For each key factor, corresponding indicators are developed to quantify its influence. For instance, economic strength can be measured by indicators such as gross domestic product (GDP), trade volume, and foreign exchange reserves. Military strength can be assessed by the number of armed forces personnel and the ratio of military expenditure to GDP. The technological level can be evaluated by metrics such as the number of scientific journal articles, patent applications, education penetration rates, and high-tech industry export values. Specific measurement elements are summarized in Table 2.
Drawing on the geopolitical potential model [40], a country’s cyberspace strength can be divided into cyberspace influence (soft power) and overall national influence (hard power). Based on the degree of influence of various indicators, the coefficient of variation weighting method is used to assign weights [41,42]. The coefficient of variation weighting method is an objective approach that derives weights directly from the original indicator data through statistical processing. It is characterized by minimal influence from subjective factors, making it suitable for projects where evaluation indicators are strongly independent. The specific steps are as follows:
① Construct the original indicator data matrix: m indicators and n countries exist, with X representing the original data matrix, where xij denotes the value of the jth indicator for the ith country;
② Data normalization processing:
③ Calculate the standard deviation of the jth indicator, reflecting the absolute variation degree of each indicator Sj, where Sj represents the standard deviation of the jth indicator:
④ Calculate the coefficient of variation for the jth indicator, reflecting the relative variation degree of each indicator:
⑤ Calculate the weight wj for the jth indicator:
Given that current assessments of cyberspace strength prioritize cyberspace power and recognize the substantial impact of network infrastructure on a country’s overall cyberspace strength, this study assigns a weight of 0.7 to the cyberspace influence component (soft power) and 0.3 to the overall national influence component (hard power). The weights assigned to the comprehensive network strength index are listed in Table 3.
(3) After assigning weights to the data, the Z-score standardization method is used to normalize the data to the range [0, 1] [43]. The specific steps are as follows:
Transform the sequence x1, x2, …, n:
The new sequence y1,y2,...yn has a mean of 0 and a variance of 1. Finally, the comprehensive strength of each country is calculated using the following formula.
where aj represents the weights assigned to various indicators, and Mj indicates the metrics formed by network strength and overall strength.
(4) By referencing the geopolitical potential model [40], construct the network potential model:
where WiA represents the network potential of country i in country A; kiA represents the network dependency coefficient of country A on country i, determined by the ratio of A’s network facility import and export trade with i to A’s total network facility trade with the world; a larger kiA indicates a higher network dependency of country A on country i, thereby increasing i’s network influence over A; ∂Pi represents the actual power of country i in country A, including i’s network comprehensive strength Pi and A’s willingness to invest strategically in i’s network ∂; where ∂ is categorized into four levels: fundamental interests, important interests, ordinary interests, and no interests, corresponding to the values of ∂ as 1, (0.5, 1), (0, 0.5], and 0, respectively; c represents the national comprehensive strength of country i; diA represents the network distance between the two countries, which is the network latency.
3.3.2. Force-Directed National Network Potential Map Layout
Based on the network connection clustering of national entities, the number of AS connections between countries and their direct associations are fully considered; however, accurately describing "adjacency" in cyberspace remains challenging. For instance, a greater number of network connections between countries implies a higher degree of dependency on their network communications, which can be expressed as an "adjacent relationship." Therefore, this study utilizes a force-directed layout algorithm to optimize the layout of "sections" in the network space between countries. The force-directed layout algorithm is grounded in principles of physics, simulating repulsive and attractive forces between nodes to achieve optimal node positioning [44]. The basic process is as follows:
First, countries within the same cluster are placed in the same area according to clustering results, with each node’s position initialized randomly;
Next, calculate the repulsive, attractive, and connection forces between nodes. Repulsive forces maintain a certain distance between countries within the same cluster to avoid overlap, whereas attractive forces draw countries within the same cluster closer together to enhance clustering cohesion. Connection forces create connecting lines between countries in different clusters and apply a specific attraction along these lines to ensure the connections between countries are not excessively weak. Update the positions of each node (country) based on the calculated forces. Repeat the calculations of forces and position updates until convergence conditions are satisfied;
Finally, connections are processed by drawing lines or curves between countries to represent their links. Assign proportional areas to each country based on the calculated cyberspace strength index, and redraw the map according to the updated coordinates. To maintain consistent area sizes despite graphical layout changes, country sizes are determined by their network strength, requiring the following steps:
(1) Define the objective function: Define an objective function that measures polygon aggregation and vacant land size, where vacant land refers to unoccupied areas on the map that are not adjacent to countries, as illustrated in Figure 6.
Consider using the distance between polygons to represent aggregation and the method of calculating the area of vacant land to represent its size. Let the objective function for polygon aggregation be f1, and the objective function for vacant land size be f2. The overall objective function is F =ω1f1 + ω2f2, where ω1 and ω2 denote weight coefficients used to balance the importance of the two objective functions. Next, define the distance between polygons as the Euclidean distance between the center points of each polygon. Assuming the coordinates of the center point of the ith polygon are (xi,yi), the distance between polygons can be expressed as follows:
Assume that the polygon has n vertices with coordinates (x1,y1), (x2,y2)……(xn,yn). The coordinates of the center point of the polygon are given by(x,y):; the objective function for polygon aggregation can be defined as the weighted sum of distances between polygons: , where N denotes the number of polygons and ωij denotes the weight coefficient between polygons i and j. The objective function for vacant land size can be defined as the sum of the areas of the bounding rectangles of the polygons minus the sum of the areas of all polygons:
where Sij denotes the area between the bounding rectangles of polygons i and j, and Ai and Aj denote the areas of polygons i and j, respectively. The area of a polygon is given by:
where n denotes the number of vertices of the polygon, (xi,yi) is the coordinate of the ith vertex, and(xi+1,yi+1)is the coordinate of the next vertex. The area between the bounding rectangles is:
where (xi,yi)and(xj,yj)are the center coordinates of polygons i and j.
(2) Define the constraints: To ensure that the polygons are aggregated together without vacant land, the following constraints are added:
- The minimum distance between polygons is no less than a preset value dmin;
- The maximum area of vacant land does not exceed a preset value Smax;
- The area of each polygon after updating the coordinates must equal its original area.
(3) Solve the optimization problem: Combine the objective function and constraints into an optimization problem, resulting in a standard optimization problem of the following form:
minimize F(x)
subject togi(x) ≤ 0, i = 1, ..., m
hj(x) = 0, j = 1, ..., p
where x denotes the coordinate vector of the polygons, gi(x) and hj(x) denote the inequality and equality constraint functions, respectively, where m and p denote the numbers of inequality and equality constraints, respectively. The problem is solved using nonlinear programming to obtain the optimal solution. Finally, the coordinates of relevant points and lines are updated using the calculated optimal solution, as illustrated in Figure 7.
4. Experiment and Discussion
4.1. Experiment on Building a Cyber Potential Metaphor Map
The experiment utilizes AS connectivity data and the number of vulnerabilities in various countries, comprising 6,842 entries in the AS connectivity dataset, along with total asset counts and 302 CVE vulnerabilities per country. These data allows for the calculation of the percentage of vulnerabilities per country. Information on the number of IPs, ASNs, DNS servers, and domain names for each country was sourced from publicly available data on Index Mundi and Chacuo websites [45,46].
An IP address is a unique identifier for devices on the Internet [47]. A higher number of IP addresses owned by a country or organization generally indicates a larger number of connected devices and a broader network scale on the Internet [48]. An AS is a fundamental Internet unit comprising a group of networks formed by one or more IP address prefixes. AS connectivity data include connection information between different autonomous systems, encompassing network routing and transmission protocols that facilitate global Internet connectivity. Countries or organizations with more ASes typically exhibit more network nodes and a more complex Internet architecture [48]. DNS servers are responsible for converting domain names into corresponding IP addresses. A higher number of DNS servers suggests stronger infrastructure for domain name resolution, supporting more effective management and distribution of DNS queries [49].
This study assesses the network influence of countries using indicators such as the number of IPs, AS counts, DNS server counts, domain counts, Internet penetration rates, secure Internet server counts, vulnerability counts, GDP, and land area. Specific units and data cutoff times are summarized in Table 4.
The cyberspace strength index of each country can be obtained through the calculation formula in 2.3.2, and the top ten countries are listed in Table 5.
4.3. Visualization Results of Cybers Potential Metaphor Map
This study employs GMap to visualize AS connectivity data, with the results presented in Figure 8. Subsequently, the clustering criterion was changed to "country names," and a force-directed layout algorithm was utilized to generate the cyber potential metaphor map, as illustrated in Figure 9, where each country name represents an AS domain of that country.
4.4. Experimental Analysis
4.4.1. Analysis of Cyberspace Sphere of Influence and Links
Based on the analysis of the network potential metaphor map, the top ten countries ranked by network strength are the United States, China, Russia, Germany, the United Kingdom, Brazil, Canada, Japan, Australia, and France, as shown in Figure 10. This ranking closely aligns with the top ten cyber powers identified in the "National Cyberspace Capability Index 2022" (NCPI) published by the Belfer Center for Science and International Affairs in 2022 [15], as summarized in Table 6.
The difference arises because the comprehensive strength of cyberspace in this study is calculated using objective data indicators, such as the number of national IPs, ASNs, and vulnerabilities. In contrast, the NCPI relies more heavily on subjective data for analysis, including metrics such as cybersecurity awareness, risk literacy, successful Google content removal requests, and the scale of national standards organizations. The NCPI conceptualizes cyberspace capability as the goals a country seeks to achieve in or through cyberspace. Conversely, the national network comprehensive strength in this study is based on each country’s network mapping resources, providing stronger objectivity in describing national network strength.
The number of connections between countries indicates the scale of their relationships, frequency of interactions, and breadth of cooperation and competition involved. According to the diagram, China has relatively more connections with the United States, Australia, and Japan. This suggests that countries with robust cyber capabilities maintain closer ties, leading to mutually beneficial cooperation. In the diagram, both the United States and China serve as key nodes. The United States sustains close cybersecurity cooperation with European countries through multilateral frameworks including NATO and the Five Eyes Alliance. China advances cyber infrastructure development through the Belt and Road Initiative, enhancing technological collaboration with countries along the route, particularly developing nations. Additionally, China maintains strategic cybersecurity and defense technology cooperation with Russia. European countries exhibit strong cyber connections with the United States, with numerous connections among EU member states. This fosters cybersecurity and supports digital market integration through unified legal and policy frameworks. In Asia, Japan and South Korea have established a solid cybersecurity alliance through bilateral security agreements and technological cooperation with the United States, whereas China also collaborates with these Asian nations. Peripheral countries in the diagram, such as Egypt and Saudi Arabia, display limited connections, primarily owing to geographical proximity. These countries mainly collaborate in areas such as energy and military competition but may face strategic differences in addressing regional conflicts and crises. These intricate inter-state network connections reveal patterns of cooperation and competition in global cybersecurity and technology, reflecting strategic intentions as countries seek to secure advantages in the information age. The complexity and strategic importance of these connections are critical aspects of power dynamics and international relations.
4.4.2. Thematic Information Expression Based on the Cyber Potential Basemap
Thematic information is incorporated into Figure 9 to create the "Global Network Power Distribution and Backbone Level Thematic Map," as shown in Figure 11. This thematic map is designed to display the global distribution of cyber power through an intuitive visual representation. The network space map is used as the base map, where the differences in network strength among countries are depicted by the relative size of the country areas, providing a clear visualization of global network strength distribution. The number of ASs is symbolized using hexagons as the outer frame of the symbols, representing stability and structure to reflect the autonomous nature of network regions.
At the center of the graphic, an icon resembling a signal tower is used to indicate efficient and convenient network signal transmission. A gradient color scheme, ranging from light blue to dark blue, is employed to signify an increase in quantity, conveying information through variations in color intensity. Lines of different thicknesses represent the hierarchical structure of the three AS-backbone network levels, classified as Tier 1, Tier 2, and Tier 3. Tier 1 represents the global Internet backbone, characterized by networks that are directly interconnected and do not rely on external networks for IP packet routing. Tier 2 (secondary backbone) networks are typically regional or national providers that connect to Tier 2 and Tier 1 networks via Internet exchange points or private peering agreements. Tier 3 (tertiary backbone) networks are local or regional providers that offer Internet access to end users and connect to higher-tier networks through rented or purchased bandwidth. The Tier 1 backbone network is represented by thicker lines, which signifies its core position in the global network. The Tier 2 backbone network is depicted with medium-thickness lines, reflecting its robust strength and broad distribution. Owing to the extensive number of Tier 3 networks, they are not fully displayed; only a specific region in Guangdong Province, China, is highlighted to exhibit local network details. Additionally, red, purple, and dark green are used to indicate the number of IP addresses per country, number of DNS servers, and relative number of domain names compared to other countries, respectively. The overall design aims to deliver a comprehensive analysis of global network resources and their structural hierarchy through a layered data presentation and visually engaging graphical display.
5. Conclusions and Prospects
5.1. Conclusions
This study investigates the connectivity data of AS from various countries as a base map to calculate and represent the comprehensive cyberspace strength of each country. This strength is metaphorically depicted as a geographical map to exhibit their relative positions and influence in cyberspace. Through comprehensive calculations and spatial metaphor representation, this research offers a novel perspective for analyzing and understanding national cyberspace development. By analyzing the AS connectivity data of each country, assessments of their comprehensive cyberspace strength were derived and represented by area size. The findings reveal that countries with stronger cyberspace strength occupy larger areas on the cyberspace map, whereas those with weaker strength appear in smaller areas. This visualization method effectively illustrates the relative positions and strength disparities among countries in cyberspace. The main contributions and innovations of this study are as follows:
(1) Drawing from the geopolitical potential model, this study proposes the "cyber potential" model to measure the influencing factors among countries in cyberspace. This model reflects the impact of countries on a shared region’s cyberspace, revealing their cyberspace strength.
(2) This research improves the GMap algorithm to better represent the spatial influence of each country’s cyberspace, addressing issues such as regional dispersion and clustering, ensuring that nodes representing the same country are grouped together in a manner consistent with geographic representations.
(3) By applying the concept of metaphorical mapping, the complex and abstract nature of cyberspace is represented as an intuitive geographical space. The resulting cyberspace spatial influence map shows that larger areas indicate stronger network strength, whereas closely situated countries suggest cooperative networking.
5.2. Prospects
Although this study has made significant progress in investigating cyberspace maps, several areas warrant further exploration and improvement. First, the evaluation index system for comprehensive cyberspace strength can be refined. Currently, national cyberspace strength is primarily assessed using factors such as IP counts, ASN counts, and vulnerabilities. However, with technological advancements, additional important indicators, such as cyber infrastructure, security capabilities, innovation in cyber applications, governance, and sustainability, may become relevant. Future research should focus on incorporating more comprehensive and precise evaluation metrics. Second, the geographical metaphor for representing cyber strength can be expanded to include more dimensions. This study simplifies cyber strength to area size on a geographical map, which provides an intuitive representation. However, cyber strength may also encompass dimensions such as influence range and resilience. Exploring various metaphorical representations could provide a more nuanced reflection of the position and strength of each country in cyberspace. Finally, a deeper investigation into the influencing factors and policy implications of national cyber strength is necessary. Whereas this study provides a preliminary analysis of the components of cyber strength, further examination of the relationships between these factors and their mechanisms of influence is needed. Integrating these insights with the current needs and status of different countries could yield targeted policy recommendations to guide their cyberspace development strategies.
In summary, the findings of this study present new perspectives and methods for understanding and analyzing national cyberspace development. Future research should aim to further investigate evaluation metrics, metaphorical geographical representations, and influencing factors and policy recommendations, advancing the field of cyberspace map research and innovation. The findings and methods presented herein lay the foundation for more detailed analyses and innovative approaches in the field of cyberspace research, contributing to better strategies for national cyber development.
Author Contributions
Conceptualization, Dngyu Si and Bingchuan Jiang; Methodology Design and Implementation, Bingchuan Jiang; Validation and Data Verification, Qing Xia and Jingxu Liu; Formal Data Analysis, Xiao Wang; Investigation and Primary Data Collection, Dngyu Si; Resource Management, Dngyu Si; Original Draft Preparation, Dngyu Si; Manuscript Review and Editing, Bingchuan Jiang. All authors have read and agreed to the published version of the manuscript.
Funding
This study was supported by National Natural Science Foundation of China (No. 42171456).
Data Availability Statement
The data used to substantiate the findings of this research are accessible upon reasonable request from the corresponding author.
Conflicts of Interest
The authors declare that they have no known competing financial interests or personal relationships that could have appeared to influence the work reported in this paper.
References
- Zhang, L.; Zhou, Y.; Shi, Q.S.;Luo, X.Y.; Zhao, H.P. Cyberspace map tightly coupled with geographical space. J Cyber Sec 2018, 3, 63–72. [CrossRef]
- Tsou, M.H. Mapping cyberspace: Tracking the spread of ideas on the internet//25th International Cartographic Conference; Paris. Available online: http://icaci.org/files/documents/ICC_proceedings/ICC2011/Oral Presentations PDF/D3-Internet, web services and web mapping/CO-354.pdf.2011.
- Tsou, M.H.; Kim, I.H.; Wandersee, S.; Lusher, D.; An, L.; Spitzberg, B.; Gupta, D.; Gawron, J.M.; Smith, J.; Yang, J.A.; et al. Mapping ideas from cyberspace to realspace: Visualizing the spatial context of keywords from web page search results. Int J Digit Earth 2014, 7, 316–335. [CrossRef]
- Han, S.Y.; Tsou, M.H.; Clarke, K.C. Revisiting the death of geography in the era of Big Data: The friction of distance in cyberspace and real space. Int J Digit Earth 2018, 11, 451–469. [CrossRef]
- Yang, J.A.; Tsou, M.H.; Spitzberg, B.; et al. Mapping spatial information landscape in cyberspace with social media. CyberGIS Geospatial Discov Innov 2019, 71–86. [CrossRef]
- Wu, A.X.; Taneja, H. Reimagining internet geographies: A user-centric ethnological mapping of the World Wide Web. J Comput Mediated Commun 2016, 21, 230–246. [CrossRef]
- Lu, Z.; Chi, F.; Wang, R.; Han, B.; Wu, S.F.; Han, R.L. Comparison of realistic geo-space and virtual cyberspace in China. Sci Geogr Sin 2008, 05, 601–606.
- The Internet Map[EB/OL], 2024-05-21. Available online: http://internet-map.net/.
- Holmquist, L.E.; Fagrell, H.; Busso, R. Navigating cyberspace with cybergeo maps//Proceedings of IRIS, 1998; Vol. 21.
- Chen, S.; Li, S.H.; Chen, S.M.; Yuan, X. R-map: A map metaphor for visualizing information reposting process in social media. IEEE Trans Vis Comput Graph 2020, 26, 1204–1214. [CrossRef]
- Wise, J.A.; Thomas, J.J.; Pennock, K.; Lantrip, D.; Pottier, M.; Schur, A.; Crow, V. Visualizing the non-visual: Spatial analysis and interaction with information from text documents. Proceedings of the Visualization 1995 Conference; IEEE Publications, 2009; pp. 51–58. [CrossRef]
- Xin, R.; Ai, T.H.; He, Y.K. Visualisation and analysis of nonspatial hierarchical data of gasper map. Acta Geod Cartogr Sin 2017, 46, 2006–2015. http://xb.chinasmp.com/EN/10.11947/j.AGCS.2017.20160596. [CrossRef]
- Liu, W.; Liu, G.; Fu, Z. Nonlinear Least Squares Phase Unwrapping Based on Topographic Slopes. Geogr Inf Sci 2013, 15. [CrossRef]
- Qi, K.; Zhang, H.; Zhou, Y.; Liu, Y.F.; Li, Q.X. Metaphor representation of resource nodes in cyberspace based on local Moran index and PageRank algorithm[J]. QiK. Geogr Inf Sci 2024.
- Voo, J.; Hemani, I.; Cassidy, D. National Cyber Power Index 2022[R]; Belfer Center for Science and International Affairs, Harvard University: MA, 2022.
- In Global Cybersecurity Index 2021[R]; International Telecommunication Union: Geneva, 2021; 16. Global Cybersecurity Index 2021[R]; International Telecommunication Union: Geneva, 2021.
- Network Readiness Index [Report][R].Commonwealth of Virginia: Potomac Institute for Policy Studies, 2015.
- In Cyber Power Index[R]; Economist Intelligence Unit, Booz Allen Hamilton: Chicago, 2011; 18. Cyber Power Index[R]; Economist Intelligence Unit, Booz Allen Hamilton: Chicago, 2011.
- Su, C. Study on International Law of Cyberspace Governance[D]; Heilongjiang University: Harbin, 2021.
- Leetaru, K.; Wang, S.; Cao, G.; Padmanabhan, A.; Shook, E. Mapping the global Twitter heartbeat: The geography of Twitter. First Monday 2013. [CrossRef]
- Hu, Z.L. Metaphor and Cognition; Peking University Press: Beijing, 2004.
- Women, L.G. Fire, and Dangerous Things: What Categories Reveal About the Mind; University of Chicago Press: Chicago, 2008.
- Ventalon, G.; Erjavec, G.; Tijus, C. Processing visual metaphors in advertising: An exploratory study of cognitive abilities. J Cogn Psychol 2020, 32, 816–826. [CrossRef]
- Su, S.L.; Wang, L.Q.; Du, Q.Y.; Zhang, J.Y.; Kang, M.J.; Weng, M. Fundamental theoretical issues of metaphorical map[J/OL]. Geogr Inf Sci 2022, 1–13.(2022-12-29).
- Wu, C.; Chen, M.; Zhou, L.; Liang, X.; Wang, W. Identifying the spatiotemporal patterns of traditional villages in China: A multiscale perspective. Land 2020, 9, 449. [CrossRef]
- Li, A. Study on Combination and Transfer Between High-Speed Railway and Urban Rail Transit[D]; Beijing Jiaotong University: Beijing, 2011.
- Zhang, L.; Wang, G.X.; Jiang, B.C.; Zhang, L.T.; Ma, L. A review of visualization methods of cyberspace map. Geom Inf Sci Wuhan Univ 2022, 47, 2113–2122. [CrossRef]
- Gansner, E.R.; Hu, Y.; Kobourov, S.G. Gmap: Drawing graphs as maps. Graph Drawing: 17th International Symposium, GD 2009, Chicago, USA, Sep 22–25, 2009. Revised Papers 17; Springer: Berlin Heidelberg, 2010; pp. 405–407.
- Gansner, E.R.; Hu, Y.; Kobourov, S. GMap: Visualizing graphs and clusters as maps IEEE Pacific Visualization Symposium (PacificVis); IEEE Publications, 2010; Vol. 2010; pp. 201–208. [CrossRef]
- Gansner, E.R.; Gansner, E.R.; Kobourov, S.G. Visualizing graphs and clusters as maps. IEEE Comput Graph Appl 2010, 30, 54–66. [CrossRef]
- Kobourov, S.G.; Pupyrev, S.; Simonetto, P. Visualizing graphs as maps with contiguous regions. Eurovis (Short Pap), 2014.
- Mashima, D.; Kobourov, S.G.; Hu, Y. Visualizing dynamic data with maps. IEEE Trans Vis Comput Graph 2012, 18, 1424–1437. [CrossRef]
- Miller, J.; Kobourov, S.; Huroyan, V. Browser-based hyperbolic visualization of graphs 15th Pacific Visualization Symposium (PacificVis); IEEE Publications; IEEE Publications, 2022; Vol. 2022; pp. 71–80. [CrossRef]
- Goyal, P.; Ferrara, E. Graph embedding techniques, applications, and performance: A survey. Knowl Based Syst 2018, 151, 78–94. [CrossRef]
- Perozzi, B.; Al-Rfou, R.; Skiena, S. Deepwalk: Online learning of social representations. Proceedings of the 20th ACM SIGKDD International Conference on Knowledge Discovery and Data Mining, 2014; pp. 701–710. [CrossRef]
- Grover, A.; Leskovec, J. node2vec: Scalable feature learning for networks. Proceedings of the 22nd ACM SIGKDD International Conference on Knowledge Discovery and Data Mining 2016, 2016, 855–864. [CrossRef]
- MacQueen, J. Some methods for classification and analysis of multivariate observations. Proceedings of the Fifth Berkeley Symposium on Mathematical Statistics and Probability, 1967; Vol. 1; pp. 281–297.
- Newman, M.E.J. Fast algorithm for detecting community structure in networks. Phys Rev E Stat Nonlin Soft Matter Phys 2004, 69, 066133. [CrossRef]
- Newman, M.E.J. Modularity and community structure in networks. Proc Natl Acad Sci USA 2006, 103, 8577–8582. [CrossRef]
- Wang, Z.Y. Discussion on the Interaction Between Geo-potential and Bilateral Relations——Take China and the United States INTHE 10 ASEAN Countries as an Example[D]; Yunnan Normal University: Kunming, 2021.
- Sun, H.J. On division of weight and weighting approach. J Dongbei Univ Fin Econ 2009, 04, 3–7.
- Wang, X.M. Analysis of Geo-potential on Countries Involved in the South China Sea Disputes[D]; Liaoning Normal University: Dalian, 2015.
- Altman, E.I. Financial ratios, discriminant analysis and the prediction of corporate bankruptcy. J Fin 1968, 23, 589–609. [CrossRef]
- Fruchterman, T.M.J.; Reingold, E.M. Graph drawing by force-directed placement [Software]. Softw Pract Exp 1991, 21, 1129–1164. [CrossRef]
- Global National and Regional IP Address Segments[EB/OL], 2024-05-21. Available online: http://ipblock.chacuo.net/.
- Index Mundi[EB/OL], 2024-05-21. Available online: https://www.indexmundi.com/.
- What is an IP address? How Does It Work?[EB/OL], 2024-05-21. Available online: https://www.fortinet.com/resources/cyberglossary/what-is-ip-address.
- Clark, D. The design philosophy of the DARPA Internet protocols. Symposium Proceedings on Communications architectures and protocols, 1988; pp. 106–114. [CrossRef]
- Ramdas, A.; Muthukrishnan, R. A survey on DNS security issues and mitigation techniques International Conference on Intelligent Computing and Control Systems (ICCS); IEEE Publications, 2019; Vol. 2019; pp. 781–784. [CrossRef]
Figure 1.
Cyberspace potential metaphor map design ideas.
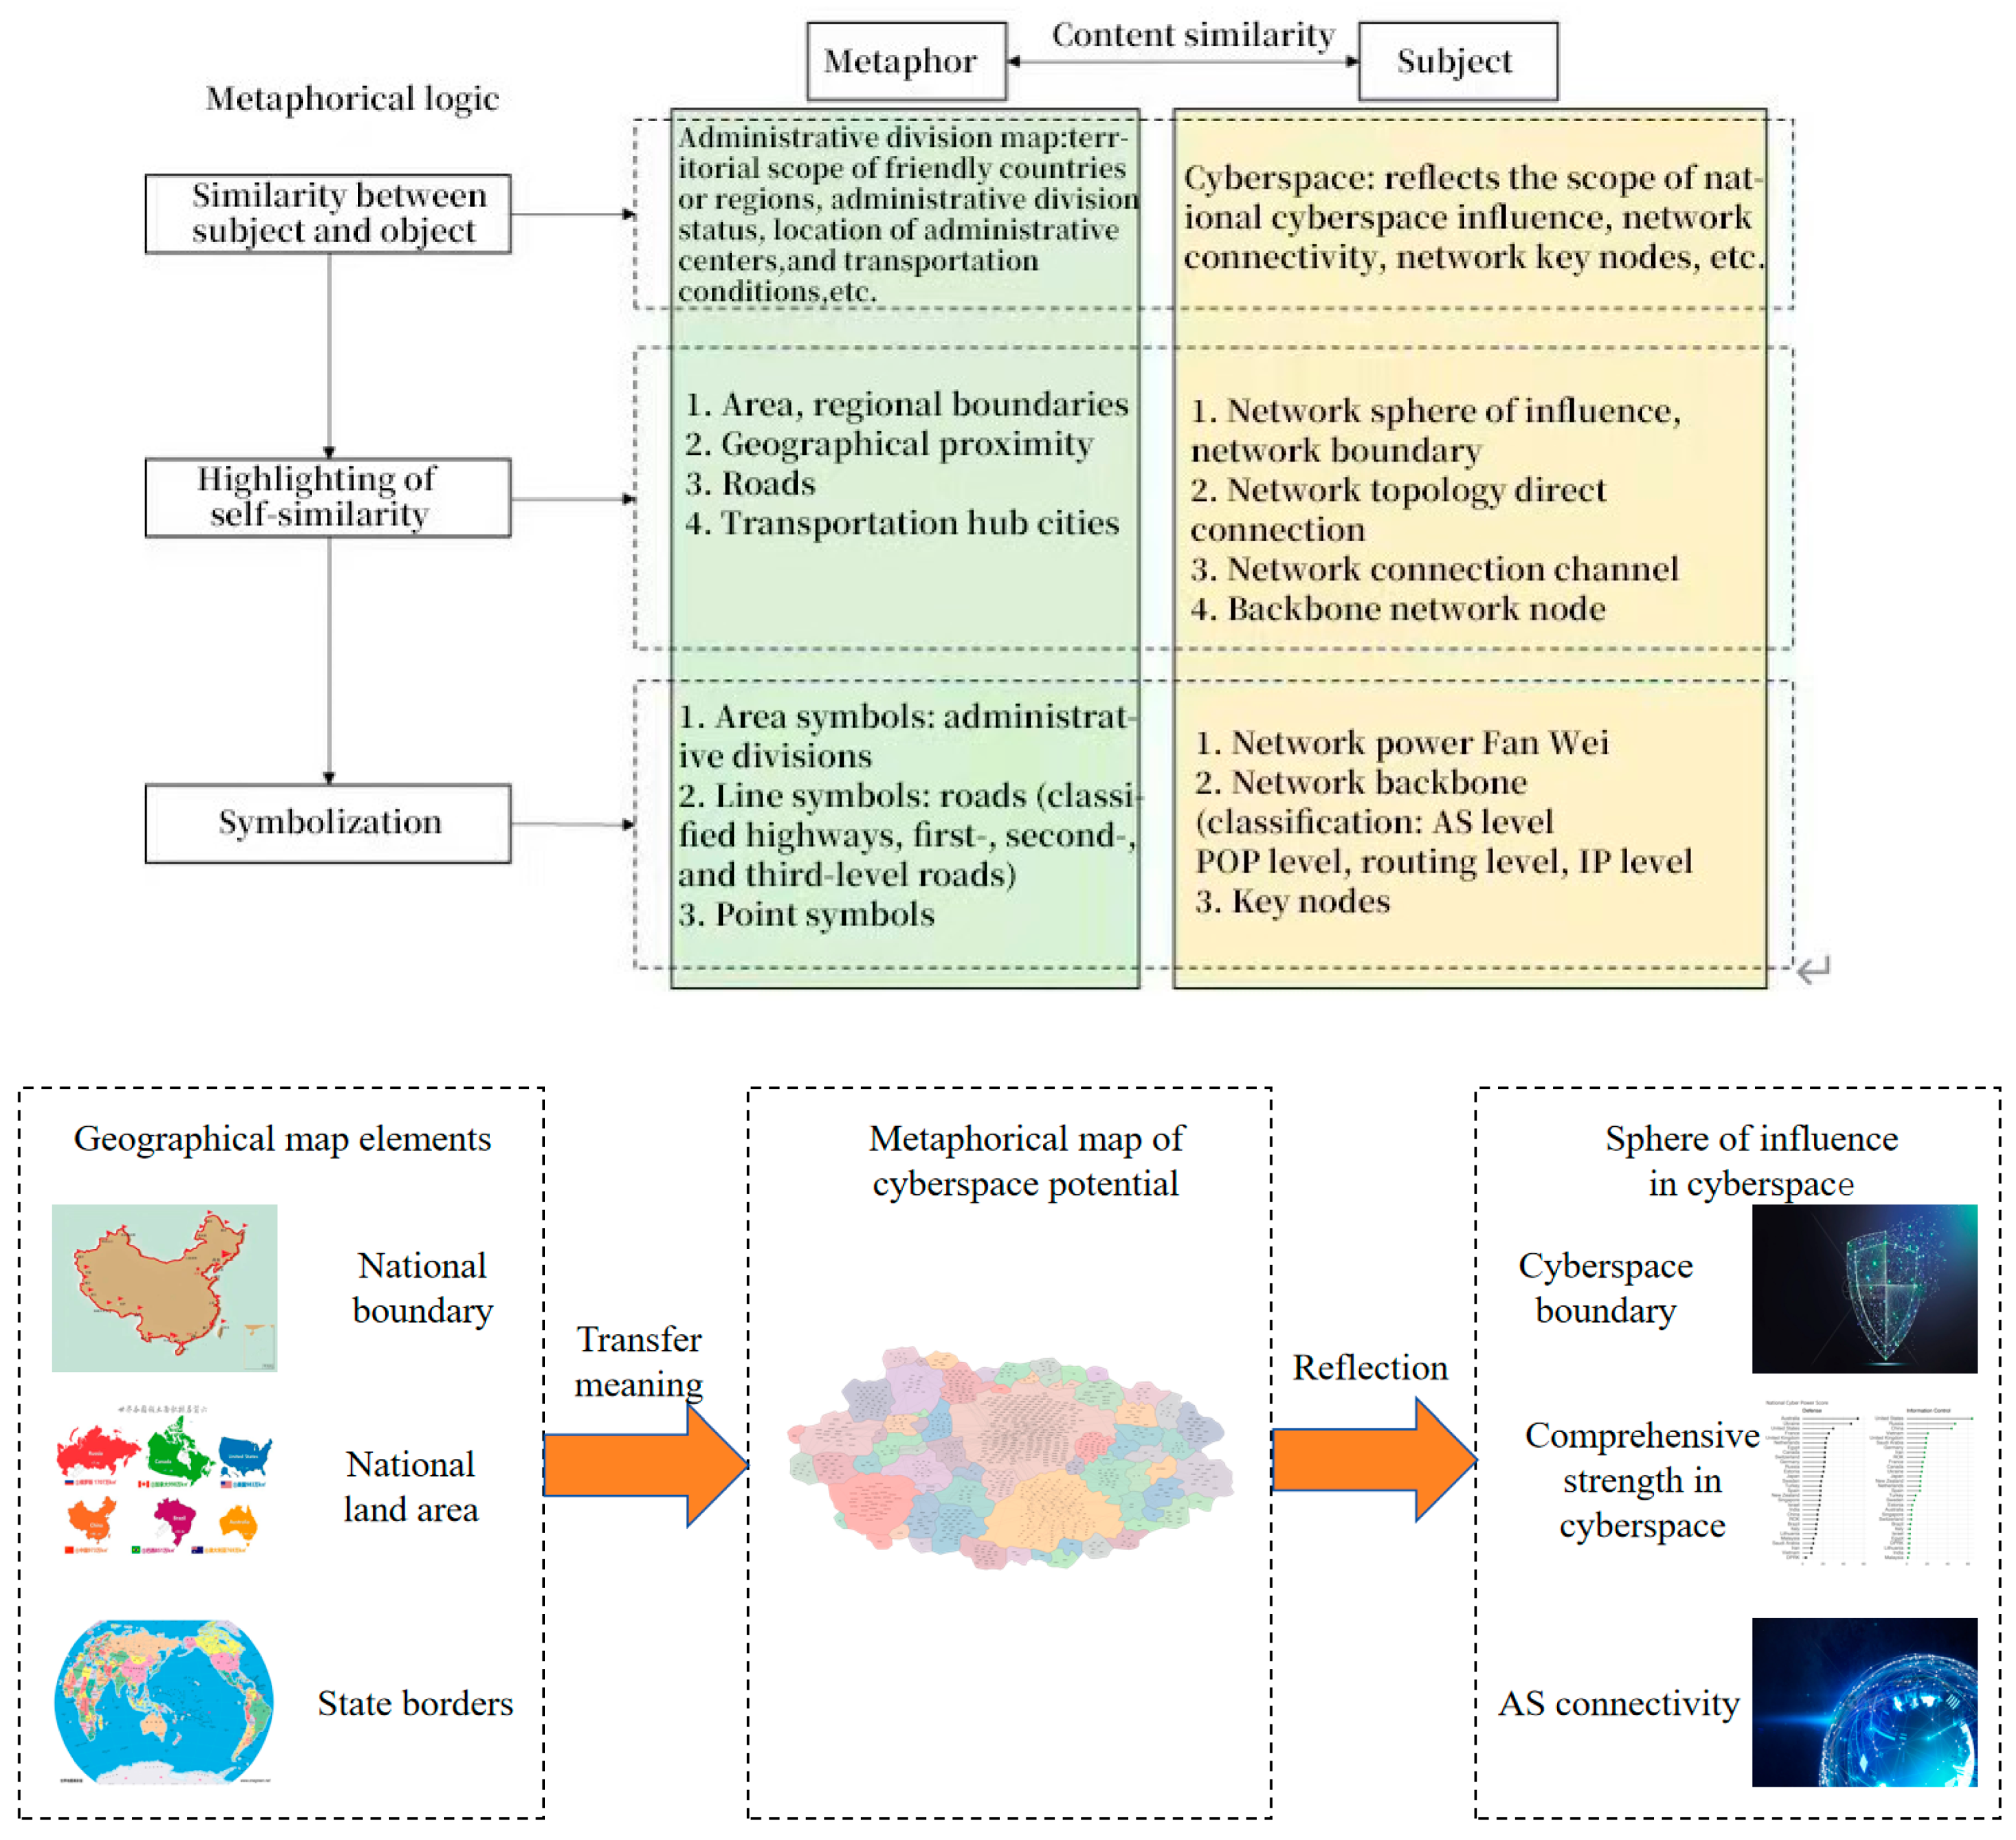
Figure 2.
Method of constructing a metaphorical map of cyberspace potential.
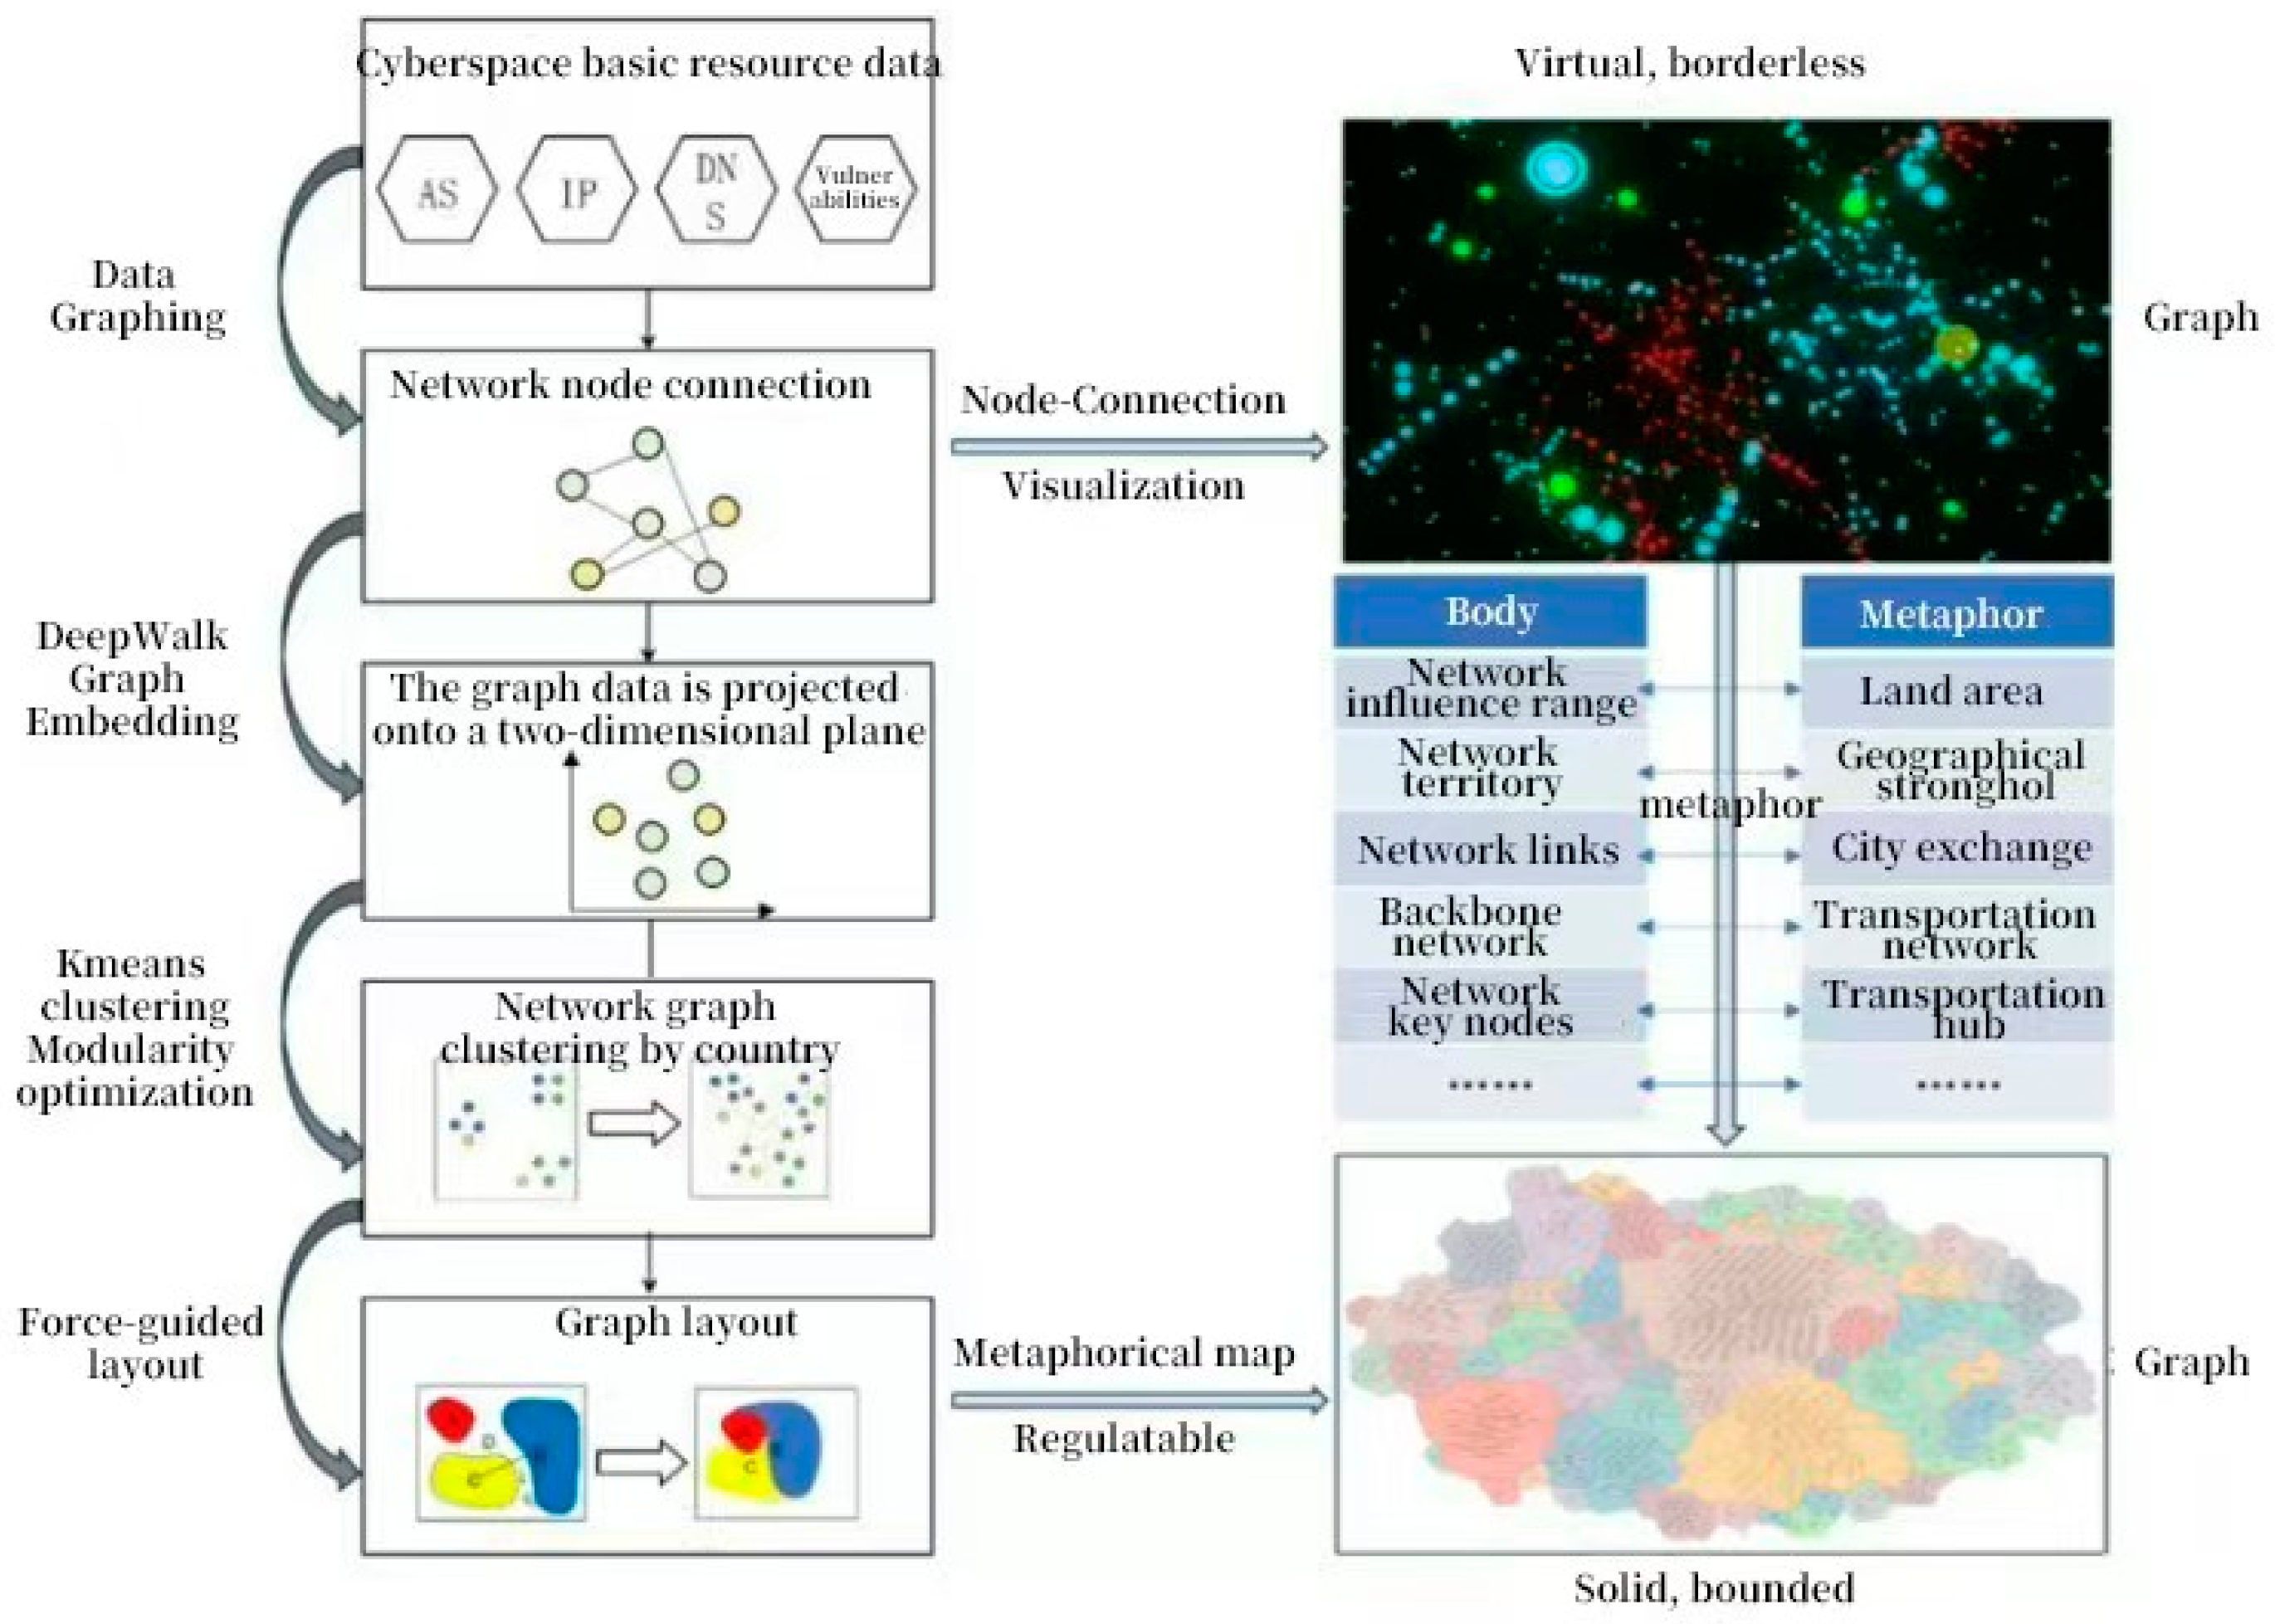
Figure 3.
Use the DeepWalk algorithm for graph embedding.
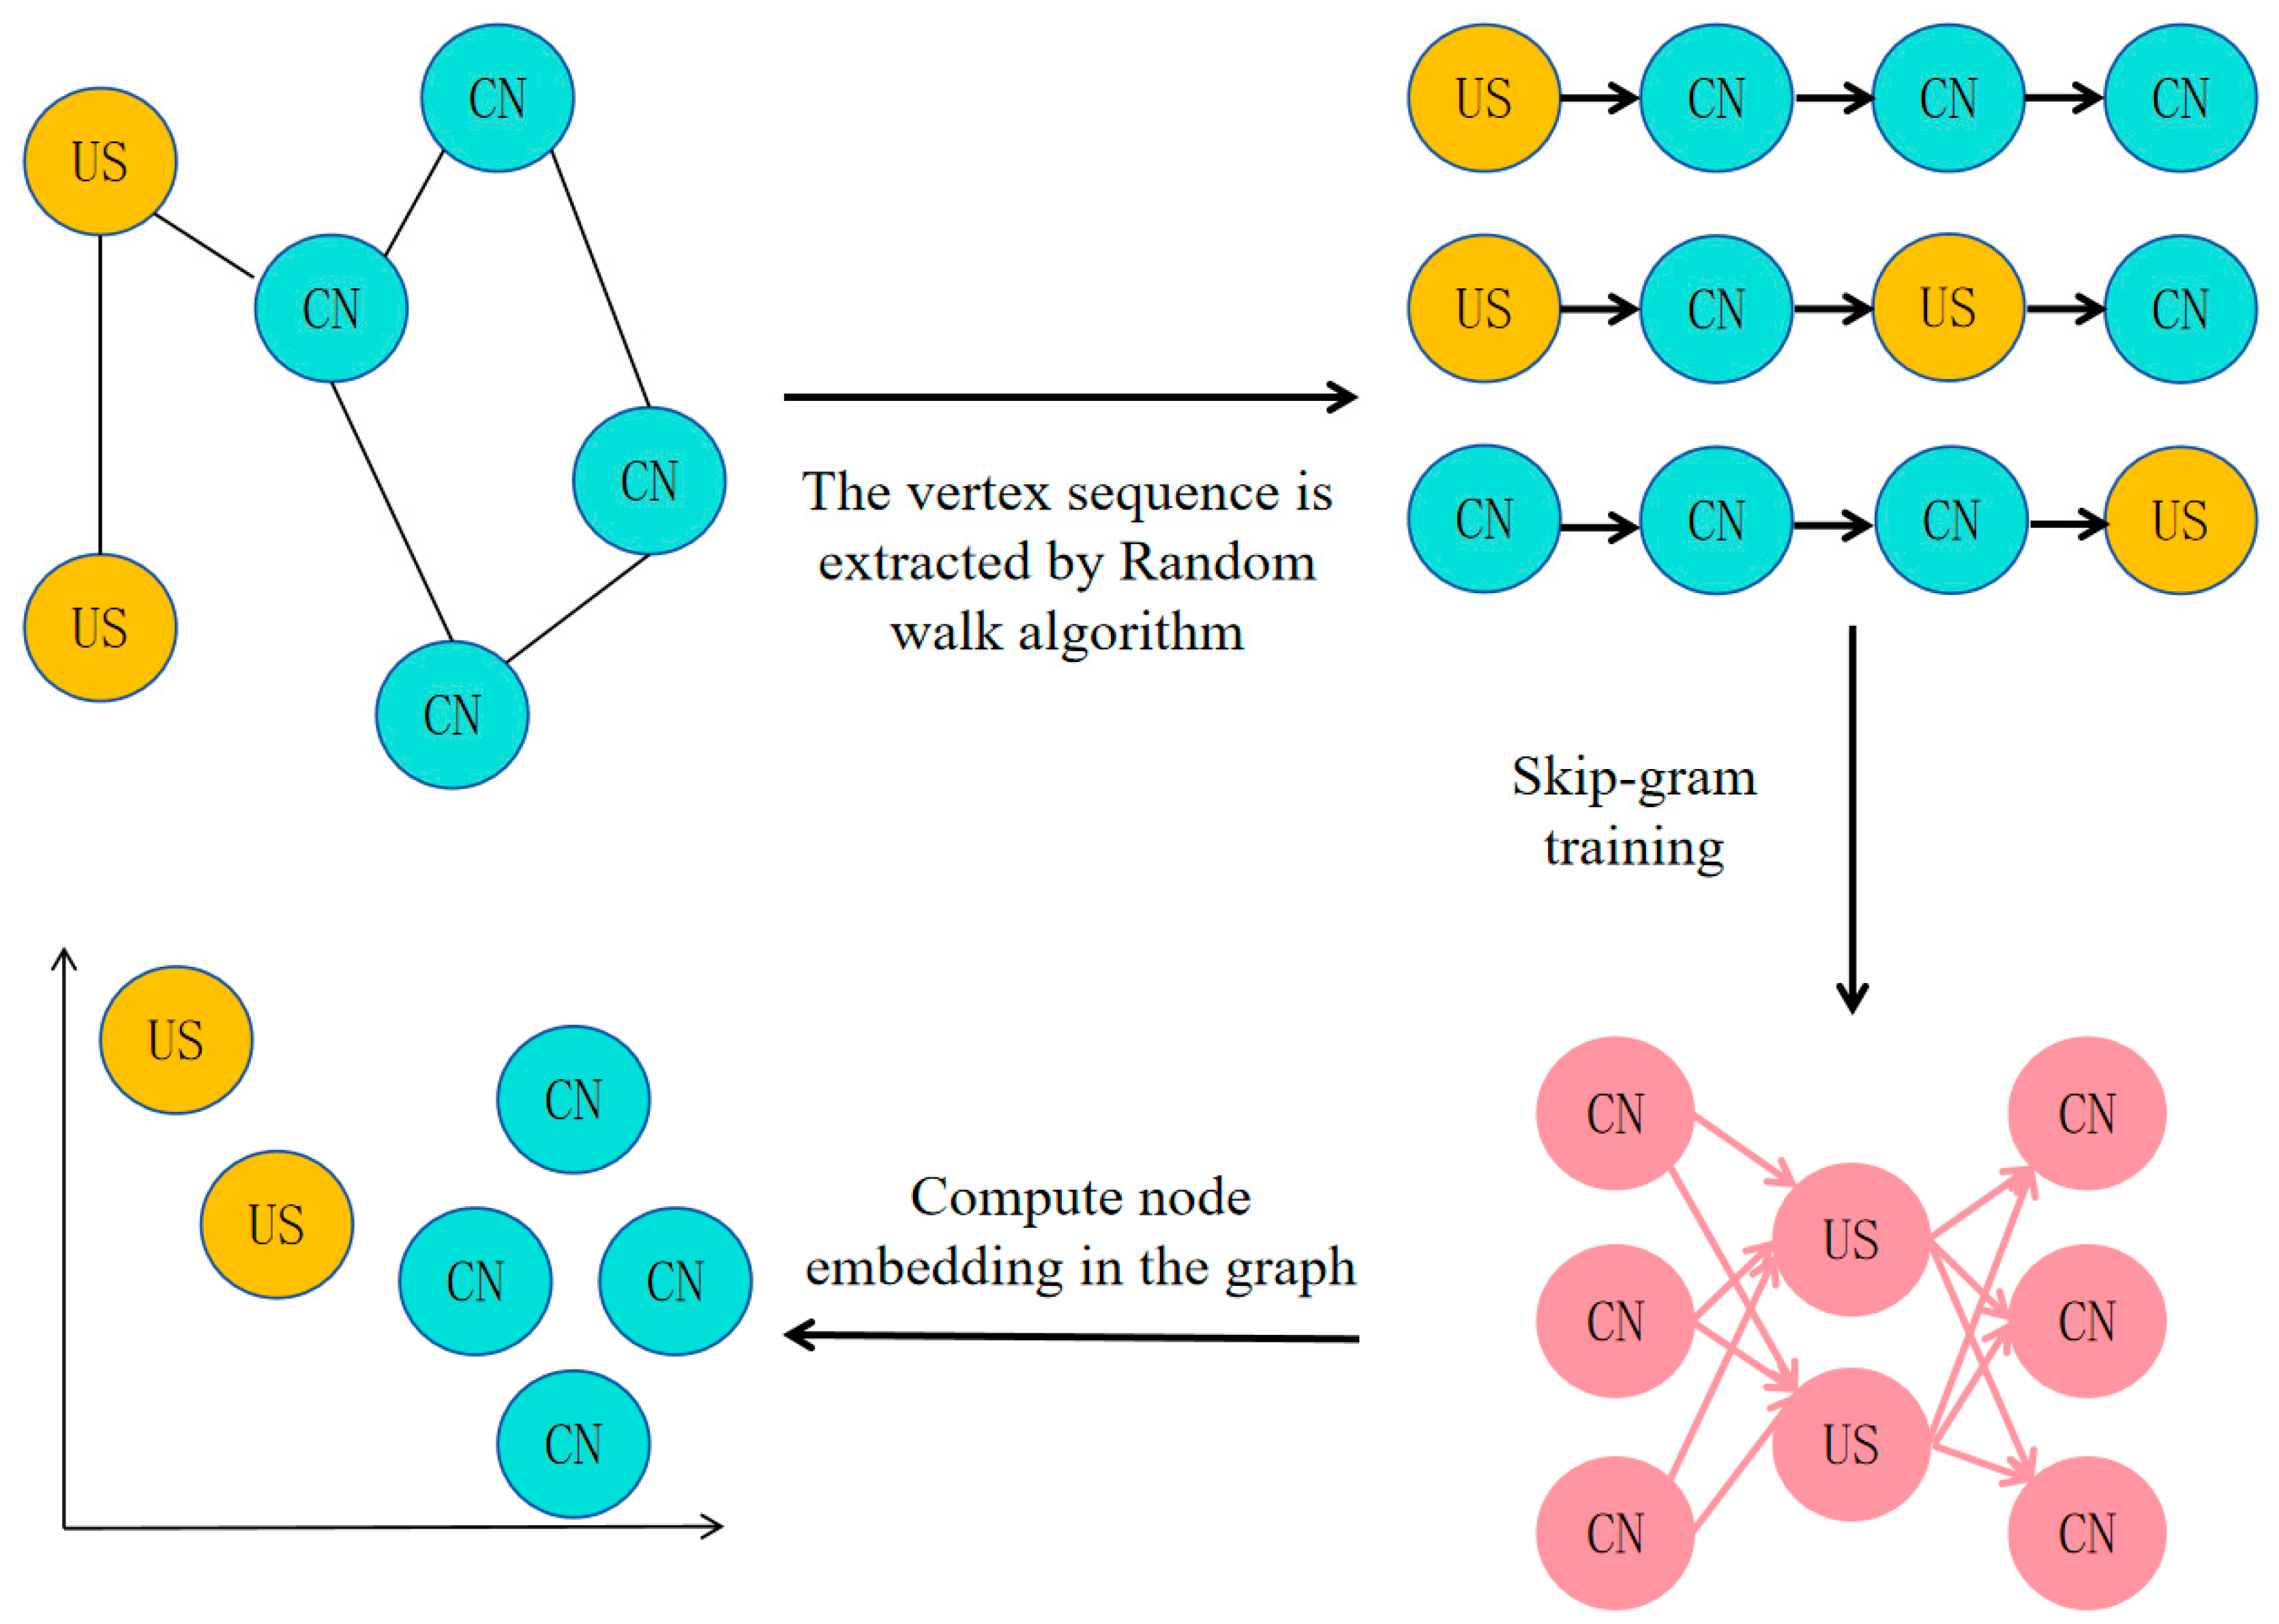
Figure 4.
K-means algorithm flow chart.
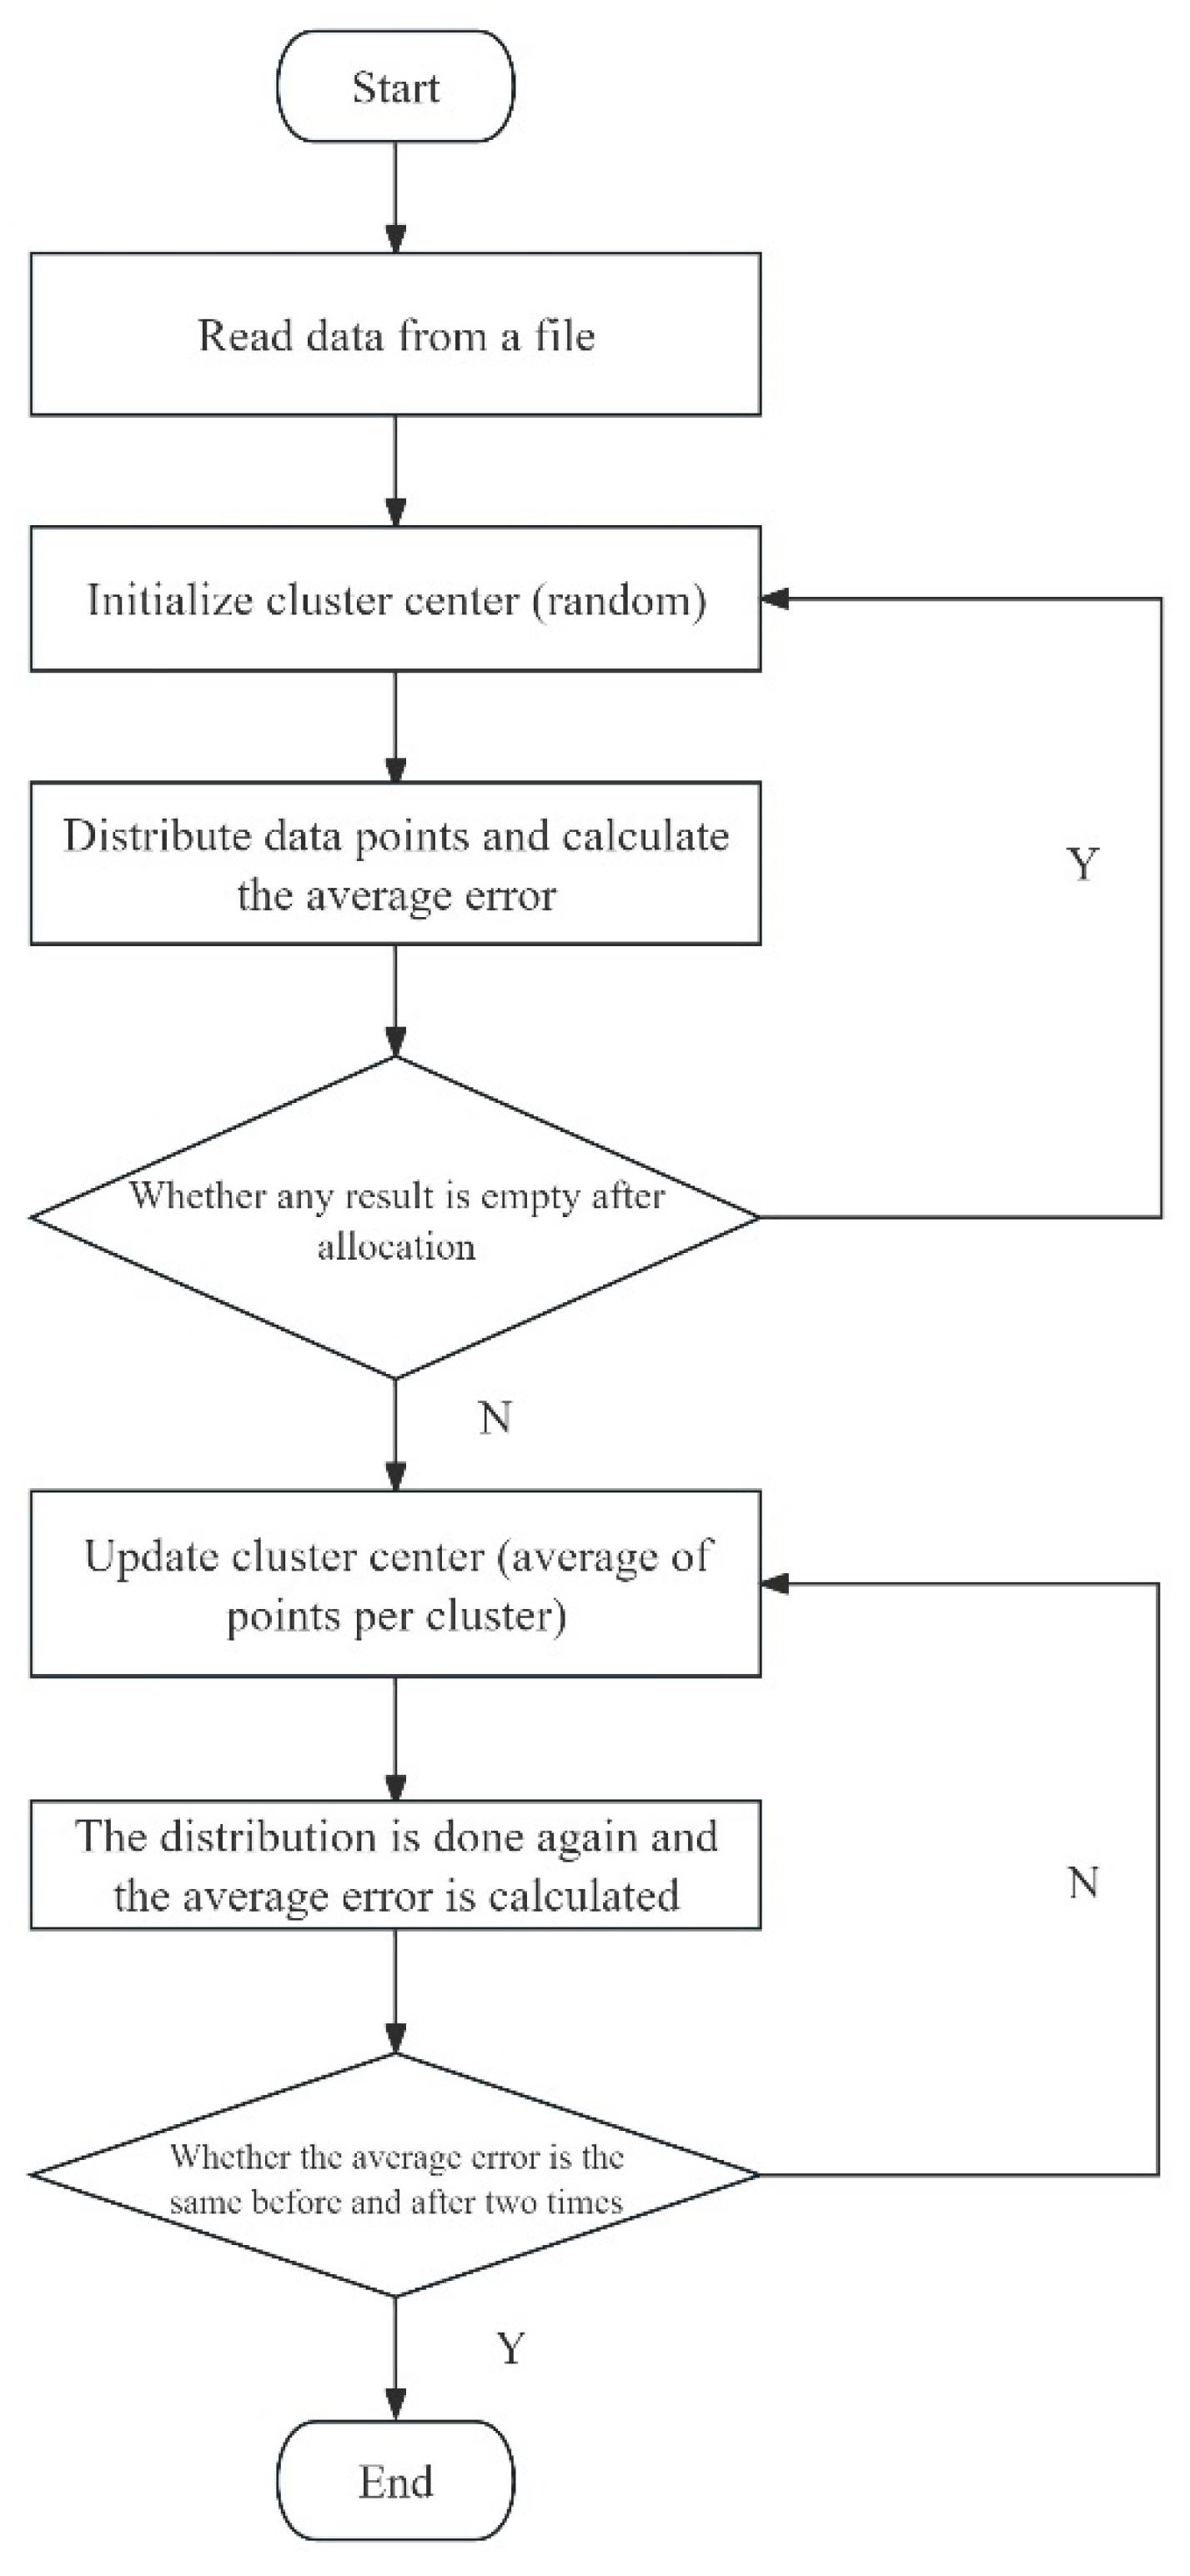
Figure 5.
K-means algorithm steps.
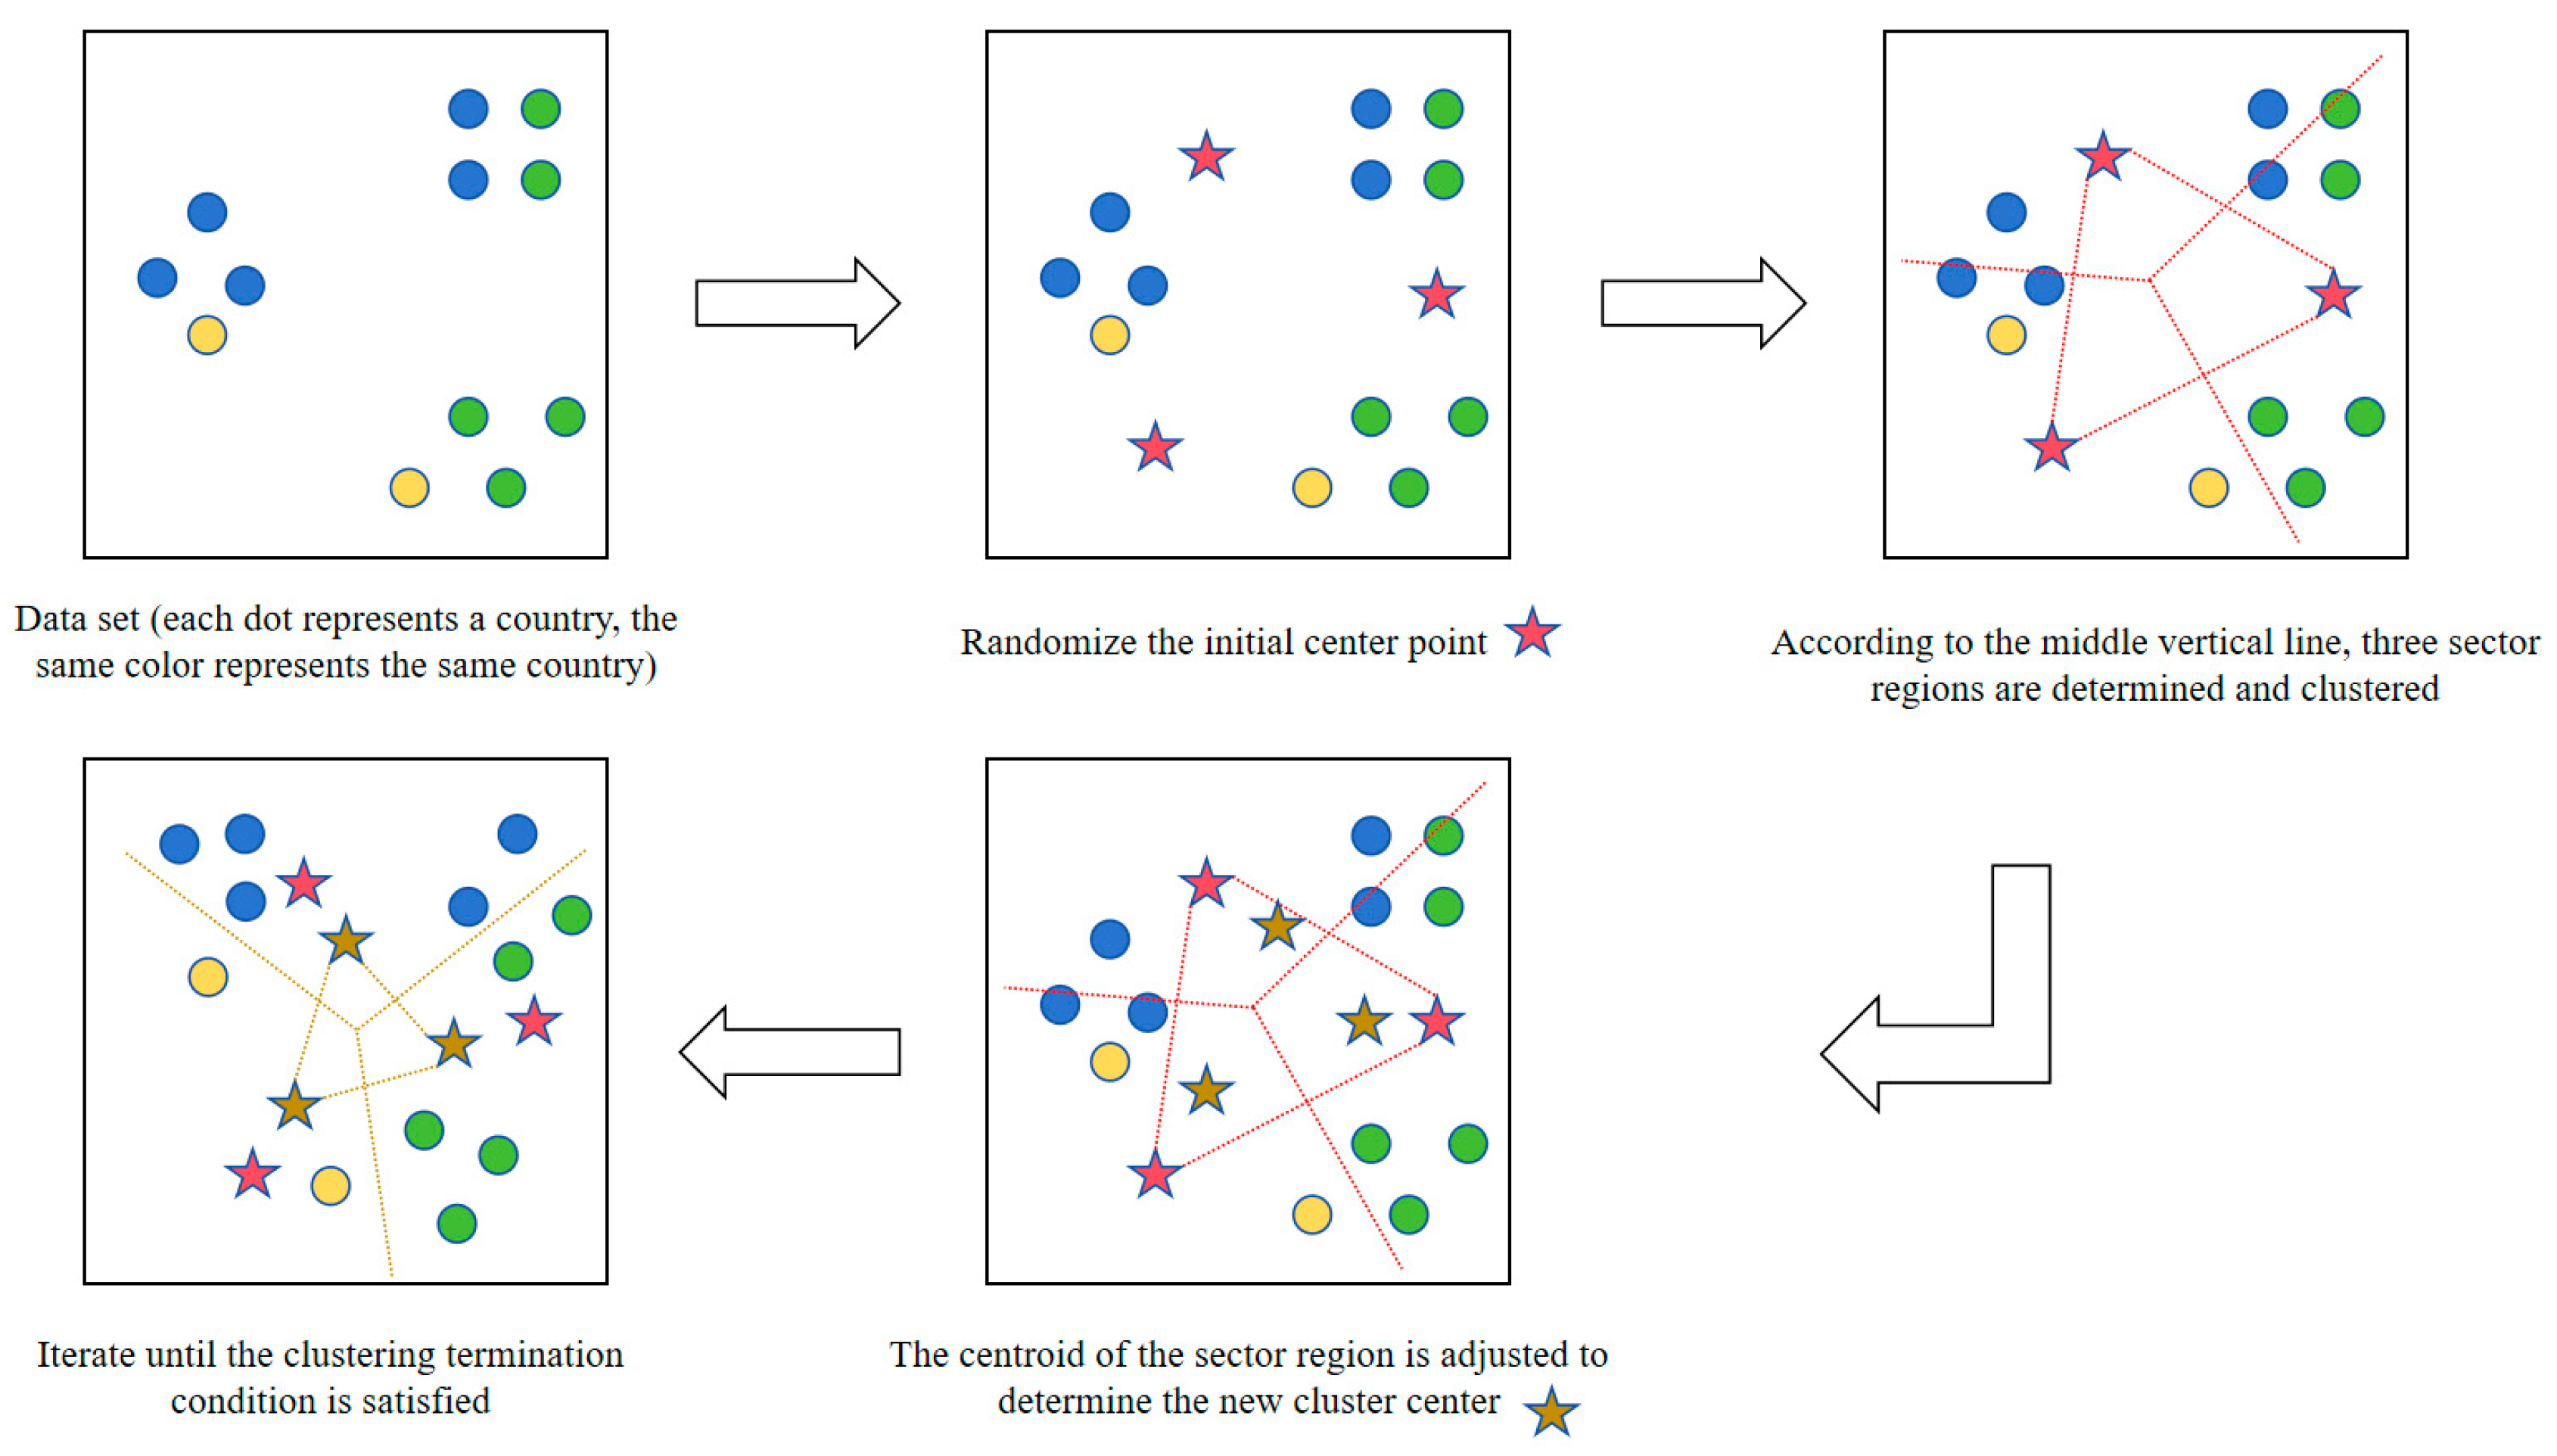
Figure 6.
Open space indication.
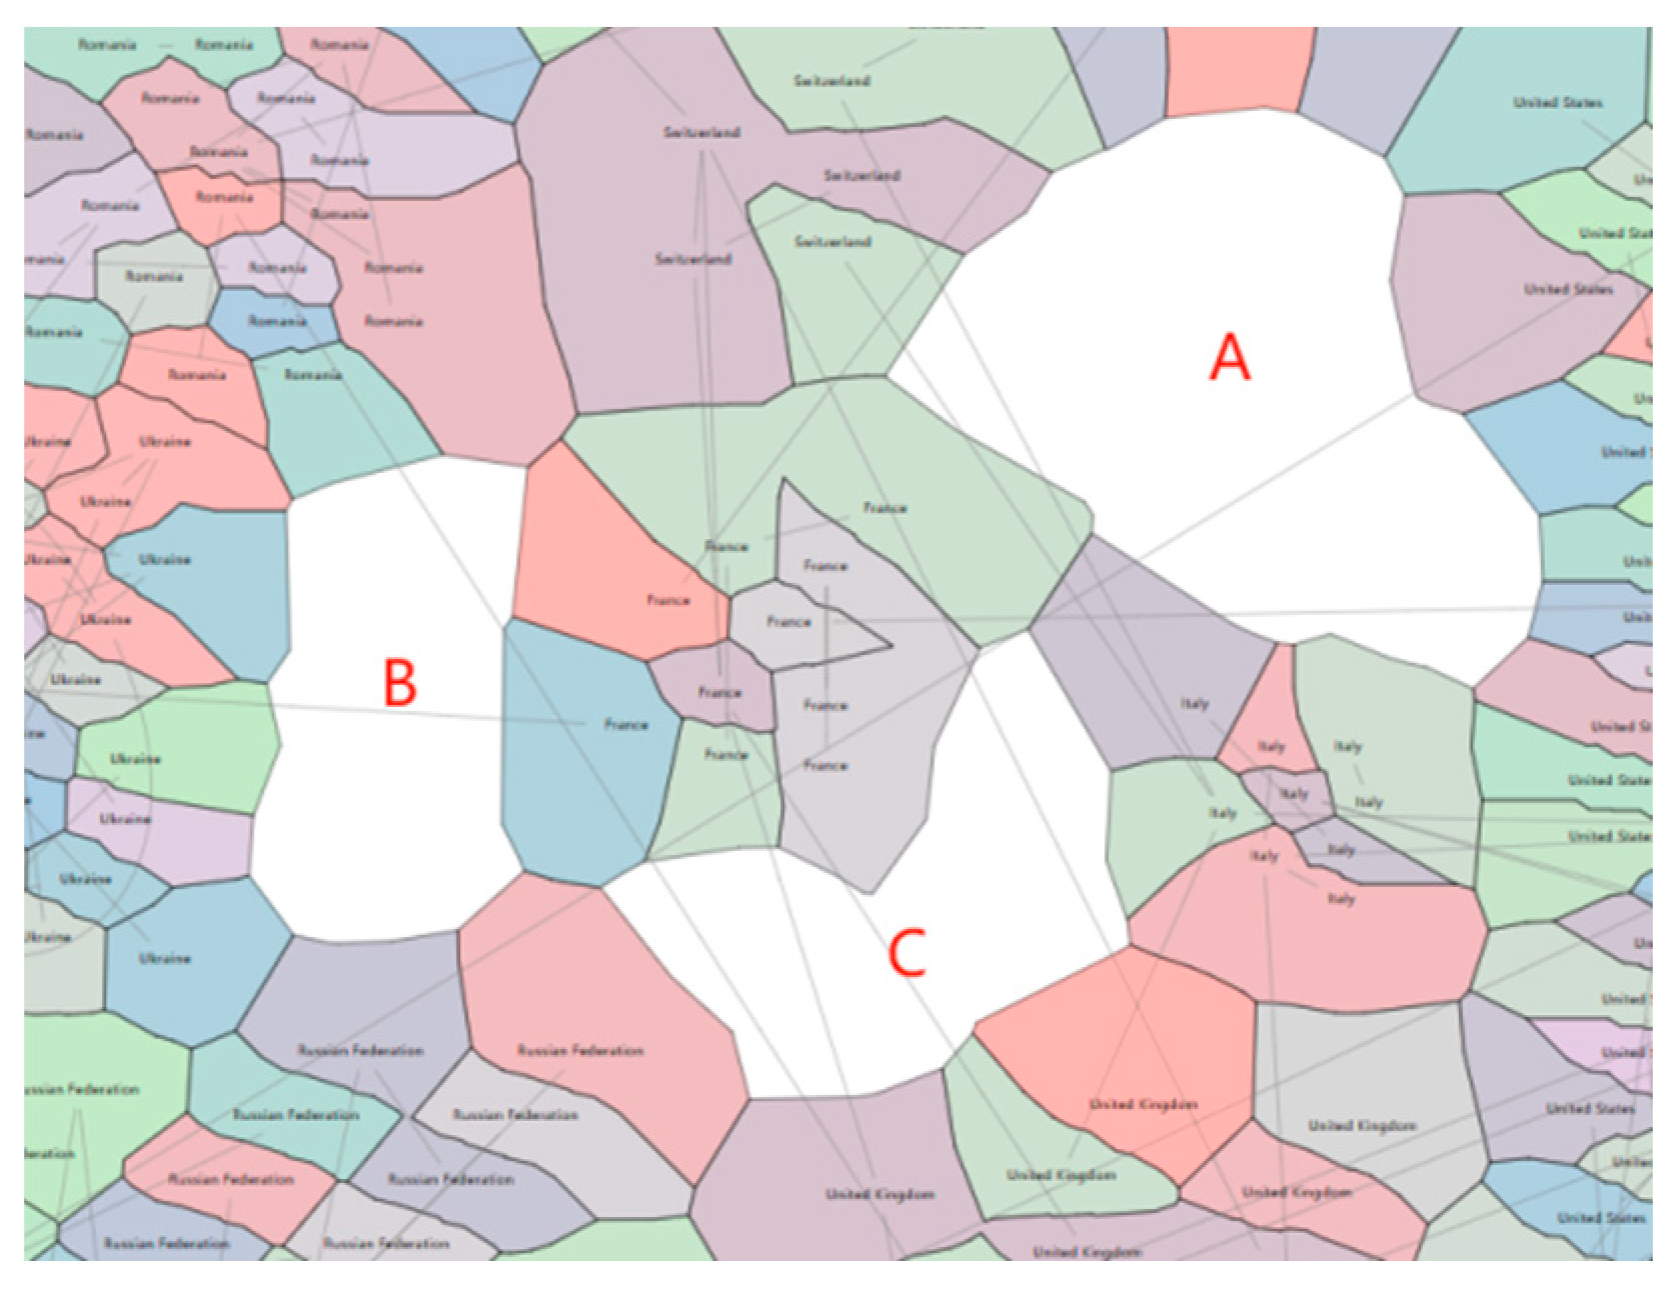
Figure 7.
Optimization diagram of force-oriented layout algorithm.
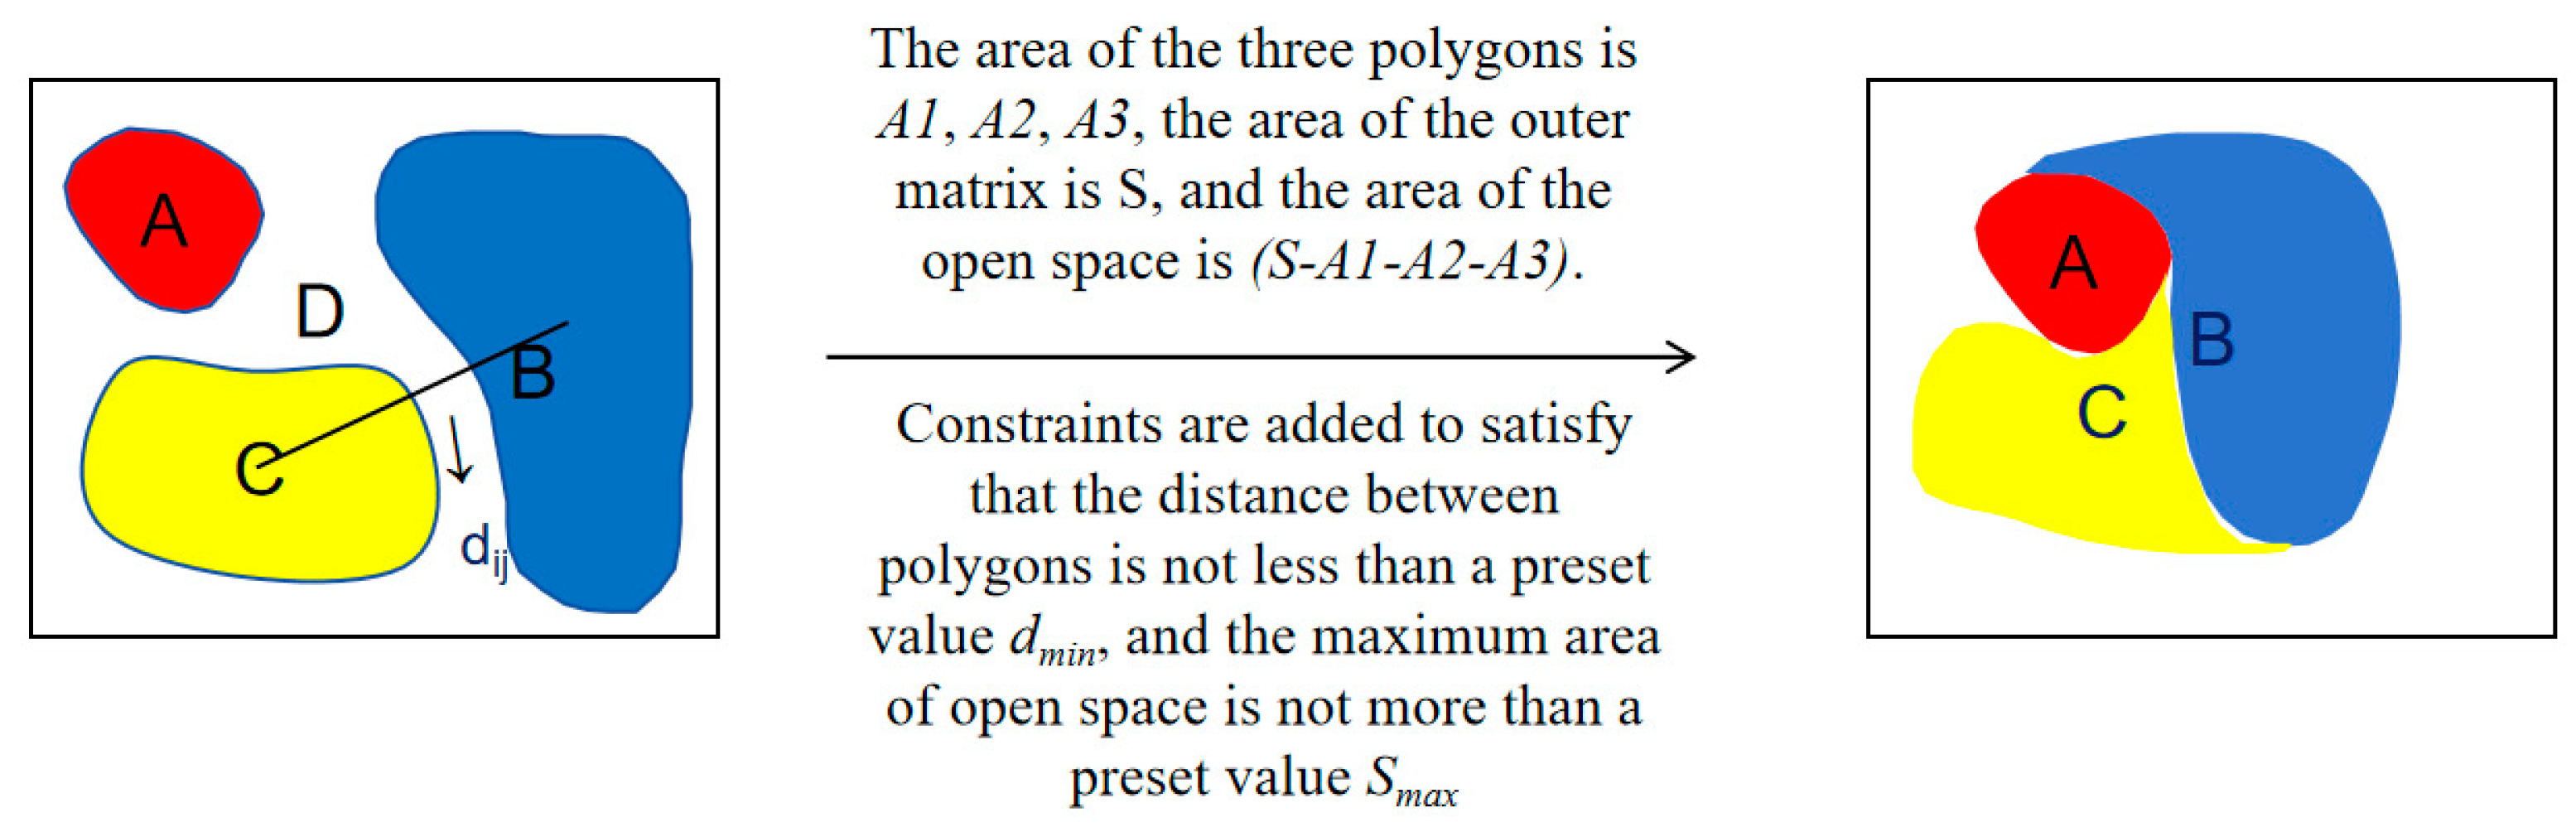
Figure 8.
GMap indicates the map generated directly.
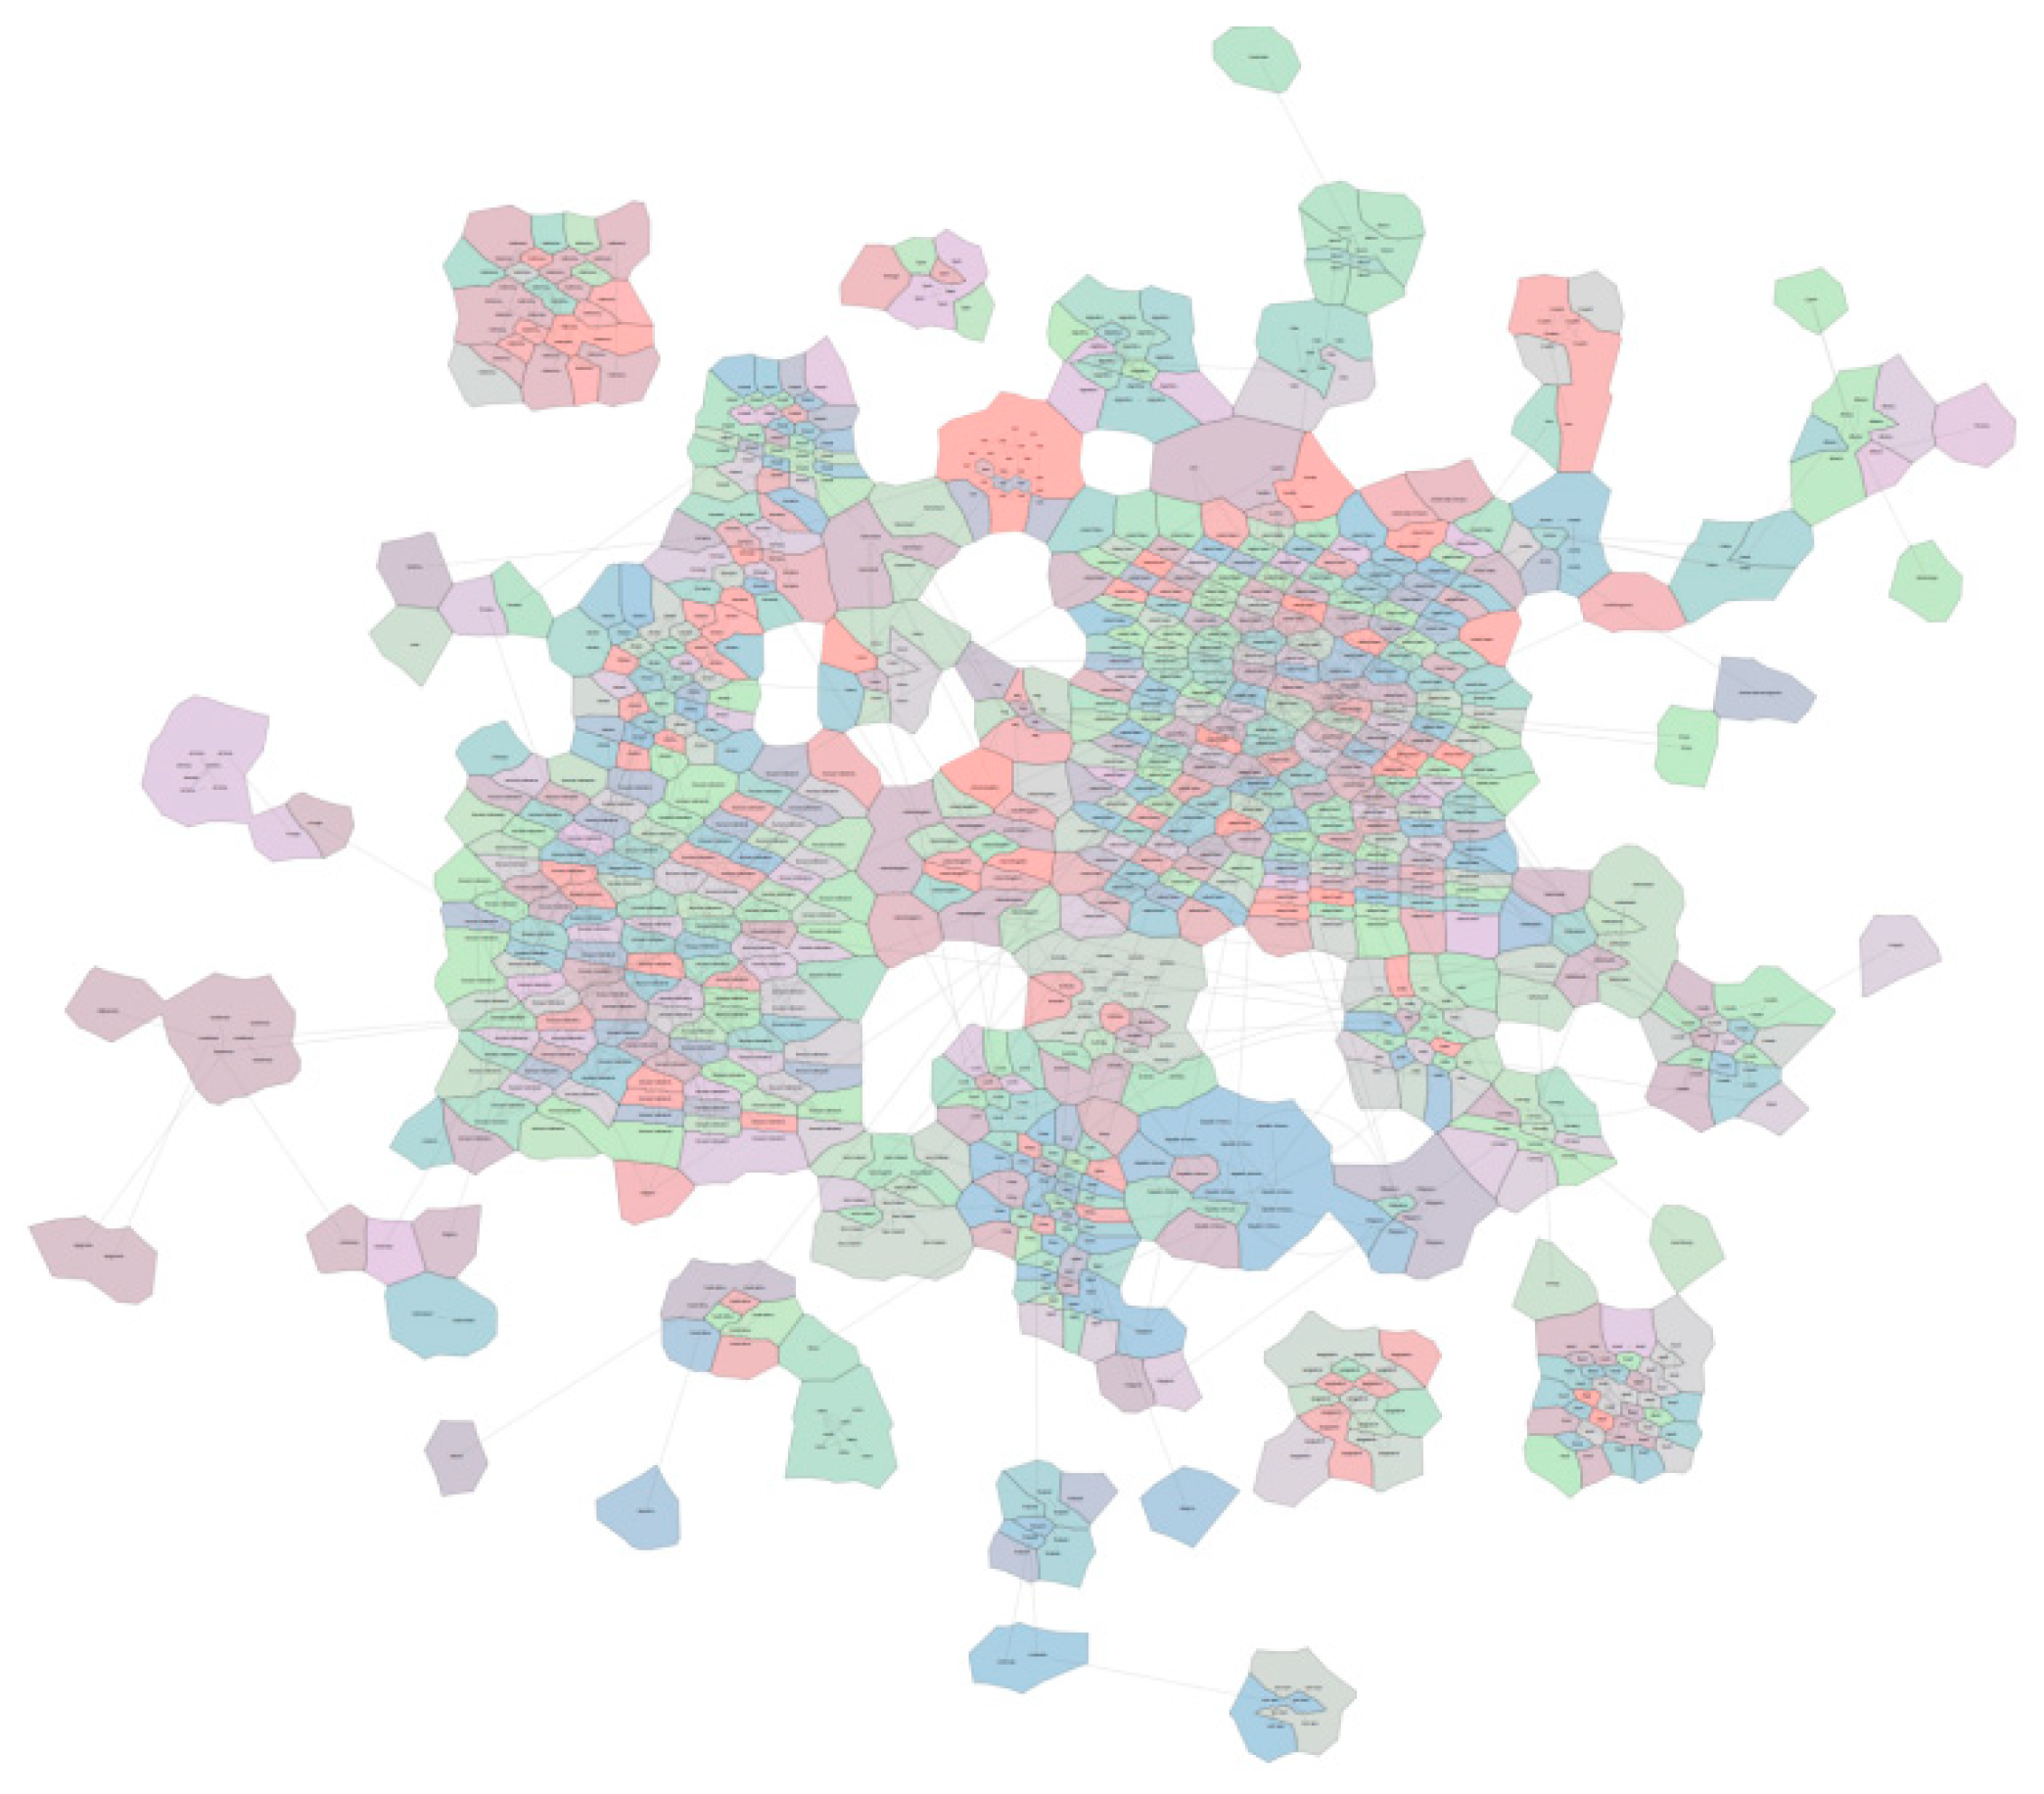
Figure 9.
Metaphorical map of cyberspace potential.
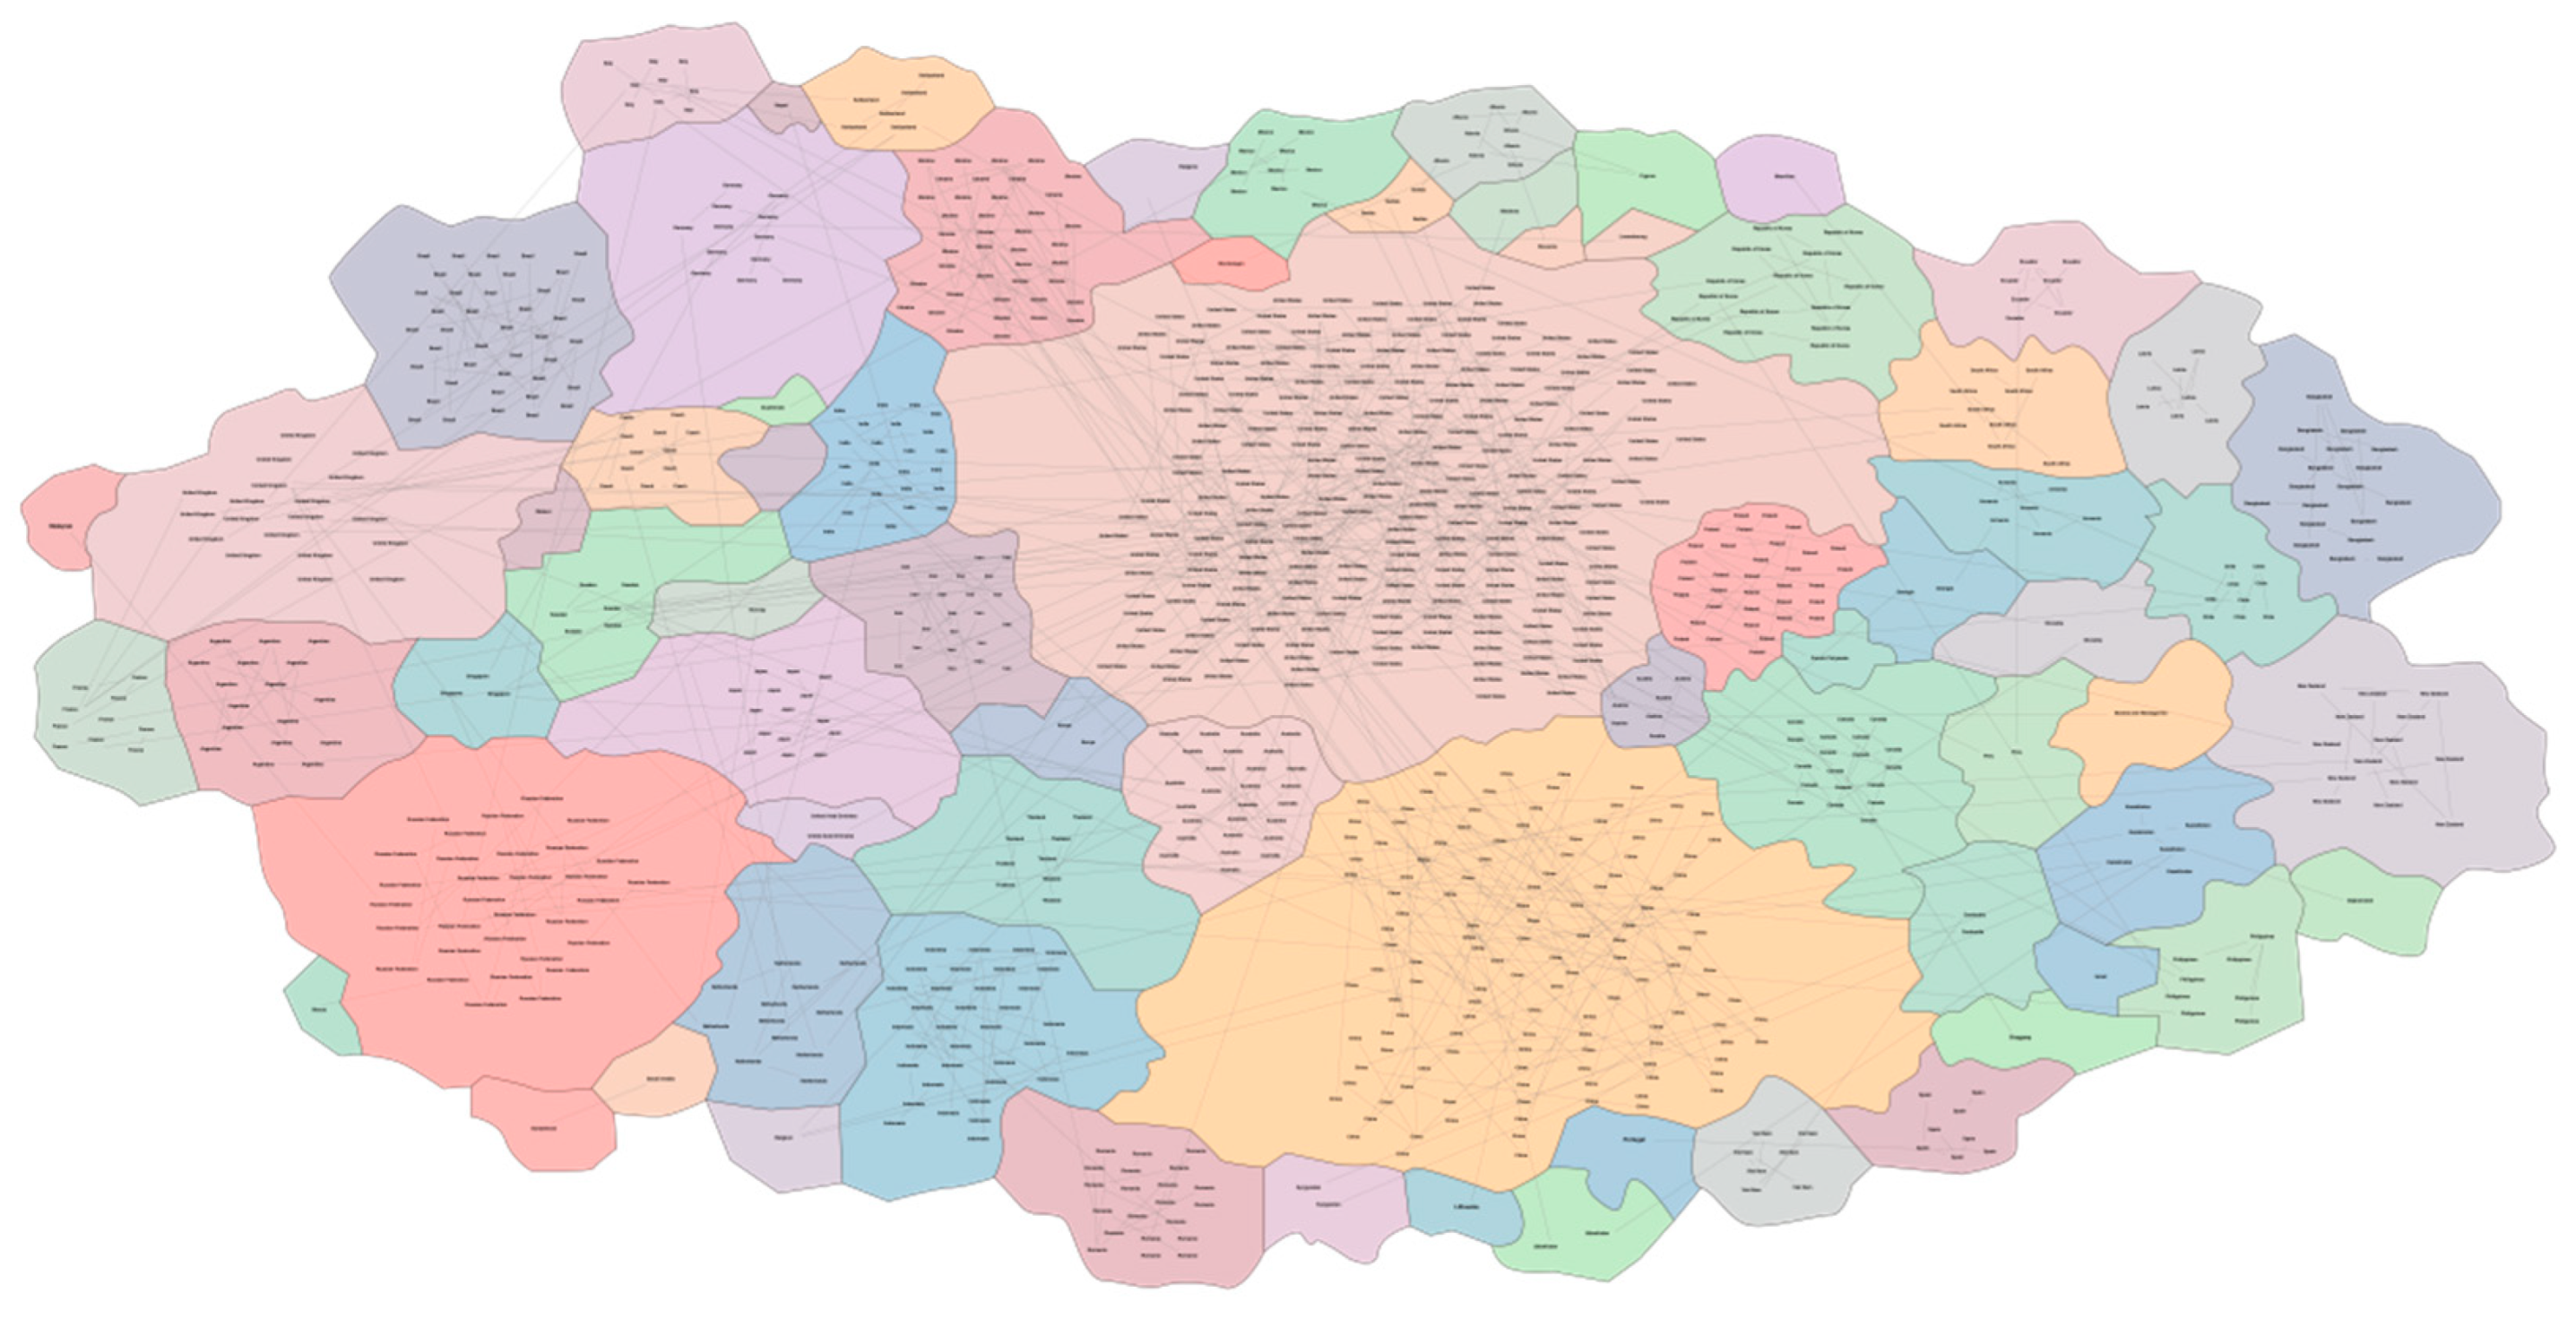
Figure 10.
Top 10 countries in cyber power.
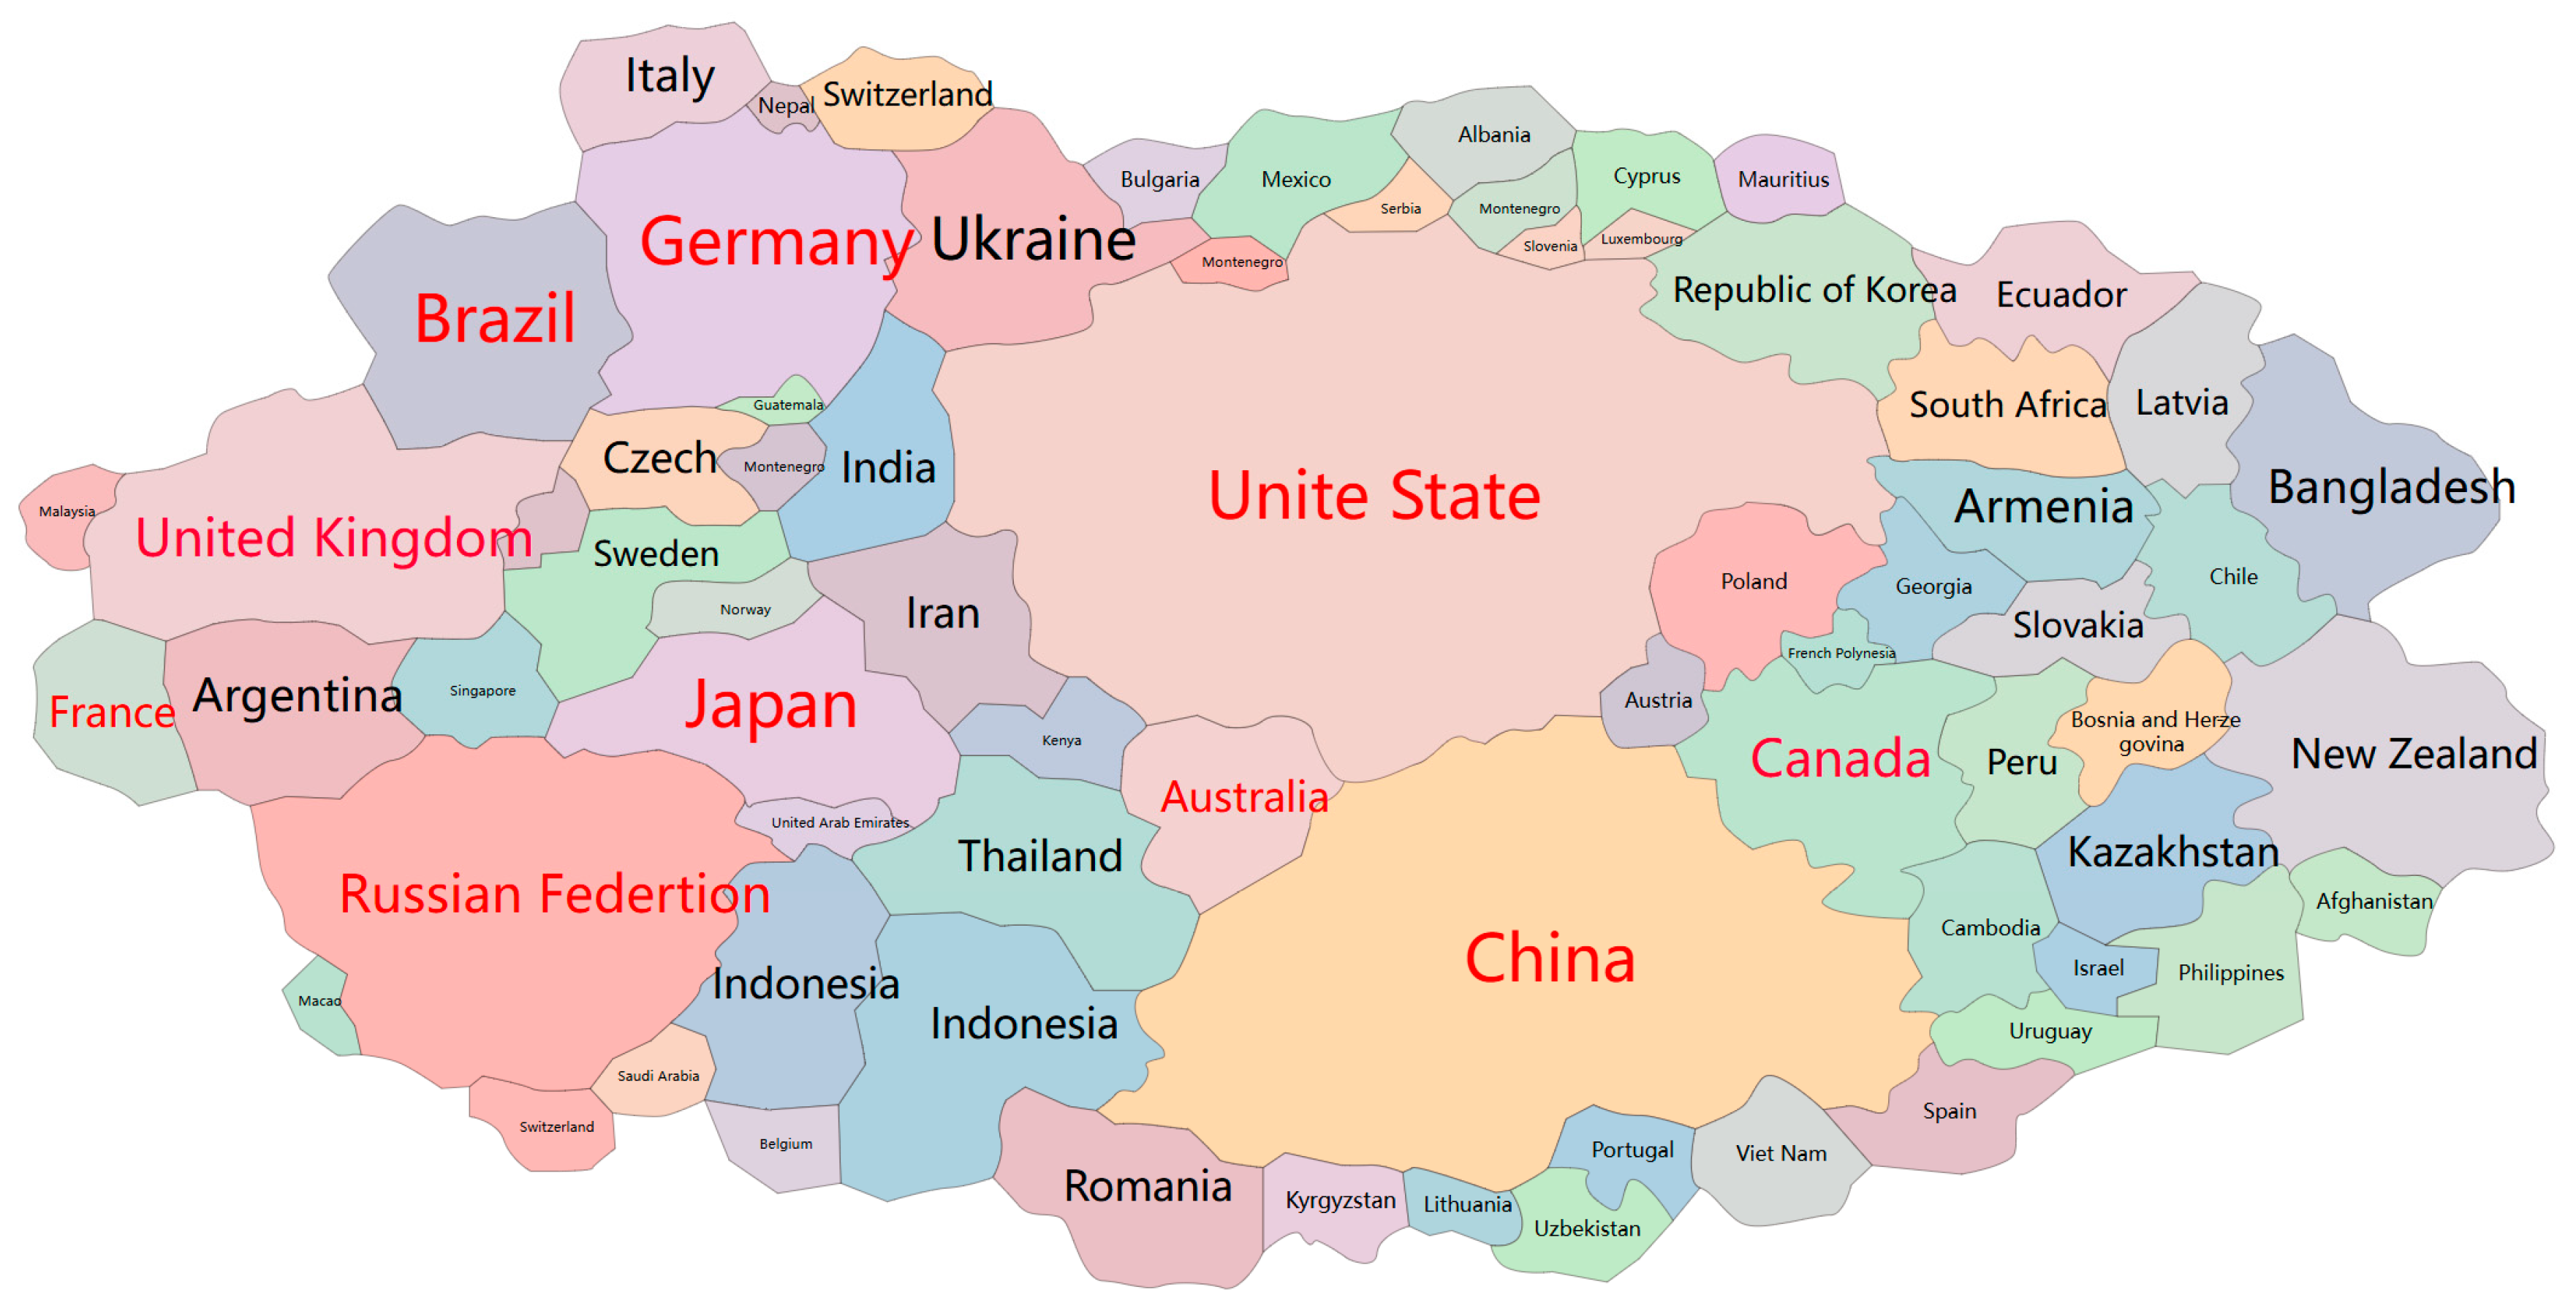
Figure 11.
Thematic map of cyberspace potential.
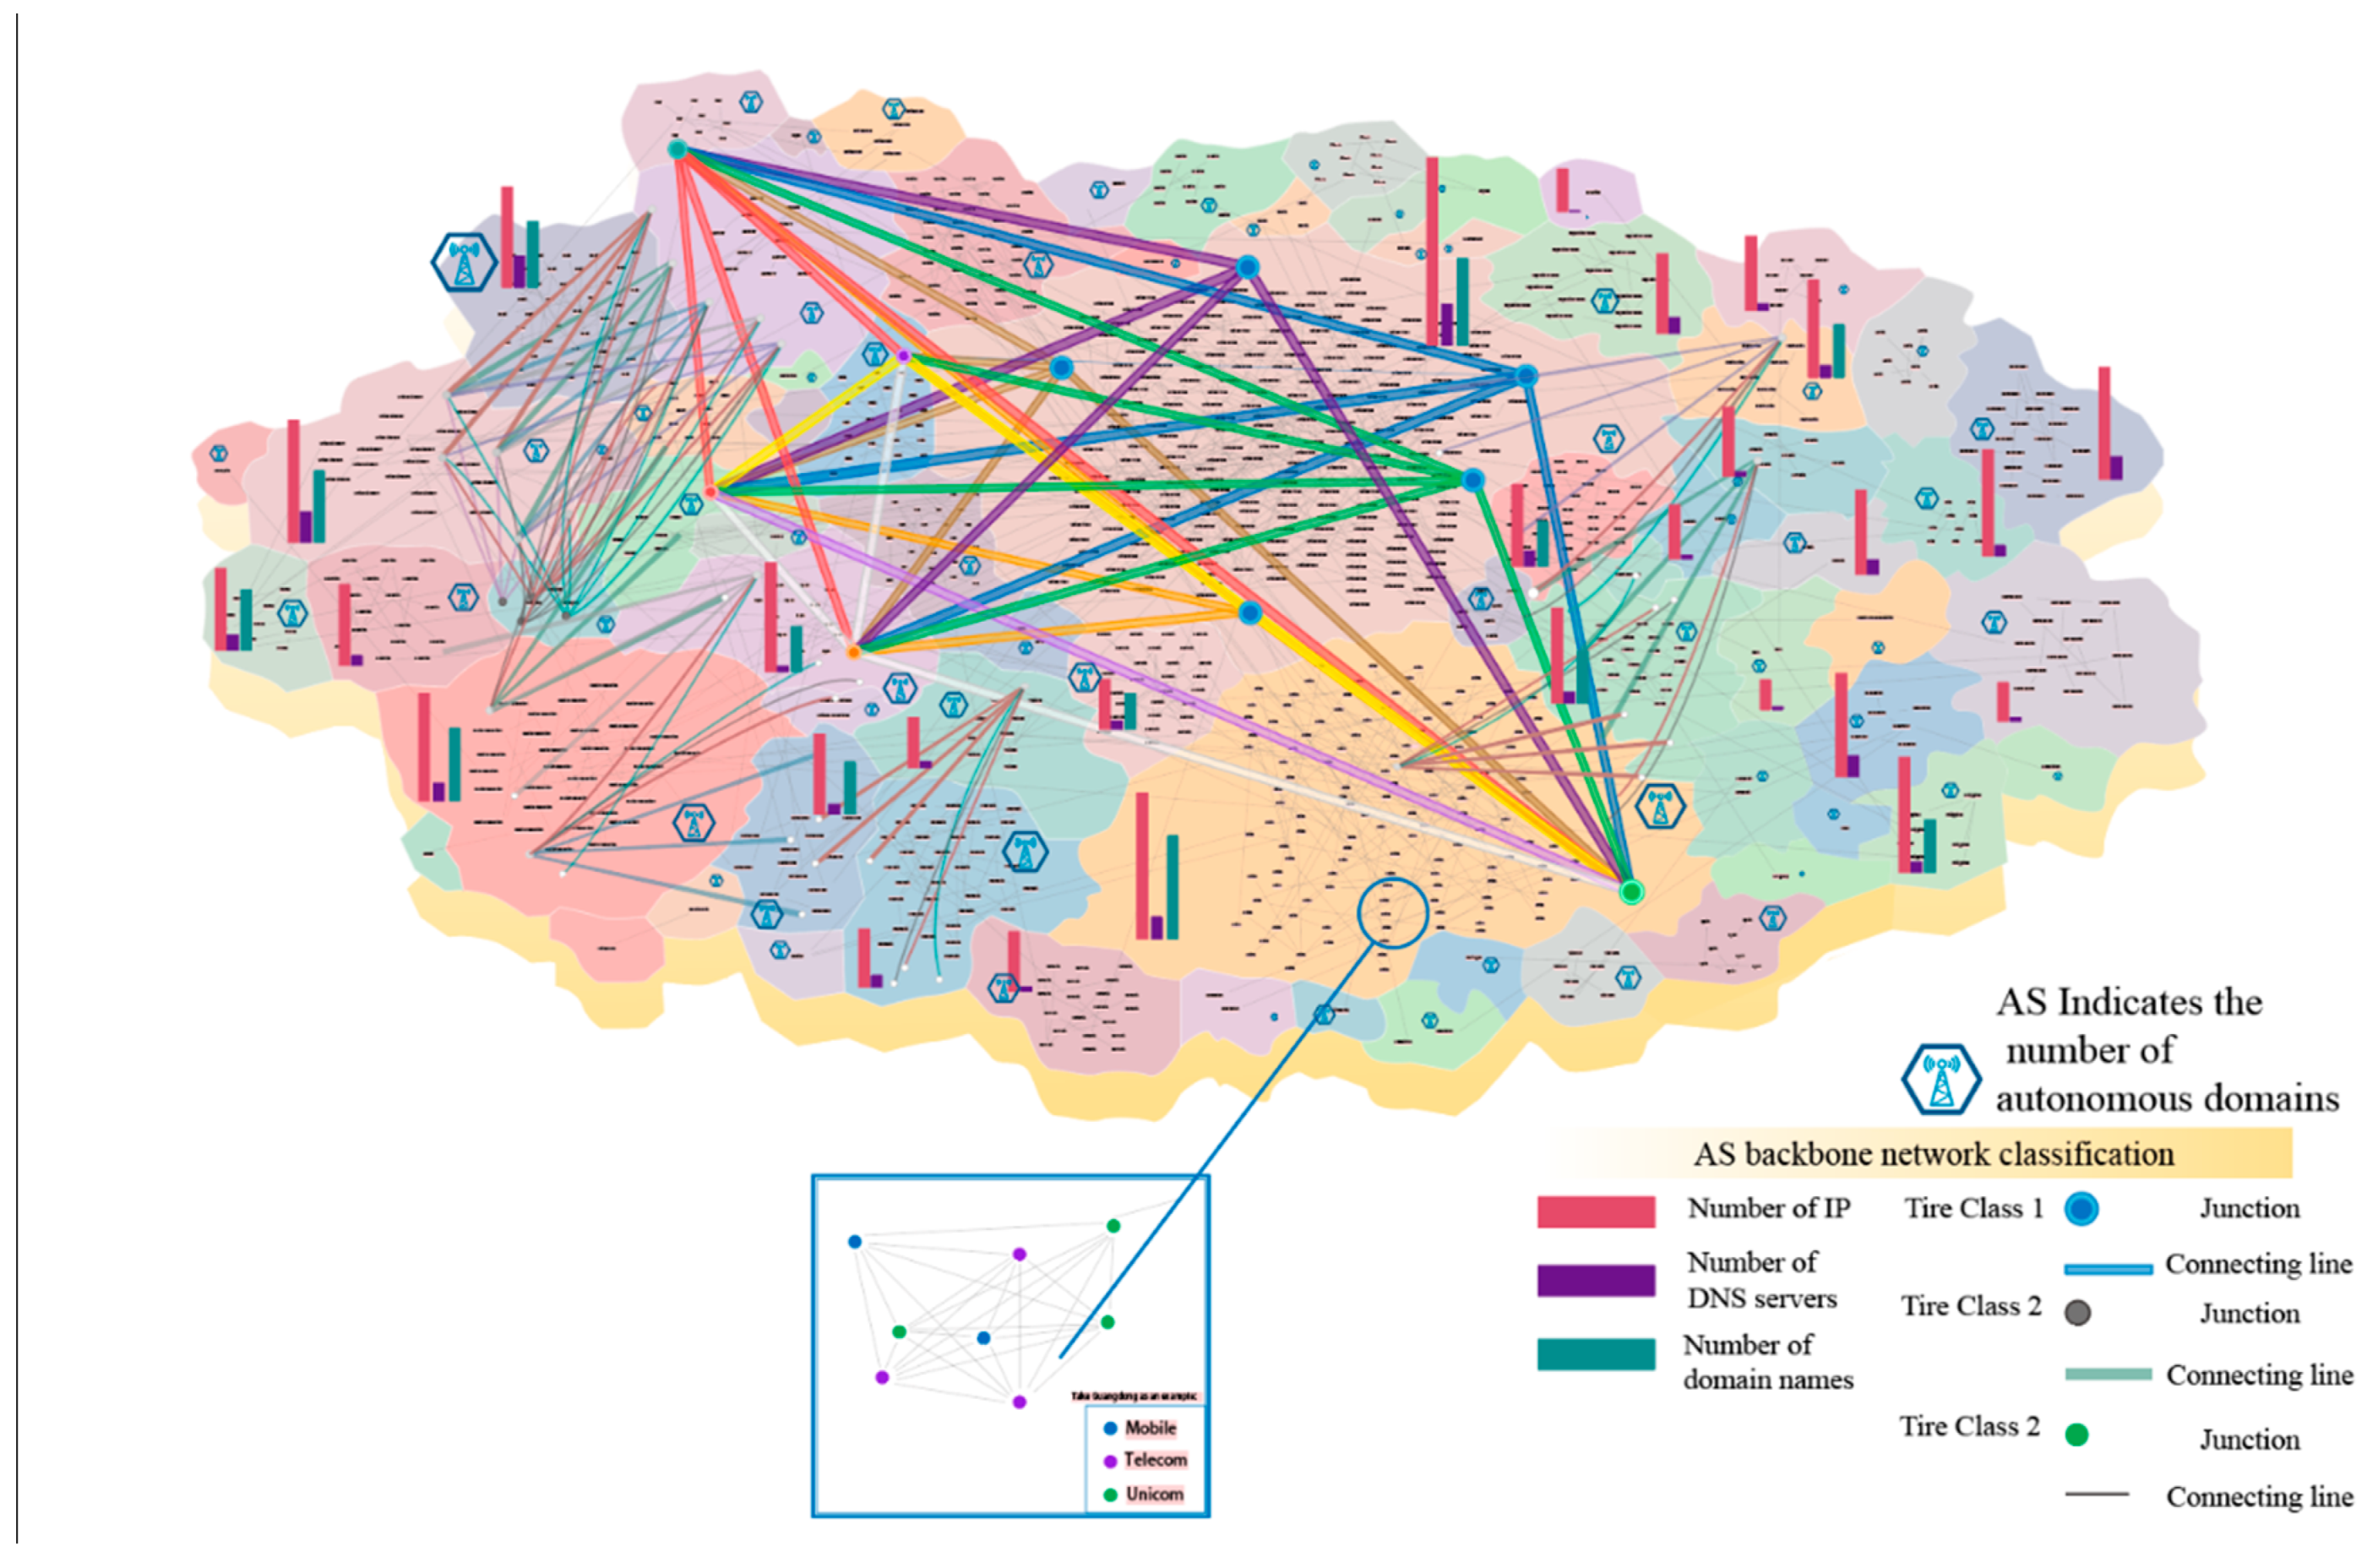
Table 2.
Key Factors Quantitative indicators.
| Key Factor | Indicators |
|---|---|
| Cyberspace technical strength | Number of national IPs and ASN quantities. |
| Cyberspace security capability | Number of vulnerabilities in the national network. |
| International cooperation and diplomacy | Number of AS connections in the country. |
| Economic strength | Gross domestic product (GDP), trade volume, and foreign exchange reserves. |
| Military strength | Number of armed forces personnel and military expenditure as a percentage of GDP. |
| Population size | Population size |
| Technological level | Number of scientific journal articles, patent applications, education penetration rate, and high-tech industry export value. |
Table 3.
Comparison and analysis of cyberspace map representation methods.
| Primary Index | Weight | Secondary Index | Weight |
|---|---|---|---|
| Cyberspace Strength | 0.7 | IP number | 0.54920074 |
| AS Indicates the number of autonomous domains | 0.05655169 | ||
| Number of DNS servers | 0.04153054 | ||
| Number of domain names | 0.14566287 | ||
| Internet penetration | 0.11279529 | ||
| Number of secure Internet servers | 0.05280177 | ||
| Number of vulnerabilities | 0.0414571 | ||
| Overall Strength | 0.3 | GDP | 0.73004571 |
| Land area | 0.26995429 |
Table 4.
Network Comprehensive Strength Index.
| Index | Unit | Time |
|---|---|---|
| IP number | Pct | 2023.7.25 |
| AS Indicates the number of autonomous domains | Pct | 2023.7.25 |
| Number of DNS servers | Pct | 2023 |
| Number of domain names | Pct | 2023.7.24 |
| Internet penetration | Percentage | 2021 |
| Number of secure Internet servers | Per million people | 2020 |
| Number of vulnerabilities | Percentage (1-%) | 2023 |
| GDP | Millions of dollars | 2022 |
| Land area | Square kilometer | 2023 |
Table 5.
Top ten countries in terms of overall network strength.
| Country | Abbreviation | National Power Index |
|---|---|---|
| America | US | 0.840193361497829 |
| China | CN | 0.474704594839867 |
| Russia | RU | 0.239512198050437 |
| Germany | DE | 0.229205405352285 |
| Britain | GB | 0.210031567851877 |
| Brazil | BR | 0.182482279811081 |
| Canada | CA | 0.177795046596043 |
| Japan | JP | 0.165668826464713 |
| Australia | AU | 0.15929862114969 |
| France | FR | 0.14068317053891 |
Table 6.
Comparison with NCPI network power ranking.
| Ranking | Network Comprehensive Strength | NCPI Ranking |
|---|---|---|
| 1 | America | America |
| 2 | China | China |
| 3 | Russia | Russia |
| 4 | Germany | Britain |
| 5 | Britain | Australia |
| 6 | Brazil | Netherlands |
| 7 | Canada | Korea |
| 8 | Japan | Vietnam |
| 9 | Australia | France |
| 10 | France | Iran |
Disclaimer/Publisher’s Note: The statements, opinions and data contained in all publications are solely those of the individual author(s) and contributor(s) and not of MDPI and/or the editor(s). MDPI and/or the editor(s) disclaim responsibility for any injury to people or property resulting from any ideas, methods, instructions or products referred to in the content. |
© 2024 by the authors. Licensee MDPI, Basel, Switzerland. This article is an open access article distributed under the terms and conditions of the Creative Commons Attribution (CC BY) license (http://creativecommons.org/licenses/by/4.0/).
Copyright: This open access article is published under a Creative Commons CC BY 4.0 license, which permit the free download, distribution, and reuse, provided that the author and preprint are cited in any reuse.


