
Submitted:
11 December 2023
Posted:
12 December 2023
You are already at the latest version
Abstract
In order to analyze the spatial distribution characteristics of the cultural landscape of the Yangtze River (Nanjing section) and show the role of the Yangtze River culture in promoting regional economic development and cultural radiation, Based on the Knowledge graph technology and 3S technology, this paper conducts geographical positioning and spatial analysis of the Yangtze River cultural landscape in Nanjing, and analyzes the surrounding environment by combining remote sensing images and topographic data. Researches show that: The Yangtze River cultural landscape in Nanjing includes 74 landscape points of seven landscape types, and the distribution of landscape points shows a clustering trend, but the spatial distribution and aggregation degree of different types of cultural landscapes are different. Due to the influence of climate environment and water resources distribution, the surrounding cultural landscape has a low altitude and high vegetation coverage, showing obvious distribution characteristics along the river. This study is helpful to improve the coordination degree between cultural landscape protection and planning management, and can provide useful reference for the protection of cultural landscape of the Yangtze River.
Keywords:
3S Technology
; the culture of Yangtze River
; Nanjing CIty
; CUltural Landscape
; Spatial Pattern
1. Introduction
Cultural landscape is the common complex of natural landscape and human activities formed in any particular time and space, in which natural landscape elements provide the basic carrier for the formation and development of human material cultural landscape. Therefore, cultural landscape is a variety of human activity forms attached to the natural landscape [1]. Due to the vast territory of China, the distribution pattern of natural landscape has significant spatial differences, so the cultural landscape also has certain spatial differences. At the same time, with the constant change of cultural landscape and the continuous expansion of cultural tourism resources, cultural landscape poses a threat to the spatial distribution of ecosystem and vegetation, and affects the relationship between man and nature [2,3,4].In recent years, in order to analyze the spatial distribution characteristics of cultural landscape and the evolution trend of the surrounding environment of cultural landscape, scholars have carried out many academic discussions on cultural landscape. From the perspective of the integration of multidisciplinary techniques and methods, the research ideas are broadened, the theoretical qualitative research is gradually transformed into technical quantitative analysis, and the research perspective is extended to the fields of cultural landscape and environmental sustainable development [5,6,7,8,9]. For example, Wang Pan et al. [10], based on geographic information technology, classified and visualized the geographical name cultural landscape on the north slope of Tianshan Mountain in Xinjiang, and analyzed the kernel density and geographical name landscape agglomeration based on the visualization results. The historical situation, economic conditions, natural characteristics and distribution characteristics of the study area, including settlement, nationality, immigration and Xinjiang regional cultural characteristics, are systematically summarized. Schulp et al. believed that cultural landscape was disappearing as a low-intensity, multi-functional landscape. Schulp et al. superimposed the land use change track and the spatial distribution of cultural landscape in the European Union, and the research results showed that there was an obvious synergistic phenomenon between land change track and cultural landscape type change. In addition, typical cultural landscapes show strong differences in future landscape changes under different scenario conditions, and the threats faced by cultural landscapes are obviously related to agricultural policies, natural policies and other spatial restrictions [11]. Lei Zexin et al. [12] visualized the spatial distribution information of Taiyuan's historical and cultural landscape based on AHP-GIS, and quantitatively evaluated the value of the historical and cultural landscape, providing a more intuitive scientific basis for the historical and cultural response and landscape planning development of Taiyuan City. Geography Information Systems [13] (GIS), Remote Sensing [14,15] (RS) and Global Navigation Satellite [16]. With the rapid development and maturity of System (GNSS) technology, surface information monitoring and research on cultural landscape distribution pattern based on 3S technology have become one of the important directions of current landscape spatial pattern research [17], providing new ideas for scientific analysis of cultural landscape spatial distribution.
As the largest river in China, the Yangtze River is the longest inland river in China with the largest amount of water and the widest basin area. The abundant water resources in the Yangtze River basin also create the diversified natural landforms and the Yangtze River culture with a long history [18,19]. At the same time, the Yangtze River Basin, as the major traffic artery of our country, has effectively promoted the historical and cultural transmission and regional economic development, and is an important cultural space in our country [20]. As one of the oldest and most diverse cultures in China, the Yangtze River culture has a profound historical and geographical background. The distribution of cultural landscapes in the Yangtze River Basin reflects the evolution of the natural environment and the changes of residents' economic production and social life in the Yangtze River Basin [21]. The spatial distribution pattern of cultural landscapes in the Yangtze River Basin is investigated and analyzed. It is of great reference significance for the protection and development of the cultural landscape in the Yangtze River Basin. This paper takes the Yangtze River cultural landscape in Nanjing as the research object, extracts the Yangtze River cultural landscape points in Nanjing combined with existing data and knowledge graph technology, and analyzes the spatial distribution and surrounding environment of the Yangtze River cultural landscape in Nanjing through GIS technology based on remote sensing image data, spatial distribution vector data and topographic data. In order to provide scientific reference for the planning and construction of cultural parks in the Yangtze River basin.
2. Study area
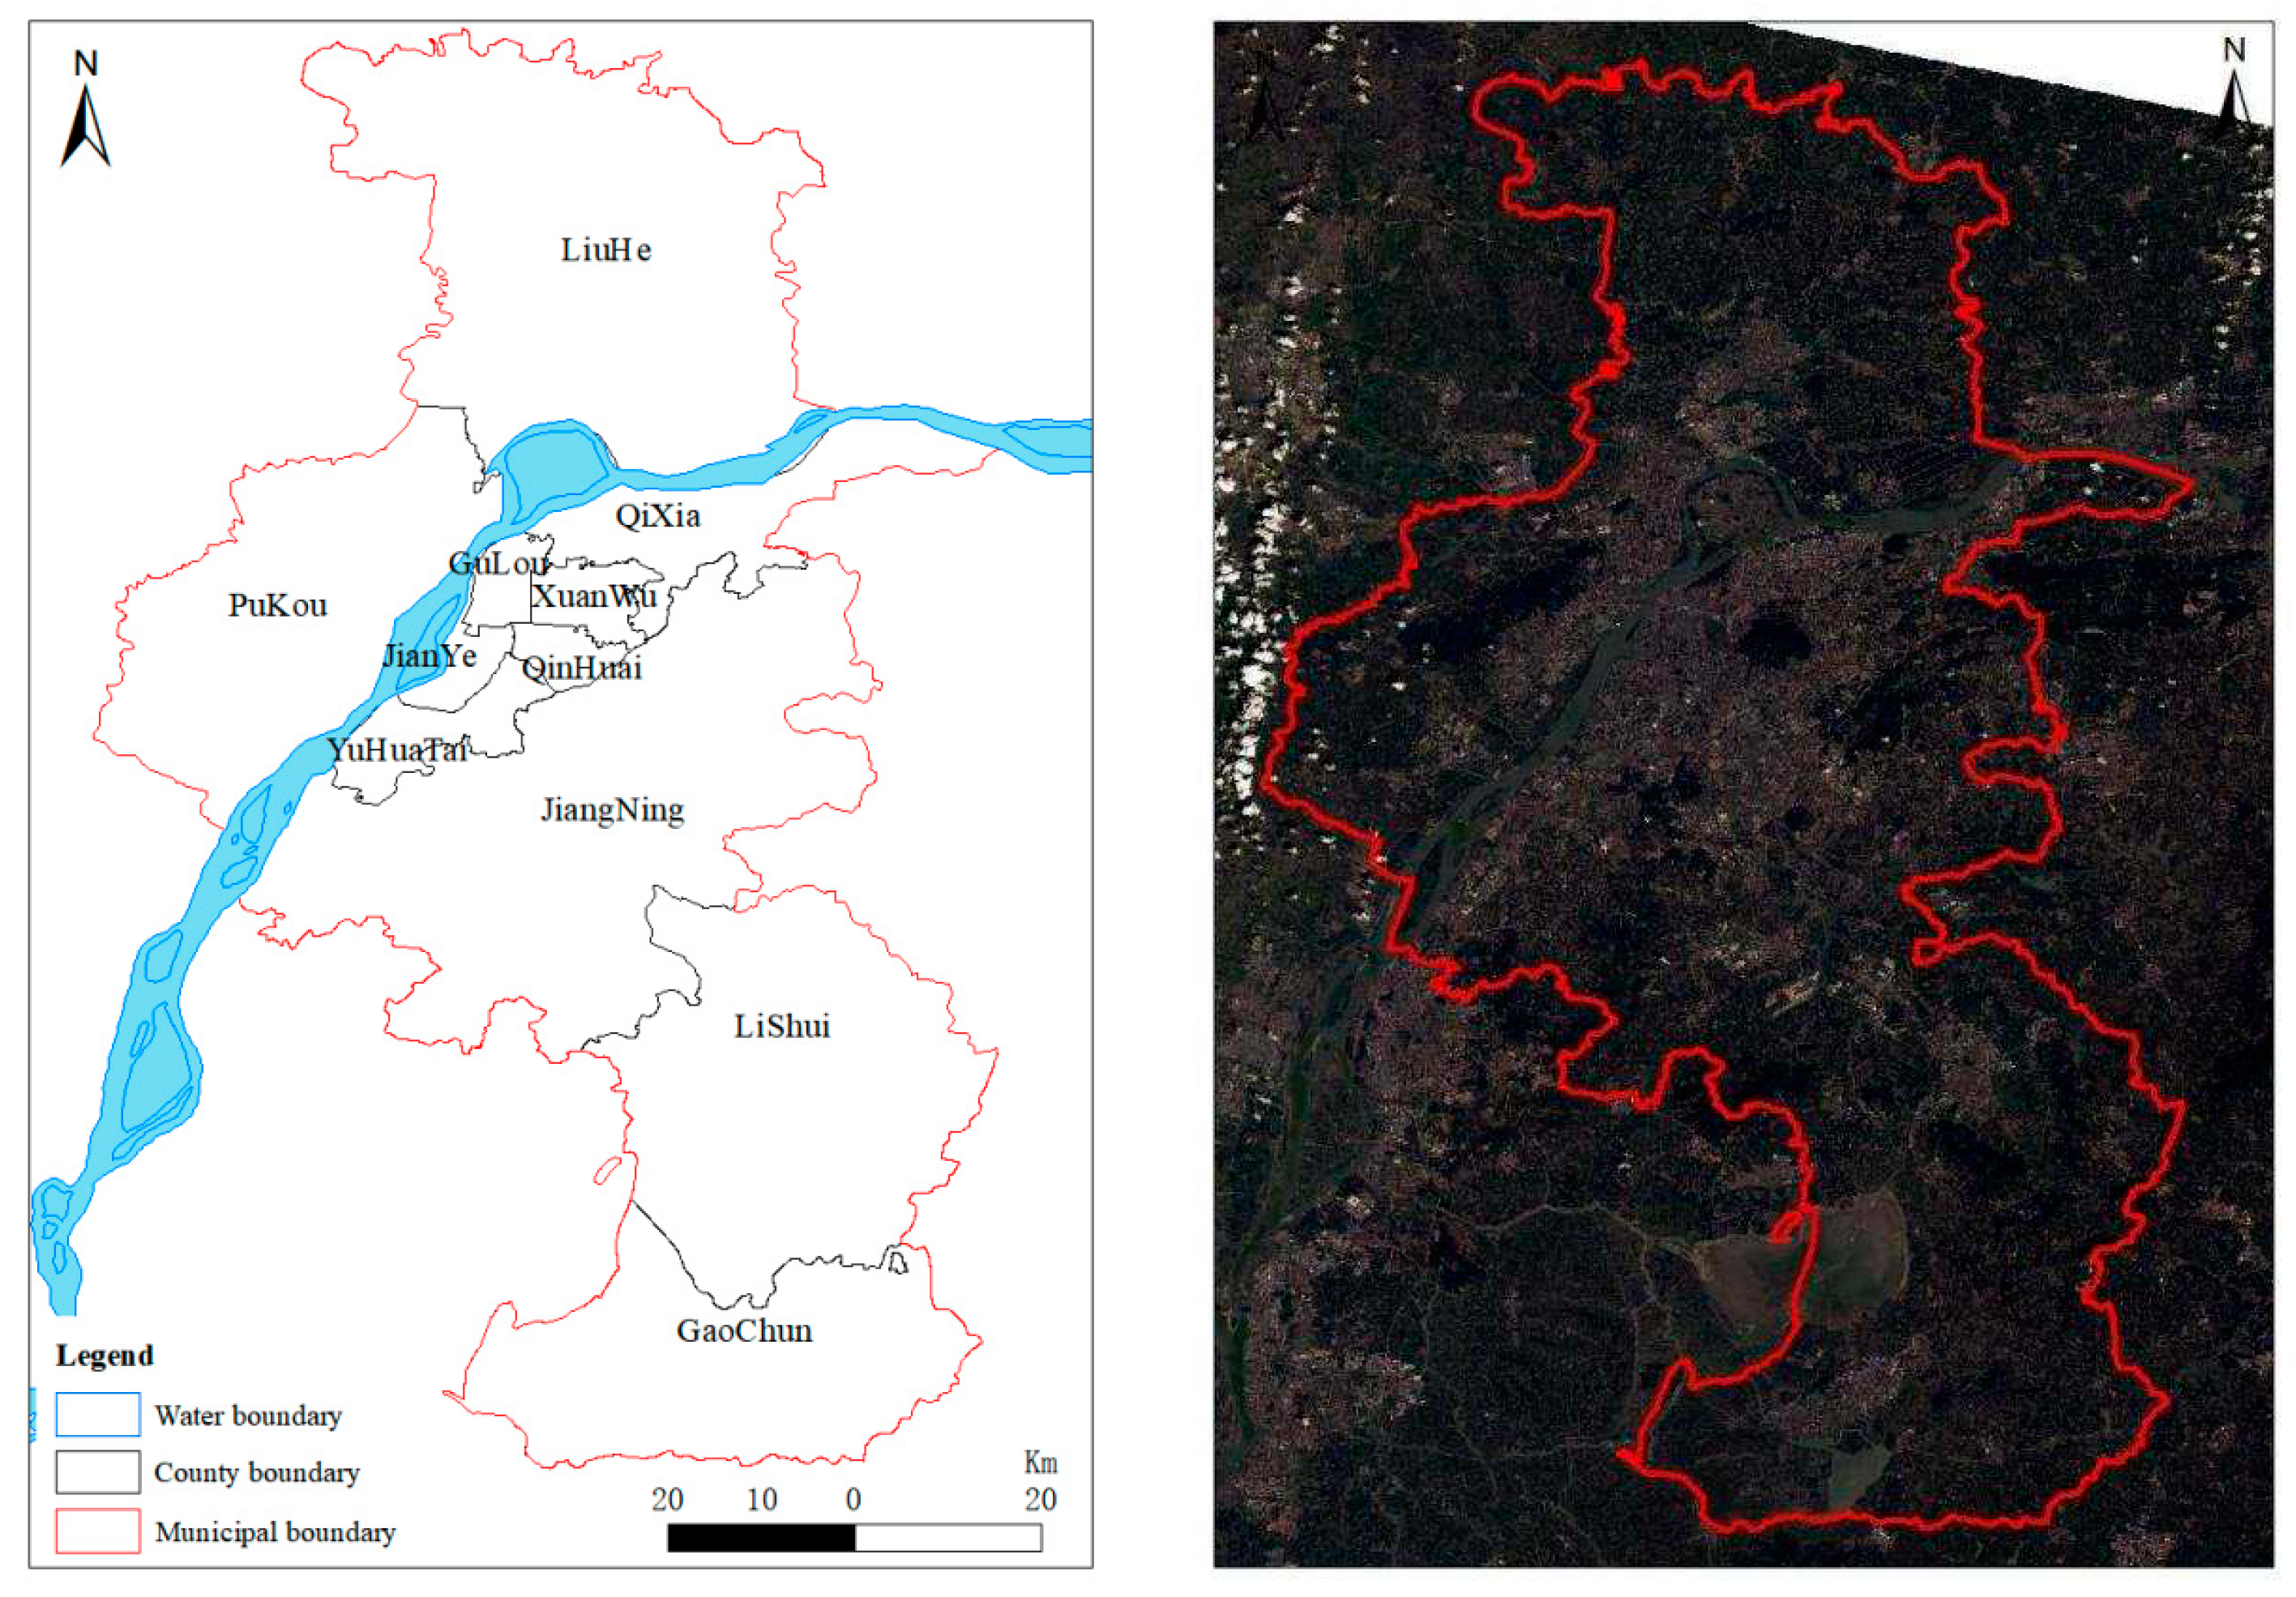
Located on the bank of the Yangtze River, Nanjing is the central city of the northern wing of the Yangtze River Delta, and an important gateway radiating the development of the central and western regions, known as the "North-South gateway and North-South throat" [22]. Nanjing is located between 31°14 'n-32 °37' N and 118°22 'e-119 °14' E, with an administrative area of about 6587 square kilometers. It has a subtropical monsoon climate with an average annual temperature of 16.1℃ and an average annual precipitation of about 1000-1200mm. The topographic elevation of the study area ranges from -92 to 441 m, and almost all the cities are surrounded by hills and mountains [23]. As an important historical and cultural city and scientific research and education base in China, Nanjing enjoys the reputation of "the land of gold dust in the Six Dynasties". Meanwhile, as one of the important cradling places of the Yangtze River culture, Nanjing, with its unique geographical location, has become an important link between the Yangtze River culture and the world, and has played an important role in the formation and development of the Yangtze River culture [24].
Figure 1.
Study area.
3. Research method
3.1. Data Sources
The data required in this study mainly includes three categories: remote sensing image data, vector data and terrain data. The remote sensing image data used in this research is the Landsat-8 satellite image data [25] on September 05, 2022, with a resolution of 30m, and the data is from the United States Geological Survey. USGS) Official website (https://www.usgs.gov/); Vector data refers to the distribution data of the cultural landscape of the Yangtze River in Nanjing, which is based on the Survey Report of the Cultural and Tourism Resources of the Yangtze River in Nanjing. The coordinates are obtained through online map positioning and field positioning, and the spatial distribution data of the cultural landscape of the Yangtze River is generated. The terrain data are based on the Shuttle Radar Topography Mission (SRTM) in Nanjing [26], which is derived from the official website of USGS.
3.2. Research method
(1) Knowledge graph construction
With the popularization of Internet technology and the development of open linked data, Google proposed the concept of knowledge graph in 2012 [27]. As an important carrier representing the structural relationship between entities, knowledge graph has become an effective tool to quickly grasp the development characteristics, trends and frontiers of a field, and an increasingly popular research direction in the field of scientific cognition and human intelligence, and has been widely used in the research of different disciplines such as ecological environment, military defense, agricultural monitoring and disaster monitoring [28]. In order to analyze the overall situation of the Yangtze River cultural landscape in Nanjing, knowledge graph was introduced and the structural relationship between cultural landscapes was constructed based on graph database neo4j to provide a more intuitive display of landscape composition.
(2)Nearest neighbor index method
Based on the landscape distribution data of Nanjing section of Yangtze River Basin, this study combined with the nearest neighbor index method to analyze the spatial distribution characteristics of cultural landscape within the study area. The Nearest Neighbor Index (NNI) [29,30] is a geographical index that describes the degree of mutual proximity of point objects in geographical space, and can effectively reflect the spatial distribution characteristics of point elements. The nearest proximity index is calculated as follows:
Where: n is the total number of target element points within the research area, and A is the total area of the research area. R is the calculated result of the nearest point index, is the average distance between each element point and its nearest point, is the theoretical closest distance, and D is the point density. When R<1, , indicating that the point elements are distributed coherently. When R=1, , indicating that the point elements are randomly distributed. When R>1, , indicating that the distribution of point elements is random.
(3) Nuclear density analysis
Kernel Density (KD) [31,32] is an analytical method to analyze the distribution density of target point elements in the spatial neighborhood, which can quantitatively display the spatial agglomeration of point elements. Based on the kernel density analysis method, this study studied the spatial agglomeration characteristics of the Yangtze River cultural landscape in Nanjing. The formula for calculating the kernel density is as follows:
Where: is the calculation result of the kernel density value, is the distance from the estimated point to the sample element, h represents the search radius, represents the kernel function, and n is the number of sample elements falling within the search radius. The larger the value of , the more dense the spatial distribution of point elements, and the higher the probability of the existence of points in this range.
(4) Normalized vegetation index method
Normalized Difference Vegetation Index (NDVI) [33,34] refers to a vegetation index obtained by quantifying the difference between red band and near infrared band of satellite images based on spectral characteristics of vegetation. The index is widely used in the fields of vegetation spatial distribution and growth monitoring, crop and animal husbandry yield estimation, etc. Its calculation formula is as follows:
Where: NDVI is the normalized vegetation index value; NIR is the near-infrared band in Landsat8 images, and vegetation has strong reflection ability to near-infrared band. R is the red band in Landsat8 images, which can be effectively absorbed by vegetation. In this study, NDVI is used to describe the natural ecological environment of vegetation growth in Nanjing section of Yangtze River Basin.
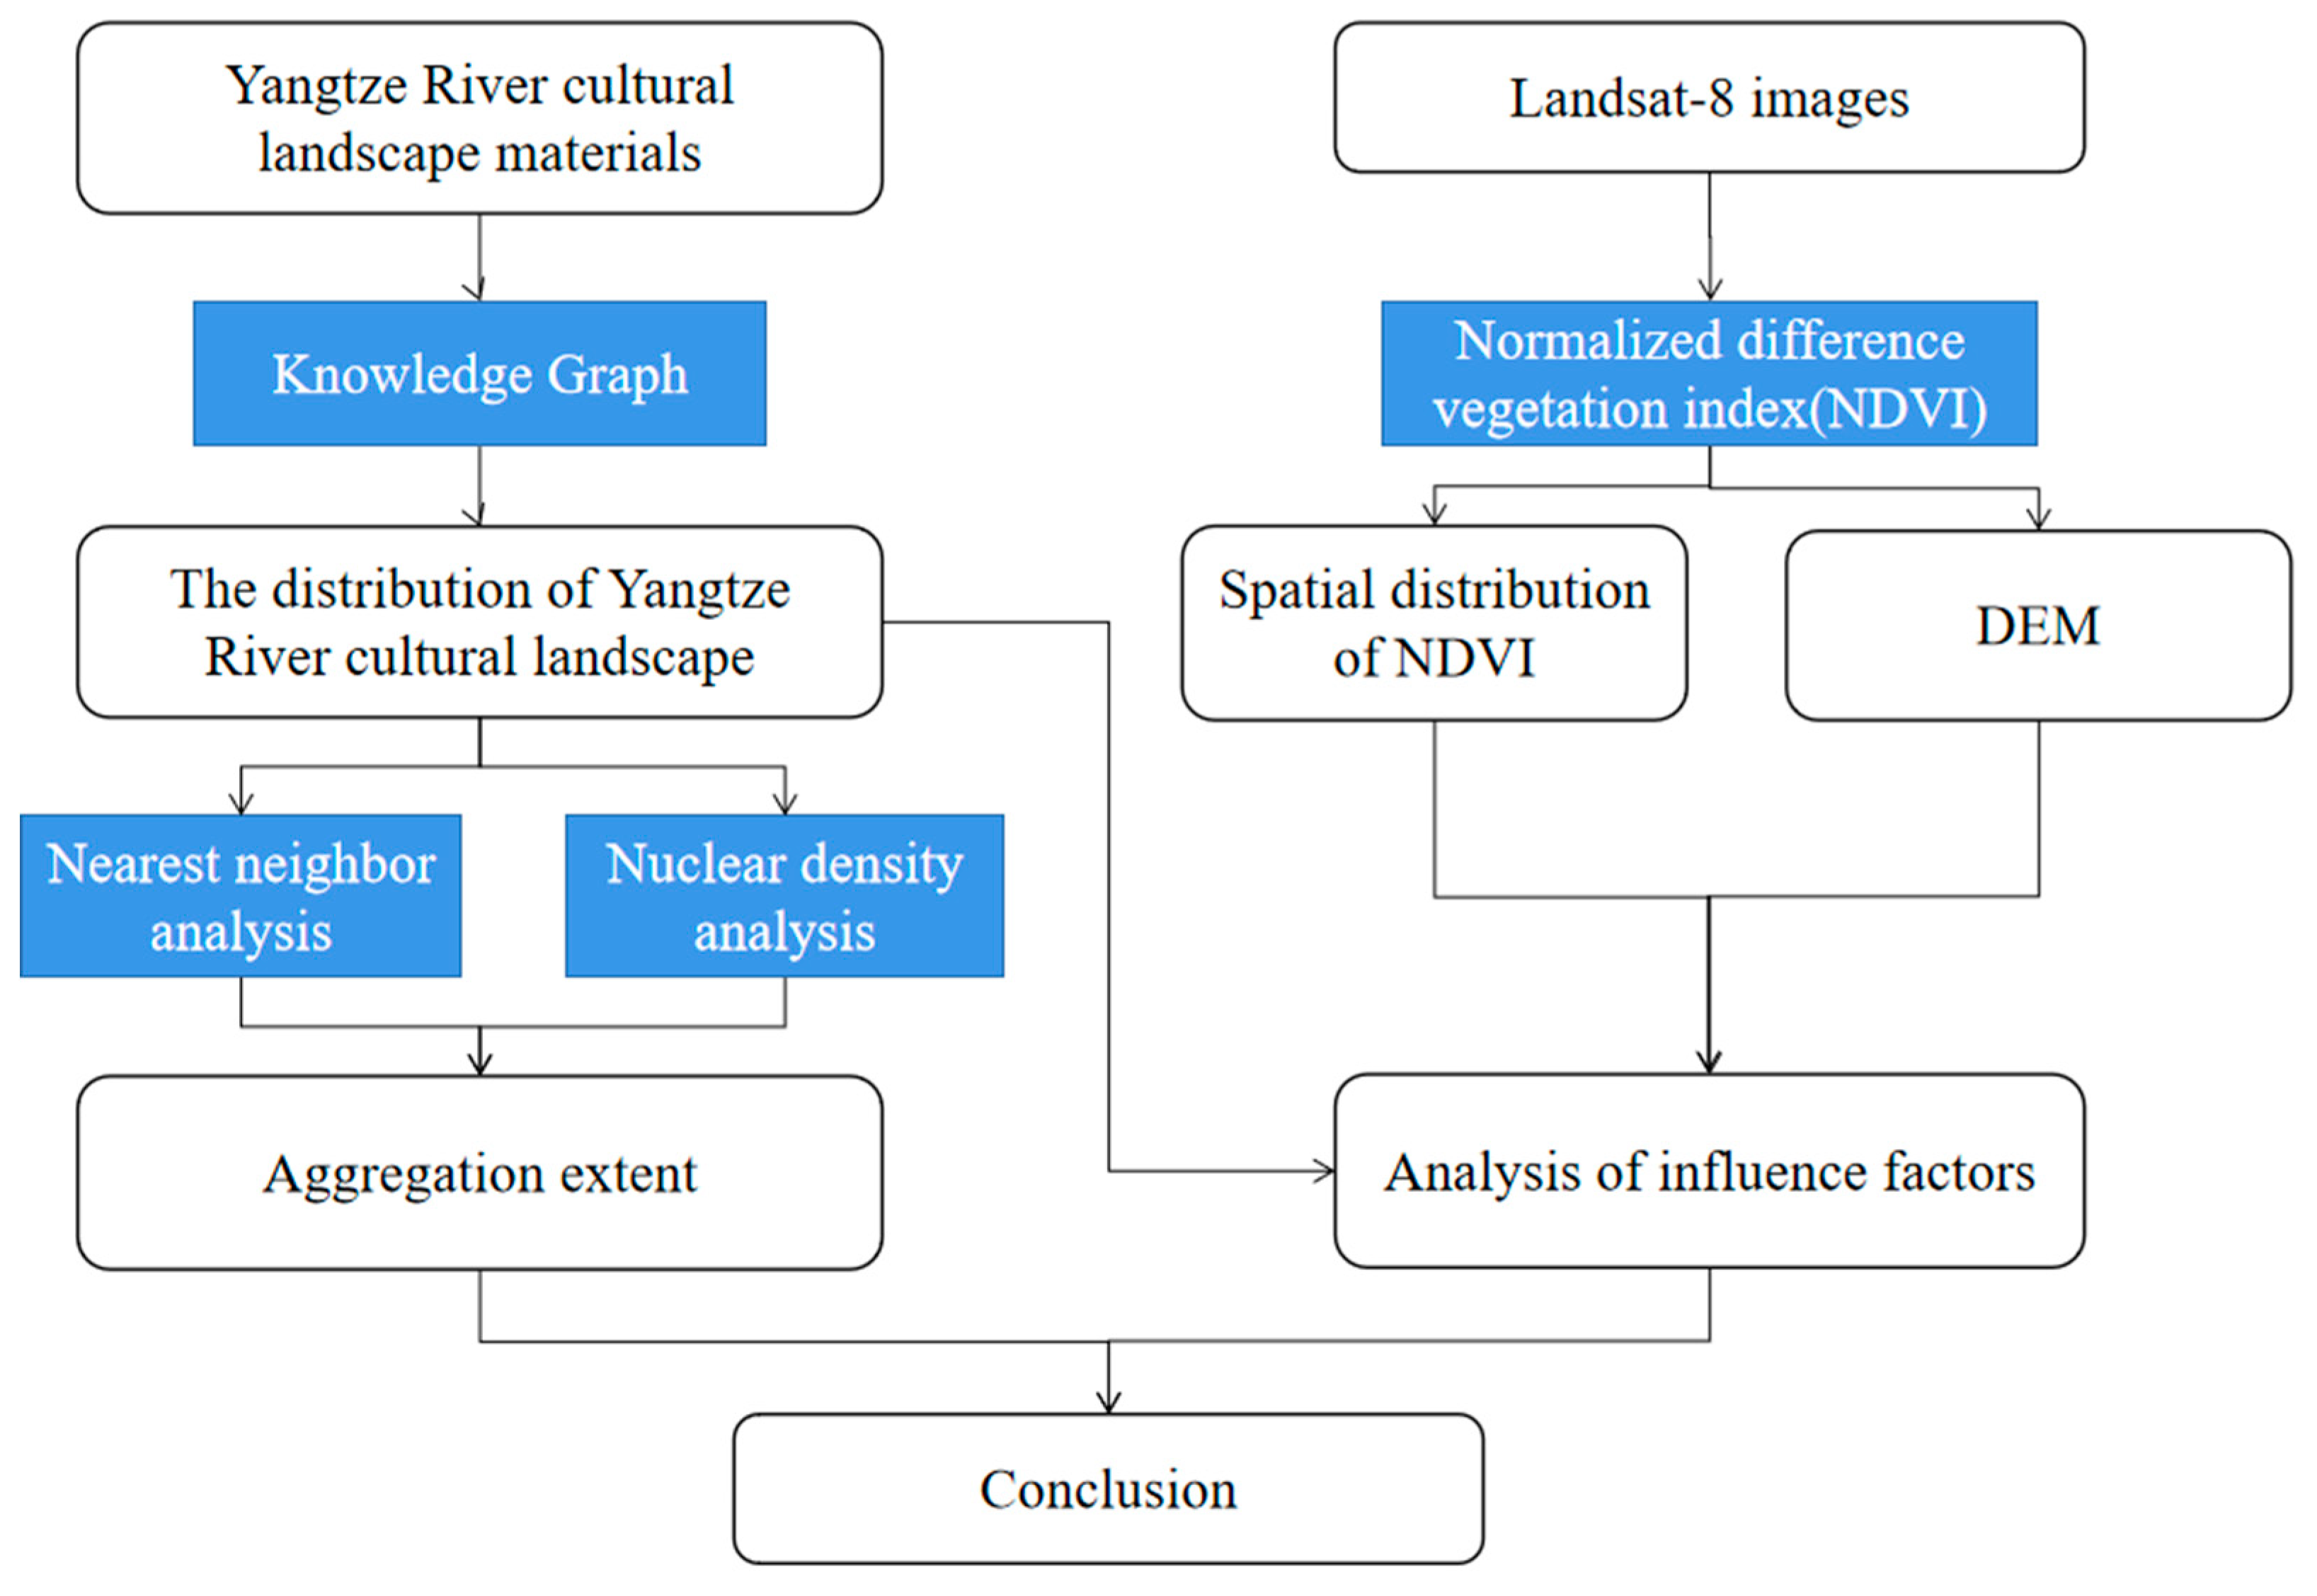
Based on the above methods, a study on the spatial distribution of the Yangtze River cultural landscape in Nanjing is carried out. The overall technical roadmap of this study is as follows:
Figure 2.
Tecnology roadmap.
4. Data processing results of Nanjing cultural landscape
4.1. Extraction and spatial data generation of Nanjing Yangzte River cultural landscape
In order to analyze the space distribution pattern of the Yangtze River cultural landscape in Nanjing more comprehensively, this paper extracts the Yangtze River cultural landscape in Nanjing based on the key words and relations extracted from the Knowledge graph by referring to the Survey Report of Nanjing Yangtze River Culture and Tourism Resources. A total of 74 cultural landscape points of the Yangtze River in 7 categories and 14 subcategories were extracted based on knowledge graph (Table 1), and the locations of cultural landscapes were marked based on GNSS technology to clarify the overall distribution of each landscape, thus providing data basis for the analysis of spatial pattern of cultural landscapes in the Yangtze River Basin (Nanjing section). The spatial distribution pattern of the Yangtze River cultural landscape in Nanjing is shown in Figure 3:
The Yangtze River cultural landscape in Nanjing includes seven categories, namely terrain landscape, water landscape, biological landscape, tangible cultural heritage, intangible cultural heritage, architecture and facilities, and human activity landscape (Figure 4), which are mainly distributed in Jianye District, Qixia District, Xuanwu District, Qinhuai District and Gulou District. Among them, the number of Yangtze River tangible cultural heritage landscapes in Nanjing is the largest 30, accounting for 40.5%, followed by architecture and facility landscapes, accounting for 24.3%, and the number of Yangtze River cultural and biological landscapes is the least, accounting for only 1.4% of the total number of Yangtze River cultural landscapes. In addition, the number of Yangtze River cultural water landscape, local cultural landscape, cultural activity landscape and intangible cultural heritage landscape in Nanjing accounted for 16.2%, 10.8%, 4.1% and 2.7% of the total cultural landscape, respectively.
Nanjing Yangtze River cultural landscape types are relatively rich, and their spatial distribution is relatively concentrated, but there are still some differences in the distribution of different types of landscape points (Figure 5). Among them, the landscape of Yangtze River cultural waters in Nanjing is more evenly distributed, distributed in all districts and counties along the Yangtze River, the geographical landscape is mainly distributed in Qixia District and Gulou District, the tangible cultural heritage landscape is concentrated in Gulou District, and the architecture and facility landscape is mostly distributed in Gulou District and Jianye District. As for the intangible cultural heritage landscape, biological landscape and human activity landscape of the Yangtze River, due to the small number of passes, their distribution shows obvious characteristics of aggregation and dispersion.
4.2. Calculation result of aggregation degree of Yangtze River cultural landscape in Nanjing
Nanjing, as one of the important cradlings and radiating centers of the Yangtze River culture, is endowed with rich Yangtze River cultural landscapes such as water landscape, feature landscape and tangible cultural heritage landscape. In order to conduct a quantitative analysis of the spatial distribution characteristics of the Yangtze River cultural landscape in Nanjing, based on ArcGIS closest proximity index method and kernel density analysis plug-in, this paper analyzes the proximity degree and kernel density of various cultural landscapes in the Yangtze River Basin of Nanjing, so as to reflect the aggregation degree of various cultural landscapes.
Figure 6.
Analysis result of kernel density of Yangtze River cultural landscape in Nanjing.
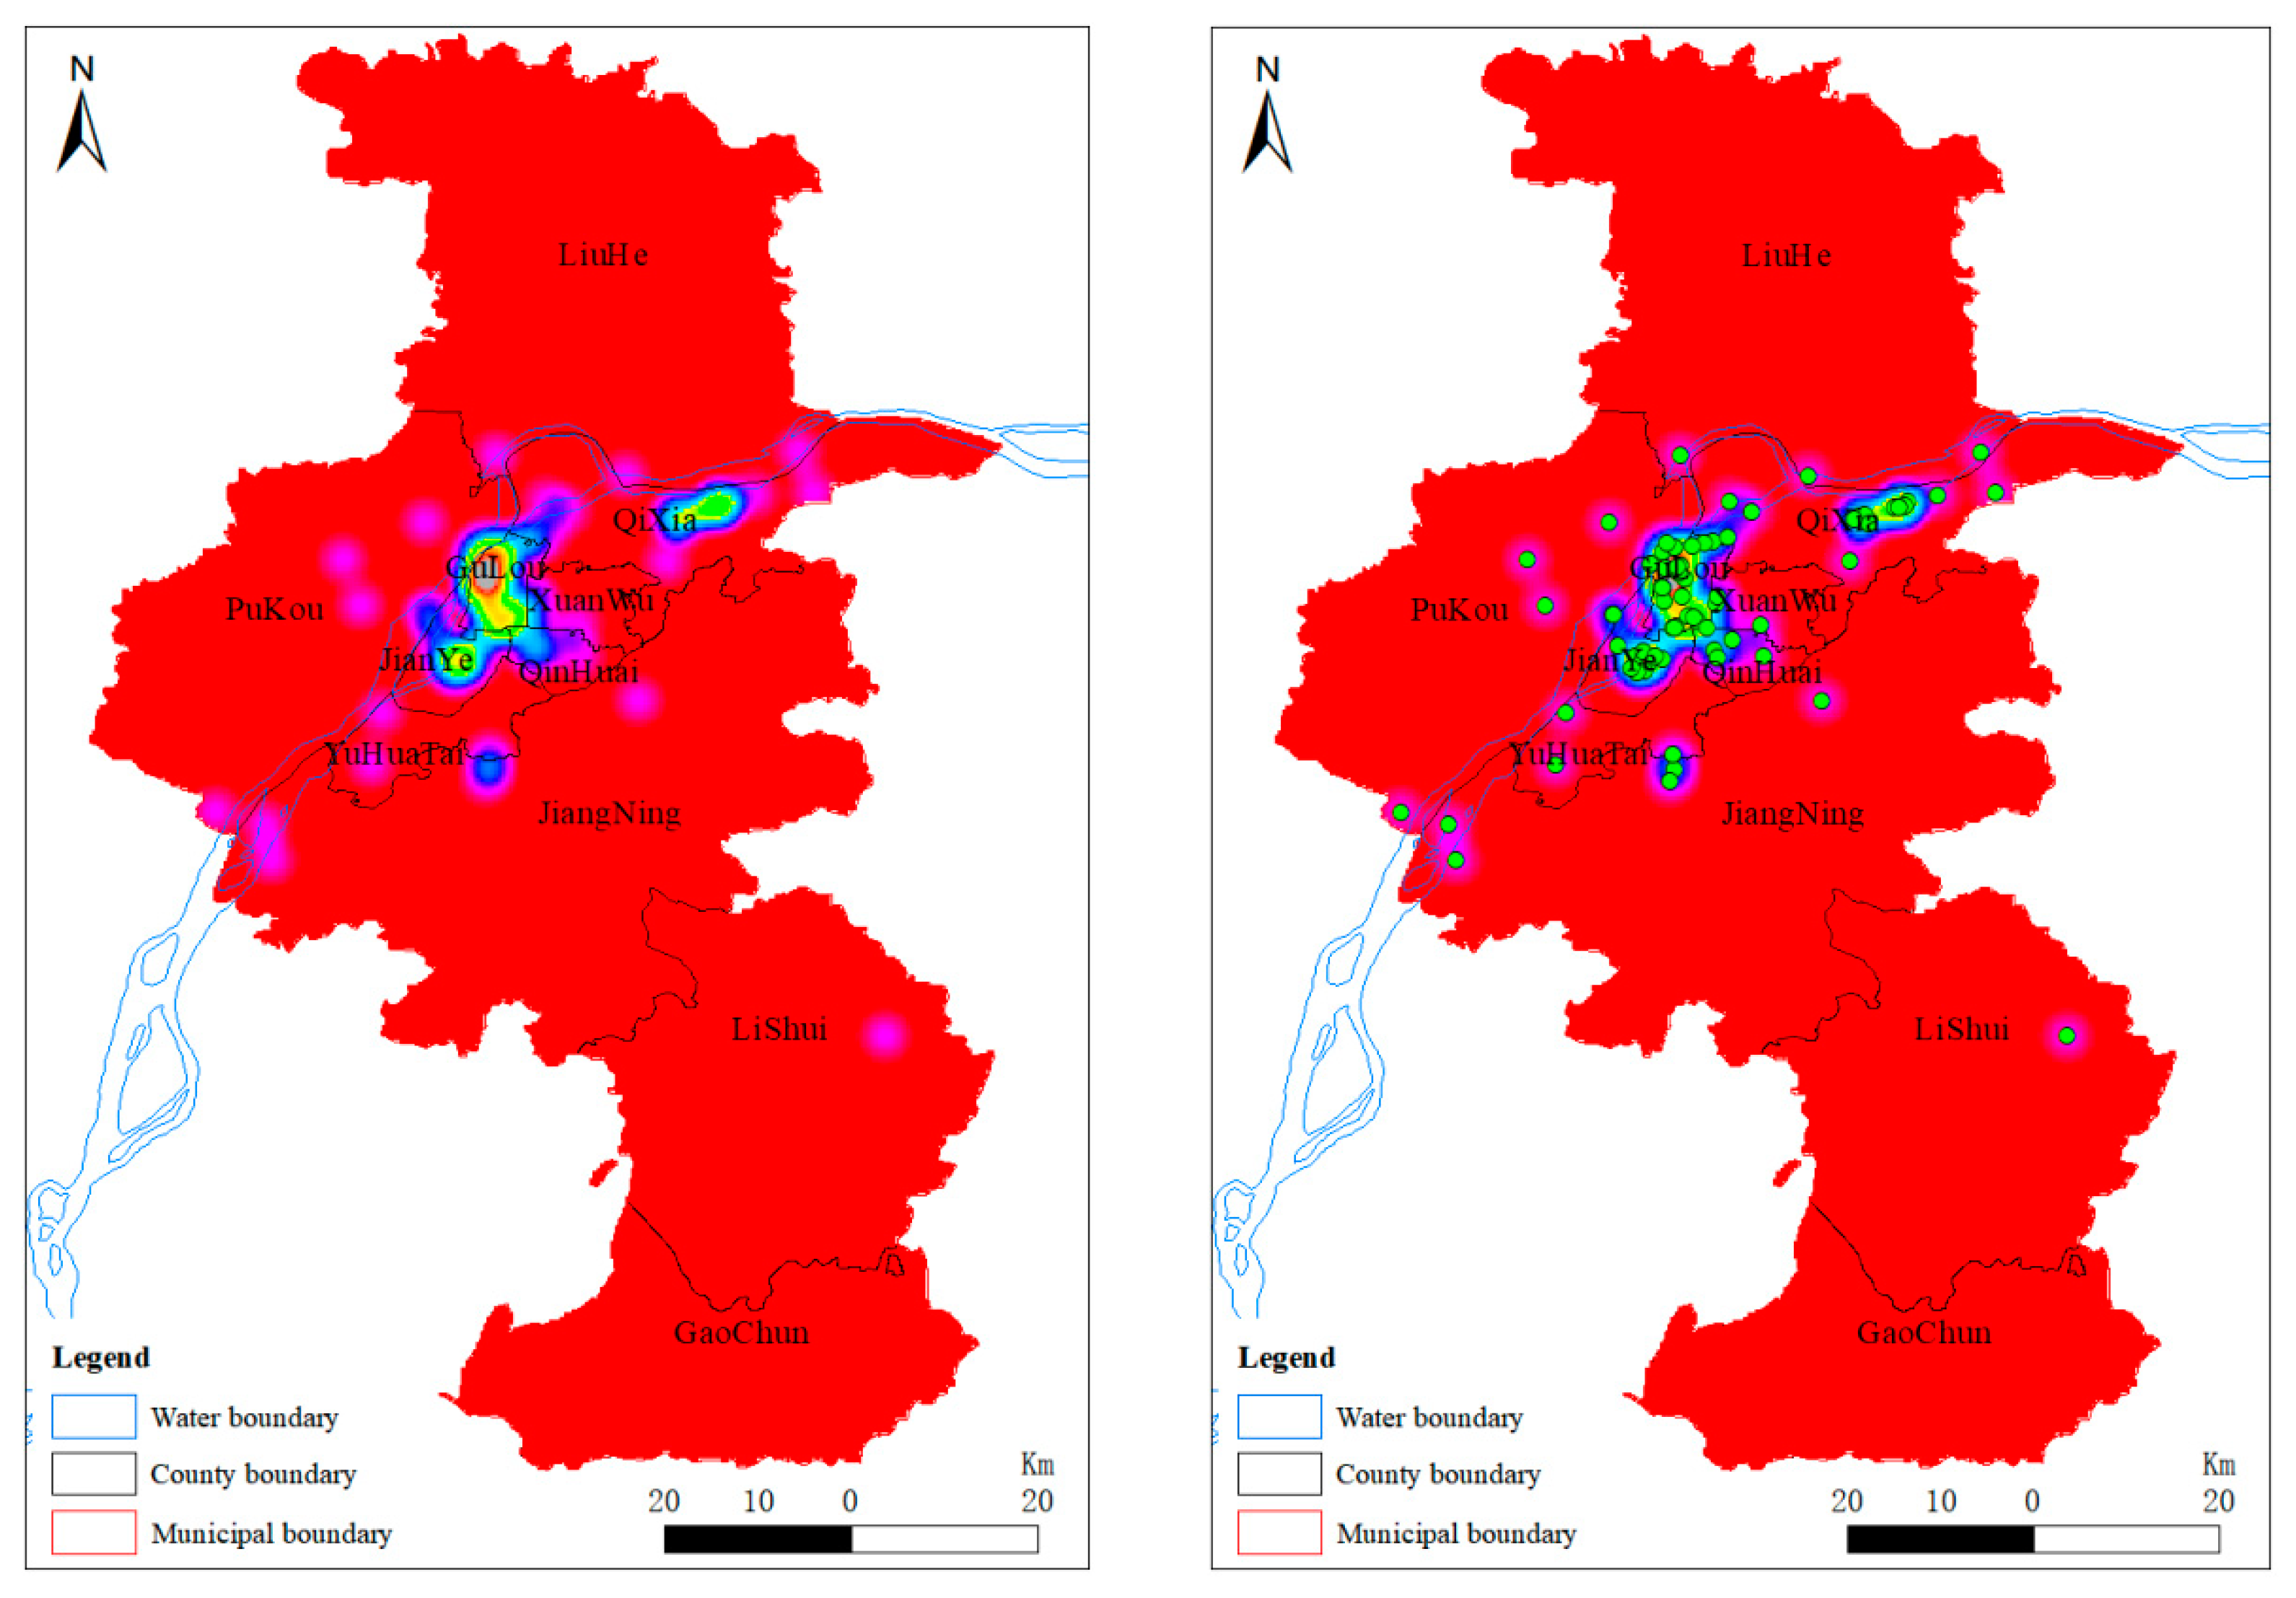
According to the results of the nearest proximity index (Table 2), the nearest proximity index of all Yangtze River cultural landscapes in Nanjing City is 0.57, showing a clustering distribution as a whole. Among them, the nearest proximity indices of geographical landscape, tangible cultural heritage and buildings and facilities are about 0.63, 0.32 and 0.59, respectively. Therefore, the above types of landscape points are clustered, and the clustering degree of tangible cultural heritage is the most significant (P value is zero). The nearest proximity index of water landscape, intangible cultural heritage and human activity landscape was about 1.09, 1.34 and 0.81, respectively, showing random distribution. And because there is only one biological landscape, the nearest neighbor analysis cannot be performed alone. According to the analysis result of the kernel density of Yangtze River cultural landscape points in Nanjing (Figure 5), the whole Yangtze River cultural landscape in Nanjing presents obvious clustering characteristics. Except Gaochun District, there are Yangtze River cultural landscape points in all districts of Nanjing, and the landscape points are mainly distributed in the southern region along the Yangtze River, among which Gulou District and Jianye District have the highest distribution density, followed by Qinhuai District and Qixia District. The distribution density of landscape points in Lishui District is the lowest.
4.3. Results of vegetation index calculation and terrain analysis in Nanjing
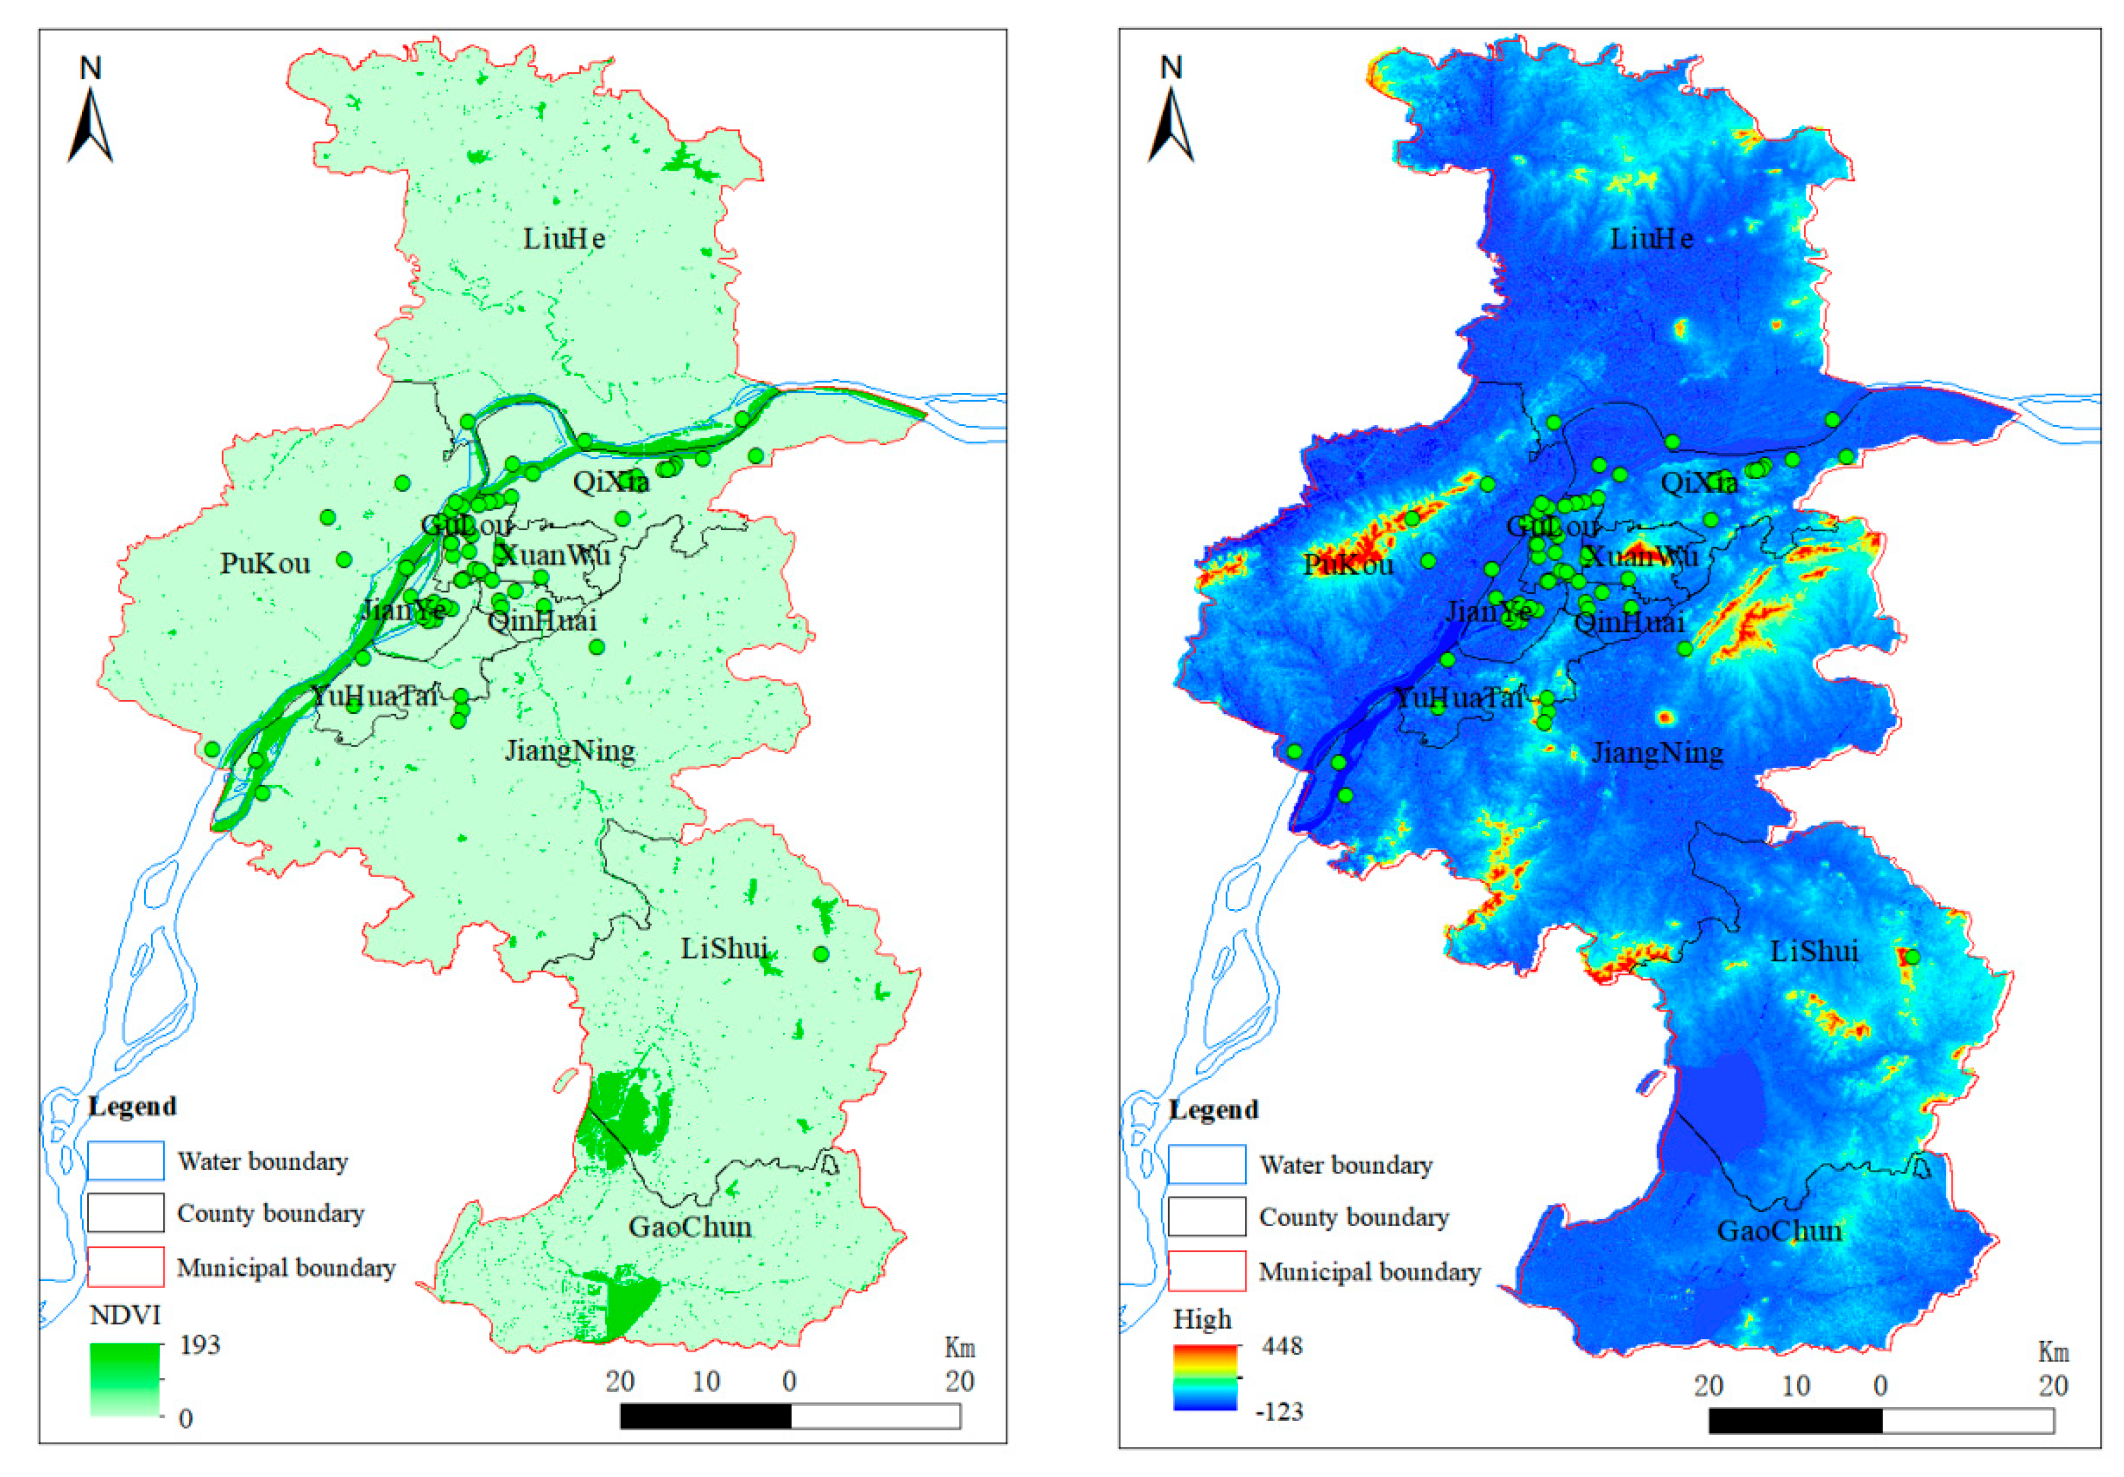
In order to fully analyze the spatial distribution relationship between the vegetation and terrain of Nanjing city and the cultural landscape points of the Yangtze River, this paper carried out band calculation and data extraction based on Landsat-8 satellite image data and global SRTM data, combined with the spatial analysis function of ArcGIS software, and calculated the NDVI index and elevation distribution data of Nanjing city. The results of the calculation of Nanjing vegetation index show that the areas with high vegetation index are mainly concentrated along the Yangtze River and some areas in the south of Nanjing, and scattered in other areas, showing a relatively obvious distribution trend of "near the water and near the river". From the results of Nanjing topographic data extraction, it can be seen that the elevation range of Nanjing is -123m~448m, and the maximum elevation difference of the city is only 571m. The topographic highs are mainly distributed in Pukou District, Xuanwu District, Jiangning District and Lishui District, and the overall terrain is relatively flat.
Figure 5.
Vegetation index and terrain extraction results in Nanjing.
5. Study on spatial distribution characteristics of Yangtze River cultural landscape in Nanjing
5.1. Analysis of the overall spatial distribution characteristics of the Yangtze River cultural landscape
Based on the keyword and relation extraction of Nanjing Yangtze River Cultural and Tourism Resources Survey Report and Knowledge graph, this paper analyzes and extracts the Yangtze River cultural landscape in Nanjing, and obtains 74 landscape points in 7 landscape types. Based on the geographic information positioning technology, the geographic coordinates of each landscape point were obtained to obtain the spatial distribution information of the Yangtze River cultural landscape points in Nanjing.
Based on the distribution data of Yangtze River cultural landscape points in Nanjing, the spatial distribution pattern of various types of Yangtze River cultural landscape points in Nanjing is analyzed, and the number and spatial distribution pattern of various Yangtze River cultural landscape points in Nanjing are different. Among them, the Yangtze River cultural landscape in Nanjing is mainly dominated by tangible cultural heritage landscape, accounting for 40.5% of the total Yangtze River cultural landscape in Nanjing. The tangible cultural heritage landscape has a wide distribution range, mainly distributed in the Gulou district on the south bank of the Yangtze River, showing obvious clustering characteristics. The number of landscape types of landscape, architecture and facilities is relatively small, but the above two types of landscape still have obvious clustering characteristics. As for water landscape, its quantity is only less than that of tangible cultural heritage landscape and architecture and facility landscape. However, due to its wide distribution range, its spatial distribution is relatively scattered, showing random distribution characteristics. However, the number of non-tangible cultural heritage, human activities and biological landscape points is small, and there is no gathering trend.
5.2. Analysis of inculencing factors around cultural landscape
The Yangtze River cultural landscape in Nanjing takes the Yangtze River as the main body and forms a rich and diverse cultural landscape around the Yangtze River basin. Affected by the distribution of water resources in the Yangtze River Basin, the cultural landscape of the Yangtze River is mainly distributed around the river. Affected by water resources and climate factors, the vegetation resources around the cultural landscape are relatively rich. At the same time, due to the increasing attention of Nanjing Municipal government to the cultural landscape of the Yangtze River in recent years and the continuous implementation of relevant landscape protection measures, the vegetation around the cultural landscape has been effectively protected, so the vegetation normalization index is high in the region along the Yangtze River. At the same time, since most of Nanjing's Yangtze River cultural landscapes exist around the Yangtze River, the landscape distribution area is generally flat. About 81.1% of the landscapes are distributed below 50m above sea level, about 12.2% of the landscapes are located between 50-120m above sea level, and only about 6.7% of the cultural landscapes are above 120m.
From the above analysis, it can be seen that under the influence of climate, environment, water resources and other factors, most of the Yangtze River cultural landscapes in Nanjing are located in areas with low altitude and high vegetation coverage. Therefore, in the protection and planning of the Yangtze River cultural landscapes, the stability of the surrounding environment should be ensured to avoid damaging the regional ecological environment.
5. Conclusions
Nanjing, as an important radiation center of Yangtze River culture, has many types of Yangtze River cultural landscape. In order to fully analyze the spatial distribution characteristics and surrounding environment of Nanjing's scene cultural landscape, this paper extracts and locates the landscape view based on knowledge graph technology and GNSS technology, extracts the vegetation index and topographic data of Nanjing based on RS technology, and finally combines GIS technology to conduct spatial analysis of the landscape view. The main research conclusions are as follows:
(1) The Yangtze River cultural landscape types in Nanjing are abundant and distributed in a concentrated way, covering seven categories, namely terrain landscape, water landscape, biological landscape, tangible cultural heritage, intangible cultural heritage, architecture and facilities and humanistic activity landscape, including 74 landscape points, mainly distributed in Jianye District, Qixia District, Xuanwu District, Qinhuai District and Gulou District;
(2) The cultural landscape of the Yangtze River in Nanjing showed an obvious gathering trend; However, the spatial distribution and aggregation degree of different types of landscape points are different. Among them, the number of geographical landscape, tangible cultural heritage and architecture and facility landscape is large and shows an obvious clustering trend, while the number of other types of cultural landscape is relatively small and shows a random distribution in space.
(3) About 81.1% of the cultural landscape of the Yangtze River in Nanjing is less than 50m above sea level. Due to the influence of climate, environment and water resources distribution, the surrounding cultural landscape of Nanjing has a low altitude and high vegetation coverage. Therefore, how to improve the protection ability of regional cultural landscape while ensuring the ecological environment security is one of the main challenges facing the cultural protection of the Yangtze River at present.
Funding
This research was funded by the Key Research and Development Program of Chengdu University of Technology Postgraduate Innovative Cultivation Program: Tunnel Geothermal Disaster Susceptibility Evaluation in Sichuan-Tibet Railway Based on Deep Learning (CDUT2022BJCX015).
Institutional Review Board Statement
Not applicable.
Informed Consent Statement
Not applicable.
Data Availability Statement
Not applicable.
Acknowledgments
The authors are grateful for helpful comments from many researchers and colleagues.
Conflicts of Interest
The authors declare that they have no known competing financial interests or personal relationships that could have appeared to influence the work reported in this paper.
References
- Tang, M. The Inventory and Progress of Cultural Landscape Study. Progress in Geography 2000, 19, 70–79. [Google Scholar]
- Riechers, M.; Pătru-Dușe, I.A.; Balázsi, Á. Leverage points to foster human nature connectedness in cultural landscapes. Ambio 2021, 50, 1670–1680. [Google Scholar] [CrossRef] [PubMed]
- Yang, C.; Han, F. A digital information system for cultural landscapes: the case of Slender West Lake scenic area in Yangzhou, China. Built Heritage 2020, 4, 3. [Google Scholar] [CrossRef]
- Cuca, B.; Agapiou, A. Impact of land-use change and soil erosion on cultural landscapes: the case of cultural paths and sites in Paphos district, Cyprus. Applied Geomatics 2018, 10, 515–527. [Google Scholar] [CrossRef]
- Dong, H.; Wu, K.; Wang, Z.; Xin, Y.; Han, C. Spatial pattern and development model of rural cultural tourism in Yu County based on GIS. Housing and Real Estate 2022, Z1, 114–120. [Google Scholar]
- Macdonald, E.; King, E.G. Novel ecosystems: A bridging concept for the consilience of cultural landscape conservation and ecological restoration. Landscape and Urban Planning 2018, 177, 148–159. [Google Scholar] [CrossRef]
- Shedayi, A.A.; Xu, M.; Gonalez-Redin, J.; Ali, A.; Shahzad, L.; Rahim, S. Spatiotemporal valuation of cultural and natural landscapes contributing to Pakistan’s cultural ecosystem services. Environmental Science and Pollution Research 2022, 29, 41834–41848. [Google Scholar] [CrossRef] [PubMed]
- Maldonado, A.D.; Ramos-López, D.; Aguilera, P.A. The Role of Cultural Landscapes in the Delivery of Provisioning Ecosystem Services in Protected Areas. Sustainability 2019, 11, 2471. [Google Scholar] [CrossRef]
- Cortés-Capano, G.; Toivonen, T.; Soutullo, A.; Fernández, A.; Dimitriadis, C.; Garibotto-Carton, G.; Minin, E.D. Exploring landowners’ perceptions, motivations and needs for voluntary conservation in a cultural landscape. People and Nature 2020, 2, 840–855. [Google Scholar] [CrossRef]
- Wang, P.; Wang, H.; Yang, S.; Sui, X.; Liu, Z. GIS-based analysis of cultural landscapes for settlement names on the northern slope of the Tianshan Mountains. Arid Land Geography 2020, 43, 516–524. [Google Scholar]
- Schulp, C. J, E.; Levers, C.; Kuemmerle T.; Tieskens, K.F.; Verburg, Peter.H. Mapping and modelling past and future land use change in Europe's cultural landscapes. Land Use Policy 2019, 80, 332–344. [Google Scholar] [CrossRef]
- Lei, Z.; Luo, J.; Cao, L. Quantitative research on historic city landscape value assessment based on AHP-GIS - Taking Taiyuan, a historic and cultural city, as an example. Journal of Taiyuan University of Technology 2021, 52, 630–637. [Google Scholar]
- Li, Q.; Guo, F.; Guan, Y. A GIS-Based Evaluation of Environmental Sensitivity for an Urban Expressway in Shenzhen, China. Engineering 2018, 4, 230–234. [Google Scholar] [CrossRef]
- Weiss, M.; Jacob, F.; Duveiller, G. Remote sensing for agricultural applications: A meta-review. Remote Sensing of Environment 2020, 236. [Google Scholar] [CrossRef]
- Lechner, A.M.; Foody, G.M.; Boyd, D.S. Applications in Remote Sensing to Forest Ecology and Management. One Earth 2020, 2, 405–412. [Google Scholar] [CrossRef]
- Kong, X.; Chen, Q.; Gu, G.; Qian, W.; Ren, K.; Wang, J. Wang, J. A GPS-based Camera Calibration Method. Acta Armamentarii 2016, 37, 2301–2307. [Google Scholar]
- Wang, X.; Wang, Y.; Li, Y.; Li, H. Review on landscape pattern change of the Pearl River Delta based on 3S technology. Ecological Science 2009, 28, 557–561. [Google Scholar]
- Zhang, L.; Lu, C.; Li, J. Development of river basins and national civilization in China. Resources and Environment in the Yangtze Basin 2015, 24, 1639–1645. [Google Scholar]
- Fang, L.; Wang, L.; Chen, W.; Sun, J.; Cao, Q.; Wang, S.; Wang, L. Identifying the impacts of natural and human factors on ecosystem service in the Yangtze and Yellow River Basins. Journal of Cleaner Production 2021, 314, 127995. [Google Scholar] [CrossRef]
- Zhou, J.; Wu, Y. The characteristics of spatial distribution and its influencing factors of Lingnan residence villages. Chinese Journal of Agricultural Resources and Regional Planning 2018, 39, 133–137. [Google Scholar]
- Hu, X.; Shangguan, L. Integrality, dynamics and intertextuality: linear cultural spatial narrative from the perspective of river basin. Journal of Primitive National Culture 2022, 14, 123–156. [Google Scholar]
- Yang, M.; Xie, Y. Spatial Pattern Change and Ecosystem Service Value Dynamics of Ecological and Non-Ecological Redline Areas in Nanjing, China. International Journal of Environmental Research and Public Health 2021, 18, 4224. [Google Scholar] [CrossRef]
- Wang, R.; Hou, H.; Murayama, Y.; Derdouri, A. Spatiotemporal Analysis of Land Use/Cover Patterns and Their Relationship with Land Surface Temperature in Nanjing, China. Remote Sensing 2020, 12, 440. [Google Scholar] [CrossRef]
- Yang, J. Study on Spatial and Temporal Changes and Influencing Factors of Nanjing Urban Historical and Cultural Landscape. Urban Development Studies 2019, 26, 80–86. [Google Scholar]
- Astola, H.; Häme, T.; Sirro, L.; Molinier, M.; Kilpi, J. Comparison of Sentinel-2 and Landsat 8 imagery for forest variable prediction in boreal region. Remote Sensing of Environment: An Interdisciplinary Journal 2019, 223, 257–273. [Google Scholar] [CrossRef]
- Mukul, M.; Srivastava, V.; Jade, S.; Mukul, M. Uncertainties in the Shuttle Radar Topography Mission (SRTM) Heights: Insights from the Indian Himalaya and Peninsula. Scientific Reports 2017, 7, 41672. [Google Scholar] [CrossRef]
- Guo, F.; Lai, P.; Huang, F.; Liu, L.; Wang, X.; He, Z. Literature review and research progress of landslide susceptibility mapping based on knowledge graph. Earth Science, 2023; 42, 1874. [Google Scholar]
- Ji, S.; Pan, S.; Cambria, E.; Marttinen, P.; Yu, P.S. A Survey on Knowledge Graphs: Representation, Acquisition and Applications. TNNLS 2021 IEEE Transactions on Neural Networks and Learning Systems 2020, 33, 494–514. [Google Scholar] [CrossRef]
- Cao, Y.; Xu, C.; Ren, Y.; Li, X. Selection of Color Pattern Indices of Scenic Forest Based on Sensitivity Ranks. Scientia Silvae Sinicae 2021, 57, 1–12. [Google Scholar]
- Qaddoura, R.; Faris, H.; Aljarah, I. An efficient clustering algorithm based on the k -nearest neighbors with an indexing ratio. International Journal of Machine Learning and Cybernetics 2020, 11, 675–714. [Google Scholar] [CrossRef]
- Monjarás-Vega, N.A.; Briones-Herrera, C.I.; Vega-Nieva, D.J.; Calleros-Flores, E.; Corral-Rivas, J.J.; López-Serrano, P.M.; Pompa-García, M.; Rodríguez-Trejo, D.A.; Carrillo-Parra, A.; González-Cabán, A.; Alvarado-Celestino; Jolly, W.M. Predicting Forest fire kernel density at multiple scales with geographically weighted regression in Mexico. Science of The Total Environment 2020, 718, 137313. [Google Scholar] [CrossRef] [PubMed]
- Jiao, M.; Lu, L.; Niu, F.; He, J.; Mu, X. Spatial Distribution Characteristics of National Key Cultural Relics Protection Units and Their Driving Factors in the Grand Canal Cultural Belt. Economic Geography, 2023, 43, 228–239. [Google Scholar]
- Barbosa, H.A.; Kumar, T.V.L.; Paredes, F.; Elliott, S.; Ayuga, J.G. Assessment of Caatinga response to drought using Meteosat-SEVIRI Normalized Difference Vegetation Index (2008–2016). ISPRS Journal of Photogrammetry and Remote Sensing 2019, 148, 235–252. [Google Scholar] [CrossRef]
- Zhang, Z.; Li, J.; Liu, Q.; Zhao, J.; Dong, Y.; Li, S.; Wen, Y.; Yu, W. Verification and analysis of high spatial-temporal resolution vegetation index product based on GF-1 satellite data. National Remote Sensing Bulletin 2023, 27, 665–676. [Google Scholar] [CrossRef]
Figure 3.
Yangtze River cultural landscape point distribution in Nanjing.
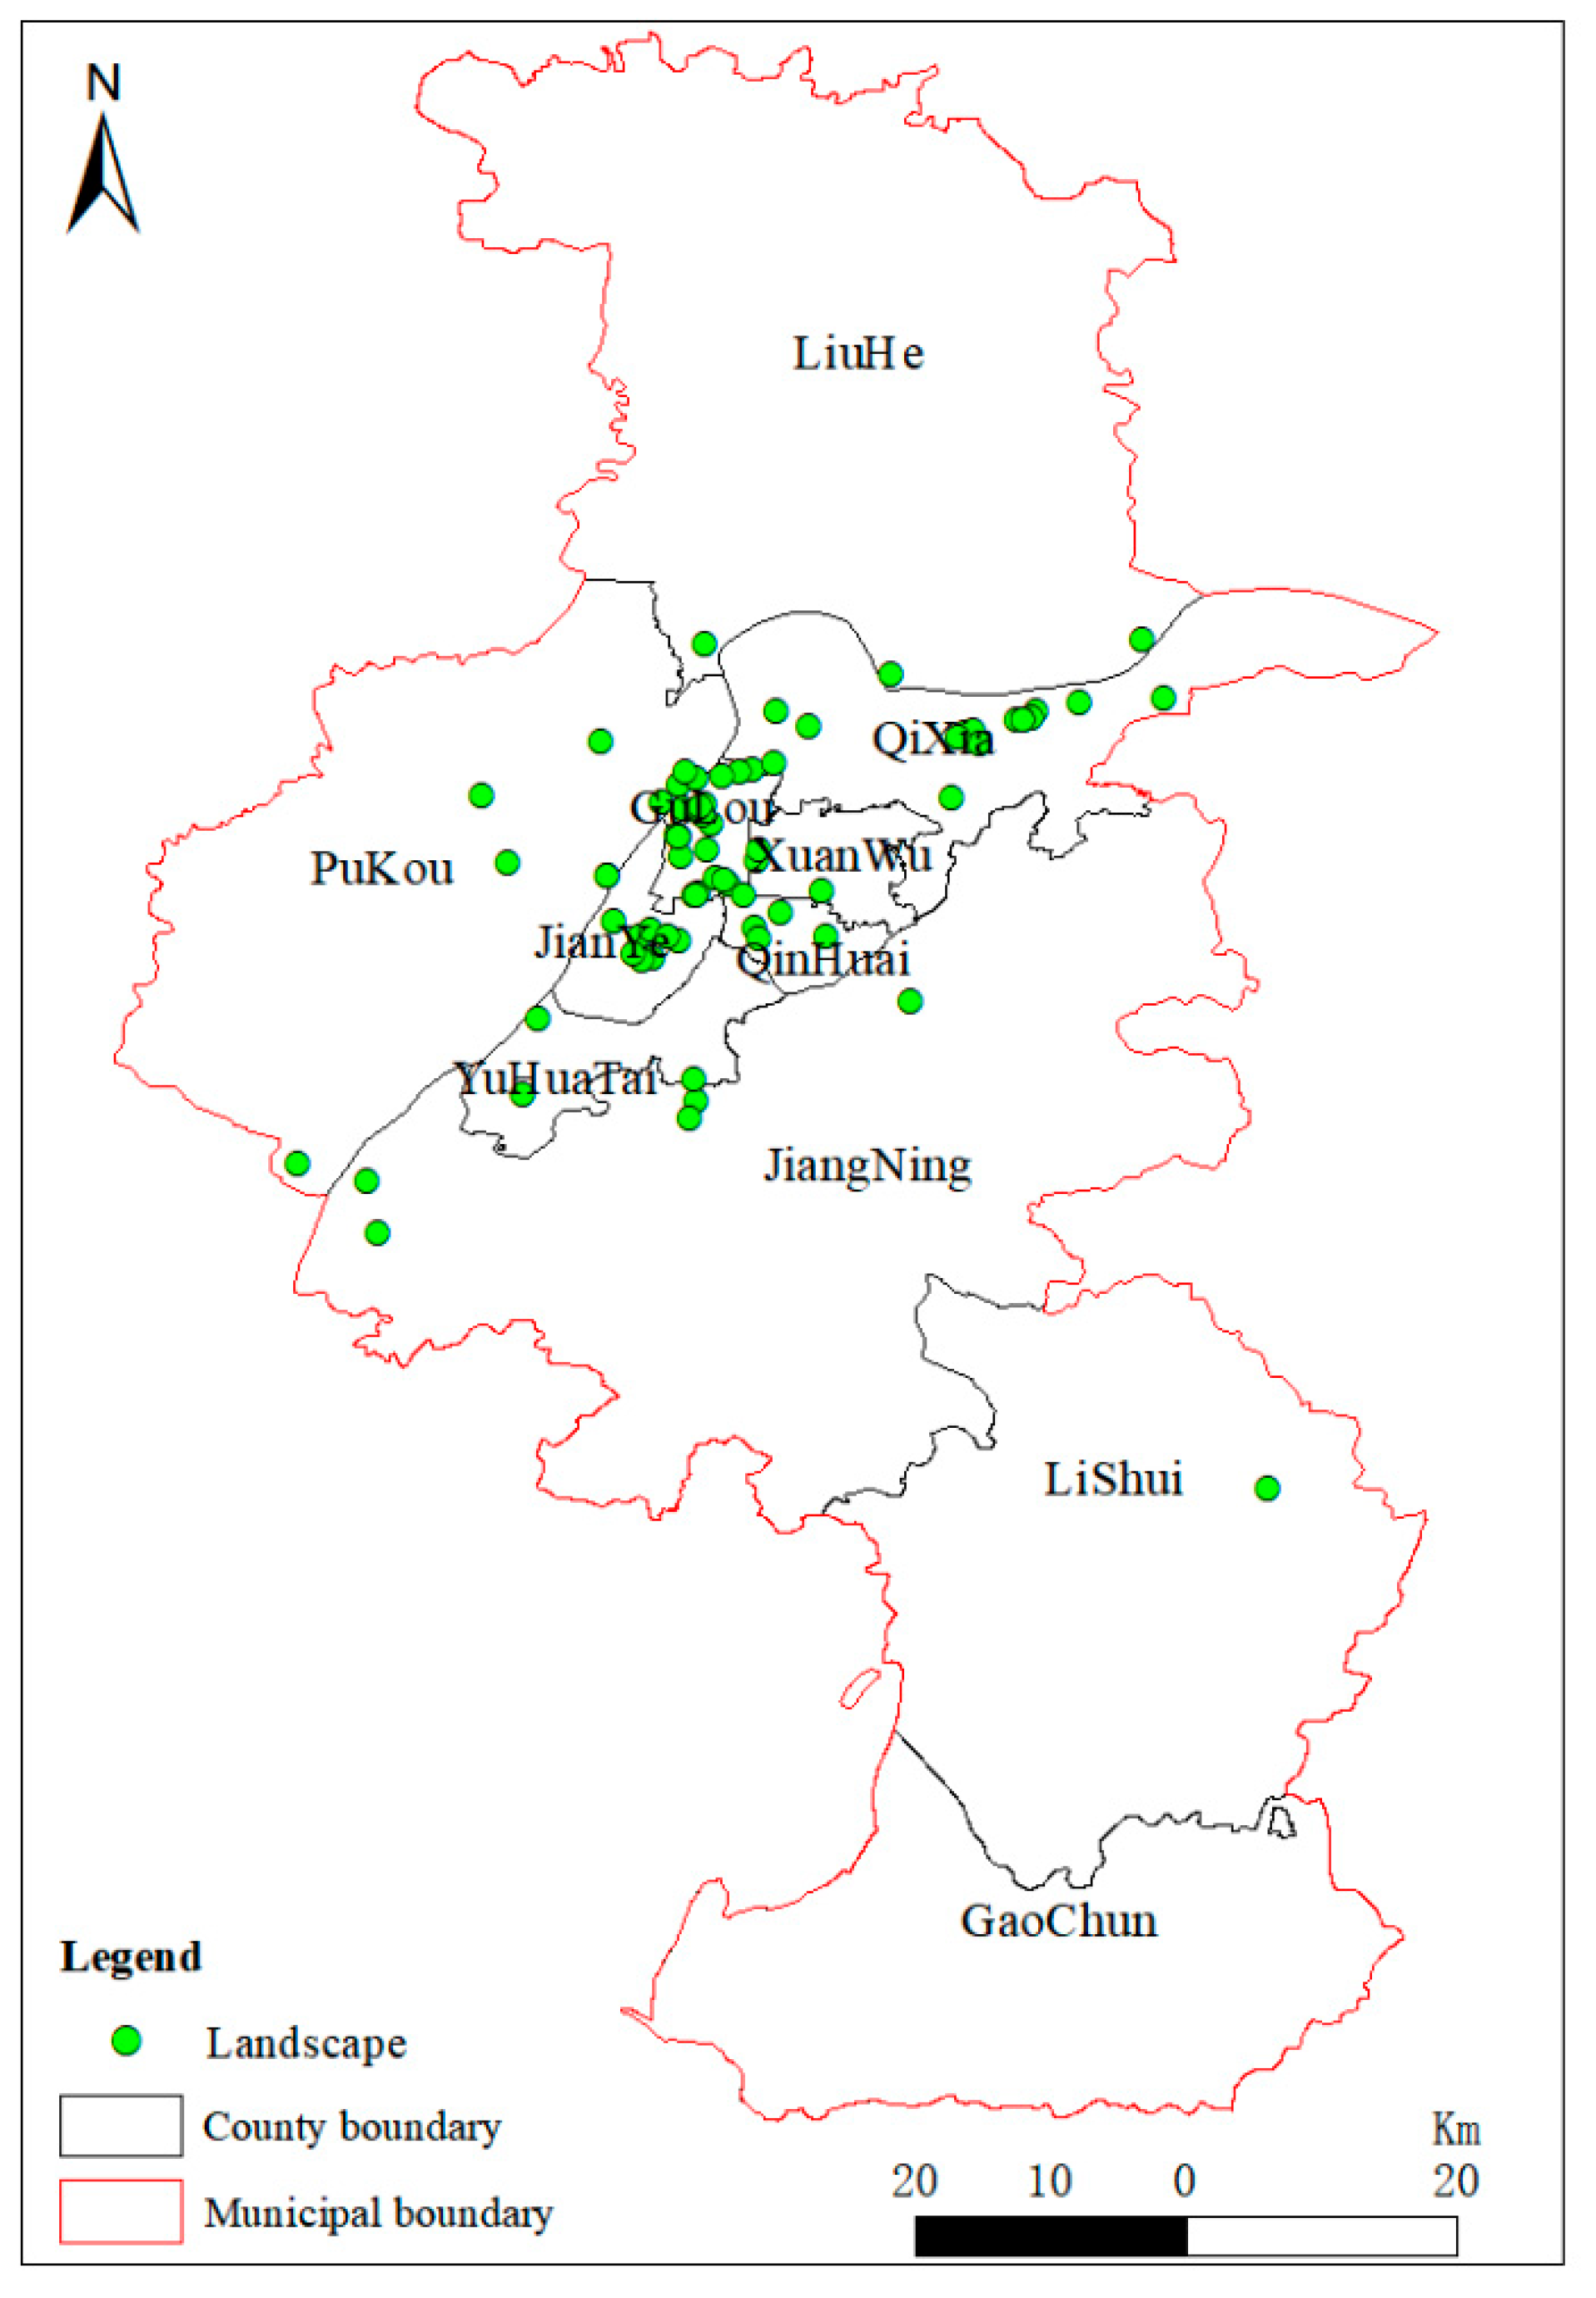
Figure 4.
Nanjing Yangtze River cultural landscape type map.
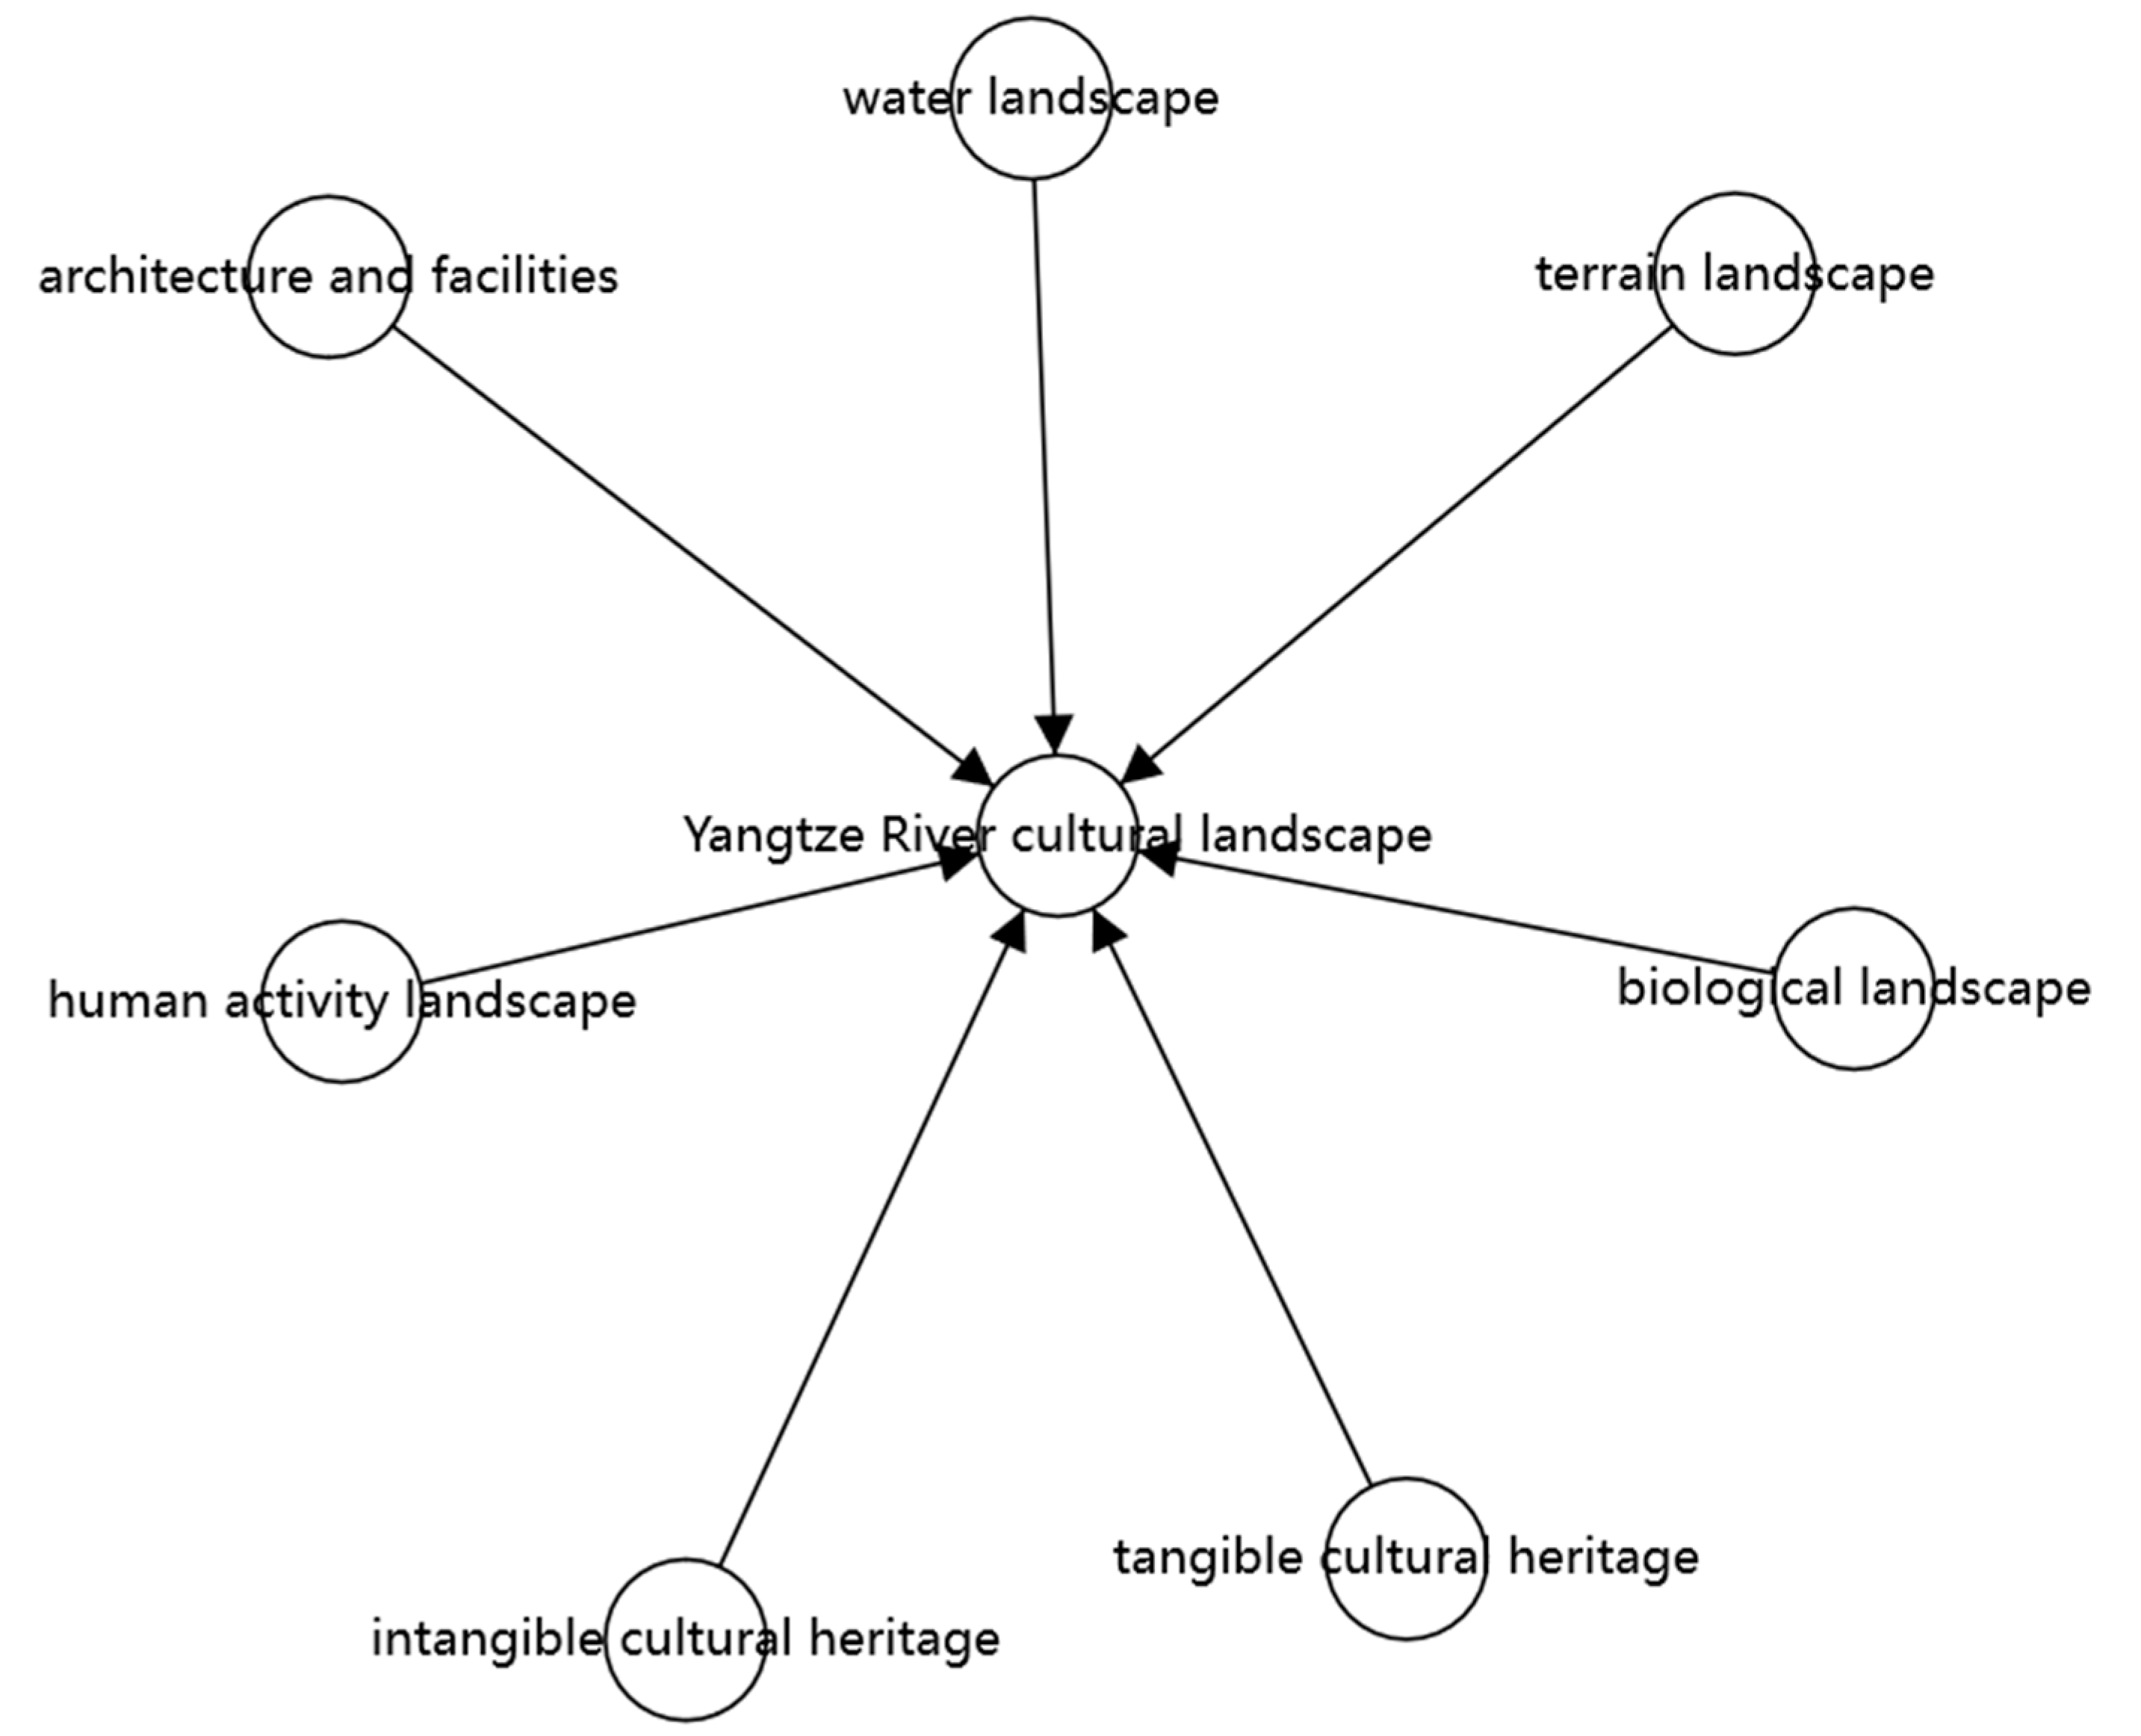
Figure 5.
Distribution of different types of landscape points of Yangtze River culture in Nanjing.
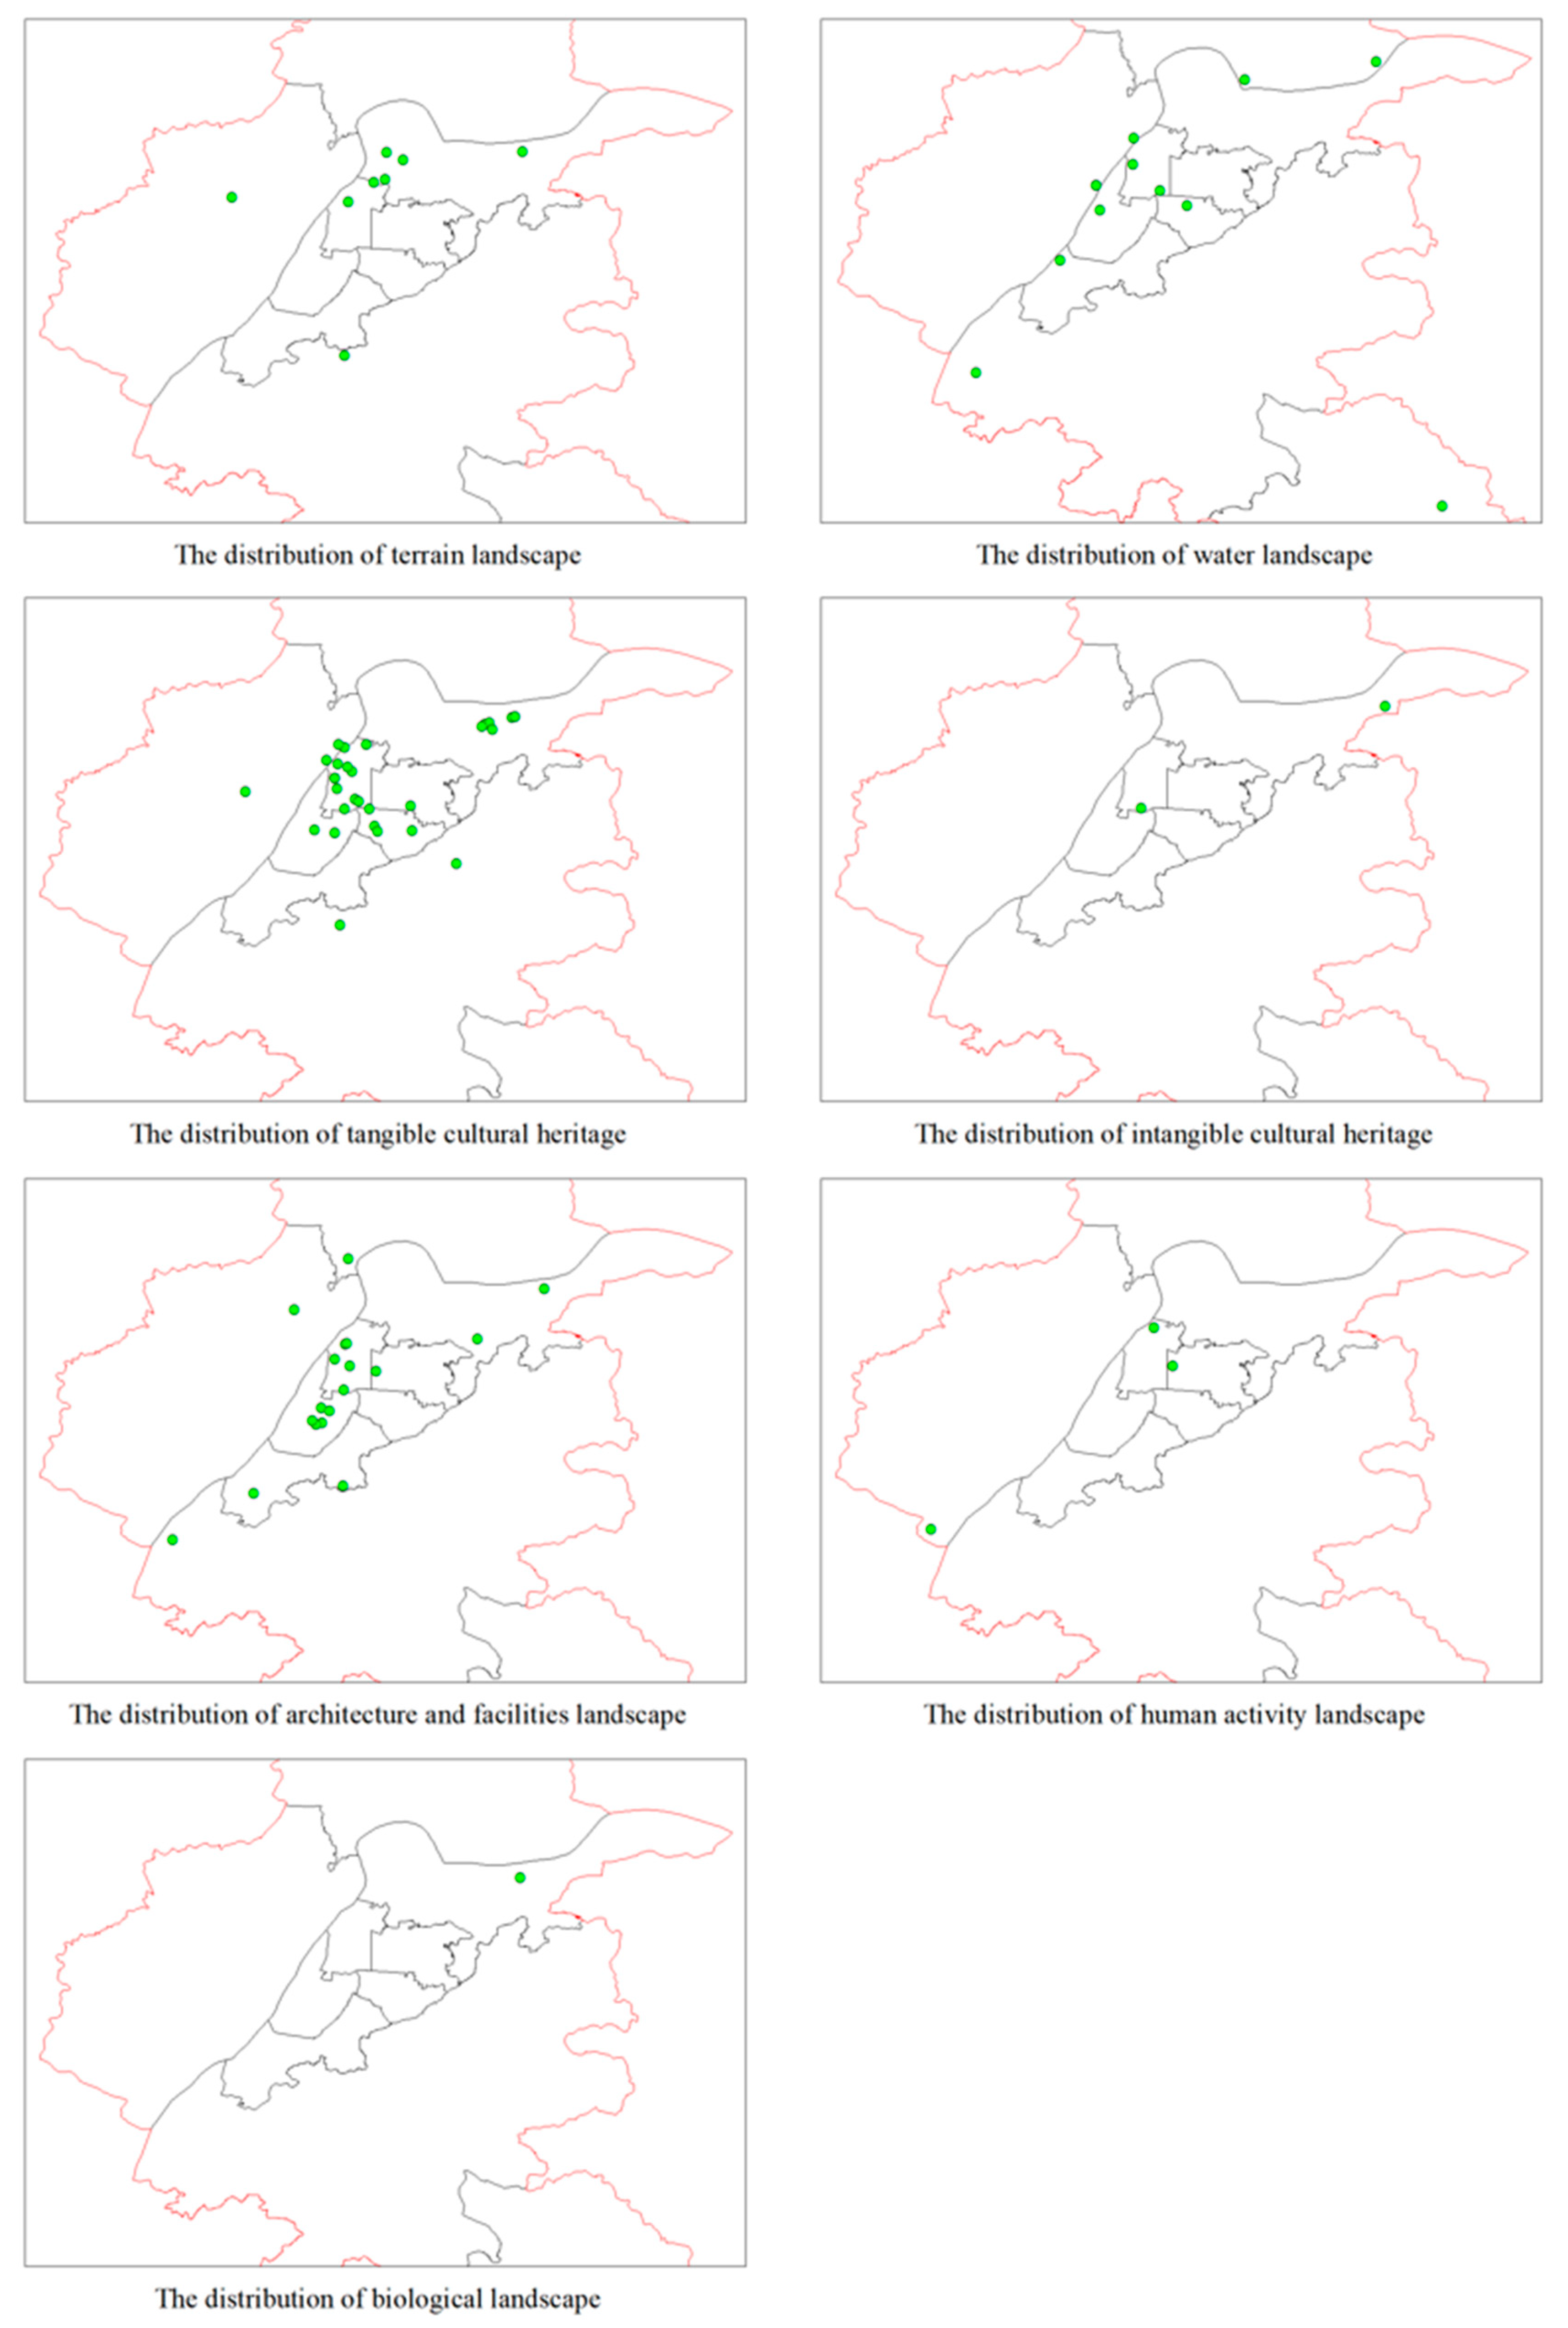

Table 1.
Statistical table of Yangtze River cultural landscape in Nanjing.
| Categories | number | proportion | typical cultural landscape |
| water landscape | 12 | 16.2% | Qin Huai River |
| terrain landscape | 8 | 10.8% | Shizi mountain |
| biological landscape | 1 | 1.4% | red maple of Qixia Mountain |
| tangible cultural heritage | 30 | 40.5% | nanjing city walls |
| intangible cultural heritage | 2 | 2.7% | Yunjin wood machine makeup flower hand weaving skills |
| architecture and facilities | 18 | 24.3% | Nanjing Treaty Historical Materials Exhibition Hall |
| human activity landscape | 3 | 4.1% | Fu Baoshi |
Table 2.
Calculation results of the nearest proximity index of the Yangtze River cultural landscape in Nanjing.
Table 2.
Calculation results of the nearest proximity index of the Yangtze River cultural landscape in Nanjing.
| Categories | theoretical mean distance | expected mean distance | NNI | Z value | P value |
| water landscape | 12726.3m | 11714.5m | 1.086377 | 0.572425 | 0.567034 |
| terrain landscape | 9058.8m | 14347.2m | 0.631394 | -1.994521 | 0.046095 |
| biological landscape | / | / | / | / | / |
| tangible cultural heritage | 2406.6m | 7408.9m | 0.324830 | -7.074641 | 0 |
| intangible cultural heritage | 38335.7m | 28694.5m | 1.335994 | 0.909028 | 0.363335 |
| architecture and facilities | 5637.3m | 9564.8m | 0.589379 | -3.332790 | 0.000860 |
| human activity landscape | 19138.2m | 23428.9m | 0.816862 | -0.606835 | 0.543960 |
| comprehension | 2678.5m | 4717.3m | 0.567799 | -7.112664 | 0 |
Disclaimer/Publisher’s Note: The statements, opinions and data contained in all publications are solely those of the individual author(s) and contributor(s) and not of MDPI and/or the editor(s). MDPI and/or the editor(s) disclaim responsibility for any injury to people or property resulting from any ideas, methods, instructions or products referred to in the content. |
© 2023 by the authors. Licensee MDPI, Basel, Switzerland. This article is an open access article distributed under the terms and conditions of the Creative Commons Attribution (CC BY) license (http://creativecommons.org/licenses/by/4.0/).
Copyright: This open access article is published under a Creative Commons CC BY 4.0 license, which permit the free download, distribution, and reuse, provided that the author and preprint are cited in any reuse.


