
Submitted:
18 November 2024
Posted:
18 November 2024
You are already at the latest version
Abstract
Puya raimondii Harms is a charismatic species discovered in the Cordillera Blanca (now Huascarán National Park, Peru) in 1867 by the great Italian-born Peruvian geographer and naturalist Antonio Raimondi. The importance of this plant is due to its imposing size, to the rare and extreme ecosystem that depends on it, and to the fact that it is linked to the name Antonio Raimondi. Four studies on its genetic diversity revealed a range of patterns, with a fixation index of 0.711 as weighted mean and gene flow as low as 0.02–0.03. In fact, the vast majority of the total genetic variation was documented between populations, with very low genetic variation found within populations (weighted mean genetic diversity as low as Hs = 0.072 and mean genetic similarity very high, ranging from 96% up to 99%). We hypothesize that the narrow genetic base of P. raimondii populations may be due to a combination of factors: i) an inbreeding‒based reproductive strategy (i.e., mating between individuals related by common ancestry), which leads to homozygosity and genomic uniformity; ii) strong environmental selective pressure (e.g., day‒night temperature excursion, long dry period, etc.), which favours only the highest fitness individual genotypes; and iii) a long life cycle, which hampers recombination events and reduces genetic diversity. Overall, these factors suggest that P. raimondii is a genetically fragile, fragmented, and endangered species.
Keywords:
Puya raimondii
; plant reproduction systems
; plant population genetics
; fixation index
; Antonio Raimondi
1. Introduction
Puya raimondii Harms is a charismatic species that was discovered and described in the Cordillera Blanca (now Huascarán National Park, Peru) by Antonio Raimondi in 1867. The importance of this plant is due to its imposing size (it is the largest member of the Bromeliaceae family), the rich and uncommon ecosystem that depends on it, and to the fact that it is linked to the name of Antonio Raimondi, who was born in Milan in 1824 and emigrated to Peru in 1850. In 1851, he became a professor of natural history in the Collegio de la Independencia, but most importantly, in 1856, he was one of the professors who founded the medical school at the National University of San Marcos, and in 1861, he founded the Department of Analytical Chemistry. This article is dedicated to his memory since this year marks the two hundredth anniversary of his birth.
Notably, P. raimondii is a high‒altitude species from the Andes, ranging from 3000 to 4800 m [1]. It is colloquially known as the Queen of the Andes and reproduces only once in a lifetime (i.e., semelparity), with plants usually flowering at 40–100 years of age [2,3]. Consequently, P. raimondii is considered genetically fragile, fragmented and endangered because of its long generation time and death after its first reproduction, which are biological features that prevent genetic diversity [1]. Thus, the conservation of P. raimondii populations is of paramount importance, as the impact of climate change and human activity, including the exploitation of plants for various purposes, can potentially lead to the deterioration of these unique populations, which possess a rich historical and distinctive evolutionary legacy.
The aim of this work is to critically review the main studies carried out on the population genetics of P. raimondii to infer its reproductive systems and hence to provide a solid basis for drafting an adequate plan for the conservation of this fascinating plant and its extraordinary ecosystem. We are confident that such a plan must start from the local populations representing the genetic material best preserved in protected areas, which have experienced less genetic erosion and have been shown to be highly divergent, highly inbred and characterized by exceptionally high genetic loads. This genetic material should constitute the starting point for the reinforcement of the species within its original distribution area, which would allow for the replacement of the small populations destined to disappear and ensure the conservation of its characteristic ecosystem. Such an action, carried out by the Peruvian Universities along with national and regional Institutions, would also constitute a dutiful homage, on the two hundredth anniversary of his birth, to the great Italian geographer and naturalist to whom P. raimondii has linked its name as well as the Peruvian history of the past two centuries.
2. Results and Discussion
To date, four studies have been conducted to assess the genetic diversity of P. raimondii over a period of two decades [4,5,6,7]. The initial study, conducted by Sgorbati et al. [4], employed amplified fragment length polymorphism (AFLP), random amplification of polymorphic DNA (RAPD) and chloroplast simple sequence repeats (cpSSR) markers to assess the genetic structure of 160 individuals sampled from eight distinct populations. Among the 217 AFLP markers used, 7 were polymorphic within populations, and 18 were polymorphic among populations, scoring a total genetic diversity (Ht) of 0.295 (Table 1). Notably, four populations were entirely monomorphic, whereas the remaining populations presented only 1 to 3 polymorphic markers. This was reflected in within‒population genetic variation of less than 4% and therefore high genetic differentiation among populations, accounting for 96.1% of the total variation, i.e., Fst = 0.961 (Table 1). The estimated gene flow equal to Nm = 0.02 (Table 1) was very low, suggesting nearly complete genetic isolation between populations, highlighting the restricted dispersal of genetic materials (pollen, seed, and plantlet sources) and strong geographic barriers.
In this study, to further explore the genetic background of P. raimondii, RAPD markers were used to analyse a progeny set of 13 plants. Only two out of 63 parental loci were heterozygous, suggesting a high homozygosity level of 96%. Additionally, no polymorphisms were detected with seven universal cpSSR primers. In terms of reproductive biology, the consistent ploidy across seeds and leaves excluded apomixis as the cause of high homozygosity, suggesting instead that the species predominantly reproduces via autogamy. These findings provide the first insights into the genetic diversity among P. raimondii populations through the assessment of molecular markers. Furthermore, information was gleaned regarding its reproductive biology via genome size estimation and ploidy level analysis [4].
A decade later, Hornung-Leoni et al. [5] investigated five populations of P. raimondii from two localities, Huascarán and Canchayllo (Table 2), using AFLP markers with four primer combinations for DNA fingerprinting. This study, which included a total of 60 individual plants, presented results that apparently contrast with the findings of Sgorbati et al. [4]. Here, 32.1% of the genetic variation occurred among populations, whereas 67.9% was found within populations. This distribution suggests that a significant proportion of the total genetic diversity, corresponding to Ht = 0.230 (Table 1), was retained within populations [5]. To summarize, this study suggests that high genetic variation is found within populations, even though the UPGMA dendrograms generated from AFLP data via the Dice index [8] shared similar patterns in terms of genetic similarity statistics with those of the study of Sgorbati et al. [4] (Figure 1A,B). In the study of Hornung-Leoni et al. [5], the estimates of genetic similarity ranged from approximately 98–99% (red line, Figure 1B), with an admixed cluster of individuals from the five populations included in the analysis. These values were even higher than those reported by Sgorbati et al. [4], who reported approximately 96% genetic similarity and included three other species of Puya as outgroups: Puya ferruginea (R. and Pav.) L. B. Sm., Puya herrerae, and Puya densiflora (Figure 1A).
In contrast, Tumi et al. [6,9] utilized SSR markers to examine the genetic structure of P. raimondii, analysing 84 individuals from three populations (Figure 1C, Table 2). That study revealed a mean of 0.051 for the observed heterozygosity and a higher expected heterozygosity within populations, that is, Hs = 0.217 (Table 1), indicating a significant excess of homozygosity. Moreover, they reported 65% genetic variation among populations and only 10% within populations. The inbreeding coefficient (Fis = 0.776) and fixation index (Fst = 0.426) reported in Table 1 indicates substantial inbreeding, along with significant genetic differentiation among populations [6]. Despite these data, a perplexing interpretation emerged, suggesting that the genetic diversity data mostly agree with the findings of Hornung-Leoni et al. [5], whereas the results of Sgorbati et al. [4] were contrary. The authors proposed that the differences among these studies may also be attributed to the age of the sampled plants, as they had sampled juveniles, whereas the studies by Sgorbati et al. [4] and Hornung-Leoni et al. [5] did not specify the size or age of the plants. However, some points require further clarification. First, their findings align with those of Sgorbati et al. [4] and with the general fact that genetic diversity is greater among populations than within populations. Second, Hornung-Leoni et al. [5] reported the opposite pattern, with greater diversity within populations. Finally, the age of the plants is irrelevant when using genomic DNA-based markers, such as AFLP and SSR, since these molecular markers are not influenced by the age or developmental stage of the individual plants.
Most recently, Liu et al. [7] estimated the genetic diversity of 200 individuals sampled from nine populations of P. raimondii via whole-genome sequencing. Approximately 95.65% of the P. raimondii sequence reads were accurately mapped to the reference genome. The results revealed very low genetic diversity within populations and high genetic divergence among them. The Fst values ranged from 0.88 to 0.92 (Table 1), indicating strong genetic isolation. Population structure analyses clearly divided the nine populations, with all individuals being genetically assigned to their respective geographic groups (Figure 1D).
Overall, the fixation index calculated over all four studies was equal to Fst = 0.771 as weighted mean, ranging from a minimum of 0.144 [5] to a maximum of 0.961 [4], and the most reliable of those statistics is based on the whole-genome sequencing recently reported by Liu et al. [7]. In fact, the proportion of genetic diversity among populations was as high as Fst = 0.88–0.92. Hence, most of the total genetic variation was documented among populations, with very low genetic variation found within populations (i.e., weighted mean as low as Hs = 0.072). The high genetic differentiation among populations was confirmed by gene flow estimates, which revealed values as low as Nm = 0.02–0.03 [4,7].
The different methodologies used across these studies, i.e., AFLP, SSR, and WGS, may account for some of the variations in the reported data. Molecular markers are widely integrated and employed in genetic diversity assessment for ease and efficiency of use [10,11,12,13,14]. In particular, the AFLP markers proved reliable in our case and yielded results similar to those obtained by new technologies such as WGS, e.g., the studies of Sgorbati et al. [4] and the work of Liu et al. [7] 20 years later. Moreover, the number of representative populations included in these studies (Table 2), on the basis of their geographical distribution across the northern, central, and southern regions of the Peruvian Andes (Figure 1 and Figure 3), may also influence the divergence in the reported results. For example, the study of Hornung-Leoni et al. [5] included five populations from two geographical locations, the northern and central regions of the Andes (blue triangles, Figure 3), in accordance with the reported UPGMA dendrogram (Figure 1B). Although the study analysed five P. raimondii populations, the AMOVA results referred to data from “nine populations of both species of Andean Puya”, creating confusion regarding the actual number of populations and species included in the genetic diversity assessment data.
On the other hand, the remaining three studies sampled populations from the northern, central, and southern regions of the Peruvian Andes, with the study of Tumi et al. [6] representing three populations from each geographic zone (Figure 3). In this study, the central Yanacancha (YAN) population presented the same membership in the STRUCTURE analysis as the northern Pacahapaqui (PAC) population did (Figure 1C). These two populations, along with the other seven populations included in the study by Liu et al. [7], were clearly delineated by the STRUCTURE analysis (Figure 1D) and attributed to their respective geographic zones, i.e., north, centre, and south, according to the reported lower K values (K = 3; see Liu et al. [7]). In fact, the strong geographic isolation of P. raimondii populations across the Peruvian and Bolivian Andes, whose plants are found solely approximately 4,000 m above sea level (“sky-islands” distribution pattern), seems to efficiently hamper any gene flow among populations by means of either animal-based pollen and seed dispersal or human-mediated plant migration and introduction.
To summarize, from a genetic perspective, Sgorbati et al. [4] and Tumi et al. [6] reported high genetic differentiation among populations, with minimal within-population diversity, reinforcing the idea that P. raimondii populations may experience limited gene flow and significant genetic isolation due to geographic distribution (Figure 3). In contrast, Hornung-Leoni et al. [5] reported higher within-population genetic diversity and moderate genetic differentiation, implying greater connectivity among populations. The most recent study by Liu et al. [7] provided a more comprehensive assessment of the genetic diversity in this species through high-resolution genomic data, resolving some of the discrepancies reported by earlier studies. These findings confirmed low genetic diversity within populations and strong genetic isolation among populations, as indicated by high Fst values (Table 1), and confirmed the genetic diversity results of Sgorbati et al. [4]. The overall pattern indicates that P. raimondii is a genetically fragile, fragmented and endangered plant species because of its long generation time and death after its first reproduction, which are biological features that prevent genetic diversity within populations and increase genetic isolation and differentiation among populations.
Interestingly, to shed light on the demographic history of this unique species, Liu et al. [7] conducted a detailed investigation by analysing the genomes of P. raimondii and its close relative, an iteroparous species, Puya macrura. It is hypothesized that the two species diverged approximately 4.7 million years ago and experienced a bottleneck 1–0.7 million years ago during the Pleistocene. Here, the population size of both species decreased, likely due to climatic events, even if they evolved differently, with P. raimondii being more sensitive to climate challenges than P. macrura was due to its low adaptability rate and semelparity reproductive strategy. In contrast, P. macrura adapted rapidly and managed to recover and expand [7]. These findings are highly relevant given that they reflect the cost of the low genetic diversity present in P. raimondii.
The case study of P. raimondii here presented deserves a further discussion focused on the inbreeding-based reproductive strategy of the species (i.e., mating between individuals related by common ancestry). Molecular marker data suggest that we are dealing with individuals and populations that at the species level are most likely characterized by a high degree of homozygosity stemmed from inbreeding (i.e., mediated by either selfing or outcrossing and sib-mating or promoted by mixed conditions). It is well known that inbreeding has usually negative effects on the evolution and preservation of a small lineage and gene pool [15,16].
In a population with a high degree of inbreeding, progenies are more likely to inherit harmful mutations from both germ lines. Therefore, plants carrying these mutations with an inbreeding-based reproductive strategy can more quickly manifest lower vigour and poorer viability and/or fertility. Hence, progenies expressing these mutations may worsen their fitness and consequently become less likely for deleterious mutations to be passed on to subsequent generations. Such behaviour seems particularly true in P. raimondii and boosted in this species as it typically has a very long-life cycle, is exposed to a strong environmental selective pressure, and reproduces once every several dozens of years.
Recently, Fortier [17] published about the importance of P. raimondii, focusing on a call for more actions for its conservation through in situ and ex situ initiatives. It is therefore possible that future climatic challenges could prove fatal for this species, since it may reduce the populations of P. raimondii by one-fifth, or even by half, as reported by Fortier [17], or alternatively, by 45% [18]. P. raimondii plants are subject to a number of anthropogenic risks, including the use of fire for land regeneration and the avoidance of domesticated animal entrapment in its sharp leaves [17,19]. Furthermore, its gigantic and resilient leaves are utilized as a food source attained by foraging [19]. In addition to anthropogenic risks, Suni et al. [20] documented the impact on P. raimondii and the surrounding ecosystem of fires occurring every 4–6 years, coinciding with periods of drought and low temperatures preceded by high precipitation [20]. These recent studies in 2024 are of paramount importance, as they correlate genetic information [7], environmental issues [20], and conservation actions [17] to more accurately identify the importance and necessity for the risk assessment of P. raimondii.
Naturalists and scientists hold great responsibility for discovering and transmitting data on rare and endangered species, leading to pivotal actions for the protection of not only the species but also the surrounding ecosystem. The high Andes region is home to some of the most biodiverse ecosystems on the planet, and as such, it is highly conserved [17,21,22]. However, the importance of acquiring genetic data and evaluating emerging technologies is as crucial as the accurate interpretation and transmission of these data. To this end, the standardization of genetic data for P. raimondii population structure is of paramount importance for the implementation of protective measures for this giant yet fragile species, known as the Queen of the Andes.
3. Methodology
Reproduction in angiosperms has a well-defined evolutionary meaning. On the one hand, it markedly determines the preservation of genetic diversity between species, limiting or preventing the exchange of genes between different genomes; on the other hand, it equally affects the genetic structure of populations, significantly contributing to the composition of genotypes within species and the organization of their genomes [23]. In general, comprehending the reproductive systems and dynamics of plant species will help overcome the reproductive barriers that limit genetic diversity and serve to understand the structure and evolution of plant populations along with their conservation strategies.
Two criteria should be followed for genetic marker-based characterization and conservation decision-making: priority populations for conservation should be those with the greatest within-population diversity, and/or the conservation of between-population diversity should be maximized. Both within- and between-population diversity parameters are typically measured via molecular markers. In both cases, making sound, evidence-based priority decisions for conservation at the global level requires the availability of large datasets.
The genetic variability or uniformity of plant populations characterized via molecular markers is usually assessed via the calculation of genetic similarity coefficients. Estimates of genetic similarity (GS) between populations can be computed on the basis of either dominant or codominant molecular markers. These estimates are traditionally calculated in all possible pairwise comparisons between individuals either within or between populations via different coefficients. For example, genetic similarity estimates between individuals can be calculated using the following formula of Dice (1945): GS = 2Mij/(2Mij + Mi + Mj), where Mij represents the number of shared markers scored between the pair of individual fingerprints, haplotypes or genotypes (i and j) considered; Mi is the number of markers present in i but absent in j; and Mj is the number of markers present in j but absent in i. Such an estimate of genetic similarity corresponds to that calculated by the formula of Nei and Li (1979).
The simple matching (SM) coefficient is also very popular for computing genetic similarity. This coefficient represents the simplest way of measuring similarity, as it does not impose any weights. For a given comparison, SMij can be calculated as follows: SMij = m/(m+n), where m corresponds to the matches (i.e., number of shared markers) and n is the number of mismatches (i.e., polymorphic markers) between individuals i and j (for details, see Barcaccia, 2010 [24]).
The standard genetic diversity (H) and genetic differentiation (D) statistics of Nei [25] and the inbreeding (F) coefficients of Wright [26] are also widely used to summarize the genetic structure of populations and the distribution of genetic variation using codominant molecular markers. The average (no) and effective (ne) number of alleles per locus as well as the observed (Ho) and expected (He) heterozygosity are the most commonly calculated population genetic parameters for the characterization of within-subpopulation diversity. If pi denotes the frequency of the ith marker allele at a given locus, then the genetic diversity computed as H = 1 – Σpi2 is equivalent to the expected heterozygosity. This parameter can be computed for single subpopulations (Hs) and the total population as a whole (Ht). Hierarchical analysis of variance with estimation of F statistics is then usually performed to measure the deficiency or excess heterozygosity within a subpopulation (Fis) and between subpopulations (Fit) as well as the fixation index (Fst) of the total population at the species level: Fst = (Ht – Hs)/Ht. In particular, Fst measures the effect of the subdivision of the total population into different subpopulations and corresponds to the reduction in heterozygosity of individual populations compared with the population as a whole. Gene flow (Nm) is usually derived from the fixation index as follows: Nm = 0.25(1 – Fst)/Fst. The result is independent of population size because the force of gene flow, which is measured by the fraction of migrants in a population (denoted as m), is counteracted by the force of genetic drift, which is proportional to the inverse of the population size (N). An Nm <1 indicates local differentiation of populations, whereas an Nm > 1 indicates little differentiation among populations.
Any set of genetic diversities or similarities can be analysed in terms of within- and between-population genetic variation, particularly in terms of individual plant contributions to the total genetic variability. The most common approach involves calculating a symmetrical matrix of genetic distances or similarities on the basis of marker allele frequencies and multilocus fingerprints or genotypes, respectively, generating UPGMA dendrograms and PCA centroids (for details, see Barcaccia, [24]).
Molecular markers and, more generally, genomics data are very useful for studying plant reproductive biology as well as mating systems (for example, degree of selfing vs. outcrossing or sexuality vs. apomixis) and their direct consequences for population genetics (i.e., heterozygosity vs. homozygosity, population structure, genetic diversity partitioning, inbreeding levels, genetic drift dynamics, etc.) and for assessing genetic diversity within and genetic differentiation among populations to infer basic information on plant reproductive patterns. In the last 10 years, our research group has applied molecular markers to several crop and model species for genotyping individuals and populations by amplifying target regions or by sequencing whole genomes, including cereals (corn, barley, wheat, etc.) [27,28,29], vegetables (lettuce, chicory, endive, sweet potato, fennel, common bean, etc.) [30,31,32,33,34,35], fruit trees (olive, grapevine, pear, etc.) [36,37,38] and medicinal herbs (Hypericum and Cannabis) [39,40]. Genetic diversity/similarity statistics as well as inbreeding coefficients and differentiation statistics are useful not only for characterizing populations and preserving germplasm resources but also for breeding or protecting plant varieties and food derivatives.
In addition to conventional, well-established and largely studied crop plants, we also focused our attention on neglected, unknown or uncommon (nonfood and nonfeed) species, including P. raimondii Harms. It is a fascinating plant species whose populations live in a rare and unique ecosystem in the Andes, between 3.200 and 4.400 m of altitude, in the Puna environment, where only rare, relict Polylepis ssp. and BuddlIeja ssp. woods have escaped felling over the course of a thousand years. Individual plants are exceptionally large, and the species is known as the largest of the Bromeliaceae family (Figure 2). Genetic information on this species is scarce, and its reproductive biology is completely unexplored.
Sgorbati et al. [4] conducted pioneering research on the genetic diversity and reproductive biology of P. raimondii populations in the Peruvian Andes (Figure 3). The data provided by this work led the International Union for the Conservation of Nature (IUCN) to formulate an assessment of the risk of extinction of this species [1]. Subsequently, further studies on the plant genomics and reproductive genetics of this species have been conducted by a few research groups [5,6,7].
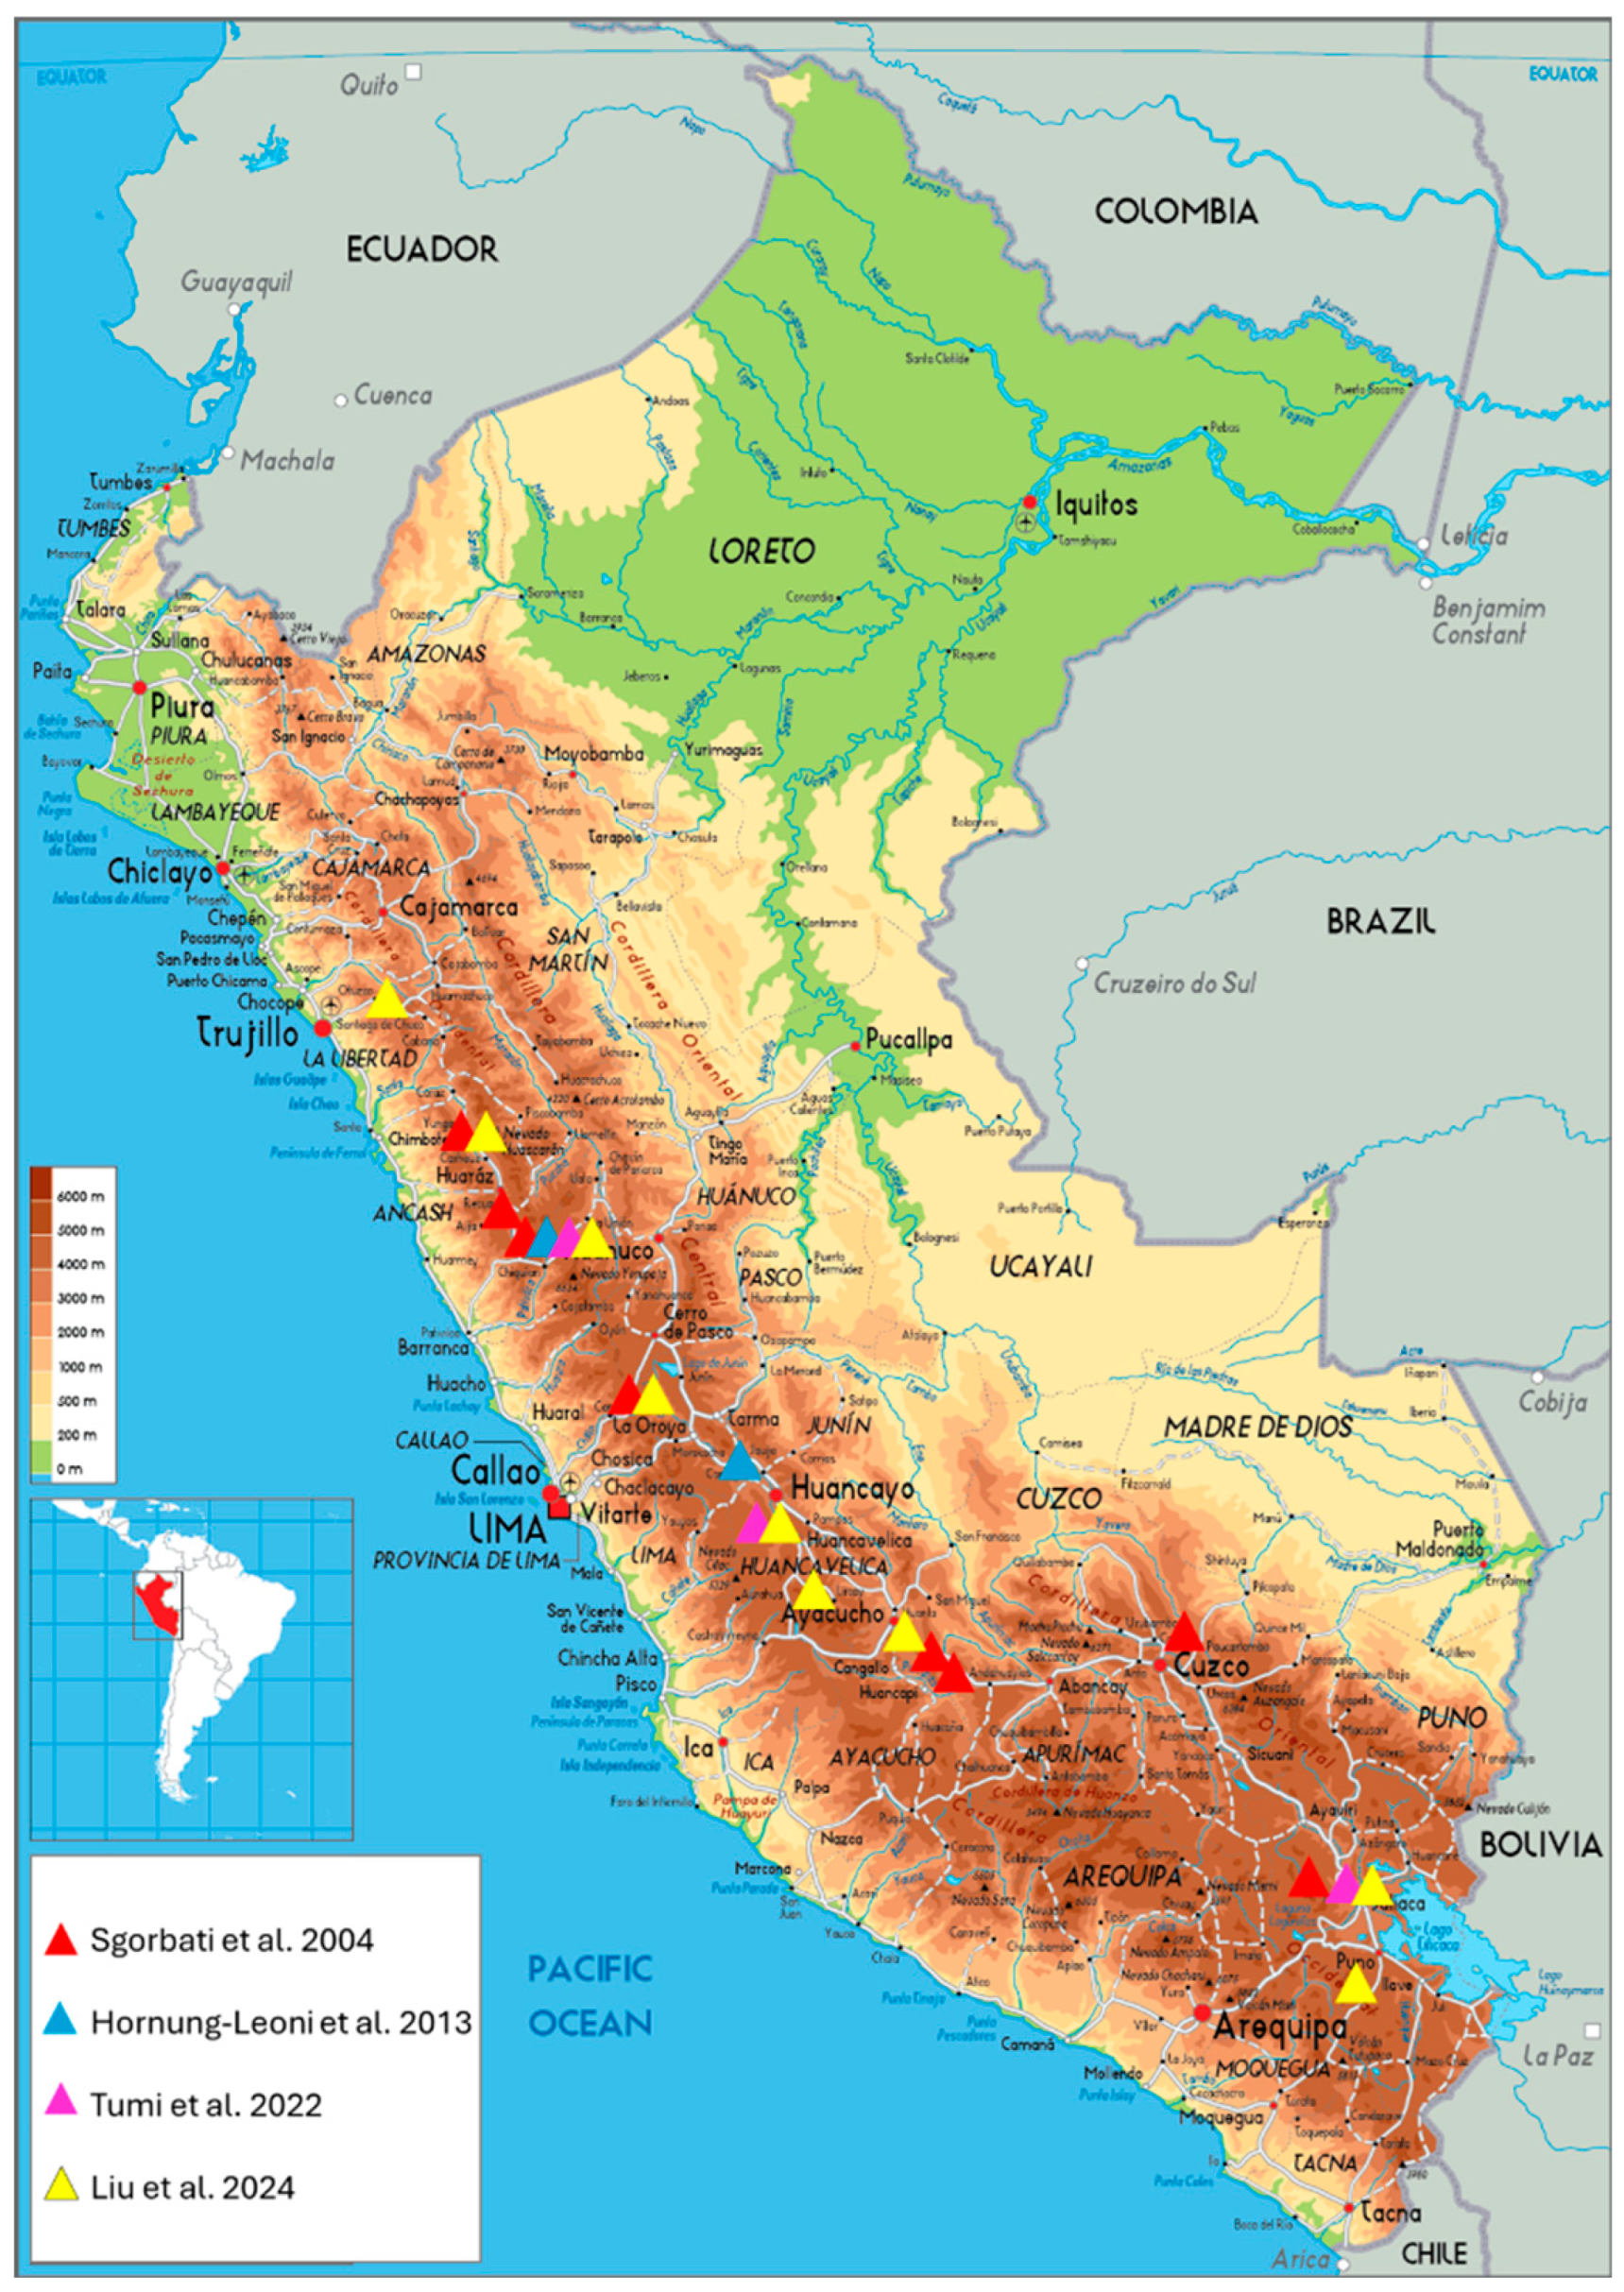
Figure 3.
Geographical distribution of P. raimondii populations sampled in the Peruvian Andes, according to the four reported studies.
Figure 3.
Geographical distribution of P. raimondii populations sampled in the Peruvian Andes, according to the four reported studies.
Basic information on the P. raimondii populations sampled and analysed thus far is reported in Table 2. For each of the populations investigated by Sgorbati et al. [4], Hornung-Leoni et al. [5], Tumi et al. [6], and Liu et al. [7], the information included the number of plants, the name of the location and the geographic location.
Overall, data from molecular marker-based fingerprinting and whole-genome sequencing were used to understand the population genetic structure of P. raimondii and infer its reproductive system biology. In fact, the vast majority of the total genetic variation was documented between populations, with very low genetic variation found within populations (mean estimates of genetic similarity across all populations varied from approximately 96% to 99% or 100%, i.e., genetic identity).
4. Conclusions
Our paper critically reviews the population genetics of the Queen of the Andes (P. raimondii), an iconic species here considered as a case study. The comprehensive analysis of the available molecular markers and genomics data enabled a reappraisal of the genetic diversity patterns in P. raimondii and provided a solid basis for drafting and applying an adequate plan for the conservation of P. raimondii, as this outstanding giant rosette bromelia plant was already considered the endangered Queen of the Andes by Sgorbati et al. [4] two decades ago.
Here, we hypothesize that the narrow genetic base of P. raimondii populations may be due to a combination of biological and environmental factors: i) an inbreeding reproductive strategy, which leads to homozygosity and genomic uniformity; ii) strong environmental selective pressure (e.g., day‒night temperature excursion up to 30°C, long dry period, etc.), which favours only the highest-fitness individual genotypes; and iii) a long life cycle, which hampers recombination events and consequently reduces genetic diversity.
The key findings derived from the available genomics data are consistent with a number of evidences on the population genetics of P. raimondii: most of the populations of P. raimondii studied so far proved to be highly divergent, genetically inbred, and characterized by random genetic drift, absent flow of genetic material and an exceptionally high genetic load. This translates into low genetic diversity of populations, which result genetically isolated, contributing to the fragmentation of the species.Overall, these findings are critical for conservation efforts. There are populations, mostly growing in protected areas and consisting of many thousands of individuals, which appear to retain considerable fitness, given that they reproduce regularly and have a high proportion of juvenile individuals. These populations could provide genetic material, in the form of seedlings grown for a few years in nurseries, to strengthen existing populations or form new ones within the distribution area of the species, where many small populations are at risk of disappearing.
In conclusion, on the basis of the available population genetics data, P. raimondii is confirmed to be a genetically fragile, fragmented and endangered plant species, which deserves urgent conservation actions.
Author Contributions
Conceptualization, G.B. and S.S.; methodology and literature investigation, S.D.; writing—original draft preparation, G.B., S.D., and S.S.; review and editing, G.B. All authors have read and agreed to the published version of the manuscript.
Funding
This research received no external funding.
Data Availability Statement
Not Applicable.
Acknowledgments
We thank the research group of the Laboratory of Genetics and Genomics for Plant Breeding of the University of Padova for their valuable support with this project, and their participation and fruitful discussion within a workshop dedicated to Puya raimondii.
Conflicts of Interest
The authors declare no conflicts of interest.
References
- Lambe: A. Puya raimondii The IUCN Red List of Threatened Species 2009: E. T168358A6482345. Website https://www.iucnredlist.org/species/168358/6482345 [accessed 15 November 2019] 2009.
- Benzing, D.H. Bromeliaceae: Profile of an Adaptive Radiation; Cambridge University Press, 2000; ISBN 0521430313.
- Hornung-Leoni, C.T.; González-Gómez, P.L.; Troncoso, A.J. Morphology, Nectar Characteristics and Avian Pollinators in Five Andean Puya Species (Bromeliaceae). Acta Oecologica 2013, 51, 54–61. [Google Scholar] [CrossRef]
- Sgorbati, S.; Labra, M.; Grugni, E.; Barcaccia, G.; Galasso, G.; Boni, U.; Mucciarelli, M.; Citterio, S.; Iramátegui, A.B.; Gonzales, L.V. A Survey of Genetic Diversity and Reproductive Biology of Puya raimondii (Bromeliaceae), the Endangered Queen of the Andes. Plant Biol 2004, 6, 222–230. [Google Scholar] [CrossRef] [PubMed]
- Hornung-Leoni, C.T.; Sosa, V.; Simpson, J.; Gil, K. Genetic Variation in the Emblematic Puya raimondii (Bromeliaceae) from Huascarán National Park, Peru. Crop Breeding and Applied Biotechnology 2013, 13, 67–74. [Google Scholar] [CrossRef]
- Tumi, L.; Ge, X.J.; Prado, G.E.; Cosacov, A.; García, V.H.; Arakaki, M.; Suni, M.L. Genetic Diversity and Genetic Structure of Puya raimondii (Bromeliaceae) for Its Conservation in the Peruvian Andes. Rev Peru Biol 2022, 29. [Google Scholar] [CrossRef]
- Liu, L.; James, J.; Zhang, Y.; Wang, Z.; Arakaki, M.; Vadillo, G.; Zhou, Q.; Lascoux, M.; Ge, X. The ‘Queen of the Andes’(Puya raimondii) Is Genetically Fragile and Fragmented: A Consequence of Long Generation Time and Semelparity? New Phytologist 2024. [CrossRef] [PubMed]
- Nei, M.; Li, W.-H. Mathematical Model for Studying Genetic Variation in Terms of Restriction Endonucleases. Proceedings of the National Academy of Sciences 1979, 76, 5269–5273. [Google Scholar] [CrossRef] [PubMed]
- Tumi, L.; Zhang, Y.; Wang, Z.; Suni, M.L.; Burgess, K.S.; Ge, X. Microsatellite Markers for the Endangered Puya raimondii in Peru. Appl Plant Sci 2019, 7, e11308. [Google Scholar] [CrossRef]
- Barcaccia, G. Using Molecular Markers for Characterizing and Preserving Germplasm Resources. In Molecular techniques in crop improvement (2nd edition); Springer Publisher, 2010; pp. 231–255 ISBN 9048129664.
- Ajmone Marsan, P.; Castiglioni, P.; Fusari, F.; Kuiper, M.; Motto, M. Genetic Diversity and Its Relationship to Hybrid Performance in Maize as Revealed by RFLP and AFLP Markers. Theoretical and Applied Genetics 1998, 96, 219–227. [Google Scholar] [CrossRef]
- Blas, R.; Ghislain, M.; del Rosario Herrera, M.; Baudoin, J.-P. Genetic Diversity Analysis of Wild Arracacia Species According to Morphological and Molecular Markers. Genet Resour Crop Evol 2008, 55, 625–642. [Google Scholar] [CrossRef]
- Schulman, A.H. Molecular Markers to Assess Genetic Diversity. Euphytica 2007, 158, 313–321. [Google Scholar] [CrossRef]
- Mba, C.; Tohme, J. Use of AFLP Markers in Surveys of Plant Diversity. In Methods in Enzymology; Elsevier, 2005; Vol. 395, pp. 177–201 ISBN 0076-6879.
- Porcher, E.; Lande, R. Inbreeding Depression under Mixed Outcrossing, Self-Fertilization and Sib-Mating. BMC Evol Biol 2016, 16, 1–14. [Google Scholar] [CrossRef] [PubMed]
- Duthie, A.B.; Reid, J.M. Evolution of Inbreeding Avoidance and Inbreeding Preference through Mate Choice among Interacting Relatives. Am Nat 2016, 188, 651–667. [Google Scholar] [CrossRef]
- Fortier, R.P. Queen of the Andes: The Ecology and Conservation of Puya raimondii. Frontiers in Conservation Science 2024, 5, 1349553. [Google Scholar] [CrossRef]
- Ramirez-Villegas, J.; Cuesta, F.; Devenish, C.; Peralvo, M.; Jarvis, A.; Arnillas, C.A. Using Species Distributions Models for Designing Conservation Strategies of Tropical Andean Biodiversity under Climate Change. J Nat Conserv 2014, 22, 391–404. [Google Scholar] [CrossRef]
- Salazar Castillo, J.; Caceres de Baldarrago, F.; Poma, I.; Raimondo, F.M. Diagnostico Del Estado Actual de Consevación de Puya raimondii En Arequipa–Perù. Quaderni di Botanica ambientale e applicata 2010, 21, 83–91. [Google Scholar]
- Suni, M.L.; Vadillo, G.P.; Arana, C.; Jara-Peña, E.; Salinas, L.; Ponce, M.E.; Ramsay, P.M. Post-Fire Recovery of Puya raimondii, Vegetation and Birds in the Puna of Huascarán National Park, Perú. J Mt Sci 2024, 21, 20–32. [Google Scholar] [CrossRef]
- Myers, N.; Mittermeier, R.A.; Mittermeier, C.G.; Da Fonseca, G.A.B.; Kent, J. Biodiversity Hotspots for Conservation Priorities. Nature 2000, 403, 853–858. [Google Scholar] [CrossRef] [PubMed]
- Anderson, E.P.; Marengo, J.; Villalba, R.; Halloy, S.; Young, B.; Cordero, D.; Gast, F.; Jaimes, E.; Ruiz, D.; Herzog, S.K. Consequences of Climate Change for Ecosystems and Ecosystem Services in the Tropical Andes. Climate change and biodiversity in the tropical Andes 2011, 1, 1–18. [Google Scholar]
- Barcaccia, G.; Mazzucato, A.; Albertini, E.; Zenoni, S.; Baldoni, L.; Mousavi, S.; Mendes, M.A.; Coimbra, S.; Granell, A.; Pupilli, F. Genetics and Genomics of Plant Reproduction for Crop Breeding, Volume II. Front Plant Sci 2023, 14, 1145208. [Google Scholar] [CrossRef]
- Barcaccia, G. Molecular Markers for Characterizing and Conserving Crop Plant Germplasm. Molecular Techniques in Crop Improvement: 2nd Edition 2009, 231–254.
- Nei, M. The Theory and Estimation of Genetic Distance. 1973.
- Wright, S. The Interpretation of Population Structure by F-Statistics with Special Regard to Systems of Mating. Evolution (N Y) 1965, 395–420.
- Palumbo, F.; Galla, G.; Martínez-Bello, L.; Barcaccia, G. Venetian Local Corn (Zea mays L.) Germplasm: Disclosing the Genetic Anatomy of Old Landraces Suited for Typical Cornmeal Mush Production. Diversity (Basel) 2017, 9, 32. [Google Scholar] [CrossRef]
- Palumbo, F.; Galla, G.; Barcaccia, G. Developing a Molecular Identification Assay of Old Landraces for the Genetic Authentication of Typical Agro-Food Products: The Case Study of the Barley ‘Agordino. ’ Food Technol Biotechnol 2017, 55, 29–39. [Google Scholar] [CrossRef] [PubMed]
- Porfiri, O.; Torricelli, R.; Silveri, D.D.; Papa, R.; Barcaccia, G.; Negri, V. The Triticeae Genetic Resources of Central Italy: Collection, Evaluation and Conservation. Hereditas 2001, 135, 187–192. [Google Scholar] [CrossRef]
- Palumbo, F.; Galla, G.; Vitulo, N.; Barcaccia, G. First Draft Genome Sequencing of Fennel (Foeniculum vulgare Mill.): Identification of Simple Sequence Repeats and Their Application in Marker-Assisted Breeding. Molecular Breeding 2018, 38, 1–17. [Google Scholar] [CrossRef]
- Patella, A.; Palumbo, F.; Galla, G.; Barcaccia, G. The Molecular Determination of Hybridity and Homozygosity Estimates in Breeding Populations of Lettuce (Lactuca sativa L.). Genes (Basel) 2019, 10, 916. [Google Scholar] [CrossRef] [PubMed]
- Patella, A.; Palumbo, F.; Ravi, S.; Stevanato, P.; Barcaccia, G. Genotyping by RAD Sequencing Analysis Assessed the Genetic Distinctiveness of Experimental Lines and Narrowed down the Genomic Region Responsible for Leaf Shape in Endive (Cichorium endivia L.). Genes (Basel) 2020, 11, 462. [Google Scholar] [CrossRef] [PubMed]
- Sica, P.; Scariolo, F.; Galvao, A.; Battaggia, D.; Nicoletto, C.; Maucieri, C.; Palumbo, F.; Franklin, D.; Cabrera, M.; Borin, M. Molecular Hallmarks, Agronomic Performances and Seed Nutraceutical Properties to Exploit Neglected Genetic Resources of Common Beans Grown by Organic Farming in Two Contrasting Environments. Front Plant Sci 2021, 12, 674985. [Google Scholar] [CrossRef]
- Palumbo, F.; Galvao, A.C.; Nicoletto, C.; Sambo, P.; Barcaccia, G. Diversity Analysis of Sweet Potato Genetic Resources Using Morphological and Qualitative Traits and Molecular Markers. Genes (Basel) 2019, 10, 840. [Google Scholar] [CrossRef]
- Palumbo, F.; Qi, P.; Pinto, V.B.; Devos, K.M.; Barcaccia, G. Construction of the First SNP-Based Linkage Map Using Genotyping-by-Sequencing and Mapping of the Male-Sterility Gene in Leaf Chicory. Front Plant Sci 2019, 10, 276. [Google Scholar] [CrossRef]
- Hmmam, I.; Mariotti, R.; Ruperti, B.; Cultrera, N.; Baldoni, L.; Barcaccia, G. Venetian Olive (Olea europaea) Germplasm: Disclosing the Genetic Identity of Locally Grown Cultivars Suited for Typical Extra Virgin Oil Productions. Genet Resour Crop Evol 2018, 65, 1733–1750. [Google Scholar] [CrossRef]
- Nicolè, S.; Barcaccia, G.; Erickson, D.L.; Kress, J.W.; Lucchin, M. The Coding Region of the UFGT Gene Is a Source of Diagnostic SNP Markers That Allow Single-Locus DNA Genotyping for the Assessment of Cultivar Identity and Ancestry in Grapevine (Vitis vinifera L.). BMC Res Notes 2013, 6, 1–13. [Google Scholar] [CrossRef]
- Draga, S.; Palumbo, F.; Miracolo Barbagiovanni, I.; Pati, F.; Barcaccia, G. Management of Genetic Erosion: The (Successful) Case Study of the Pear (Pyrus communis L.) Germplasm of the Lazio Region (Italy). Front Plant Sci 2023, 13, 1099420. [Google Scholar] [CrossRef] [PubMed]
- Borin, M.; Palumbo, F.; Vannozzi, A.; Scariolo, F.; Sacilotto, G.B.; Gazzola, M.; Barcaccia, G. Developing and Testing Molecular Markers in Cannabis sativa (Hemp) for Their Use in Variety and Dioecy Assessments. Plants 2021, 10, 2174. [Google Scholar] [CrossRef] [PubMed]
- Barcaccia, G.; Arzenton, F.; Sharbel, T.F.; Varotto, S.; Parrini, P.; Lucchin, M. Genetic Diversity and Reproductive Biology in Ecotypes of the Facultative Apomict Hypericum perforatum L. Heredity (Edinb) 2006, 96, 322–334. [Google Scholar] [CrossRef] [PubMed]
Figure 1.
Graphical illustration of the reported genetic data from the four studies in question. A) UPGMA dendrogram displaying the genetic similarity among populations of P. raimondii from the work of Sgorbati et al. [4]. Abbreviations of the populations are given in Table 2, while the three other species of Puya are included as outgroups: fer-Puya ferruginea, her-Puya herrerae, and den-Puya densiflora. B) UPGMA dendrogram of the genetic similarity estimates from Hornung-Leoni et al. [5], including the individuals from five populations reported as R1 to R5, followed by the genotype number. C) STRUCTURE analysis, assuming the number of clusters (K) = 2 of the three populations (abbreviations as in Table 2), of P. raimondii from the study of Tumi et al. [6]. D) STRUCTURE analysis of K = 9 (as the optimal solution) of the nine populations analysed by Liu et al. [7] (for population abbreviations, see Table 2) and the well-defined regional divisions between the northern, central, and southern regions in the corresponding colours: blue, green and red.
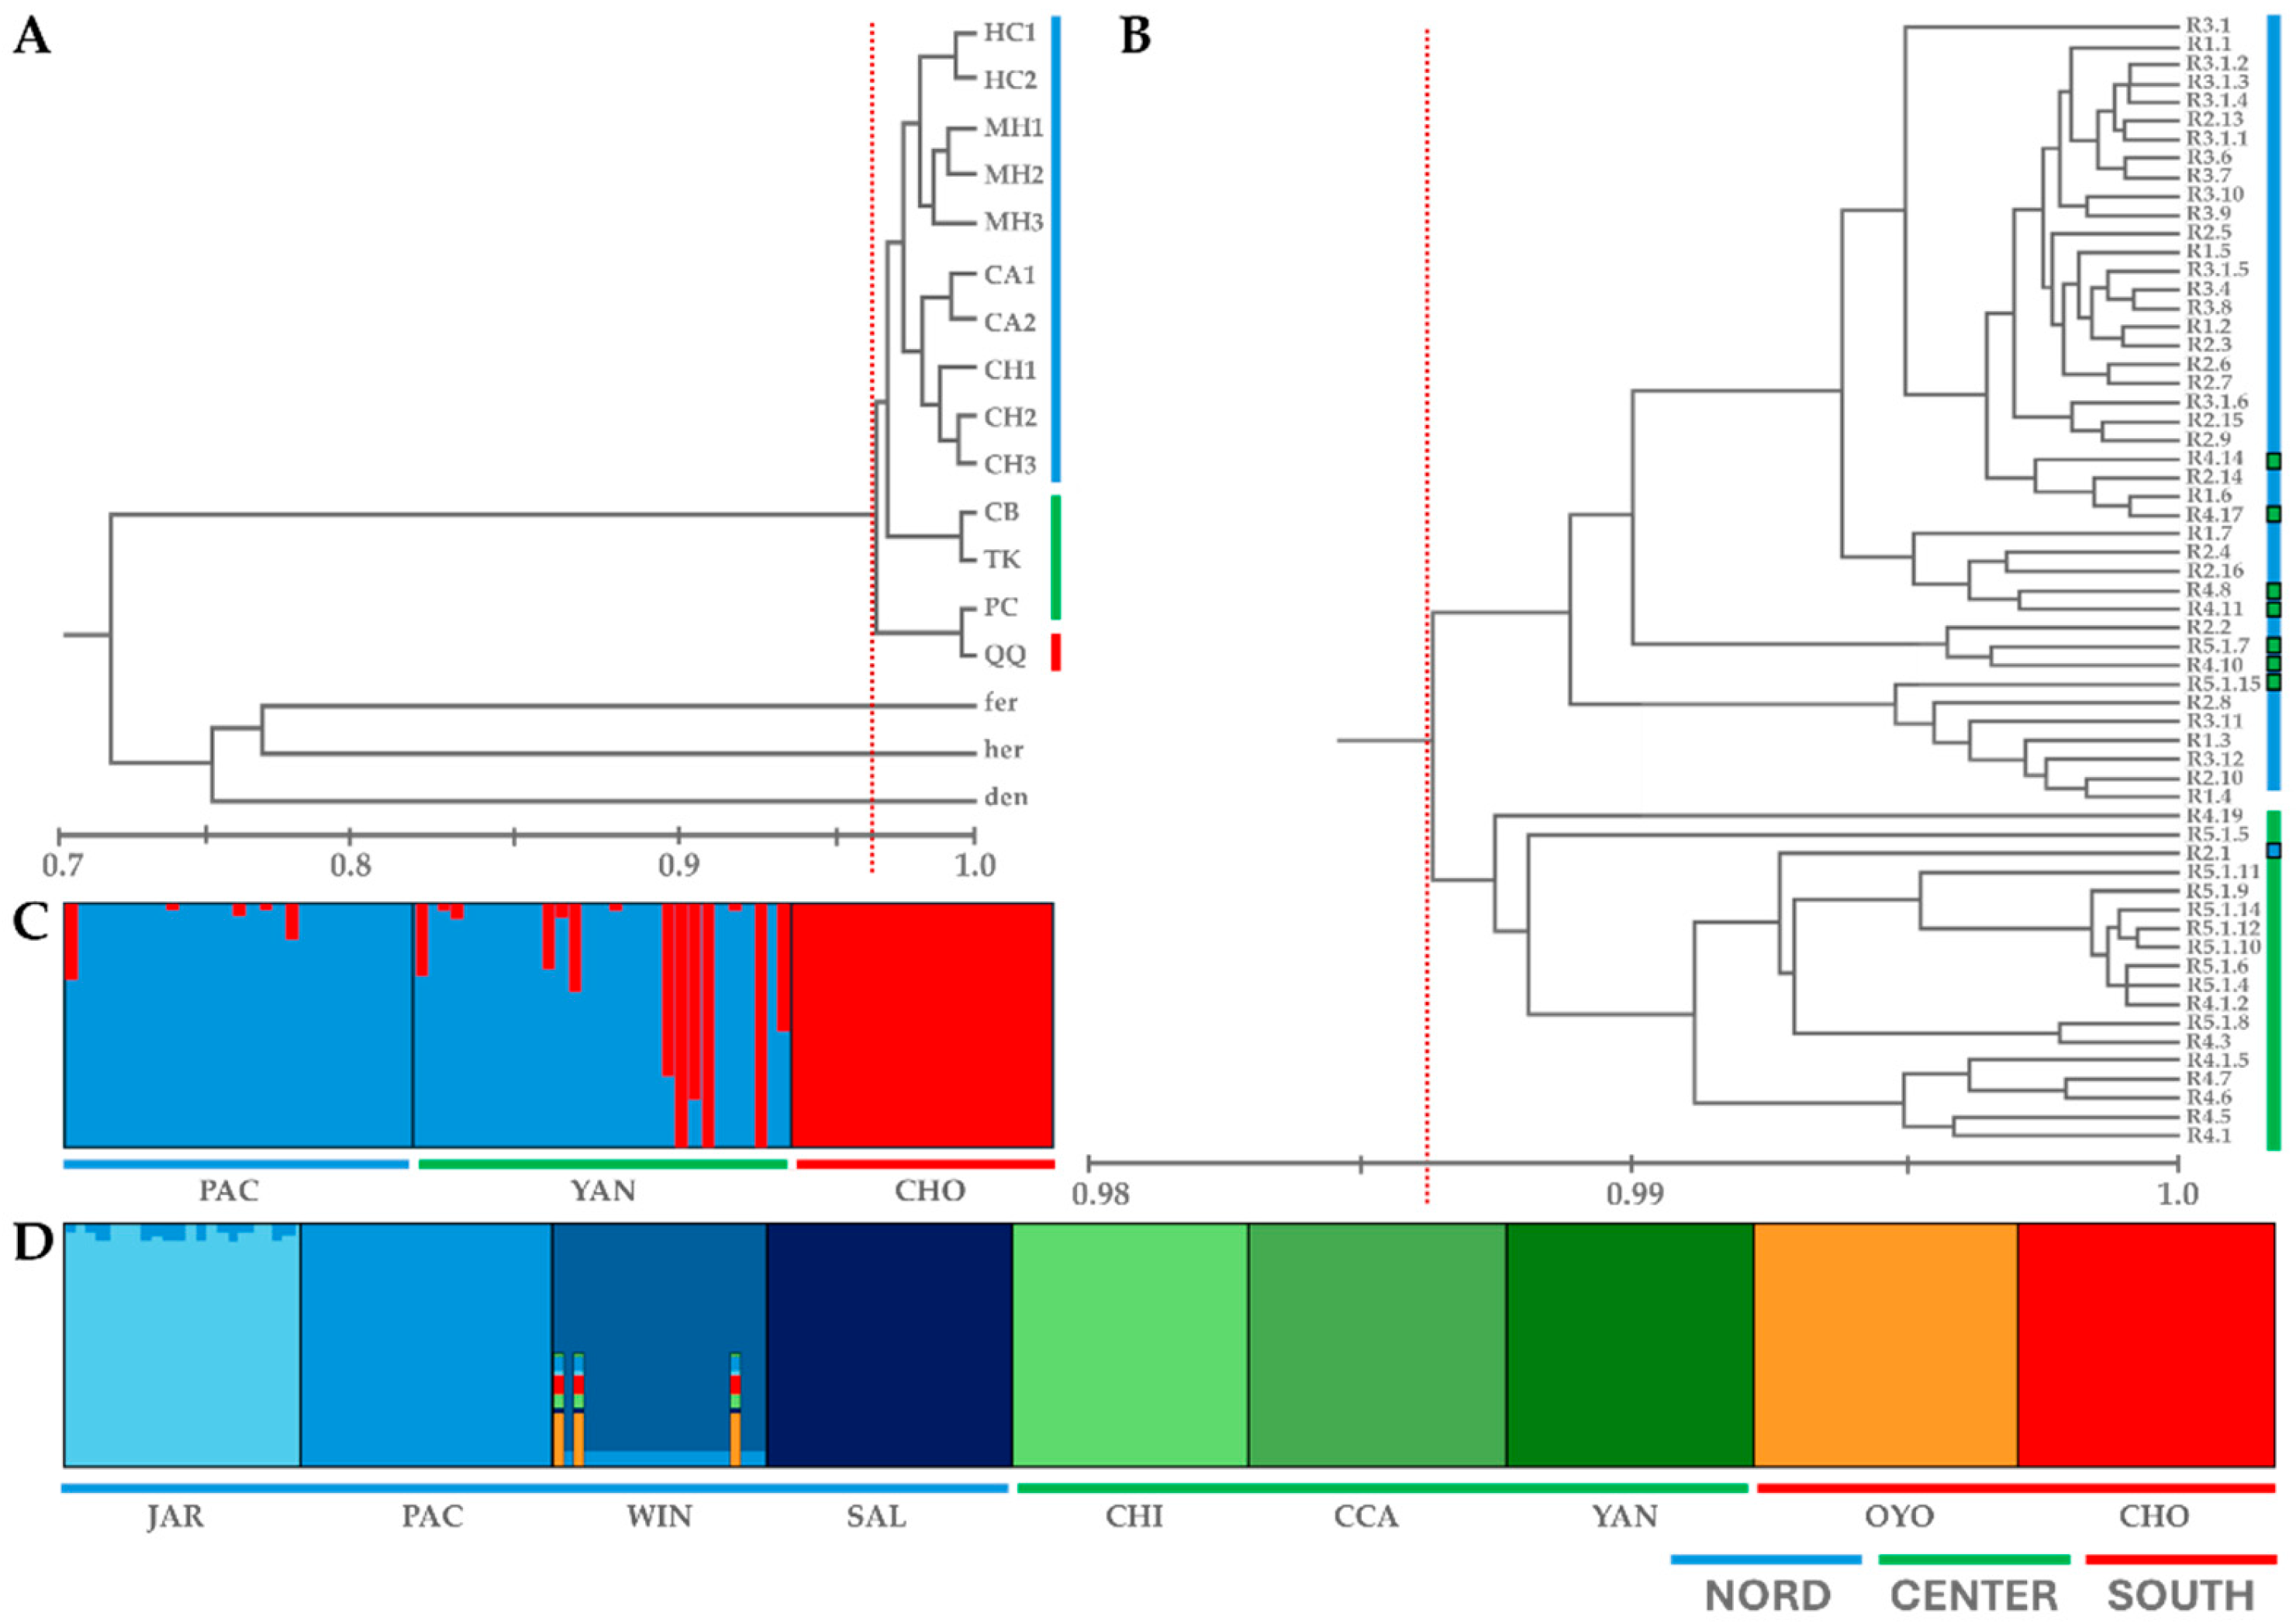
Figure 2.
Fascinating P. raimondii individuals of the Titancayocc population in Ayacucho, Peru.
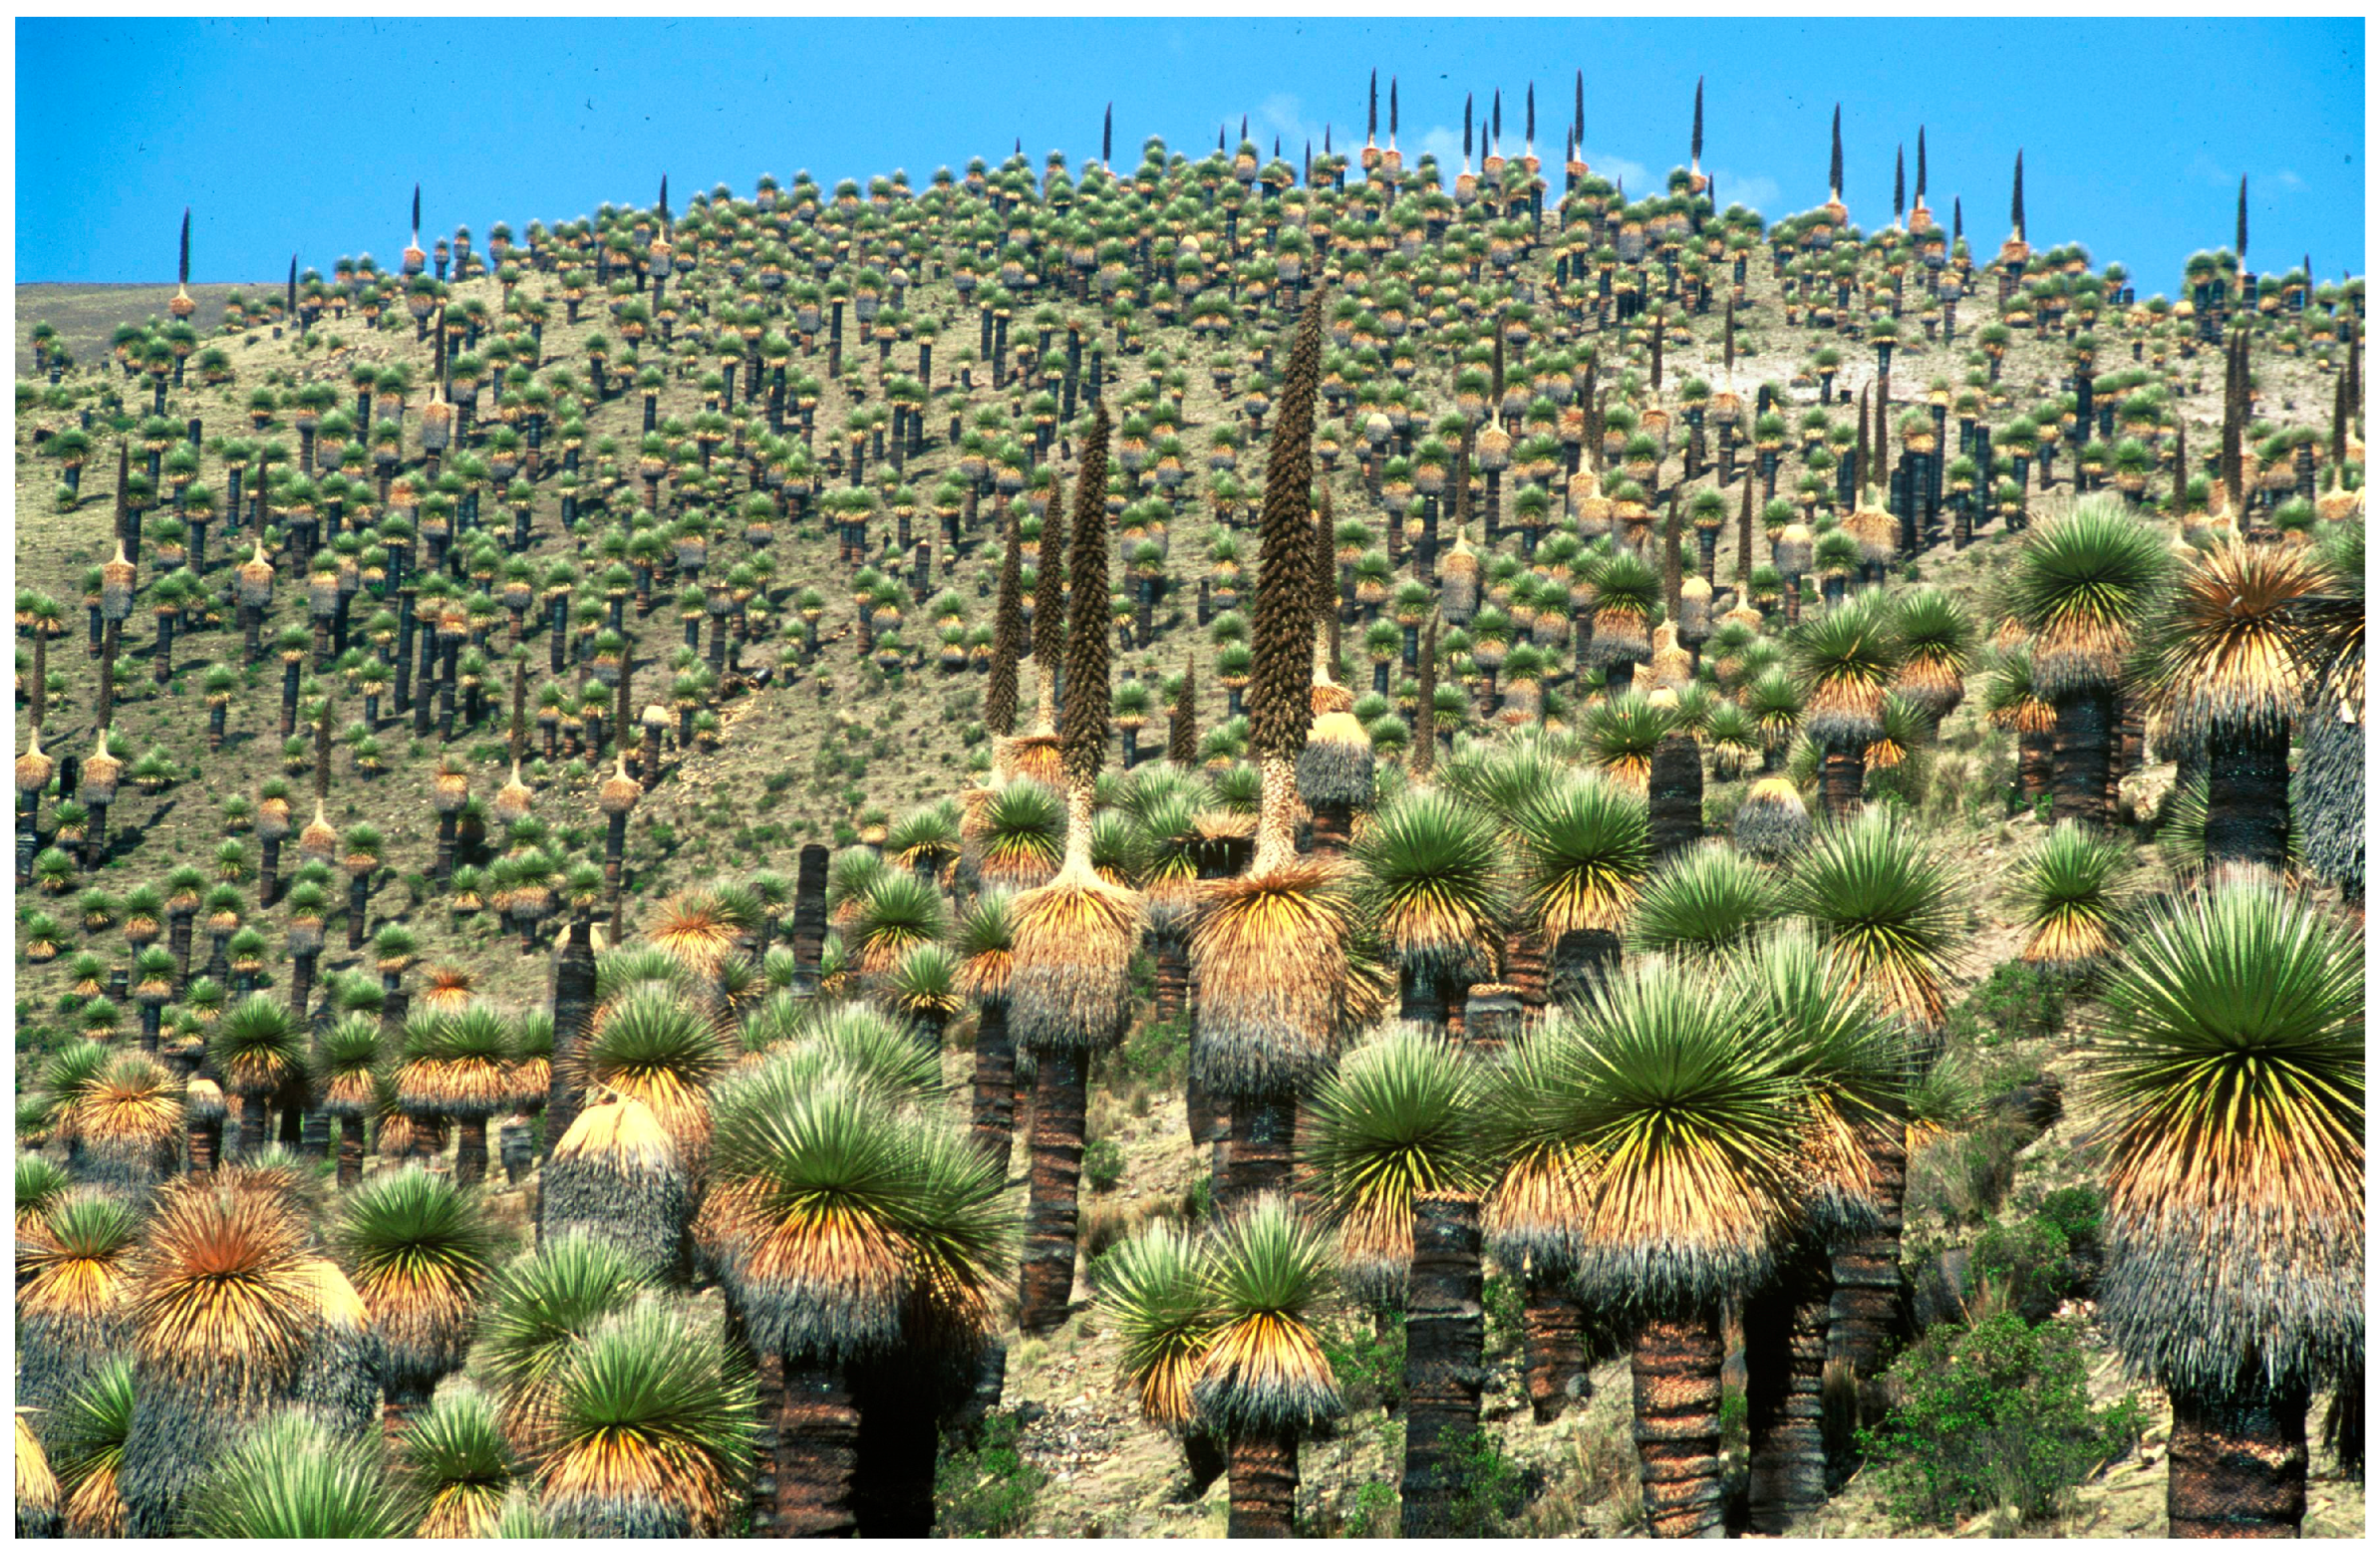

Table 1.
Genetic diversity statistics of P. raimondii reported by the four studies. The number of populations and genotypes and the type of DNA analysis used for the assessment of molecular polymorphisms at the genome level. Statistical data include total genetic diversity (Ht), expected mean heterozygosity within each population (Hs), genetic differentiation between populations (Dst), the fixation index (Fst), the inbreeding coefficient (Fis) and gene flow (Nm) estimates.
| No. | No. | DNA | Genetic diversity statistics* | ||||||
| Authors | pops | genotypes | analysis | Ht | Hs | Dst | Fis | Fst | Nm |
| Sgorbati et al. [4] | 8 | 160 | AFLP | 0.295 | 0.011 | 0.284 | n.a. | 0.961 | 0.02 |
| Hornung-Leoni et al. [5] | 5 | 60 | AFLP | 0.230 | 0.197 | 0.033 | n.a. | 0.144 | 2.97 |
| Tumi et al. [6] | 3 | 84 | SSR | 0.378 | 0.217 | 0.161 | 0.776 | 0.426 | 0.34 |
| Liu et al. [7] | 9 | 200 | WGS | 0.114 | 0.009 | 0.105 | 0.700 | 0.88‒0.92 | 0.02‒0.03 |
* Sgorbati et al. [4] and Hornung-Leoni et al. [5] calculated genetic diversity statistics of dominant AFLP molecular marker data. Tumi et al. [6] applied codominant SSR markers or microsatellite markers, whereas Liu et al. [7] used SNP marker data derived from whole-genome sequencing (WGS). Notably, for Tumi et al. [6], Ht, Dst and Nm values were added via calculations on the basis of the Hs and Fst values reported, and for Liu et al. [7], the heterozygosity estimates for the subpopulation Hs were derived from the Fst index via nucleotide diversity statistics across all of the populations (i.e., species level), which were considered equal to Ht.
Table 2.
Population sampling information on the geographic location of P. raimondii.
| Authors | Population/Individuals | Location | Geographic coordinates |
| Sgorbati et al. [4] | Huinchos (HC)/20 | Pueblo Libre, Ancash | -9.1333°, -77.8667° |
| Minas Huinac (MH)/20 | Aija, Ancash | -9.7000°, -77.6667° | |
| Carpa (CA)/20 | Recuay, Ancash | -9.8833°, -77.2833° | |
| Cerro Huaypian (CH)/20 | Huaros, Lima | -11.3833°, -76.5333° | |
| Pampa-corral (PC)/20 | Lares, Cusco | -13.1500°, -71.9833° | |
| Carabamba (CB)/20 | Chiara, Ayacucho | -13.4500°, -74.1333° | |
| Titankayocc, (TK)/20 | Vischongo, Ayacucho | -13.5667°, -73.9833° | |
| Quello Quello (QQ)/20 | Lampa, Puno | -15.2500°, -70.3500° | |
| Hornung-Leoni et al. [5] | R1/7 | N.P. Huascarán | -9.87697°, -77.27311° |
| R2/14 | N.P. Huascarán | -9.88333°, -77.25722° | |
| R3/14 | N.P. Huascarán | -9.89056°, -77.28000° | |
| R4/13 | Canchayllo | -11.83225°, -75.71535° | |
| R5/10 | Canchayllo | -11.83000°, -75.69556° | |
| Tumi et al. [6] | Yanacancha (YAN)/15 | Cachi, Chupaca, Yanacancha | -12.247°, -75.475° |
| Yanacancha (YAN)/14 | Huáscar, Chupaca, Yanacancha | -12.236°, -75.440° | |
| Pacahapaqui (PAC)/28 | Bolognesi, Aquia | -9.958°, -77.088° | |
| Lampa (CHO)/27 | Choconchaca, Lampa | -15.258°, -70.088° | |
| Liu et al. [7] | OYO/23 | Ichuna, General Sanchez Cerro, Moquegua | -16.167°, -70.5825° |
| CHO/23 | Lampa, Lampa, Puno | -15.2581°, -70.0883° | |
| CHI/22 | Chiara, Huamanga, Ayacucho | -13.2743°, -74.2054° | |
| CCA/23 | Huancavelica, Huancavelica | -12.8254°, -75.0678° | |
| YAN/23 | Cachi and Huáscar, Junin, Chupaca, Yanacancha | -12.2471°, -75.4755° | |
| JAR/22 | Huaros, Canta, Lima | -11.3913°, -76.5601° | |
| PAC/23 | Bolognesi, Aquia, Ancash | -9.958°, -77.0881° | |
| WIN/22 | Huaylas, Pueblo Libre, Ancash | -9.1059°, -77.8677° | |
| SAL/22 | Otuzco, Salpo, La Libertad | -8.0685°, -78.5744° |
Disclaimer/Publisher’s Note: The statements, opinions and data contained in all publications are solely those of the individual author(s) and contributor(s) and not of MDPI and/or the editor(s). MDPI and/or the editor(s) disclaim responsibility for any injury to people or property resulting from any ideas, methods, instructions or products referred to in the content. |
© 2024 by the authors. Licensee MDPI, Basel, Switzerland. This article is an open access article distributed under the terms and conditions of the Creative Commons Attribution (CC BY) license (http://creativecommons.org/licenses/by/4.0/).
Copyright: This open access article is published under a Creative Commons CC BY 4.0 license, which permit the free download, distribution, and reuse, provided that the author and preprint are cited in any reuse.


