
Submitted:
15 November 2024
Posted:
19 November 2024
You are already at the latest version
Abstract
The full range of effects of strong volcanic eruptions on the electrical characteristics of the atmosphere is not yet fully understood. On April 10, 2023, the largest in recent decades eruption of the Shiveluch volcano in Kamchatka occurred. At the same time, a sharp increase in electron concentration was observed in the F layer of the ionosphere above the volcano. Simultaneously, at a distance of 450 km from the volcano, an intense anomaly was observed in the vertical component of the electric field potential gradient in the surface atmosphere. At this distance, the anomaly could not have been caused by a space charge of volcanic ash. The article examines the atmospheric-electrical effects of a volcanic eruption and proposes a physical mechanism for these phenomena. The formation of strong electric field splash as result of volcano eruption was confirmed by the consecutive Shiveluch volcano eruption on 18 August 2024.
Keywords:
volcanic eruptions
; atmospheric electric field
; ionosphere
1. Introduction
The impact of strong volcanic eruptions on the electrical characteristics of the atmosphere leads to many geophysical effects. Direct electrification of volcanic ash particles can occur as a result of fractoemission, which occurs as a result of the destruction of solid materials [1,2]; triboeffect, as a result of particle friction [3,4]; release of radioactive particles and gases in erupted rocks [5], local modification of the parameters of the global electrical circuit due to changes in the conductivity of the surface layer of the atmosphere during the release of volcanic ash and aerosols into the atmosphere [6]. All these phenomena can be accompanied by powerful lightning discharges [7,8,9,10].
When studying the electrical effects of volcanic eruptions, the objects of study most often are lightning discharges in an eruptive cloud [10], as well as the movement and evolution of charged volcanic ash [4,6,9].
During severe volcanic eruptions, changes in the total electron content (TEC) of the atmosphere are observed. An increase in TEC has been observed regularly during volcanic eruptions both at high latitudes (Eyjafjallajökull volcano eruption in Iceland in April 2010) and near the equator (Agung volcano eruption in Indonesia in November 2017 and Fuego volcano in Guatemala in June 2018) [6]. During the eruption of the underwater volcano Hunga Tonga-Hunga Ha'apai on January 15, 2022, a gigantic increase in TEC was observed, followed by a strong and prolonged depletion [11]. Changes were also observed in the parameters of the global electrical circuit. The increase in thunderstorm activity over this volcano became a unique point source of excitation of the Schumann resonance. For near-surface changes in the atmospheric electric field, an estimate of the global electric circuit time constant of 7 - 8 minutes was obtained [12].
Emissions in the VLF frequency band and variations in ion concentration at the satellite orbit altitude were recorded while the DEMETER satellite passed over Mount Etna in Italy during its eruption on November 4 and 6, 2006 [13].
The eruption of Popocatepetl volcano, Mexico, resulted in magnetic field disturbances of about 0.001–0.1 nT [5]. The created acoustic wave caused the excitation of resonant oscillations in the earth-atmosphere-ionosphere waveguide and the excitation of geomagnetic pulsations [14].
Effects in the electric field, interpreted as a field from a volcanic ash cloud, were regularly recorded for volcanic eruptions in Kamchatka and the Kuril Islands [9]. The electric field was monitored using four sensors, which made it possible to obtain information about the ranges of variations in the electric field when a volcanic cloud passes over the observation station and the delay time of the anomaly in the electric field from the moment of the eruption. Field values from -5877 V/m to +4820 V/m were recorded, and the delay time in relation to the volcano eruption varied from 34 to 90 hours.
As a result of the eruption of the Shiveluch volcano in April 2023 in Kamchatka (Russia), a local positive anomaly was formed in F-layer, recorded by AIS ground based ionosonde installed at the Paratunka station. There, at the Paratunka observatory, at a distance of more than 450 km from the volcano, an anomalous surge in the electric field of the surface atmosphere was recorded: the magnitude of the vertical gradient reached ~900 V/m. The results of experimental measurements and their possible interpretation will be presented below.
2. Instruments and Measurement Methods
The Paratunka Geophysical Observatory (φ=52.9722°N, λ=158.2483°E) is located in the Northwest Pacific Ocean on the Kamchatka Peninsula, Russia. It has a whole range of geophysical and meteorological measurements. Ionospheric measurements are carried out by the AIS ionospheric station produced in Serpukhov (Russia).
The main characteristics of this station: pulse power 15 kW, frequency range 1-20 MHz, frequency step 20 kHz, scanning duration of the frequency range 1-15 MHz is 20 s, altitude resolution 3 km. The antenna radiation pattern is 60 degrees. Probing is performed once every 15 minutes.
The measurement of the vertical component of the electric field potential gradient in the atmosphere (PG) is carried out with a fluxmeter “Pole-2”, developed at the Main Geophysical Observatory named after. A.I. Voeikov (Russia). PG measurements in the “Pole-2” sensor is carried out through two channels. The first channel has a resolution of 0.16 V/m and a dynamic range of ±200 V/m. The second channel has a resolution of 1.6 V/m and a dynamic range of ±2000 V/m. When processing the measurements, the readings of both channels were taken into account. The sensor is located at a height of 3 m. This is due to the maximum height of snow cover in winter. Using the reduction factor, the data are reduced to the ground level.
The next device for measuring the electrical characteristics of the atmosphere is “Electric Conductivity-2”. It was also developed at the Main Geophysical Observatory named after. A.I. Voeikov. The electrical conductivity of the air is measured for positive and negative ions separately. The principle of its action is as follows. Air is blown through a pipe, to the walls of which a condenser is attached. Under the influence of a voltage applied between the plates of the capacitor, an electric current flows to the inner plate. The value of this current is proportional to the value of the polar electrical conductivity. Separately, the electrical conductivity of the air, caused by positive ions and separately by negative ones, is measured. Temporal resolution is 1 second.
The instruments set of the Paratunka Observatory includes a digital weather station. It measures the following parameters: air temperature, relative humidity, wind speed, wind direction, atmospheric pressure, precipitation level, solar radiation intensity, solar energy flux density. Measurement interval is 10 min.
3. Registered Effects
Shiveluch volcano coordinates are (φ=56.6361°N, λ=161.315°E), its height is 3283 m. It is located in the north of the Kamchatka Peninsula. On the night of April 10 - 11, 2023 local time (00:54) and at 12:54 UT on April 10, a strong explosive eruption began. Analysis of radar images from satellites dated by April 15 showed that the main eruption occurred as a result of the collapse of the lava dome of the volcano in a southern direction, forming in its place a caldera measuring 2 × 2.6 km. The collapse process was initially caused by a breach of the dome at its base and a subsequent explosion in a south-easterly direction. According to the Kamchatka Volcanic Eruption Response Team KVERT, the ash column rose to a height of 10 km above sea level. KVERT satellite data showed that a large ash cloud drifted 340 km north-northwest and 240 km west-southwest of the volcano. The active phase of the eruption of the Shiveluch volcano, according to KVERT data, lasted from April 10 to April 12, 2023 [15].
According to the Roscosmos State Corporation, the total area covered by ash as a result of the volcanic eruption amounted to 1305.7 thousand hectares Figure 1.
Ash from the volcano did not reach the Paratunka Observatory, which is more than 200 km south of the southernmost tip of the volcanic ash area.
The change in the state of the electrical parameters of the atmosphere, recorded at the Paratunka observatory, located 451 km from the volcano, is presented in Figure 2. The moment of appearance of anomalies in the ionosphere is represented by a red arrow. The electric field of the atmosphere reacted with a high positive surge (Figure 2a). In Figure 2b shows the electrical conductivity of air caused by positive ions (red line) and negative ions (blue line).
This type of signal in shape could have been generated by snowfall [17]. At this time, it was snowing and raining in the observatory area (Figure 2c). However, its intensity cannot be explained by precipitation alone. Actually, after 20:00 the intensity of precipitation increased, but the electrical parameters of the atmosphere did not change. For the appearance of such a strong signal in the electric field, additional mechanisms for modifying the atmosphere were activated after 13:15.
Measurements of the atmospheric electric field are very sensitive to meteorological phenomena. Therefore, to interpret the signal, it is necessary to use the measurement results of the weather station (Figure 3). The moment of appearance of anomalies in the ionosphere is marked with a red arrow. The wind speed at a height of 25 m at the time of the anomalies did not exceed 5 m/s (Figure 3a) and was not accompanied by any surge in intensity. The electrical characteristics of air can be affected by its humidity. In Figure 3b shows air humidity. There are no spikes in humidity at the time of a volcanic eruption. The fog effect is described in a paper where it is shown that air humidity simultaneously affects electrical conductivity caused by positive ions and negative ions. In this case, these two quantities behaved differently (Figure 2b). The anomaly manifested itself in electrical conductivity caused by negative ions.
Figure 4 shows ionograms of the vertical ground-based sounding around the time of the Shiveluch volcano eruption. The typical state of the ionosphere for this time of the day is shown in Figure 4a, time 13:00 UTC. Local time differs from UTC by +12 hours. Thus, the figure shows a night-time ionogram. 20 minutes after the volcanic eruption at 12:54 UTC, additional reflection traces appeared at an apparent height of 530 km (Figure 4b). Considering that the shape of the tracks corresponds to a normal ionogram, only with increased values of the apparent height, we have the right to assume that we are dealing with oblique propagation. The reason for this phenomenon will be discussed in the next section. At 13:30 UTC (Figure 4c), the typical ionogram was restored and additional traces disappeared.
Noteworthy is the fact that all recorded anomalies (electric field gradient, air conductivity, the appearance of anomalous reflections on the vertical sounding ionogram) were recorded 5-10 minutes after the eruption, which immediately rejects the hypothesis of the passage of an ash cloud over the Paratunka station as it is described in [6,9].
An additional argument that anomalies in geophysical fields were caused by the eruption of the Shiveluch volcano is the general calm situation in the parameters of the atmosphere during this period. In Figure 5 are shown the graphs in local time of the vertical TEC over the Shiveluch volcano (a), vertical TEC over Paratunka (b), ΔTEC for Shiveluch data (c), global equatorial geomagnetic index Dst (d), and critical frequency foF2 (e) for the period from April 6 to April 16, 2023. On the TEC and foF2 graphs, blue lines show the current TEC and foF2 values, and red lines – the median.
The similarity of the ionospheric variations at all three graphs is clearly seen There no any exceptional variations which could be associated with the volcano eruption. The negative deviation observed at all three locations – is ionosphere reaction on the small negative geomagnetic disturbance of Dst. Ionospheric disturbances happened with several hours delay in relation to the Dst negative pulse.
The next section will consider possible physical mechanisms for the generation of recorded anomalies in the atmosphere and ionosphere possibly caused by the eruption of the Shiveluch volcano.
4. Discussion
To correctly interpret our measurements, we must restate the original data:
The volcano eruption took place at the point with coordinates (φ=56.6361°N, λ=161.315°E), while the Paratunka Observatory is located at the point (φ=52.9722°N, λ=158.2483°E). We calculated the distance between geographical points in kilometers using the formula:
where φ1, λ1 are the latitude and longitude of the first point, φ2, λ2 are the latitude and longitude of the second point.
We found that the distance between these points is 451 km.
From remote sensing data (Figure 1) we can conclude that the ash plume from the volcanic eruption did not reach the Paratunka Observatory. Even more, during the time period when the ionospheric and electric field anomalies were registered the ash plum was extremely small as one can see in the Figure 6.
For the correct interpretation of the ionospheric anomaly, the exact time of the onset of the explosive eruption and electrification of the ash cloud, expressed in multiple lightning discharges within it, is of particular importance. One of the most reliable and effective indicators of this process is the registration of pulsed VLF radiation from the eruption area which is result of the lightning discharges within the eruption cloud [18]. It is shown in the Figure 6a. The second indicator is the seismic activity in the from of microseisms registered at the Badary (BRD) seismic station. We see that the number of explosive earthquakes began to increase around 12:00 UTC (Figure 6b), and the count rate of pulsed VLF radiation, according to the authors [18], sharply increased at 13:07 UTC (Figure 6a). In fact, a sharp increase in the amplitude of explosive eruptions, judging by graph 6b, took place earlier than 13:07, and we can agree with the above time of the main eruption of 12:54 UTC.
Let's try to understand the complex of electromagnetic effects recorded after the eruption of the Shiveluch volcano. The earliest reaction in time was the ionospheric reaction recorded on the ionograms of the AIS ionosonde at 13:15 UTC (Figure 4b). As can be seen from the figure, an additional trace has formed on the ionogram, having the shape of a normal ionogram with traces of reflection of an ordinary and extraordinary wave, originating approximately at the height of the first multiple reflection of the main ionogram (~530 km). The critical frequency of this trace is almost 2 MHz higher than the critical frequency of the main ionogram, which does not change for half an hour and is approximately 5.8 MHz on all three ionograms (Figure 4). We can talk about the formation of a local positive anomaly in the ionosphere located at some distance from the ionosonde. Since the anomaly is not located directly above the ionosonde, the probing and signals reflected from the positive anomaly propagate along an oblique path producing the larger time delay, and we are dealing with oblique backscatter sounding [20]. Proof of this is the increase in apparent height on the additional ionogram in Figure 4b. We also want to demonstrate the oblique backscattered ionogram from [20] to compare with our result presented in Figure 4b, see Figure 7.
As one can see the ionograms are almost identical with those presented in Figure 4b: vertical reflections are at the apparent height 250-300 km, and the oblique backscattered trace starts at the height nearly 500 km.
The schematic diagram of obtaining the obliques reflections is shown in the Figure 8. The spot of the denser plasma was formed over the Shiveluch volcano caldera at the same altitude as the vertical ionogram 250 km, but the distance from the ionosonde location in Paratunka to the ionospheric irregularity (taking into account the distance between Paratunka and Shiveluch 450 km) is 515 km. That’s why the reflection at the ionogram appears at the apparent height nearly this altitude.
Now we should understand how this anomaly could be formed over the volcano. The authors of [9] report on the measured strong electric fields (-5877 V/m and +4820 V/m) during the earlier Shiveluch volcano eruption. As it was shown in [21] the strong electric field can penetrate into the ionosphere and create the large scale positive and negative anomalies. In [21] as a reference magnitude of such field was taken 1000 V/m. The recent model calculations for the two strong Alaska earthquakes demonstrated the possibility of registered positive anomalies of the epicenters of the earthquakes where the electric field magnitude 1000 V/m was selected for calculation also. So, basing on these publications we can suppose that in the initial phase of Shiveluch volcano eruption the strong short-lasting electric field >1000 V/m was generated which induced the formation of the positive anomaly in the ionosphere over the volcano.
Simultaneously with the registration of the anomalous ionogram at 13:15 UT starts to grow the atmospheric electric field at Paratunka measured by the Pole sensor (Figure 2). It reaches its maximum 1 h15 min later and vanishes at 15:50 UT. The hypothesis of simple scavenging the negative ions by the precipitating snow does not work because after 20:00 UT (Figure 2) the precipitation intensity becomes stronger but we do not see the negative conductivity drop similar to what happened at 14:30 UT. We need something more, some additional factor which intensifies the negative ion’s scavenging by the precipitation. And in this moment we should look again at the Figure 2: what happens at 04:45 UT. We see jump increase of both positive and negative conductivities by 4 times. It may happen only under the action of some source of ionization. Only radon emanating from the earth’s crust can be proposed as a such source. For its transport to the observation point we can propose the following scenario. According to [23] carbon dioxide is the main carrier of radon in the earth’s crust. From the other side, the highest gas flux is always observed from the northern group of volcanoes: Shiveluch, Klyuchevskoy and Bezymianny [24]. It was demonstrated in [25] that increased radon emanation starts few days before the volcano eruption. The measurements were made in the vicinity of the volcanoes, but we can suppose that the crust deformation before the volcano eruption can be transferred within the whole Kamchatka peninsula, including the Paratunka region, where the carbon dioxide flux can bring the radon to the ground surface. Accepting such scenario, we can divide the process of the anomalous electric field generation in several stages:
- Crust deformation due to volcan eruption preparation
- Radon transport to the ground surface by CO2 which found new ways of migration in the earth’s crust due to crust deformation
- Air ionization leading to increase of ion’s concentration in near ground layer of atmosphere
- Atmospheric precipitation and negative ions attachment to snowflakes
- Sharp decrease of the negative conductivity due to low mobility of snowflakes in comparison with the light negative ion’s mobility
- Total decrease of near ground layer conductivity what leads to the sharp increase of the vertical gradient of electric field up to 700 V/m.
The question arises: why contrary to the cases described in [6] the positive anomaly in the ionosphere was so short-lived, less than 30 minutes, although the eruption itself lasted about 3 days? Most likely, the cause was the meteorological situation: intense snow and rain, which led to the rapid fall of volcanic ash over a large area (see Figure 1). The thickness of the layer was 8 cm over a huge area. The short duration of the effect is also confirmed by a short-term surge in the atmospheric electric field recorded at the Paratunka station (Figure 2a). All together indicates that the decrease in the conductivity of the boundary layer was short-lived, and further eruptions were emissions in the form of steam-gas clouds [18].
Meanwhile during preparation of present publication, the next eruption of Shiveluch volcano happened on 17 August 2024 which also was accompanied by the anomalies in atmospheric electric field and in the ionosphere. It worth to compare both cases to find some similarities in the atmospheric effects. Before to discuss similarities, it is necessary to say about the difference which was the weather. The 17 August eruption took place in fear-weather conditions: high atmospheric pressure, no rains, the wind speed not exceeded 6m/s. Nevertheless, the similar strong surge of electric field (EF) was registered around the time of the volcano eruption, with even larger magnitude 1200 V/m (Figure 9).
Except the intensive EF surge, we can note the very low value (less than the normal 100V/m) of EF magnitude, and even period of negative (reversed to natural direction) values between 03:30 and 04:10 UT, as well as between 07:00 and 08:00 UT. This result can be explained if we look at the polar conductivities presented in the Figure 10.
One can see that during almost the whole interval of time the positive conductivity is lower than negative one except the short negative surge of the negative conductivity at 03:20. Just during this short interval we observe the positive surge of PG. And when the difference between negative and positive conductivities exceeds value 2.5, we observe the electric field direction overturn to the negative values sometime exceeding −200 V/m.
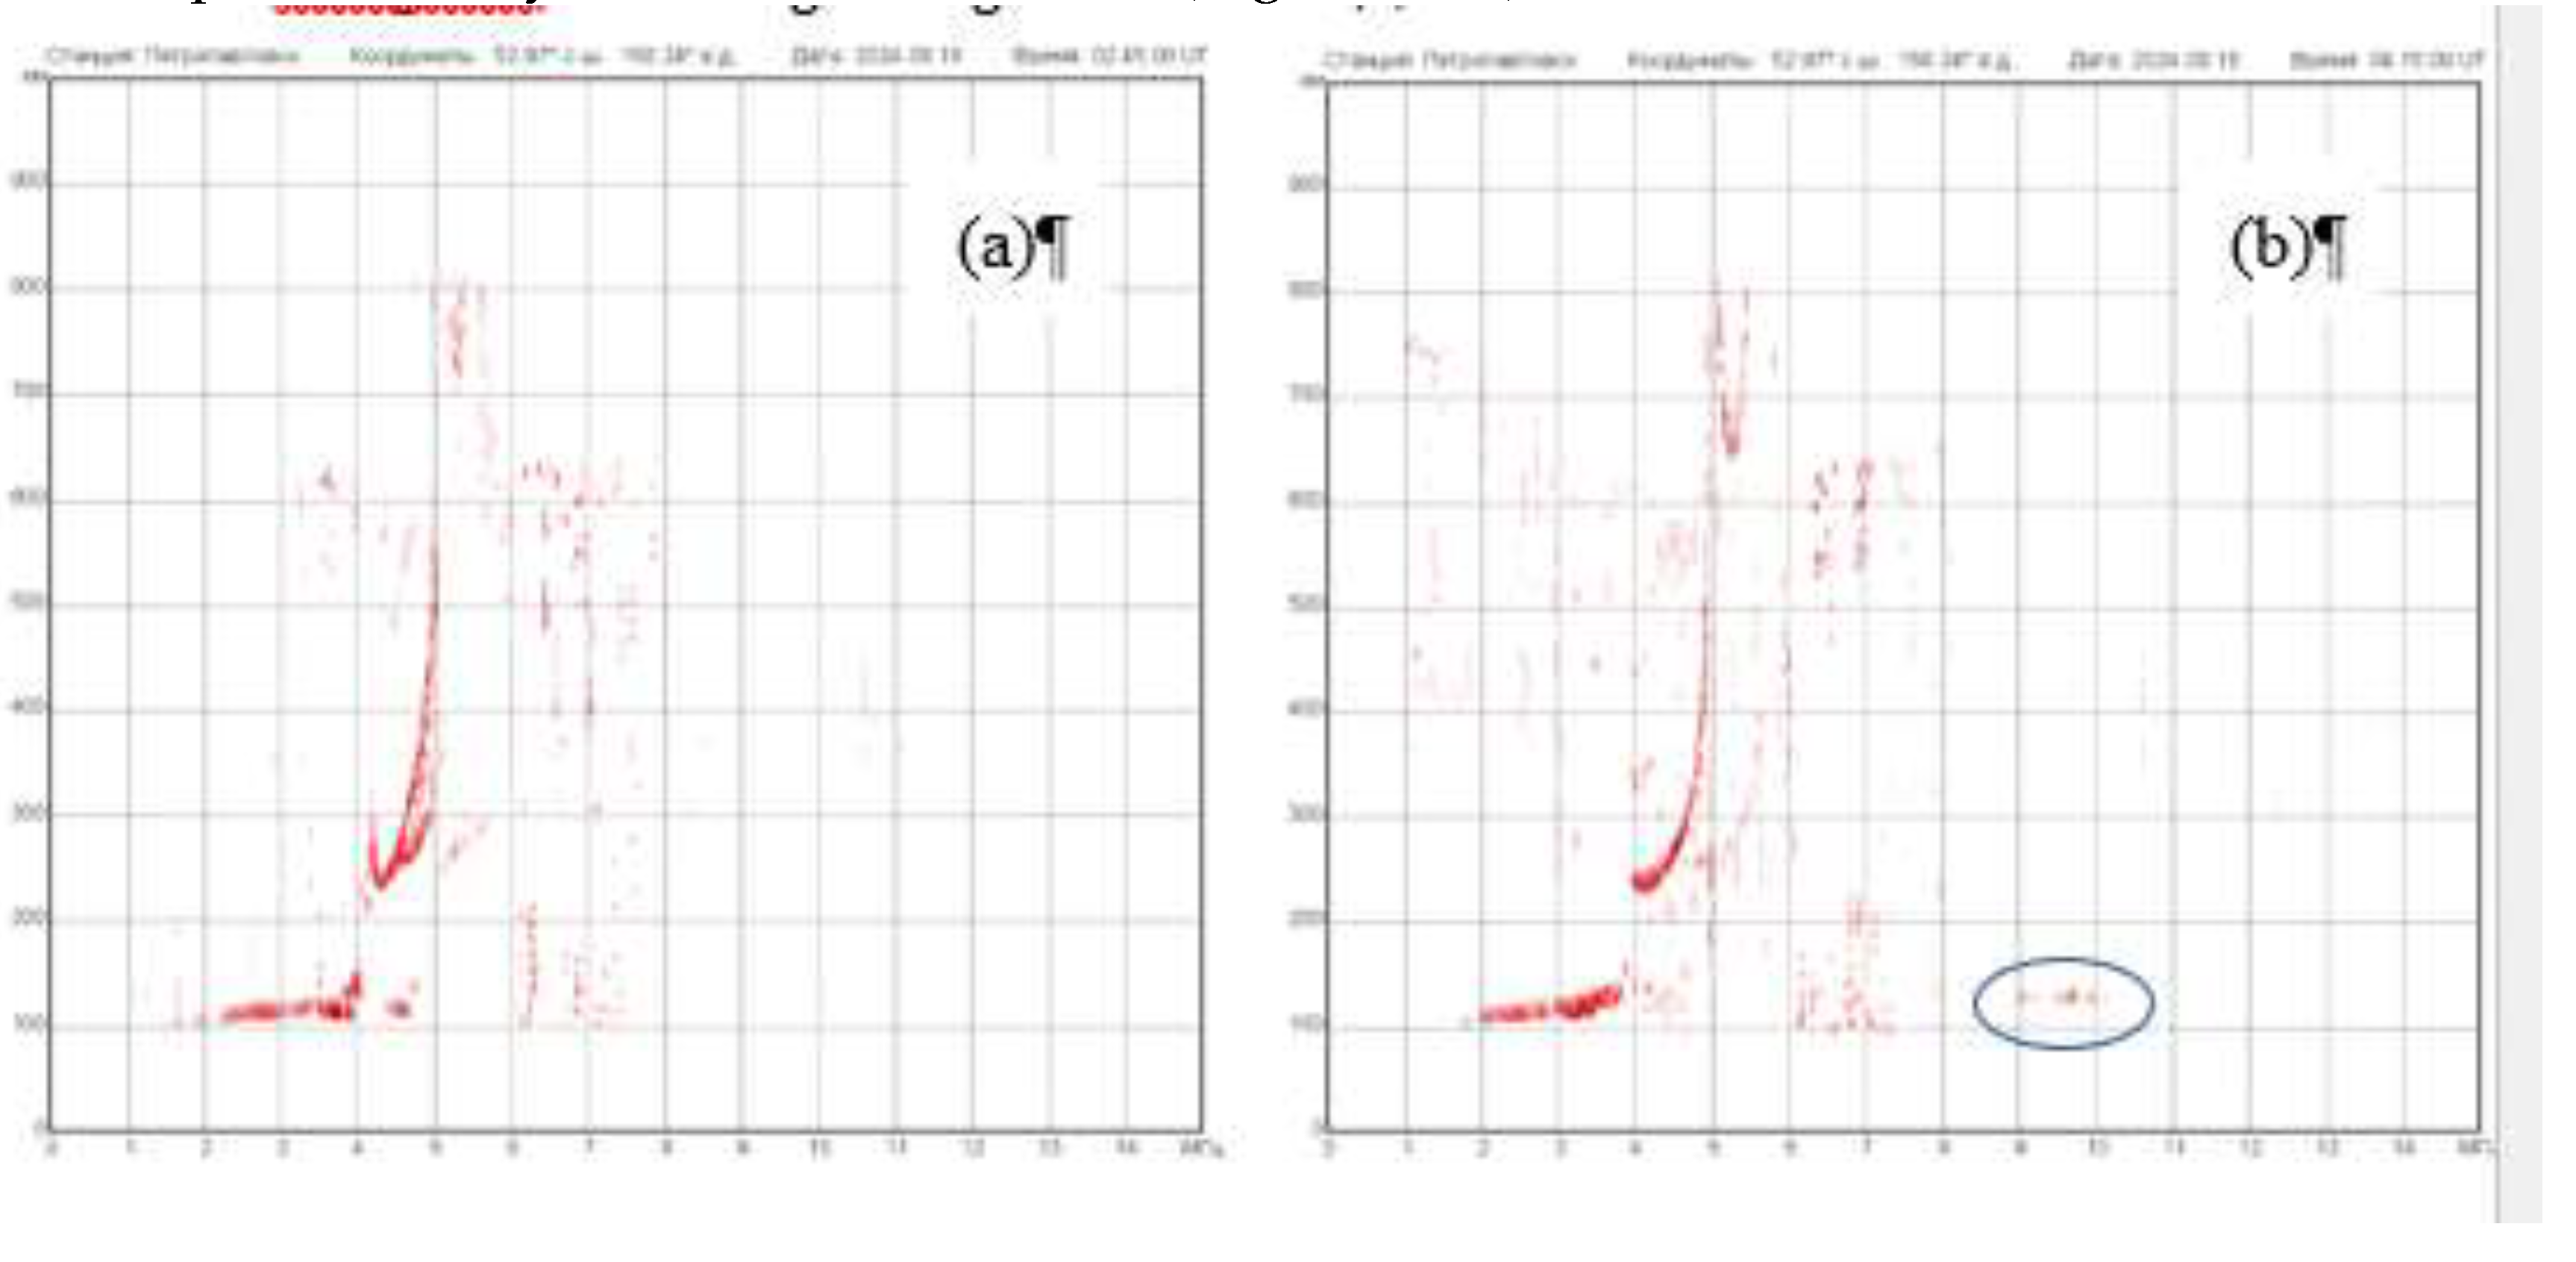
This result can be connected with the unusual reflections observed at altitude of the E-layer (near 100 km) at the ionograms registered by AIS ionosonde at Paratunka (Figure 11). Such reflections are called in the literature “anomalous reflection” [26] and look like a thick intensive layer reaching the frequency 4-5 MHz. We see also the blanketing of the F-layer be the E-layer and formation of anomalous sporadic E-layer at altitude 120 km (Figure 11 b). Both effects are described in [27].
According to [27] the anomalous sporadic E-layer at 120 km altitude is formed by metallic aerosols drifting from the ground surface under the action of electric field. It is possible only when we deal with the inversed electric field which was registered after 03:30, when the electric field directed up and is able to rise the positive metallic aerosols.
5. Conclusions
The effect of the eruption of the Shiveluch volcano manifested itself in a modification of the electrical characteristics of the atmosphere, as a result of which a positive anomaly was formed in the ionosphere, in which the critical frequency was 2 MHz higher than the critical frequency foF2 far from the vertical projection of the location of the Shiveluch volcano. The uniqueness of this event was its short duration, despite the intensity of the eruption at the very beginning and its duration for 3 days. This result differs from what is regularly observed after intense volcanic eruptions in various parts of the world [6], when ionospheric anomalies are observed for a long time. The difference between the presented results and the results of the cited work is that in that publication ionospheric anomalies were recorded using GPS GIM technology, which made it possible to obtain the spatial distribution of the anomaly in the ionosphere. Attempts to use the same technology to analyze the effects of the Shiveluch volcano eruption on April 10, 2023 did not reveal the presence of any anomalies in the ionosphere. This can be explained by two factors:
1 In the Kamchatka-Sakhalin region, there are only two stations in the list of IGS stations from which GIM maps are built: in Yuzhno-Sakhalinsk (yssk) and in Petropavlovsk-Kamchatsky (pets). Naturally, it is not possible to obtain the spatial distribution of the total electron content in a huge region based on data from two GPS receivers.
2 Another explanation is possible. GIM maps are built every 2 hours, i.e. their time resolution for observing short-term variations in the ionosphere is negligible. In this case, maps are built for an integer value of the UTC hour, and the generated anomaly did not falls within the time interval of the global map formation.
Nevertheless, the obtained result should be considered unique. For the first time, the formation of an ionospheric anomaly as a result of a volcanic eruption was recorded using an ionospheric vertical sounding station. This allows not only to estimate the electron density at the maximum of the F layer of the ionosphere, but also to obtain its vertical profile.
To summarize, we can say that the electromagnetic effect in the atmosphere and ionosphere created by strong volcanic eruptions has been confirmed. A unique consequence of meteorological manifestations in the atmosphere in the form of heavy snowfall interspersed with rain was the rapid deposition of the main portion of volcanic ash that burst out in the first minutes after the start of the eruption, which limited the time for the manifestation of electromagnetic effects and led only to a short-term surge in the atmospheric electric field and the formation of a positive anomaly in ionosphere, lasting no more than 30 minutes. A sharp increase in the atmospheric electric field is associated with a decrease in the conductivity of the atmospheric boundary layer due to the adhesion of light negative ions to volcanic ash particles that were large in size and had low mobility.
The second case considered in the paper confirms that the strong positive surge of atmospheric electric field is connected with the volcano eruption, and also with the difference of the positive and negative ions conductivities relationship. In both cases the negative ions conductivity was lower than the positive one during formation of the positive surge in atmospheric electric field. This effect needs the further investigation using the additional cases of volcano eruptions at Kamchatka peninsula.
Author Contributions
Conceptualization Sergey Smirnov and Sergey Pulinets; conducting ionospheric observations Vasily Bychkov; conducting meteorological and electrostatic observations Sergey Smirnov; theoretical substantiation of the effect Sergey Pulinets. All authors have read and agreed to the published version of the manuscript.
Funding
The work was supported by IKIR FEB RAS State Task (subject registration No. 124012300245-2; Russian Federation) and with the support of the Ministry of Science and Higher Education of the Russian Federation (theme “Monitoring”, state registration No. 122042500031-8).
Data Availability Statement
Common Use Center “North-Eastern Heliogeophysical Center” http://www.ikir.ru/en/CUC/.
Conflicts of Interest
The authors declare no conflict of interest.
References
- Mueller, S.B., Ayris, P.M., Wadsworth, F.B., Kueppers, U., Casas, A.S., Delmelle, P., Jacob, M., Taddeucci, J., Dingwell, D.B. Ash aggregation enhanced by deposition and redistribution of salt on volcanic ash surfaces in eruption plumes. Sci Rep., 2017. 7, 45762. [CrossRef]
- James, M.R., Lane, S.J., Gilbert, J.S. Volcanic plume electrification – Experimental investigation of fracture charging mechanism. J. Geophys. Res., 2000. 105, 641--649. [CrossRef]
- Mendez, Harper J., Cimarelli, C., Cigala, V., Kueppers, U., Dufek, J., 2021. Charge injection into the atmosphere by explosive volcanic eruptions through triboelectrification and fragmentation charging. Earth and Planetary Science Letters 574, 117162. [CrossRef]
- Aplin, K. L., Bennett, A.J., Harrison, R.G., Houghton, I.M.P. Chapter 6 - Electrostatics and In Situ Sampling of Volcanic Plumes, in: Volcanic Ash. Hazard Observation. Elsevier, Amsterdam, 2016. pp. 99--113. [CrossRef]
- Yutsis, V., Kotsarenko, A., Grimalsky, V., Pulinets, S. On the Radon-Related Mechanism of the Seismo- and Volcanogenic Geomagnetic Anomalies: Experiments in Tlamacas Mountain (Volcano Popocatepetl Area) and Electrode Effect Model. Atmosphere, 2023. 14, 705. [CrossRef]
- Pulinets, S.A., Davidenko, D.V., Pulinets M.S. Atmosphere-ionosphere coupling induced by volcanoes eruption and dust storms and role of GEC as the agent of geospheres interaction. Adv. Space Res., 2022. 69(12), 4319-4334. [CrossRef]
- Mather, T.A., Harrison, R.G. Electrification of volcanic plumes. Surveys in Geophicsis., 2006. 27, 387-432. [CrossRef]
- Behnke, S.A., Thomas, R.J., McNutt, S.R., David, J.S., Paul, R.K., William, R., Harald, E.E. Observations of volcanic lightning during the 2009 eruption of Redoubt Volcano. J. Volcanol. Geotherm. Res., 2013. 259, 214-234. [CrossRef]
- Firstov, P.P., Malkin, E.I., Akbashev, R.R., Druzhin, G.I., Cherneva, N.V., Holzwort, R.H., Uvarov, V.N., Stasi, I.E. Registration of atmospheric–electric effects from volcanic clouds on the Kamchatka Peninsula (Russia). Atmosphere, 2020. 11(6), 634. http://doi.org/10.3390/atmos11060634.
- Shevtsov, B.M., Firstov, P.P., Cherneva, N.V., Holzworth, R.H., Akbashev, R.R. Lightning and electrical activity during the Shiveluch volcano eruption on 16 November 2014. Nat. Hazard Earth Syst. Sci., 2016. 16, 871–874. [CrossRef]
- Astafyeva, E., Maletckii, B., Mikesell, T.D., Munaibari, E., Ravanelli, M., Coisson, P., Manta F., Rolland, L. The 15 January 2022 Hunga Tonga eruption history as inferred from ionospheric observations. Geophysical Research Letters, 2022. 49, e2022GL098827. [CrossRef]
- Bór, J., Bozóki, T., Sátori, G., Williams, E., Behnke, S.A., Rycroft, M.J., Buzás, A., Silva, H.G., Kubicki, M., Said, R., Vagasky, C., Steinbach, P., André, K., Atkinson, M. Responses of the AC/DC global electric circuit to volcanic electrical activity in the Hunga Tonga-Hunga Ha'apai eruption on 15 January 2022. Journal of Geophysical Research: Atmospheres, 2023. 128, e2022JD038238. [CrossRef]
- Tramutoli, V., Marchese, F., Falconieri, A., Filizzola, C., Genzano, N., Hattori, K., Lisi, M., Liu, J.-Y., Ouzounov, D., Parrot, M., Pergola, N., Pulinets, S. Tropospheric and Ionospheric Anomalies Induced by Volcanic and Saharan Dust Events as Part of Geosphere Interaction Phenomena. Geosciences, 2019. 9(4), 177. [CrossRef]
- Surkov, V.V., Pilipenko, V.A., Shiokawa, K. Geomagnetic effect of the atmospheric acoustic resonance excited by earthquakes and volcano eruptions. Journal of Geophysical Research: Space Physics, 2023. 128, e2023JA031872. [CrossRef]
- KVERT Information Release, April 10, 2023. KVERT, Institute of Volcanology and Seismology FEB RAS. http://www.kscnet.ru/ivs/kvert/van/index?type=2 (accessed 7 March 2024).
- GSA Geospatial analytics. https://geonovosti.terratech.ru/nature/novoe-izverzhenie-vulkana-shiveluch/#article2 (accessed 7 March 2024).
- Smirnov, S. Atmospheric Electricity Measurements in the Pacific Northwest, Russia. Appl. Sci., 2023. 13, 2571. [CrossRef]
- Malkin, E.I., Cherneva, V.I., Makhlai, D.O., Cherneva, N.V., Akbashev, R.R., Sannikov, D.V. Remote methods for observations of Shiveluch and Bezymianny volcano eruptions. Vestnik KRAUNC. Fiz.-mat. nauki., 2023. 43(2), 141--165. EDN:WWRQHZ. [CrossRef]
- https://cimss.ssec.wisc.edu/satellite-blog/archives/51654.
- Liu, T.; Yang, G.; Zhao, Z.; Jiang, C.; Hu, Y. Application of Beamforming Technology in Ionospheric Oblique Backscatter Sounding with a Miniaturized L-Array. Remote Sensing.2020.12(3), 499. doi:10.3390/rs12030499.
- Pulinets, S.A.; Khegaï ,V.V.; Boyarchuk, K.A.; Lomonosov A.M. The atmospheric electric field as a source of variability in the ionosphere, Physics-Uspekhi. 1998. 41, 515-522.
- Hegai, V.; Zeren, Z.; Pulinets, S. Seismogenic Field in the Ionosphere before Two Powerful Earthquakes: Possible Magnitude and Observed Ionospheric Effects (Case Study). Atmosphere 2023, 14, 819. [CrossRef]
- Khilyuk, L.F.; Chillingar, G.V.; Robertson, J.O.Jr.; Endres, B. Gas migration. Events preceding earthquakes (Houston, Texas: Gulf Publishing Company), 2000. 390 p.
- Taran, Y.A. Geochemistry of volcanic and hydrothermal fluids and volatile budget of the Kamchatka-Kuril subduction zone. Geochim. Cosmochim. Acta. 2009. 73, 1067–1094.
- Pulinets, S.; Budnikov, P. Atmosphere Critical Processes Sensing with ACP. Atmosphere. 2022. 13, 1920. [CrossRef]
- Givishvili, G.V.; Leshchenko, L.N. Anomalous reflections from the ionosphere, Geomagn. Aeron. 2013. 53, 635-641. DOI: 10.1134/S001679321305006X.
- Pulinets, S.A.; Boyarchuk, K.A.; Hegai, V.V.; Kim, V.P.; Lomonosov A.M. Quasielectrostatic Model of Atmosphere-Thermosphere-Ionosphere Coupling. Adv. Space Res. 2000, 26, 1209-1218 . [CrossRef]
Figure 1.
The boundaries of the distribution of ash as a result of the eruption of Shiveluch Volcano on April 10, 2023 are marked in purple [16].
Figure 1.
The boundaries of the distribution of ash as a result of the eruption of Shiveluch Volcano on April 10, 2023 are marked in purple [16].
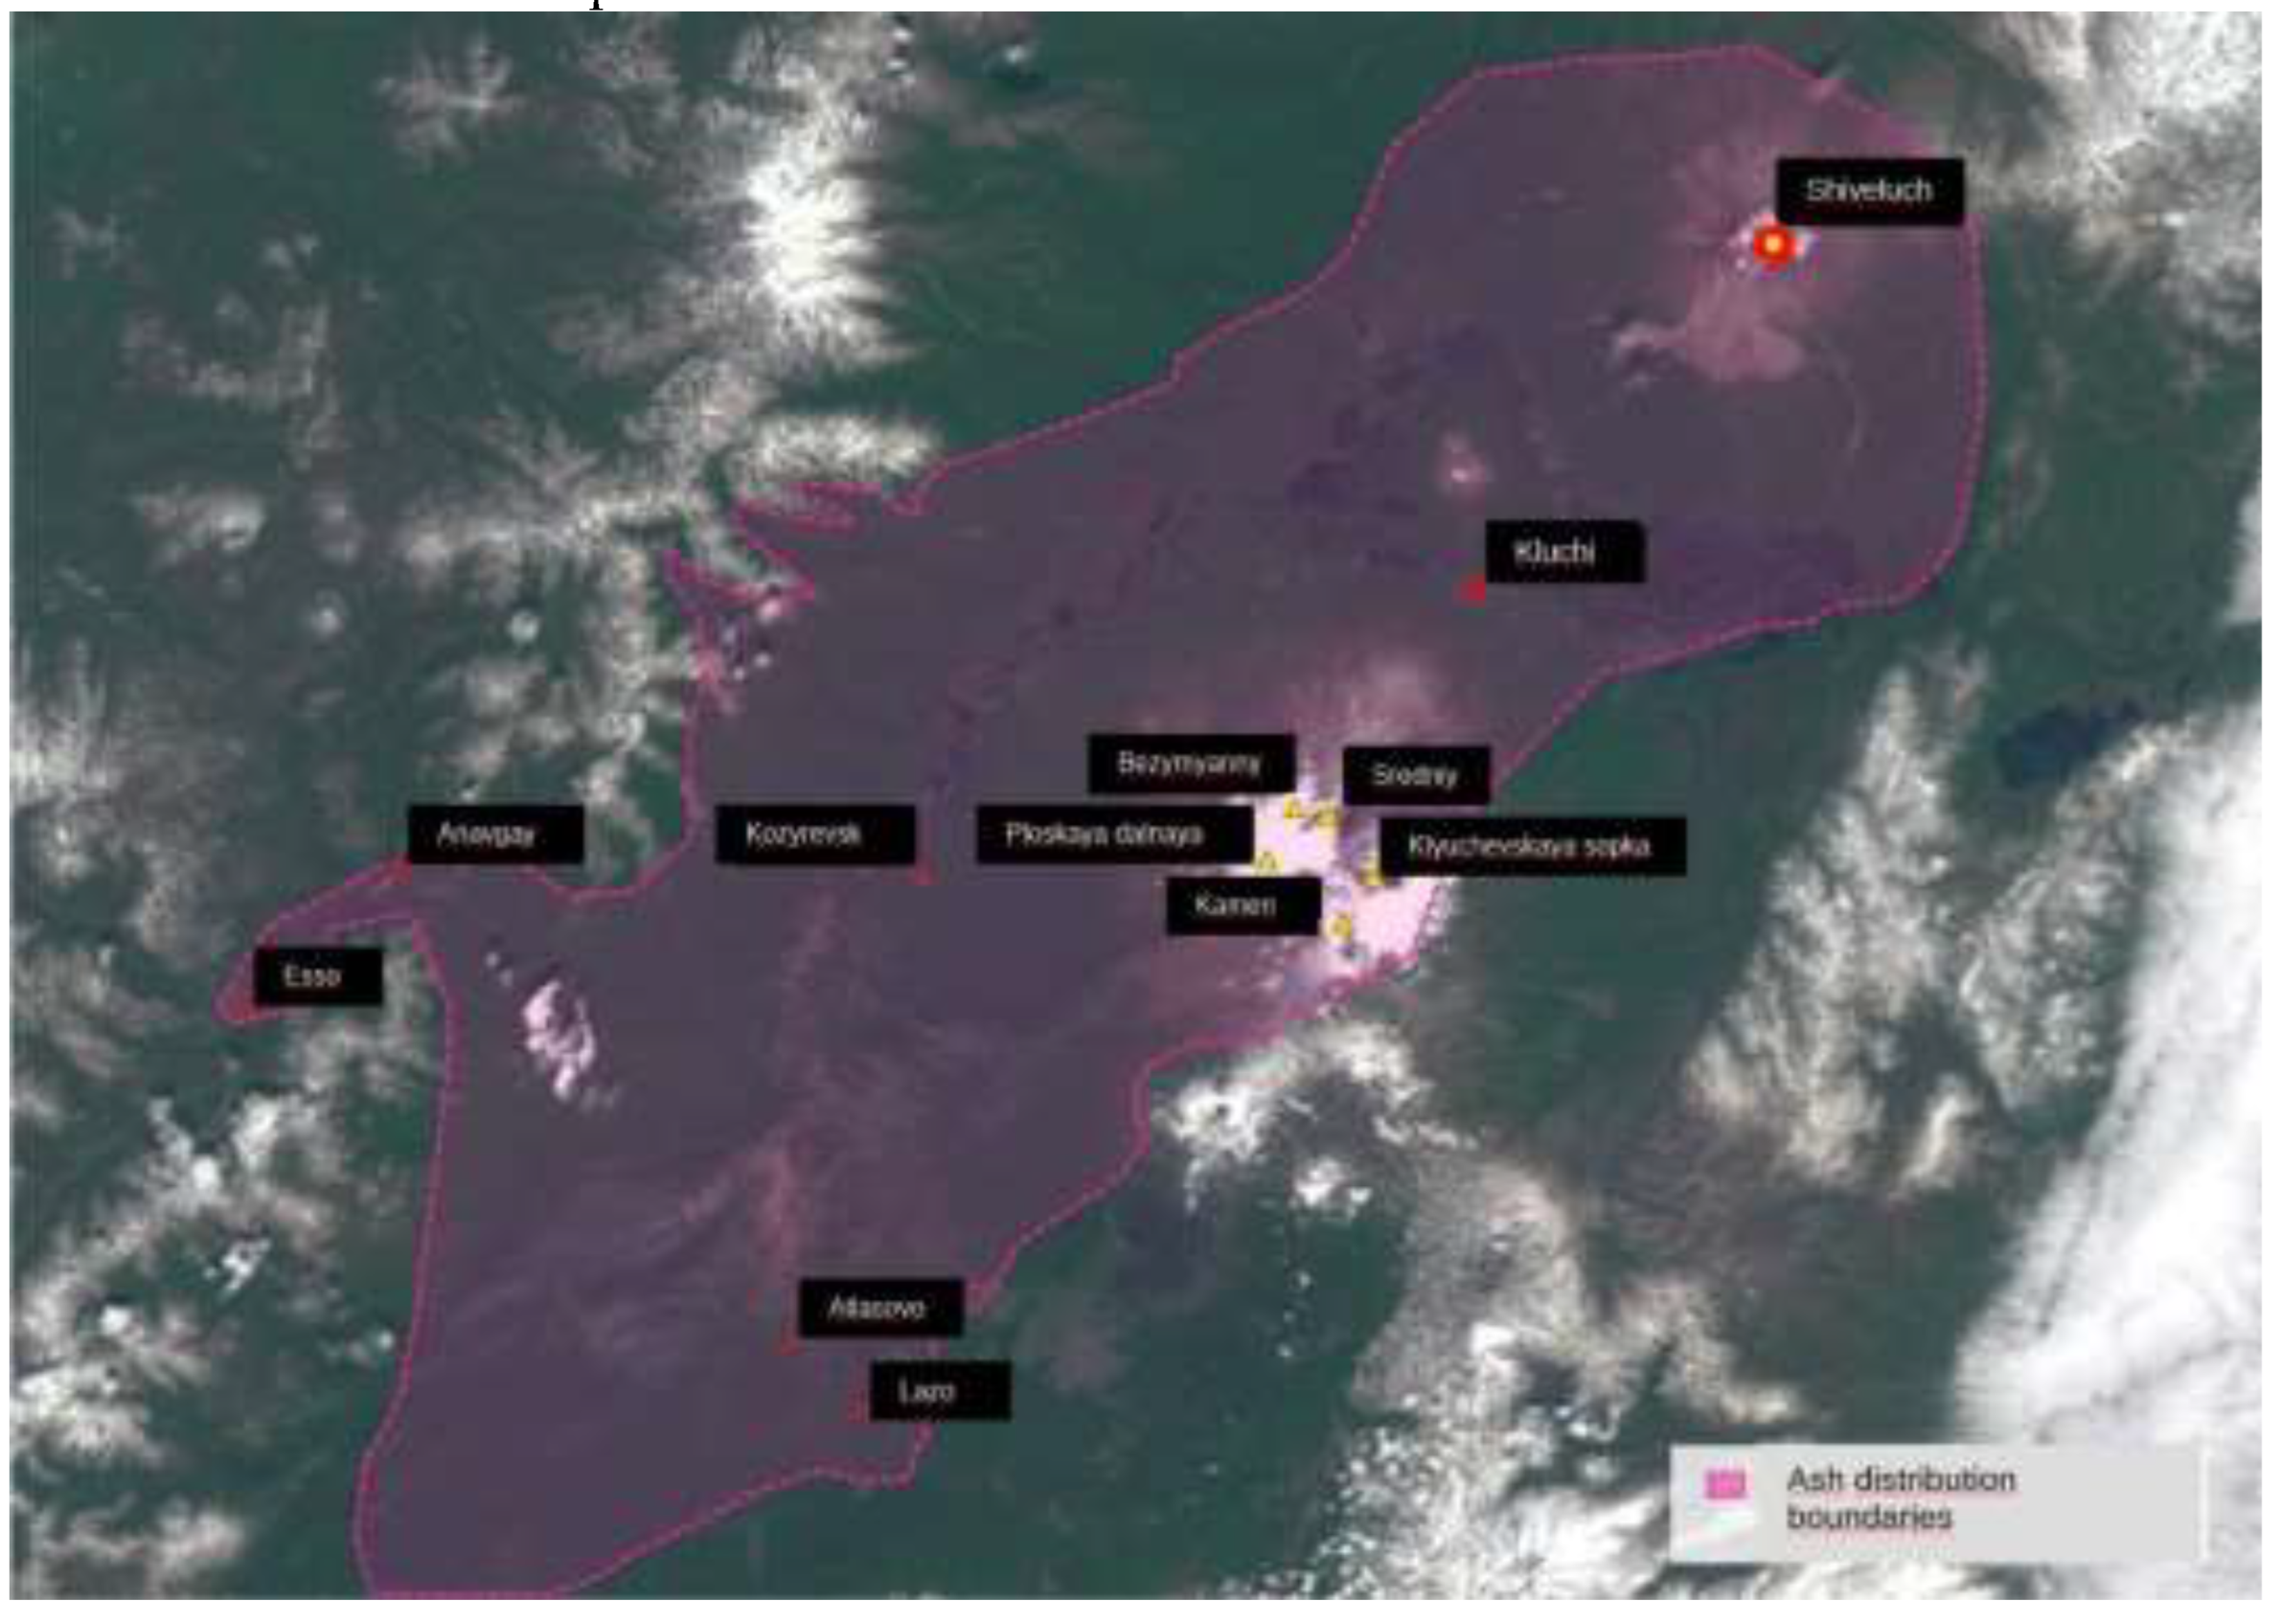
Figure 2.
Electrical and meteorological parameters of the atmosphere at the Paratunka observatory during the eruption of the Shiveluch volcano (moment 13:15 - red arrow) (a) potential gradient; (b) air conductivity caused by positive ions (red line) and negative ions (blue line); (c) precipitation.
Figure 2.
Electrical and meteorological parameters of the atmosphere at the Paratunka observatory during the eruption of the Shiveluch volcano (moment 13:15 - red arrow) (a) potential gradient; (b) air conductivity caused by positive ions (red line) and negative ions (blue line); (c) precipitation.
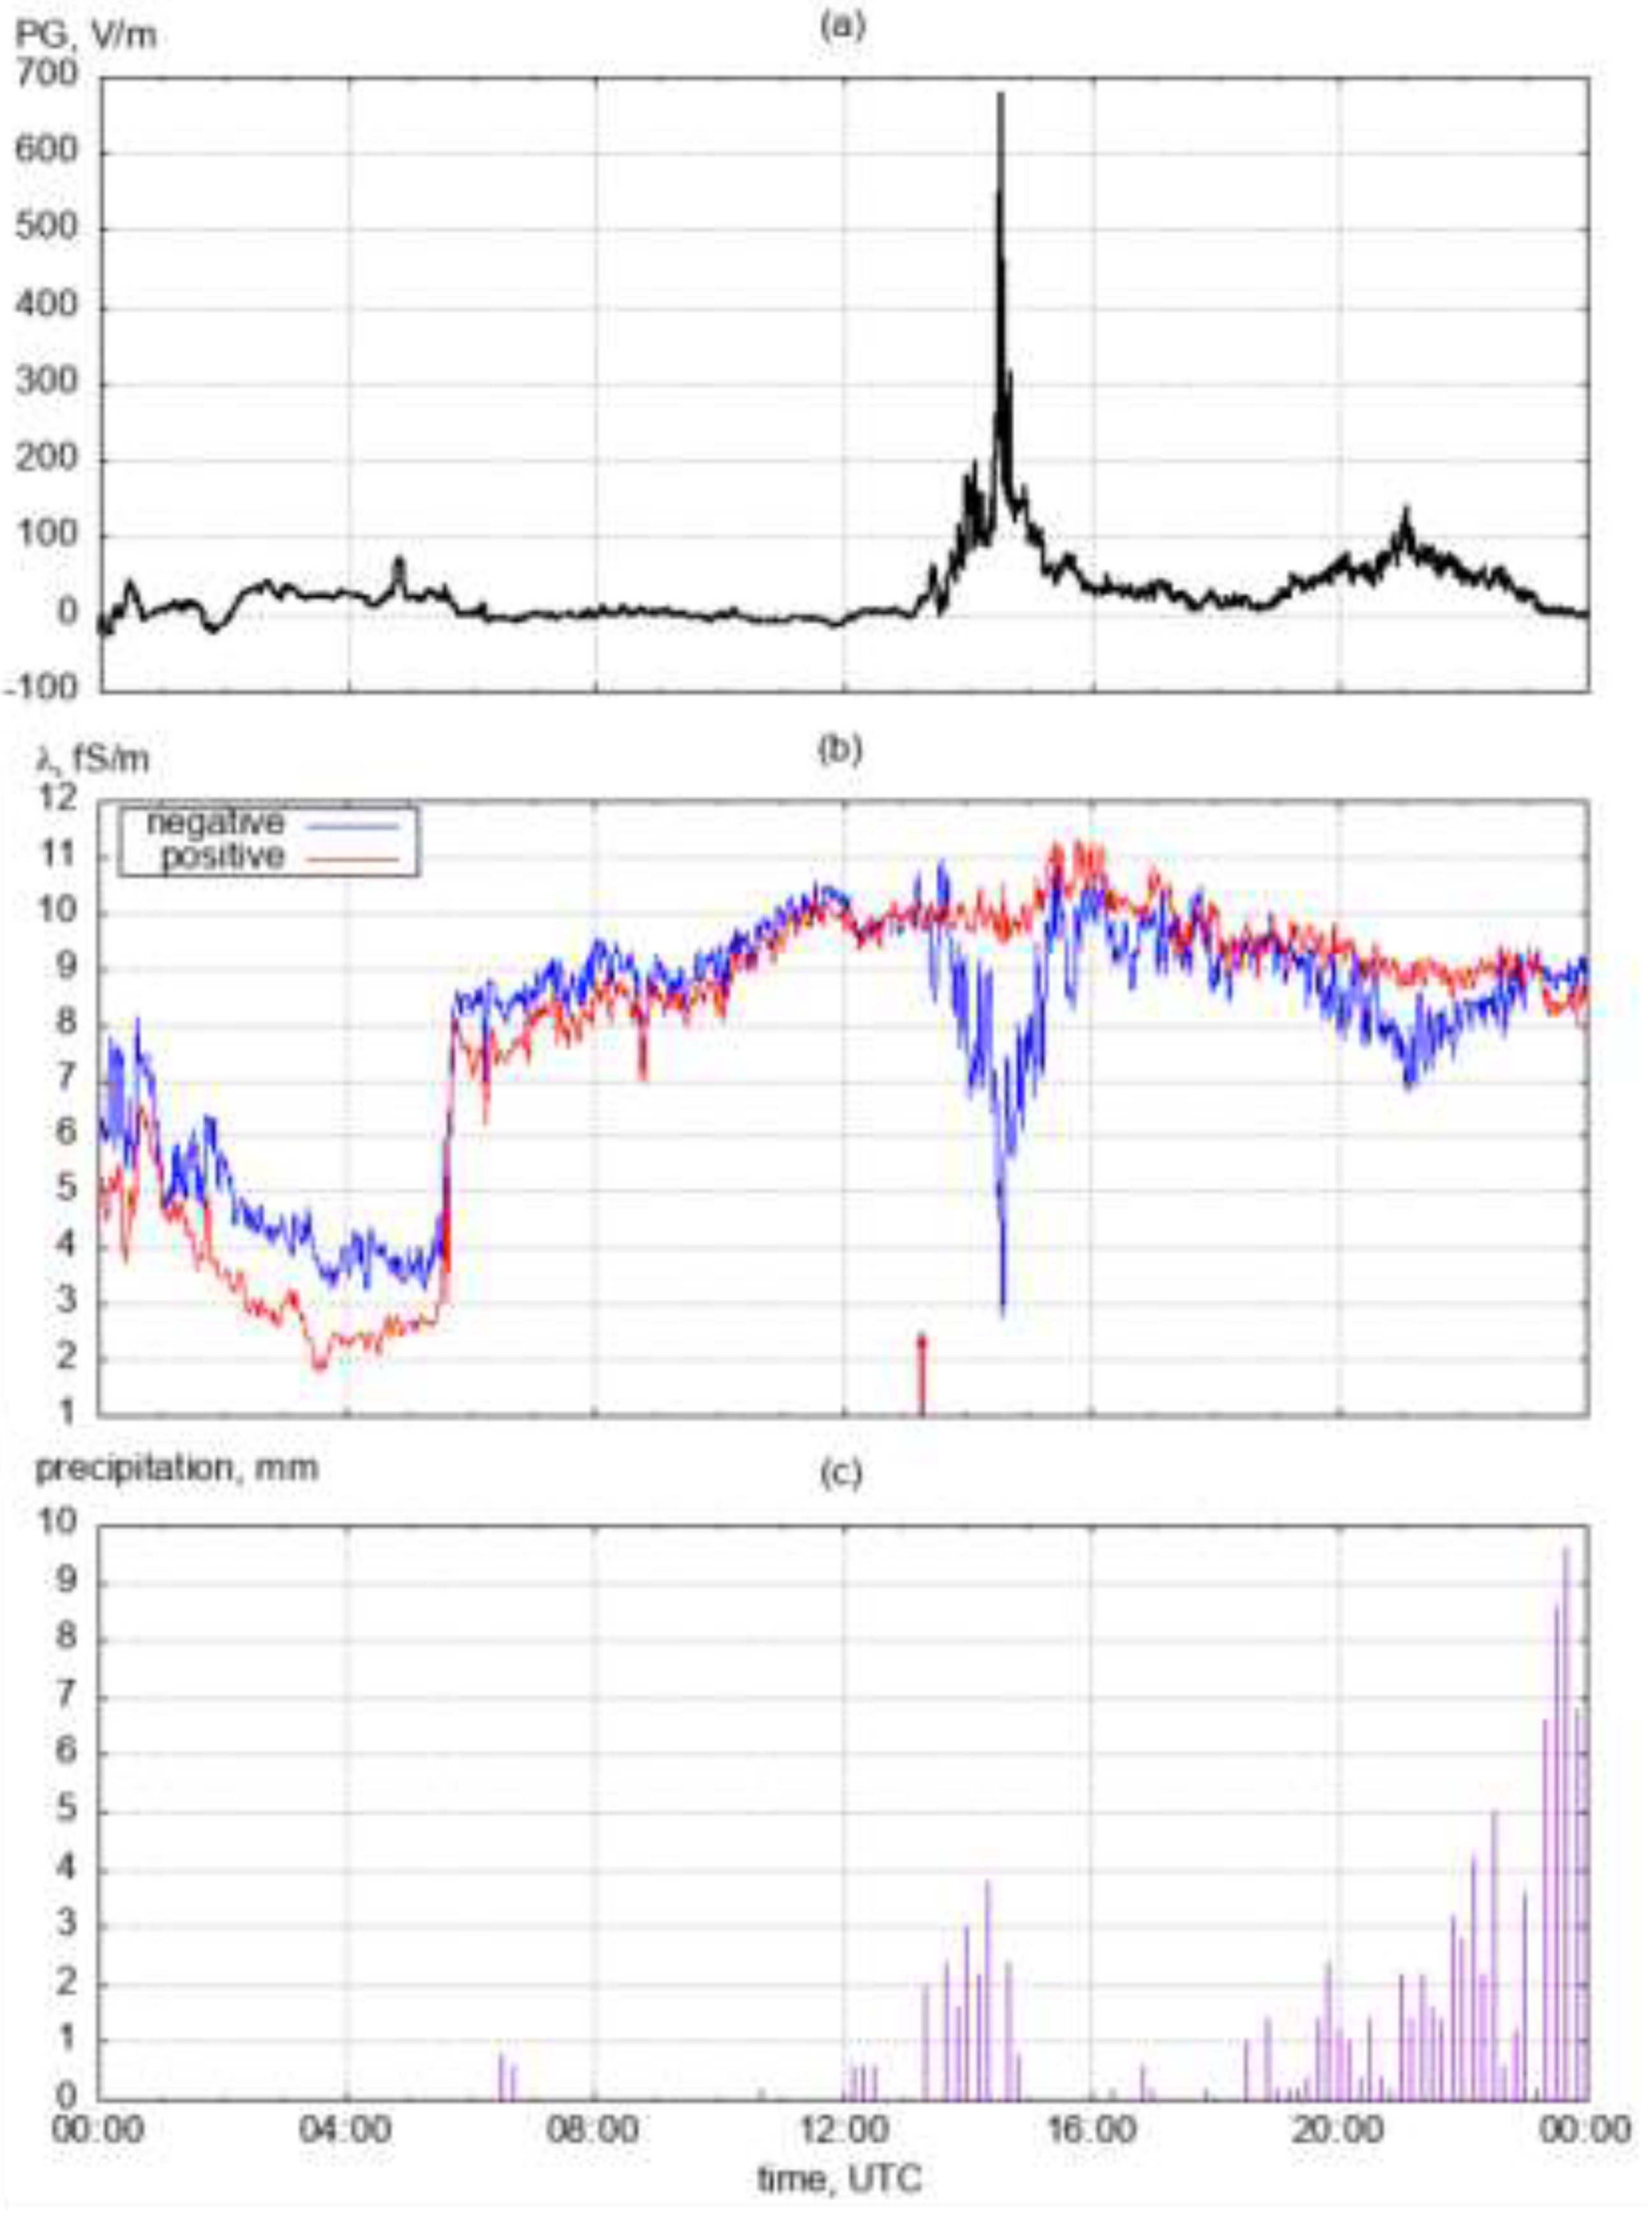
Figure 3.
Meteorological parameters of the atmosphere at the Paratunka observatory during the eruption of the Shiveluch volcano (13:15 - red arrow) (a) wind speed; (b) air humidity.
Figure 3.
Meteorological parameters of the atmosphere at the Paratunka observatory during the eruption of the Shiveluch volcano (13:15 - red arrow) (a) wind speed; (b) air humidity.
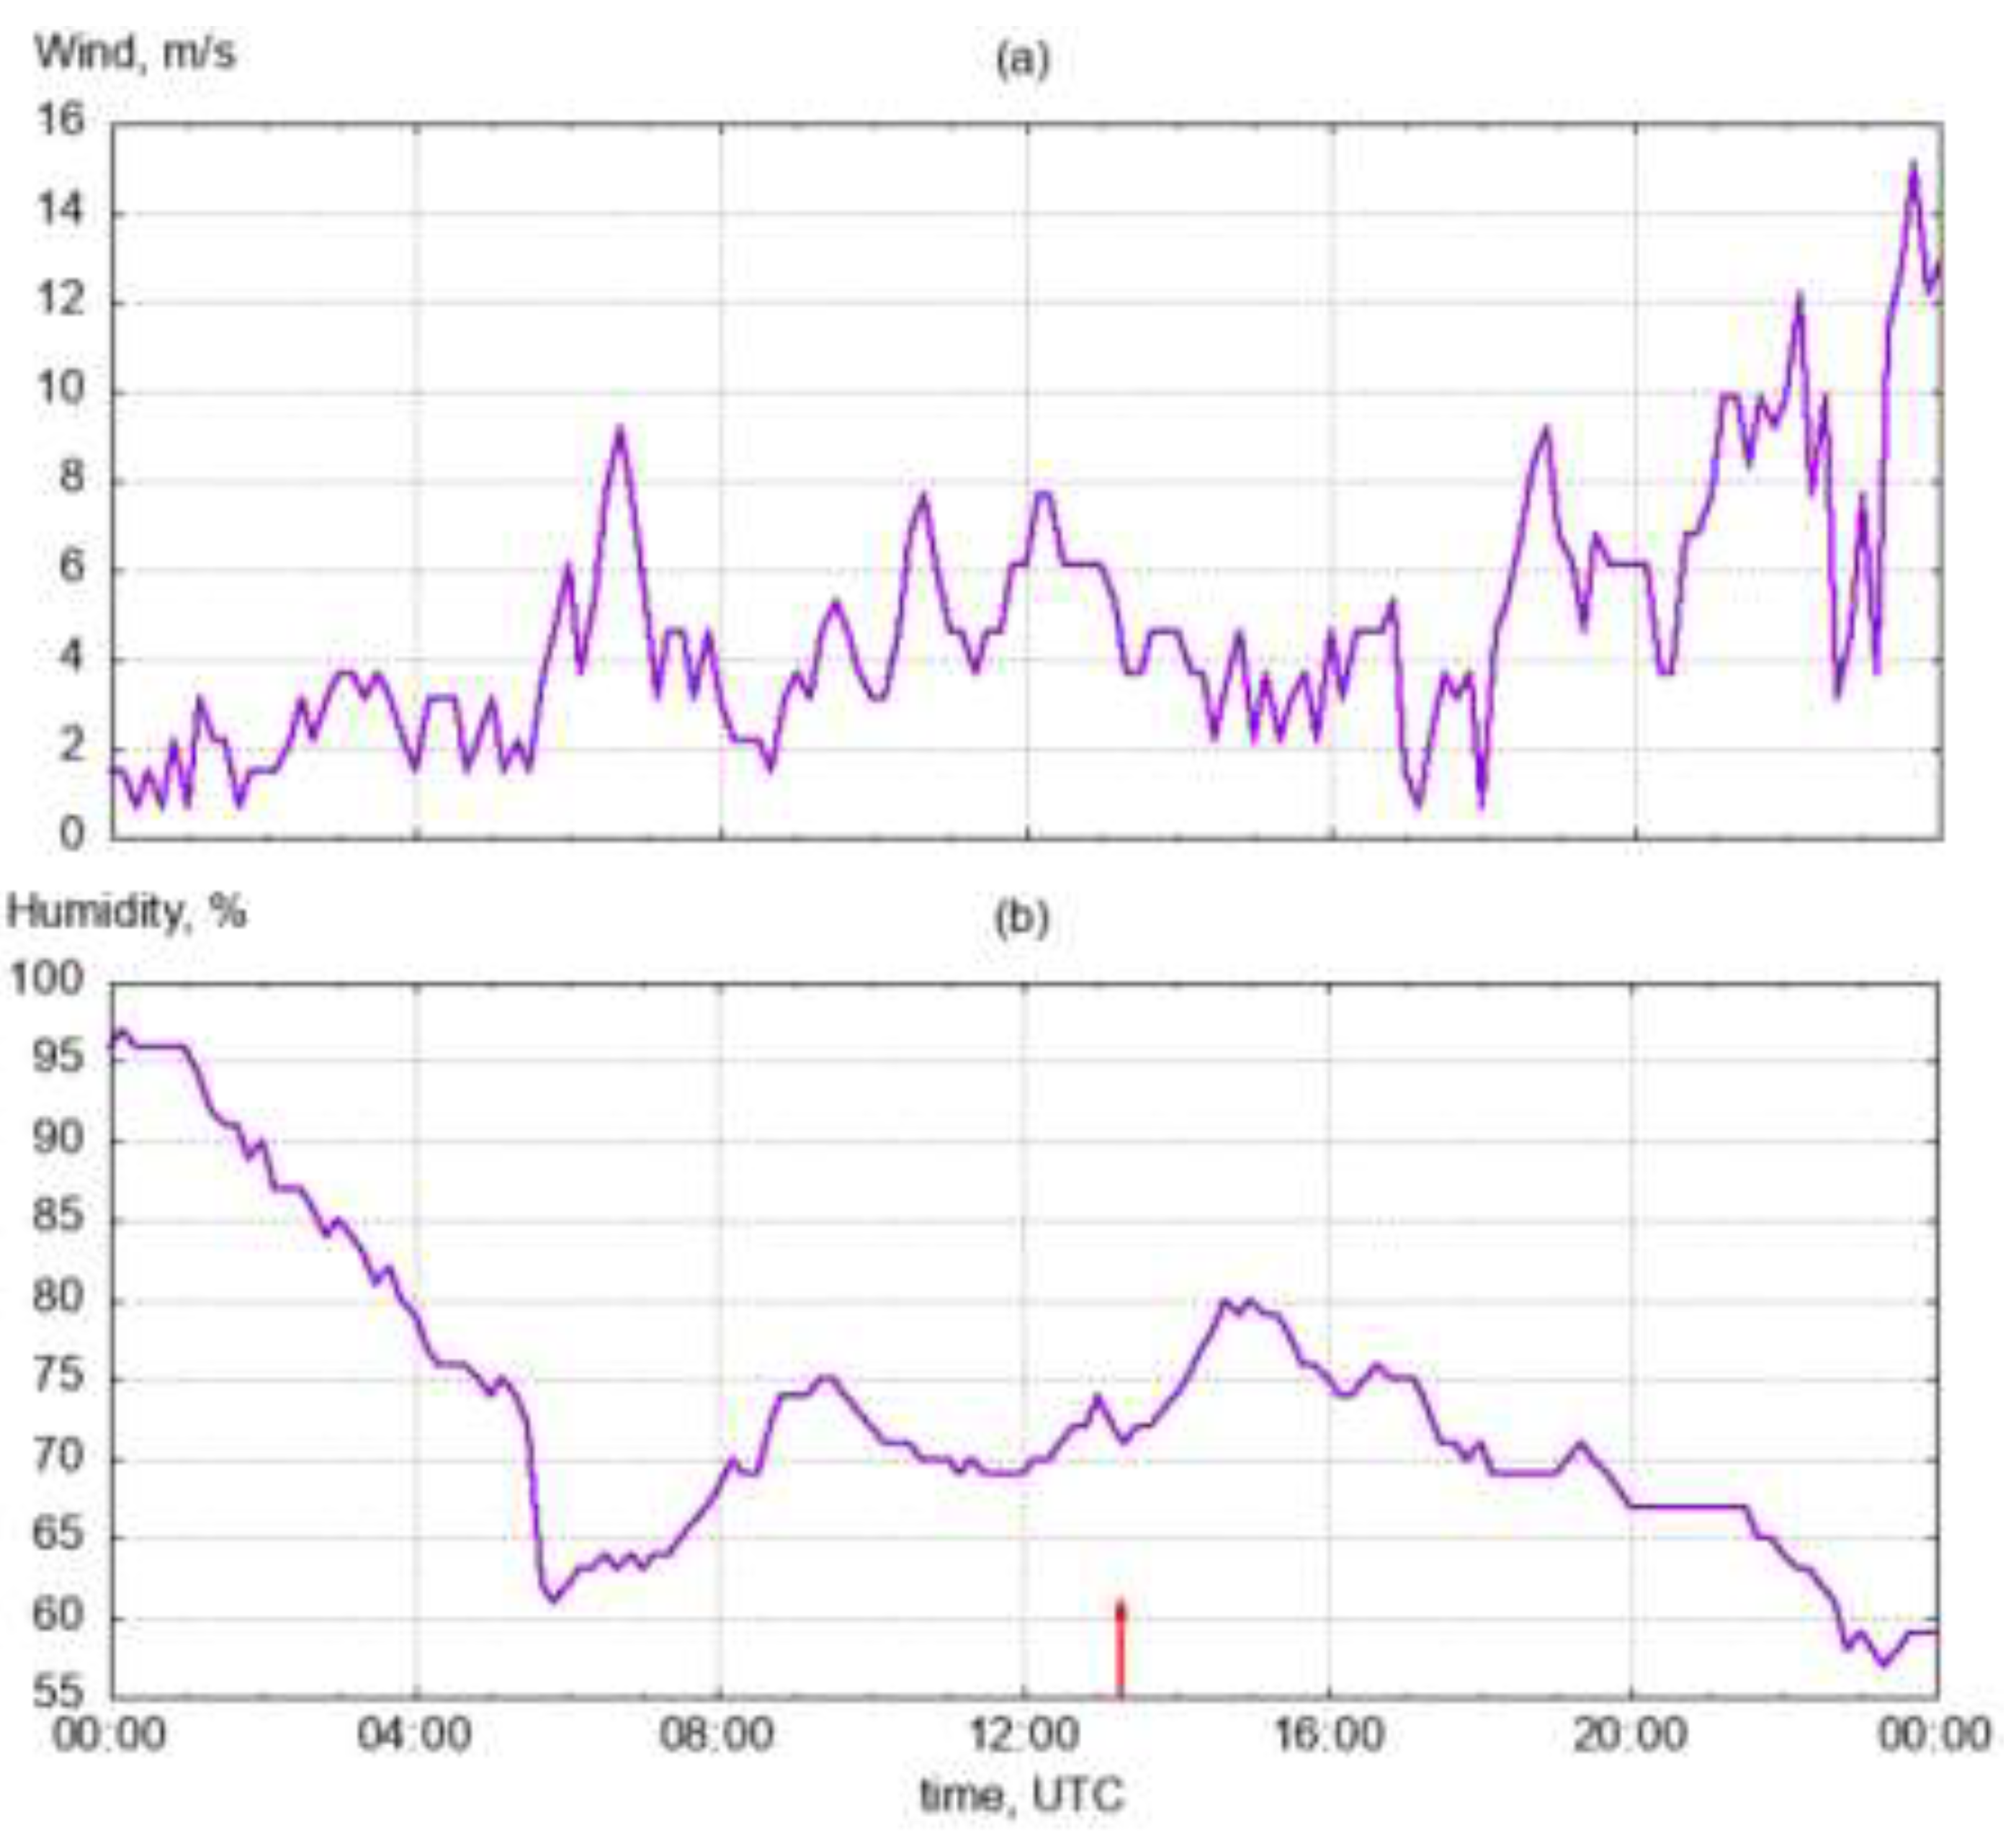
Figure 4.
Ionograms registered in 10 April 2023 at: (a) 13:00 UTC; (b) 13:15 UTC; (c) 13:30 UTC.
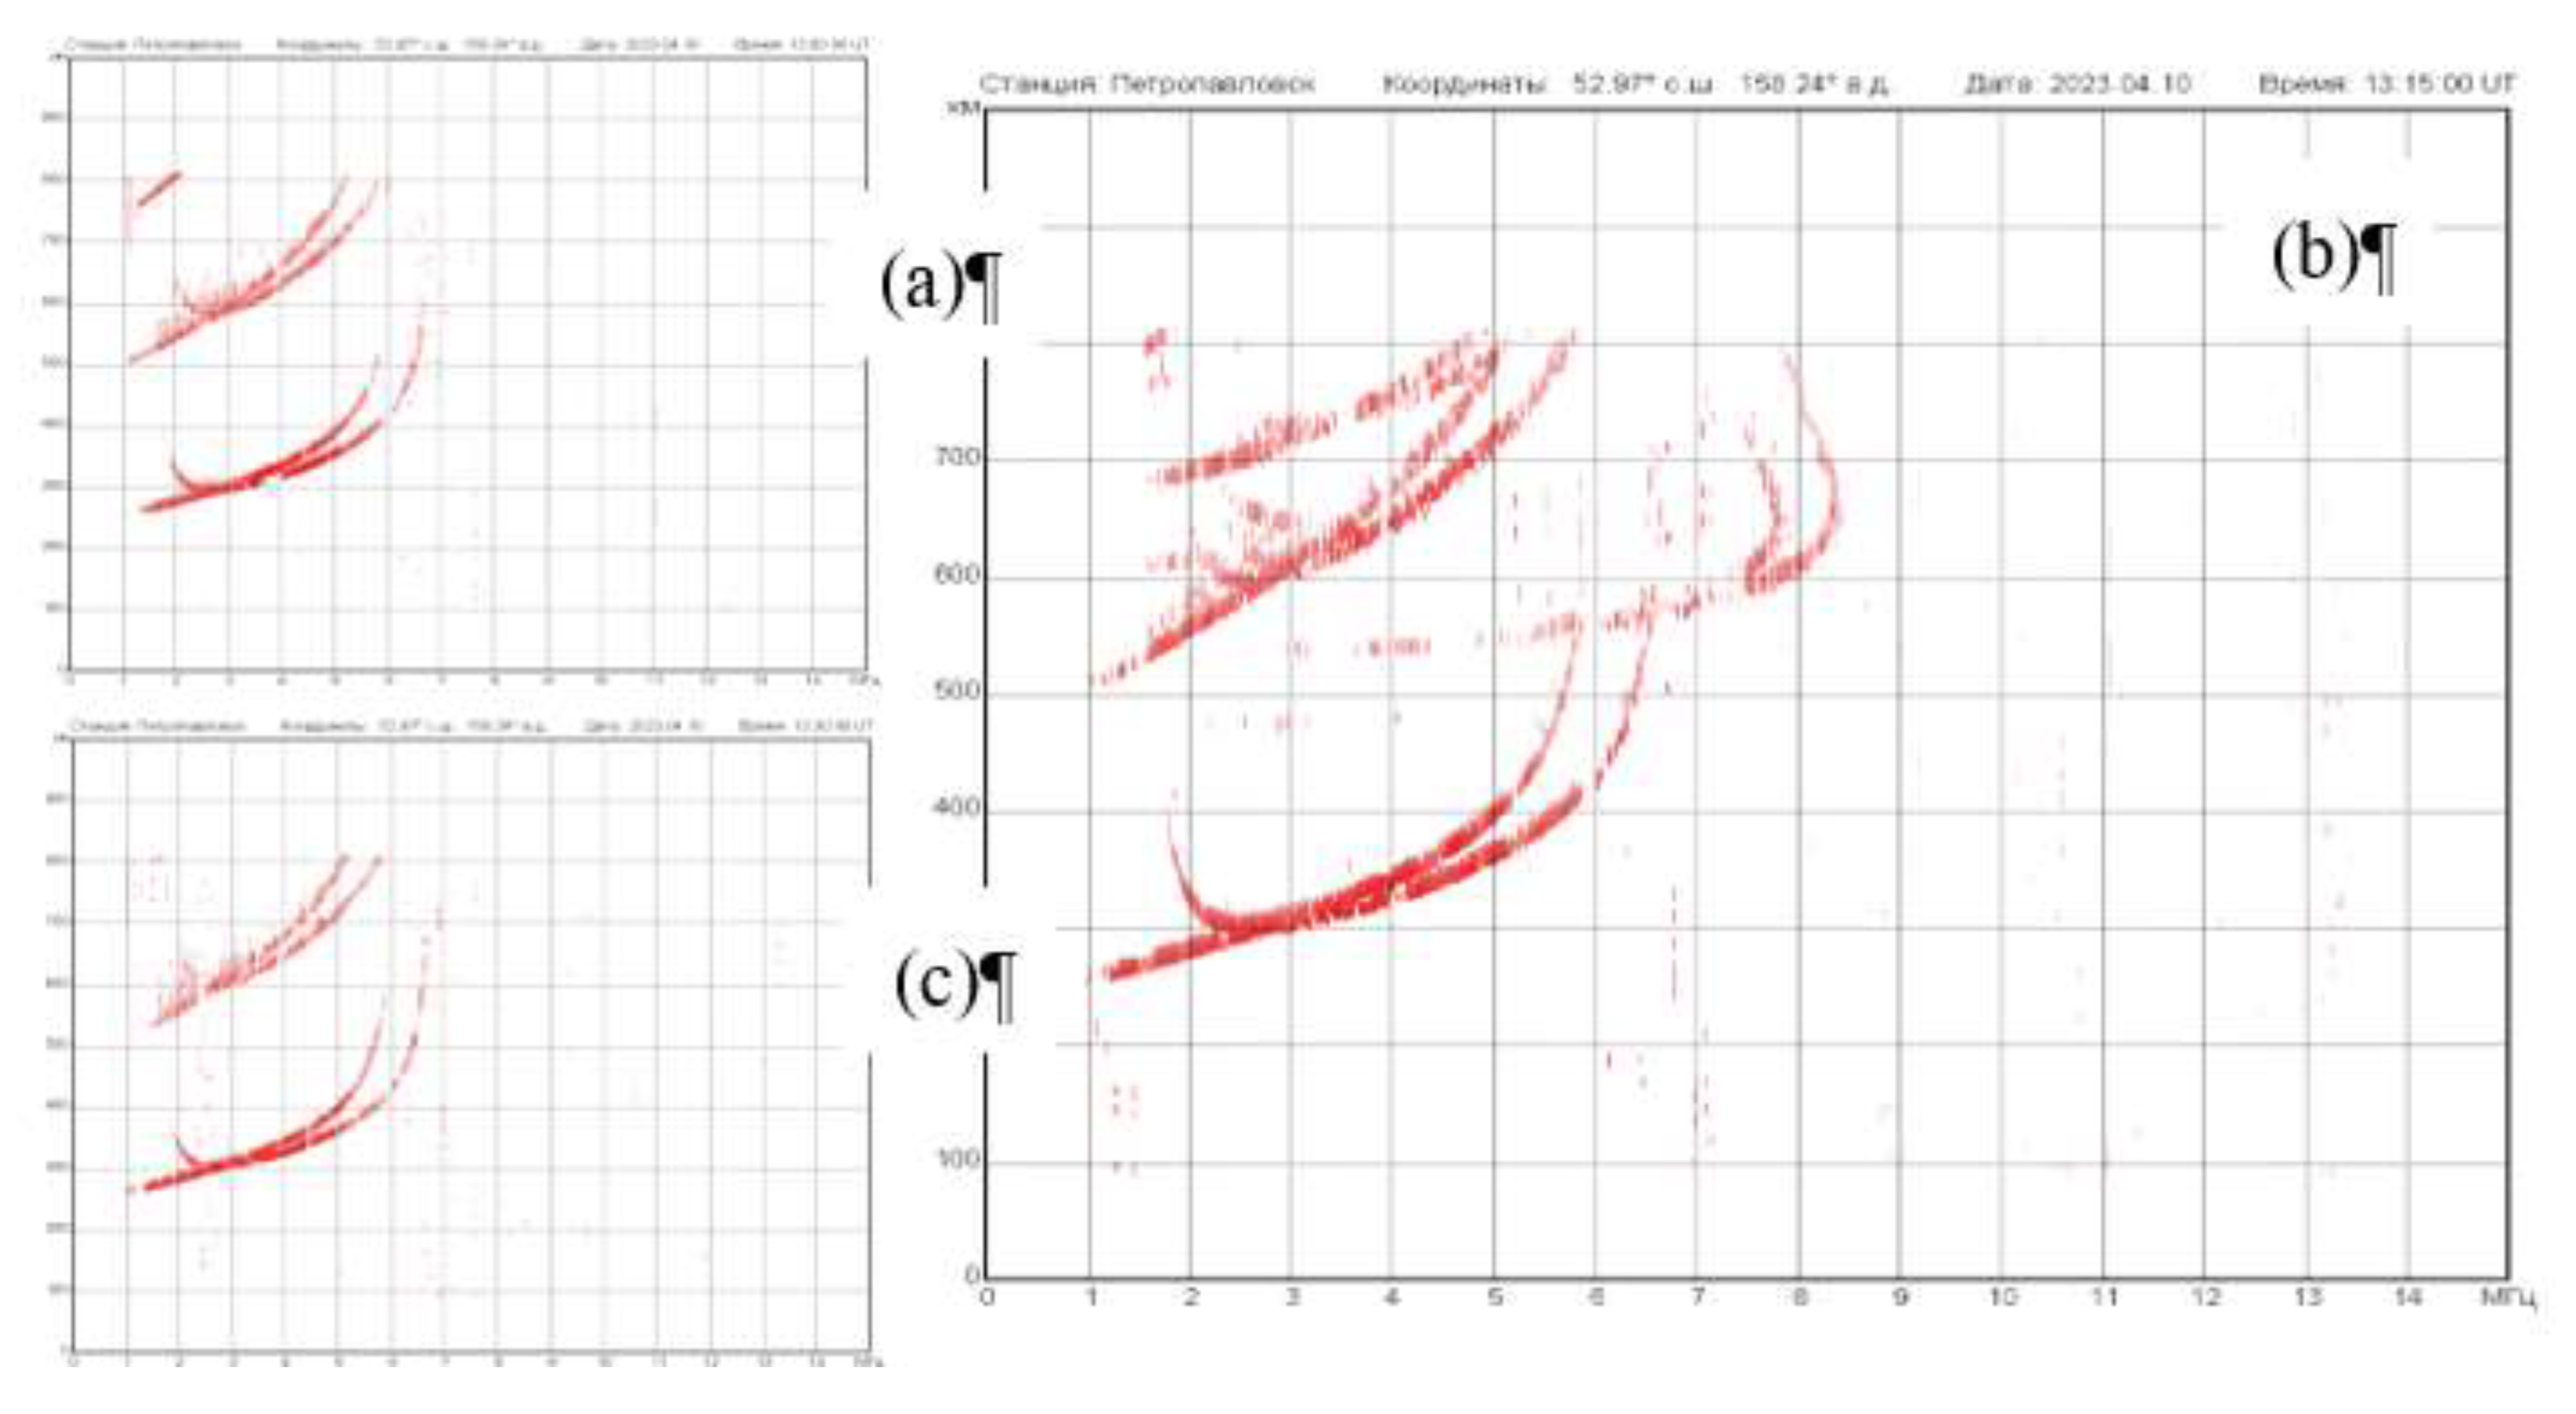
Figure 5.
Variations of the ionospheric parameters during time interval from 6 till 16 April 2023 (a) GIM TEC variations over the Shiveluch volcano location; (b) GIM TEC variations over the Paratunka observatory location; (c) ΔTEC for Shiveluch data; (d) – Dst index; (e) – critical frequency foF2 measured by AIS ionosonde at Paratunka. Blue lines GIM TEC and foF2 time variations, red lines – the running median.
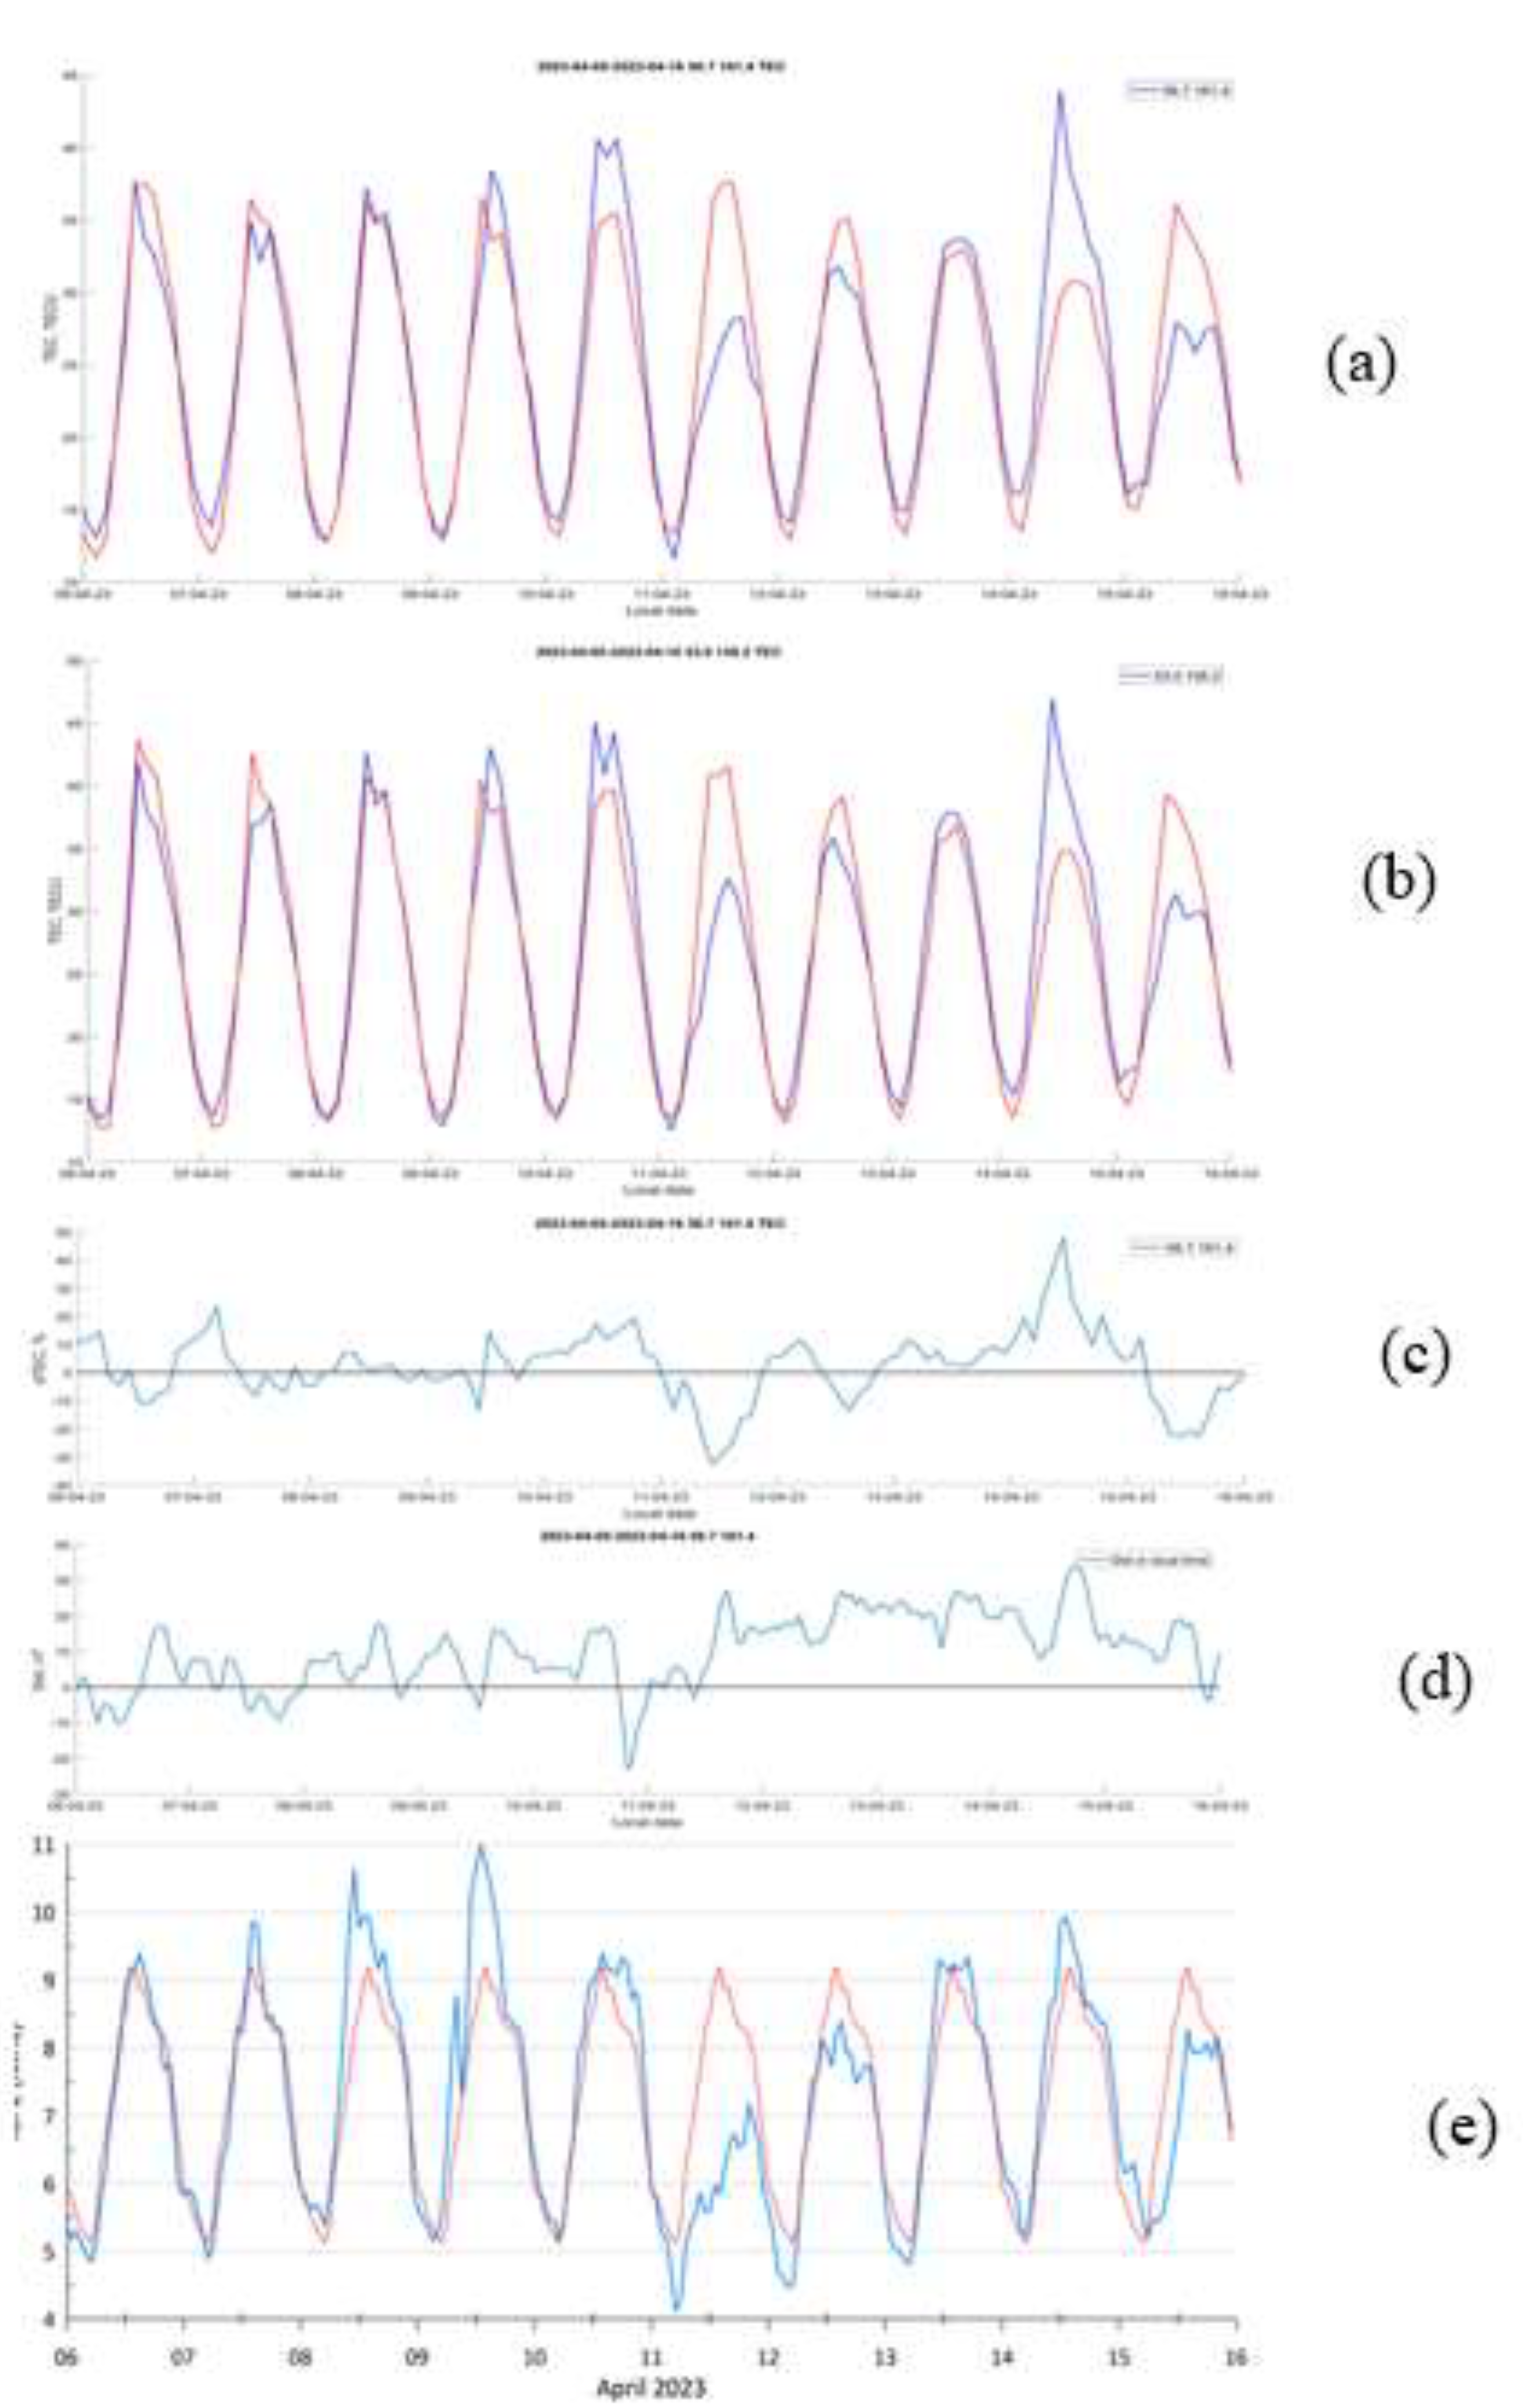
Figure 6.
(a) counting rate of pulsed electromagnetic VLF radiation; (b) recording of explosive microseims at the seismic station BDR [18]. At the lower panel are shown the consecutive images from the Himawari9 geostationary satellite [19]. From left to right: 10 April 13:10 UTC; 14:20 UTC; 15:50 UTC; 11 April 00:00 UTC .
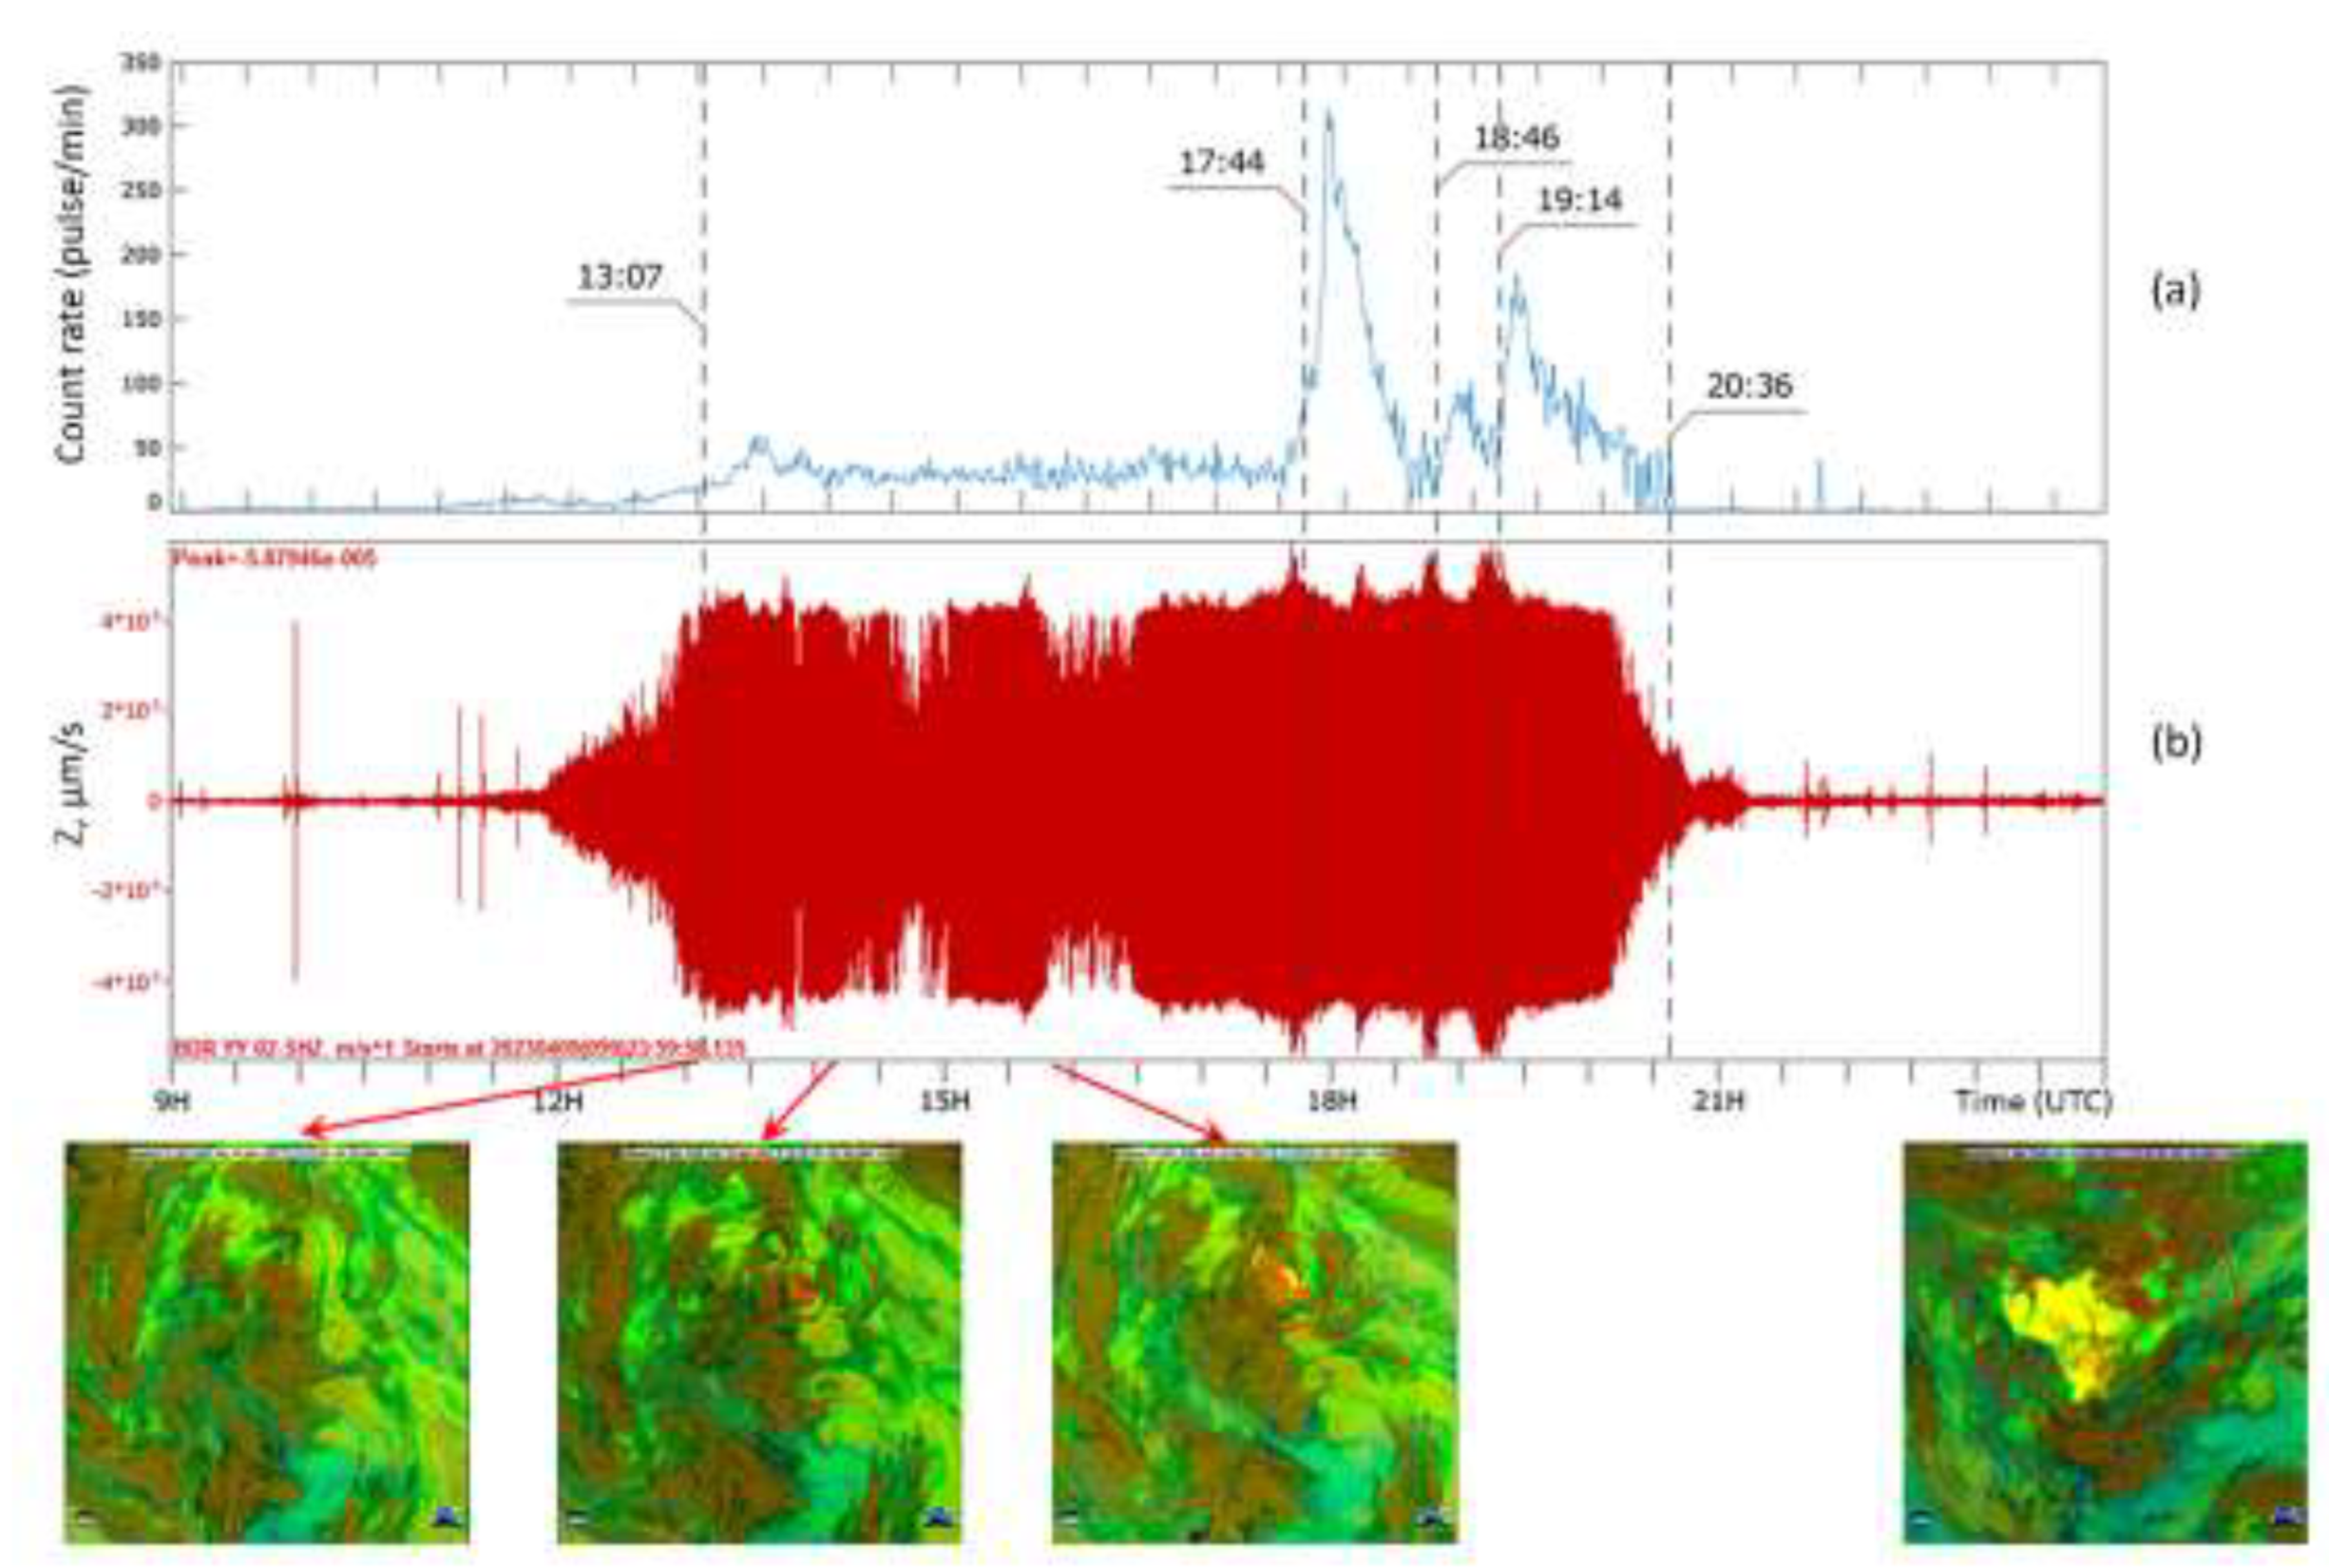
Figure 7.
(a) Legend of the signals observed by the L-array; (b) ionograms registered by one of channels of the L-array [20].
Figure 7.
(a) Legend of the signals observed by the L-array; (b) ionograms registered by one of channels of the L-array [20].
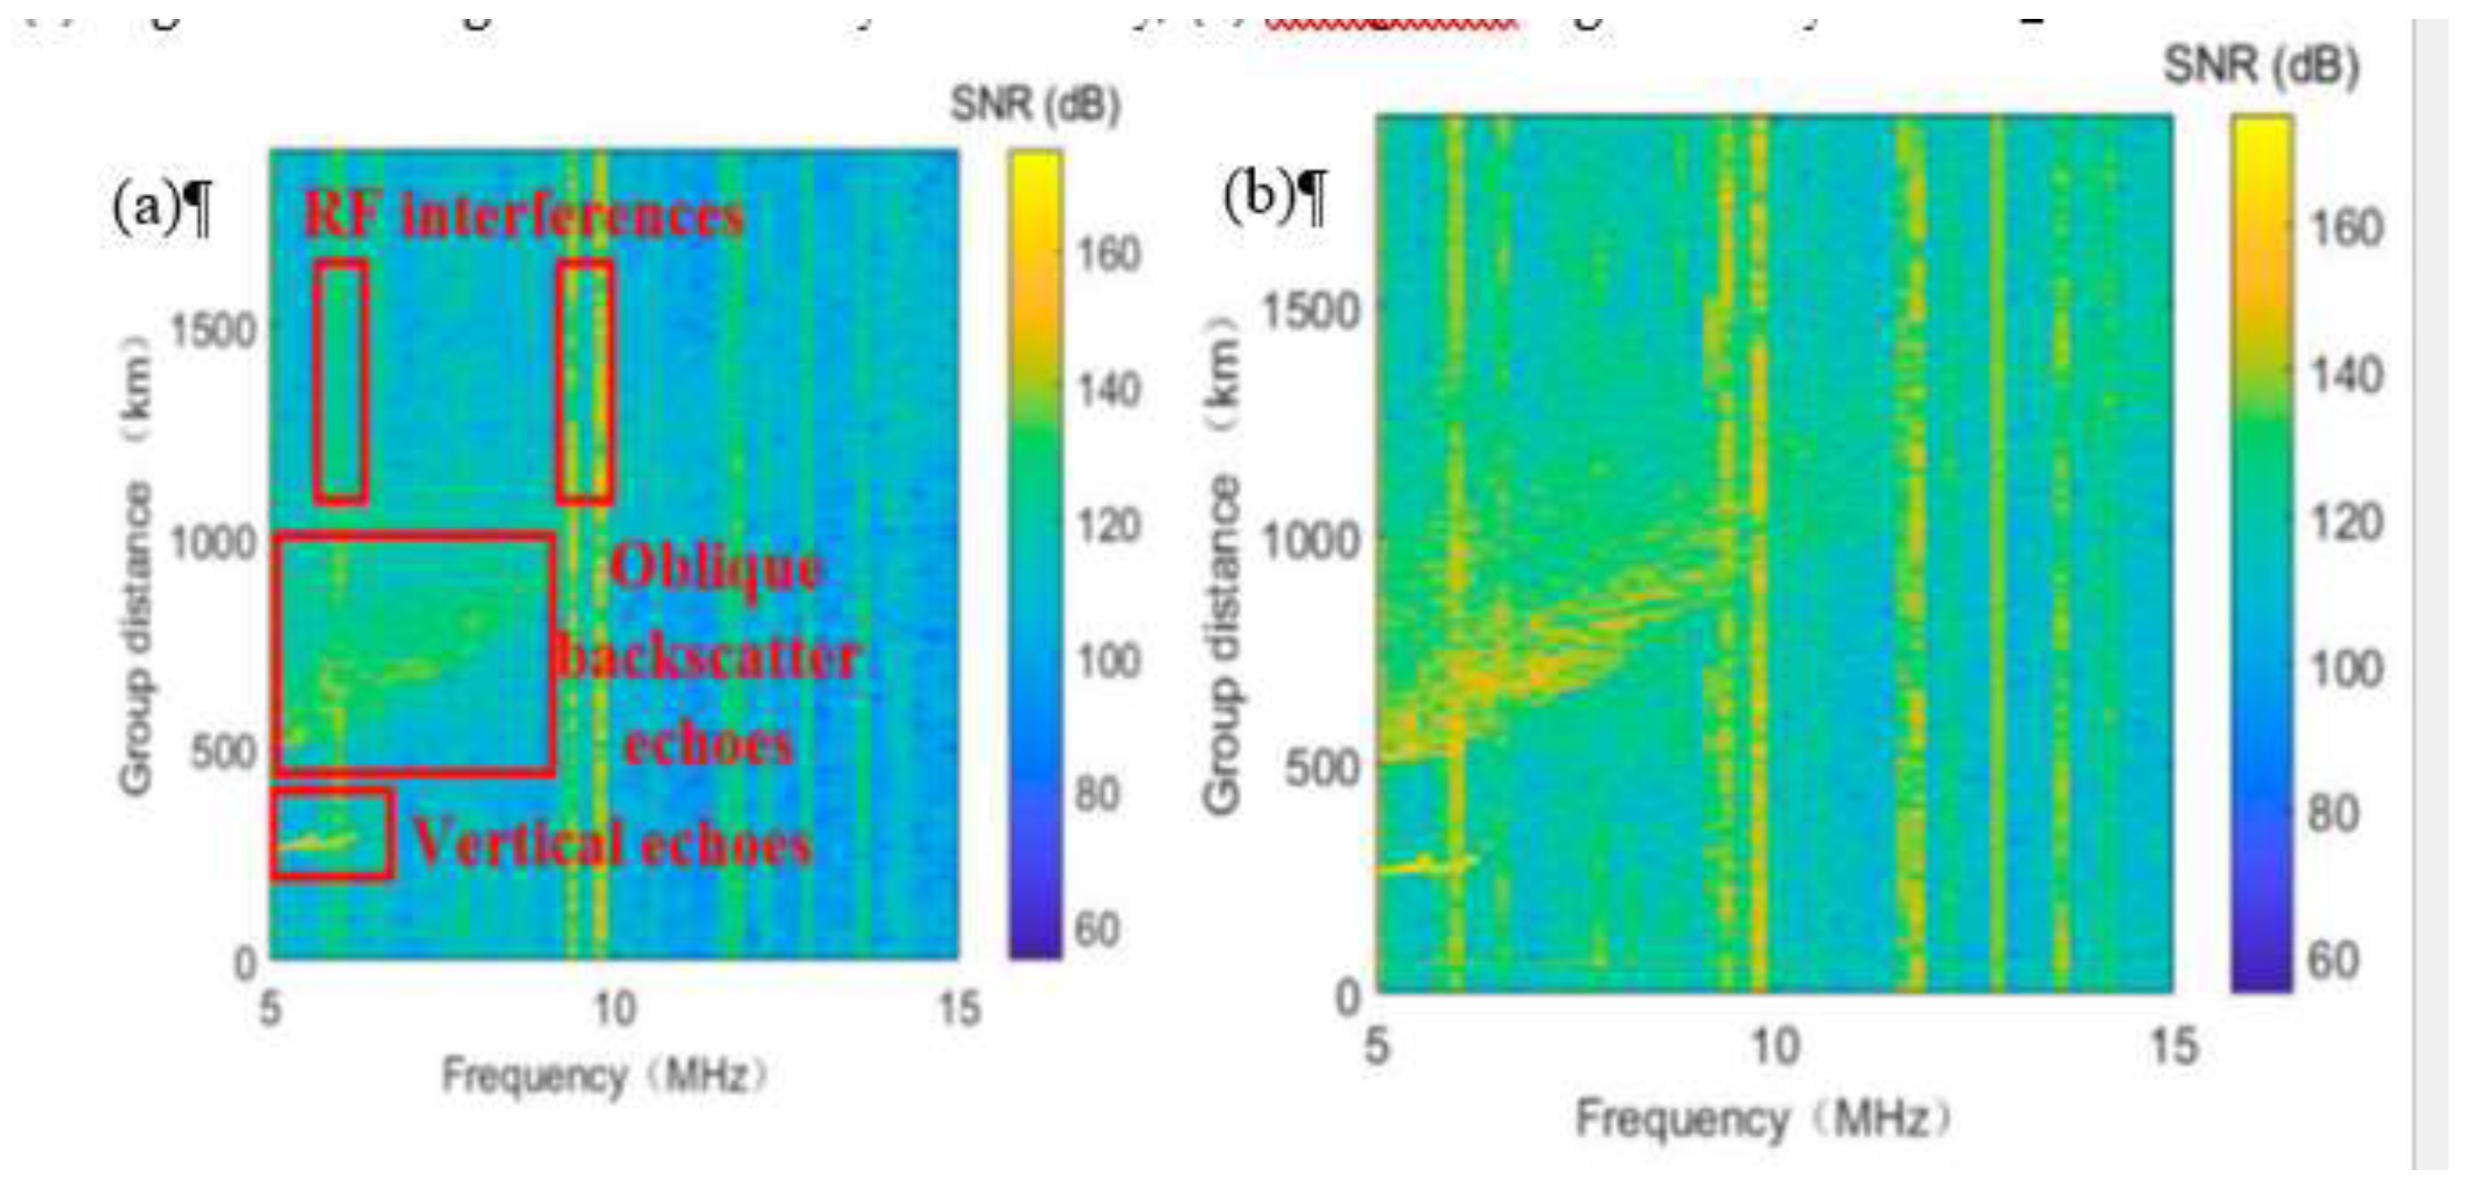
Figure 8.
Schematic presentation of the oblique reflection trace formation on the ionogram image
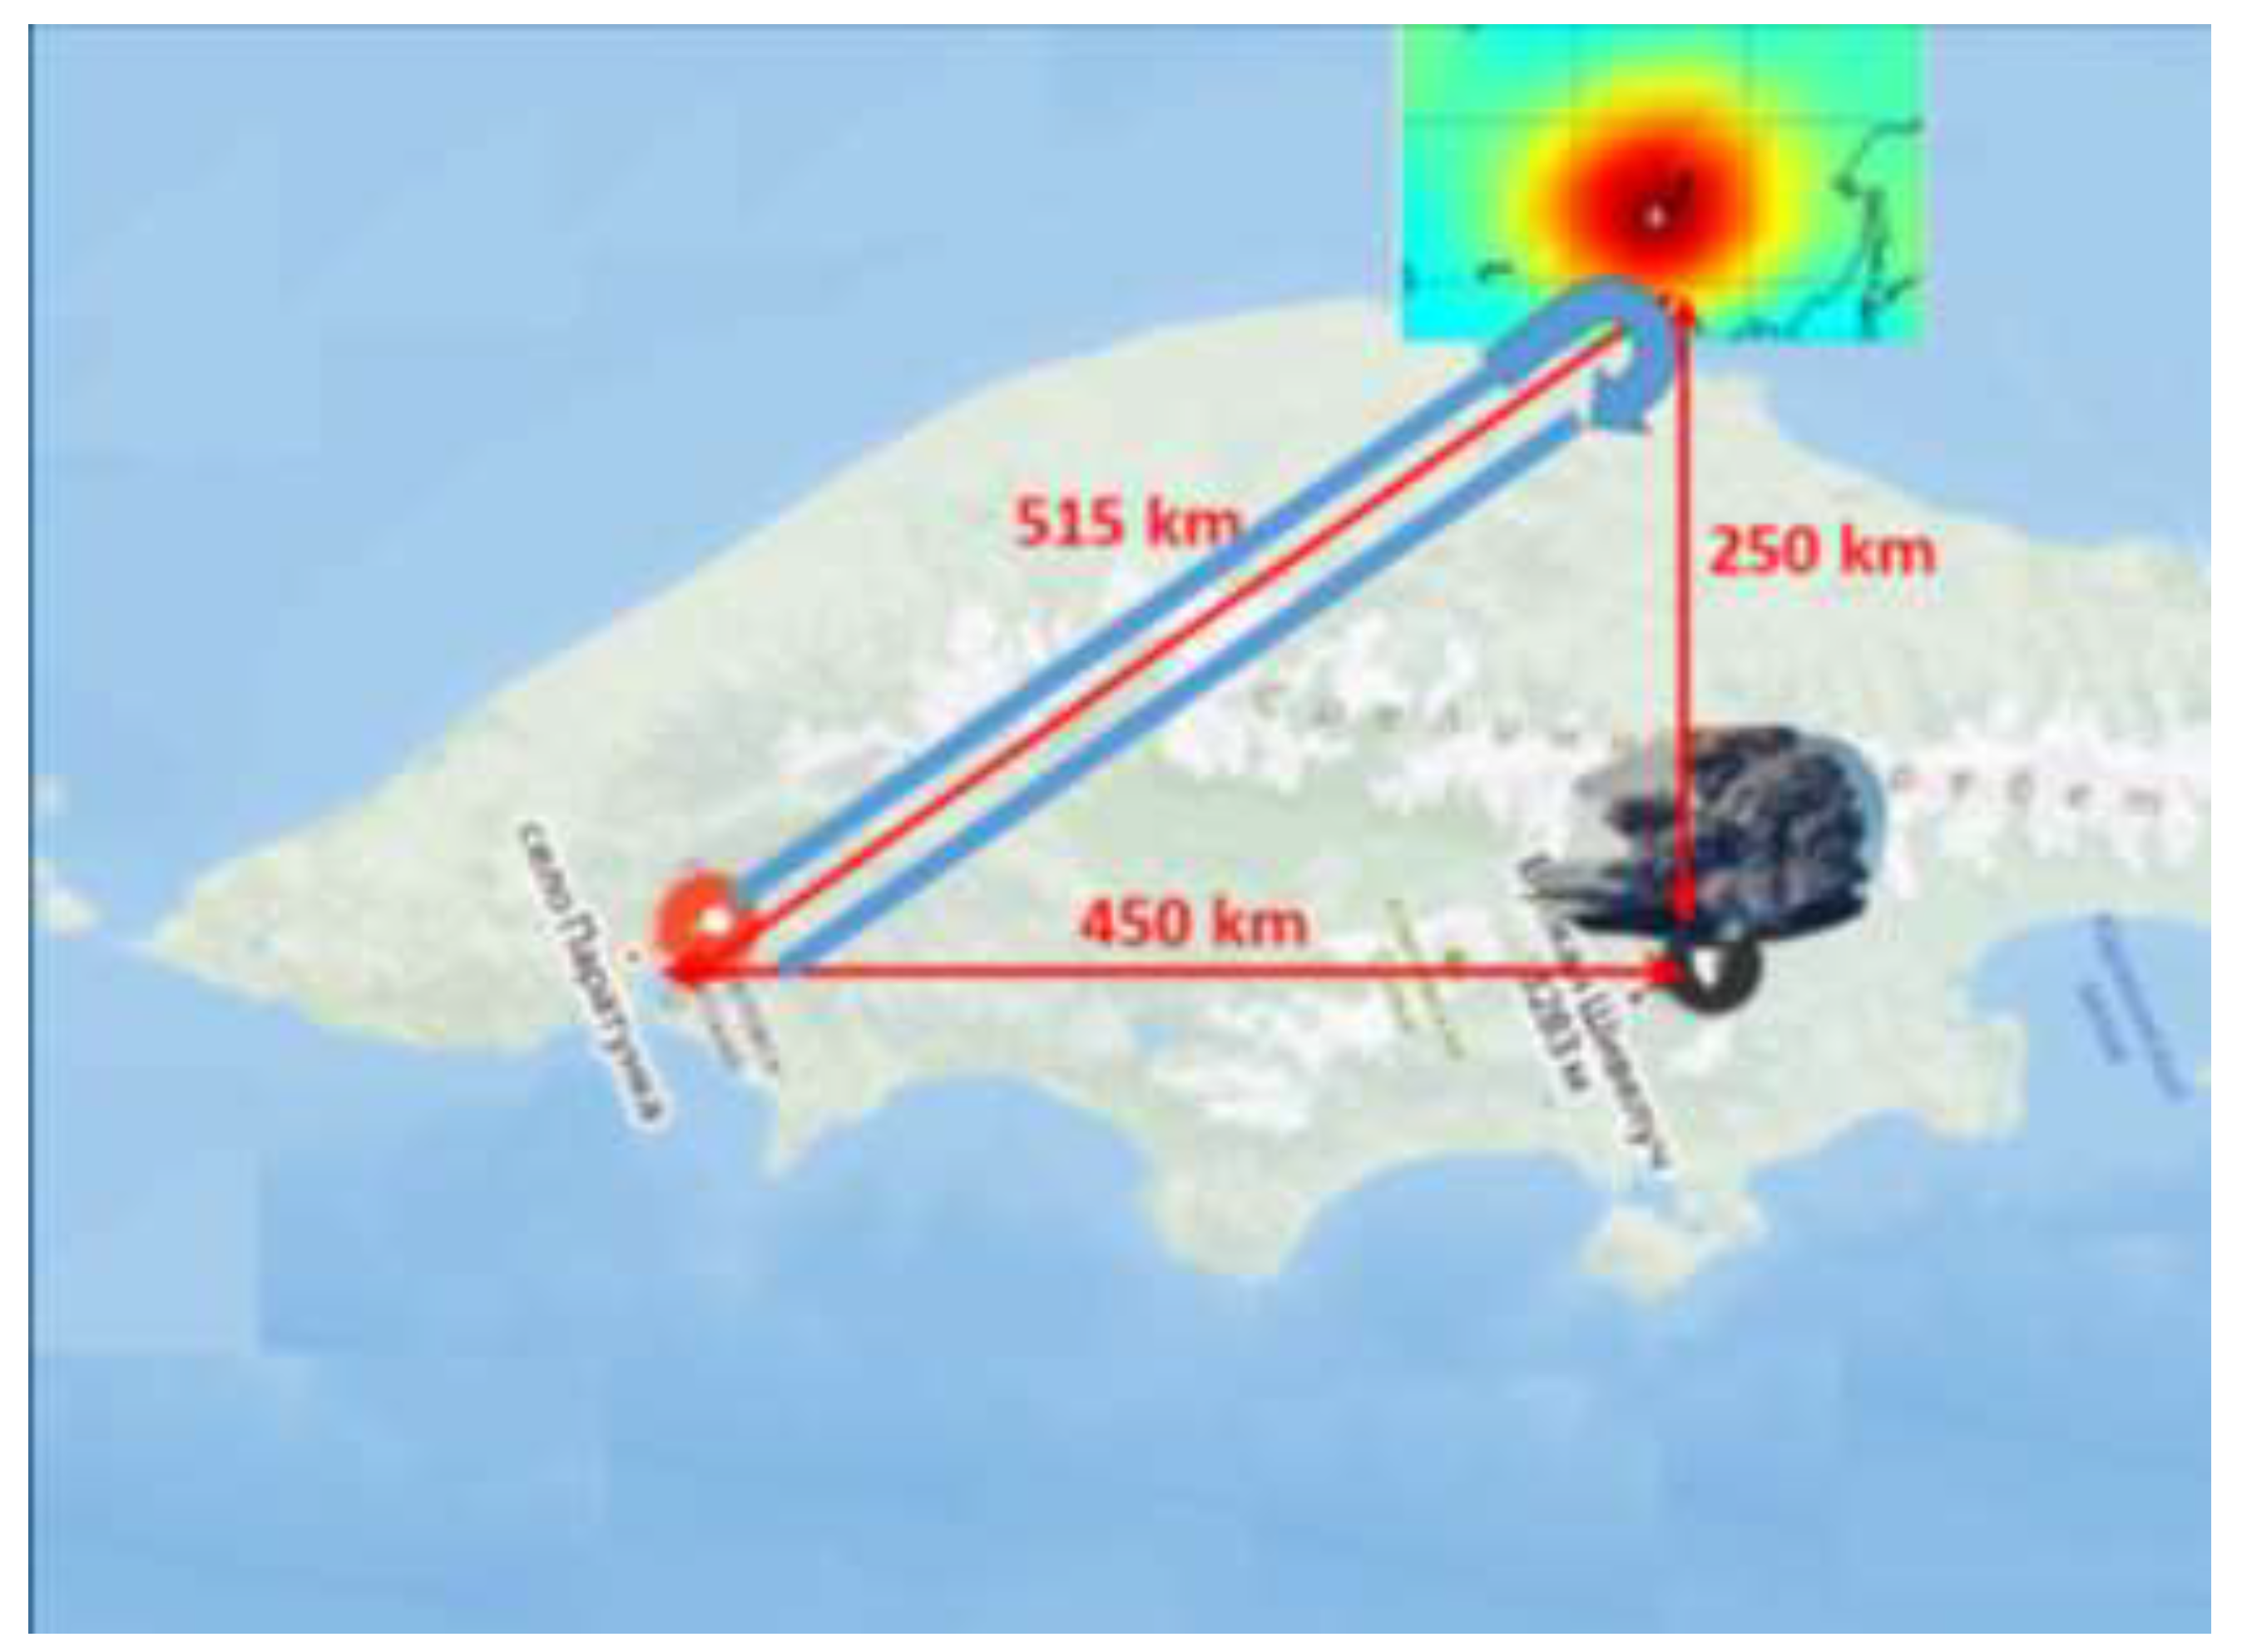
Figure 9.
Variation of the vertical potential gradient (PG) of atmospheric electric field registered on 18 August 2024 at Paratunka observatory with 1 s time resolution
Figure 9.
Variation of the vertical potential gradient (PG) of atmospheric electric field registered on 18 August 2024 at Paratunka observatory with 1 s time resolution
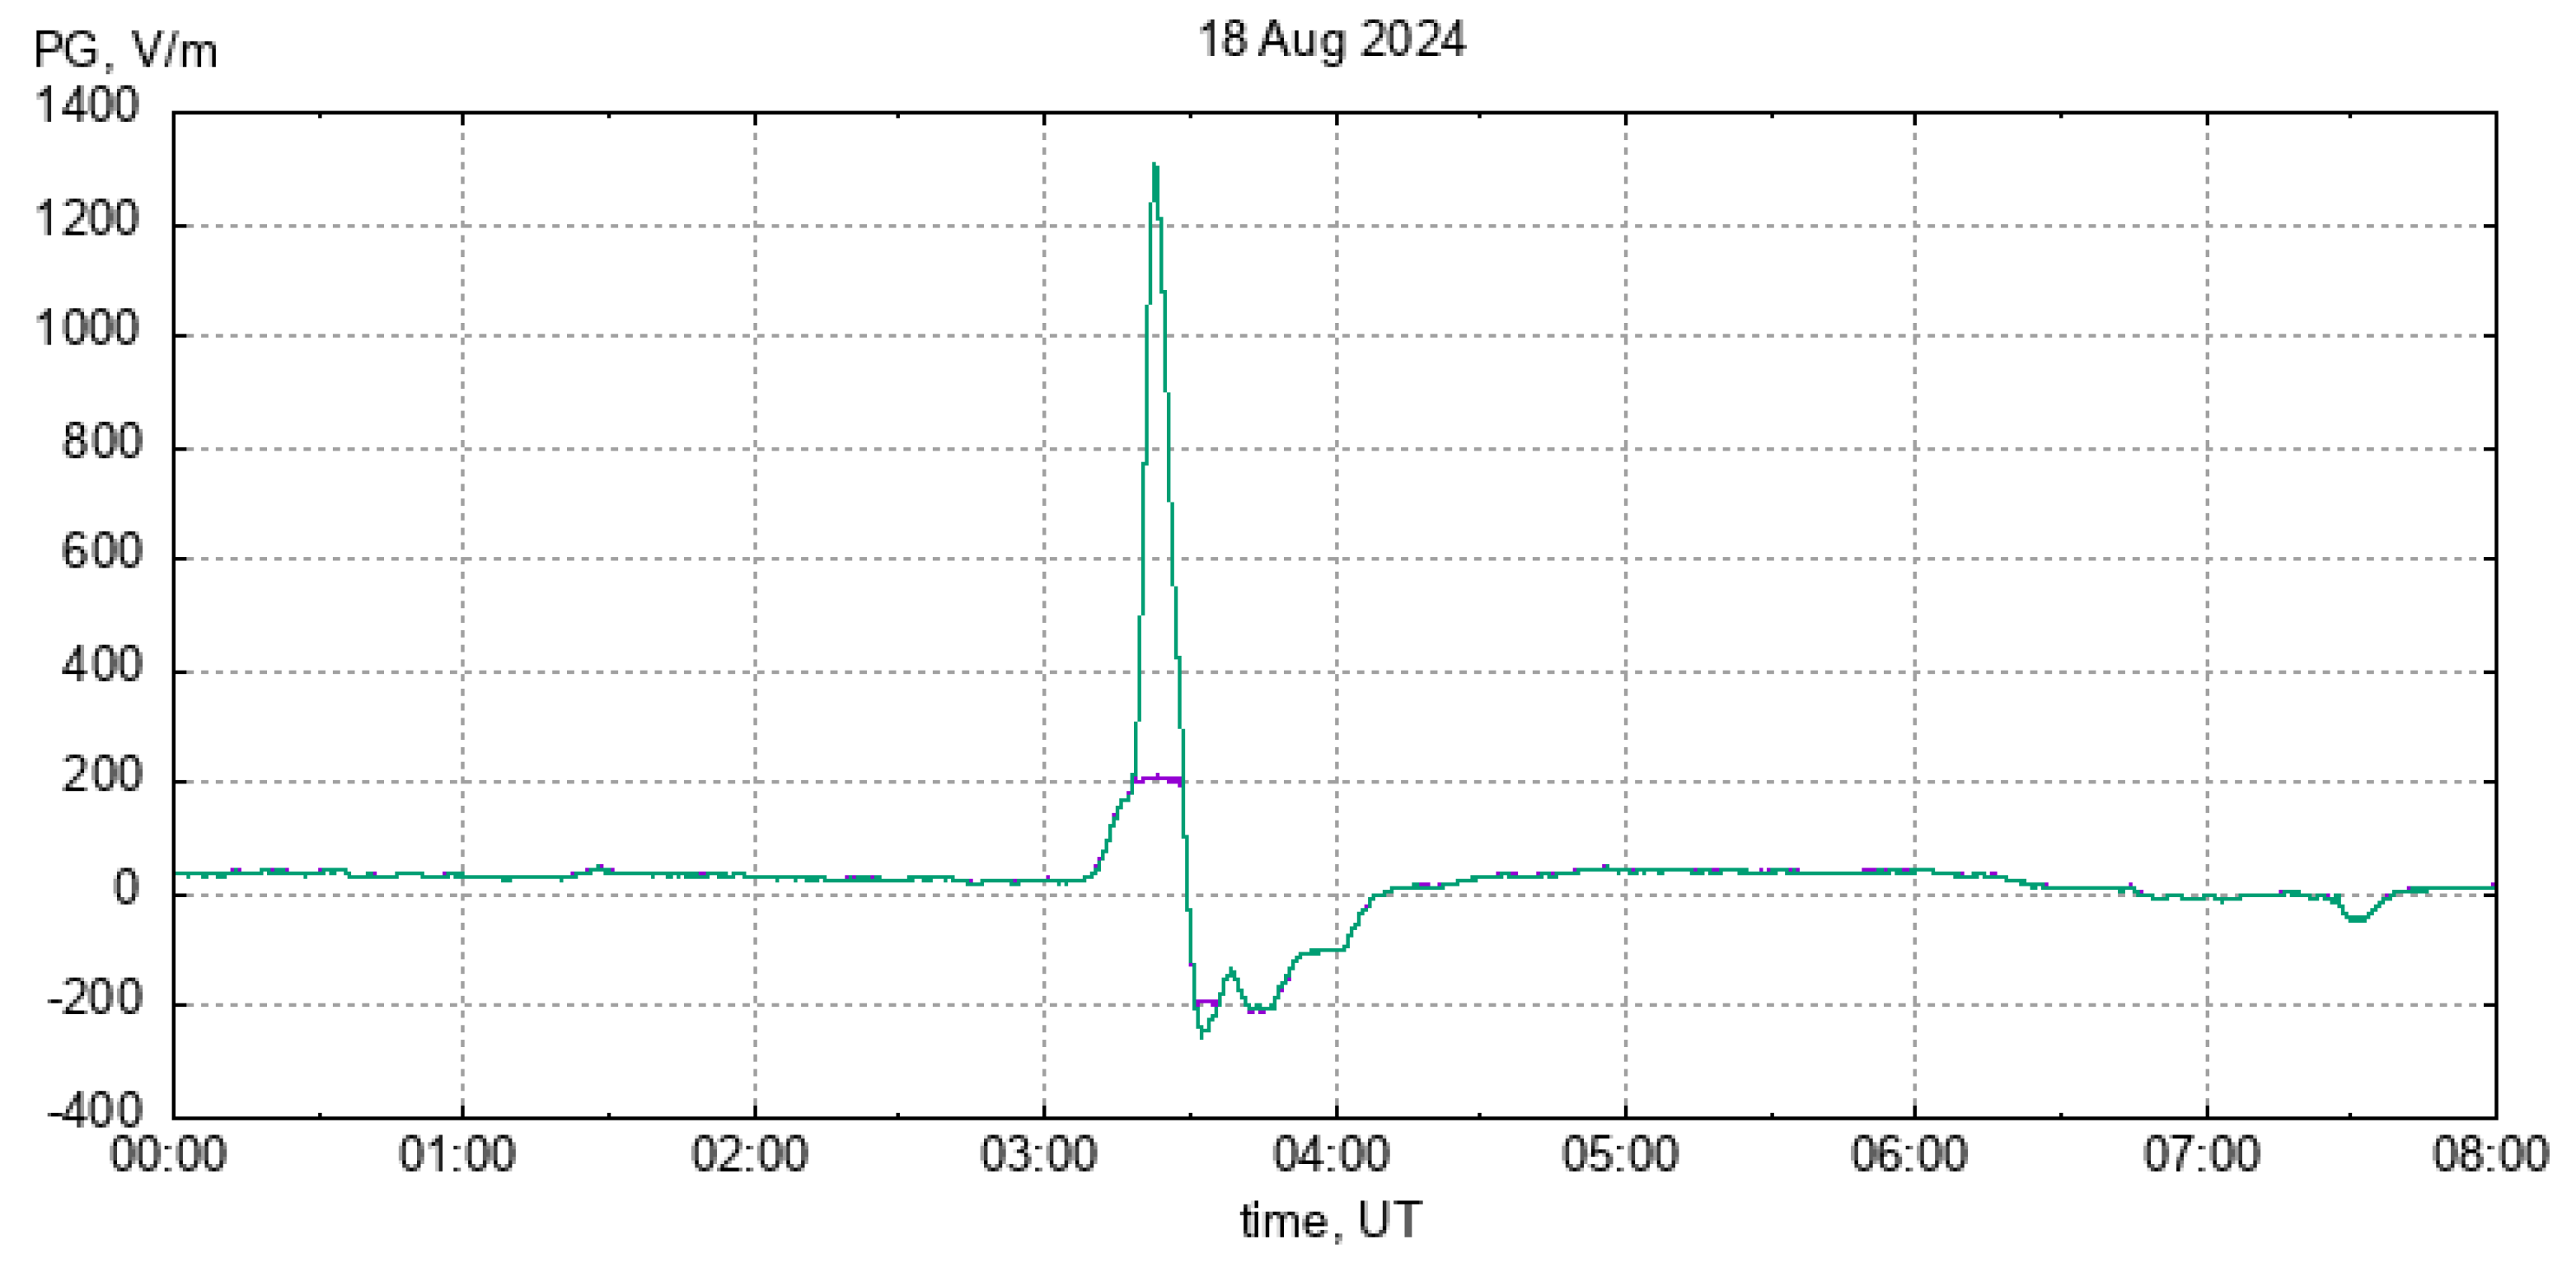
Figure 10.
Variations of positive (red) and negative (blue) conductivities registered on 18 August 2024 at Paratunka observatory
Figure 10.
Variations of positive (red) and negative (blue) conductivities registered on 18 August 2024 at Paratunka observatory
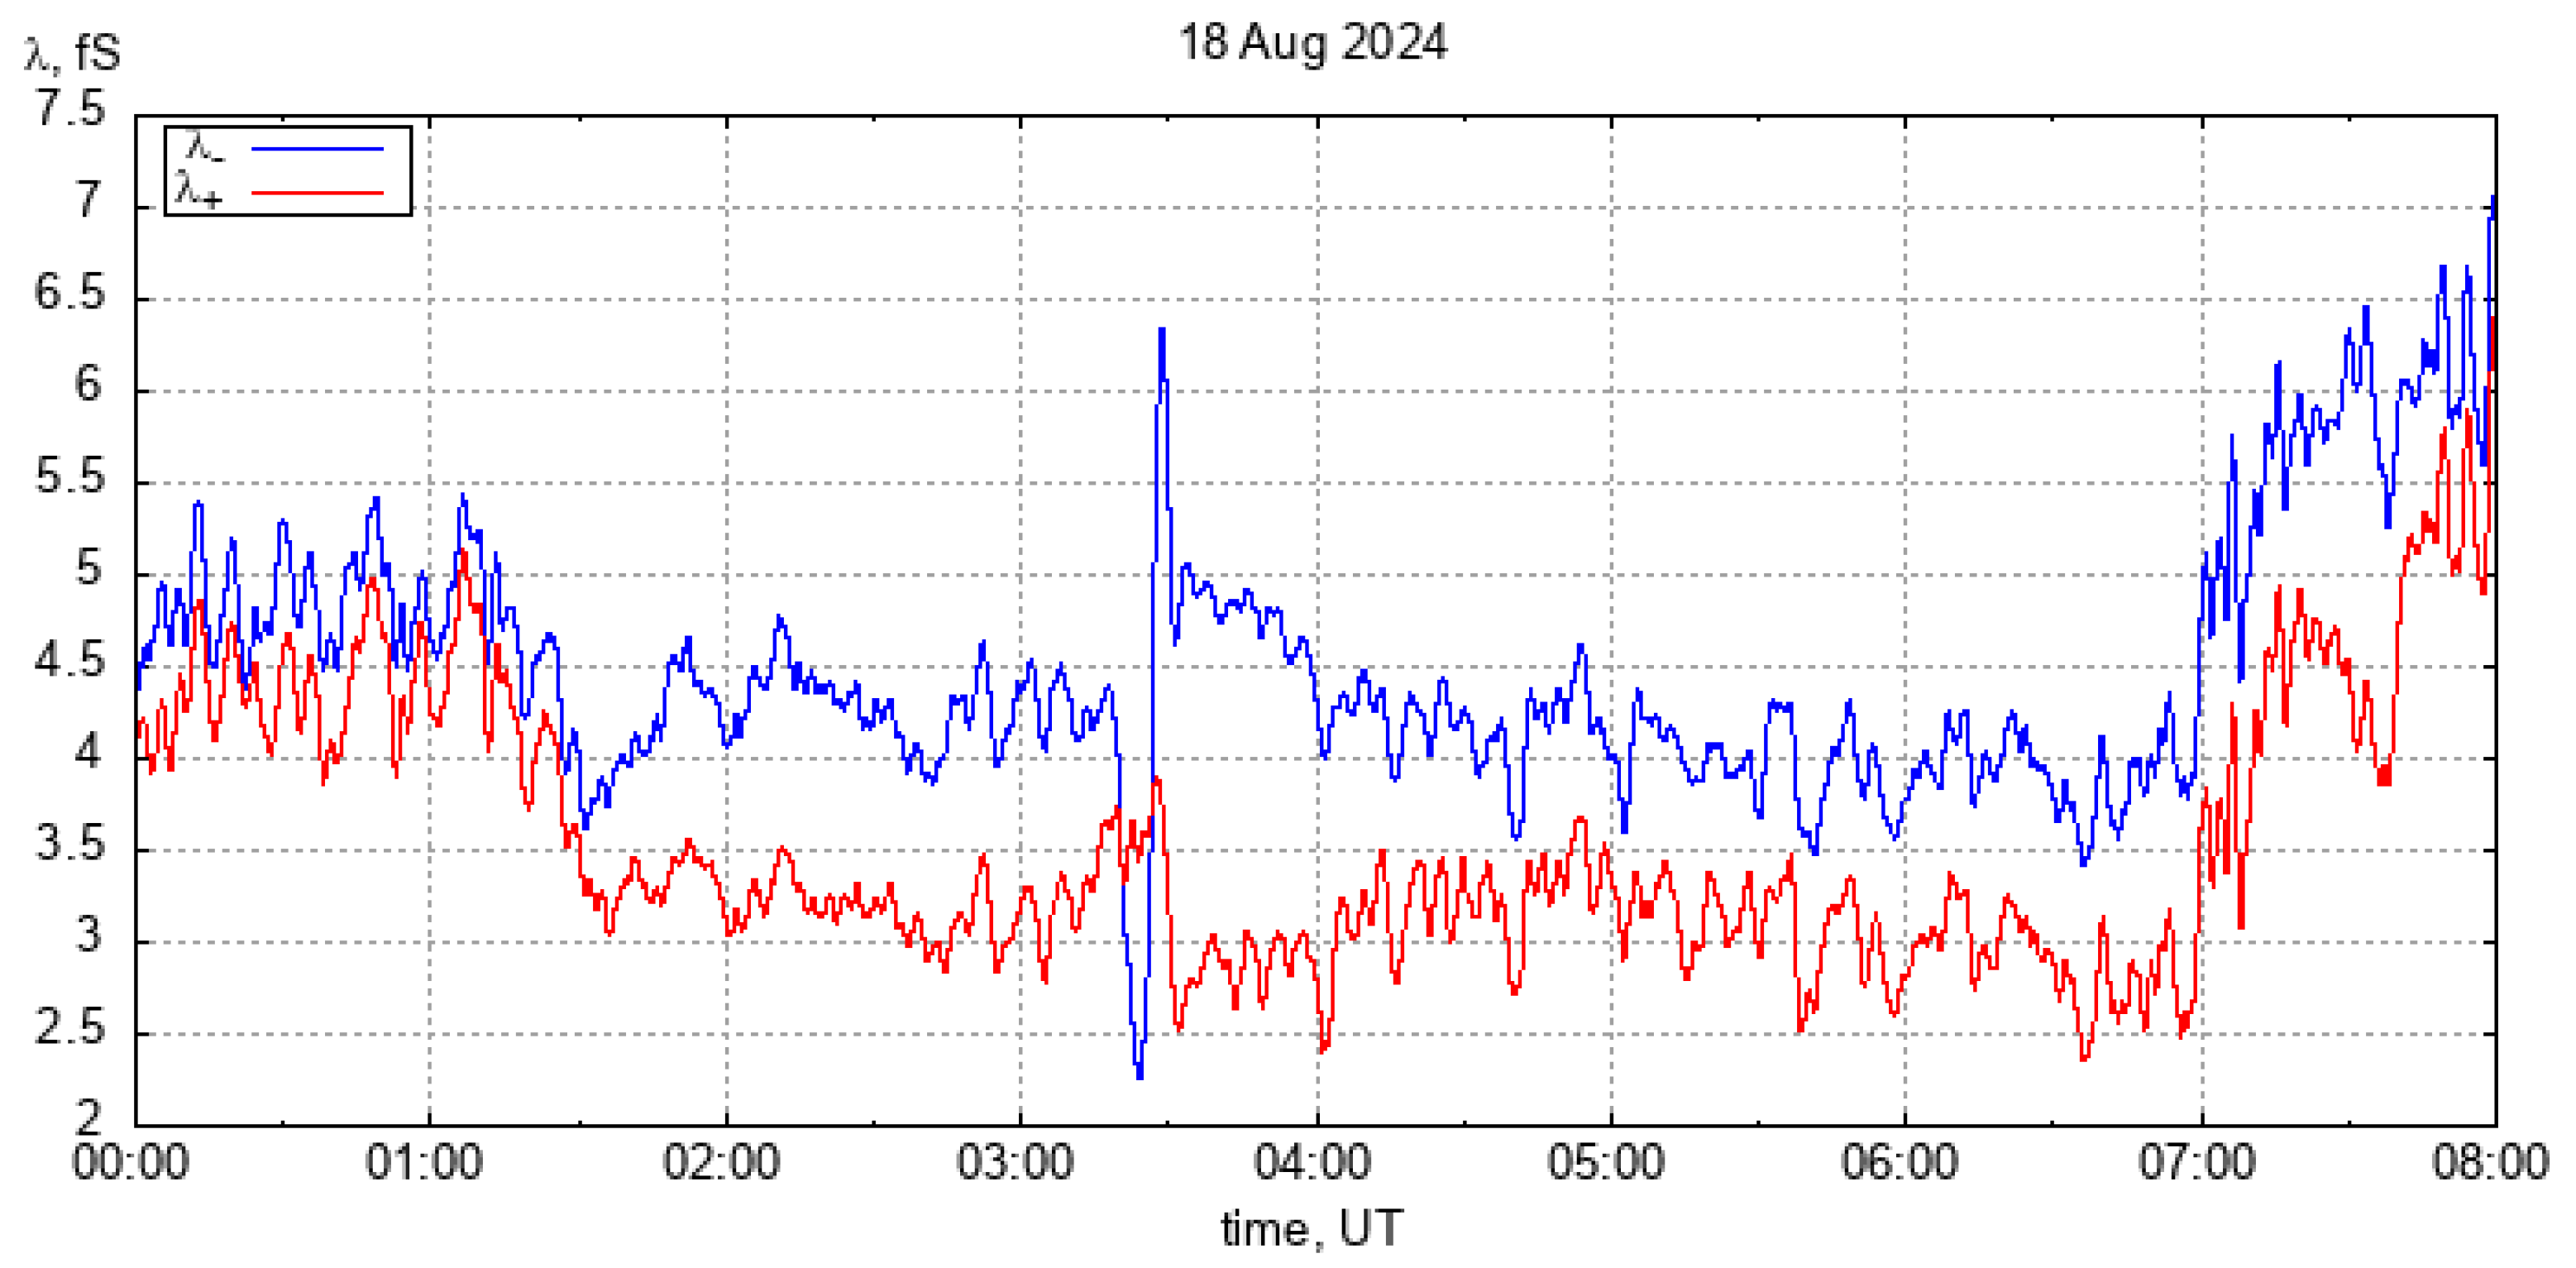
Figure 11.
Examples of vertical ionogram in the beginning at 02:45 UT (a) and the end at 04:15 UT (b) of the anomalous reflection effect.
Figure 11.
Examples of vertical ionogram in the beginning at 02:45 UT (a) and the end at 04:15 UT (b) of the anomalous reflection effect.
Disclaimer/Publisher’s Note: The statements, opinions and data contained in all publications are solely those of the individual author(s) and contributor(s) and not of MDPI and/or the editor(s). MDPI and/or the editor(s) disclaim responsibility for any injury to people or property resulting from any ideas, methods, instructions or products referred to in the content. |
© 2024 by the authors. Licensee MDPI, Basel, Switzerland. This article is an open access article distributed under the terms and conditions of the Creative Commons Attribution (CC BY) license (http://creativecommons.org/licenses/by/4.0/).
Copyright: This open access article is published under a Creative Commons CC BY 4.0 license, which permit the free download, distribution, and reuse, provided that the author and preprint are cited in any reuse.


