Preprint
Review

This version is not peer-reviewed.

Deuterium Oxide Dilution Method to Quantify Human Milk Intake Volume of Infants: Systematic Review – A Contribution from the ConcePTION Project

A peer-reviewed article of this preprint also exists.

Submitted:

18 November 2024

Posted:

19 November 2024

You are already at the latest version

Abstract

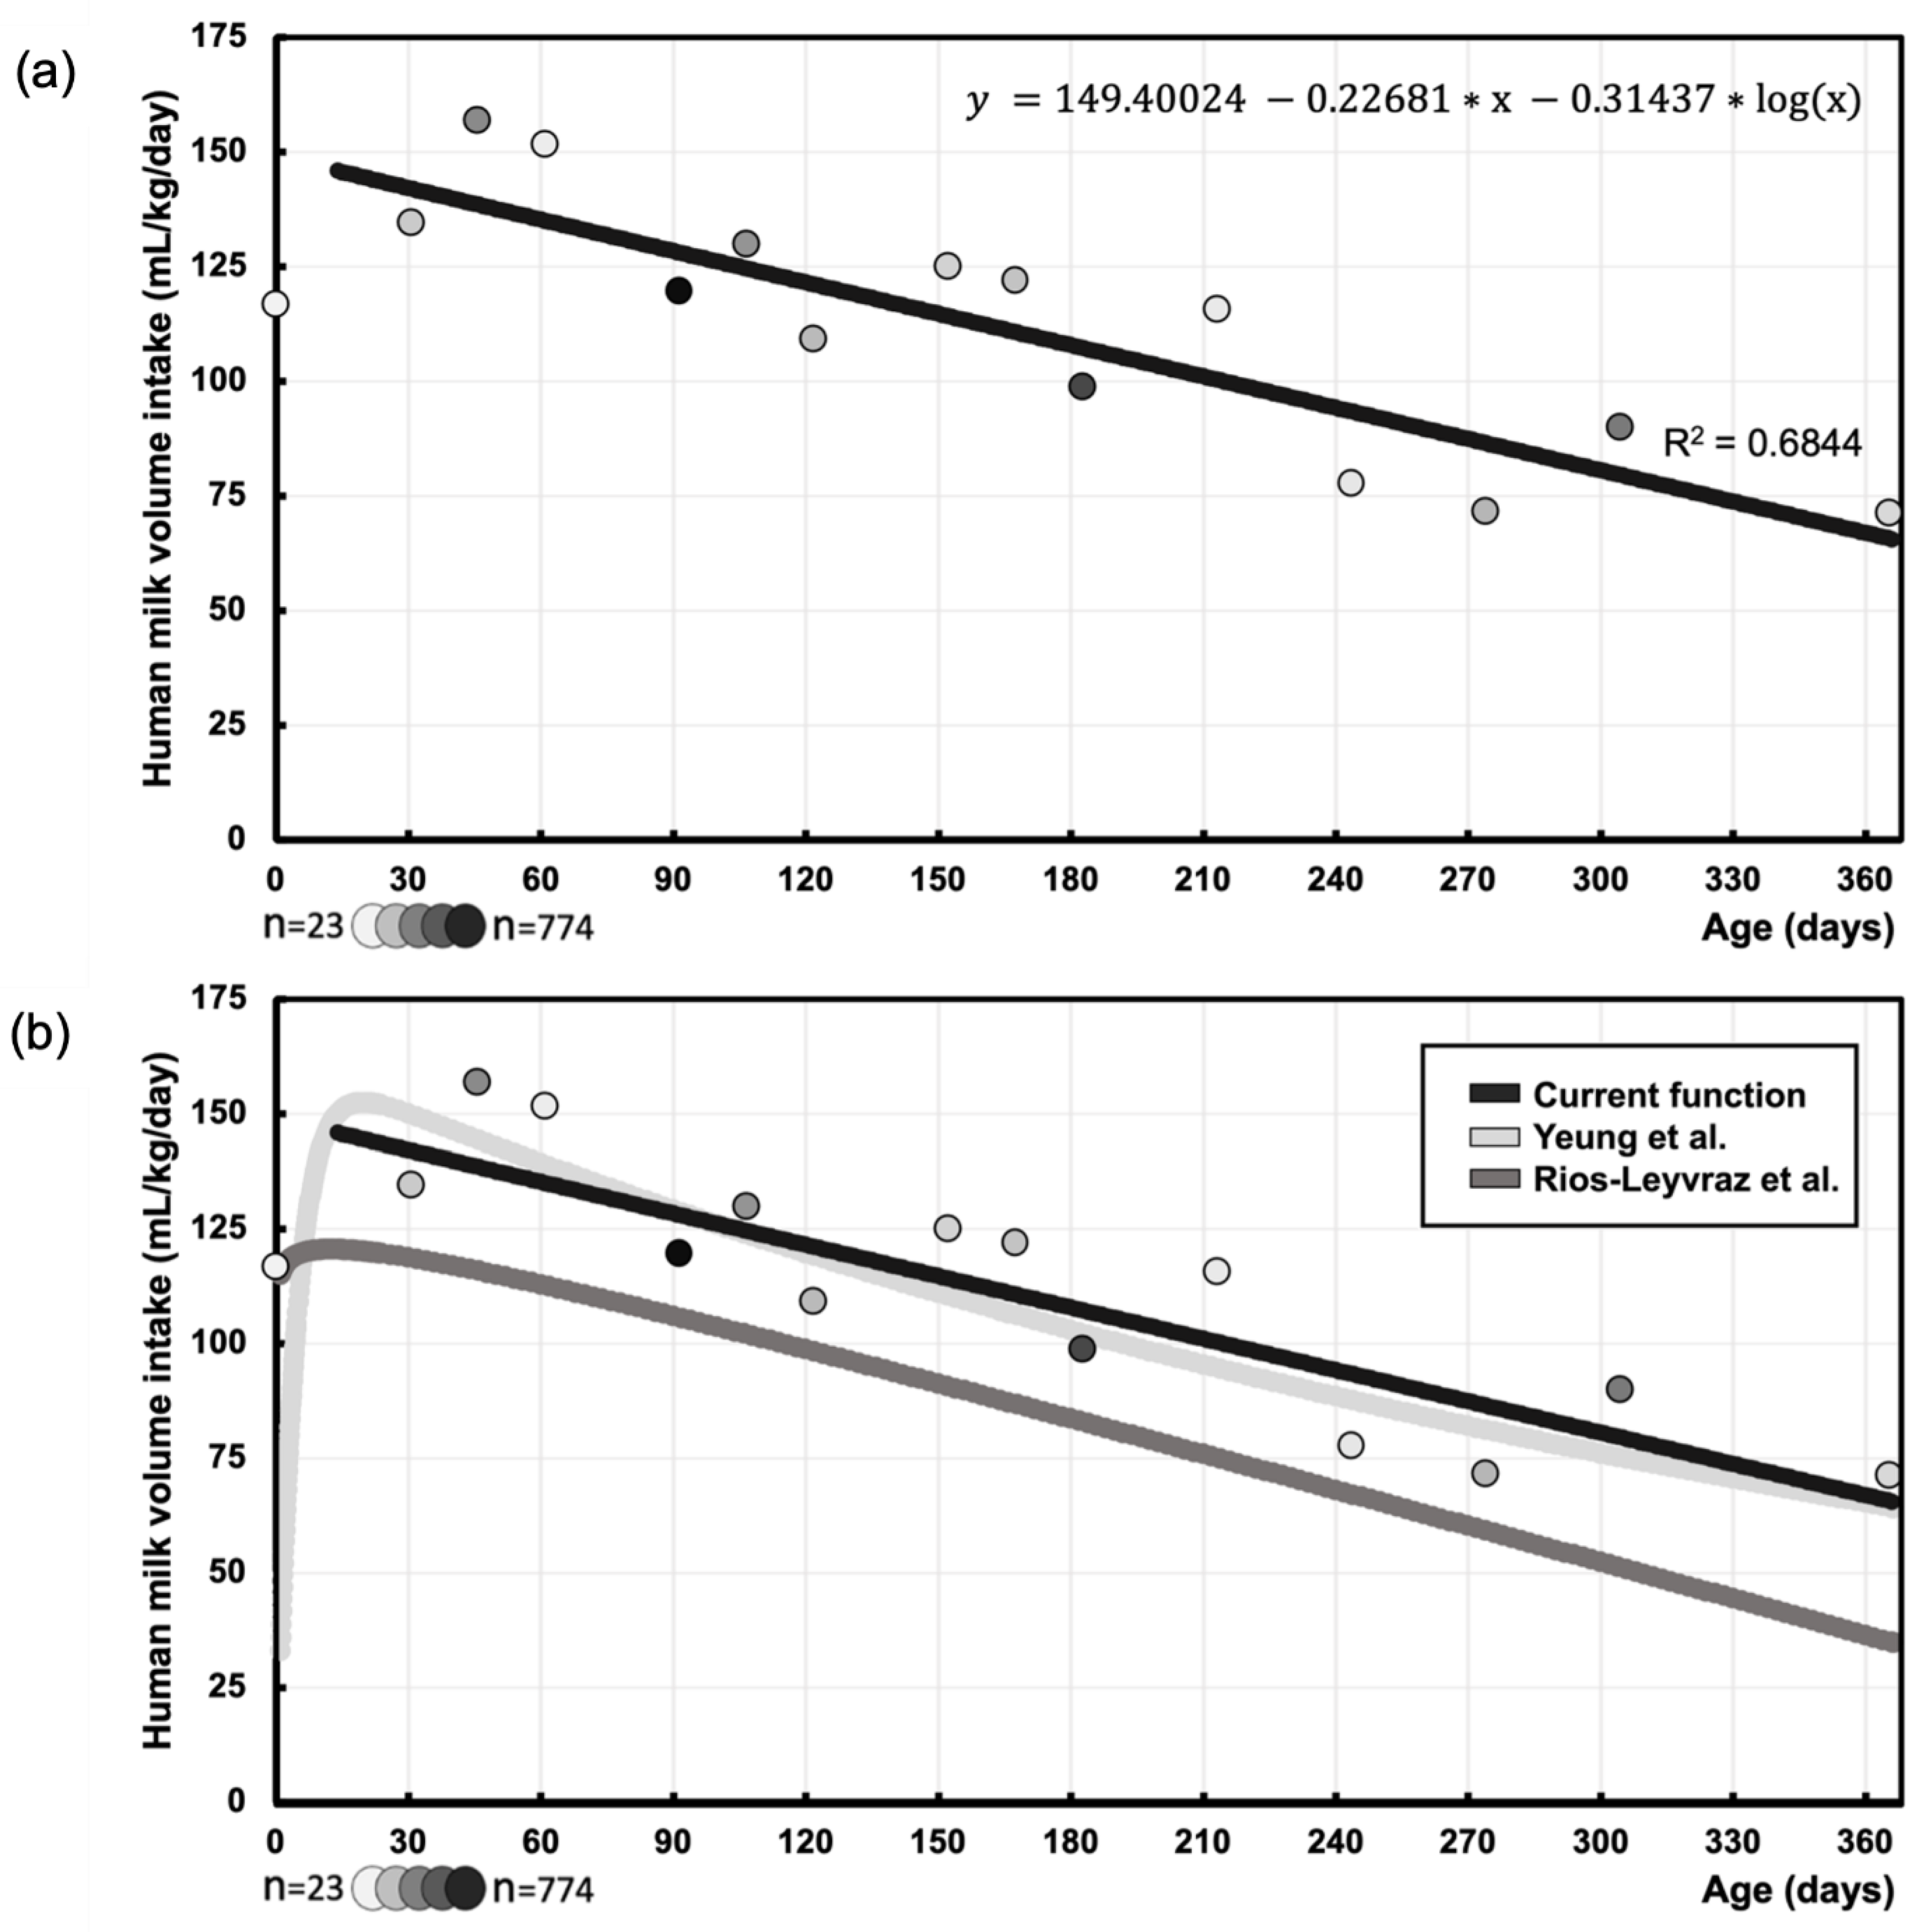
Background: Global health organizations recommend breastfeeding, but maternal pharmacotherapy can disrupt this due to safety concerns. Physiologically-based pharmacokinetic (PBPK) models predict medication transfer through breastfeeding, relying on validated milk intake volume data. However, literature mainly focused on different measurement methods, or such intake data were collected without systematic review. This systematic review therefore aims to gather data on human milk intake volume derived using the (dose-to-the-mother) deuterium oxide dilution method, allowing comparison with literature. Additionally, it aims to explore effects of maternal conditions on milk intake volume. Methods: PubMed, Embase, Web of science, Cochrane library, Scopus and CINAHL were searched for studies on the dilution method and breastfeeding in healthy infants. Risk of Bias was assessed using the Newcastle-Ottawa Scale (NOS) and the Risk of Bias 2 (RoB2) tool. Data on mean human milk intake volume were extracted and synthesized (mL/day and mL/kg/day) throughout infancy. Results: Sixty studies (34 countries) reported on milk intake volume of 5502 infants. This intake was best described by logarithmic regression y(mL/kg/day) = 149.4002 -0.2268*x -0.1365*log(x) (x=postnatal age, days). Maternal conditions showed no significant influence on human milk intake, except for maternal smoking (reduction). Conclusion: This function corresponds with previous literature, particularly between 1.5 to 12 months. Limited availability of early infancy data underscores the need for additional data in future PBPK modelling to enhance informed healthcare decisions and improved outcomes for mother and infant.

Keywords: 
;  ;  ;  ;  ;  ;  

1. Introduction

The World Health Organization (WHO) emphasizes the importance of breastfeeding, recommending exclusive breastfeeding up to six months of age followed by partial breastfeeding until two years of age or longer [1]. This approach has been proven to be beneficial for the infant, e.g., reducing the risk of gastro-intestinal infections or leukemia in early life and lasting advantages later in life [1,2]. Breastfeeding also provides various health benefits to the mother, including a lower risk of ovarian and breast cancer [2]. From six months of age, breastfeeding should be complemented with additional food sources, as the nutritional needs of the growing infant are no longer adequately met through exclusive breastfeeding alone [1]. Despite these WHO recommendations, not all women breastfeed their infant as long as they desire or intend [3]. Maternal conditions and the resulting decision to start medication can be a reason for preliminary termination of breastfeeding [3]. Furthermore, health care workers may hesitate to prescribe pharmacotherapy or advise to (temporarily) interrupt breastfeeding because of the limited understanding of safety of maternal medication for the nursing infant [4].
To inform shared decision making of patients and health care workers, insights into the extent and safety of medication transferred from mother to infant through human milk are necessary. Clinical lactation studies can provide these insights, but they are commonly costly, logistically challenging, and ethically complex [5]. Therefore, there is room for physiologically based pharmacokinetic (PBPK) models to add to the available evidence [5]. These mathematical models merge physiological population-specific and medication-specific knowledge to predict medication concentrations [5,6]. In this manner, infantile drug exposure can be simulated by multiplying the concentration of medication in human milk with milk intake volume of the infant [5,7].
Mother-infant PBPK models rely on accurate physiological data input, which are frequently lacking [5,6]. Among these variables, knowledge about the human milk intake volume of the infant is crucial [5,7]. The two most widely used techniques to quantify this variable are the (dose-to-the mother) deuterium oxide dilution method and the test-weighing method [8,9]. In the 14-day deuterium oxide dilution method, a small and deemed safe quantity of deuterium oxide (e.g., 30 g of 99.8% 2H) is orally administered to the mother, dispersing to the infant through breastfeeding [8]. This method then imputes the measured infantile and maternal deuterium concentration in saliva (or urine) collected on day 1, 2, 3, 4, 13 and 14, into a theoretical model of water turnover in the mother-infant entity. This way the method can estimate human milk intake volume over the course of two weeks [8]. Differently, the test-weighing method compares the infantile weight before and after feeding to quantify milk intake [9]. However this method is prone to systematic errors when improper scales or procedures are selected [10]. The limitations of this method are possibly more present in young infants, where human milk intake volume quantities are low [11]. In contrast, the deuterium oxide dilution method has been found to be especially effective in infants up to six months of age without disturbing normal feeding behavior [8,9].
Previously published literature often combined data from the test-weighing and deuterium oxide dilution method or is rather based on comprehensive reviews [7,12,13,14]. We are unaware of a systematic review on the available data of the deuterium oxide dilution method.
Consequently, we aimed to systematically collect available data from clinical studies that report human milk volumes solely using the deuterium oxide dilution method at different postnatal ages. These data are used to develop a function describing human milk intake volume over postnatal age and thus allowing a comparison to previously described functions by Yeung et al. or Rios-Leyvraz et al. [7,14].
Additionally, we analyzed the effects of specific maternal conditions (e.g., human immunodeficiency virus (HIV) status, morbidity characteristics, smoking) on human milk intake volume of healthy infants. Hereby, this review can provide valuable input for mother-infant PBPK models, contributing to a deeper understanding of human milk intake volume at different infancy stages. Ultimately, this can advance infant medication safety during breastfeeding, enabling shared healthcare decisions and improved outcomes for both mother and infant.

2. Materials and Methods

This systematic review was registered in the International Prospective Register of Systematic Reviews (PROSPERO, CRD42022380374) [15]. This review was conducted to assess published scientific literature on human milk intake volume in accordance with the Preferred Reporting Items for Systematic Reviews and Meta Analyses (PRISMA) guidelines (see supplementary files) [16]. Supplementary materials on search strategy, quality assessment, pooling formula, data extraction and synthesis are available.

2.1. Inclusion and Exclusion Criteria

Eligible articles were primary studies reporting human milk intake volume using the dose-to-mother deuterium oxide dilution method in breastfed infants up to one year of age. The data on exclusive breastfeeding up to six months of age was of primary interest.
Available articles in English were included without restrictions on publication date, country of recruited participants, or ethnicity. Conference abstracts were excluded in our systematic review. Additionally, infants recruited with medical conditions affecting human milk intake volume were excluded, based on the definition of (un)healthy infants as applied in the retained studies. There were no limitations on studies reporting the incidental sickness of infants during the study, nor was there a limitation on maternal medical conditions or maternal weight. Preterm infants were excluded, with the used definition of being born prior to 36 weeks of completed gestation (< 36 weeks gestational age) to accommodate divergent global definitions. There was no limitation on infantile weight, except for studies only including infants small for gestational age, as these were excluded. These criteria were separately evaluated for both control and intervention groups in controlled trials.

2.2. Search Strategy

The search strategy was developed in consultation with the Biomedical Sciences Library of KU Leuven (Leuven, Belgium). Six scientific databases were searched on April 15th, 2023, i.e., PubMed, Embase, Web of science, Cochrane library, Scopus and CINAHL. No unpublished studies or grey literature were searched. The search string (Supplementary Table S1) consisted of two concepts that were subsequently merged, being the deuterium oxide dilution method and breastfeeding.

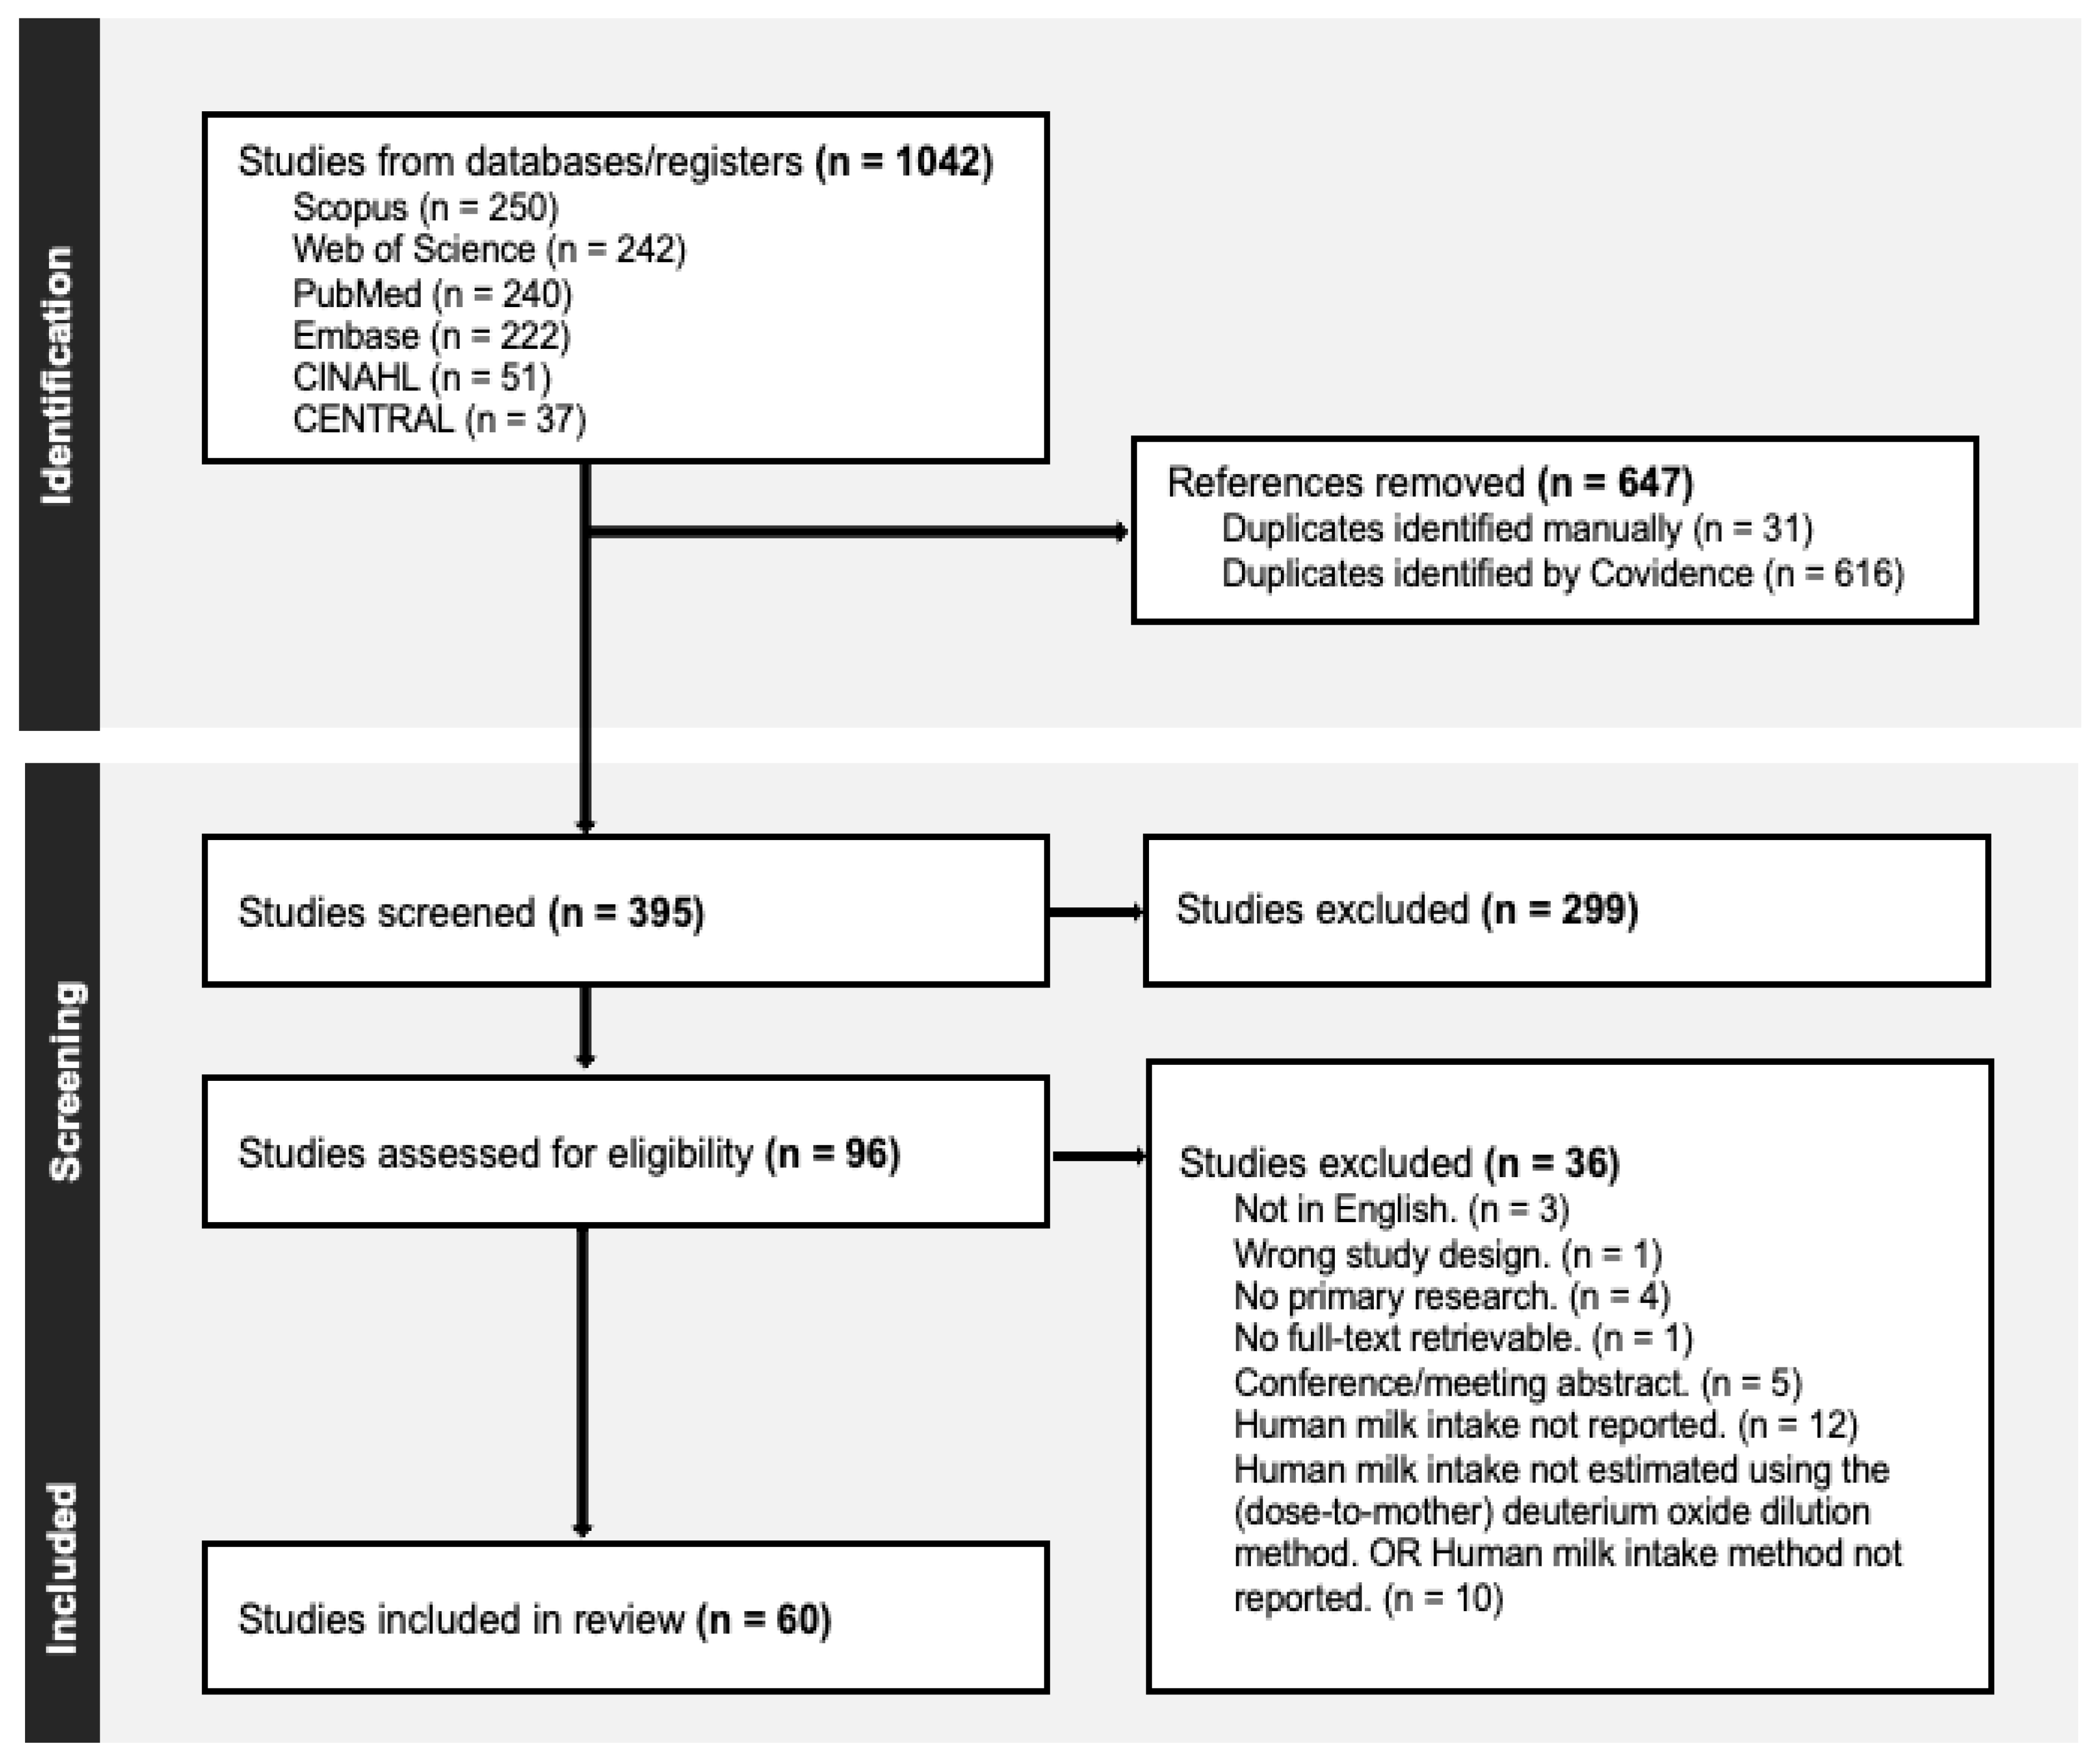
2.3. Screening Process and Quality Assessment

Articles derived from the databases using the search string were imported into Covidence, a review management software tool [17]. Duplications were automatically removed and subsequently checked manually by one researcher (L.C.). In the first phase, title and abstract were screened in accordance with the eligibility criteria by two researchers (L.C., M.V.N.) working separately. In the second phase, the full text of the selected articles was separately reviewed using the same methodology. In the case of any disagreement during either phase, a third researcher (K.A.) was consulted for the final and independent decision.
Quality assessment was performed by two researchers (L.C., K.A.), with involvement of a third researcher (M.V.N.) in case of disagreement, using the adapted Newcastle-Ottawa scale (NOS) for cohort and cross-sectional studies (Supplementary Table S2 and S3) [18]. Quality was assessed regarding the used deuterium oxide dilution method, where cohort studies were defined as using the method in different cohorts and preferably as repeated measures within cohorts. The Risk of Bias (ROB) 2 tool was used for bias assessment of the randomized controlled trials (Supplementary Table S4) [19].

2.3. Data Extraction and Synthesis

Data extraction was performed using a structured extraction form in Microsoft Excel (version 16.81). Extraction was performed by one researcher (K.A., L.C.) with subsequent verification by a second researcher (M.V.N., or K.A.) respectively. Extraction of primary interest included the human milk intake volume and infantile weight with their sample sizes, at the reported postnatal age. The secondary data of interest encompassed variables such as the country of study, maternal weight, age, conditions, infantile gestational age, and birth weight.
During synthesis, data were retained once per cohort and deuterium measurement period, by merging articles on likely shared cohorts. We pooled secondary variables to describe the mother-infant pairs as accurately as possible (pooling formula in Supplementary Table S5) [20,21]. Standard errors and confidence intervals were converted to standard deviations (SD) [22]. In the event that human milk intake volume (mean ± SD) was not reported in mL/day or mL/kg/day, values were converted from g/day or g/kg/day using the density of breast milk (1.03 g/mL) [7]. Additionally, the mean human milk intake volume was converted from mL/day to mL/kg/day using the given mean infant weight. To estimate the SD of these newly calculated means the propagation of uncertainty principle was used, assuming independence of errors between weight and human milk intake volume [23]. If the postnatal age of infants was unavailable, but the day of the deuterium dose could be inferred (from the text, figures or tables), we chose the midpoint of the deuterium measurement period (day 7 of 14).
All mean milk intake volumes of cohorts were individually plotted in a graph and further pooled at every month during the first year of life, together with the available SD [20,21]. Additional intermediate time points were calculated depending on the relative sample sizes of the cohorts. A non-linear regression was fitted using the RStudio (version 2023.12.1+402) to construct a logarithmic function based on the function used in Rios-Leyvraz et al., allowing the comparison to Yeung et al. or Rios-Leyvraz et al. [7,14].

3. Results

A total of 1042 articles from the six databases were derived. After duplicate removal, 395 articles had to be screened (PRISMA flow diagram - Figure 1)[16,17]. After screening of title and abstract, 96 articles were retained for full text assessment. Subsequently, 36 articles were excluded, predominantly because articles did not report human milk intake volume (n=12) or did not report the use of the dose-to-the-mother deuterium oxide dilution method (n=10). This resulted in a total of 60 included articles.
After deciding on the study design and selecting the preferred quality assessment template, included articles were assessed on quality and risk of bias. Sixteen articles were classified as cohort studies and another 33 cross-sectionally studied human milk intake volume (Supplementary Table S2 and S3). The remaining 11 studies were randomized controlled trails (Supplementary Table S4). The mean score on the NOS-scale for cohort studies was 7.6 out of 9 points (good quality), with the lowest score being 6 out of 9 points [18]. Cross-sectional studies obtained a mean score of 5.1 out of 7 points, with the lowest score being 4 out of 7 [18]. All 11 randomized controlled trails were of good quality with an overall low risk of bias [19].
Of all 60 articles included, ten articles were merged into five datasets. This decision was based on the interpretation that these articles reported on the same cohort and deuterium oxide dilution results. One study cohort was excluded as it only contained infants born small for gestational age [24]. Two studies reported data as median and interquartile range, disabling further data synthesis [25,26].
Studies were conducted in 34 different countries, on six continents (Supplementary Table S6): Africa (42.6%), Asia (21.3%), South America (14.8%), North America (13.1%), Europe (4.9%) or Oceania (3.3%). The pooled mean age of mothers (mean ± SD) was 26.8 ± 5.7 years, obtained from studies reporting on this at any point during the study (involving 3842 mothers). Similarly, the pooled mean weight of mothers (mean ± SD) reported at any point during the study was 57.5 ± 10 kg (involving 2595 mothers). Mothers breastfed their infants either exclusively or non-exclusively (predominantly or partially). This vastly differed between cohorts and the infantile postnatal age.

3.1. Human Milk Intake Volume – mL/day

A total of 152 datapoints were derived, representing the mean human milk intake volume of 5502 exclusively and non-exclusively breastfed infants. For eight datapoints, we were not able to retrieve the matching sample sizes. The data were visualized in Figure 2, displaying the mean human milk intake volume (mL/day) of cohorts at their respective postnatal age (months). The pooled means and SD of human milk intake volume were calculated at intermediate time points during the first year of life (Figure 3 and Table 1).

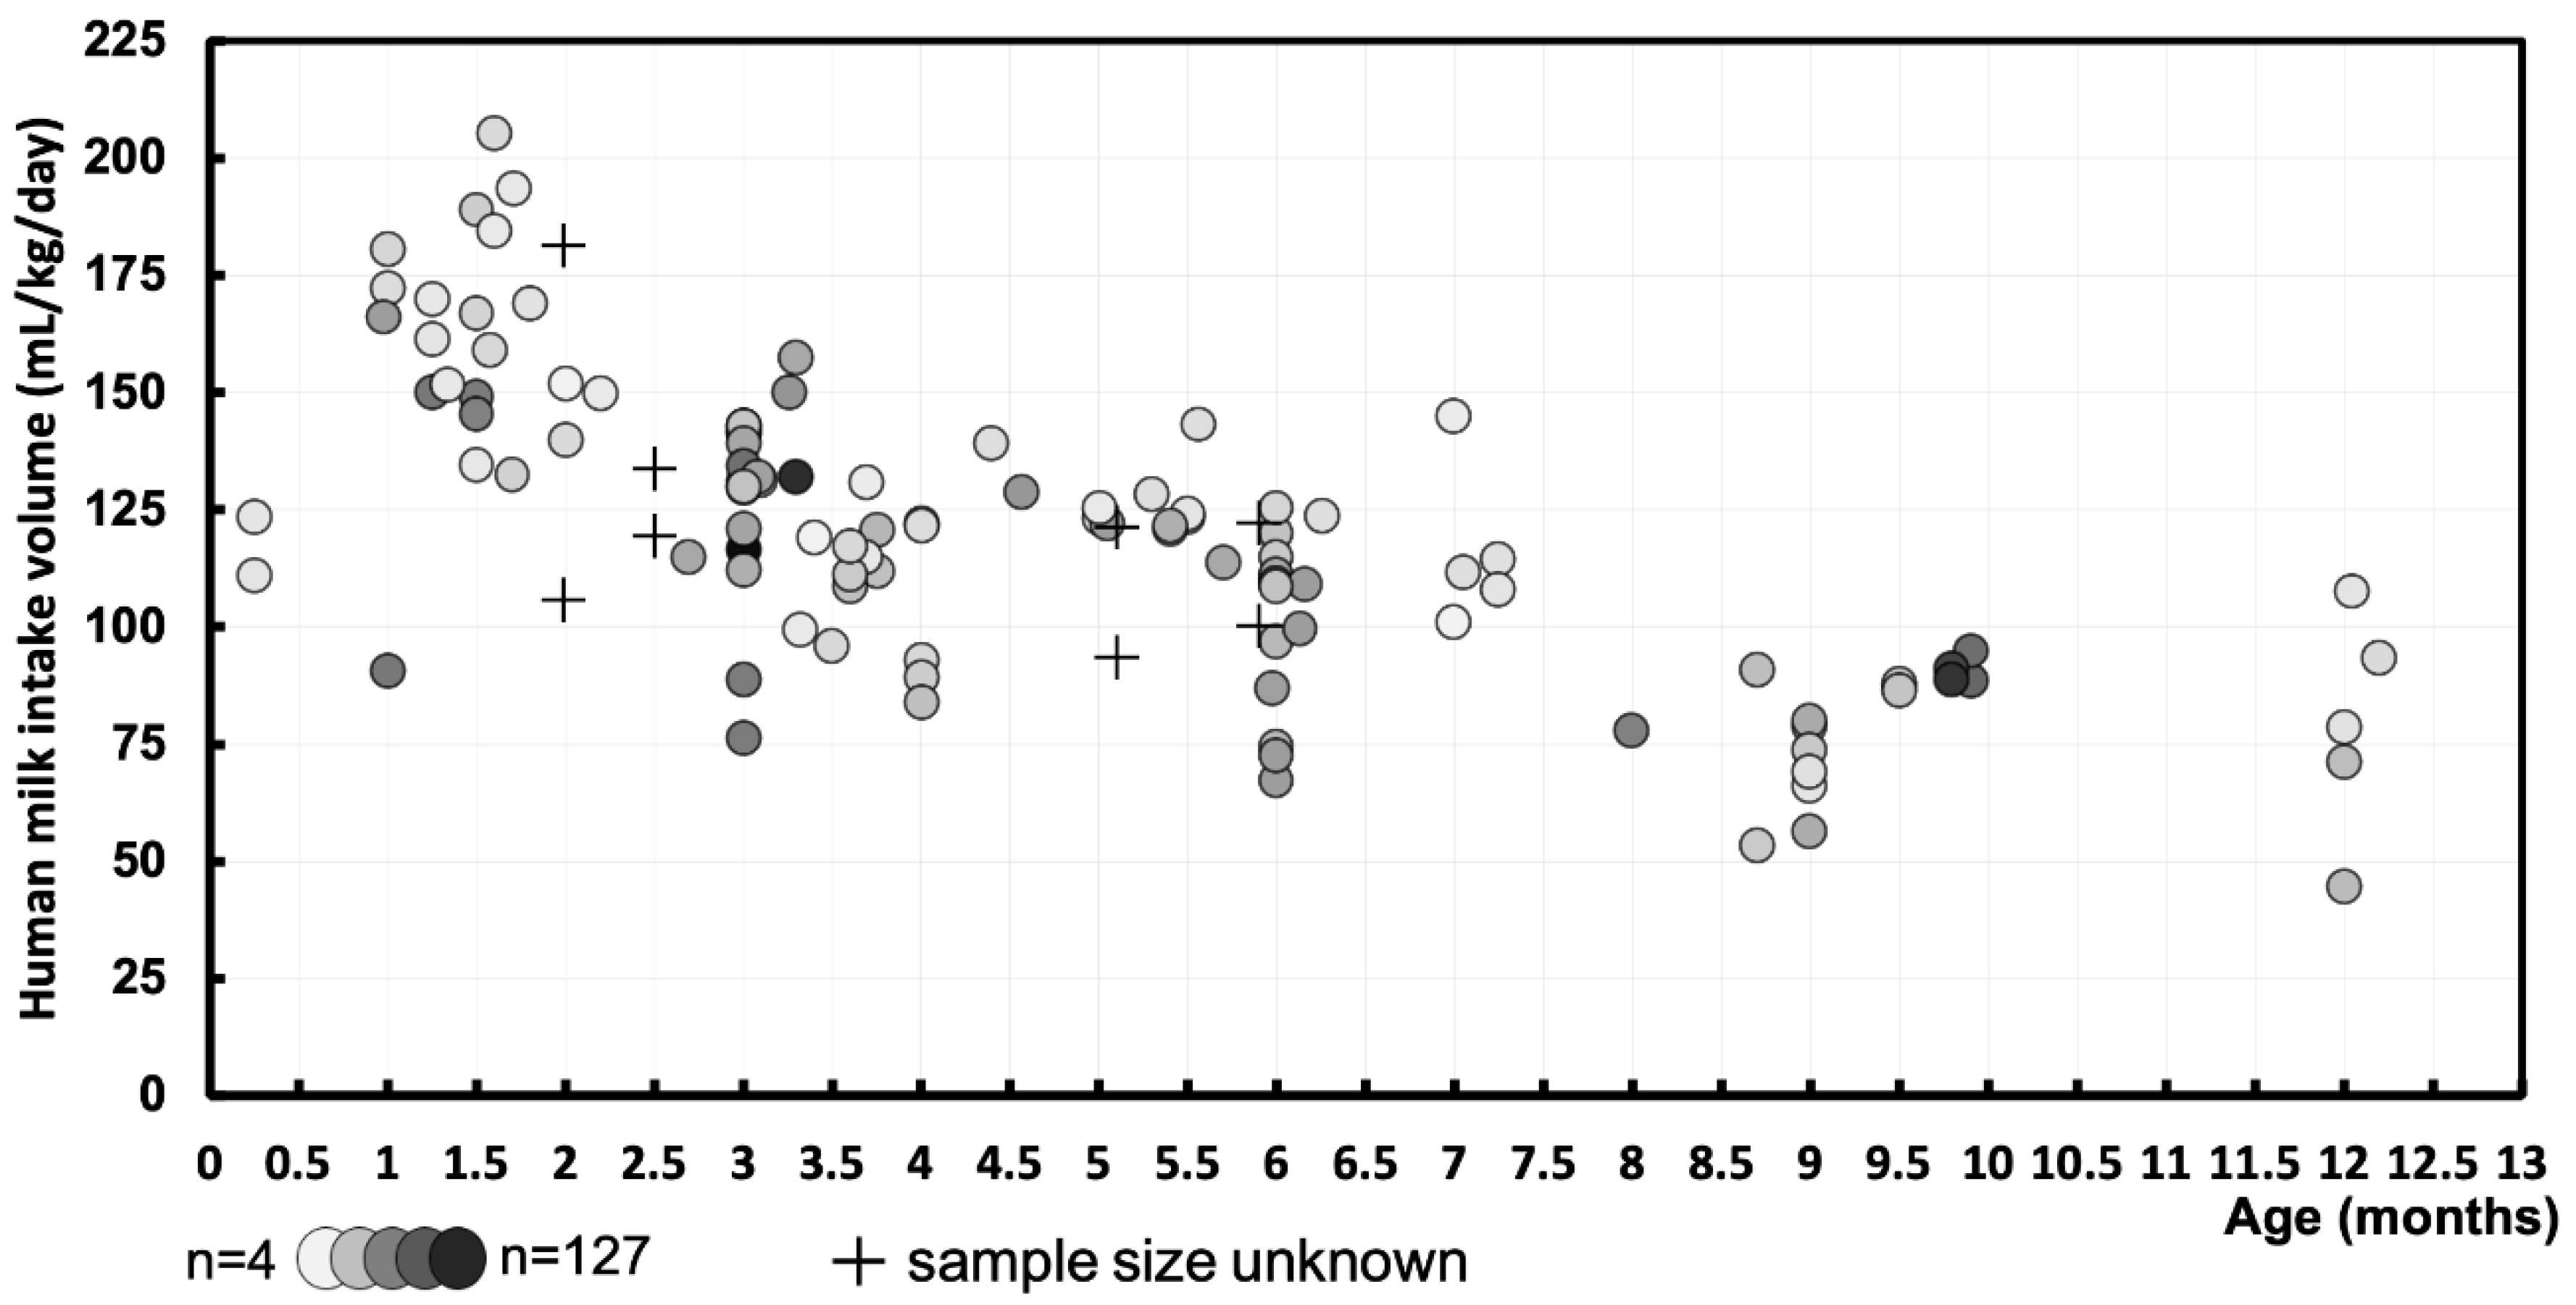
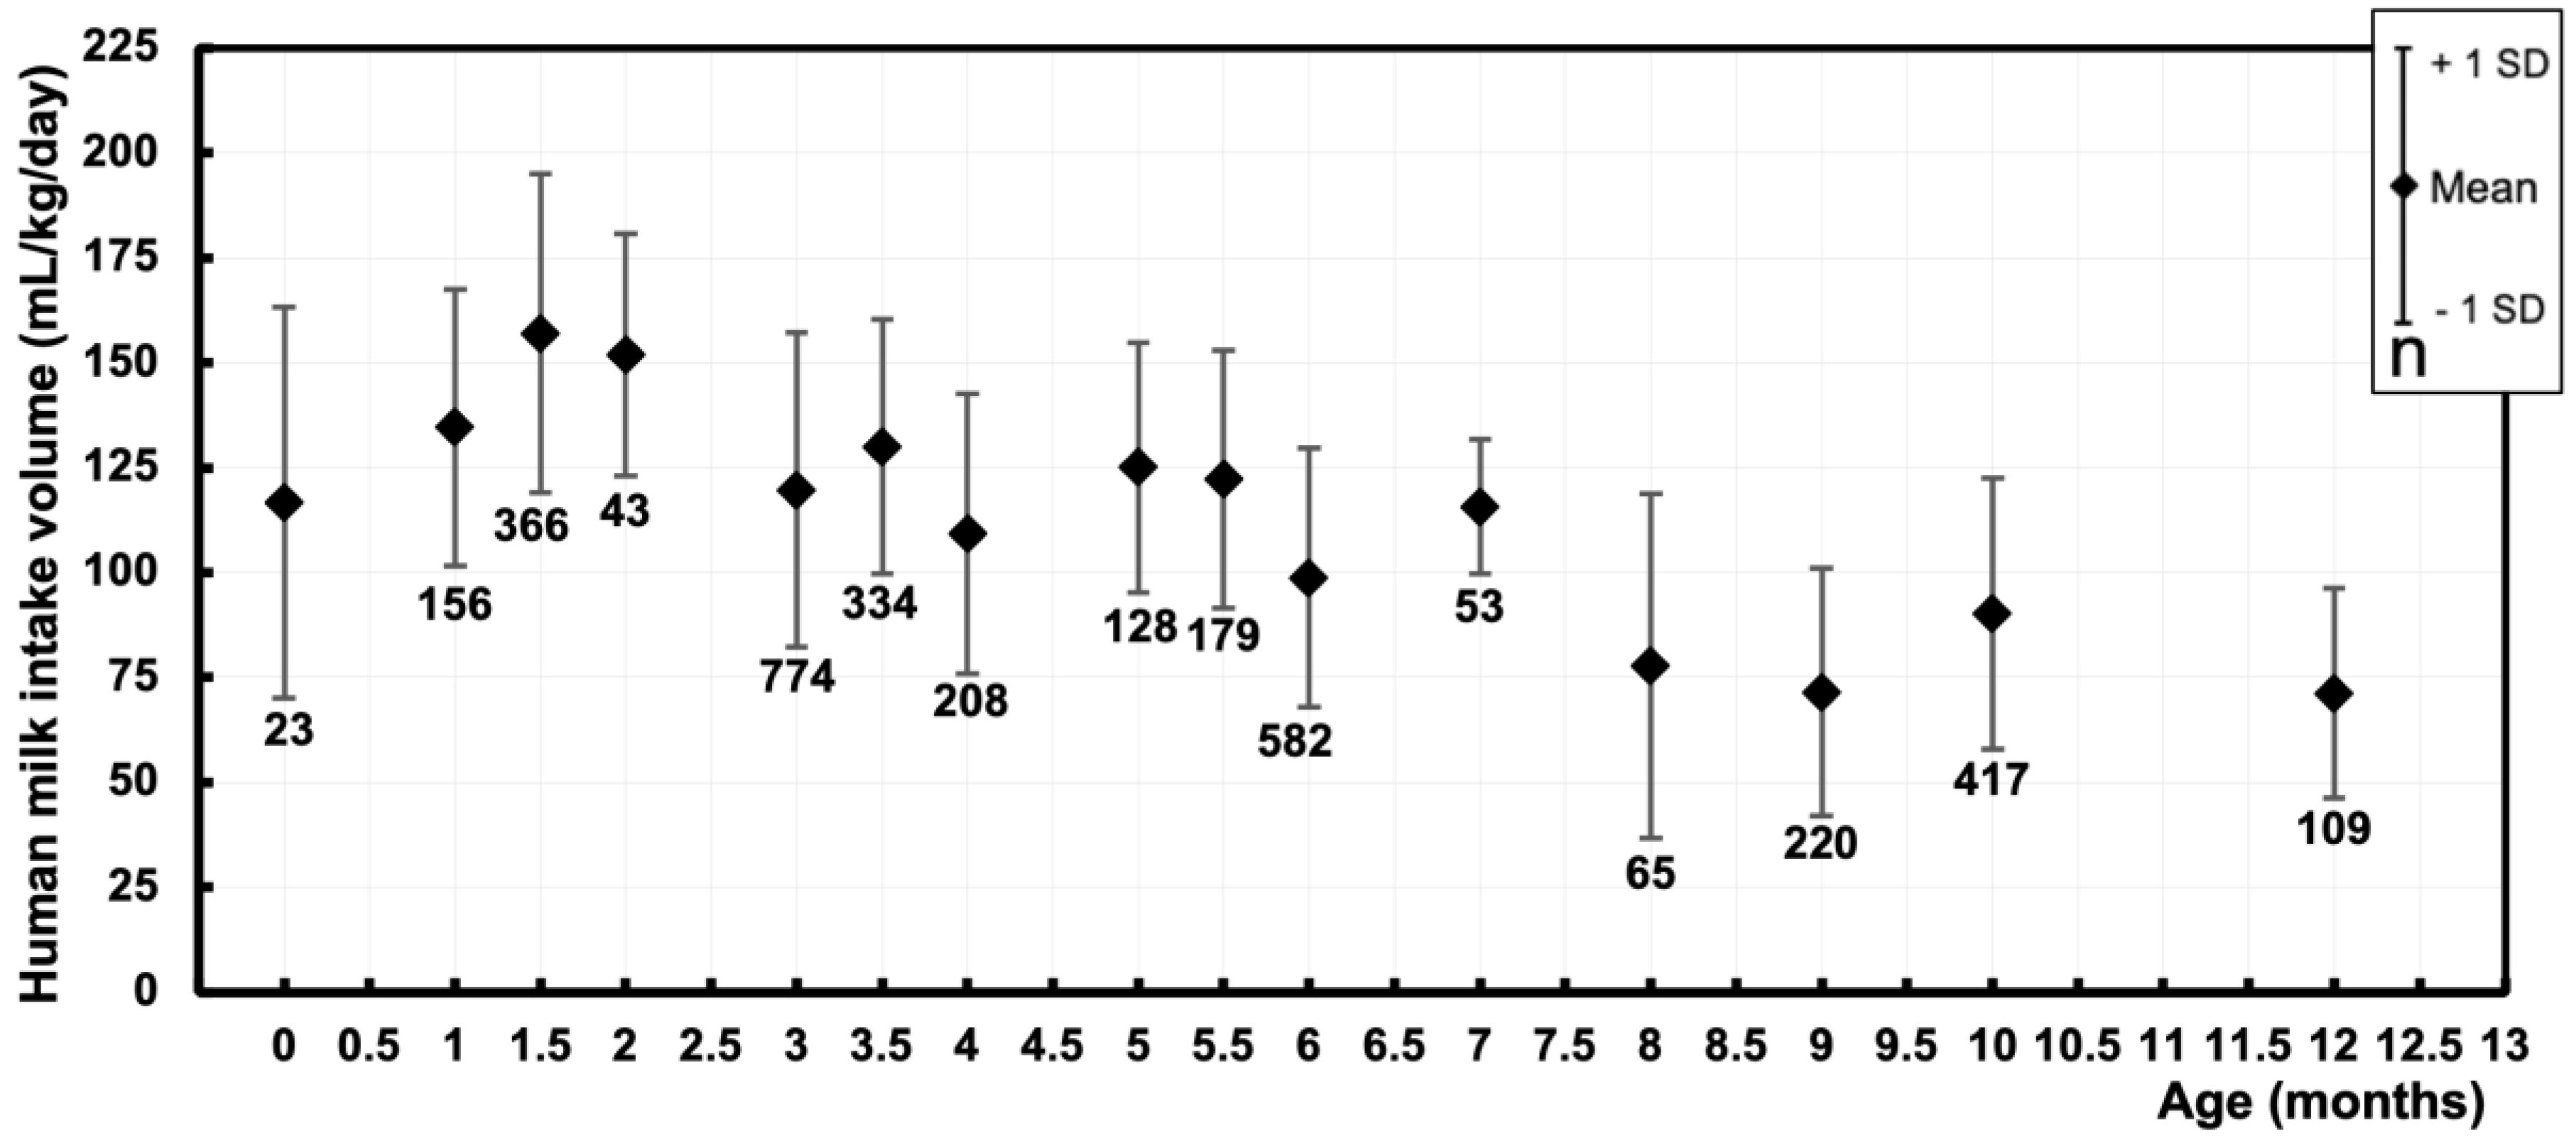
3.2. Human Milk Intake Volume – mL/kg/day

A total of 111 datapoints were derived, representing the mean human milk intake volume of 3657 exclusively and non-exclusively breastfed infants. For 8 datapoints, we were not able to retrieve the matching sample sizes. The data were visualized in a graph (Figure 4), displaying the mean human milk intake volume (mL/kg/day) of cohorts at their respective postnatal age (months). The pooled means and SD of human milk intake volume were calculated at intermediate time points of the first year of life (Figure 5 and Table 2).

3.2. Function of Human Milk Intake Volume (mL/kg/day) Over Postnatal Age (days)

The function of pooled mean human milk intake volume (ml/kg/day) over postnatal age in days is best described by the following function (Equation (1)), as shown in Figure 6:
y   ( m L / k g / d a y ) = 149.40024 0.22681 x 0.31437 l o g ( x )
This logarithmic regression has an R-squared value of 0.68, depicted in the Figure 6. Here, the current function can be compared to the non-linear regression derived by Yeung et al. and Rios-Leyvraz et al. [7,14].

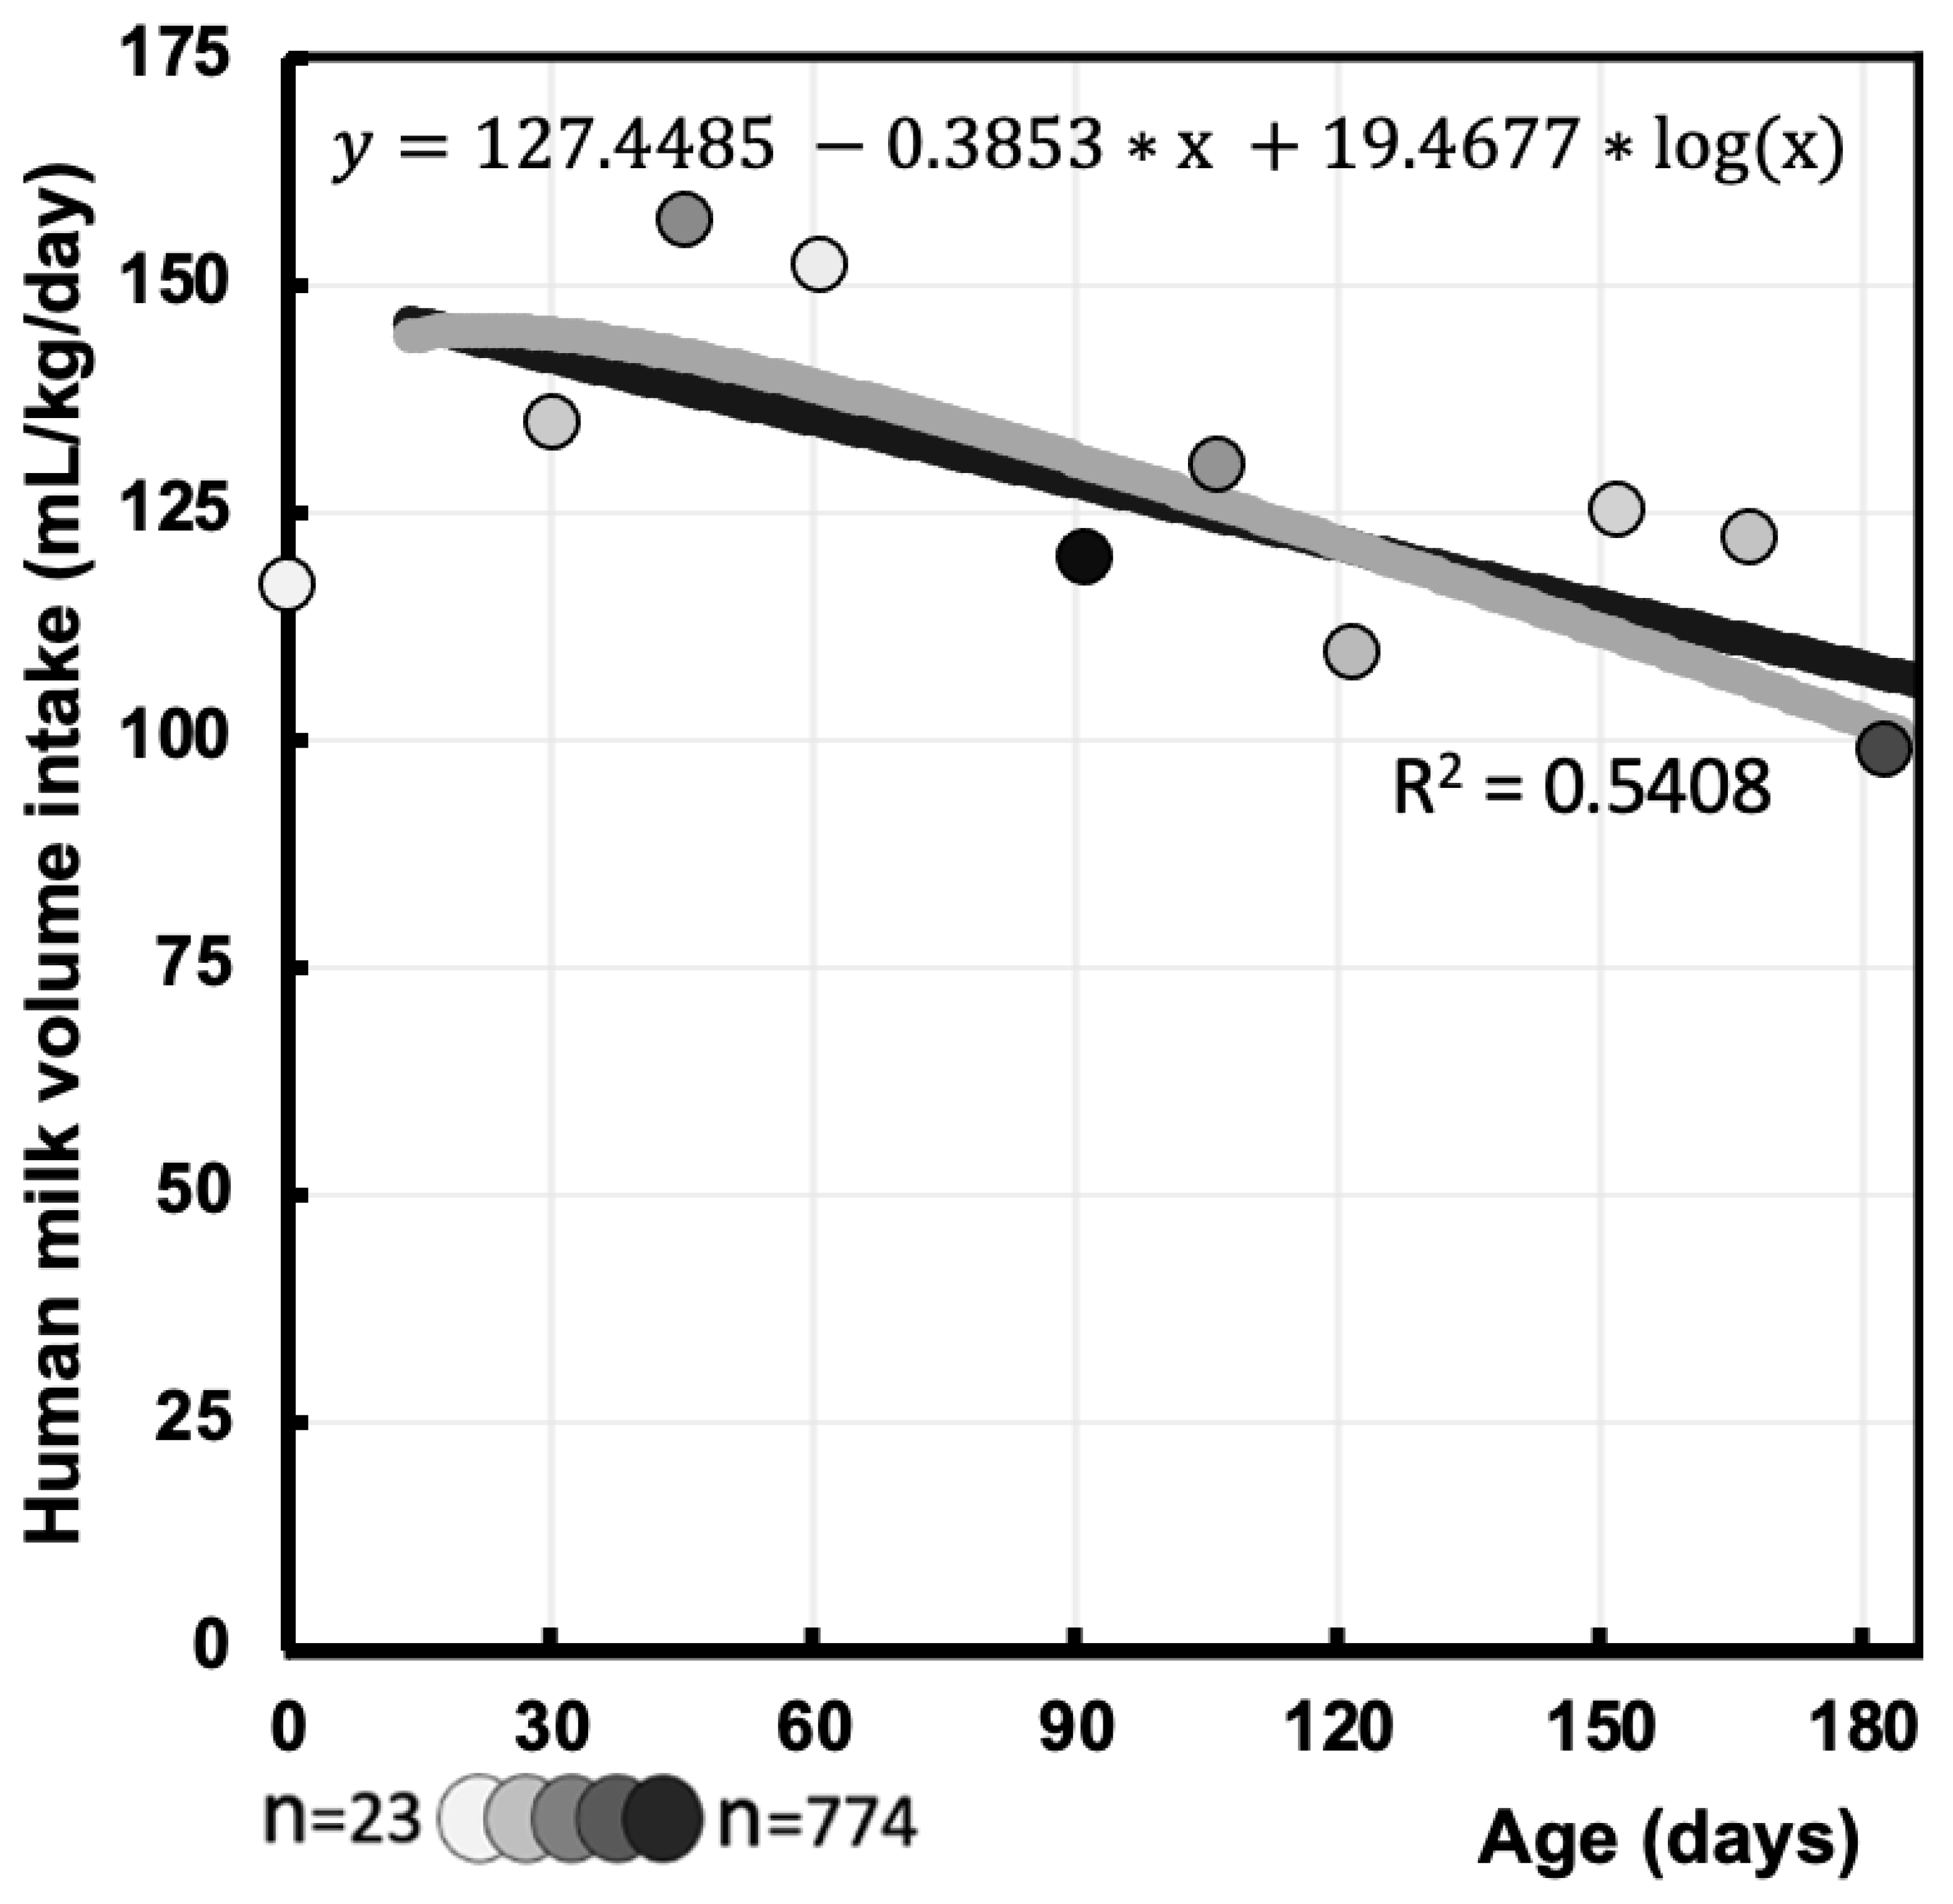
3.3. Human Milk Intake Volume Function (mL/kg/day) During First 6 Months

In this review, we primarily focused on human milk intake volume during the first 6 months of age. Most of the collected data from infants in this review were up to 6 months of age (predominantly at 6 weeks, 3 and 6 months) and thus matched our primary interest period. Logarithmic regression performed during the primary interest period up to 6 months yielded the following function (Equation (2)), as depicted in Figure 7:
y   ( m L / k g / d a y ) = 127.4485 0.3853 x + 19.4677 l o g ( x )
With x= postnatal age in days; this logarithmic regression reproduces a R-squared of 0.54.

3.4. Maternal Conditions and Interventions Effects on Human Milk Intake Volume

Two African studies reporting on maternal HIV-status in relation to human milk intake volume did not show significant differences at both the 1.5 and 6 month measurement periods (Table 3) [27,28]. Furthermore, one of these studies confirmed this non-significance at the 3, 9 and 12 month measurement periods [27].
A study on the presence of perinatal depression among Pakistani mothers neither showed any significant difference in human milk intake volume at 4 months of age [29]. In contrast, Chilean mothers who smoked (≥ 4 cigarettes per day) during pregnancy and breastfeeding did show a significantly (p<0.0001) lower human milk intake volume [30].
An intervention of postpartal deworming with Albendazole in Peru showed no significant lower human milk intake volume compared to control mothers [31].

4. Discussion

This systematic review reported on human milk intake volume of approximately 5502 infants being either exclusively or non-exclusively breastfed during the first year of life. Of the 60 articles included, most cohort studies were of good quality (≥7 points on the NOS-scale) and all included randomized controlled trials had low risk of bias [18,19].
The pooled means of human milk intake volume (mL/day) over postnatal age seemed to reach a convex plateau phase, with the highest pooled mean observed at 5 months old measuring 882.4 ± 181 mL/day. When available data was converted to mL/kg/day, the trendline followed a downward slope. This trend was summarized by a logarithmic regression (Equation (1)):
y   ( m L / k g / d a y ) = 149.4002 0.2268 x 0.31437 l o g ( x )
With x = postnatal age in days. The lowest observed pooled mean was present at the age of 12 months (71.2 ± 25 mL/kg/day), which was rather comparable to the previous function described by Yeung et al. [7]. Visually, our data corresponded well with their function between the ages of 1.5 and 12 months [7].
While the current regression model performed overall well, our function deviated noticeably from Yeung et al. during the first weeks [7]. The current function described the maximal value in the first week of life, while the human milk intake volumes reported by Yeung et al. were considerably lower and reached its maximal value at about 2 weeks of age [7]. These lower intakes are expected in real world practice, as colostrum intake volume in the very first days after birth is low and rising rapidly in the subsequent days [32,33]. This deviation can be attributed to a limitation of the deuterium oxide dilution method, being its 14-day runtime during which multiple saliva (or urine) samples have to be taken [8]. In contrast, the test-weighing method has to be performed within a minimum of 24 hours and can be applied from early neonatal life onwards [34]. Consequently, the test-weighing method is preferred during the first postnatal week(s), which explains the relative underrepresentation of data using the deuterium oxide dilution method in the first weeks of life, thus resulting in a suboptimal regression analysis [11]. Despite the 14-day length of the deuterium oxide dilution method, it was proven to be a usable method in early infancy in one study (starting within the first 48 hours) [35]. Therefore, the current function is not suitable for the first weeks of life, however, our function during the first 6 months of life presents this aspect of early infancy more accurately.
Overall, our systematic review confirms the presence of a high-risk period for medication toxicity due to high human milk intake volume in early infancy [7]. As can be observed in Figure 6, the maximal intake expressed by mL/kg/day occurs in the age window up to 2.5 months. This window has a specific risk as this higher intake holds a risk for medicine accumulation as this co-occurs with a still low drug clearance capacity of the infant [7,36].
In essence, our model converged and surpassed the function described by Yeung et al. after approximately 2 to 3 months [7]. Despite including both exclusively and non-exclusively breastfed infants in our model, equal or higher intakes were observed compared to the exclusively breastfed infants of Yeung et al. [7]. However, lower intakes were expected because the included infants were not exclusively breastfed. As exemplified by the few studies (Supplementary Table S6) that did report separate intakes (per day) for infants with comparable weights, the exclusively breastfed infants showed significantly higher intakes than non-exclusively breastfed infants [37,38,39,40].
Our model was not able to account for the breastfeeding exclusivity rate since most studies included both exclusively and non-exclusively breastfed infants, often without separate reporting of their human milk intake volume data. Yet, a convergence was observed between our function and Yeung et al. that could be explained by the findings of the recent systematic review conducted by Rios-Leyvraz et al. [7,14]. They reported no significantly different intakes between the dose-to-the-mother deuterium oxide dilution method and the test-weighing method corrected for insensible water loss [14]. However, it could be assumed that studies using the infantile test-weighing method seldomly correct for insensible water loss, explaining the potentially underestimation of human milk intake volume of Yeung et al.[7,14,41]. Thus, the lower intakes from non-exclusively breastfed infants in our model were balanced by the possible underestimation of human milk intake volume using the test-weighing method.
Compared to the overall function on all data of Rios-Leyvraz et al., our current function systematically reported higher intakes [14]. The lower intake of the their review might be explained by an overrepresentation of test-weighing data, as lower test-weighing results are described compared to deuterium dilution results [33]. Furthermore, test-weighing was primarily self-managed by mothers (52%) or executor was unclear (20%), possibly contributing to more variation in practice and methods in weighing [14]. Lastly, differences in ethnicities and feeding habits might help explaining a discrepancy between different reviews [42].
After 6 months of age, some authors stated that the deuterium oxide dilution method is not applicable because of varying breastfeeding practices [9]. However, this was less of a concern as our study primarily focused on human milk intake volume during the first 6 months of age, which was more accurately presented by Equation 2.
Among the maternal conditions and interventions relevant as potential PBPK study topics, only one factor showed a significant impact on infantile human milk intake volume. Specifically, maternal smoking (≥ 4 cigarettes per day) during pregnancy and breastfeeding was found to negatively influence human milk intake volume in infants [30]. Consequently, when investigating the risk of maternal smoking on infants using PBPK modeling, it may be appropriate to apply a correction for this lower milk intake volume. As the other maternal conditions and interventions showed no relevant differences, the need for correction is not required, and thereby further validating the applicability of our model for general PBPK modeling purposes. Importantly, this includes maternal HIV infection (Table 3), as this suggests that the reference values on human milk intake volume can also be used in this specific scenario.
To our knowledge, this systematic review represents the largest study to date that pools human milk intake volume data obtained solely using the (dose-to-the mother) deuterium oxide dilution method, considerably larger than a previous review by da Costa et al. from 2010 [13]. Unlike da Costa et al., this current model reported human milk intake volumes relative to changing infant weight, providing more informative data for PBPK modelling [13]. Furthermore, our review illustrated the increased use of the deuterium oxide dilution method for estimating human milk intake volume, with a gradual increase also in the industrialized world since last years [34].
One limitation of both the deuterium oxide dilution method and our systematic review is the relatively limited availability of data from industrialized or European countries, which could impact the input for PBPK models. To illustrate, only 4.9% of the studies included in our review reported data from Europe. Notably, the study by Rios-Leyvraz et al. using both test-weighing and deuterium oxide dilution data reported significantly different intake volumes across continents [14]. Since our model did not require exclusive breastfeeding of infants, it can provide a better representation of actual intakes in a population. However, it is important to recognize that breastfeeding practices also vary depending on the country of the study [43]. Moreover, the maternal characteristics differed across populations in the studies, with an overall pooled maternal age of 26.8 ± 5.7 years and a pooled weight of 57.5 ± 10 kg.
Another limitation of our study is the sparse availability of data regarding human milk intake volume expressed in mL/kg/day. To address this, the mean human milk intake volume was converted from mL/day to mL/kg/day using the mean infant weights. This conversion provided highly informative data and allowed comparison with the function of Yeung et al. or Rios-Leyvraz et al. [7,14]. As articles seldomly reported intakes directly in mL/kg/day, it can be concluded that this converted data only represents a minor limitation associated with the use of the deuterium oxide dilution method.

5. Conclusions

This systematic review highlights the value of using the (dose-to-the-mother) deuterium oxide dilution method for the estimation of human milk intake volume. It expects the presence of a high-risk period in early infancy concerning the transfer of maternal pharmacotherapy though human milk to the infant. Moreover, it questions the function described by Yeung et al. after 2 months of age because their model may underestimate the actual human milk intake volume due to limited correction of insensible water loss. This underestimation may be even more present in the model of Rios-Leyvraz et al., when compared to our model. This has important implications for PBPK simulations, as the risk estimation can be higher during later infancy. However, our model solely using data from the deuterium oxide dilution method may also underestimate the risk for exclusively breastfed infants due to the inclusion of non-exclusively breastfed infants. Furthermore, this review highlights the lack of data using the deuterium oxide dilution method, especially in the early postnatal period before 1 month of age and in the industrialized world or Europe. This review also urges for more data to be presented relative to infantile weight (mL/kg/day) and separate reporting of breastfeeding exclusivity rates, as this is most informative for PBPK predictions. Based on the findings of this review, future mother-infant PBPK models can be enhanced to further inform healthcare decisions and improve outcomes for both mother and infant.

Supplementary Materials

The following supporting information can be downloaded at the website of this paper posted on Preprints.org, Supplementary file 1: Supplementary table S1: Search string of PubMed, Embase, Web of science, Cochrane library, Scopus and CINAHL; Supplementary table S2: The Newcastle-Ottowa scale (NOS) used for quality assessment of cohort studies; Supplementary table S3: Adapted Newcastle-Ottowa scale (NOS) used for quality assessment of cross-sectional studies; Supplementary table S4: The Risk of Bias-2 (ROB2) tool for the quality assessment of randomized trials; Supplementary table S5: Formula used pooling of means and standard deviations; Supplementary table S6: Data extraction and synthesis; Supplementary file 2: PRISMA guidelines checklist; Supplementary file 3: PRISMA guidelines abstract checklist.

Author Contributions

Conceptualization, L.C., M.V.N., K.A.; methodology, L.C., M.V.N., K.A.; formal analysis, L.C., M.V.N., K.A.; investigation, L.C., M.V.N., K.A.; data curation, L.C., M.V.N., K.A.; writing—original draft preparation, L.C., M.V.N., K.A.; writing—review and editing, A.S.; visualization, L.C.; supervision, M.V.N., K.A.; funding acquisition, K.A., A.S. All authors have read and agreed to the published version of the manuscript.

Funding

The ConcePTION project has received funding from the Innovative Medicines Initiative 2 Joint Undertaking under grant agreement no. 821520. This Joint Undertaking receives support from the European Union’s Horizon 2020 research and innovation programme and EFPIA. The research activities of Anne Smits are supported by a Senior Clinical Investigatorship of the Research Foundation – Flanders (FWO) (18E2H24N).

Data Availability Statement

The corresponding author can be contacted to share the search results, and data will be shared upon reasonable request.

Acknowledgments

The research project leading to these results was conducted as part of the ConcePTION consortium. This paper only reflects the personal views of the stated authors. The authors wish to thank Thomas Vandendriessche, Chayenne Van Meel, Norin Hamouda and Krizia Tuand, the biomedical reference librarians of the KU Leuven Libraries – 2Bergen – learning Centre Désiré Collen (Leuven, Belgium), for their help in conducting the systematic literature search.

Conflicts of Interest

The authors declare no conflicts of interest.

References

  1. World Health Organisation. Infant and young child feeding: WHO; 2021 [Available from: https://www.who.int/news-room/fact-sheets/detail/infant-and-young-child-feeding.
  2. Fan D, Xia Q, Lin D, Ma Y, Rao J, Liu L, et al. Role of breastfeeding on maternal and childhood cancers: An umbrella review of meta-analyses. J Glob Health. 2023;13:04067. [CrossRef]
  3. Odom EC, Li R, Scanlon KS, Perrine CG, Grummer-Strawn L. Reasons for earlier than desired cessation of breastfeeding. Pediatrics. 2013;131(3):e726-32. [CrossRef]
  4. Della-Giustina K, Chow G. Medications in pregnancy and lactation. Emerg Med Clin North Am. 2003;21(3):585-613. [CrossRef]
  5. Nauwelaerts N, Deferm N, Smits A, Bernardini C, Lammens B, Gandia P, et al. A comprehensive review on non-clinical methods to study transfer of medication into breast milk - A contribution from the ConcePTION project. Biomed Pharmacother. 2021;136:111038. [CrossRef]
  6. Smits A, De Cock P, Vermeulen A, Allegaert K. Physiologically based pharmacokinetic (PBPK) modeling and simulation in neonatal drug development: how clinicians can contribute. Expert Opin Drug Metab Toxicol. 2019;15(1):25-34. [CrossRef]
  7. Yeung CHT, Fong S, Malik PRV, Edginton AN. Quantifying breast milk intake by term and preterm infants for input into paediatric physiologically based pharmacokinetic models. Matern Child Nutr. 2020;16(2):e12938. [CrossRef]
  8. Agency IAE. IAEA human health series No. 7. Stable Isotope Technique to Assess Intake of Human Milk in Breastfed Infants. Vienna, 2010.
  9. Torabinia M, Rosenblatt SD, Mosadegh B. A Review of Quantitative Instruments for Understanding Breastfeeding Dynamics. Glob Chall. 2021;5(10):2100019. [CrossRef]
  10. Meier PP, Engstrom JL. Test weighing for term and premature infants is an accurate procedure. Arch Dis Child Fetal Neonatal Ed. 2007;92(2):F155-6. [CrossRef]
  11. Savenije OE, Brand PL. Accuracy and precision of test weighing to assess milk intake in newborn infants. Arch Dis Child Fetal Neonatal Ed. 2006;91(5):F330-2.
  12. Nancy F. Butte MGL-A, Cutberto Garza. Nutrient adequacy of exclusive breastfeeding for the term infant during the first six months of life. Geneva, Switzerland: World Health Organization; 2002.
  13. da Costa TH, Haisma H, Wells JC, Mander AP, Whitehead RG, Bluck LJ. How much human milk do infants consume? Data from 12 countries using a standardized stable isotope methodology. J Nutr. 2010;140(12):2227-32. [CrossRef]
  14. Rios-Leyvraz M, Yao Q. The Volume of Breast Milk Intake in Infants and Young Children: A Systematic Review and Meta-Analysis. Breastfeed Med. 2023;18(3):188-97. [CrossRef]
  15. Martje Van Neste KA, Lucas Cloostermans. The deuterium oxide dilution method for estimating breast milk volume intake of the infant: a systematic review: PROSPERO; 2022 [CRD42022380374]. Available from: https://www.crd.york.ac.uk/prospero/display_record.php?ID=CRD42022380374.
  16. Page MJ, McKenzie JE, Bossuyt PM, Boutron I, Hoffmann TC, Mulrow CD, et al. The PRISMA 2020 statement: an updated guideline for reporting systematic reviews. Bmj. 2021;372:n71. [CrossRef]
  17. Veritas Health Innovation. Covidence systematic review software Australia2023 [Available from: www.covidence.org.
  18. Kenniscentrum voor de Gezondheidszorg Gent. Newcastle - Ottawa quality assessment scale [Available from: https://www.kcgg.ugent.be/pdf/NEWCASTLE-OTTAWA_QUALITY_ASSESSMENT_SCALE.pdf.
  19. Sterne JAC, Savović J, Page MJ, Elbers RG, Blencowe NS, Boutron I, et al. RoB 2: a revised tool for assessing risk of bias in randomised trials. Bmj. 2019;366:l4898.
  20. Salkind NJ. Encyclopedia of Research Design. United kingdom SAGE Publications; 2010.
  21. Warner RM. Applied Statistics II: Multivariable and Multivariate Techniques. United states SAGE Publications; 2020.
  22. collaboration. Tc. Obtaining standard deviations from standard errors and confidence intervals for group means 2011 [6 february 2024]. Available from: https://handbook-5-1.cochrane.org/chapter_7/7_7_3_2_obtaining_standard_deviations_from_standard_errors_and.htm#:~:text=The%20standard%20deviation%20for%20each,should%20be%20replaced%20by%205.15.
  23. Palmer. M. Propagation of Uncertainty through Mathematical Operations: massecuite institute of technology [Available from: https://web.mit.edu/fluids-modules/www/exper_techniques/2.Propagation_of_Uncertaint.pdf.
  24. Islam MM, Brown KH. Zinc transferred through breast milk does not differ between appropriate- and small-for-gestational-age, predominantly breast-fed Bangladeshi infants. Journal of Nutrition. 2014;144(5):771-6. [CrossRef]
  25. Caire-Juvera G, Casanueva E, Bolaños-Villar AV, De Regil LM, De la Barca AMC. No changes in weight and body fat in lactating adolescent and adult women from Mexico. American Journal of Human Biology. 2012;24(4):425-31. [CrossRef]
  26. Leong C, Gibson RS, Diana A, Haszard JJ, Rahmannia S, Ansari MB, et al. Differences in Micronutrient Intakes of Exclusive and Partially Breastfed Indonesian Infants from Resource-Poor Households are Not Accompanied by Differences in Micronutrient Status, Morbidity, or Growth. Journal of Nutrition. 2021;151(3):705-15. [CrossRef]
  27. Mulol H, Coutsoudis A. Breastmilk Output in a Disadvantaged Community with High HIV Prevalence as Determined by the Deuterium Oxide Dose-to-Mother Technique. Breastfeeding Medicine. 2016;11(2):64-9. [CrossRef]
  28. Oiye S, Mwanda W, Filteau S, Owino V. HIV-Infected and HIV-Uninfected Western Kenyan Women Produce Equivalent Amounts of Breast Milk at 6 Wk and 6 Mo Postpartum: A Prospective Cohort Study Using Deuterium Oxide Dose-to-Mother Technique. The Journal of nutrition. 2023;153(1):27-33. [CrossRef]
  29. Rahman A, Hafeez A, Bilal R, Sikander S, Malik A, Minhas F, et al. The impact of perinatal depression on exclusive breastfeeding: a cohort study. Maternal and Child Nutrition. 2016;12(3):452-62. [CrossRef]
  30. Vio F, Salazar G, Infante C. Smoking during pregnancy and lactation and its effects on breast-milk volume. American Journal of Clinical Nutrition. 1991;54(6):1011-6. [CrossRef]
  31. Mofid LS, Casapía M, Montresor A, Rahme E, Marquis GS, Vercruysse J, et al. Maternal postpartum deworming and infant milk intake: Secondary outcomes from a trial. Maternal and Child Nutrition. 2021;17(4). [CrossRef]
  32. Saint L, Smith M, Hartmann PE. The yield and nutrient content of colostrum and milk of women from giving birth to 1 month post-partum. Br J Nutr. 1984;52(1):87-95. [CrossRef]
  33. Santoro W, Jr., Martinez FE, Ricco RG, Jorge SM. Colostrum ingested during the first day of life by exclusively breastfed healthy newborn infants. J Pediatr. 2010;156(1):29-32. [CrossRef]
  34. Bandara T, Wong WW. Quantification of human milk intake of the babies. SriLanka J Child Health. 2022;51(4):608-12. [CrossRef]
  35. Braga GC, Ferriolli E, Quintana SM, Ferriani RA, Pfrimer K, Vieira CS. Immediate postpartum initiation of etonogestrel-releasing implant: A randomized controlled trial on breastfeeding impact. Contraception. 2015;92(6):536-42. [CrossRef]
  36. Van Neste M, Bogaerts A, Nauwelaerts N, Macente J, Smits A, Annaert P, et al. Challenges Related to Acquisition of Physiological Data for Physiologically Based Pharmacokinetic (PBPK) Models in Postpartum, Lactating Women and Breastfed Infants-A Contribution from the ConcePTION Project. Pharmaceutics. 2023;15(11). [CrossRef]
  37. Agne-Djigo A, Kwadjode KM, Idohou-Dossou N, Diouf A, Guiro AT, Wade S. Energy intake from human milk covers the requirement of 6-month-old Senegalese exclusively breast-fed infants. Br J Nutr. 2013;110(10):1849-55. [CrossRef]
  38. Haisma H, Coward WA, Albernaz E, Visser GH, Wells JCK, Wright A, et al. Breast milk and energy intake in exclusively, predominantly, and partially breast-fed infants. European Journal of Clinical Nutrition. 2003;57(12):1633-42. [CrossRef]
  39. Mazariegos M, Slater C, Ramirez-Zea M. Validity of Guatemalan Mother’s Self-Reported Breast-Feeding Practices of 3-Month-Old Infants. Food and Nutrition Bulletin. 2016;37(4):494-503. [CrossRef]
  40. Wells JC, Jonsdottir OH, Hibberd PL, Fewtrell MS, Thorsdottir I, Eaton S, et al. Randomized controlled trial of 4 compared with 6 mo of exclusive breastfeeding in Iceland: differences in breast-milk intake by stable-isotope probe. Am J Clin Nutr. 2012;96(1):73-9. [CrossRef]
  41. Arthur PG, Hartmann PE, Smith M. Measurement of the milk intake of breast-fed infants. J Pediatr Gastroenterol Nutr. 1987;6(5):758-63.
  42. Toh JY, Yip G, Han WM, Fok D, Low YL, Lee YS, et al. Infant Feeding Practices in a Multi-Ethnic Asian Cohort: The GUSTO Study. Nutrients. 2016;8(5). [CrossRef]
  43. Zong Xn, Wu H, Zhao M, Magnussen CG, Xi B. Global prevalence of WHO infant feeding practices in 57 LMICs in 2010&#x2013;2018 and time trends since 2000 for 44 LMICs. eClinicalMedicine. 2021;37.
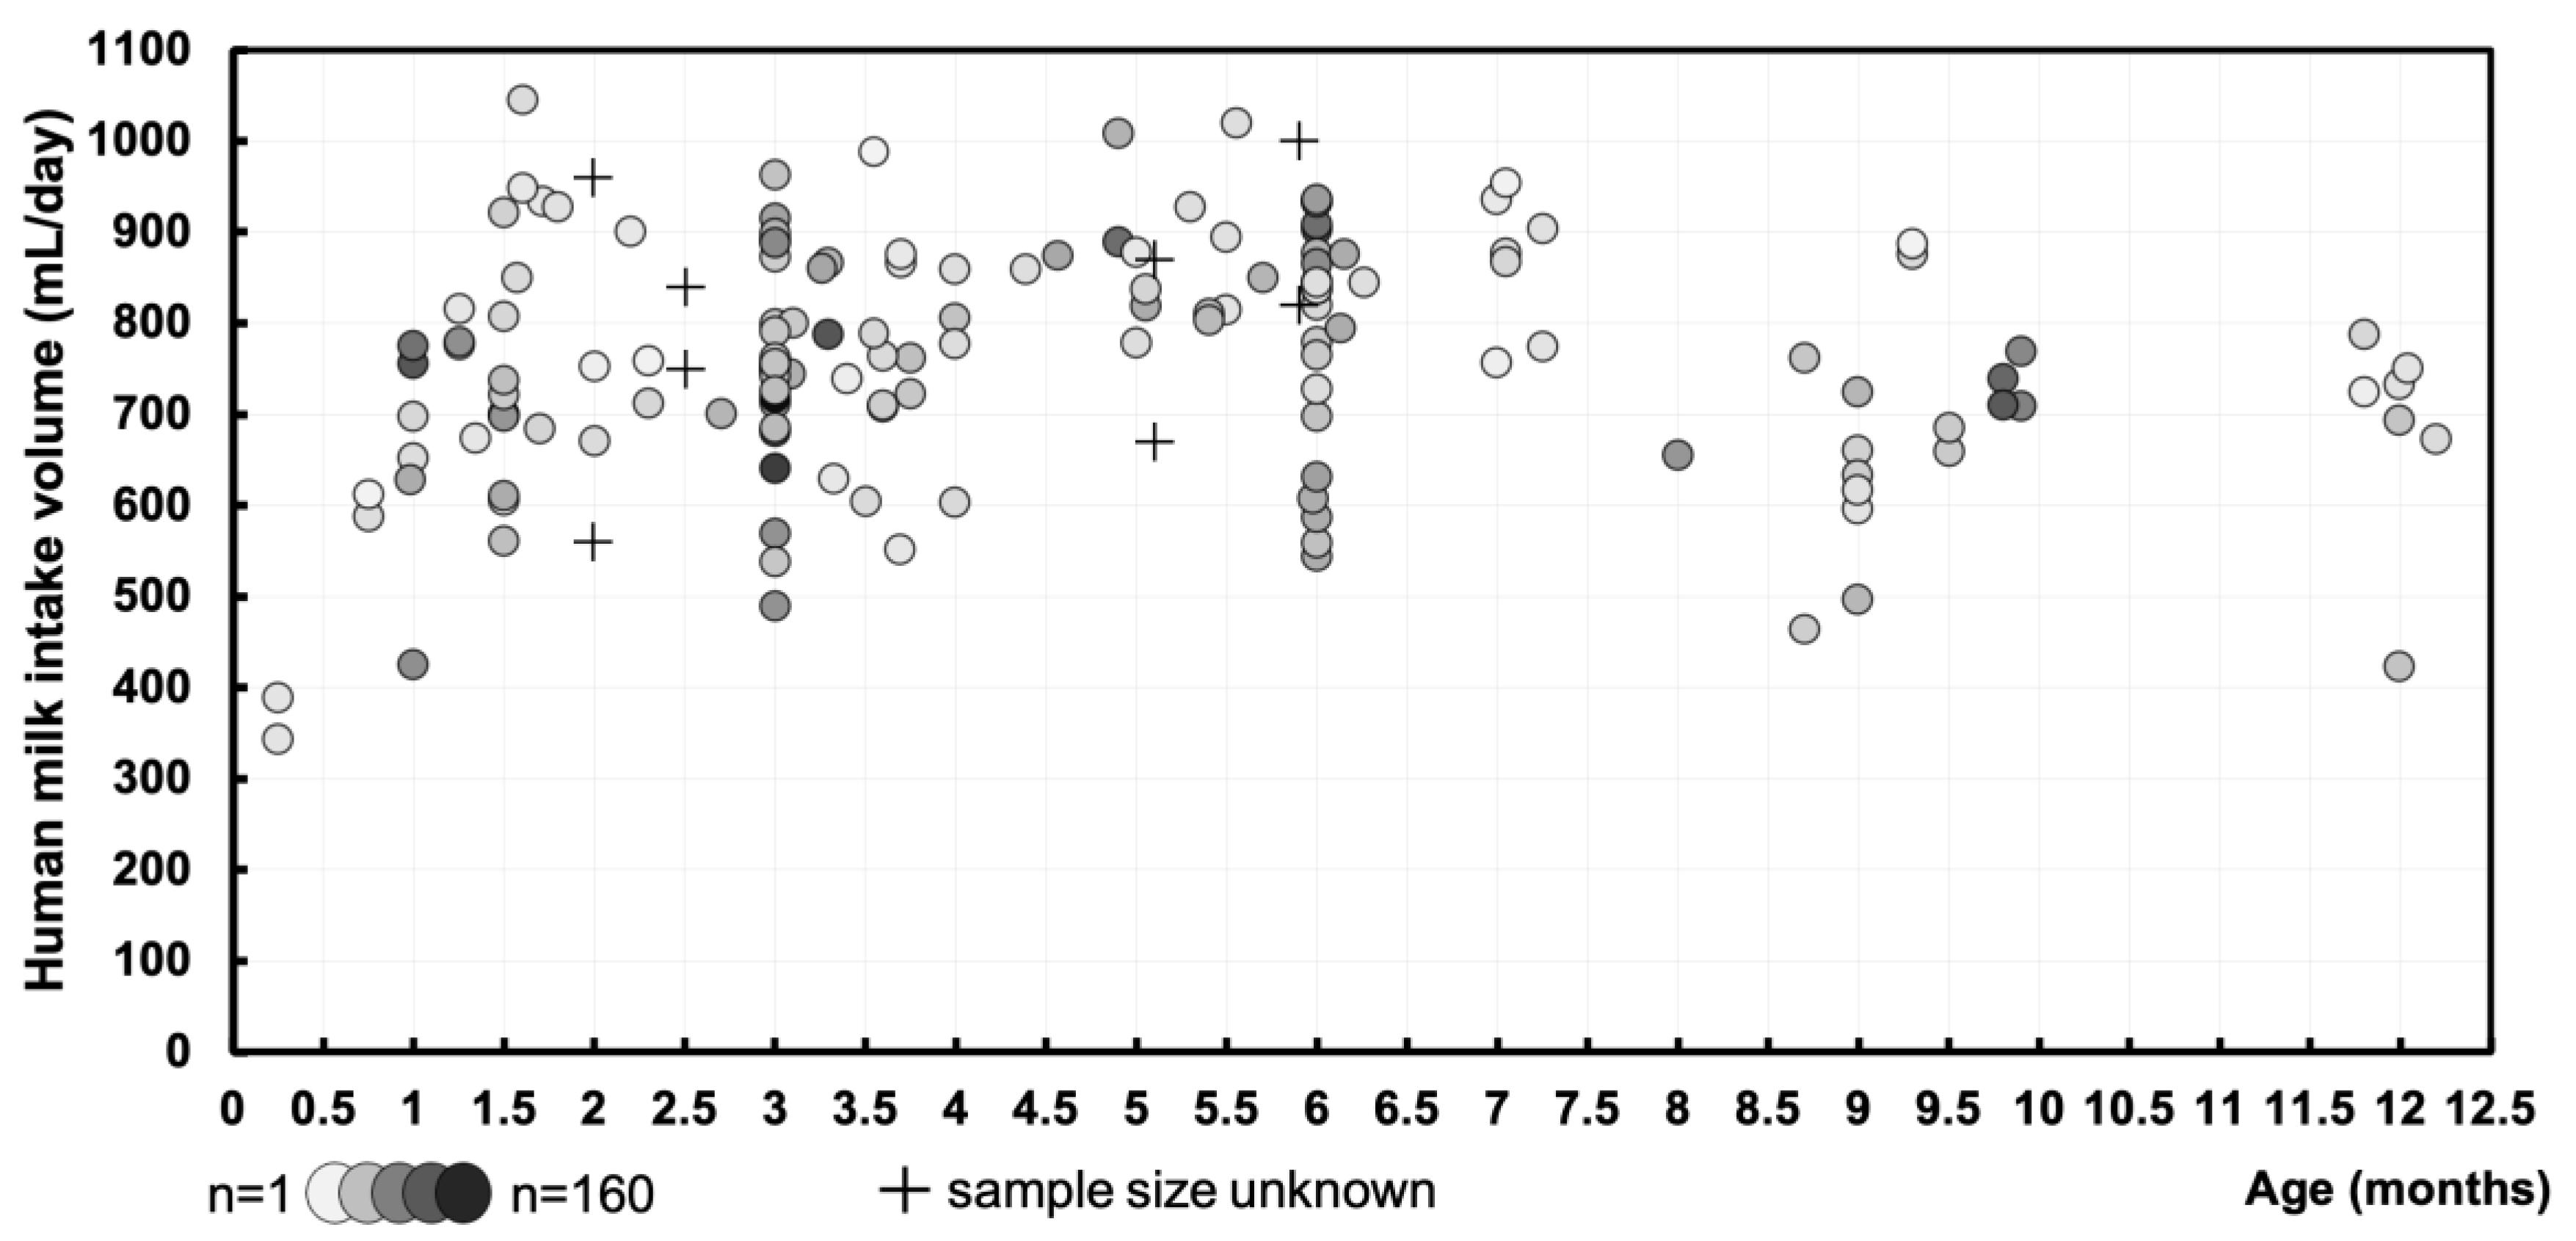
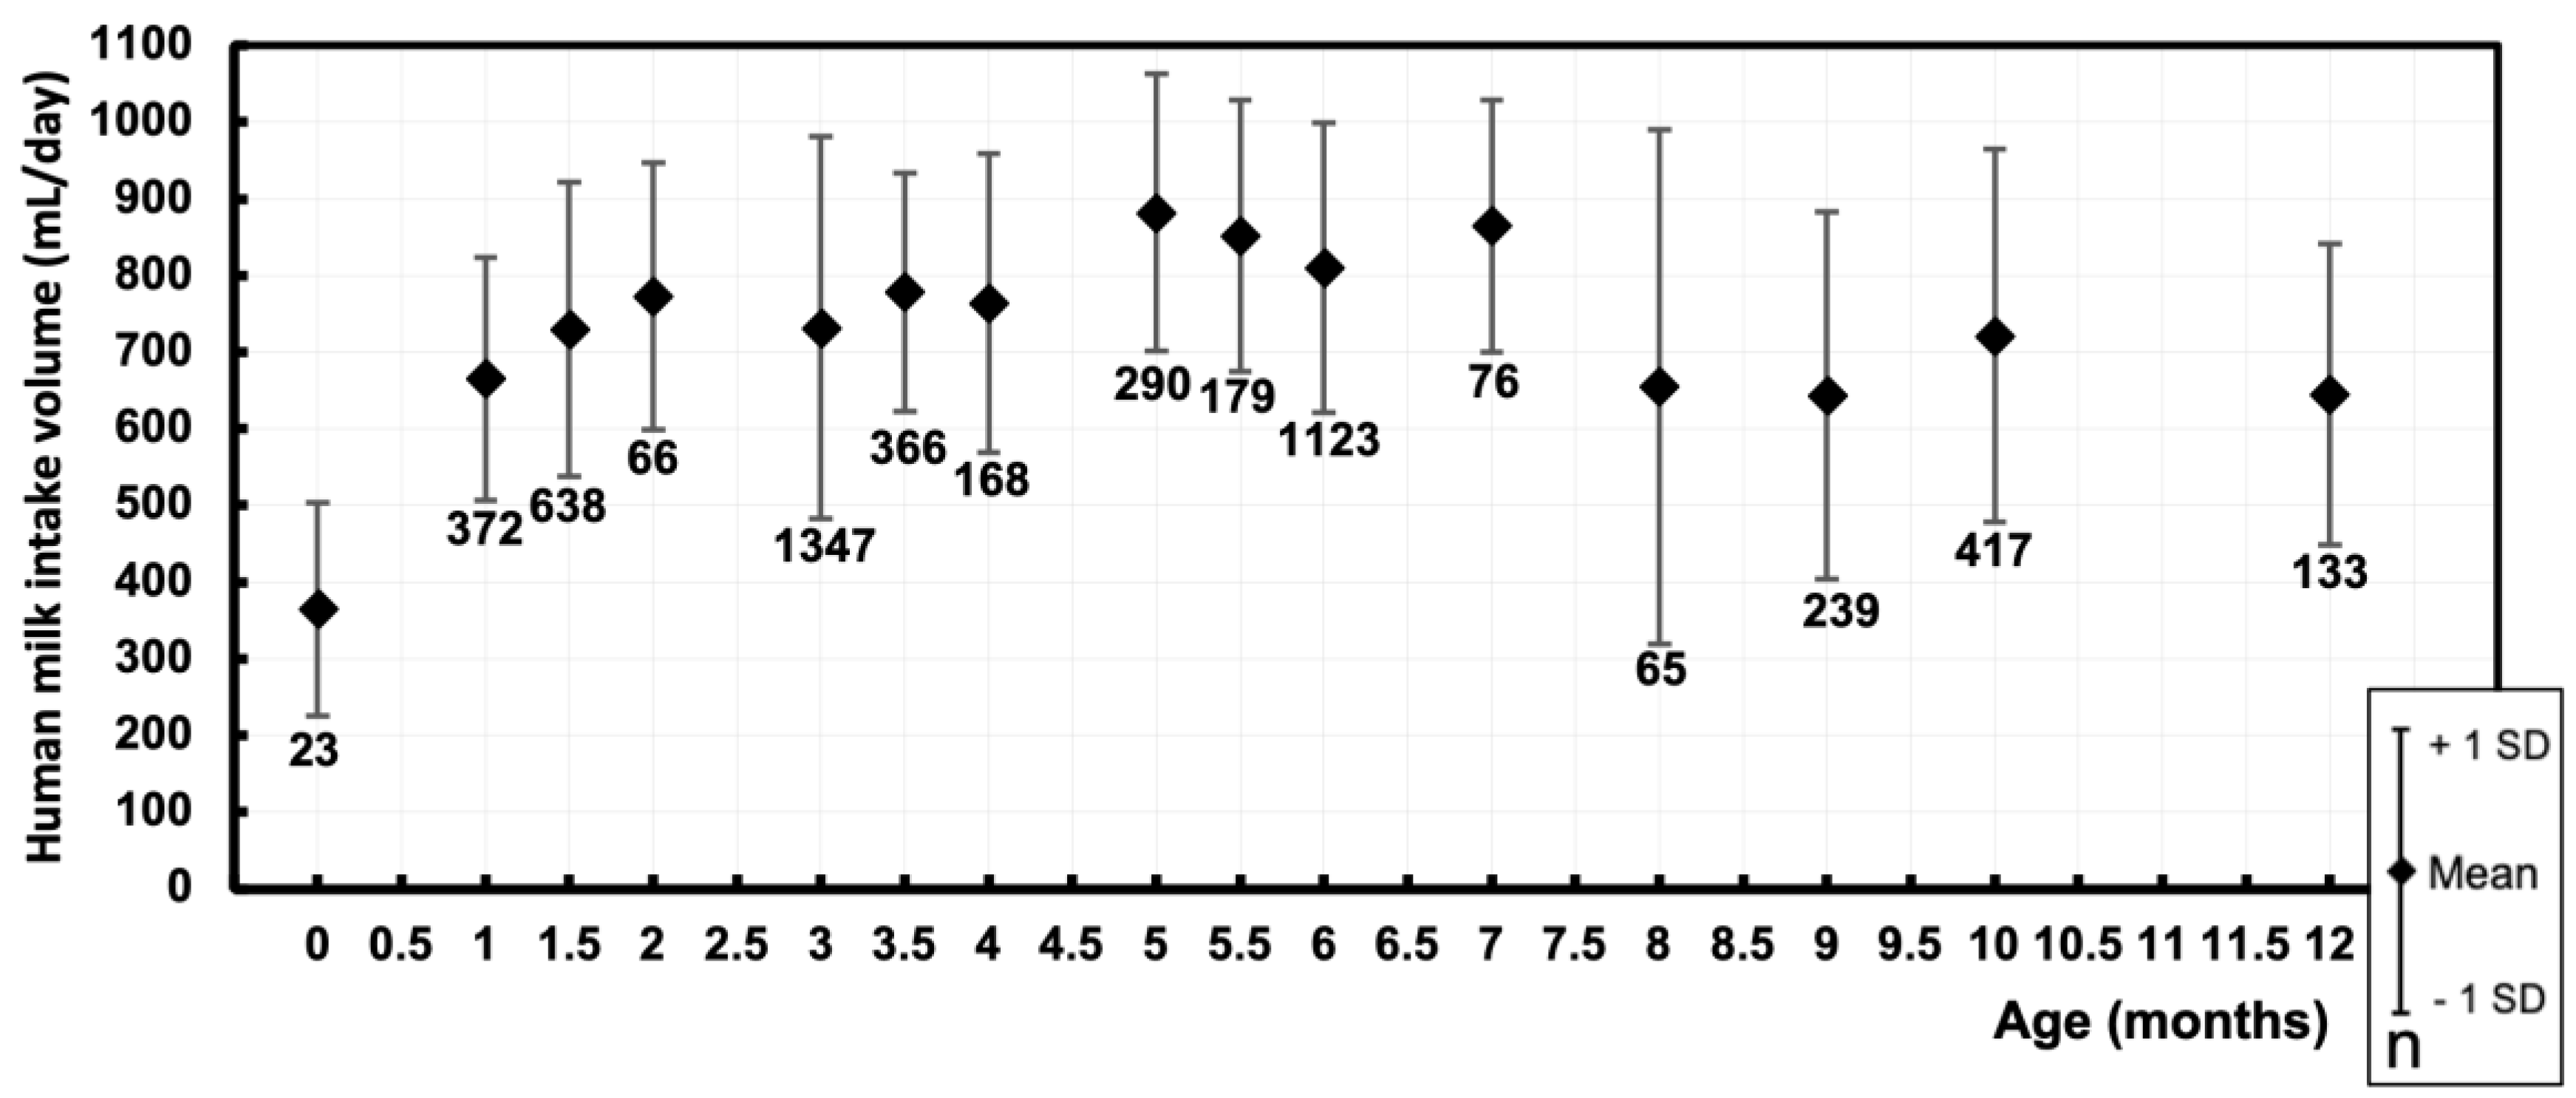
Figure 1. Visual representation of the selection process of articles by PRISMA flow diagram [16,17]. (n) represents the number of studies in the different stages of selection.
Preprints 139988 g001
Figure 2. Human milk intake volume (mL/day) over postnatal age (months) during the first life year of exclusively and non-exclusively breastfed infants. Markers represent individual cohorts at the measurement periods, where darker circles correspond to larger sample sizes (minimum n=1/ maximum n=160). When no information on the sample sizes was known, these were depicted as crosses.
Preprints 139988 g002
Figure 3. Pooled mean human milk intake volume (mL/day) over postnatal age (months) during the first life year of exclusively and non-exclusively breastfed infants. Markers representing the pooled mean human milk intake volume and the range of estimated standard deviations at the respective postnatal age. Sample sizes are depicted under markers.
Preprints 139988 g003
Figure 4. Human milk intake volume (mL/kg/day) over postnatal age (months) during the first life year of exclusively and non-exclusively breastfed infants. Markers represent individual cohorts at the measurement periods, where darker circles correspond to larger sample sizes (minimum n=4/ maximum n=127). When no information on the sample sizes was known, these were depicted as crosses.
Preprints 139988 g004
Figure 5. Pooled mean human milk intake volume (mL/kg/day) over postnatal age (months) during the first life year of exclusively and non-exclusively breastfed infants. Markers representing the pooled mean human milk intake volume and the range of estimated standard deviations at the respective postnatal age. Sample sizes are depicted under markers.
Preprints 139988 g005
Figure 6. (a) Current function of pooled mean human milk intake volume (mL/kg/day) over postnatal age in days, with the corresponding formula and R-squared value. Circle markers represent the pooled means with darker circles corresponding to larger sample sizes (minimum n=23, maximum n=774). (b) The current function, next to the function by Yeung et al. or Rios-Leyvraz et al. [7,14].
Preprints 139988 g006
Figure 7. Grey function describing human milk intake volume (mL/kg/day) over postnatal age in days during the first 6 months of age. The black line represents our function over the first year of life, circle markers represent the pooled means with darker circles corresponding to larger sample sizes (minimum n=23, maximum n=774).
Preprints 139988 g007
Table 1. Pooled mean human milk intake volume and SD (mL/day) during the first life year of exclusively and non-exclusively breastfed infants.
Postnatal age (months) Pooled sample size (n) Pooled mean (mL/day) Pooled SD
(mL/day)
0 [0.01 – 0.49] 23 364.9 139
1 [0.50 – 1.24] 372 665.6 158.3
1.5 [1.25 – 1.74] 638 729.9 191.9
2 [1.75 – 2.49] 66 773.4 174.4
3 [2.50 – 3.24] 1347 732 249.4
3.5 [3.25 – 3.74] 366 778.6 155.2
4 [3.75 – 4.49] 168 764.7 194.8
5 [4.50 – 5.24] 290 882.4 181
5.5 [5.25 – 5.74] 179 852.5 177
6 [5.75 – 6.49] 1123 809.9 189
7 [6.50 – 7.49] 76 864.8 164.9
8 [7.50 – 8.49] 65 655 336
9 [8.50 – 9.49] 239 643.5 239.2
10 [9.50 – 10.49] 417 721.7 243
12 [11.50 – 12.49] 133 645 197
Table 2. Pooled mean human milk intake volume and SD (mL/kg/day) during the first life year of exclusively and non-exclusively breastfed infants.
Postnatal age (months) Pooled sample size Pooled mean (mL/kg/day) Pooled SD
(mL/kg/day)
0 [0.01 – 0.49] 23 116.8 46.6
1 [0.50 – 1.24] 156 134.6 32.9
1.5 [1.25 – 1.74] 366 157 38
2 [1.75 – 2.49] 43 151.9 28.9
3 [2.50 – 3.24] 774 119.7 37.3
3.5 [3.25 – 3.74] 334 130.1 30.3
4 [3.75 – 4.49] 208 109.4 33.4
5 [4.50 – 5.24] 128 122.2 30.7
5.5 [5.25 – 5.74] 179 122.2 30.7
6 [5.75 – 6.49] 582 98.8 30.8
7 [6.50 – 7.49] 53 115.8 16
8 [7.50 – 8.49] 65 77.8 41
9 [8.50 – 9.49] 220 71.5 29.5
10 [9.50 – 10.49] 417 90.2 32.3
12 [11.50 – 12.49] 109 71.2 25
Table 3. Maternal conditions and interventions effects on human milk intake volume.
Author Year Postnatal age Sample size Maternal
conditions
Human milk
intake volume
p-value
Mulol et al. [27] 2016 6 weeks 21 HIV positive 831 ± 185 g/day 0.06
24 HIV negative 948 ± 223 g/day
3 months 28 HIV positive 899 ± 188 g/day 0.61
45 HIV negative 925 ± 227 g/day
6 months 27 HIV positive 871 ± 293 g/day 0.66
45 HIV negative 902 ± 286 g/day
9 months 24 HIV positive 679 ± 281 g/day 0.33
43 HIV negative 746 ± 263 g/day
12 months 13 HIV positive 755 ± 287 g/day 0.64
33 HIV negative 713 ± 264 g/day
Oiye et al. [28]
2023 6 weeks 68 HIV positive 721 ± 111 g/day 0.88
65 HIV negative 719 ± 121 g/day
6 months 60 HIV positive 960 ± 121 g/day 0.91
62 HIV negative 963 ± 107 g/day
Rahman et al. [29] 2016 4 months 24 Depressed 89.3 ± 38.1 mL/kg/day 0.57
31 Not depressed 83.9 ± 29.0 mL/kg/day
Vio et al. [30] 1991 41 ± 6.7 days 10 Smoking 693 ± 110 g/day <0.0001
52 ± 14 days 10 Not smoking 961 ± 120 g/day
Mofid et al. [31] 2021 1 months
109 Albendazole 756 ± 167 mL/day* 0.471
90 Placebo 774 ± 170.8 mL/day*
6 months
107 Albendazole 903 ± 165.5 mL/day* 0.849
93 Placebo 908 ± 173.6 mL/day*
Sample size: number of mother-infant pairs. Human milk intake volume: mean ± standard deviation (standard deviation calculated from provided standard error (*)).
Disclaimer/Publisher’s Note: The statements, opinions and data contained in all publications are solely those of the individual author(s) and contributor(s) and not of MDPI and/or the editor(s). MDPI and/or the editor(s) disclaim responsibility for any injury to people or property resulting from any ideas, methods, instructions or products referred to in the content.
Copyright: This open access article is published under a Creative Commons CC BY 4.0 license, which permit the free download, distribution, and reuse, provided that the author and preprint are cited in any reuse.
Prerpints.org logo

Preprints.org is a free preprint server supported by MDPI in Basel, Switzerland.

Subscribe

Disclaimer

Terms of Use

Privacy Policy

Privacy Settings

© 2025 MDPI (Basel, Switzerland) unless otherwise stated