
Submitted:
08 September 2025
Posted:
10 September 2025
You are already at the latest version
Abstract
Background/Objectives: Accurate estimation of caloric intake from breastfeeding is essential for understanding infant nutrition during early life. However, most existing models rely on fixed assumptions and do not reflect the natural variability in feeding behaviors and human milk composition. This study aims to provide a realistic estimation of breast milk (BM) caloric intake throughout infancy using a probabilistic approach based on empirical data. Methods: A probabilistic model was developed using four variables: feeding frequency, volume per feeding, caloric density, and infant weight. Systematic reviews were conducted to inform the input values of the first three variables, and meta-analyses were performed when feasible. Infant weight was based on World Health Organization (WHO) growth standards. Variables were stratified by age and integrated into the model through appropriate probability distributions. Monte Carlo simulations were conducted to estimate caloric intake per kilogram of body weight, expressed both per day and per feeding, across all age groups. Results: The model showed a progressive decline in daily caloric intake per kilogram with age, consistent with decreasing feeding frequency and the introduction of complementary foods. In contrast, caloric intake per feeding increased with age. These findings align with WHO energy intake targets during exclusive breastfeeding and reflect expected physiological changes in infant growth and feeding behavior. Conclusions: This study provides a probabilistic framework for estimating BM caloric intake across infancy, accounting for interindividual and age-related variability. It offers a valuable research tool to support future studies on infant nutrition and feeding behavior using realistic, data-driven assumptions.
Keywords:
Infant nutrition
; human milk composition
; energy estimation
1. Introduction
Breastfeeding provides essential nutrients and energy for infant growth and development. The World Health Organization (WHO) recommends exclusive breastfeeding for the first six months, followed by continued breastfeeding up to two years of age or beyond [1].
However, accurately estimating caloric intake from breast milk (BM) remains challenging due to variability in feeding patterns, milk composition, and infant metabolic demands [2]. Methods such as the Deuterium Dilution Technique (DTM) and 24-hour test weighing are reliable for estimating BM intake but have practical limitations: test weighing may interfere with natural breastfeeding, while DTM is time-consuming, costly, and difficult to implement in routine settings [2,3,4,5]. Additionally, these methods estimate total BM volume but do not provide detailed caloric intake or per feeding session.
Reliable estimates of caloric intake are crucial for research. However, there is a lack of models providing age-specific caloric estimates per feeding. Most available approaches are based on fixed assumptions, such as a constant feeding frequency or average milk composition, which do not reflect the natural variability observed in breastfeeding practices [6,7,8]. To address this issue, we developed a probabilistic model that offers more realistic, individualized estimations of BM caloric intake, considering factors like breastfeeding volume, feeding frequency, milk composition, and infant weight. This approach allows for a flexible and reproducible framework that more accurately reflects real-life breastfeeding patterns. Recognizing the well-established benefits of breastfeeding and existing clinical guidelines, this model is intended solely as a research tool to explore the variability in caloric intake during breastfeeding, without aiming to guide clinical practice.
2. Materials and Methods
2.1. Model Objective and Design
A probabilistic model was developed in June 2025 to estimate the caloric contribution of individual breastfeeding sessions and the resulting daily caloric intake per kilogram of body weight in full-term infants aged 0 to 24 months.
The model integrated four key variables influencing caloric intake: BM caloric density, volume consumed per feeding, daily feeding frequency, and infant weight. The first three variables were derived from systematic literature reviews and, where applicable, meta-analyses, whereas infant weight was directly obtained from the WHO Child Growth Standards [9].
The primary objective of the model was not to provide individualized clinical recommendations but rather to generate realistic, population-based estimates that can support nutritional assessments, and future research on infant feeding.
2.2. Age Stratification and Data Transformation
Infant age was divided into intervals: 0–1, 1–3, 3–6, 6–9, 9–12, 12–18, and 18–24 months. The neonatal period (0–1 month) was analyzed separately to account for rapid developmental changes and the distinct profile of milk composition during the first weeks of life [10,11]. From 1 month onward, 3-month intervals were used in the first year, and broader intervals (12–18 and 18–24 months) in the second year to align with available data and primary sources. Age assignment was based on completed months to avoid overlap.
2.3. Systematic Review and Meta-Analysis
To generate evidence-based input parameters for the probabilistic model, we performed three independent systematic reviews targeting the main determinants of BM caloric intake: (i) caloric density, (ii) volume per feeding, and (iii) daily breastfeeding frequency.
The reviews followed the PRISMA 2020 framework. Searches were conducted in PubMed from January 2005 to December 2025. We complemented the process using Elicit (Ought, CA, USA), an AI-assisted tool for evidence synthesis; however, all references were screened and verified manually by two independent reviewers, and AI was used only as a complementary tool [12].
Eligibility criteria:
- Inclusion: original observational or interventional studies reporting quantitative data on the target variables; healthy, full-term infants aged 0–24 months; and results stratified by infant age or time since birth.
- Exclusion (general):
- Narrative/review articles, editorials, protocols, or meta-analyses without primary data.
- Preterm infants only (unless data for term infants were reported separately).
- Out of time range (<2005).
- Non-human or animal studies.
- Non-applicable populations (e.g., cohorts with severe maternal malnutrition, rare diseases, or humanitarian crisis contexts).
- Studies analyzing donor human milk, due to compositional changes introduced by pasteurization that may alter caloric density and nutrient content [13].
- Other: abstracts without usable data, duplicates, or incomplete reports.
Additionally, variable-specific exclusion criteria were applied:
- Caloric density: studies not reporting caloric density or macronutrient content of BM, data not in quantitative format (mean and standard deviation), or those focused solely on biochemical/methodological analyses without cohort-level values.
- BM volume per feeding: studies not reporting BM volume, not providing data per feeding, lacking quantitative format (no means/medians), or using only indirect methods (e.g., maternal recall without test weighing or D2O).
- Feeding frequency: studies not reporting the number of feeds per day in an applicable format (e.g., only weekly frequency, feeding duration without daily count, or broad categorical groups without averages).
Study selection and extraction:
Titles and abstracts were screened independently by two reviewers, with disagreements resolved by consensus. For each included study, we extracted: study design, country, sample size, infant age, measurement method, and quantitative results. All variables were standardized to common units (kcal/dL, mL/feed, feeds/day).
Detailed search strategies for PubMed and Elicit, including all Boolean operators and filters applied, are provided in Supplementary Material (Table S1).
Meta-analysis:
A meta-analysis was conducted for variables meeting these criteria: (1) data from at least two studies; (2) reporting means and standard deviations (mean ± standard deviation); and (3) age stratification consistent with the model. Eligible studies were synthesized using MetaAnalysisOnline.com, applying a random-effects model with inverse variance weighting to generate pooled means and 95% confidence intervals (CIs). Statistical heterogeneity was assessed using Cochran’s Q test, Tau2, and the I2 statistic. Forest plots were generated for visual inspection [14].
2.4. Infant Weight as Input Parameter
Unlike the other variables, infant weight was not derived from a literature review but extracted directly from the WHO Child Growth Standards. We selected the 50th percentile (P50) for girls and boys as the most representative indicator of typical growth in full-term infants [9]. This approach avoids the influence of outliers inherent in mean-based values and reflects the median expected weight in the international reference population. To ensure consistency and account for sex-related growth differences, we consistently reported the range defined by the P50 of girls (lower bound) and boys (upper bound) for each age group. This methodology ensured internal coherence across input variables and alignment with internationally recognized anthropometric standards.
2.5. Probability Distributions and Simulation
A second-degree Monte Carlo simulation (35,000 iterations; 5,000 per age group) was performed using XLSTAT Risk® (Microsoft Corporation, Redmond, WA) [15]. Each input variable was assigned a probability distribution based on its statistical nature and the characteristics of the available data:
- Feeding frequency (feeds/day) was modeled using a triangular distribution, suitable for variables with limited data and defined minimum, maximum, and most likely values.
- Volume per feeding (mL/feed) were modeled using Project Evaluation and Review Technique (PERT) distributions, which account for asymmetry and wide individual variability while limiting the influence of outliers. These are appropriate for continuous variables when expert-informed minimum, most likely, and maximum values are available, and normality cannot be assumed.
- Caloric density (kcal/dL) was modeled using either a normal or a PERT distribution, depending on the heterogeneity observed in the meta-analysis. For age groups with low to moderate heterogeneity, a normal distribution was applied using the pooled mean and standard deviation (from the 95% confidence interval). For groups with high heterogeneity, a PERT distribution was used, with CI limits defining the range and the pooled mean as the most likely value. This approach enabled accurate representation of both consistent and variable results while minimizing outlier effects.
- Infant weight was further bounded using a uniform distribution, with the lower and upper limits defined by the 50th percentile values for girls and boys, respectively, according to the WHO Child Growth Standards. This choice constrained values to a biologically plausible range, assuming equal probability across the interval in the absence of more detailed distributional data.
To facilitate interpretation, simulated outcomes were categorized into three levels of caloric intake: low (LCI, Q1), medium (MCI, Q2), and high caloric intake (HCI, Q3), providing a structured framework for evaluating variability in nutritional intake across different age groups.
3. Results
3.1. Results of the Systematic Review and Meta-Analysis
3.1.1. Breast Milk Caloric Density
The systematic review identified 487 records in PubMed, of which 4 studies met the inclusion criteria after screening and full-text assessment (Figure 1). In parallel, the process was complemented with Elicit, which retrieved 8 candidate studies, of which 2 additional articles fulfilled the eligibility criteria. Thus, a total of 6 studies were included in the final synthesis (Table 1).
Studies by Czosnykowska-Łukacka et al. and Ongprasert et al. contributed exclusively to the 9–12 months age group, as their data for earlier months were aggregated into overly broad categories and therefore excluded from the 0–9 months analysis [16,17].
Reasons for exclusion of PubMed-identified records are detailed in Supplementary Table S2, while the screening process for Elicit-derived articles is provided in Supplementary Table S3.
The meta-analysis results are presented in Supplementary Tables S8–S14. High heterogeneity was observed in several age groups—particularly 0–1 and 9–12 months—while the 6–9 months group showed no heterogeneity (I2 = 0%). This meta-analysis was performed exclusively to generate standardized, age-specific inputs for the probabilistic model. The final input values for caloric density by age group, derived from the meta-analysis, are shown in Table 3.
3.1.1. Volume per Feeding
The systematic review identified 180 records in PubMed, of which 24 were selected for full-text screening. After eligibility assessment, none fulfilled the predefined inclusion criteria (Figure 2). The main reasons for exclusion were absence of BM volume data per feeding (n = 6), lack of stratification by infant age (n = 1), studies providing only daily volume or indirect estimations (n = 2), and non-representative populations (n = 12). In addition, a search was conducted with Elicit, which also yielded no eligible records. Details of the exclusion criteria applied to PubMed-identified records are presented in Supplementary Table S4, whereas Supplementary Table S5 summarizes the screening outcomes of articles retrieved through Elicit.
Although excluded due to insufficient stratification by infant age, two studies by Kent and colleagues are noteworthy as they represent the only available evidence reporting BM volume per feeding in infants under 6 months [20,21]. All measurements were expressed in grams but can be considered approximately equivalent to milliliters, as human milk density is ~1.03 g/mL [22]. Using test-weighing, Kent et al. (2006) observed a mean intake of 76.0 ± 12.6 g per feed (range: 0–240 g), with an inverse relationship between daily feeding frequency and average volume per feed (r2 = 0.442, p < 0.001). The average per meal was 101.4 ± 15.6 g, with increasing maximum intake as age advanced between 4 and 26 weeks [20].
In a subsequent study, Kent et al. (2013) reported a median intake of 106 mL per feed at 1 month, with a maximum of 162 mL. Median milk intake increased by 4.1 mL/week during early lactation, while maximum intake increased by 4.4 mL/week. However, in later lactation no significant changes were observed. The total 24-hour intake from 1 to 6 months averaged 808 g (SD 192; range 463–1370 g) [21].
Despite not meeting the predefined inclusion criteria, these studies informed the plausibility checks of the probabilistic model, as they provide the only direct measurements of BM intake per feeding session in early infancy.
For older infants, no direct per-feed data were available, and the literature instead provided only daily intakes. Given this limitation, we complemented the synthesis with indirect sources. Several studies reported 24-hour milk volumes, typically measured by test weighing or DTM. Reported values ranged from ~600–720 mL/day during early lactation to ~450–500 mL/day by 12 months. These results are broadly consistent with international references [23,24].
While these three studies formed the basis of our estimates, we supported the plausibility of the modeled intake ranges using WHO feeding recommendations for formula-fed infants, which suggest a gradual increase from 60 to 150 mL/kg/day during the early postnatal period [25]. Although not directly applicable to breastfed infants, these values provide a physiological reference framework consistent with growth and feeding patterns. Based on this, and given the observed variability across studies, we selected broad volume ranges for each age group to be integrated into the simulation model. Final input values are shown in Table 3.
3.1.3. Breastfeeding Frequency
The systematic review identified 63 records in PubMed, of which 6 studies met the inclusion criteria after screening and full-text assessment (Figure 3). In parallel, the process was complemented with Elicit, which retrieved 6 candidate studies; 3 were excluded and 1 overlapped with PubMed, resulting in 3 additional eligible articles. Thus, a total of 9 studies were included in the final synthesis (Table 2). Reasons for exclusion of PubMed-derived records are detailed in Supplementary Table S6, while the screening process for Elicit-derived articles is shown in Supplementary Table S7.
Due to the limited availability of standardized, age-specific data and heterogeneous reporting formats, no meta-analysis was performed. Instead, we extracted medians and interquartile ranges (IQRs) from the selected studies to define plausible frequency intervals for each age group.
For the 0–1 month group, Kent et al. (2013) reported an average of 7.6 feeds/day at one month, with a gradual decline of –0.2 feeds per week and an increase in the longest interval between feeds [21]. Kent et al. (2006) described a broad range of 6 to 18 feeds/day in exclusively breastfed infants aged 1–6 months [20]. Similarly, Huang et al. y Saki et al documented 10–14 feeds/day in newborns aged 0–28 days, while Chen et al. reported a median of 8 feeds/day (IQR: 7–10) in the first two weeks of life. [26,27,28]. Based on these data, a range of 8–14 feeds/day was estimated for the 0–1 month group.
For 1–12 months, data from the WHO Multicentre Growth Reference Study provided medians and IQRs across several countries: 9 feeds/day (IQR: 7–11) at 3 months, 8 feeds/day (IQR: 6–10) at 6 months, 7 feeds/day (IQR: 5–9) at 9 months, and 6 feeds/day (IQR: 4–8) at 12 months [29]. These values were consistent with other reports, such as Thomas et al. (10.3 feeds/day at 1–3 months), Ongpraset et al. (7.0 ± 2.2 feeds/day at 6–11 months), and Gridneva et al. (8.1 ± 1.4 feeds/day at 5 months; 5.4 ± 1.2 at 9 months) [30,31,32]. For modeling purposes, these IQRs were slightly adapted into simplified intervals to harmonize across studies and ensure consistent input categories. Accordingly, the following input intervals were defined:
- 1–3 months: 7–10 feeds/day
- 3–6 months: 6–9 feeds/day
- 6–9 months: 5–8 feeds/day
- 9–12 months: 4–7 feeds/day
For the second year of life, given the scarcity of age-specific studies and the increasing variability associated with prolonged lactation, broader ranges were proposed. Ongpraset et al. reported 4.9 ± 1.8 feeds/day at 12–17 months and 3.8 ± 2.1 at 18–23 months, while Gridneva et al. found 4.4 ± 1.9 feeds/day at 12 months [30,31]. Based on these observations, the following intervals were considered:
- 12–18 months: 2–6 feeds/day
- 18–24 months: 2–4 feeds/day
The final input values for each group are summarized in Table 3.
3.1.4. Final Input Parameters for the Probabilistic Analysis
All probabilistic input parameters employed in the simulation model for estimating BM caloric intake across age groups—used for the Monte Carlo simulations performed with XLSTAT Risk® [15]—are detailed below. Table 3 summarizes the selected input values extracted from the literature, while Table 4 presents the probability distributions applied for each parameter.

Table 3.
Selected input values used for the probabilistic model of caloric intake from breastfeeding, stratified by age group, and corresponding data sources.
Table 3.
Selected input values used for the probabilistic model of caloric intake from breastfeeding, stratified by age group, and corresponding data sources.
| Age | Feedings per day | Caloric density (kcal/dL) | Volume per feeding (mL) | Median weight stratified by age (WHO growth charts) (kg) |
|---|---|---|---|---|
| (months) | ||||
| 0-1 | 14-8月 | 63.70 [62.10; 65.31] | 30-110 | 3.2-3.3 |
| 1-3 | 10-7月 | 64.95 [62.52; 67.38] | 100-150 | 4.7-5 |
| 3-6 | 9-6月 | 61.66 [60.18; 63.15] | 110-180 | 6.3-7 |
| 6-9 | 8-5月 | 61.74 [60.19; 63.29] | 120-200 | 7.6-8.3 |
| 9-12 | 7-4月 | 76.73 [55.16; 98.30] | 140-200 | 8.5-9.2 |
| 12-18 | 6-2月 | 83.65 [74.32; 92.97] | 160-240 | 9.5-10.2 |
| 18-24 | 4-2月 | 90.43 [81.76; 99.10] | 180-240 | 10.8-11.4 |
| Reference | Thomas et al., 2005; Study Group, 2006, Kent et al. 2006; Saki et al., 2013; Kent et al., 2013; Chen et al., 2015; Gridneva et al., 2018; Huang et al., 2020; Ongpraset et al., 2025 | Saarela et al., 2005; Chang et al., 2015; Grote et al., 2016; Czosnykowska-Łukacka et al., 2018; Fischer Fumeaux et al. 2019; Ongprasert et al., 2020 | Olga et al., 2023; Kent et al. 2006; Kent et al. 2013; Mohr et al., 2023; WHO, 2009. | Child growth standards (WHO) |
Abbreviations: WHO: World Health Organization. Source: Data adapted from Thomas et al., 2005; Study Group, 2006; Kent et al., 2006; Saki et al., 2013; Kent et al., 2013; Chen et al., 2015; Gridneva et al., 2018; Huang et al., 2020; Ongpraset et al., 2025; Saarela et al., 2005; Chang et al., 2015; Grote et al., 2016; Czosnykowska-Łukacka et al., 2018; Fischer Fumeaux et al. 2019; Ongprasert et al., 2020; Olga et al., 2023; Mohr et al., 2023; WHO, 2009; and Child growth standards [9,10,11,16,17,18,19,20,21,23,24,26,27,28,29,30,31,32].
Table 4.
Input parameters and probability distributions used for the probabilistic model of caloric intake from breastfeeding, stratified by age group.
Table 4.
Input parameters and probability distributions used for the probabilistic model of caloric intake from breastfeeding, stratified by age group.
| Age | Feedings per day | Caloric density (kcal/dL) | Volume per feeding (mL) | Median weight stratified by age (WHO growth charts) (kg) |
|---|---|---|---|---|
| (months) | ||||
| Distribution | Triangular | PERT*/Normal** | PERT | Uniform |
| 0-1 | a: 8; m: 11; b: 14 | *a: 62.10; m: 63.70; b: 65.3 | a: 30; m: 70; b: 110 | a: 3.2; b: 3.3 |
| 1-3 | a: 7; m: 8.5; b: 10 | *a:62.52; m:64.95; b:67.38 | a: 100; m: 125; b: 150 | a: 4.7; b: 5.0 |
| 3-6 | a: 6; m: 7.5; b: 9 | ** μ: 61.66; σ: 0.76 | a: 110; m: 145; b: 180 | a: 6.3; b: 7.0 |
| 6-9 | a: 5; m: 6.5; b: 8 | ** μ: 61.74; σ: 0.79 | a: 120; m: 160; b: 200 | a: 7.6; b: 8.3 |
| 9-12 | a: 4; m: 5.5; b: 7 | *a: 55.16; m: 76.73; b: 98.30 | a: 140; m: 180; b: 200 | a: 8.5; b: 9.2 |
| 12-18 | a: 2; m: 4; b: 6 | *a: 74.32; m: 83.65; b: 92.97 | a: 160; m: 200; b: 240 | a: 9.5; b: 10.2 |
| 18-24 | a: 2; m: 3; b: 4 | *a: 81.76; m: 90.43; b: 99.10 | a: 180; m: 210; b: 240 | a: 10.8; b: 11.4 |
Abbreviations: PERT: Project Evaluation and Review Technique; WHO: World Health Organization.Variables were modeled using Triangular, PERT, and Normal functions in XLRisk®.a: minimum value; m: most likely value; b: maximum value; μ: mean; σ: standard deviation.
3.2. Probabilistic Model Results
As shown in Table 5 and Figure 4, Panel A, the estimated daily caloric intake from BM per kilogram of body weight progressively declined with age. The mean intake decreased from 150.8 kcal/kg/day in the 0–1 month group to 51.3 kcal/kg/day in the 18–24 months group. A slight increase was observed in the 9–12 months group (84.3 kcal/kg/day) compared to 6–9 months (80.8 kcal/kg/day), accompanied by a wider interquartile range and a higher standard deviation (SD = 14.2 kcal/kg/day), indicating increased variability in this subgroup.
Table 5 and Figure 4, Panel B illustrates caloric intake per feeding (kcal/kg/feed), which generally increased with age, rising from 13.7 kcal/kg/feed in the first month to 17.1 kcal/kg/feed in the oldest group. However, the trend was not linear. A distinct peak was observed at 1–3 months (16.8 kcal/kg/feed), followed by a transient decrease in the 3–6 months group (13.5 kcal/kg/feed), with intake values increasing again from 6 months onward.
For each age group, the results are also presented according to low (LCI, Q1), medium (MCI, Q2), and high caloric intake (HCI, Q3), which allows for a stratified interpretation of variability across the simulated distributions.
Accurate estimation of caloric intake from breastfeeding is a key challenge in infant nutrition research, yet few tools offer age-specific values per feeding. Existing models often rely on arbitrary fixed assumptions that fail to reflect the natural variability of breastfeeding patterns and may lead to inaccurate estimations, particularly in research contexts requiring detailed intake modeling [6,7,8].
Our probabilistic approach offers a more realistic alternative. By integrating diverse data sources and applying probabilistic simulations, we modeled caloric intake from BM using distributions that reflect variability in feeding volume and frequency, milk composition, and infant weight. This allowed us to simulate realistic feeding scenarios across age groups, better representing actual clinical situations.
Systematic literature reviews were conducted to define the input parameters of the model, but caloric density was the only variable suitable for meta-analysis, allowing for the generation of evidence-based probability distributions across age groups. In contrast, feeding frequency and volume per feeding were informed by published ranges, as they did not meet criteria for quantitative synthesis.
The model estimates a clear decreasing trend in daily caloric intake per kilogram of body weight with advancing age: from 150.8 kcal/kg/day in the 0–1 month group to 51.3 kcal/kg/day at 18–24 months. This decline is consistent with physiological changes during development, such as reduced metabolic demands per kilogram and decreased breastfeeding frequency over time. Conversely, caloric intake per feeding increases with age, rising from 13.7 kcal/kg/feed in the first month to 17.1 kcal/kg/feed in the oldest group, reflecting the rise in BM energy density and greater intake per session [10,11,16,17,18].
The 9–12 months group showed a modest increase in estimated intake (84.3 kcal/kg/day) with greater variability (SD = 14.2). This may relate to the particularly high caloric density estimate (76.7 kcal/dL), based on few studies with high heterogeneity (I2 = 98.7%). While plausible, this finding should be interpreted cautiously.
In addition, the higher caloric intake per kilogram per of body weight per feeding estimated for the 1–3 months group likely represents a physiological peak driven by increased feeding volume, relatively low body weight, and slightly higher BM caloric density [20,21]. These factors, derived from our systematic review, may explain the highest modeled value observed across infancy, though the estimate should be interpreted considering the limitations of the source data.
Our results (Table 5) are generally consistent with the WHO energy requirement estimates, which range from 115–120 kcal/kg/day at 0–3 months, 95–105 kcal/kg/day at 3–6 months, 85–95 kcal/kg/day at 6–12 months, and 80–85 kcal/kg/day at 12–24 months [33]. While the model outputs for infants aged 0–6 months align well with these recommendations, estimates for older infants appear to follow a natural decline. This trend likely reflects the progressive reduction in breastfeeding frequency observed with age, as described in the WHO Multicentre Growth Reference Study and supported by other longitudinal reports [30,31,32], together with the introduction of complementary feeding after 6 months, which contribute to changes in total energy intake during the second half of infancy [1,33].
Our study offers several advantages over previous models that relied on fixed assumptions, such as Weisgerber et al. in 2013 [6]. Their model used a predetermined number of daily feedings and assumed fixed BM caloric values (82 kcal/kg/day up to 9 months and 53 kcal/kg/day up to 12 months) without strong supporting evidence [6]. In contrast, our model incorporates flexible distributions for feeding frequency, BM caloric density, feeding volumes, and infant growth patterns, capturing natural variability and providing a more realistic estimation of individual intake across different age groups.
The categorization into low (LCI), medium (MCI), and high (HCI) caloric intake provides a structured framework to model perceived feeding scenarios. This approach facilitates the interpretation of individual variability across age groups and supports more refined analyses of breastfeeding patterns in research on infant energy intake.
As a practical reference, our model estimates caloric intake (kcal/kg body weight per feeding and per day) across infancy, serving as a practical reference when direct measurement is not possible (Table 5). Detailed inputs and probability distributions are provided in Table 4, allowing reproducibility with tools like XLRisk® for Microsoft Excel. The model is adaptable to specific contexts, such as preterm infants, by adjusting parameters like age, weight, and milk composition, making it useful for both population-based analyses and hypothesis-driven research.
Nevertheless, there are two main limitations: only BM caloric density met meta-analysis criteria, while other variables relied on literature-based ranges. Additionally, the model does not account for maternal nutritional status or infant health conditions, which may influence intake patterns in specific subgroups [7,8].
5. Conclusions
This study presents the first published probabilistic model to estimate BM caloric intake per feeding and per day throughout infancy. By integrating data from systematic reviews and simulating intake patterns across age groups, it offers a realistic and flexible framework for assessing energy intake in population-based research. The model captures the natural variability of breastfeeding and supports future studies in the field of infant nutrition.
Supplementary Materials
The following supporting information can be downloaded at the website of this paper posted on Preprints.org, Supplemental Table S1: Search strategies used for the systematic reviews. Date of search Aug 2025; Supplemental Table S2: Summary of studies excluded from PubMed in the systematic review of breast milk caloric density (2005–2025).; Supplemental Table S3. Summary of studies excluded from Elicit in the systematic review of breast milk caloric density (2005–2025); Supplemental Table S4: Summary of studies excluded from PubMed in the systematic review of breast milk volume per feeding session (2005–2025); Supplemental Table S5. Summary of studies excluded from Elicit in the systematic review of breast milk volume per feeding session (2005–2025); Supplemental Table S6. Summary of studies excluded from PubMed in the systematic review of breastfeeding frequency (2005–2025); Supplemental Table S7. Summary of studies excluded from Elicit in the systematic review of breastfeeding frequency (2005–2025); Supplemental Table S8. Meta-analysis of caloric density of breast milk (kcal/100 mL) in full-term infants aged 0–1 month, based on systematic review data; Supplemental Table S9. Meta-analysis of caloric density of breast milk (kcal/100 mL) in full-term infants aged 1–3 month, based on systematic review data; Supplemental Table S10. Meta-analysis of caloric density of breast milk (kcal/100 mL) in full-term infants aged 3–6 month, based on systematic review data; Supplemental Table S11. Meta-analysis of caloric density of breast milk (kcal/100 mL) in full-term infants aged 6–9 month, based on systematic review data; Supplemental Table S12. Meta-analysis of caloric density of breast milk (kcal/100 mL) in full-term infants aged 9–12 month, based on systematic review data; Supplemental Table S13. Meta-analysis of caloric density of breast milk (kcal/100 mL) in full-term infants aged 12–18 month, based on systematic review data; Supplemental Table S14. Meta-analysis of caloric density of breast milk (kcal/100 mL) in full-term infants aged 18–24 month, based on systematic review data.
Author Contributions
Conceptualization, A.B.-F. and J.V.A.-M.; methodology, A.B.-F. and J.V.A.-M.; software, A.B.-F.; validation, J.V.A.-M. and S.C.-C.; formal analysis, A.B.-F. and J.V.A.-M.; investigation, A.B.-F. and J.V.A.-M.; resources, S.F.M.; data curation, A.B.-F. and J.V.A.-M.; writing—original draft preparation, A.B.-F.; writing—review and editing, A.B.-F., J.V.A.-M., S.C.-C. and S.F.M.; visualization, A.B.-F.; supervision, S.F.M. and S.C.-C.; project administration, A.B.-F. and S.F.M. All authors have read and agreed to the published version of the manuscript.
Funding
This research received no external funding.
Institutional Review Board Statement
The study was approved by the Ethics Committee for Research of the Hospital Clínic Universitari de València (protocol code 2021/007, Act nº 367, date of approval: 25 March 2021).
Informed Consent Statement
Not applicable.
Data Availability Statement
All data supporting the findings of this study are contained within the article and its Supplementary Materials.
Acknowledgments
In this section, you can acknowledge any support given which is not covered by the author contribution or funding sections. This may include administrative and technical support, or donations in kind (e.g., materials used for experiments). Where GenAI has been used for purposes such as generating text, data, or graphics, or for study design, data collection, analysis, or interpretation of data, please add “During the preparation of this manuscript/study, the author(s) used [tool name, version information] for the purposes of [description of use]. The authors have reviewed and edited the output and take full responsibility for the content of this publication.”
Conflicts of Interest
The authors declare no conflicts of interest.
Abbreviations
The following abbreviations are used in this manuscript:
| BM | Breast Milk |
| CI | Confidence Interval |
| DTM | Deuterium Dilution Technique |
| FT-IR | Fourier-Transform Infrared Spectroscopy |
| GC | Gas Chromatography |
| HIC | High Caloric Intake |
| HPLC | High-Performance Liquid Chromatography |
| IQR | Interquartile Ranges |
| KCAL | Kilocalories |
| LCI | Low Caloric Intake |
| MCI | Medium Caloric Intake |
| MIRIS | Mid-Infrared Human Milk Analyzer |
| PERT | Project Evaluation and Review Technique |
| SD | Standard Deviation |
| USA | United States of America |
| WHO | World Health Organization |
References
- World Health Organization. Global Strategy for Infant and Young Child Feeding; World Health Organization: Geneva, Switzerland, 2003. [Google Scholar]
- Ren, M.; Qiu, Y. The Volume of Breast Milk Intake in Infants and Young Children: A Systematic Review and Meta-Analysis. Breastfeed. Med. 2023, 18, 1–12. [Google Scholar] [CrossRef] [PubMed]
- Hartmann, P.E.; Saint, L. Measurement of Milk Yield in Women. J. Pediatr. Gastroenterol. Nutr. 1984, 3, 270–274. [Google Scholar] [CrossRef] [PubMed]
- George, A.D.; Gay, M.C.L.; Murray, K.; Muhlhausler, B.S.; Geddes, D.T.; et al. Human Milk Sampling Protocols Affect Estimation of Infant Lipid Intake. J. Nutr. 2020, 150, 2924–2932. [Google Scholar] [CrossRef]
- Napoli, C.D.; Pallaro, A.; Fustiñana, C.A.; Mazza, C.S.; Zorzoli, A. Breast Milk Intake and Nutritional Assessment of Exclusively Breastfed Infants. Nutr. Clin. Diet. Hosp. 2019, 39, 120–127. [Google Scholar] [CrossRef]
- Weisgerber, M. C.; Lye, P. S.; Nugent, M.; Li, S.-H.; De Fouw, K.; Gedeit, R.; Simpson, P.; Gorelick, M. H. Relationship between Caloric Intake and Length of Hospital Stay for Infants with Bronchiolitis. Hosp. Pediatr. 2013, 3, 24–30. [Google Scholar] [CrossRef]
- Rocha-Pinto, I.; Pereira-da-Silva, L.; Silva, D. E.; Cardoso, M. Factors That May Affect Breast Milk Macronutrient and Energy Content: A Critical Review. Nutrients 2025, 17, 2503. [Google Scholar] [CrossRef]
- Suwaydi, M.A.; Lai, C.T.; Rea, A.; Gridneva, Z.; Perrella, S.L.; Wlodek, M.E.; Geddes, D.T. Circadian Variation in Human Milk Hormones and Macronutrients. Nutrients 2023, 15, 3729. [Google Scholar] [CrossRef]
- World Health Organization. Child Growth Standards. Available online: https://www.who.int/toolkits/child-growth-standards (accessed on 22 August 2025).
- Fischer Fumeaux, C.J.; Garcia-Rodenas, C.L.; De Castro, C.A.; Courtet-Compondu, M.-C.; Thakkar, S.K.; Beauport, L.; Tolsa, J.-F.; Affolter, M. Longitudinal Analysis of Macronutrient Composition in Preterm and Term Human Milk: A Prospective Cohort Study. Nutrients 2019, 11, 1525. [Google Scholar] [CrossRef]
- Chang, N.; Jung, J.A.; Kim, H.; Jo, A.; Kang, S.; Lee, S.-W. Macronutrient Composition of Human Milk from Korean Mothers of Full Term Infants Born at 37–42 Gestational Weeks. Nutr. Res. Pract. 2015, 9, 433–438. [Google Scholar] [CrossRef]
- Kung, J. Elicit (Product Review). J. Can. Health Libr. Assoc. 2023, 44, 1–3. [Google Scholar] [CrossRef]
- Piemontese, P.; Mallardi, D.; Liotto, N.; Tabasso, C.; Menis, C.; Perrone, M.; Roggero, P.; Mosca, F. Macronutrient Content of Pooled Donor Human Milk before and after Holder Pasteurization. BMC Pediatr. 2019, 19, 58. [Google Scholar] [CrossRef]
- MetaAnalysisOnline. Available online: https://metaanalysisonline.com/ (accessed on 25 August 2025).
- GitHub. pyscripter/XLRisk: Excel Add-in for Performing Monte Carlo Simulation. Available online: https://github.com/pyscripter/XLRisk (accessed on 25 August 2025).
- Czosnykowska-Łukacka, M.; Królak-Olejnik, B.; Orczyk-Pawiłowicz, M. Breast Milk Macronutrient Components in Prolonged Lactation. Nutrients 2018, 10, 1893. [Google Scholar] [CrossRef]
- Ongprasert, K.; Ruangsuriya, J.; Malasao, R.; Sapbamrer, R.; Suppansan, P.; Ayood, P.; Kittisakmontri, K.; Siviroj, P. Macronutrient, Immunoglobulin A and Total Antioxidant Capacity Profiles of Human Milk from 1 to 24 Months: A Cross-Sectional Study in Thailand. Int. Breastfeed. J. 2020, 15, 90. [Google Scholar] [CrossRef]
- Grote, V.; Verduci, E.; Scaglioni, S.; Vecchi, F.; Contarini, G.; Giovannini, M.; Koletzko, B.; Agostoni, C.; for the European Childhood Obesity Project. Breast Milk Composition and Infant Nutrient Intakes during the First 12 Months of Life. Eur. J. Clin. Nutr. 2016, 70, 250–256. [Google Scholar] [CrossRef]
- Saarela, T.; Kokkonen, J.; Koivisto, M. Macronutrient and Energy Contents of Human Milk Fractions during the First Six Months of Lactation. Acta Paediatr. 2005, 94, 1176–1181. [Google Scholar] [CrossRef]
- Kent, J.C.; Mitoulas, L.R.; Cregan, M.D.; Ramsay, D.T.; Doherty, D.A.; Hartmann, P.E. Volume and Frequency of Breastfeedings and Fat Content of Breast Milk throughout the Day. Pediatrics 2006, 117, e387–e395. [Google Scholar] [CrossRef] [PubMed]
- Kent, J.C.; Hepworth, A.R.; Sherriff, J.L.; Cox, D.B.; Mitoulas, L.R.; Hartmann, P.E. Longitudinal Changes in Breastfeeding Patterns from 1 to 6 Months of Lactation. Breastfeed. Med. 2013, 8, 401–407. [Google Scholar] [CrossRef]
- Casey, C. E.; Hambidge, K. M.; Neville, M. C. Studies in Human Lactation: Zinc, Copper, Manganese and Chromium in Human Milk in the First Month of Lactation. Am. J. Clin. Nutr. 1985, 41, 1193–1200. [Google Scholar] [CrossRef] [PubMed]
- Olga, L.; Vervoort, J.; van Diepen, J.A.; Gross, G.; Petry, C.J.; Prentice, P.M.; Chichlowski, M. Associations between Breast Milk Intake Volume, Macronutrient Intake and Infant Growth in a Longitudinal Birth Cohort: The Cambridge Baby Growth and Breastfeeding Study (CBGS-BF). Br. J. Nutr. 2023, 130, 56–64. [Google Scholar] [CrossRef] [PubMed]
- Mohr, A.E.; Senkus, K.E.; McDermid, J.M.; Berger, P.K.; Perrin, M.T.; Handu, D. Human Milk Nutrient Composition Data Is Critically Lacking in the United States and Canada: Results from a Systematic Scoping Review of 2017–2022. Adv. Nutr. 2023, 14, 1617–1632. [Google Scholar] [CrossRef]
- World Health Organization. Infant and Young Child Feeding: Model Chapter for Textbooks for Medical Students and Allied Health Professionals; World Health Organization: Geneva, Switzerland, 2009. [Google Scholar]
- Huang, S.-K.; Chih, M.-H. Increased Breastfeeding Frequency Enhances Milk Production and Infant Weight Gain: Correlation with the Basal Maternal Prolactin Level. Breastfeed. Med. 2020, 15, 639–645. [Google Scholar] [CrossRef] [PubMed]
- Chen, Y.-J.; Yeh, T.-F.; Chen, C.-M. Effect of Breast-Feeding Frequency on Hyperbilirubinemia in Breast-Fed Term Neonates. Pediatr. Int. 2015, 57, 1121–1125. [Google Scholar] [CrossRef] [PubMed]
- Saki, A.; Eshraghian, M. R.; Tabesh, H. Patterns of Daily Duration and Frequency of Breastfeeding among Exclusively Breastfed Infants in Shiraz, Iran: A 6-Month Follow-Up Study Using Bayesian Generalized Linear Mixed Models. Glob. J. Health Sci. 2013, 5, 123–133. [Google Scholar] [CrossRef]
- WHO Multicentre Growth Reference Study Group. Breastfeeding in the WHO Multicentre Growth Reference Study. Acta Paediatr. Suppl. 2006, 450, 16–26. [Google Scholar] [CrossRef]
- Ongprasert, K.; Chawachat, J.; Kiratipaisarl, W.; Siviroj, P. Breast Milk Feeding Practices and Frequencies among Complementary-Fed Children: A Cross-Sectional Study in Northern Thailand. Int. Breastfeed. J. 2025, 20, 28. [Google Scholar] [CrossRef]
- Gridneva, Z.; Rea, A.; Hepworth, A.R.; Ward, L.C.; Lai, C.T.; Hartmann, P.E.; Geddes, D. T. Relationships between Breastfeeding Patterns and Maternal and Infant Body Composition over the First 12 Months of Lactation. Nutrients 2018, 10, 45. [Google Scholar] [CrossRef]
- Thomas, K.A.; Foreman, S.W. Infant Sleep and Feeding Pattern: Effects on Maternal Sleep. J. Midwifery Womens Health 2005, 50, 399–404. [Google Scholar] [CrossRef]
- Martínez Costa, C. Requerimientos energéticos y nutritivos del niño. Recomendaciones dietéticas. In Manual Básico de Nutrición Clínica y Dietética; Mesejo Arizmendi, A., Martínez Valls, J. F., Martínez Costa, C., Eds.; Editorial Médica Panamericana: Madrid, Spain, 2012. [Google Scholar]
Figure 1.
PRISMA 2020 flow diagram of study selection for breast milk caloric density (2005–2025).
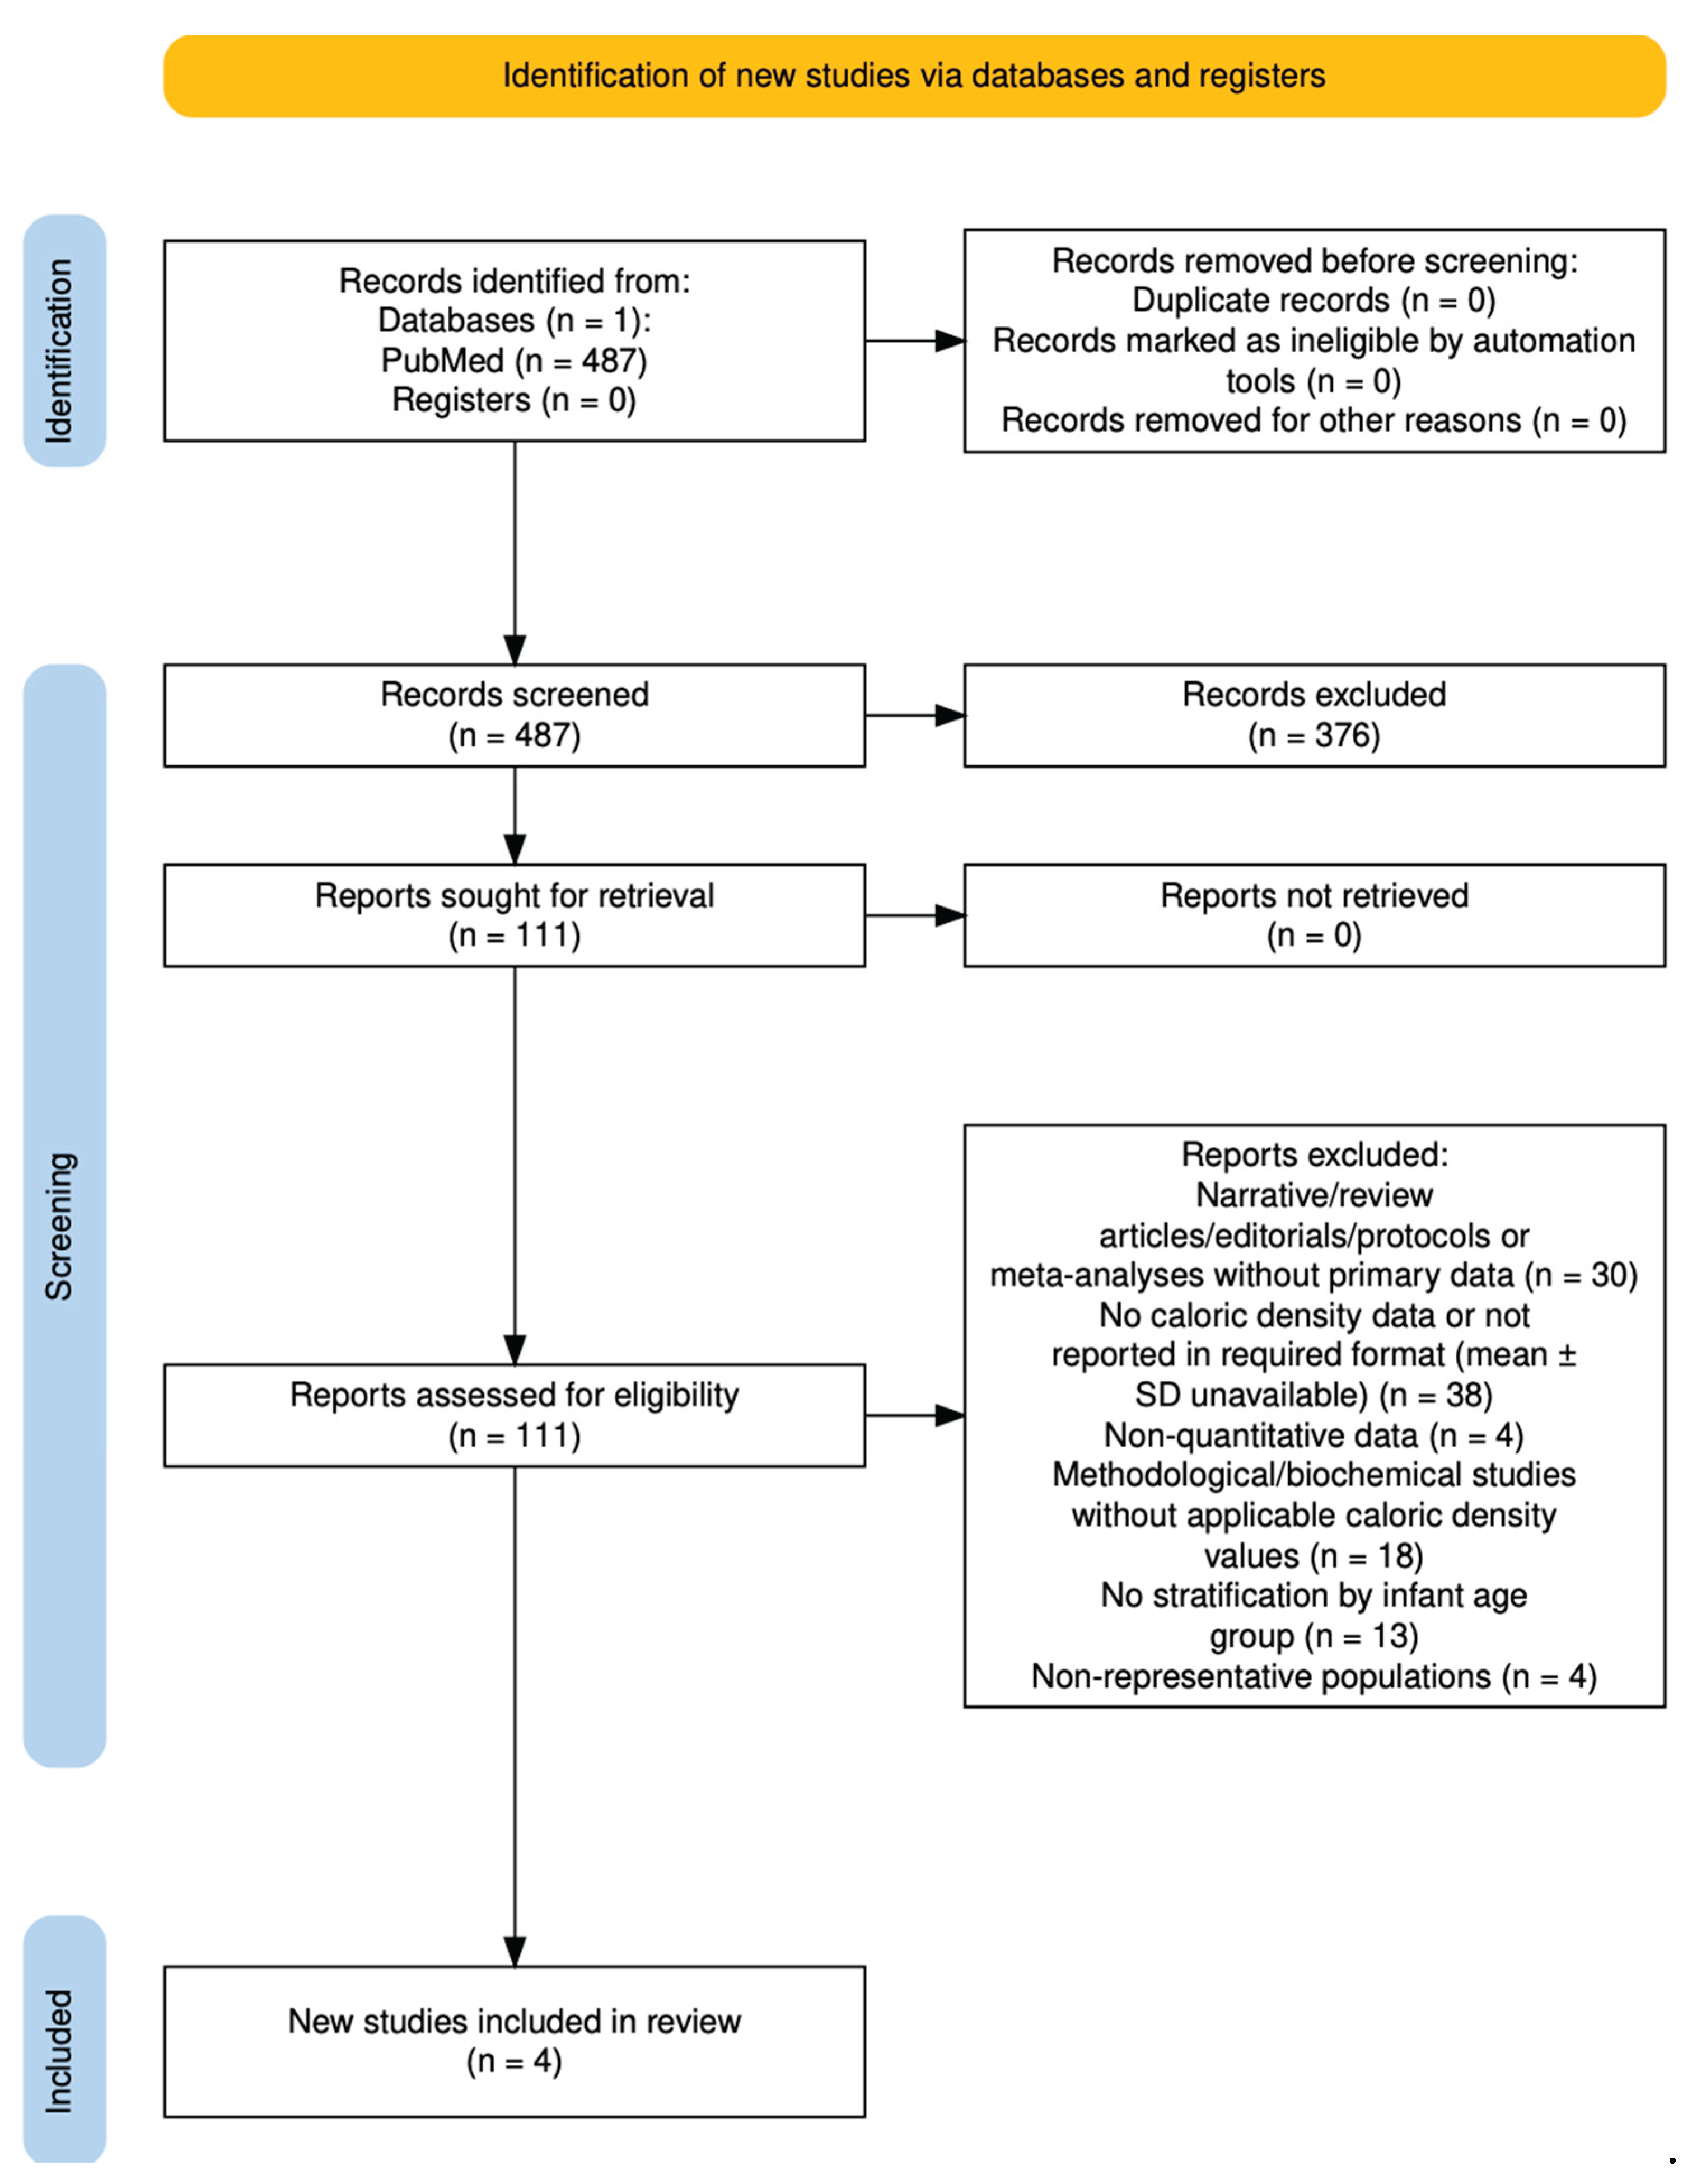
Figure 2.
PRISMA 2020 flow diagram of study selection for breast milk volume per feeding (2005–2025).
Figure 2.
PRISMA 2020 flow diagram of study selection for breast milk volume per feeding (2005–2025).
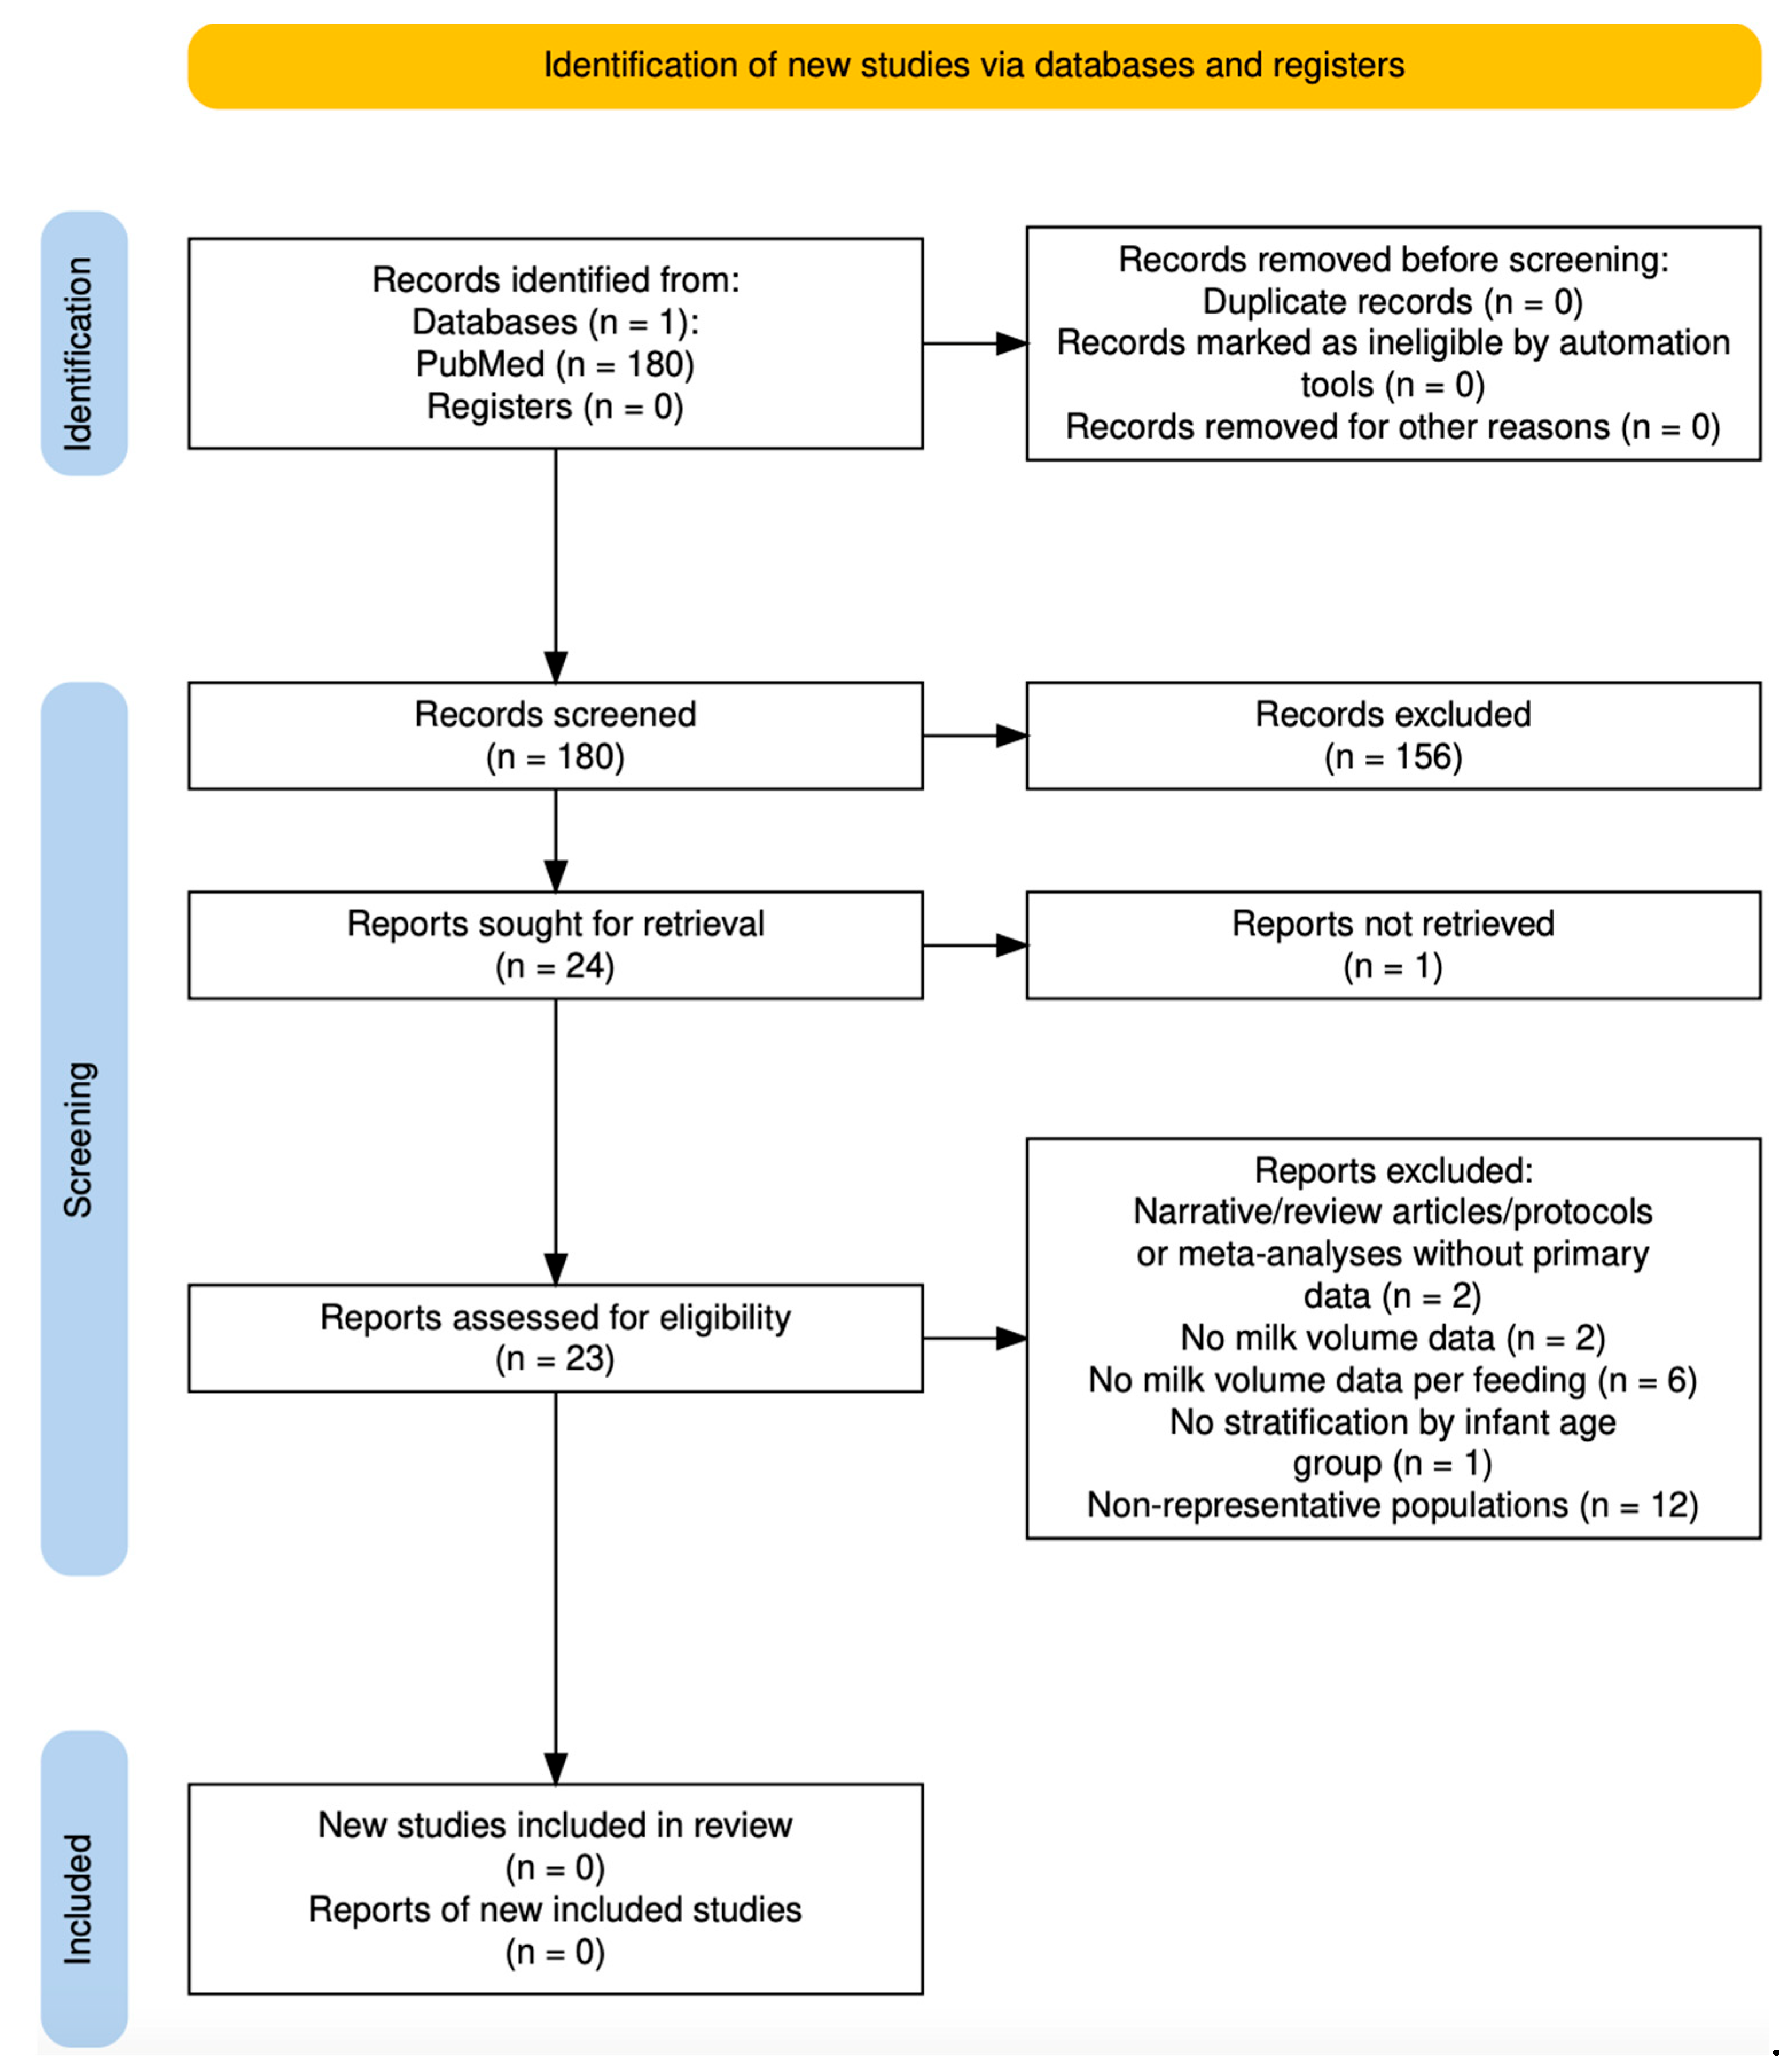
Figure 3.
PRISMA 2020 flow diagram of study selection for breastfeeding frequency (2005–2025).
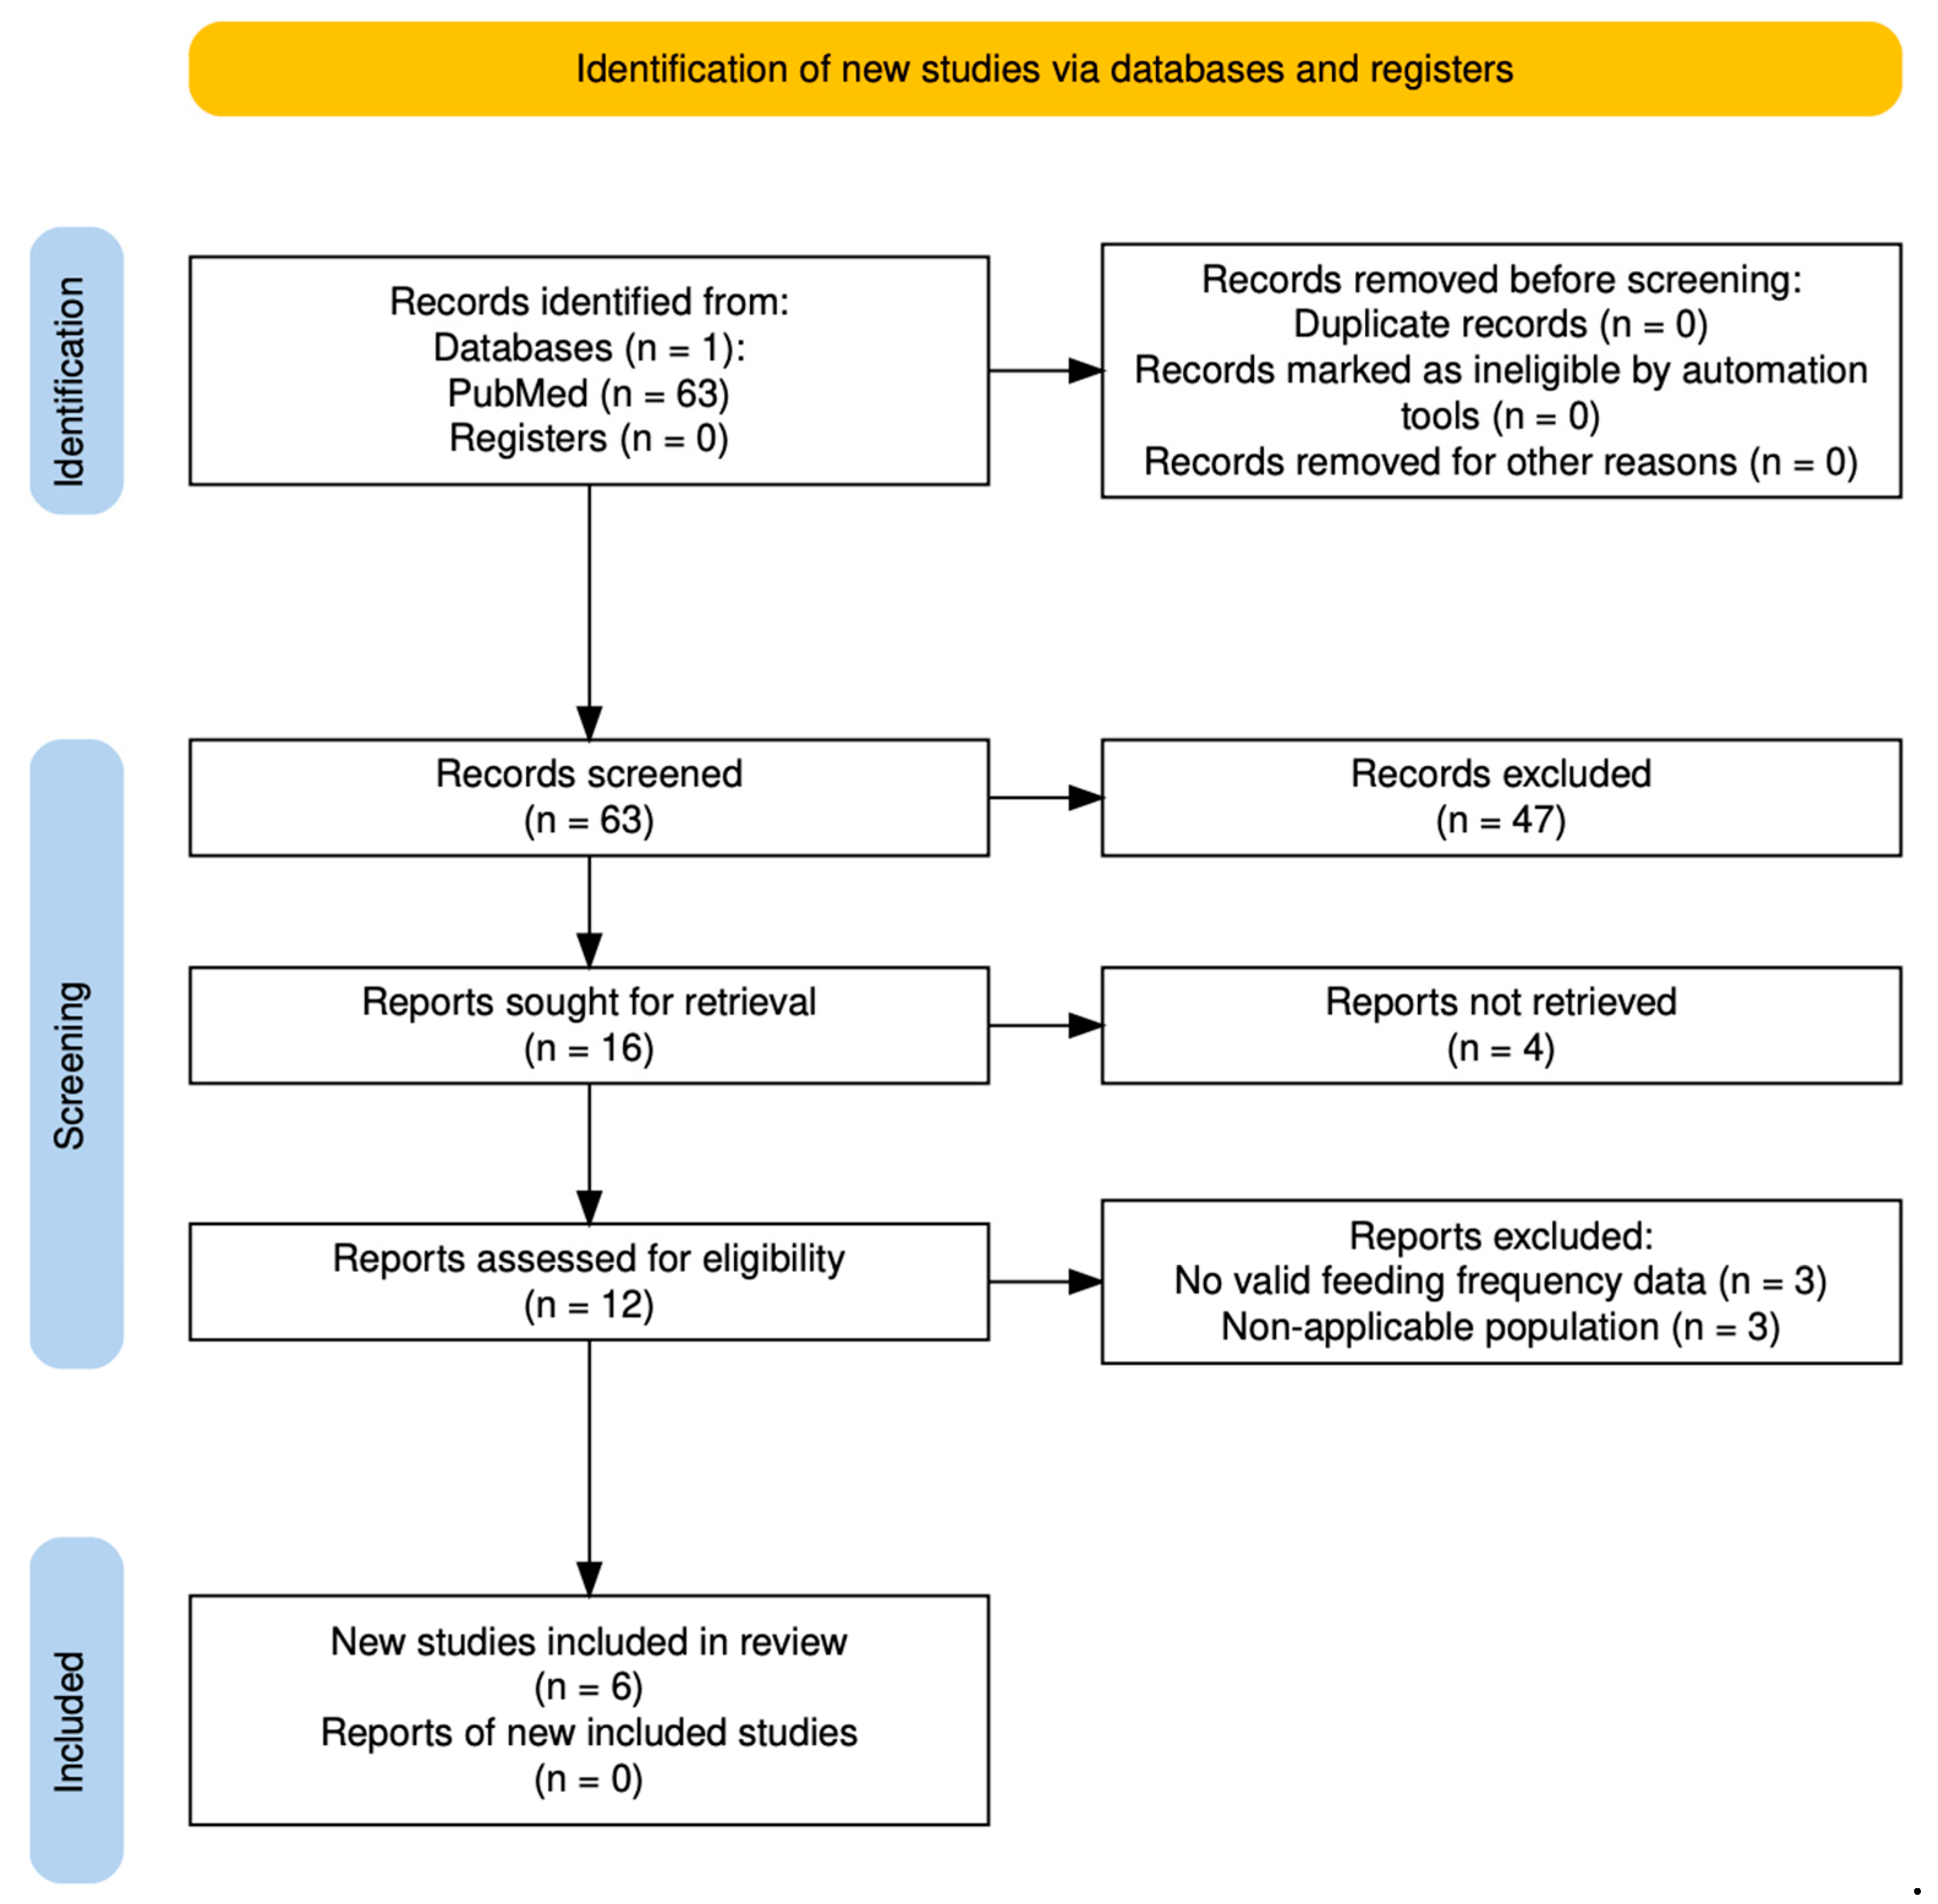
Figure 4.
Estimated caloric intake from breastfeeding per day and per feeding across infancy based on probabilistic simulations. Panel A: Simulated caloric intake per day (kcal/kg body weight/day) by age group. Panel B: Simulated caloric intake per feeding (kcal/kg body weight/feed) by age group4. Discussion
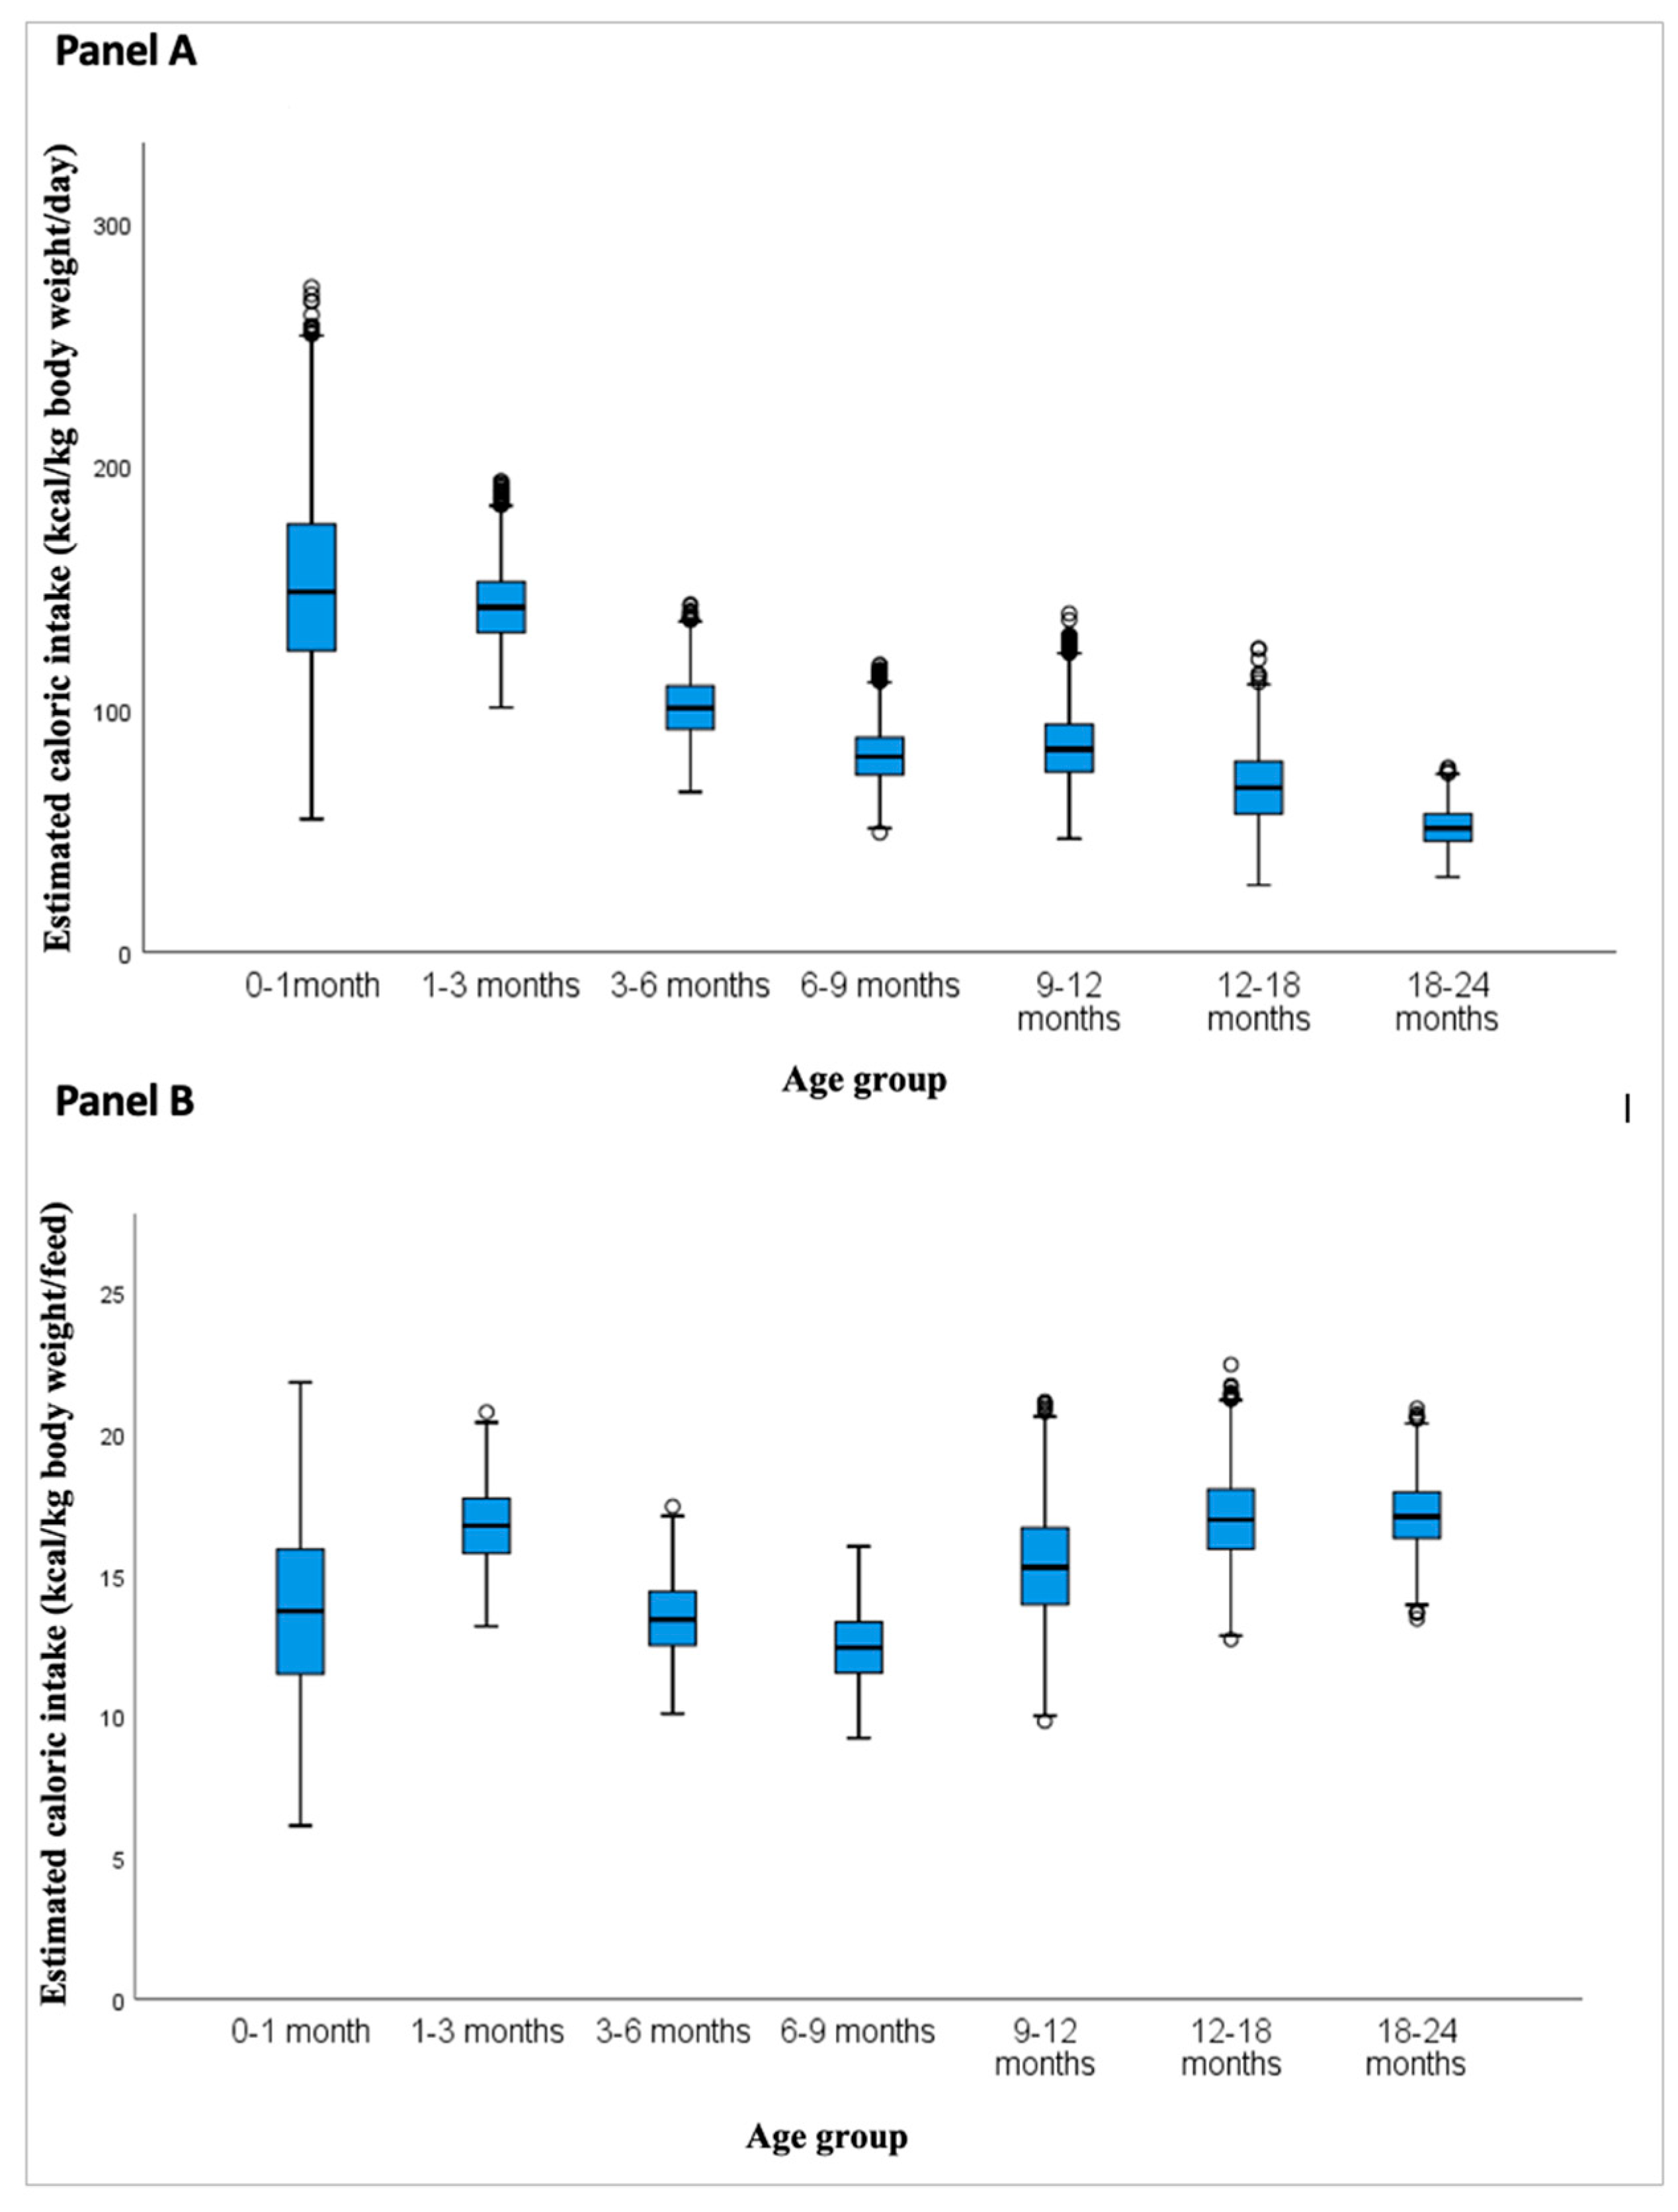
Table 1.
Summary of studies identified through PubMed and Elicit search on breast milk caloric density in full-term infants (2005–2025).
Table 1.
Summary of studies identified through PubMed and Elicit search on breast milk caloric density in full-term infants (2005–2025).
| Source | Study (Author, Year) | Country | Design | Sample Size | Age Range Covered | Method Used | Included in Meta-analysis |
|---|---|---|---|---|---|---|---|
| PubMed and Elicit | Saarela et al., 2005 | Finland | Longitudinal cohort | 483 | 1 week–6 months | Chemical/enzymatic methods | Yes |
| Elicit | Chang et al., 2015 | South Korea | Observational cohort | 2000+ | 0–9 months | FT-IR | Yes |
| PubMed and Elicit | Grote et al., 2016 | Multicountry | Cohort | 174 | 1–6 months | GC, HPLC, etc. | Yes |
| PubMed and Elicit | Czosnykowska-Łukacka et al., 2018 | Poland | Mixed methods | 137 | 0–24 months | MIRIS | Partially (9–24 months) |
| PubMed and Elicit | Fischer Fumeaux et al., 2019 | Switzerland | Longitudinal cohort | 61 | 0–3 months | MIRIS | Yes |
| Elicit | Ongprasert et al., 2020 | Thailand | Cross-sectional | 184 | 6–24 months | Colorimetric | Partially (9–24 months) |
Abbreviations: FT-IR: Fourier-transform infrared spectroscopy; GC: gas chromatography; HPLC: high-performance liquid chromatography; MIRIS: mid-infrared human milk analyzer. Source: Created by the authors based on data extracted through a systematic review of PubMed and complemented with Elicit (Ought, CA, USA) [12]. Study screening and data extraction were conducted independently by two reviewers. Data adapted from Saarela et al., 2005, Fischer Fumeaux et al., 2019; Chang et al., 2015; Czosnykowska-Łukacka et al., 2018; Ongprasert et al., 2020; Grote et al., 2016 [10,11,16,17,18,19].
Table 2.
Summary of studies identified through PubMed and Elicit search on breastfeeding frequency in full-term infants (2005–2025).
Table 2.
Summary of studies identified through PubMed and Elicit search on breastfeeding frequency in full-term infants (2005–2025).
| Source | Study (Author, Year) | Country | Design | Sample Size | Age Range Covered | Method Used | Included in Analysis |
|---|---|---|---|---|---|---|---|
| PubMed | Thomas et al., 2005 | USA | Longitudinal cohort | 37 | 4-10 weeks | Structured maternal interviews | Yes |
| Elicit | Study Group, 2006 | Multicountry | Longitudinal cohort | 1743 | 0–24 months | 24-hour recall, structured interview | Yes |
| PubMed and Elicit | Kent et al., 2006 | Australia | Cross-sectional observational | 71 | 1–6 months | Direct observation (not explicitly stated) | Yes |
| Elicit | Saki et al., 2013 | Iran | Longitudinal cohort | 287 | 0–6 months | Structured maternal interviews | Yes |
| Elicit | Kent et al., 2013 | Australia | Longitudinal cohort | 52 | 0–6 months | Direct observation (not explicitly stated) | Yes |
| PubMed | Chen et al. 2015 | Taiwan | Longitudinal cohort | 98 | 0-2 weeks | Direct observation | Yes |
| PubMed | Gridneva et al., 2018 | Australia | Longitudinal cohort | 20 | 0-12 months | Direct observation and structured maternal interviews | Yes |
| PubMed | Huang et al., 2020 | Taiwan | Longitudinal cohort | 65 | 1-28 days | Structured maternal interviews | Yes |
| PubMed | Ongpraset et al., 2025 | Northern Thailand | Cross-sectional observational | 1122 | 6-24 months | Structured maternal interviews | Yes |
Abbreviations: USA: United States of America. Source: Created by the authors based on data extracted through a systematic review of PubMed and complemented with Elicit (Ought, CA, USA) [12]. Study screening and data extraction were conducted independently by two reviewers. Data adapted from Thomas et al., 2005; Study Group, 2016; Kent et al., 2006; Saki et al. 2013; Kent et al., 2013; Chen et al. 2015; Gridneva et al., 2018; Huang et al., 2020; Ongpraset et al., 2025 [20,21,25,26,27,28,29,30,31,32].
Table 5.
Estimated caloric intake from breast milk per feeding and per day (kcal/kg body weight) by age group.
Table 5.
Estimated caloric intake from breast milk per feeding and per day (kcal/kg body weight) by age group.
| Age | 0-1 | 1-3 | 3-6 | 6-9 | 9-12 | 12-18 | 18-24 | |
|---|---|---|---|---|---|---|---|---|
| (months) | ||||||||
| Mean (p50) | Kcal/kg/feed | 13.71 | 16.75 | 13.46 | 12.43 | 15.32 | 16.99 | 17.11 |
| Kcal/kg/day | 150.8 | 142.34 | 100.92 | 80.83 | 84.28 | 67.94 | 51.33 | |
| SD | Kcal/kg/feed | 2.96 | 1.33 | 1.31 | 1.23 | 1.92 | 1.49 | 1.16 |
| Kcal/kg/day | 36.88 | 16.27 | 12.77 | 11.13 | 14.17 | 15.03 | 7.77 | |
| LCI (Q1) | Kcal/kg/feed | 11.49 | 15.76 | 12.51 | 11.54 | 13.95 | 15.92 | 16.03 |
| Kcal/kg/day | 124.11 | 131.53 | 91.68 | 72.89 | 74.14 | 56.91 | 45.73 | |
| MCI (Q2) | Kcal/kg/feed | 13.71 | 16.74 | 13.42 | 12.43 | 15.27 | 12.72 | 17.06 |
| Kcal/kg/day | 148.33 | 141.98 | 100.41 | 80.46 | 83.42 | 67.64 | 51.01 | |
| HCI (Q3) | Kcal/kg/feed | 15.91 | 17.71 | 14.42 | 13.33 | 16.67 | 18.02 | 17.93 |
| Kcal/kg/day | 176.09 | 152.49 | 109.56 | 88.27 | 93.68 | 78.45 | 56.9 |
Based on second-order Monte Carlo simulations (5,000 iterations per age group) using probabilistic inputs for feeding frequency, volume, caloric density, and infant weight. Values are expressed as kcal per kg of infant body weight per feed or per day. “Mean (p50)” refers to the arithmetic mean of the simulations. LCI, MCI, and HCI correspond to the first (Q1), second or median (Q2), and third quartiles (Q3), respectively. Abbreviations: SD: standard deviation. LCI: low caloric intake; MCI: medium caloric intake; HCI: high caloric intake.
Disclaimer/Publisher’s Note: The statements, opinions and data contained in all publications are solely those of the individual author(s) and contributor(s) and not of MDPI and/or the editor(s). MDPI and/or the editor(s) disclaim responsibility for any injury to people or property resulting from any ideas, methods, instructions or products referred to in the content. |
© 2025 by the authors. Licensee MDPI, Basel, Switzerland. This article is an open access article distributed under the terms and conditions of the Creative Commons Attribution (CC BY) license (http://creativecommons.org/licenses/by/4.0/).
Copyright: This open access article is published under a Creative Commons CC BY 4.0 license, which permit the free download, distribution, and reuse, provided that the author and preprint are cited in any reuse.


