
Submitted:
17 November 2024
Posted:
19 November 2024
You are already at the latest version
Abstract
Results suggest that the Grand Inga project will be resilient to negative climate impacts during its initial phases (1-5). The system demonstrates security and insensitivity to adverse changes, both for existing (Phase 1-2) and planned (Phase 3-5) hydropower components. The study indicates that climate change effects become apparent only in later phases (6-8), with predominantly positive impacts, potentially increasing the generation potential of the hydropower system. Overall, the Grand Inga hydropower project appears robust against adverse climate influences throughout the majority of its development phases.
Keywords:
Grand Inga
; Multi-input approach
; GRC averaging
; NEX-GDDP datasets
; Congo basin
1. Introduction
The acceleration of the global water cycle through increased evaporation and precipitation rates caused by greenhouse gas (GHG) emissions is a direct consequence of climate change [1,2,3]. This alteration redistributes water resources and intensifies the frequency and severity of extreme hydrological events [1,3,4], thereby impacting the operation of water infrastructure such as dam design and hydropower production [1,5,6,7,8].
The growing energy demand to support socioeconomic advancement is anticipated to drive further GHG emissions, amplifying atmospheric concentrations and resulting in a more pronounced climate and hydrological shift in the 21st century [9]. Against this backdrop, hydropower emerges as a dominant and cost-effective renewable energy source that plays a pivotal role in curbing GHG emissions and mitigating climate change. It's experiencing robust expansion across various global regions [10,11,12,13].
Previous studies have predominantly explored climate change's impact on water resources and hydropower generation using a top-down modeling approach. These studies integrated projections from general circulation models (GCMs) with hydrological models, reservoir operation models, and hydropower models [14,15,16,17,18]. It was generally observed that globally, projected annual mean streamflow would rise in high-latitude and wet tropical areas, while it would decrease in most dry tropical regions, alongside increased frequency of hydrological extremes [1,9].
Climate change introduces variability in precipitation and temperature patterns, impacting the streamflow regime and consequently affecting the resource potential of a basin[19,20,21]. Given that hydrological inputs are pivotal in assessing hydropower system potential, climate change impact assessments (CCIA) should integrate hydrologic models that accurately represent the contributing catchment [22,23,24,25]. These studies inherently carry uncertainties [25], primarily stemming from climate model and emission scenario uncertainties. To mitigate this, ensemble-based studies are recommended [26,27,28], with hydrologic-model-based climate change assessments incorporating climate model ensembles [29,30].
Climate change studies rely on diverse climate models simulating future climate scenarios for different greenhouse gas emission scenarios (GHGES). Projected climate variable data can be derived from various simulation runs of climate models, with general circulation models (GCMs) being common. Regional climate models (RCMs) offer a solution by providing high-resolution climate information based on GCM data [31,32].
The National Aeronautics and Space Administration (NASA) recently launched the Earth Exchange Global Daily Downscaled Projections (NEXGDDP) dataset, which facilitates future climate change studies at the watershed scale, as demonstrated by [33] and [34].
The Grand Inga hydropower project (GIHP) on the Congo River in the Democratic Republic of Congo (DRC) is a notable initiative, comprising the world's largest proposed hydropower scheme. Positioned at the Inga Falls site, it holds enormous potential for energy production. As climate change poses a significant threat to such projects, evaluating its impact on hydropower generation becomes imperative.
Thus, this study uniquely focuses on the specific challenges and opportunities posed by climate change for the Grand Inga hydropower project, unlike previous studies that explored broader impacts on water resources and hydropower generation. By narrowing its scope, the study provides a detailed and comprehensive analysis tailored to the world's largest proposed hydropower scheme.
Leveraging the Earth Exchange Global Daily Downscaled Projections (NEXGDDP) dataset by NASA, this study utilizes high-resolution climate information at the watershed scale. This approach offers a more granular and accurate assessment of climate change's impact on GIHP performance compared to previous studies that relied on less detailed climate data.
Additionally, to address uncertainties in climate modeling, the study adopts an ensemble-based approach. By integrating multiple climate models and scenarios, it enhances the robustness and reliability of its projections, providing nuanced insights into future hydrology and energy generation scenarios for GIHP.
2. Grand Inga - Overview and Project Planning
2.1. Overview on Inga Falls
The hydropower potential of the Congo River at the Inga site has been known since the beginning of the 20th century. The Inga site is a 32-km stretch of the Congo River, located approximately 280 km downstream of the Capital city of Kinshasa in the Democratic Republic of the Congo (DRC) (Figure 1). This stretch of river has a natural river profile that drops 97 m in elevation. With a mean annual flow (MAF) of around 40 000 m³/s at this site and a gross head that may be raised to 150 m, The hydroelectric potential in Inga falls is huge, the installed capacity could be developed to exceed 47 000 MW with an annual generation exceeding 360 TWh. This can be compared to the present (2021) hydropower fleet in whole Africa of 38 000 MW and 146 TWh. The two first phases of the development of the Inga site, Inga 1 (350 MW) and Inga 2 (1,400 MW), were completed in 1971 and 1982, respectively. Since then, no major new power plants have been constructed in the Country.
2.2. Development Prospects of Grand Inga
Many studies on further development of Grand Inga have been performed, a good summary of possible future development is given by Nzakimuena, St-Pierre [35] and Zahera and Fuamba [36]. The hydropower simulation models developed in this study was based on the final proposed scheme elaborated by AECOM-RSW/EDF consortium and submits to the Congolese government in 2012 as provisional feasibility report for the development study of the Inga hydroelectric site and associated interconnections. In this scheme further development has been planned in several phases, from Phase 3 to Phase 8. Each phase will consist of several turbine/generator sets, from 8-12 in each [35].
3. Data and Methods
3.1. Modelling Procedure
This study was carried out by first developing a conceptual hydrological model which is calibrated based on historical climate dataset and the observed streamflow. The hydrological model is subsequently forced with the projected future high- resolution NASA Earth Exchange Global Daily Downscaled Projections (NEX-GDDP) dataset. The hydropower generation model was used to compute the future energy production.
3.2. Data
3.2.1. System Data for Inga Falls Hydropower Development
Data for existing (Inga 1 and 2) and planned (Inga 3-8) is summarized in Table 1. It should be noted that further development is also possible, given that a residual fall still exists after the installation of eight projected phases. Some calculations are done here for two additional phases (Inga 9 and 10).
The three columns EEQV1, EEQV2 and Pmax has been compute based on Qmax and Head, with some additional assumptions regarding turbine and generator efficiency, and head losses.
Phase 9 and 10 have been added here, to show the possibility of further expansion of the project and compute utilization. Same type of turbines as in Inga 4-8 were assumed.
3.2.2. System Data
The streamflow data for the Inga outlet was sourced through the R.V.F (Régie des voies fluviales). These data played a crucial role in both the calibration process and the assessment of the hydrological modeling's performance. Specifically, the dataset encompassed the daily flow rates at Inga Falls over a span of 20 years, ranging from January 1, 1981, to December 31, 2000 (as depicted in Figure 2a). The flow duration curve is visualized in Figure 2b.
Key statistics extracted from the dataset are as follows:
Average flow: 39,912 m³/s
Median flow: 37,393 m³/s
Maximum flow: 82,428 m³/s (occurred on December 28, 1996)
Minimum flow: 23,063 m³/s (recorded on July 26, 1987)
3.2.3. Data for Future Climate Projection
To assess the hydrological response to climate change in the Congo River basin, a high- resolution NASA Earth Exchange Global Daily Downscaled Projections (NEX-GDDP) dataset was used in this study. The NEX-GDDP-CMIP5 [37] and NEX-GDDP-CMIP6 [38]dataset can be used in conducting studies of climate change impacts at the spatial scale of individual towns, cities, and watersheds. NEX-GDDP is the output of Coupled Model Inter-Comparison Project Phase 5 (CMIP5) and Phase 6 (CMIP6) GCMs downscaled at high spatial resolution (0.25° × 0.25°) and available as daily data projections from 1950–2100. The bias correction and spatial disaggregation (BCSD) regression-based statistical downscaling method was applied in the development of this dataset to improve the efficiency of low-resolution GCMs for removing local biases [37,38,39]. A subset of 13 CMIP6 models and their predecessor CMIP5 was selected in this research (Table 2).
3.3. Hydrological Model
Temperature and precipitation from the new high- resolution NASA Earth Exchange Global Daily Downscaled Projections (NEX-GDDP) datasets were used as input to a hydrological model to predict water inflows along the complete watercourse of the Congo River. Hydrological modelling was performed by the HEC-HMS model. The HEC-HMS model is designed to simulate the complete hydrological processes and can be used for both continuous and event-based modelling [40].
HEC-HMS has several Loss Method. However, with soil moisture accounting (SMA) algorithm, it accounts for watershed’s soil moisture balance over a long-term period and is suitable for simulating daily, monthly, and seasonal stream flow [41,42]. The SMA algorithm takes explicit account of all runoff components including direct runoff (surface flow) and indirect runoff (interflow and groundwater flow)[43].
The model requires inputs of daily rainfall, soil condition and other hydro meteorological data. Besides precipitation and temperature, the only other input to the SMA algorithm is the potential evapotranspiration rate. The potential evapotranspiration was computed using the Oudin formulation [44]. HEC-HMS model has been used by several researcher and has shown excellent results [42,45,46]. The structure of SMA is described in detail in the HEC-HMS Technical Reference Manual [47].
3.4. Model Calibration
The first phase of this methodology involved calibrating the HEC-HMS model at the Inga outlet. This calibration process utilized 13 CMIP6 and 13 CMIP5 historical datasets, coupled with observed hydrometric data. Consequently, a total of 26 model calibrations were undertaken, representing (Inga x 1 hydrological model x 13 datasets x 2).
One of the calibration strategies applied encompassed calibrating the model using the entire available dataset, bypassing the conventional validation phase. This strategy capitalizes on extracting maximum information from climate data to shape the parameter set, thereby reducing additional uncertainty linked to selecting calibration and validation periods [48]. Importantly, the statistical enhancement of model performance often arises from expanding the dataset with more years, and the skills required for validation and calibration are not inherently intertwined [49].
Within this study, the HEC-HMS model underwent calibration across the complete available dataset (1981-2000), without following the customary validation step. Due to the model's intricate parameter landscape, a preliminary parameter estimation was derived using insights from the HEC-GeoHMS Extension in tandem with the ArcHydro extension within ArcMap 10.7.1. However, discrepancies in certain physical parameters (such as reach length and slope) emerged from HEC-GeoHMS, necessitating manual rectification through QGIS 3.14.
The primary step in the calibration of the HEC-HMS model involved a manual fine-tuning of model parameters, employing the trial-and-error approach. This methodology empowered the modeler to subjectively adjust parameters, facilitating an appropriate alignment between observed and simulated hydrographs [50]. Subsequently, the Optimization Trials tool integrated within HEC-HMS was employed for automated calibration, serving to refine parameter values.
3.5. Multi-Input Ensemble Modelling
The concept of combining the output obtained from different models or methods was discussed and used in the pioneering works of [51,52,53,54] and others [55,56]. The essence of the concept of these methods is that each model output captures certain important aspects of the information available about the process being modeled, thereby providing a source of information that may be different from that of other models [56,57]. Combining these various sources of information may enable the user to gain a merged, all-inclusive picture for a given study area [56].
Several methods of combining model outputs have been reported: the simple average method, the weighted average method [56,57], the neural network method [56,58], Bayesian model averaging method (BMA) [59], Shuffle complex averaging (SCA) [59], and Granger Ramanathan A, B and C (GRA, GRB and GRC) [60].
Compared with more traditional averaging methods, GRA is becoming popular due to its ability to optimize weights based on performance and thus providing a superior choice in modeling. In this study, the GRC variant [61]was implemented because it is robust, easy to implement, and fast, which were key selection criteria for this study.
3.6. Hydropower Generation Simulations
The planning, design, operations, and financial evaluation of hydropower systems are based on hydrological time series. Normally periods ranging between 20 to 50 years are used for evaluations [62]. To obtain the change in hydropower production that results from climate change, production calculations are necessary, and these are carried out using hydropower simulation models. The simulation model reflects the main features of the existing hydropower system and is thus run over several years to get stable average estimates, first in the current period and then in the future. There are not so many hydropower simulation models when compared to hydrological models.
The simplest and statistical way of computing power production is correlation between historical records of flow and production [62]. However, this does not work in all cases. The best approach is to use a process-based hydropower simulation in which most of the important components of the hydropower system are defined. In this study, the hydropower simulation discharge in the river was simulated using the nMAGRes.xls, an Excel worksheet developed to make possible the automate export of nMAG [63]simulation results into Excel.
3.6.1. Hydropower Model Application
Hydropower generation calculations are based on observed daily flows from 1981 to 2000 and simulated daily flows derived from various climate models and emission scenarios. The conversion from flow to power relies on technical data from both existing (Inga 1 and 2) and planned (Inga 3-8) hydropower systems at Inga Falls.
Each generating unit (comprising a turbine and a generator) the power generation is computed as
P (MW) = 9.81 * η * Q * Hn.
where:
η is total efficiency in turbine, generator, and transformer
Q is flow in m3/s.
Hn is net head (gross head – head loss) in m.
For Inga 1 and 2, efficiency parameters are derived from operational data, whereas Inga 3-8 assumes Francis’s turbines with a 96% efficiency, a combined generator + transformer efficiency of 98%, and 1.5% head loss.
The comprehensive (Grand Inga) project is scheduled to unfold in eight phases, with Phase 1 and 2 being existing power plants and Phase 3 to 8 being in the planning stages. The various phases encompass different numbers of units, utilizing the full 150 m head, except for Phase 1 and 2, which utilize only a limited part of it. The augmentation of head is accomplished by constructing a substantial dam across the river, elevating the intake level to 150 m. A minimum bypass flow of 10% of average flow (3700 m³/s) is stipulated for all simulations.
3.6.2. Steps of the Hydropower Generation Simulation Project
- Define the hydropower model for existing and prospective developments in Inga Falls.
- Generate power from observed flow from 1981-2000 (Baseline, 1 Run).
- Generate power from flow data acquired from 13 Climate models for 1981-2000 (13runs).
- Produce generation from future flow data under two main climate modeling scenarios: CMIP5 and CMIP6, each involving different models, RCP/SSP scenarios, and time frames, leading to 65 different runs per scenario.
- Compile summary results for all models and emission scenarios.
4. Results and Discussion
The findings related to hydrological modeling, climate scenario forecasts, simulations of upcoming hydrological predictions, and future energy production are outlined in this section.
4.1. Hydrological Modelling
As started in the methodological section, HEC-HMS model has been calibrated based on the data available at the Inga outlet. The historical datasets of 13 NEX-GDDP-CMIP6 and their predecessors CMIP5 for the period 1981-2000 have been used for the model development. The GRC weighting approach was applied to generate the weights according to the simulated and the observed hydrographs. The same weights were applied to the 13 members to generate a single weighted hydrograph which was assessed using the Nash-Sutcliffe Efficiency metric for CMIP6 and CMIP5. The weights generated during the calibration of each hydrograph are then employed for model run in future climate scenario. The detailed results of calibration are not presented here for brevity. Daily precipitation and temperature data is used for hydrologic modeling while the daily streamflow data is used for model calibration. Figure 3 presents the summary of simulation of the daily streamflow patterns during the calibration period.
13 CMIP5 members, solid line indicates observed flows(blue) and GRC average(red).
4.2. Projected Hydrologic Scenario
After interpreting the projections in climate variables, the projection in hydrologic scenario is assessed. Streamflow of the basin is generated by forcing the projected climate data into the earlier calibrated hydrological model. The runoff generation for the future scenario shall be the combined effect of precipitation and temperature projections. Future streamflow pattern by each of the model scenarios is presented in Figure 4 and compared with the historical flows.
4.3. Hydropower Generation Simulations
4.3.1. Flow Duration Curve
The flow-duration curve (FDC) was prepared with the GRC daily discharge simulated from HEC-HMS model averaged over 20 years for the baseline period and future time periods for both CMIP5 and CMIP6 scenarios (Figures 5&6).
This FDC presents for Inga Falls the duration during which a certain flow value is reached or exceeded for both CMIP5 and CMIP6 scenarios. It allows you to select the nominal flow rate of the projected installation by considering the reserved flow rate and the technical minimum flow rate of the equipment. It also makes it possible to estimate the power of the plant and its average annual production.
Its distribution throughout the year is necessary for economic reasons since the sales prices applied to independent producers vary with the seasons of the year and the hours of the day.
4.3.2. Water utilization Duration Curve
The minimum bypass (environmental) flow of 3700 m3/s requires water. At full development up to and including Inga 8, the maximum flow that can be utilized in power plants is 36800 m3/s + 3700 m3/s or 40500 m3/s. Any flow larger than this will lead to flood spill at the dam. The maximum power capacity at this flow (36800 m3/s) is 47544 MW. This is equivalent to 1.14 TWh/day. Figure 7 and Figure 8 visualize total water utilization for Inga Falls, for CMIP5 and CMIP6 respectively, based on simulated flow for all scenarios. It is observed that there is ample water to maintain full capacity in the turbines approximately 40% of the time, while Inga 6, 7, and 8 will experience intervals where full generation capacity is not attainable.
Power generation is simulated daily, prioritizing water use as follows:
1. Minimum flow (3700 m³/s) - Highest Priority.
2. Units in Phase 1 - Second Priority.
3. Units in Phase 2 - Third Priority.
4. Units in Phases 3 to 8 - Decreasing Order of Priority.
4.3.3. Hydropower Generation from Observed Flow 1981-2000
Historically (1981-2000), the minimum flow at Inga Falls has been 23063 m3/s. The total capacity for Phase 1 and Phase 2 power plants is only 3580 m3/s (6*130+8*252.5) so there will always be enough water to run Inga 1 and 2 at full capacity, and still supply the minimum flow of 3700 m3/s. In fact, there will nearly always be water enough to also meet the full capacity for Inga 3, Inga 4, and Inga 5. But with the introduction of Inga 6, there will be episodes where the available flow is not always enough to run at full capacity, and the number of such episodes will increase for each Phase. This is illustrated by the Figure 9.
Figure 9 shows simulated generation (MW) each day during the historic period 1981-2000. The results are stacked so it is easy to see if there is a reduced generation due to limiting flow. We can see that power plants in Phase 1 to 5 almost always generate at full capacity, while those in Phase 6, 7 and 8 have increasing episodes of reduced or no generation, due to shortage of water. (Phase 5 has a few days with flow slightly below capacity). The average number of Full Load Hours (FLH) and Capacity Factor (Cf) is computed for each simulation and results are shown in Table 4, the two rightmost columns. The duration curves for Inga 6, 7 and 8 are shown in Figure 10. Increasing the installed capacity beyond Inga 8 is probably not economically viable, but we have still computed and presented the results in the Table 4.
It can be seen from Table 4 that the number of Full Load Hours (FLH) and Capacity Factor (Cf) decreases from 8760 hours and 100% for Inga 1 to Inga 5, to 4221 hours and 48% for Inga 8. Main generation results for each Phase are shown in Table 4. The results are computed cumulative, as flow (Qmax), power (Pmax) and average annual Energy generation (Energy) for each Phase from Inga 1 up to and including this Phase. Computed energy generation of a fully developed system (Inga 1 to Inga 8) would give an average annual generation of 360 TWh/year, practically 1 TWh/day.
4.3.4. Hydropower Generation from Each Future Simulation
Each of the future simulations (Model run) is done with a timeseries of 20 years (like 1981-2000) flow data and the hydropower system as described above. This results in a time-series of hydropower generation (MW/day) for each of the 8 phases. The results are summarized into the following main statistics:
Average annual generation Inga 1-2
Average annual generation Inga 3-8
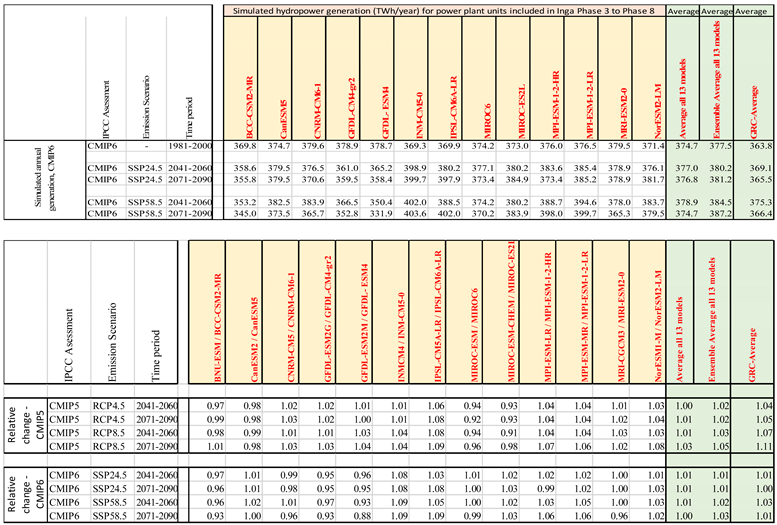
For this study, the generation in existing powerplants Inga 1 and 2 is not affected by climate change and is therefore not used further. There will always be enough water for full supply even after possible climate change. The main Results of change in hydropower generation due to Climate Change for CMIP5 and CMIP6 are summarized in table 5,6 and 7. Figure 11 shows simulated change in hydropower generation for all future scenarios of CMIP5 and CMIP6.
Table 7 shows the ratio between simulated annual generation in Inga 3-8 and simulated generation during 1981-2000 for the same model.
Hydropower Generation from CMIP5 Scenarios
Table 7 shows the projected change in the ensemble mean and range of the hydropower potential relative to the reference period under different RCPs. The mean annual power (MAP) generally increases in the two future time horizons.
As for the historical period (1981-2000) (Figure 9), in all CMIP5 futures scenarios there will always be enough water to operate Inga 1, Inga 2, Inga 3, Inga 4, and Inga 5 at their maximum capacity while ensuring a minimum flow rate of 3700 m3/s. This historical stability underscores the reliability of the system during that time frame.
However, unlike the historical period, the number of episodes introduced from Inga 6 decreases significantly for RCP4.5 scenario and almost disappears for RCP8.5 scenario.
This positive change is a consequence of the increasing of river flow patterns anticipated in the future.
As we move further along to the Inga 7 and Inga 8 phases, the episodes of favorable conditions persist, but they exhibit a less pronounced presence compared to the historical period. This phenomenon can be attributed to the projected increase in river flow for these future periods, which necessitates a more nuanced assessment of water availability and utilization.
To visually encapsulate these findings, please refer to Figure 12, which graphically illustrates the evolving dynamics of water supply and its impact on the various Inga phases.
Hydropower Generation from CMIP6 Scenarios
Hydroelectric production under the CMIP6 scenarios closely mirrors that of the CMIP5 scenarios. This consistency in outcomes is vividly depicted in Figure 13, where it becomes evident that all CMIP6 scenarios exhibit a strikingly similar pattern to that observed in CMIP5.
The data suggests that, despite the updated modeling and projections of CMIP6, the overall performance and behavior of hydroelectric production remain remarkably consistent with the previous CMIP5 findings. This alignment between the two sets of scenarios underscores the robustness and reliability of the observations, further reinforcing the implications for hydroelectric production in the context of climate change.
Hydropower Generation from CMIP5 and CMIP6 Scenarios Beyond Inga 8
Downstream from Inga Falls, extending towards the town of Matadi, the river gracefully descends in altitude, covering approximately 38 kilometers with a natural drop ranging from 32 meters to 35 meters. This residual fall in elevation presents an intriguing prospect for the distant future, particularly when considering advancements in dam construction techniques. It holds the promise of a multifaceted development endeavor that could seamlessly combine the benefits of hydroelectric power generation and enhanced navigability of the river.
This dual-purpose initiative has the potential to not only harness clean energy but also facilitate more efficient transportation and navigation along the waterway. Such a synergy between energy production and navigation could pave the way for a financially viable project, offering a win-win solution for both energy needs and improved river transport.
Figure 14 and Figure 15, as depicted in the graphs, shed light on a pertinent aspect. Under both CMIP5 and CMIP6 scenarios, there appears to be a substantial surplus of water that might otherwise go to waste if not harnessed for power generation purposes, particularly in the context of Inga 9 and 10. This surplus underscore the opportunity for further expansion and development downstream, presenting a compelling case for considering the feasibility of such projects in the broader context of sustainable resource utilization and regional development.
5. Conclusions
The present research was carried out to assess the changes in hydropower generation resulting from projected climate change conditions. The changing climate is posing a great threat to the future civilizations, due to the variations in precipitation and temperature patterns which indirectly is bound to alter hydrological cycle and consequently the streamflow pattern at a given place [15]. Rivers are very important for human live as various human activities are directly depended on example power generation. The entire infrastructure has been affected by the varying streamflow regime due to changing climate. Hydropower potential relies on the quantum of available water in the given stream and the extent of energy generation is hence allied with the streamflow pattern. It is vital to carry out an impact assessment for the existing hydropower facilities as they are huge capital investment schemes and a realistic study shall incorporate a hydrologic model [15,21]. In this study, the Grand Inga Hydroelectric project located in Congo River in the DRC was considered as a case study. The Grand Inga is a well-known, large-scale hydropower project in the world that will provide comprehensive benefits of flood control, power generation, Hydrogen production, and navigation which will be affected by climate change. The hydrological model was driven by the climate change projections of 13 NEX-GDDP CMIP6 and their predecessors CMIP5 under two RCPs and two SSPs to simulate the change of natural streamflow in the Inga Falls basin under climate change. The streamflow data of the nearby Inga gage was used to calibrate the hydrological model of the project basin and also to validate the power generation model. The hydrology of the basin was simulated using the conceptual hydrological model HEC-HMS. Future horizon of study was periods from year 2041-2060 and 2071-2090 whereas year 1981-2000 was taken as control period for climate data. An ensemble approach was used to conduct the climate change impact assessment study wherein a 13 NASA NEX-GDDP-CMIP6 and 13 NASA NEX-GDDP-CMIP5 datasets were used.
The overall impact on the Inga Falls technical potential is expected to be positive. It is clear that Inga Falls will be very secure against negative climate impacts, and not at all sensitive for possible negative changes both CMIP5 and CMIP6 scenarios. This is valid not only for the existing system Inga 1 and Inga 2, but also for Inga 3,4 and 5. It is only during Inga 6, 7 and 8 that climate change will have an impact. And this seems mostly to be positive, increasing the generation potential.
These findings indicate that the water resources management of the Inga Falls and upstream basin must take corresponding adaptive measures in the future, in order to make use of flood water and cope with the risk of increased inter-annual fluctuation of inflow for the impounding of Inga 6 to Inga 8. Increasing the flood storage capacity and strengthening the joint operation of the upstream cascade reservoirs are important means to overcome these adverse effects and are expected to turn adverse effects into favorable ones. The next step is to strengthen the research on the integrated management strategy of water resources in the upstream of Inga Falls under climate change.
Author Contributions
Conceptualization, S.Z. Salumu and M. Fuamba; methodology, S.Z. Salumu; software, A. Killingtveit and S.Z. Salumu; validation, S.Z. Salumu, A. Killingtveit and M. Fuamba; formal analysis, S.Z. Salumu; investigation, S.Z. Salumu; resources, S.Z. Salumu and M. Fuamba ; data curation, S.Z. Salumu; writing—original draft preparation, S.Z. Salumu; writing—review and editing, S.Z. Salumu, A. Killingtveit and M. Fuamba; visualization, , A. Killingtveit and S.Z. Salumu; supervision, M. Fuamba; project administration, S.Z. Salumu; funding acquisition, M. Fuamba. All authors have read and agreed to the published version of the manuscript.
Funding
This research received no external funding.
Data Availability Statement
The discharge data that support the findings of this study are available from Régies des voies fluviales (RVF), DR. Congo. Restrictions apply to the availability of these data, which were used under owner permission for this study. These data are available from the authors with the permission of RVF. The meteorological data that support the findings of this study are openly available from the NASA website at https://www.nccs.nasa.gov/services/climate-data-services. The DEM data that support the findings of this study are openly available in SRTM 1 arc second global at https://earthexplorer.usgs.gov/. The LULC data that support the findings of this study are available at: maps.elie.ucl.ac.be/CCI/viewer/download/ESACCI-LC-Ph2-PUGv2_2.0.pdf. The soil map data that support the findings of this study are available on request from openly available from FAO website at: https://www.fao.org/soils-portal/data-hub/soil-maps-and-databases/faounesco-soil-map-of-the-world/en/.
Acknowledgments
We thank Gabriel Mokango from the RVF, DR. Congo, for his help with discharge data.
Conflicts of Interest
The authors declare no conflict of interest.
References
- Qin, P.C., et al., Climate change impacts on Three Gorges Reservoir impoundment and hydropower generation. Journal of Hydrology, 2020. 580: p. 123922. [CrossRef]
- Huntington, T.G., et al., A new indicator framework for quantifying the intensity of the terrestrial water cycle. Journal of Hydrology, 2018. 559: p. 361-372. [CrossRef]
- Syed, T.H., et al., Satellite-based global-ocean mass balance estimates of interannual variability and emerging trends in continental freshwater discharge. Proc Natl Acad Sci U S A, 2010. 107(42): p. 17916-21. [CrossRef]
- Loaiciga, H.A., et al., Global warming and the hydrologic cycle. Journal of Hydrology, 1996. 174(1): p. 83-127. [CrossRef]
- Cui, T., et al., Development of a comprehensive framework for assessing the impacts of climate change and dam construction on flow regimes. Journal of Hydrology, 2020. 590: p. 125358. [CrossRef]
- Fluixá-Sanmartín, J., et al., Climate change impacts on dam safety. Natural Hazards and Earth System Sciences, 2018. 18(9): p. 2471-2488. [CrossRef]
- van Oorschot, M., et al., Combined effects of climate change and dam construction on riverine ecosystems. Ecological engineering, 2018. 120: p. 329-344. [CrossRef]
- Ehsani, N., et al., Reservoir operations under climate change: Storage capacity options to mitigate risk. Journal of Hydrology, 2017. 555: p. 435-446. [CrossRef]
- IPCC, Climate Change 2014–Impacts, Adaptation and Vulnerability: Part A: Global and Sectoral Aspects: Volume 1, Global and Sectoral Aspects: Working Group II Contribution to the IPCC Fifth Assessment Report. 2014, Cambridge University Press New York, NY.
- Berga, L., The Role of Hydropower in Climate Change Mitigation and Adaptation: A Review. Engineering, 2016. 2(3): p. 313-318. [CrossRef]
- Wasti, A., et al., Climate change and the hydropower sector: A global review. Wiley Interdisciplinary Reviews-Climate Change, 2022. 13(2): p. e757. [CrossRef]
- Hamududu and A. Killingtveit, Assessing climate change impacts on global hydropower, in Climate change and the future of sustainability. 2017, Apple Academic Press. p. 109-132. [CrossRef]
- Lu, S., et al., A review of the impact of hydropower reservoirs on global climate change. Sci Total Environ, 2020. 711: p. 134996. [CrossRef]
- Nohara, D., et al., Impact of climate change on river discharge projected by multimodel ensemble. Journal of Hydrometeorology, 2006. 7(5): p. 1076-1089. [CrossRef]
- Chilkoti, V., T. Bolisetti, and R. Balachandar, Climate change impact assessment on hydropower generation using multi-model climate ensemble. Renewable Energy, 2017. 109: p. 510-517. [CrossRef]
- Turner, S.W.D., J.Y. Ng, and S. Galelli, Examining global electricity supply vulnerability to climate change using a high-fidelity hydropower dam model. Science of The Total Environment, 2017. 590-591: p. 663-675. [CrossRef]
- van Vliet, M.T.H., et al., Power-generation system vulnerability and adaptation to changes in climate and water resources. Nature Climate Change, 2016. 6(4): p. 375-380. [CrossRef]
- Zhou, Y., et al., A comprehensive view of global potential for hydro-generated electricity. Energy & Environmental Science, 2015. 8(9): p. 2622-2633. [CrossRef]
- Liu, L.-L. and J.-J. Du, Documented changes in annual runoff and attribution since the 1950s within selected rivers in China. Advances in Climate Change Research, 2017. 8(1): p. 37-47. [CrossRef]
- Liu, L., et al., Impacts of 1.5 and 2 °C global warming on water availability and extreme hydrological events in Yiluo and Beijiang River catchments in China. Climatic Change, 2017. 145(1): p. 145-158. [CrossRef]
- Schaefli, B., Projecting hydropower production under future climates: a guide for decision-makers and modelers to interpret and design climate change impact assessments. Wiley Interdisciplinary Reviews-Water, 2015. 2(4): p. 271-289. [CrossRef]
- Chen, J., et al., Overall uncertainty study of the hydrological impacts of climate change for a Canadian watershed. Water Resources Research, 2011. 47(12). [CrossRef]
- Wilby, R.L., Uncertainty in water resource model parameters used for climate change impact assessment. Hydrological Processes, 2005. 19(16): p. 3201-3219. [CrossRef]
- Ludwig, R., et al., The role of hydrological model complexity and uncertainty in climate change impact assessment. Adv. Geosci., 2009. 21: p. 63-71. [CrossRef]
- Poulin, A., et al., Uncertainty of hydrological modelling in climate change impact studies in a Canadian, snow-dominated river basin. Journal of Hydrology, 2011. 409(3): p. 626-636. [CrossRef]
- Schaefli, B., Projecting hydropower production under future climates: a guide for decision-makers and modelers to interpret and design climate change impact assessments. WIREs Water, 2015. 2(4): p. 271-289. [CrossRef]
- Minville, M., F. Brissette, and R. Leconte, Impacts and Uncertainty of Climate Change on Water Resource Management of the Peribonka River System (Canada). Journal of Water Resources Planning and Management, 2010. 136(3): p. 376-385. [CrossRef]
- Blöschl, G. and A. Montanari, Climate change impacts—throwing the dice? Hydrological Processes: An International Journal, 2010. 24(3): p. 374-381. [CrossRef]
- Christensen, N.S. and D.P. Lettenmaier, A multimodel ensemble approach to assessment of climate change impacts on the hydrology and water resources of the Colorado River Basin. Hydrol. Earth Syst. Sci., 2007. 11(4): p. 1417-1434. [CrossRef]
- Kopytkovskiy, M., M. Geza, and J.E. McCray, Climate-change impacts on water resources and hydropower potential in the Upper Colorado River Basin. Journal of Hydrology: Regional Studies, 2015. 3: p. 473-493. [CrossRef]
- Buontempo, C., et al., An ensemble climate projection for Africa. Climate Dynamics, 2015. 44(7): p. 2097-2118. [CrossRef]
- Dosio, A., et al., Dynamical downscaling of CMIP5 global circulation models over CORDEX-Africa with COSMO-CLM: evaluation over the present climate and analysis of the added value. Climate Dynamics, 2015. 44(9): p. 2637-2661. [CrossRef]
- Chen, J.-Q. Sun, and H.-X. Li, Future changes in precipitation extremes over China using the NEX-GDDP high-resolution daily downscaled data-set. Atmospheric and Oceanic Science Letters, 2017. 10(6): p. 403-410. [CrossRef]
- Jain, S., et al., Advantage of NEX-GDDP over CMIP5 and CORDEX Data: Indian Summer Monsoon. Atmospheric Research, 2019. 228: p. 152-160. [CrossRef]
- Nzakimuena, et al., Hydroelectric development schemes of the Inga site (Democratic Republic of Congo), in ICOLD 2013 International Symposium. 2013: Seattle USA.
- Zahera and M. Fuamba, Grand Inga as One of the Solutions for Africa Energy Deficit. 2022.
- Thrasher, B., et al., Bias correcting climate model simulated daily temperature extremes with quantile mapping. Hydrology and Earth System Sciences, 2012. 16(9): p. 3309-3314. [CrossRef]
- Thrasher, B., et al., NASA Global Daily Downscaled Projections, CMIP6. Sci Data, 2022. 9(1): p. 262. [CrossRef]
- Wood, A.W., et al., Hydrologic implications of dynamical and statistical approaches to downscaling climate model outputs. Climatic change, 2004. 62(1-3): p. 189-216. [CrossRef]
- Bhuiyan, H.A.K.M., et al., Application of HEC-HMS in a Cold Region Watershed and Use of RADARSAT-2 Soil Moisture in Initializing the Model. Hydrology, 2017. 4(1): p. 9. [CrossRef]
- Ouédraogo, W.A.A., J.M. Raude, and J.M. Gathenya, Continuous modeling of the Mkurumudzi River catchment in Kenya using the HEC-HMS conceptual model: Calibration, validation, model performance evaluation and sensitivity analysis. Hydrology, 2018. 5(3): p. 44. [CrossRef]
- Singh and M.K. Jain, Continuous hydrological modeling using soil moisture accounting algorithm in Vamsadhara River basin, India. Journal of Water Resource and Hydraulic Engineering, 2015. 4(4): p. 398-408. [CrossRef]
- Roy, D., et al., Calibration and validation of HEC-HMS model for a river basin in Eastern India. ARPN journal of Engineering and Applied Sciences, 2013. 8(1): p. 40-56.
- Oudin, L., et al., Which potential evapotranspiration input for a lumped rainfall–runoff model?: Part 2—Towards a simple and efficient potential evapotranspiration model for rainfall–runoff modelling. Journal of Hydrology, 2005. 303(1): p. 290-306. [CrossRef]
- Zelelew, D.G. and A.M. Melesse, Applicability of a Spatially Semi-Distributed Hydrological Model for Watershed Scale Runoff Estimation in Northwest Ethiopia. Water, 2018. 10(7): p. 923. [CrossRef]
- Yuan, W., M. Liu, and F. Wan, Calculation of critical rainfall for small-watershed flash floods based on the HEC-HMS hydrological model. Water Resources Management, 2019. 33: p. 2555-2575. [CrossRef]
- Feldman, A.D., Hydrologic modeling system HEC-HMS: technical reference manual. 2000: US Army Corps of Engineers, Hydrologic Engineering Center.
- Tarek, F.P. Brissette, and R. Arsenault, Evaluation of the ERA5 reanalysis as a potential reference dataset for hydrological modelling over North America. Hydrology and Earth System Sciences, 2020. 24(5): p. 2527-2544. [CrossRef]
- Arsenault, F. Brissette, and J.L. Martel, The hazards of split-sample validation in hydrological model calibration. Journal of Hydrology, 2018. 566: p. 346-362. [CrossRef]
- Zhang, J., et al., Metrics for evaluating the accuracy of solar power forecasting. 2013, National Renewable Energy Lab.(NREL), Golden, CO (United States).
- Bates and C.W. Granger, The combination of forecasts. Journal of the operational research society, 1969. 20(4): p. 451-468. [CrossRef]
- Dickinson, Some statistical results in the combination of forecasts. Journal of the Operational Research Society, 1973. 24: p. 253-260. [CrossRef]
- Dickinson, Some comments on the combination of forecasts. Journal of the Operational Research Society, 1975. 26: p. 205-210. [CrossRef]
- Newbold and C.W. Granger, Experience with forecasting univariate time series and the combination of forecasts. Journal of the Royal Statistical Society: Series A (General), 1974. 137(2): p. 131-146. [CrossRef]
- Arsenault, G.R.C. Essou, and F.P. Brissette, Improving Hydrological Model Simulations with Combined Multi-Input and Multimodel Averaging Frameworks. Journal of Hydrologic Engineering, 2017. 22(4): p. 04016066. [CrossRef]
- Zhang and X. Yang, Applying a multi-model ensemble method for long-term runoff prediction under climate change scenarios for the Yellow River Basin, China. Water, 2018. 10(3): p. 301. [CrossRef]
- Shamseldin, K.M. O'Connor, and G. Liang, Methods for combining the outputs of different rainfall–runoff models. Journal of Hydrology, 1997. 197(1-4): p. 203-229. [CrossRef]
- Araghinejad, M. Azmi, and M. Kholghi, Application of artificial neural network ensembles in probabilistic hydrological forecasting. Journal of Hydrology, 2011. 407(1-4): p. 94-104. [CrossRef]
- Duan, et al., Multi-model ensemble hydrologic prediction using Bayesian model averaging. Advances in water Resources, 2007. 30(5): p. 1371-1386. [CrossRef]
- Granger, C.W.J. and R. Ramanathan, Improved Methods of Combining Forecasts. Journal of Forecasting, 1984. 3(2): p. 197-204. [CrossRef]
- Arsenault, G.R. Essou, and F.P. Brissette, Improving hydrological model simulations with combined multi-input and multimodel averaging frameworks. Journal of Hydrologic Engineering, 2017. 22(4): p. 04016066. [CrossRef]
- Hamududu, Impacts of Climate Change on Water Resources and Hydropower Systems: in central and southern Africa. 2012.
- Killingtveit, A., ENMAG user's manual. University of Trondheim, Trondheim, Norway, 2004.
Figure 1.
Drainage area of Congo River upstream of Grand Inga Hydroelectric project.
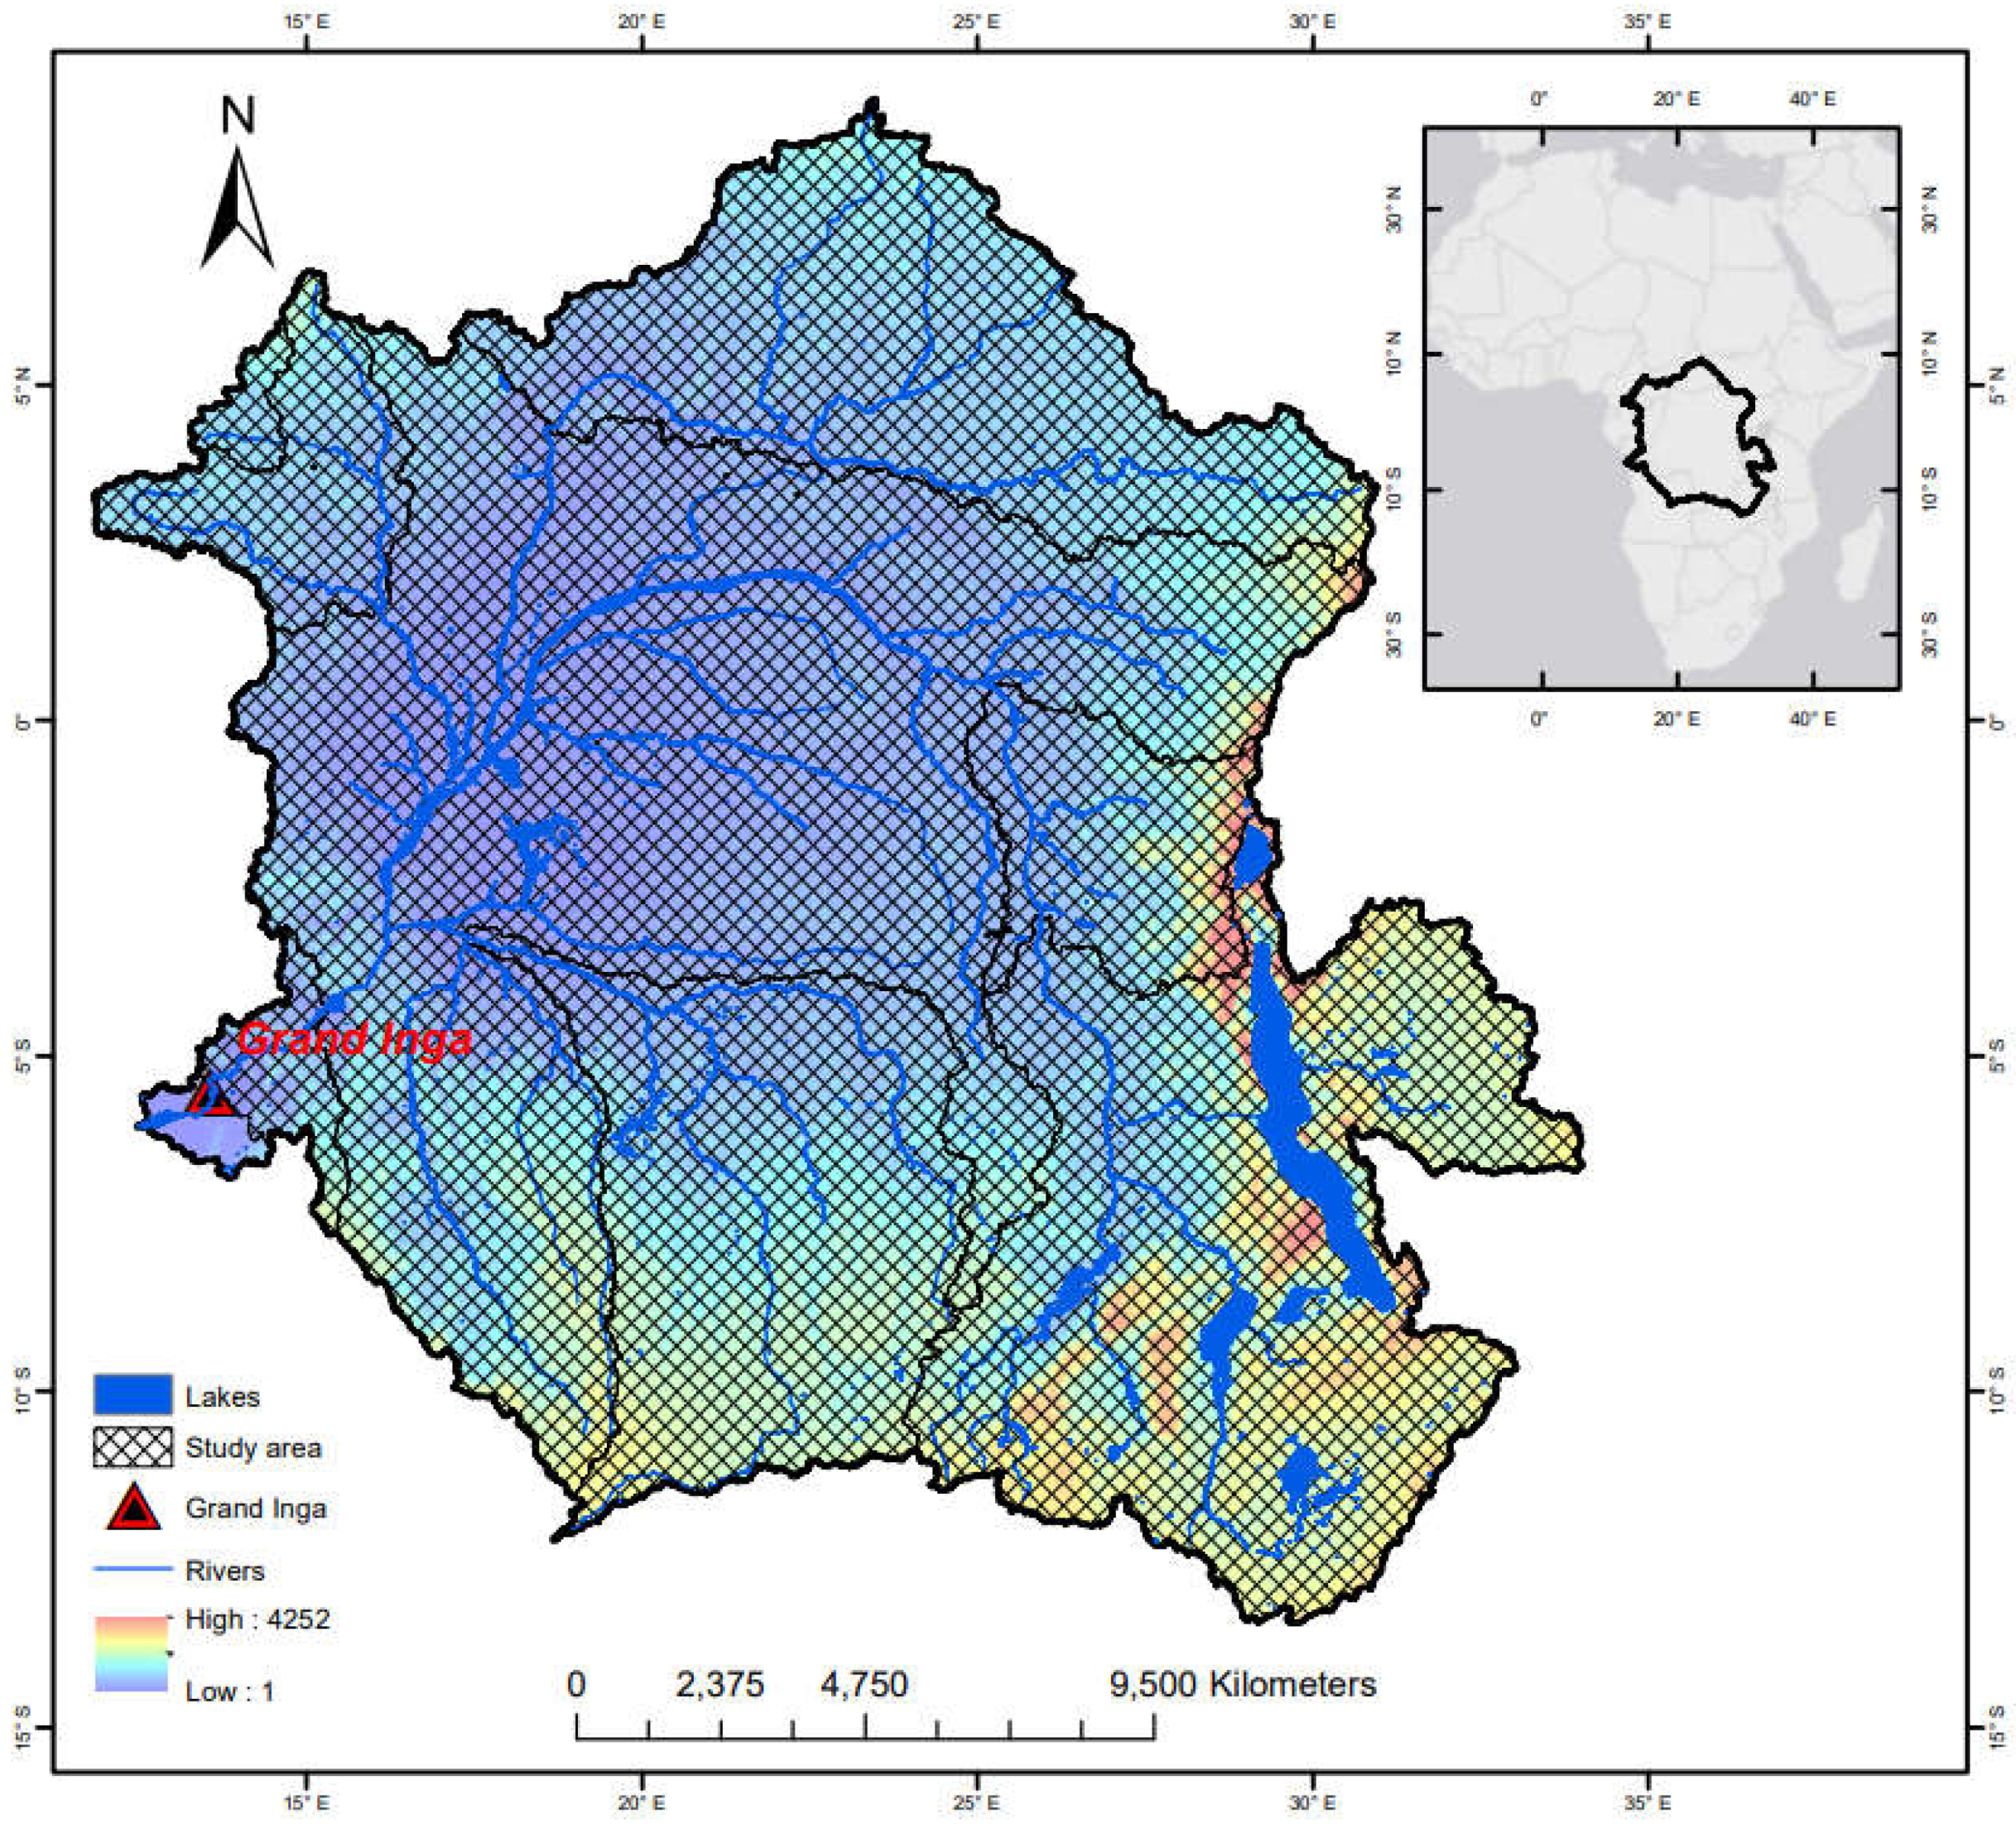
Figure 2.
(a) Daily water flow, (b) Flow duration curve at Inga Falls and (c) Water utilization duration curve for Inga Falls with full development .
Figure 2.
(a) Daily water flow, (b) Flow duration curve at Inga Falls and (c) Water utilization duration curve for Inga Falls with full development .
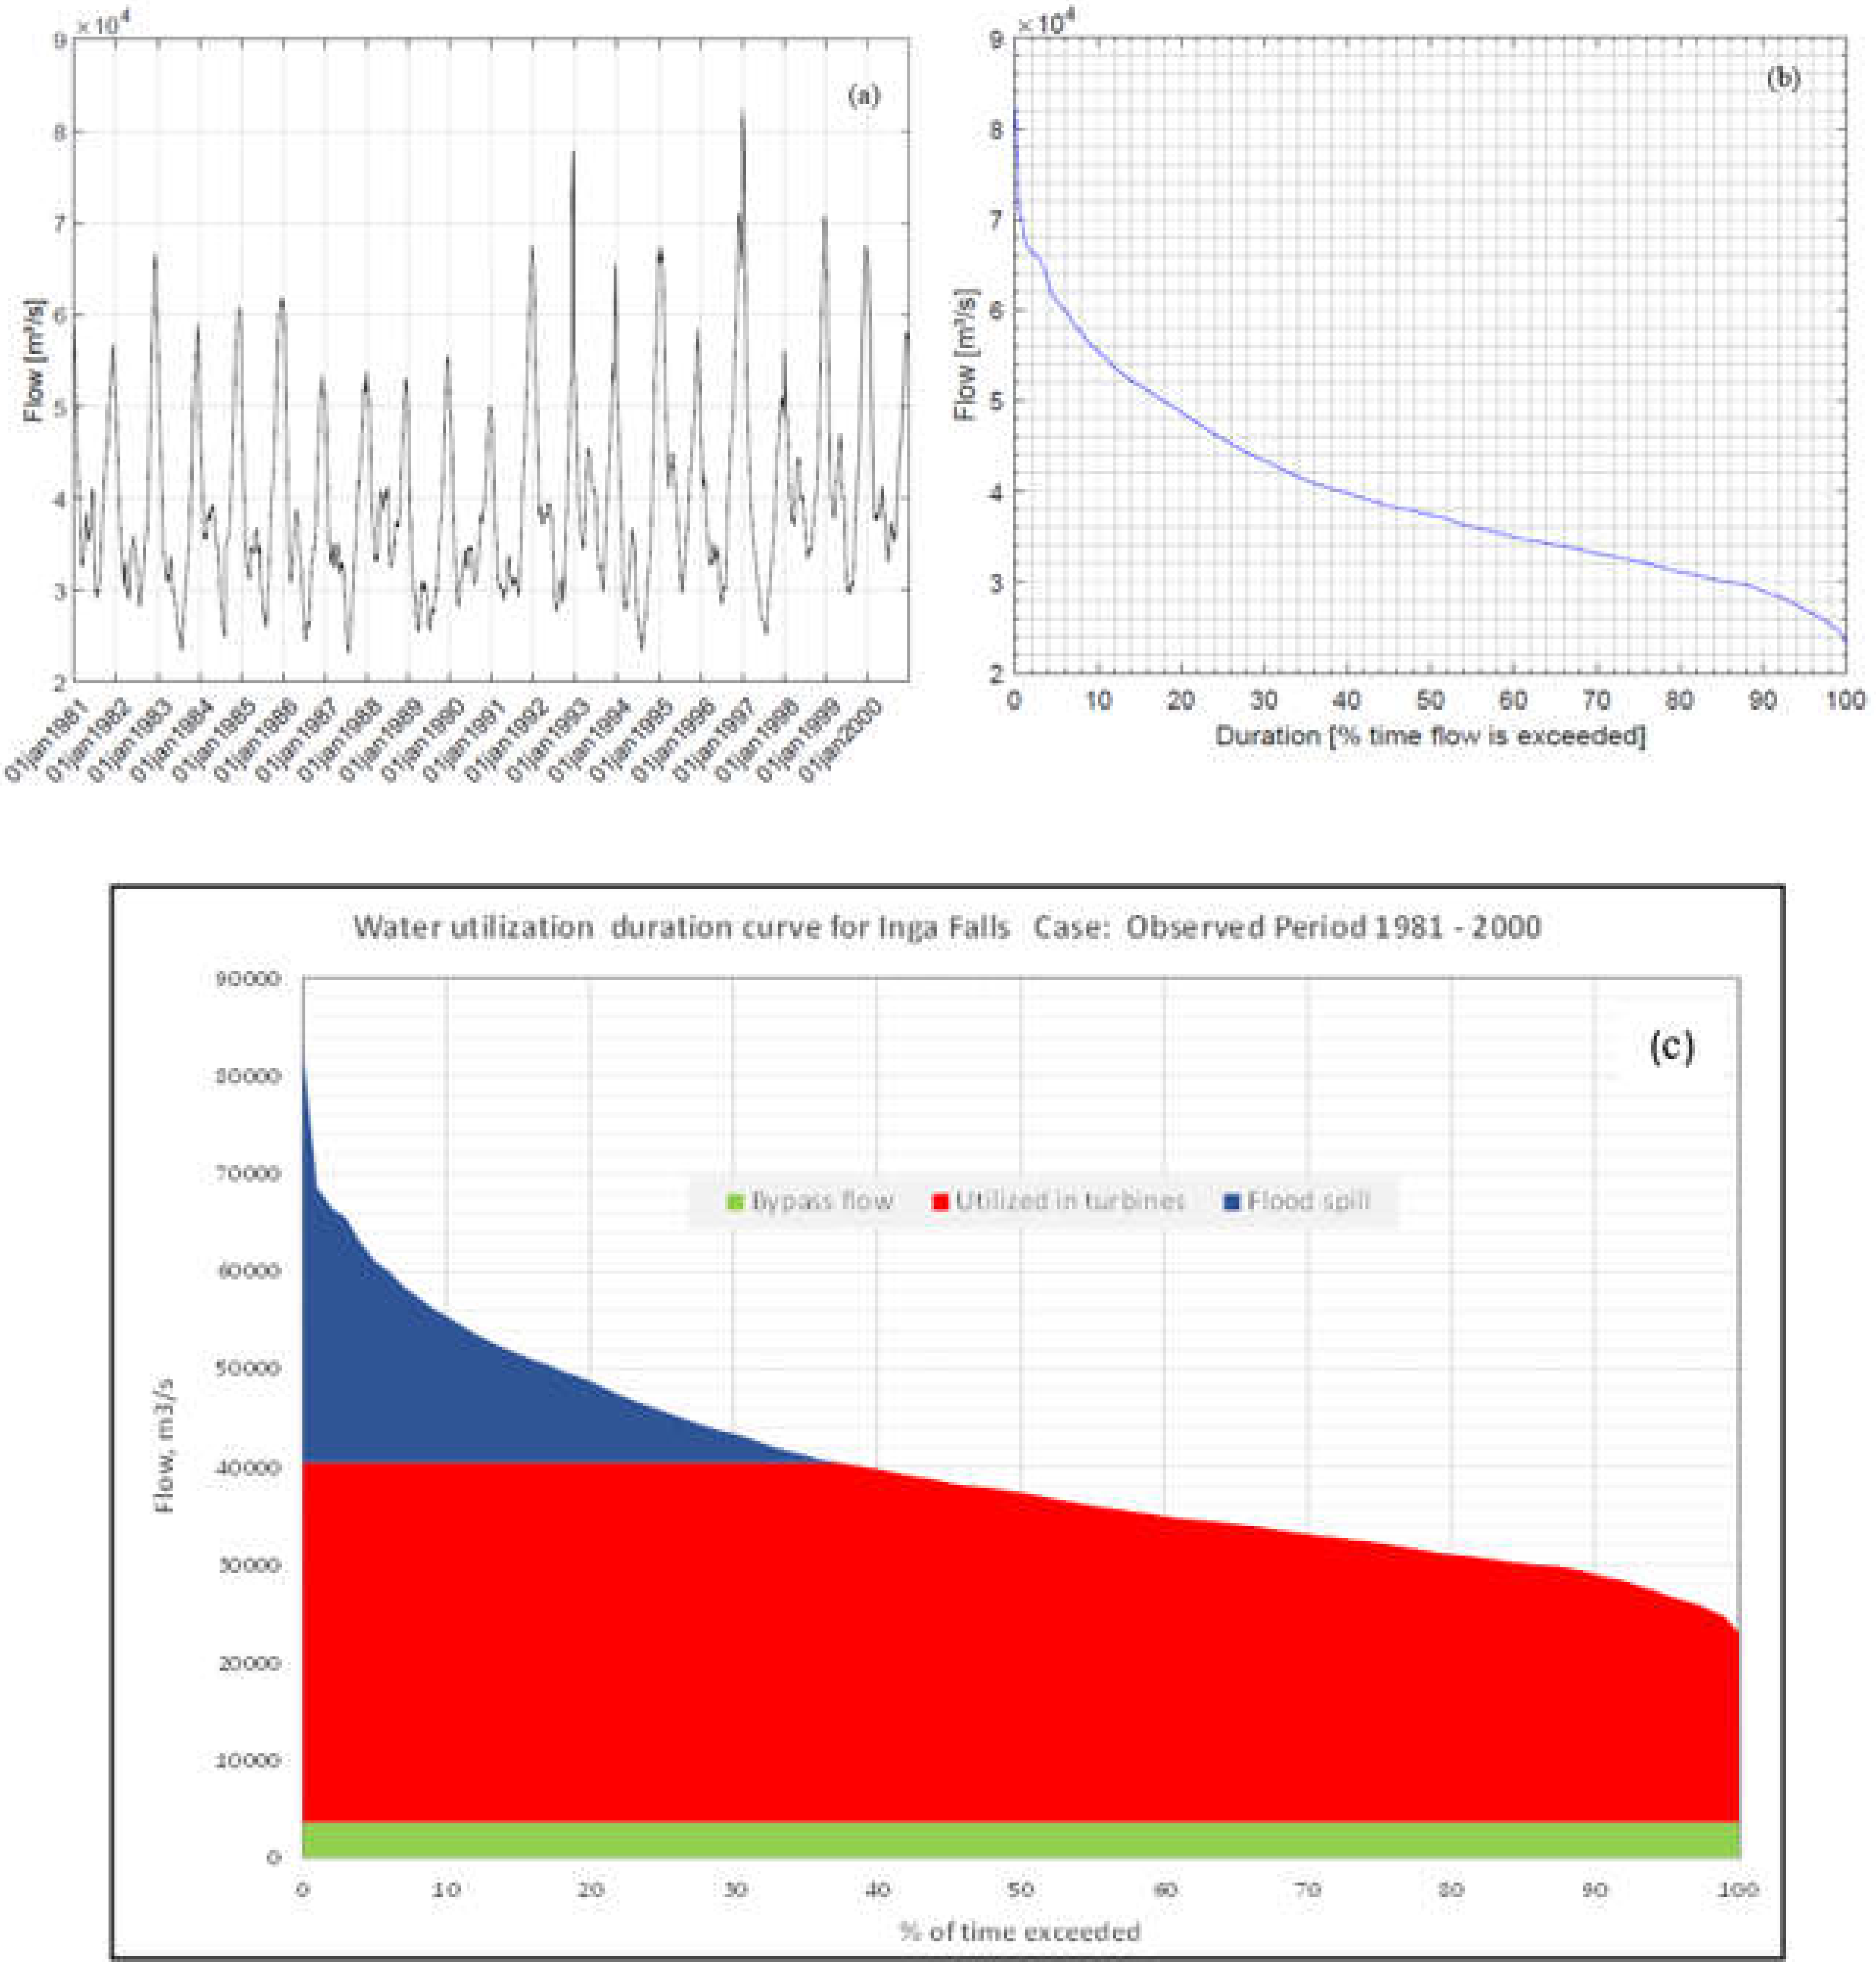
Figure 3.
HEC-HMS model calibration for years 1981- 2000; dashed lines indicate hydrographs of.
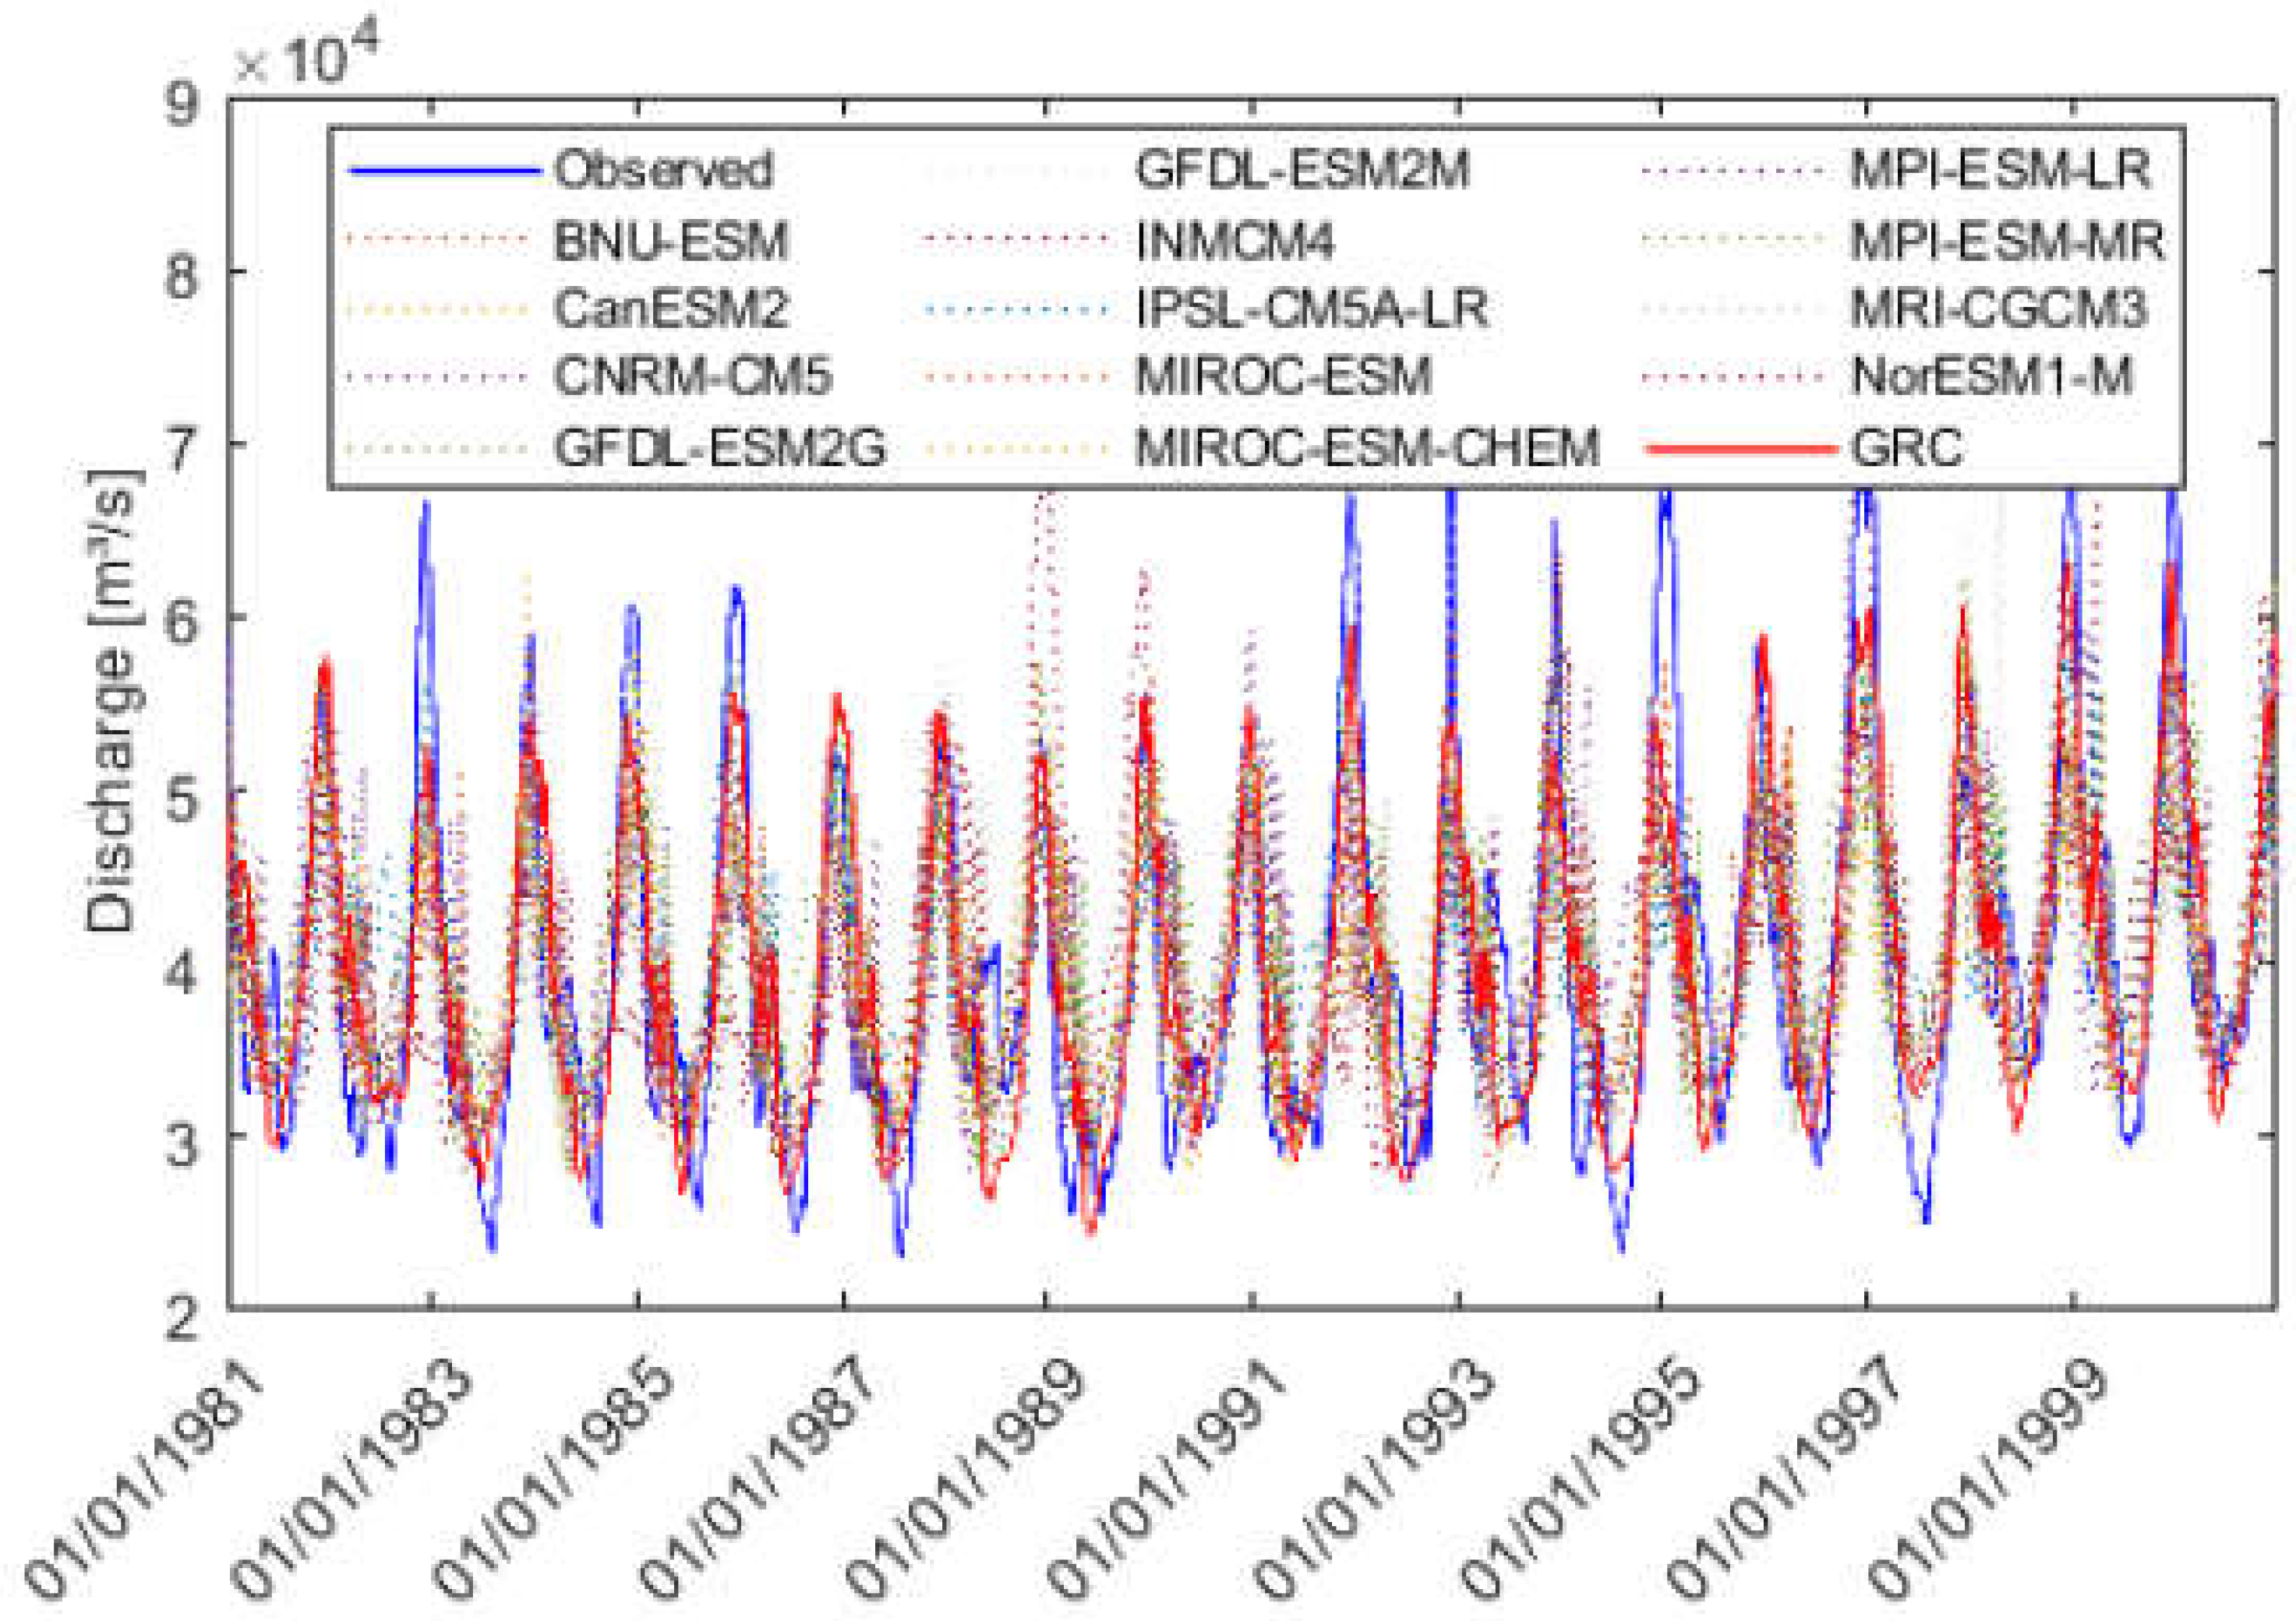
Figure 4.
Annual GRC average flow in Congo River at Inga Falls gauging station for the reference period 1981–2000 and for projected future periods for different emission scenarios (a), (b). The figure (c) represents the relative change in %.
Figure 4.
Annual GRC average flow in Congo River at Inga Falls gauging station for the reference period 1981–2000 and for projected future periods for different emission scenarios (a), (b). The figure (c) represents the relative change in %.
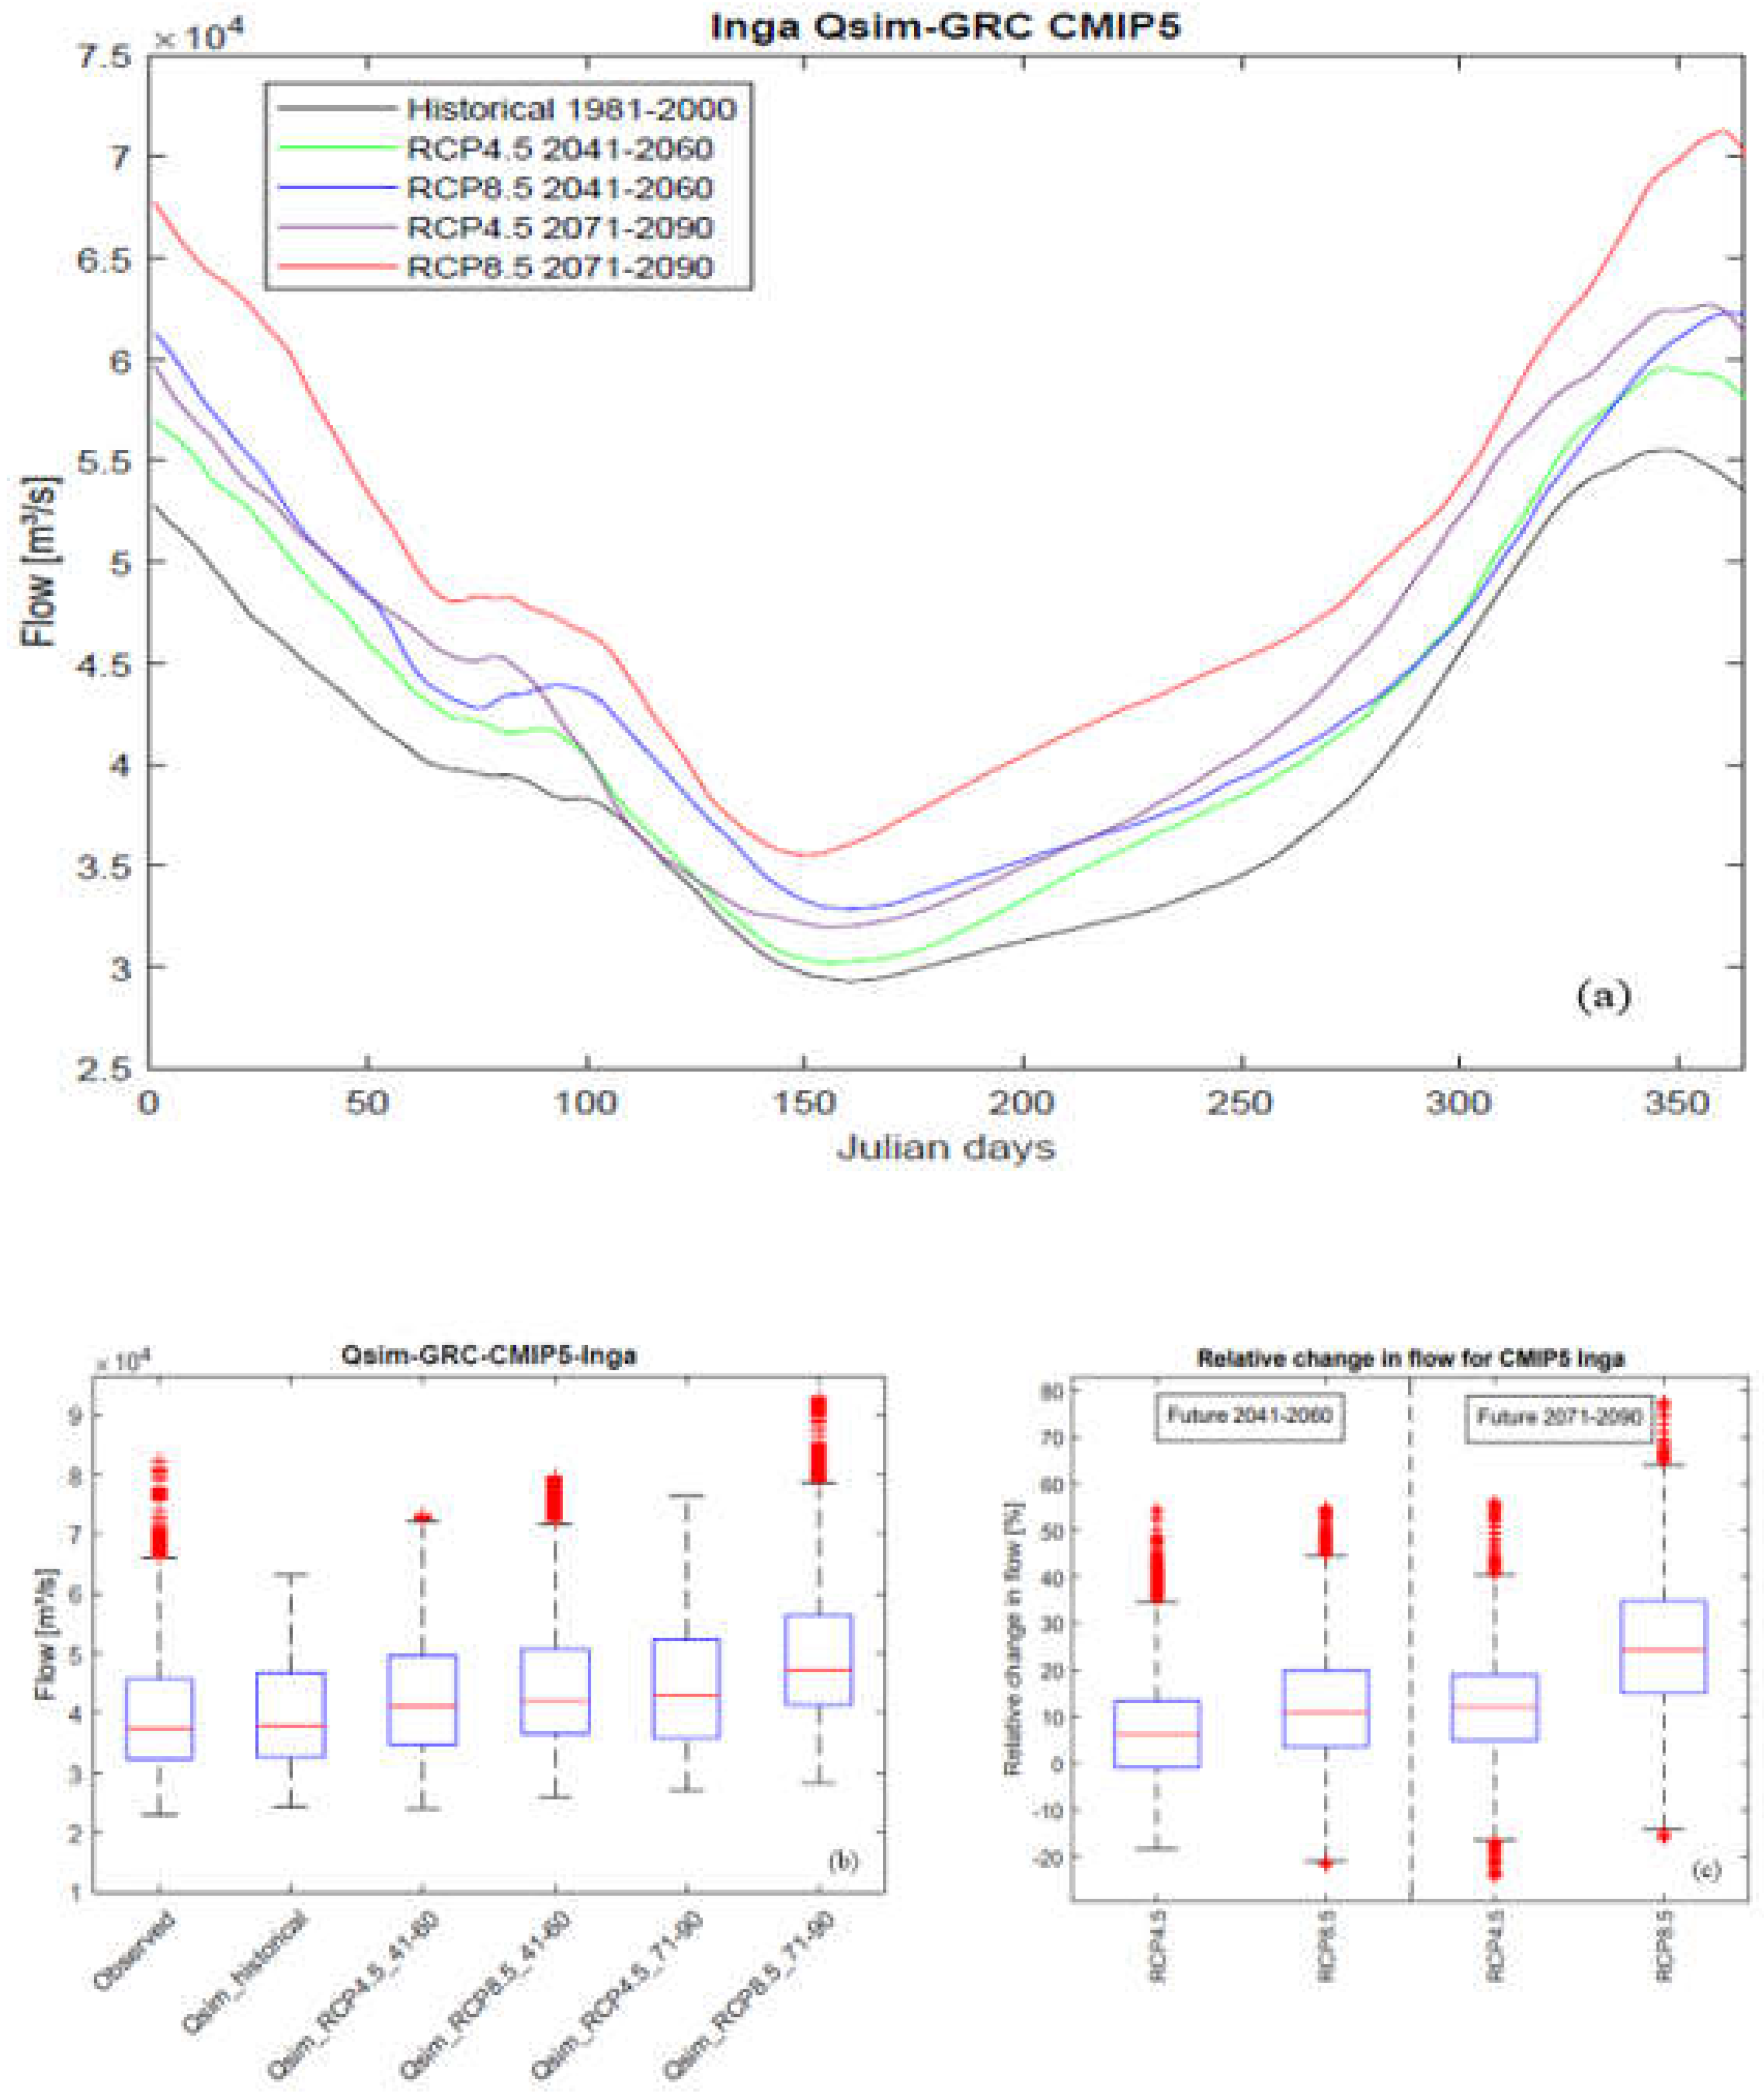
Figure 5.
Flow duration curve of Inga Falls for GRC CMIP5 scenarios.
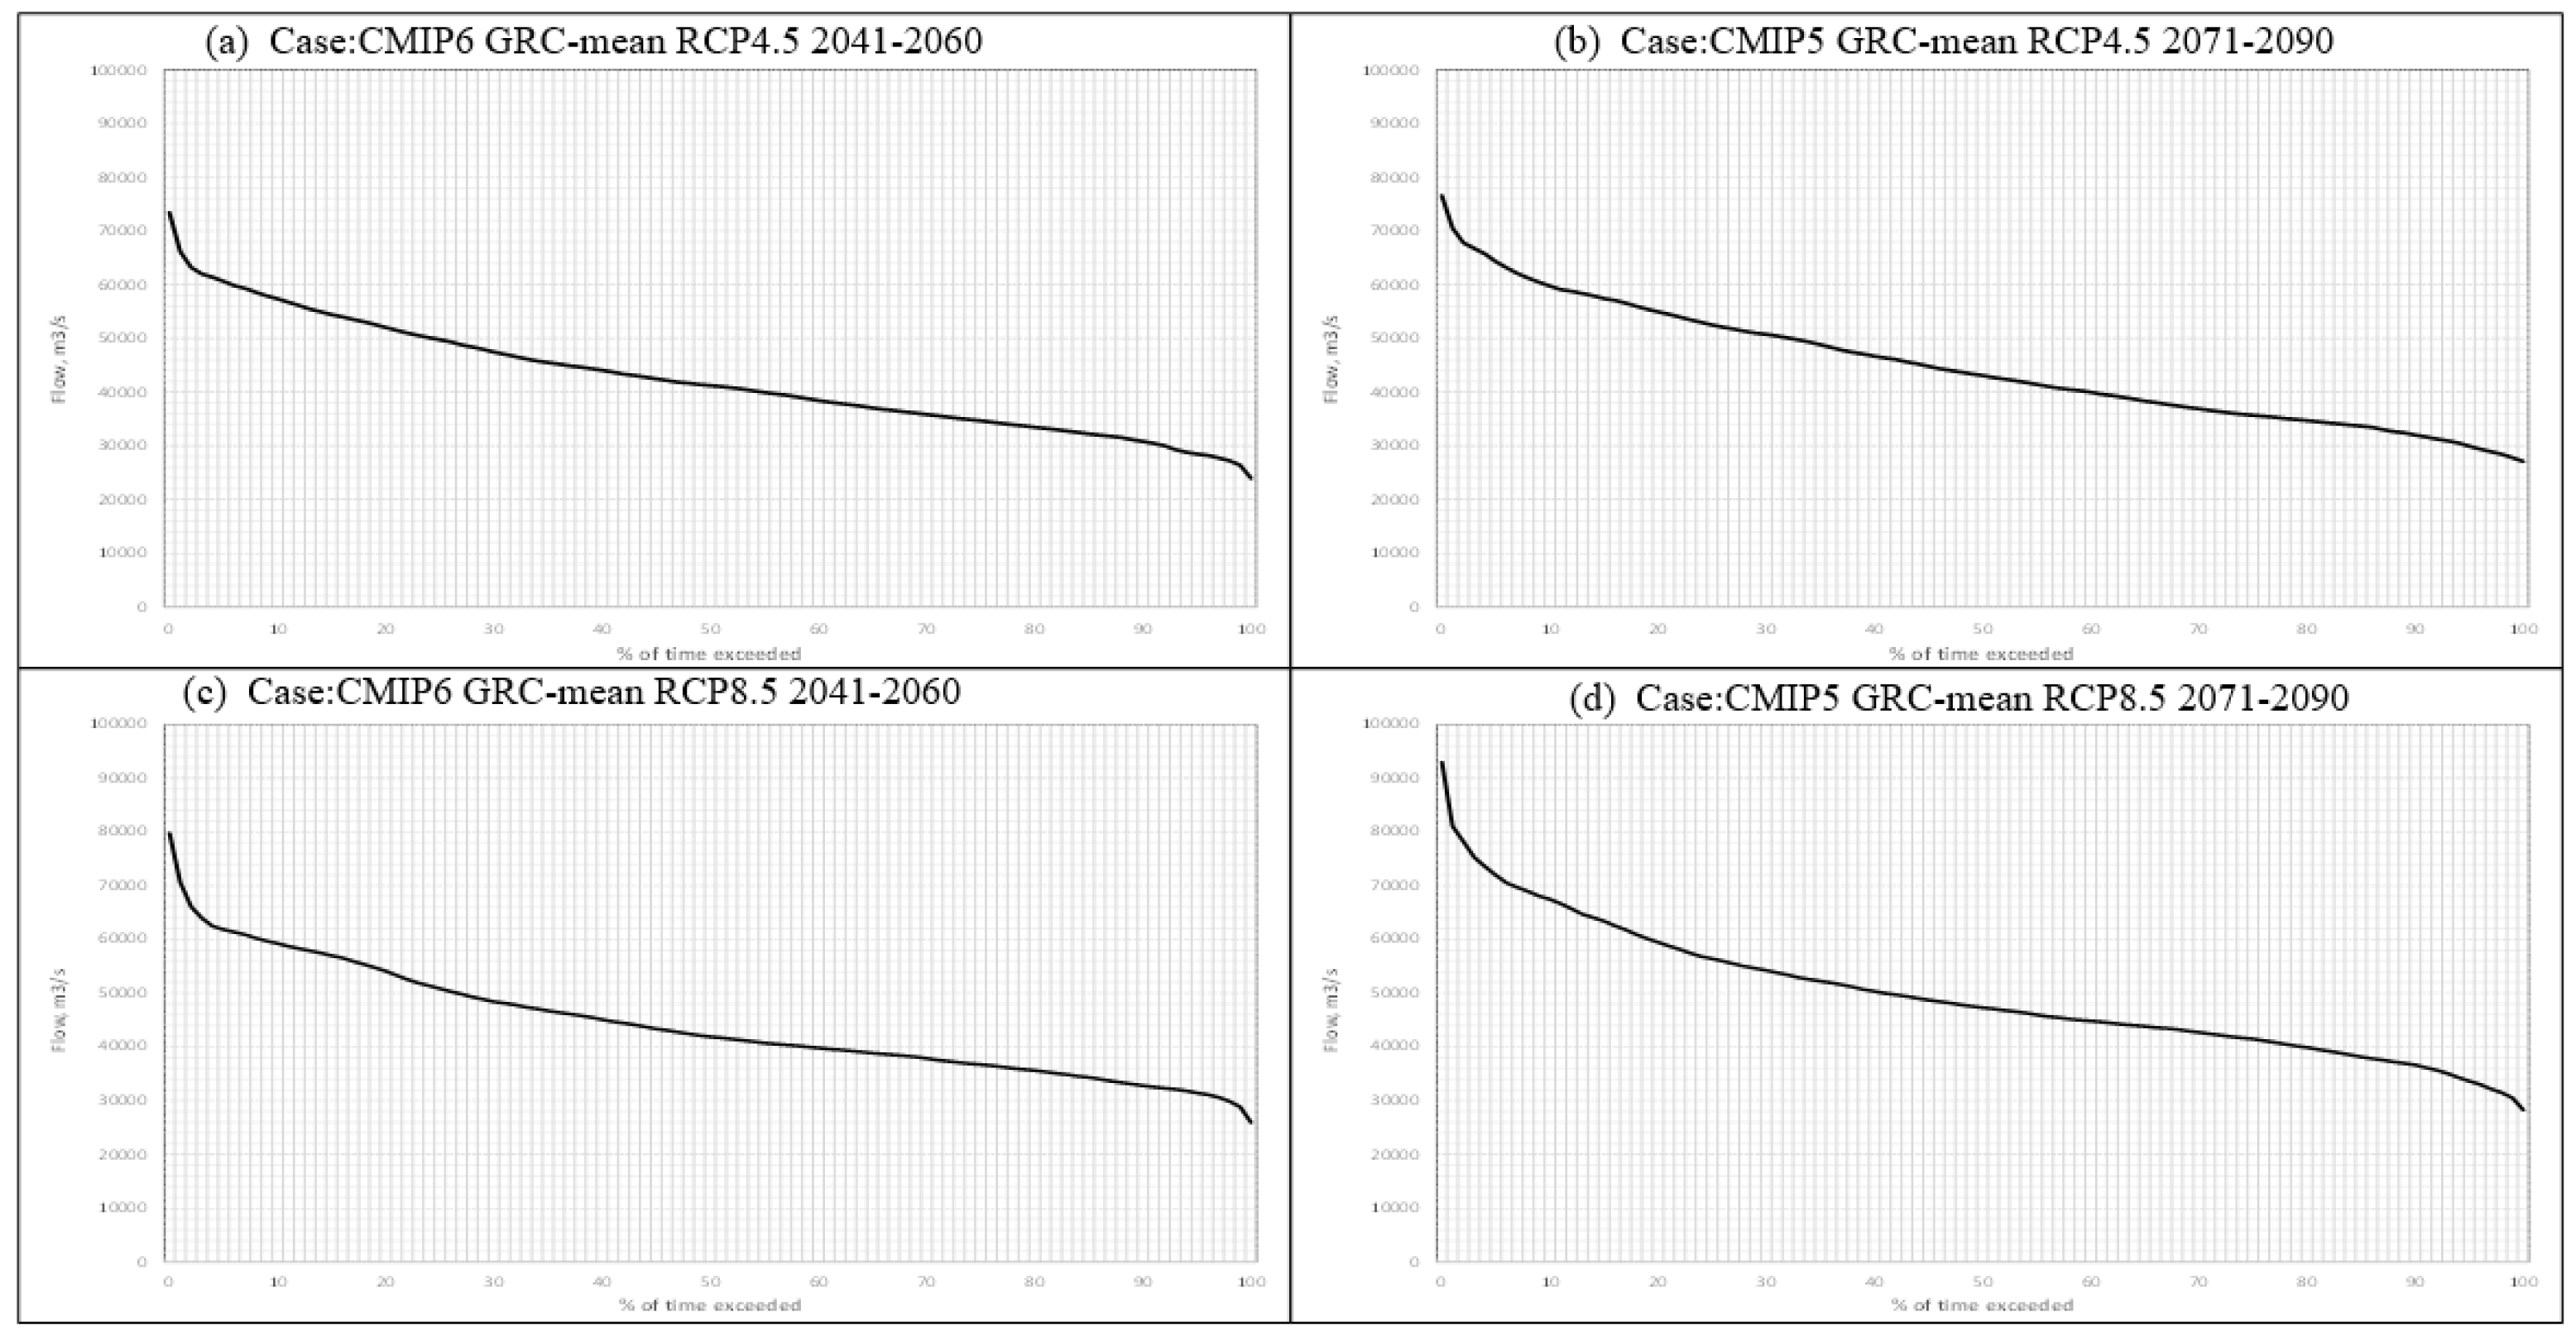
Figure 6.
Flow duration curve of Inga Falls for GRC CMIP6 scenarios.
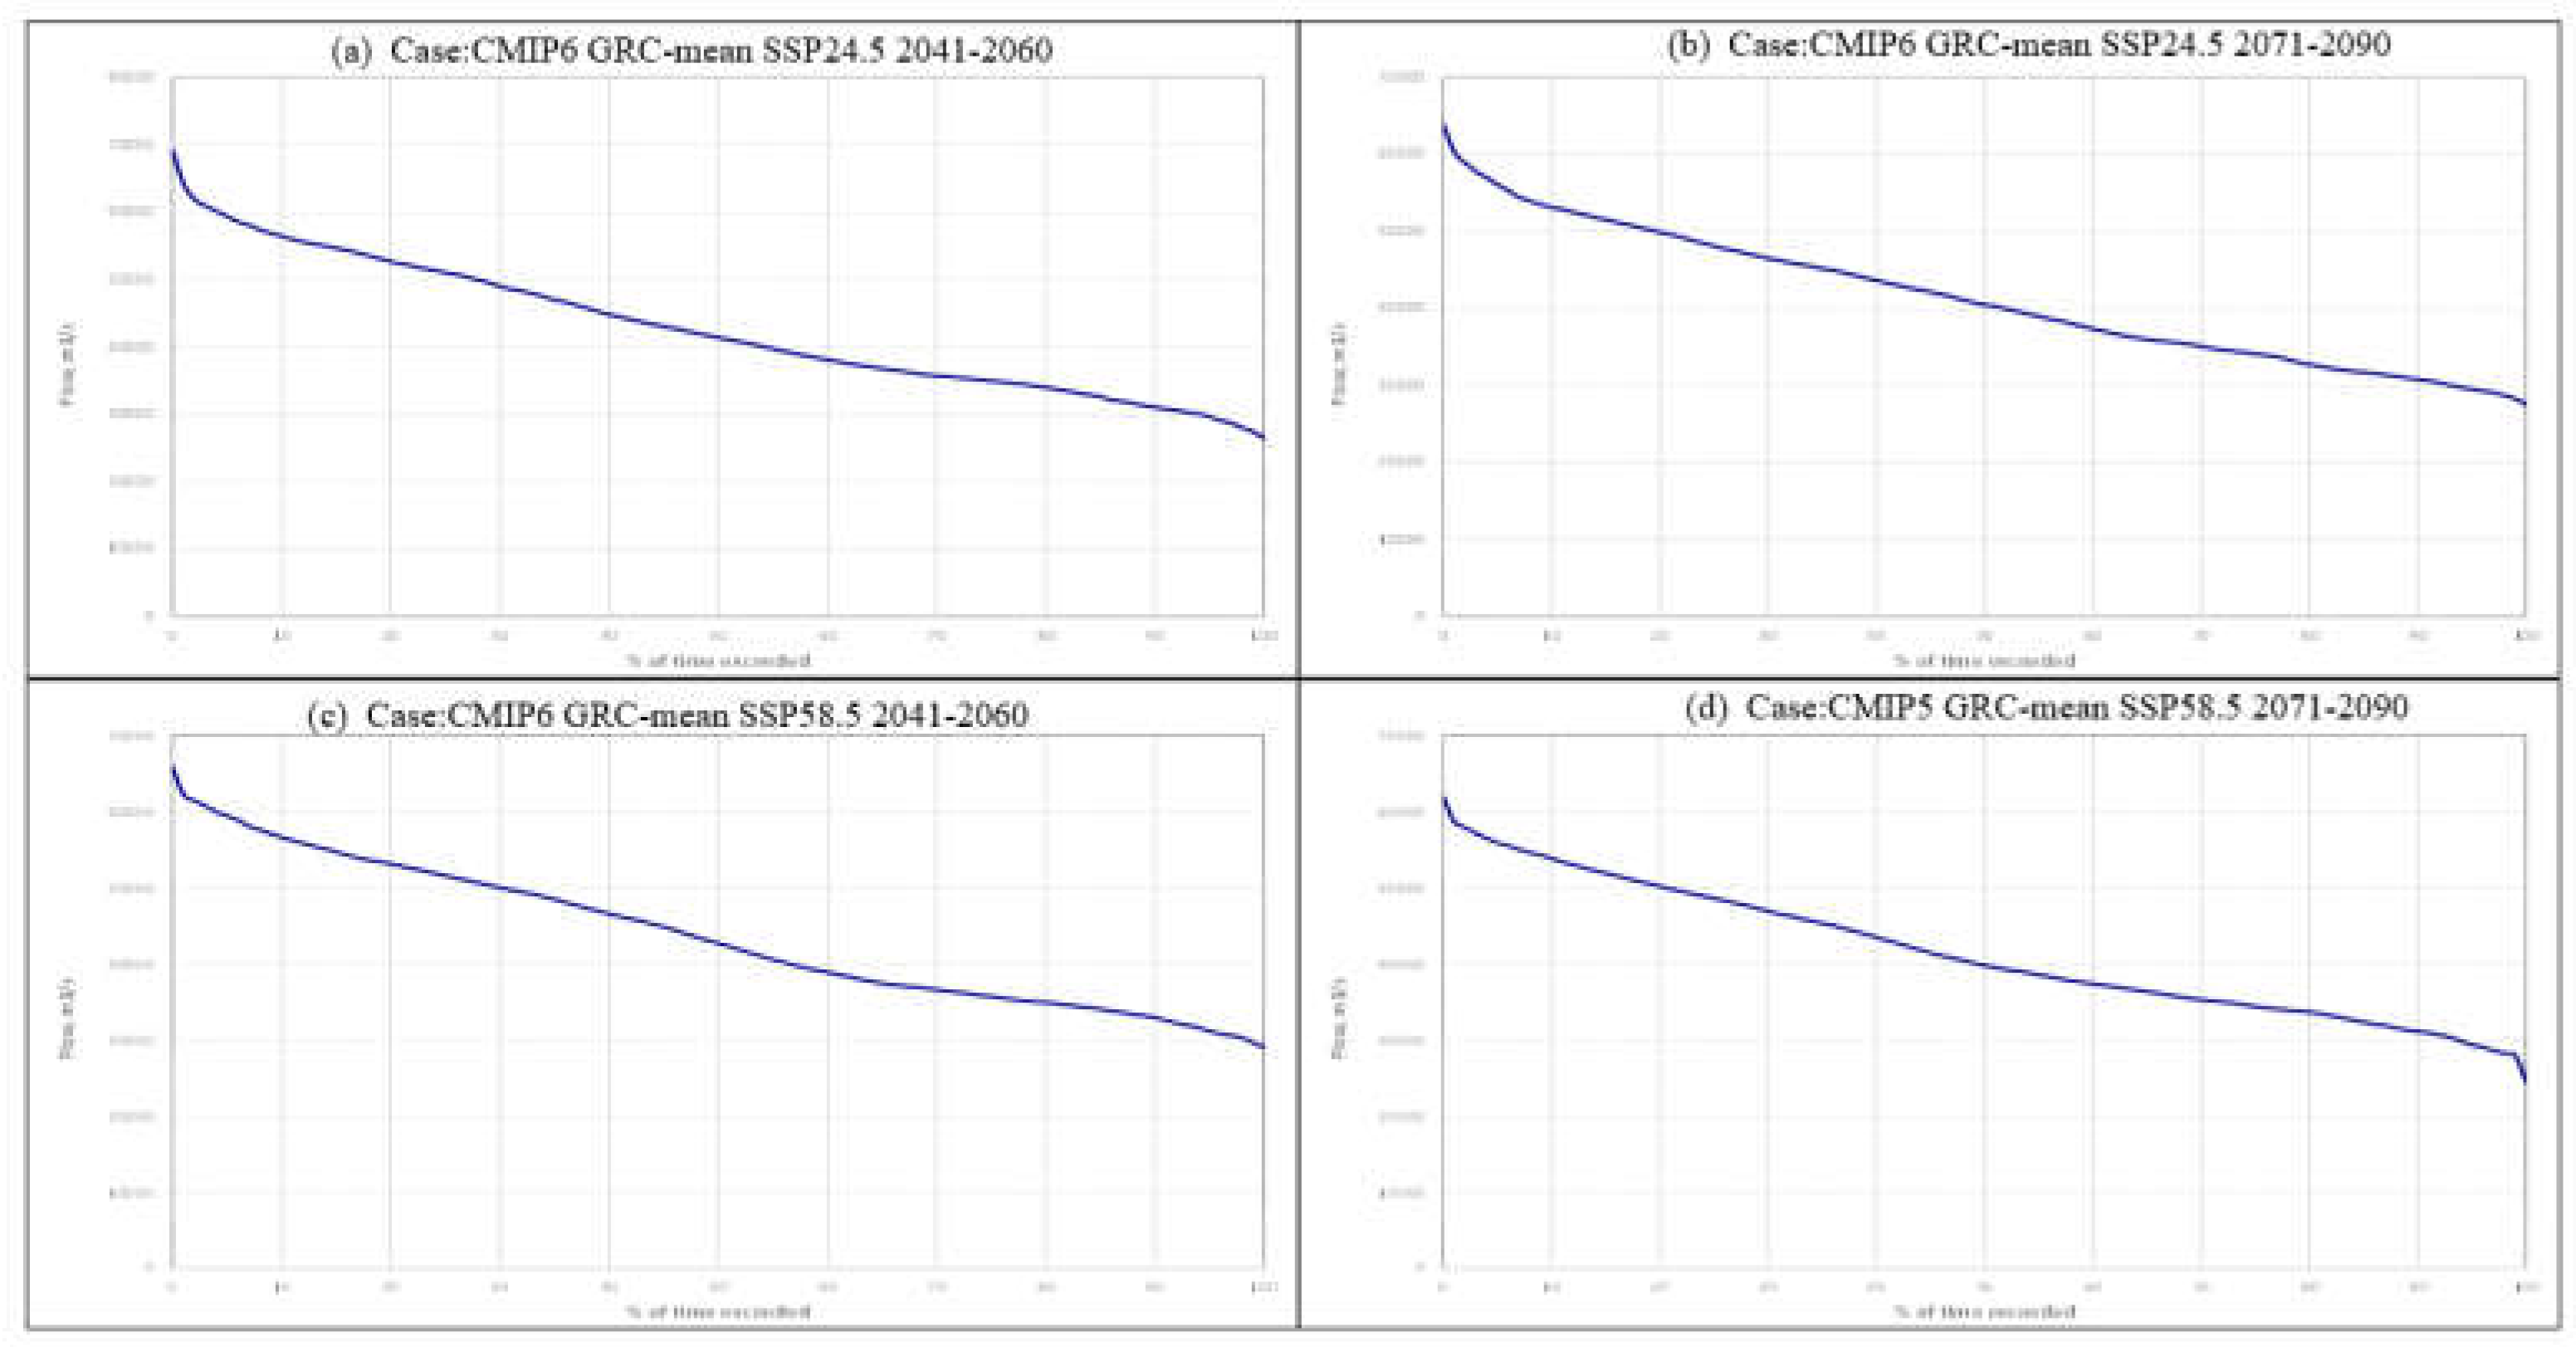
Figure 7.
Water utilization duration curve of Inga Falls for GRC CMIP5 scenarios.
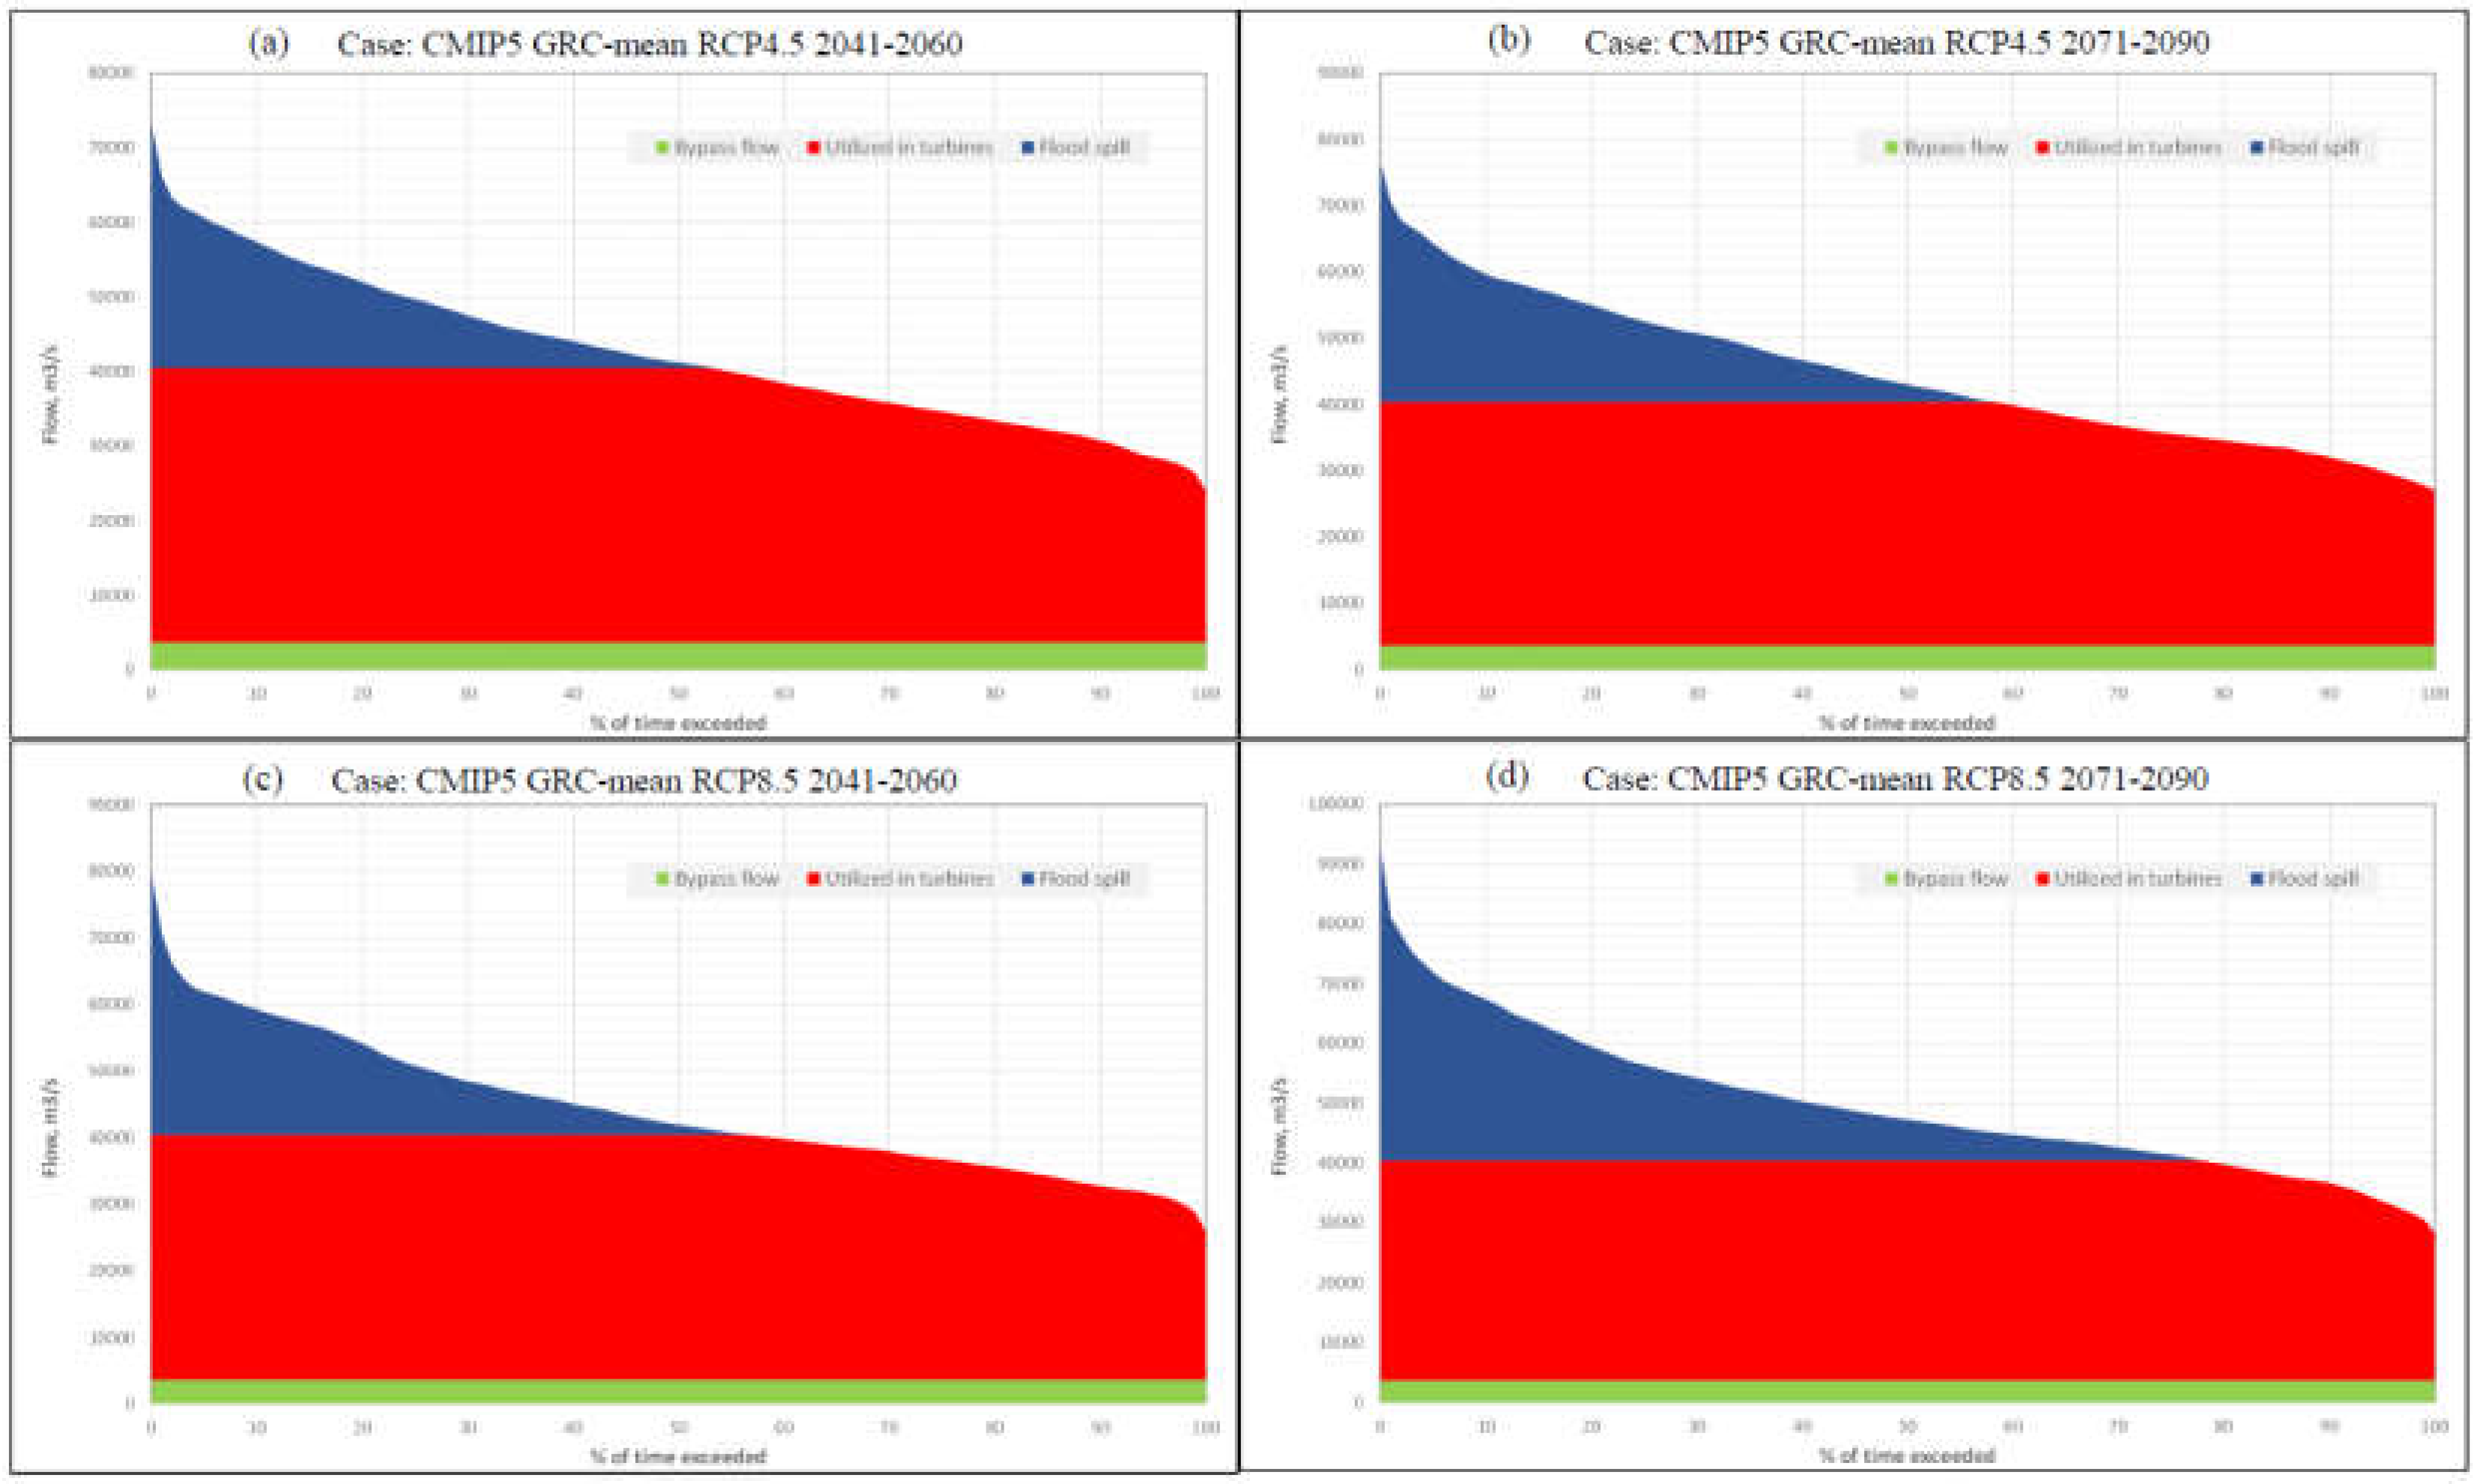
Figure 8.
Water utilization duration curve of Inga Falls for GRC CMIP6 scenarios.
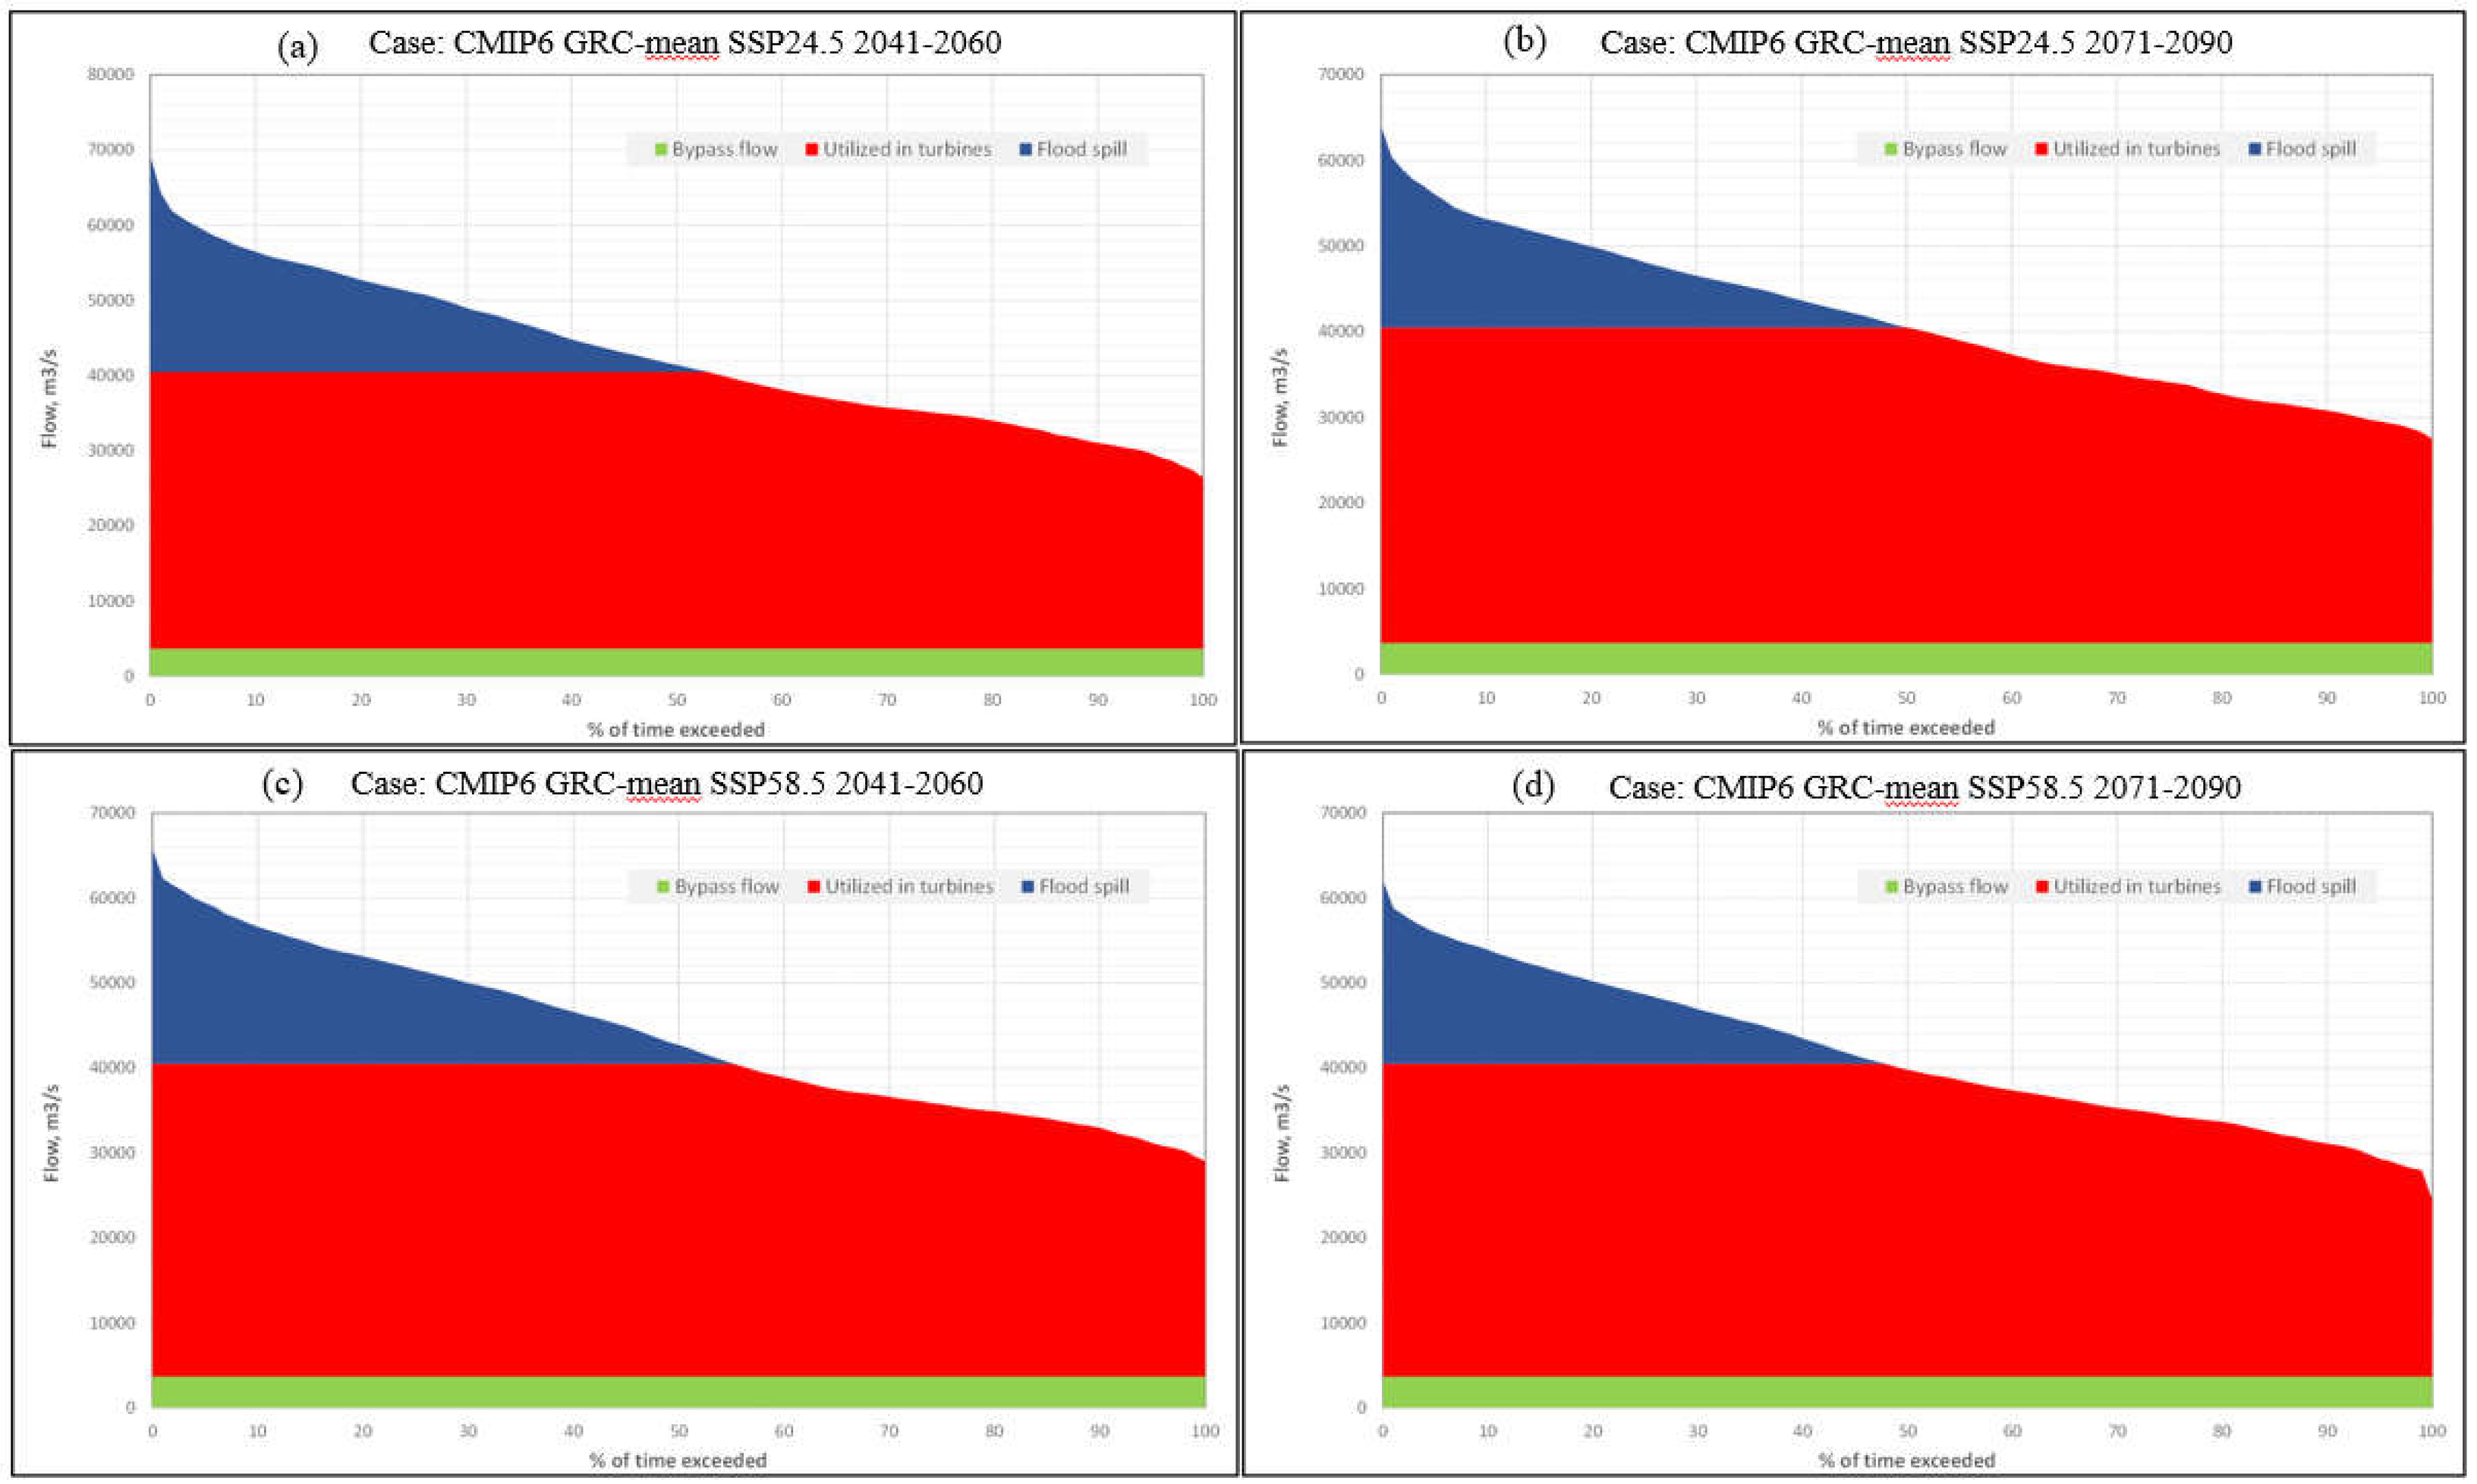
Figure 9.
Hydropower generation for Inga 1 to Inga 8 – Based on data for 1981-2000.
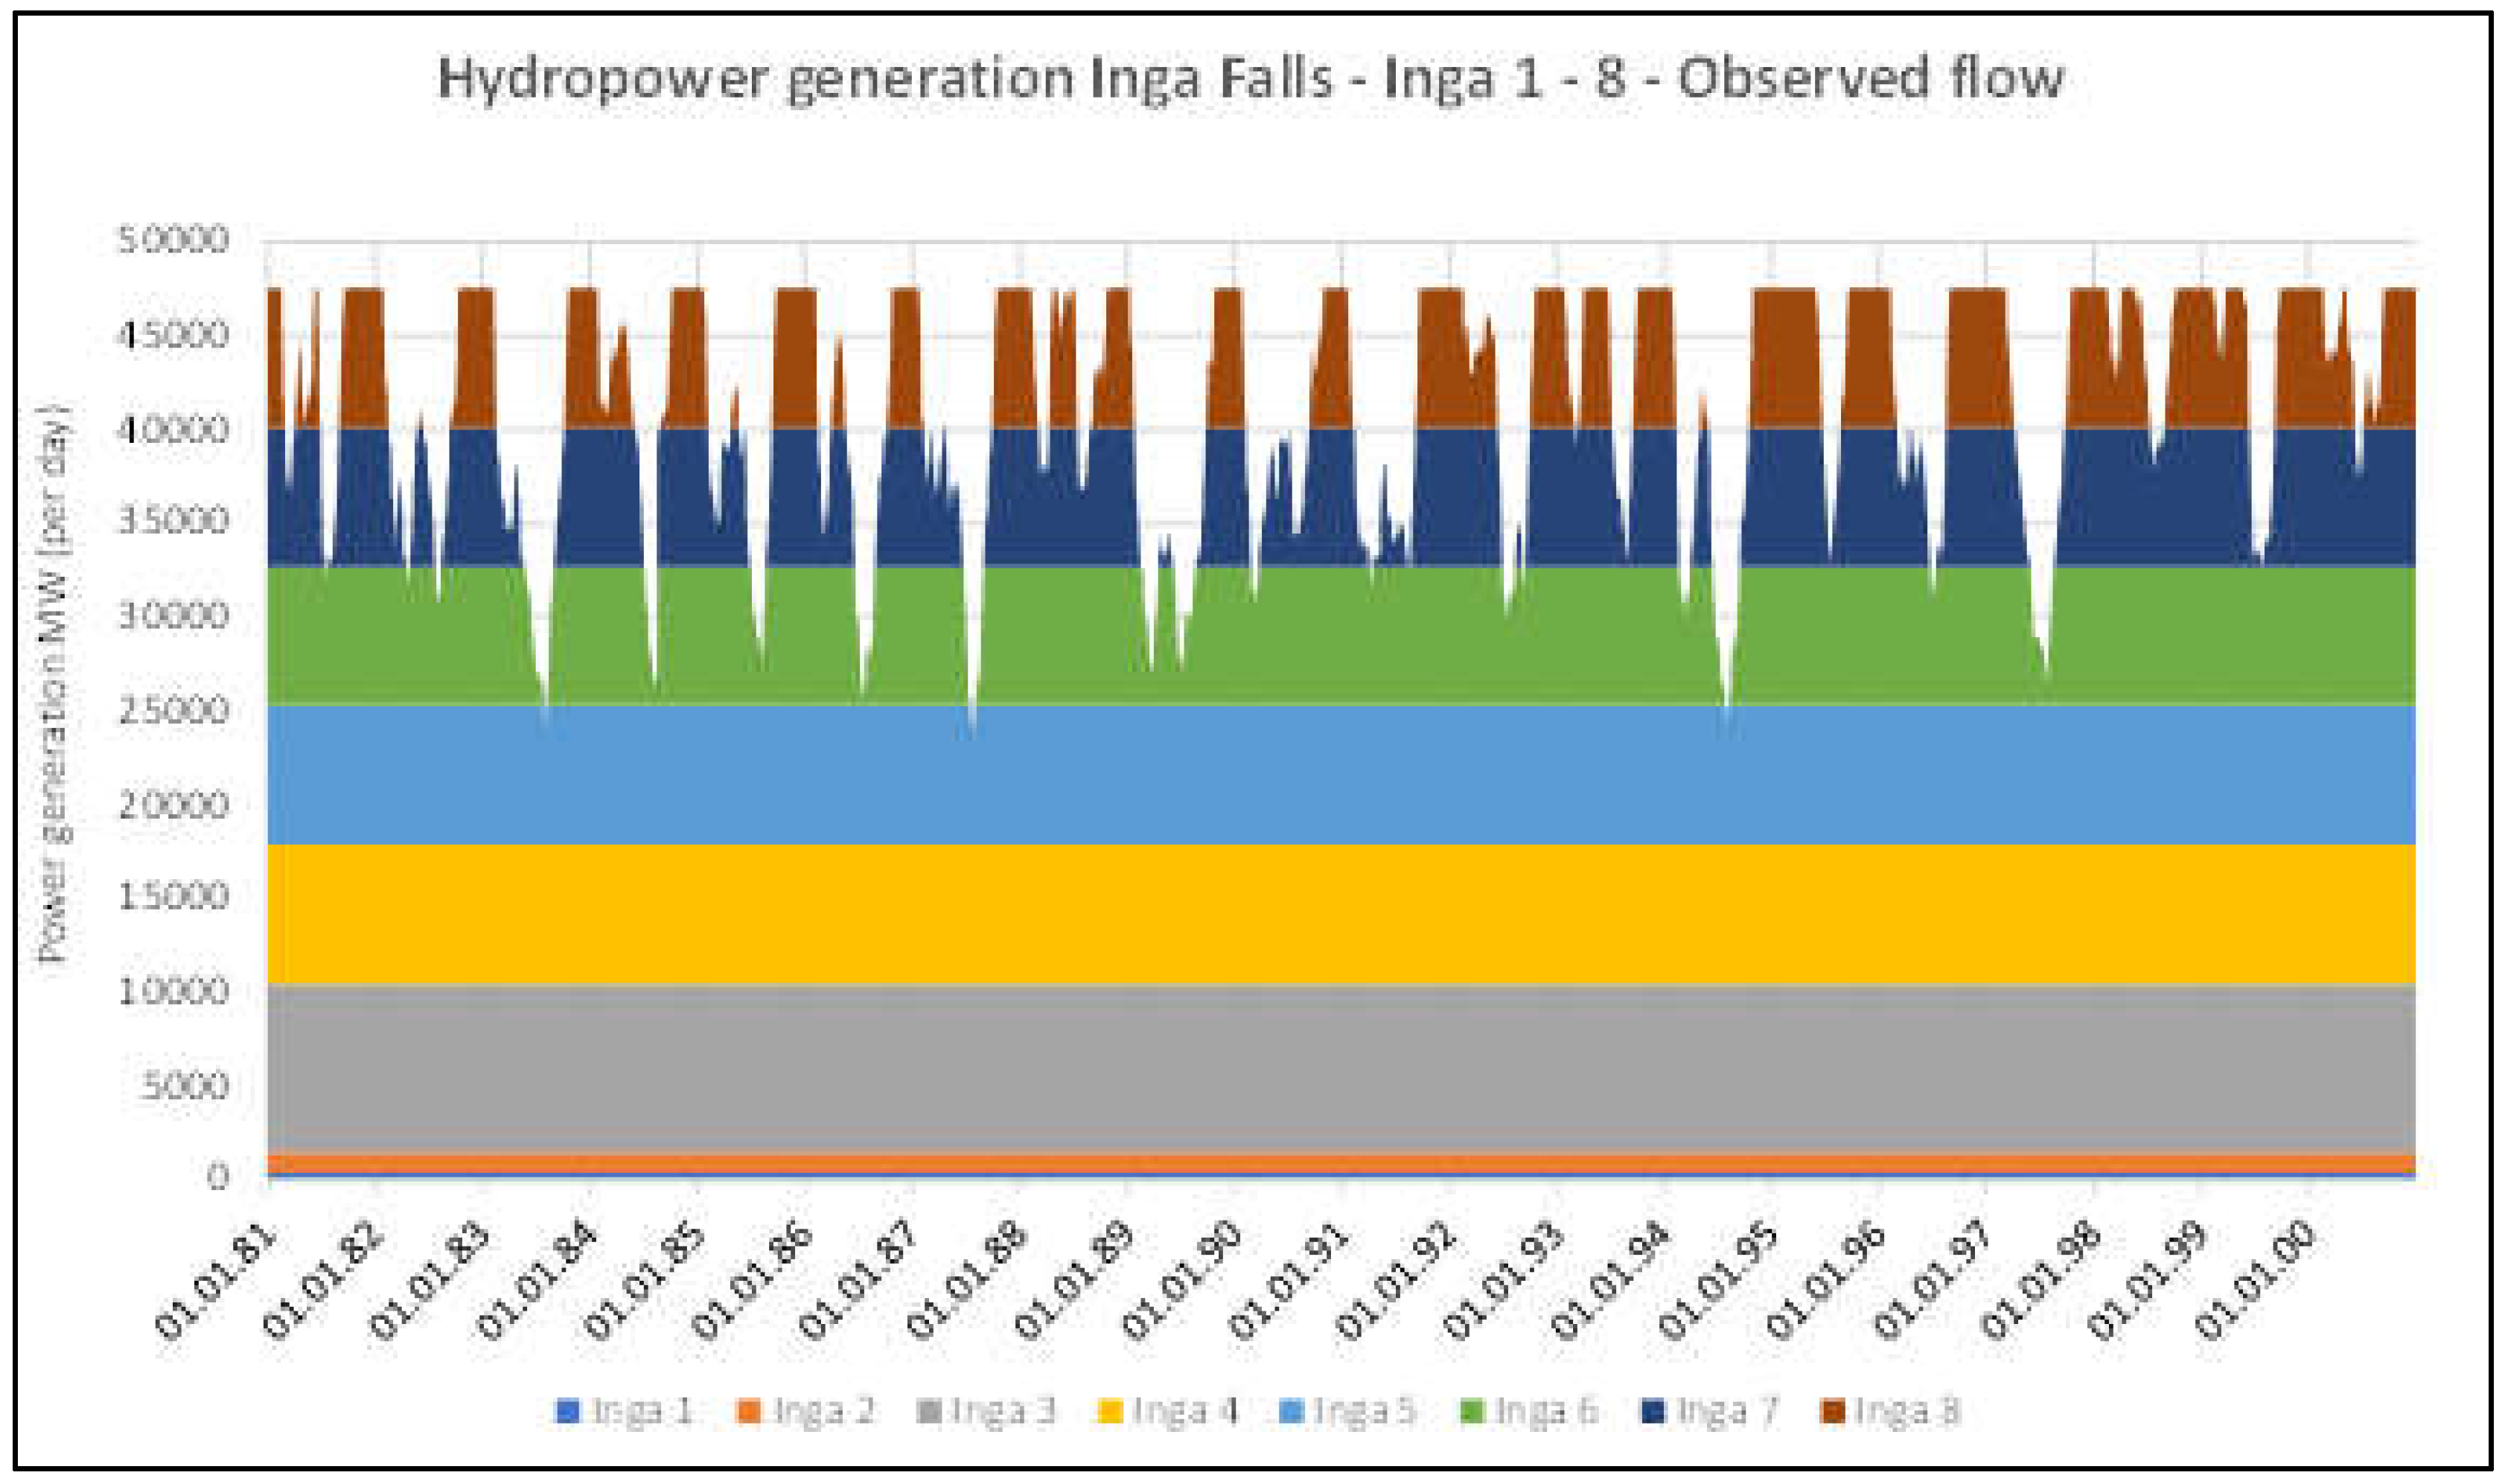
Figure 10.
Power duration curves for Inga 6, 7 and 8. Historical period 1981-2000.
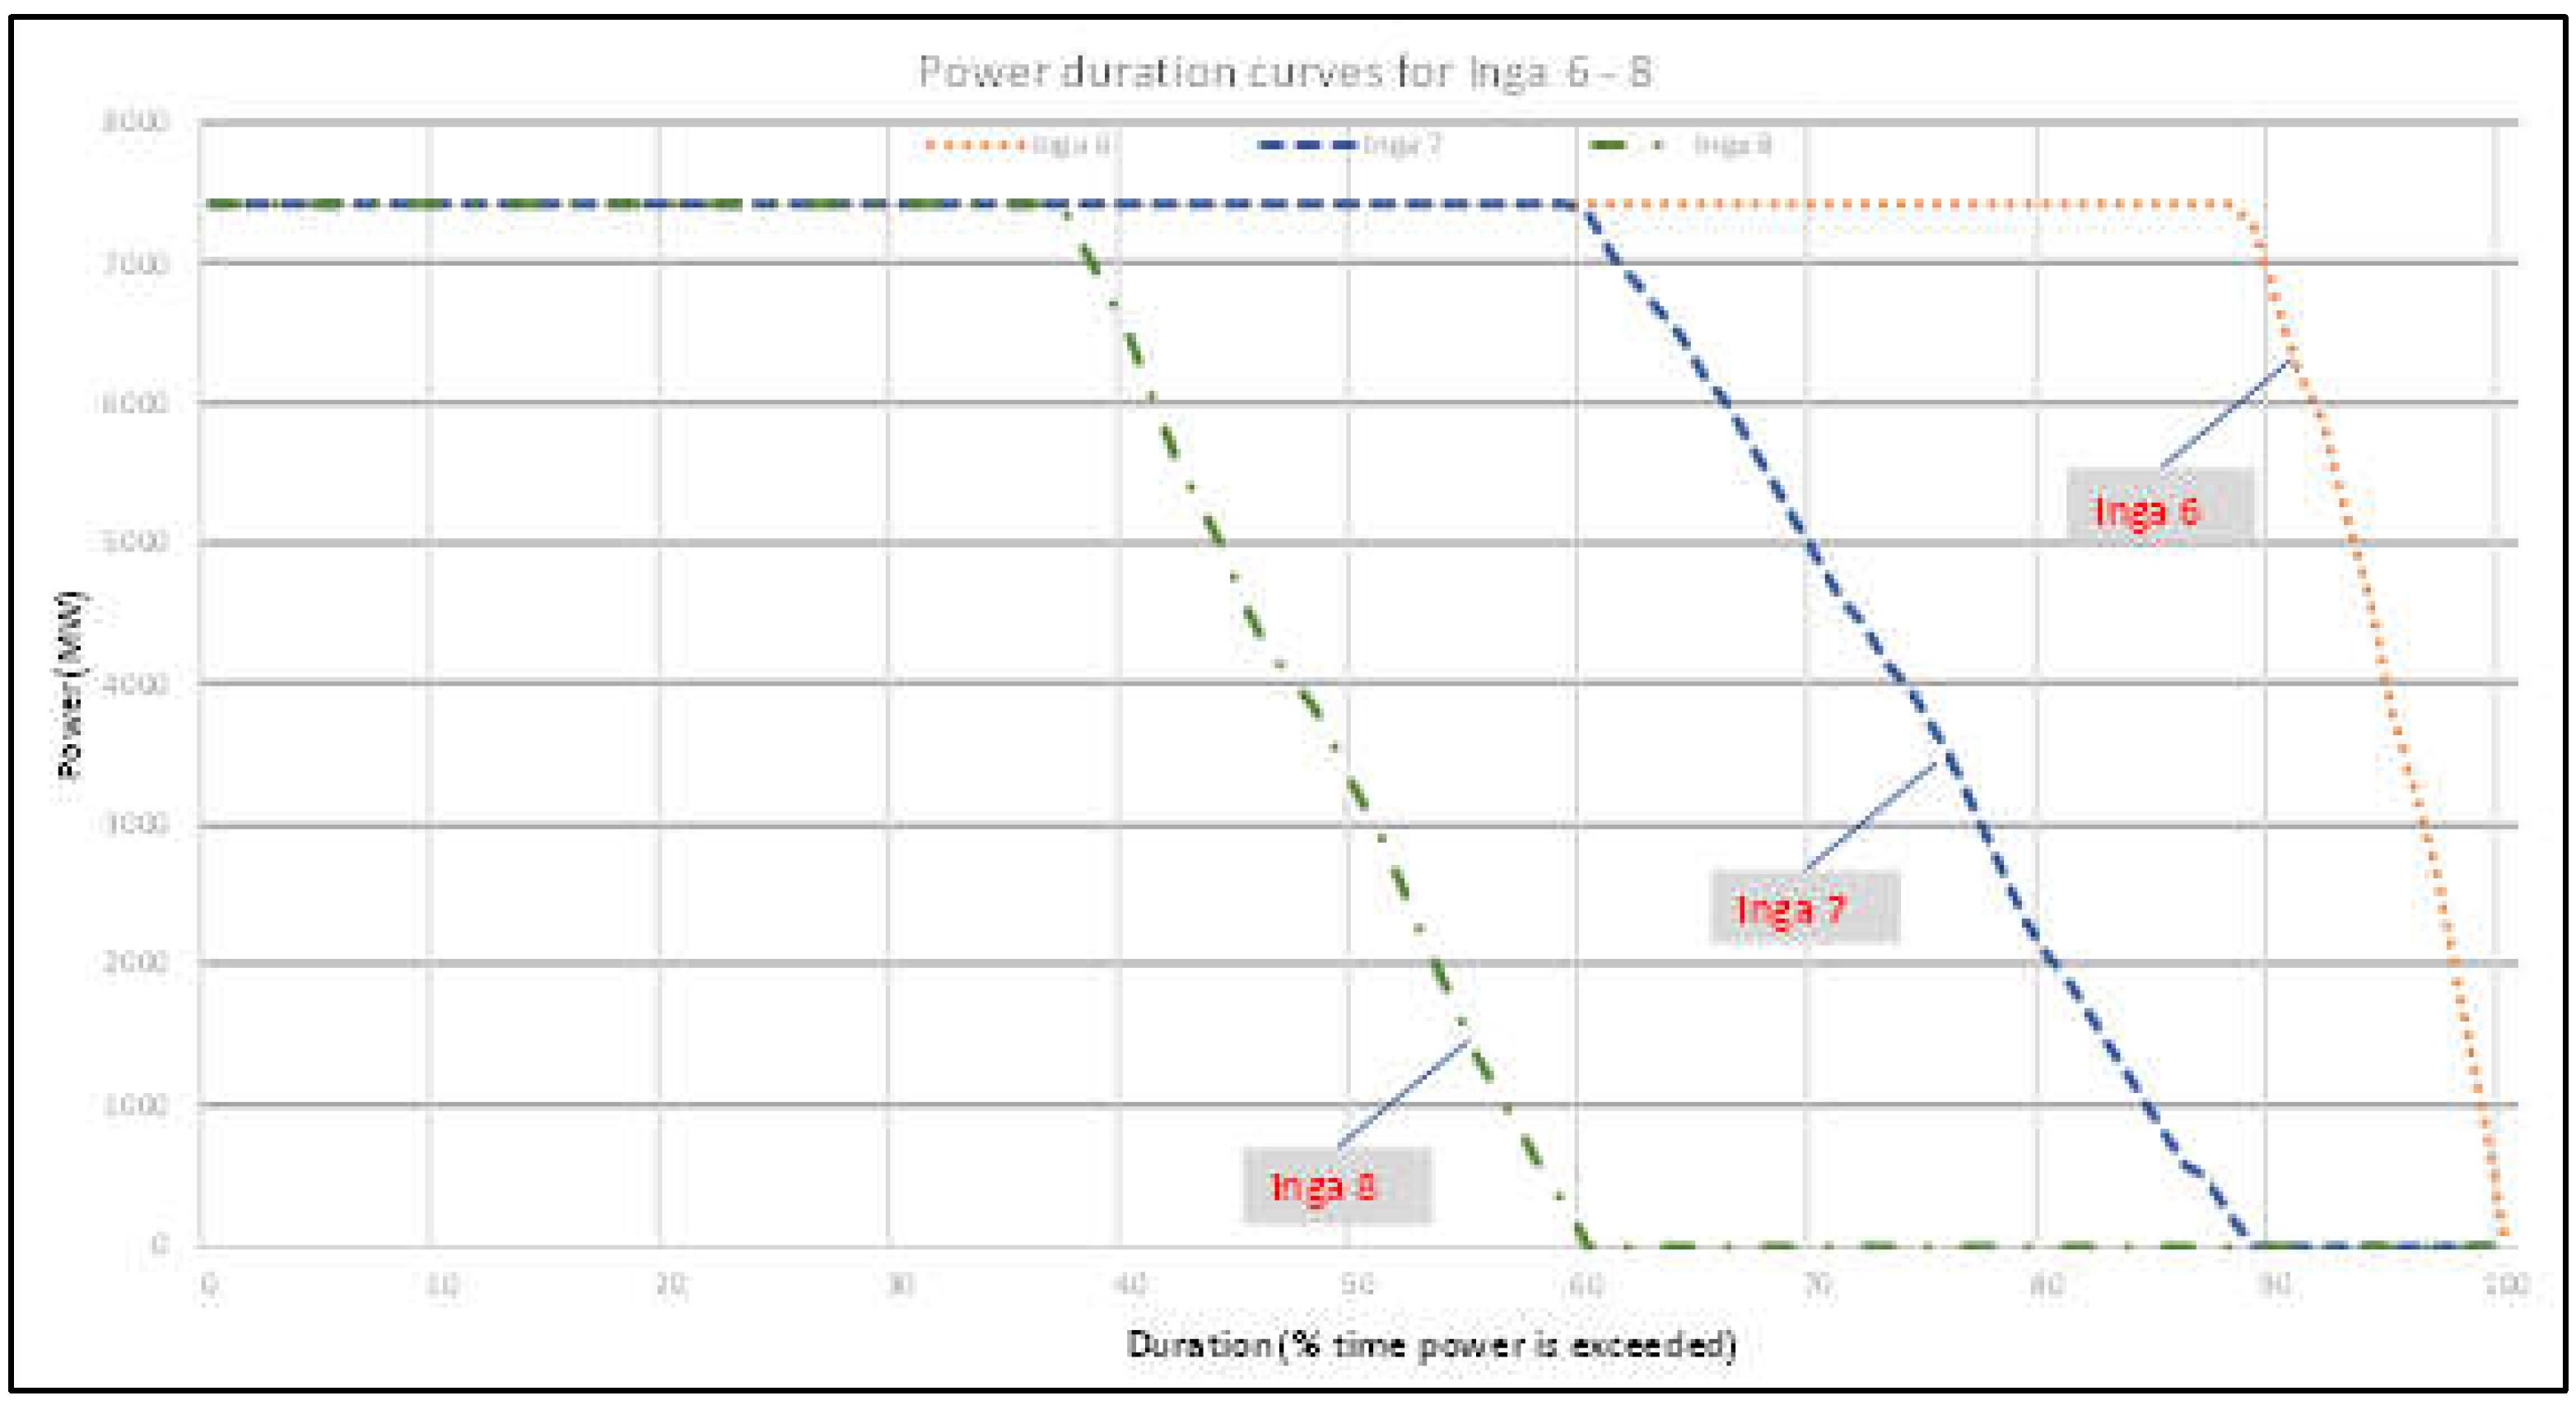
Figure 11.
Simulated change in hydropower generation for CMIP5 (a) & (b) and CMIP6 (c) & (d) Table 5 Main Results of CMIP5.
Figure 11.
Simulated change in hydropower generation for CMIP5 (a) & (b) and CMIP6 (c) & (d) Table 5 Main Results of CMIP5.
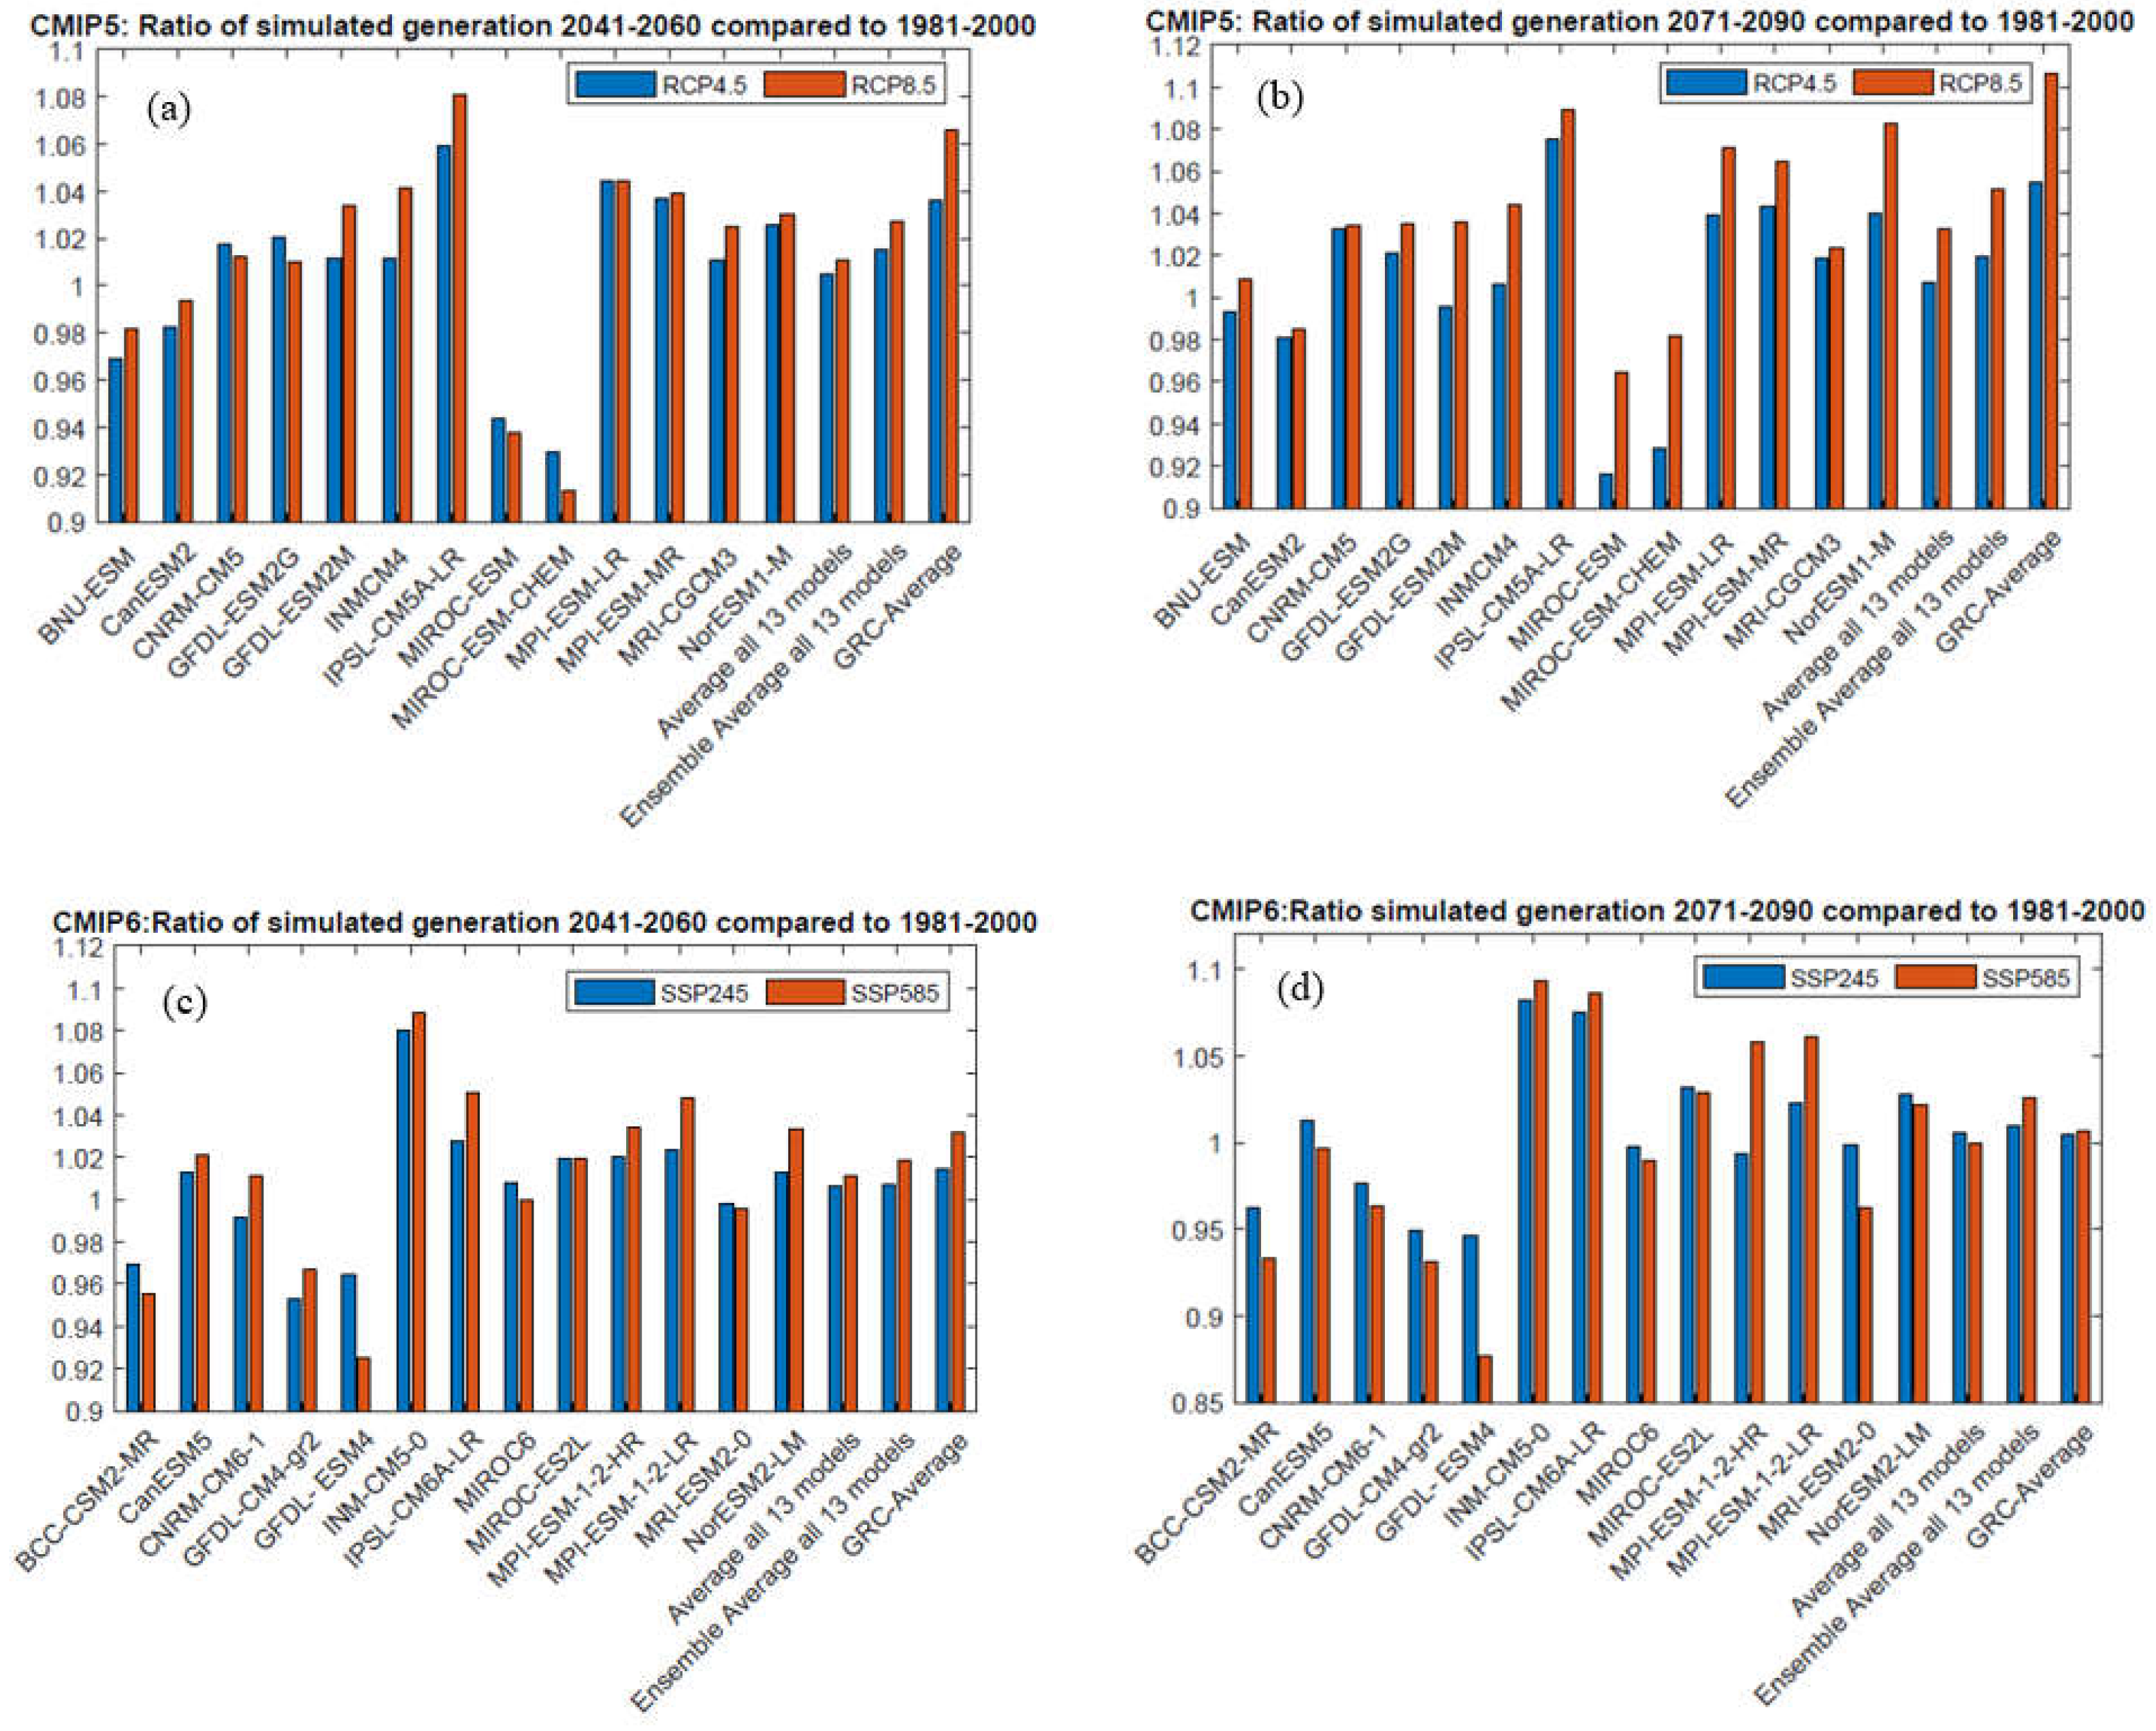
Figure 12.
Hydropower generation at Inga Falls for GRC CMIP5 scenarios.
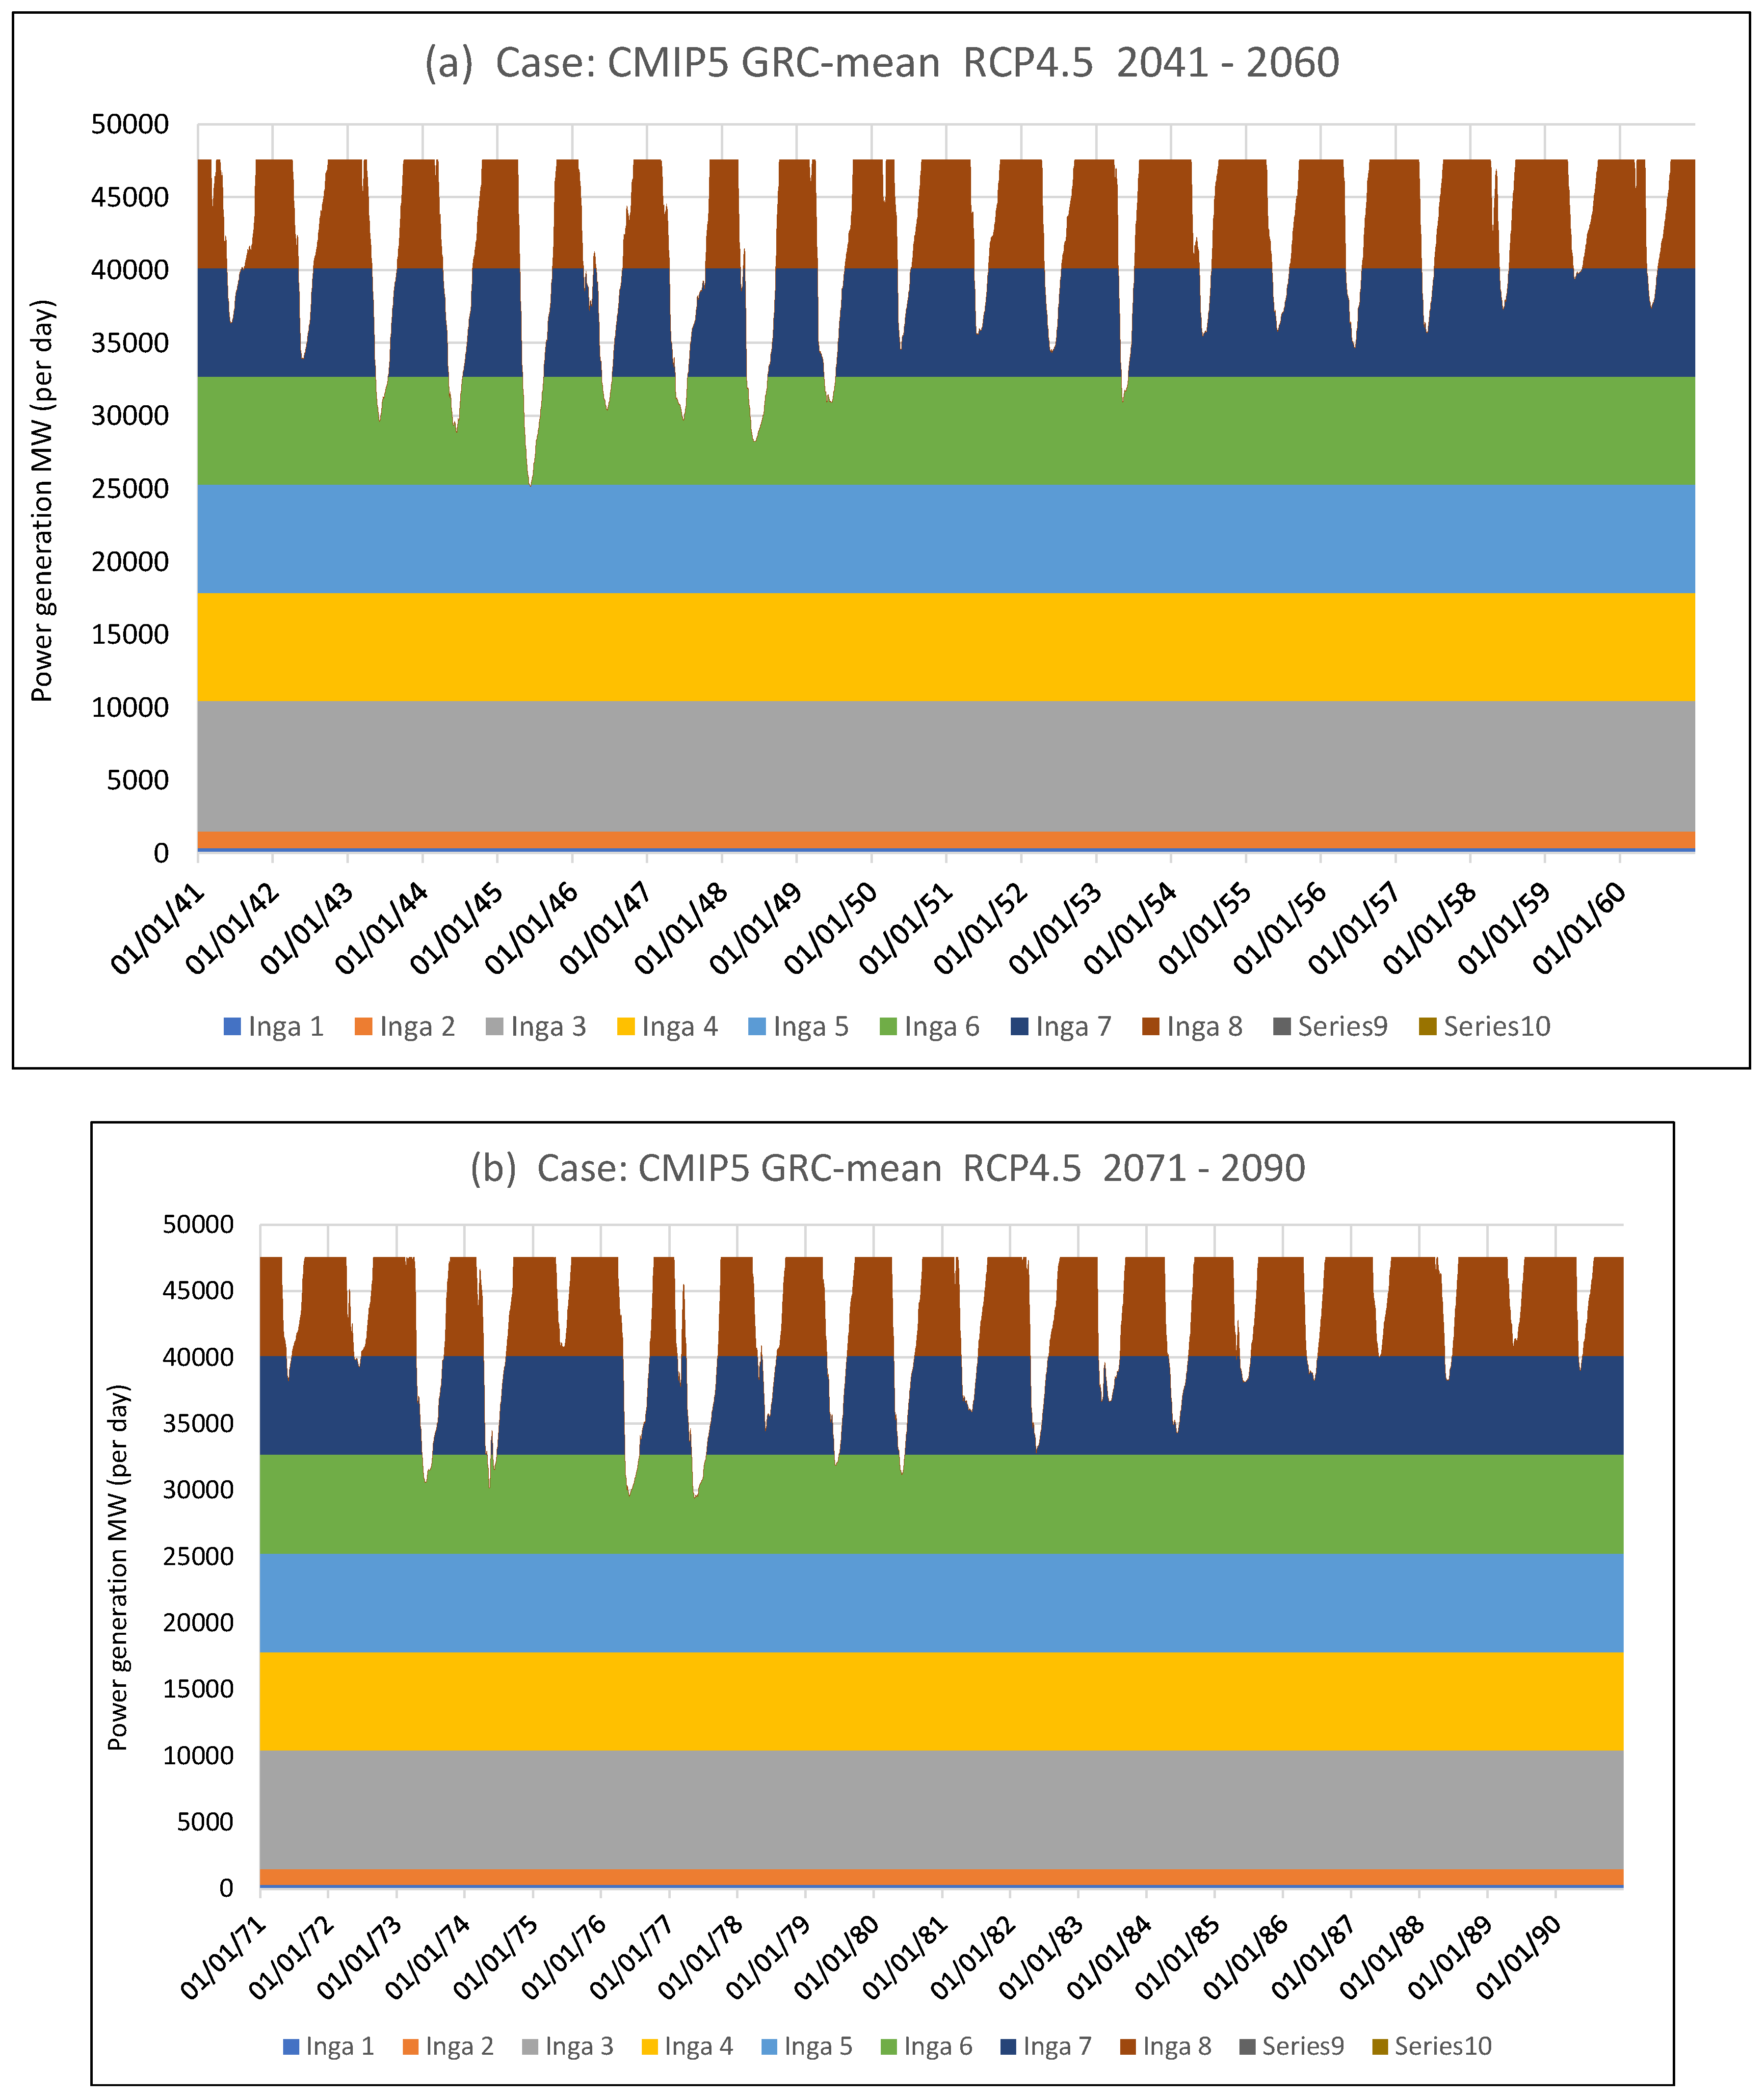
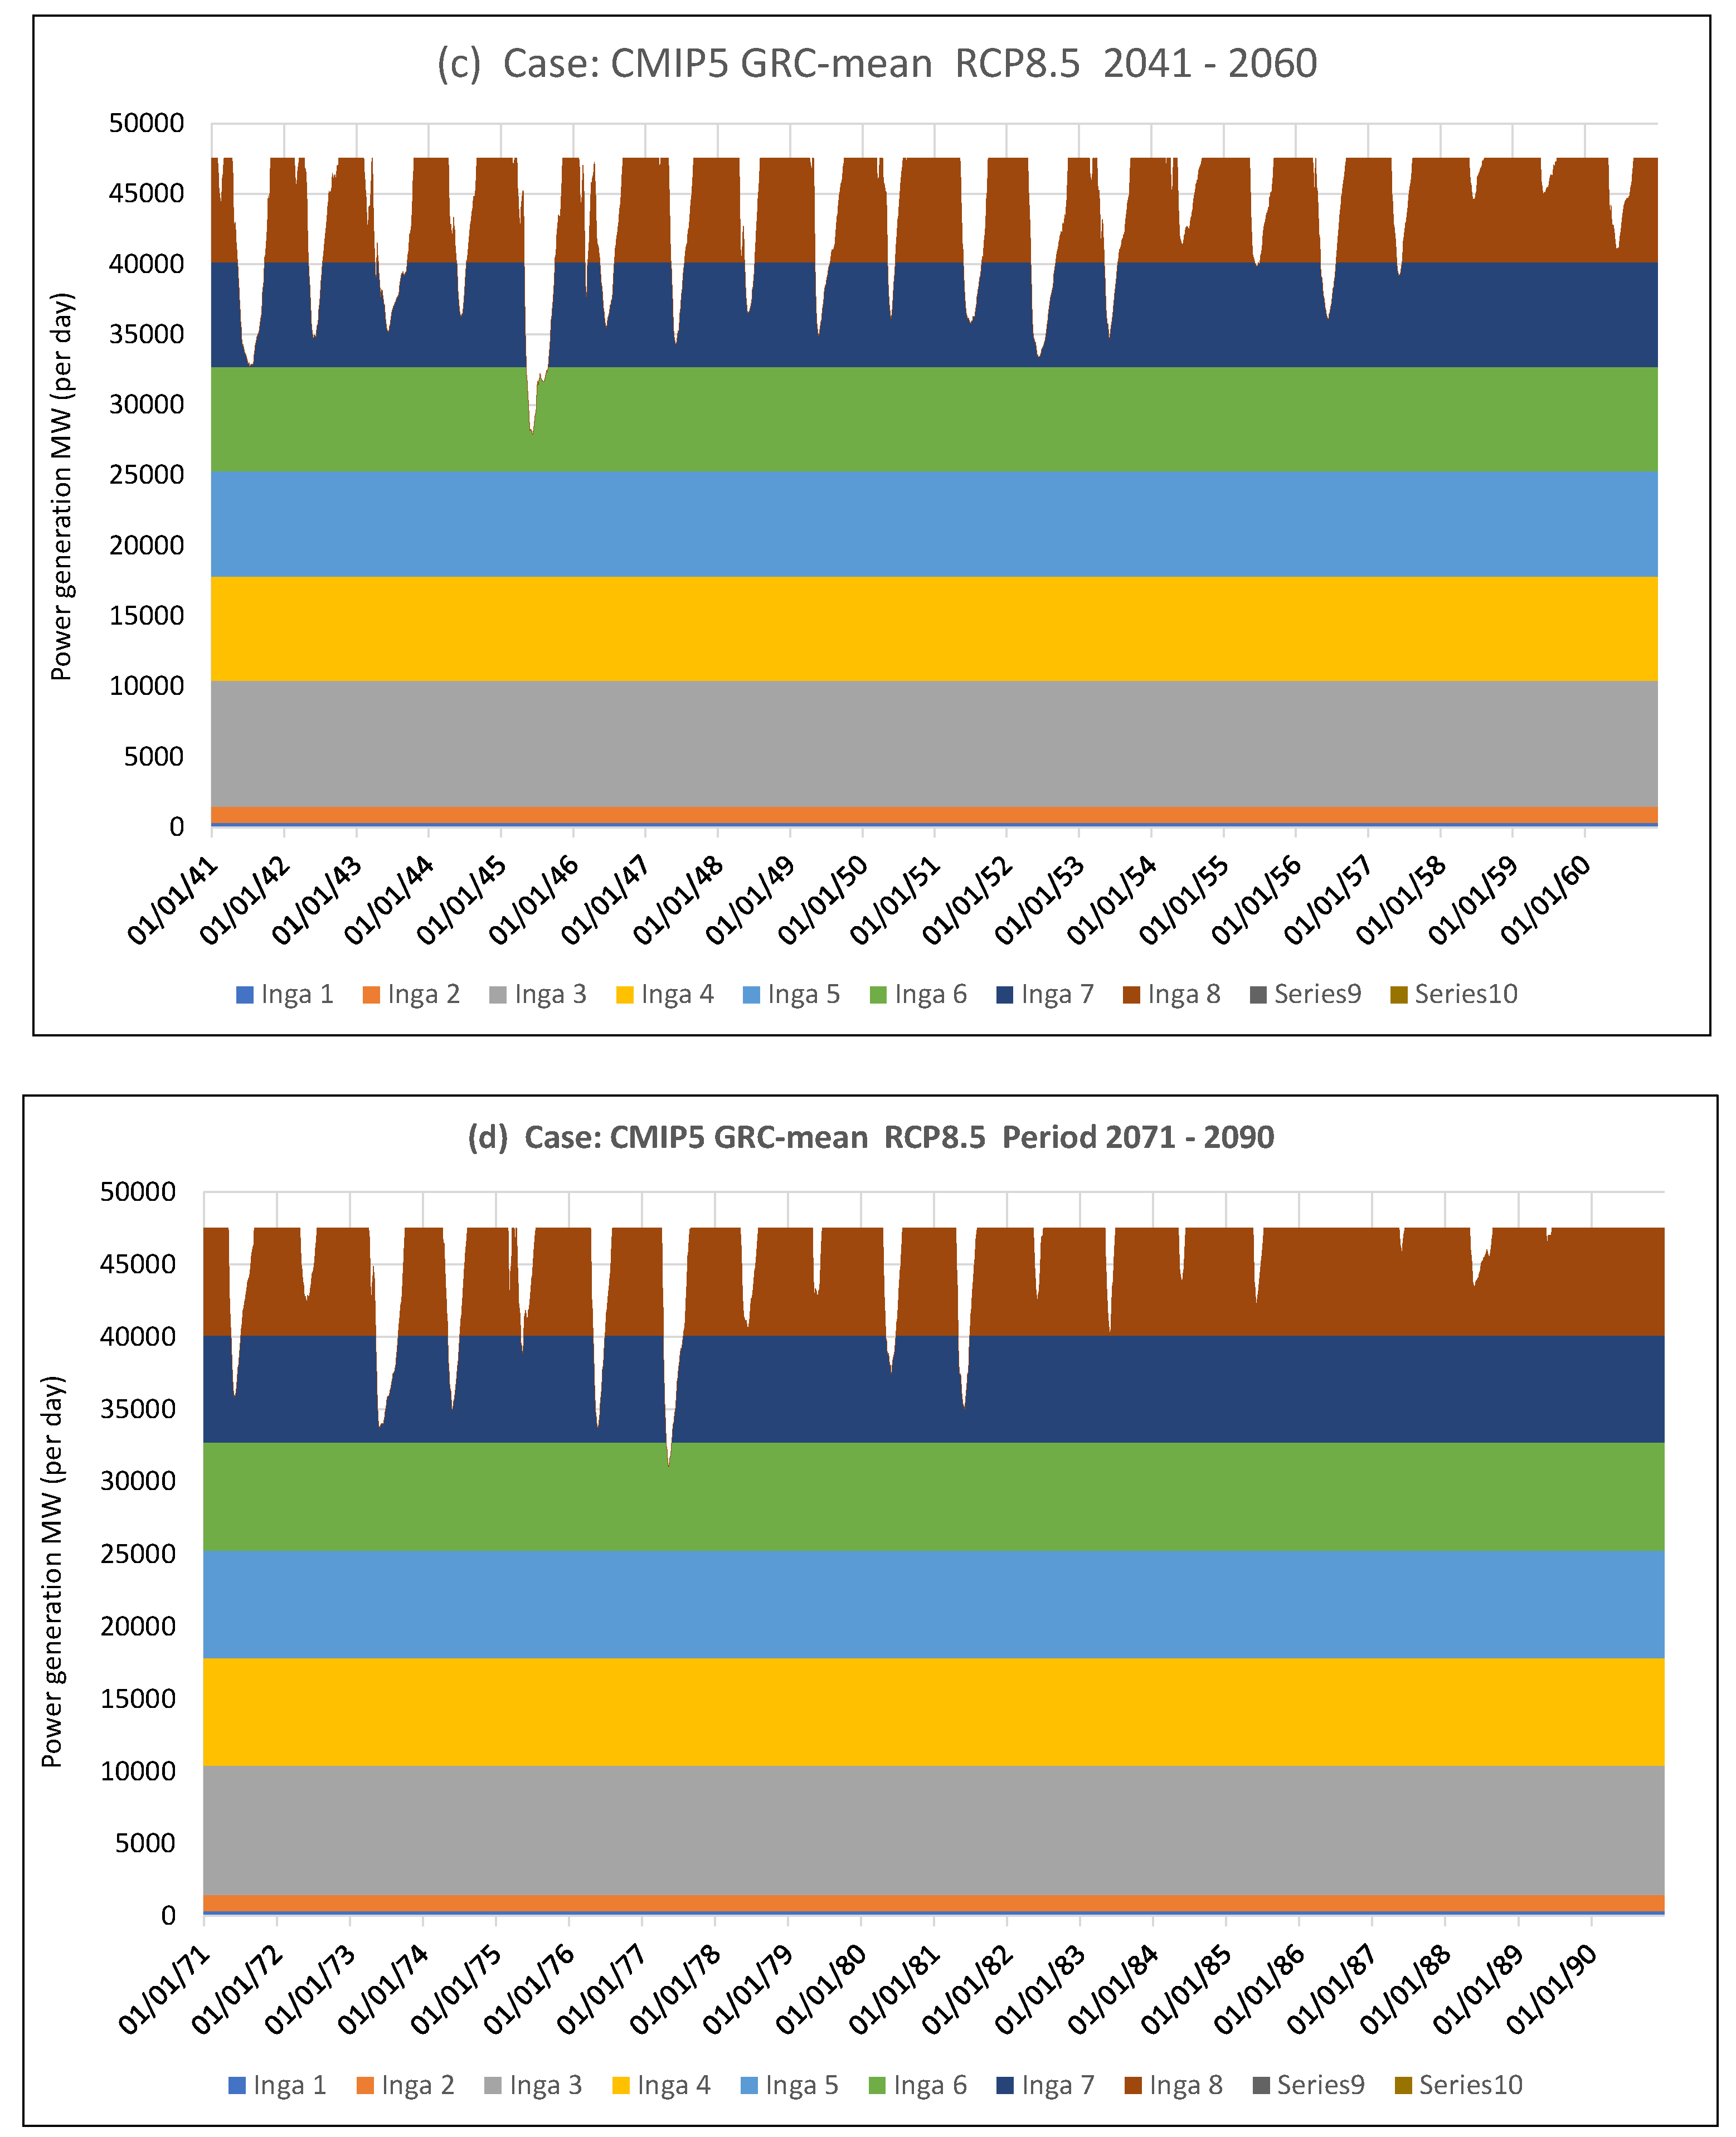
Figure 13.
Hydropower generation at Inga Falls for GRC CMIP6 scenarios.
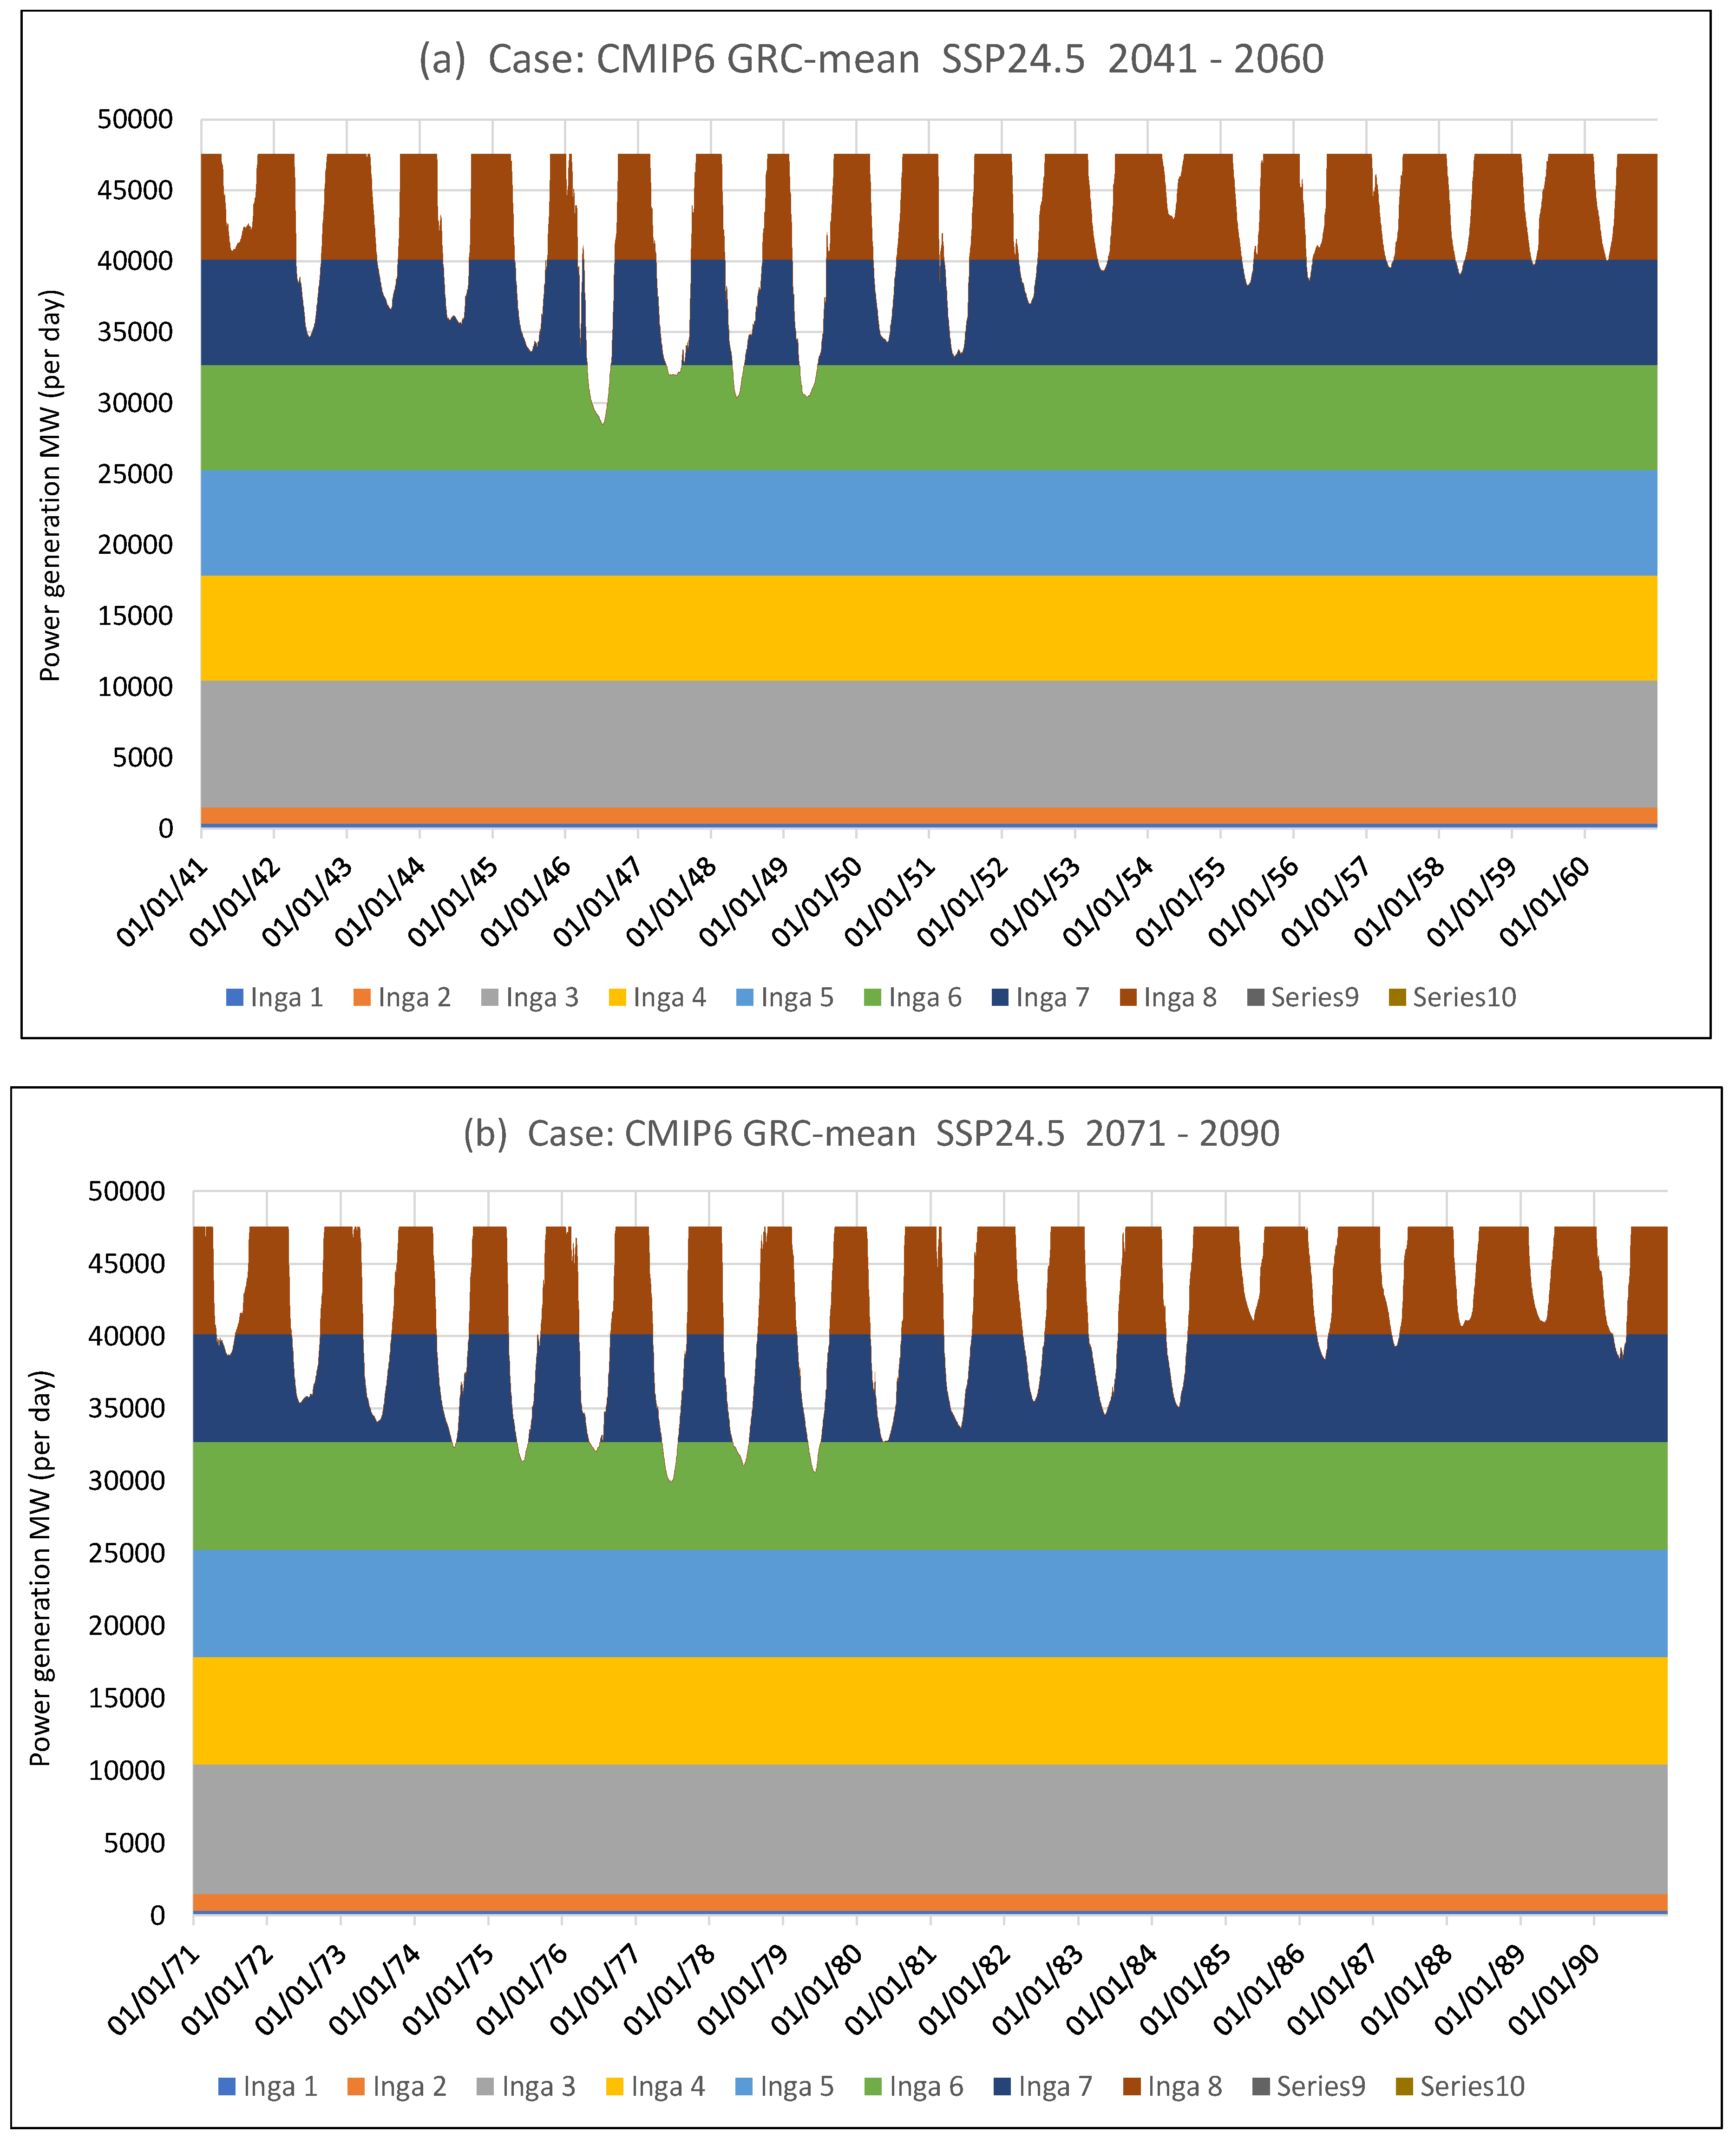
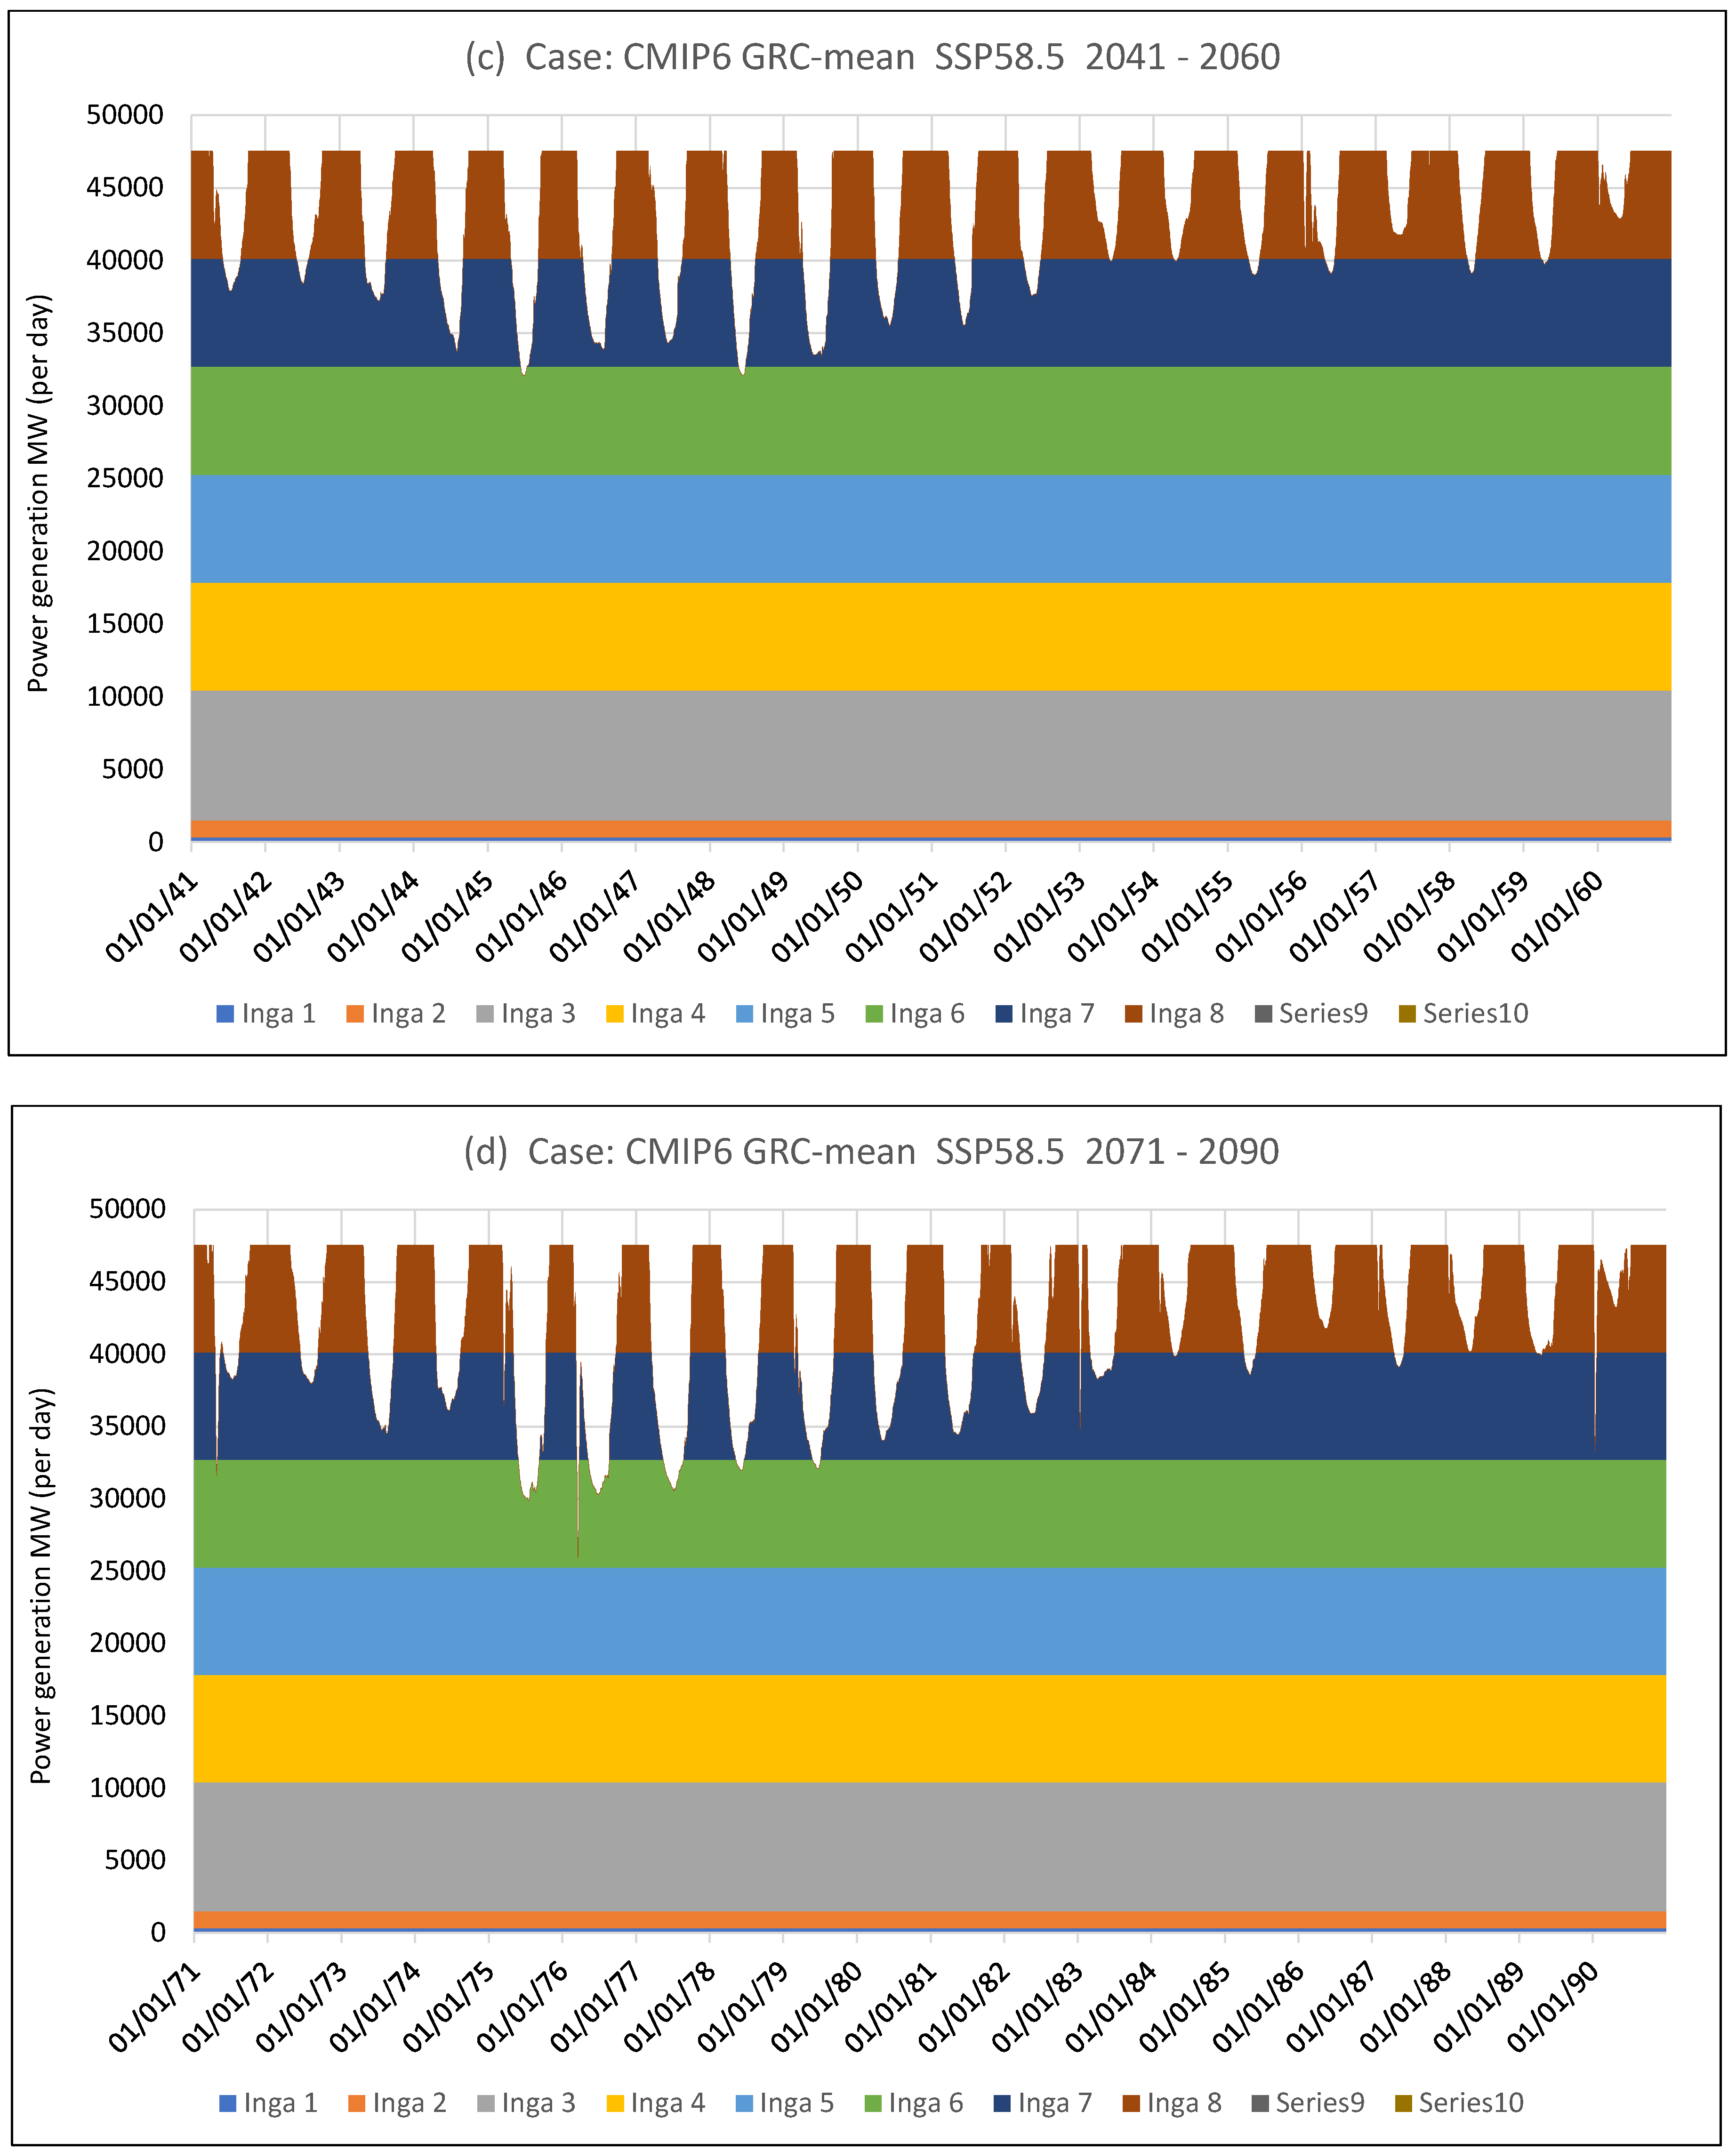
Figure 14.
Possible hydropower generation at Inga Falls beyond Inga 8 for GRC CMIP5 scenarios.
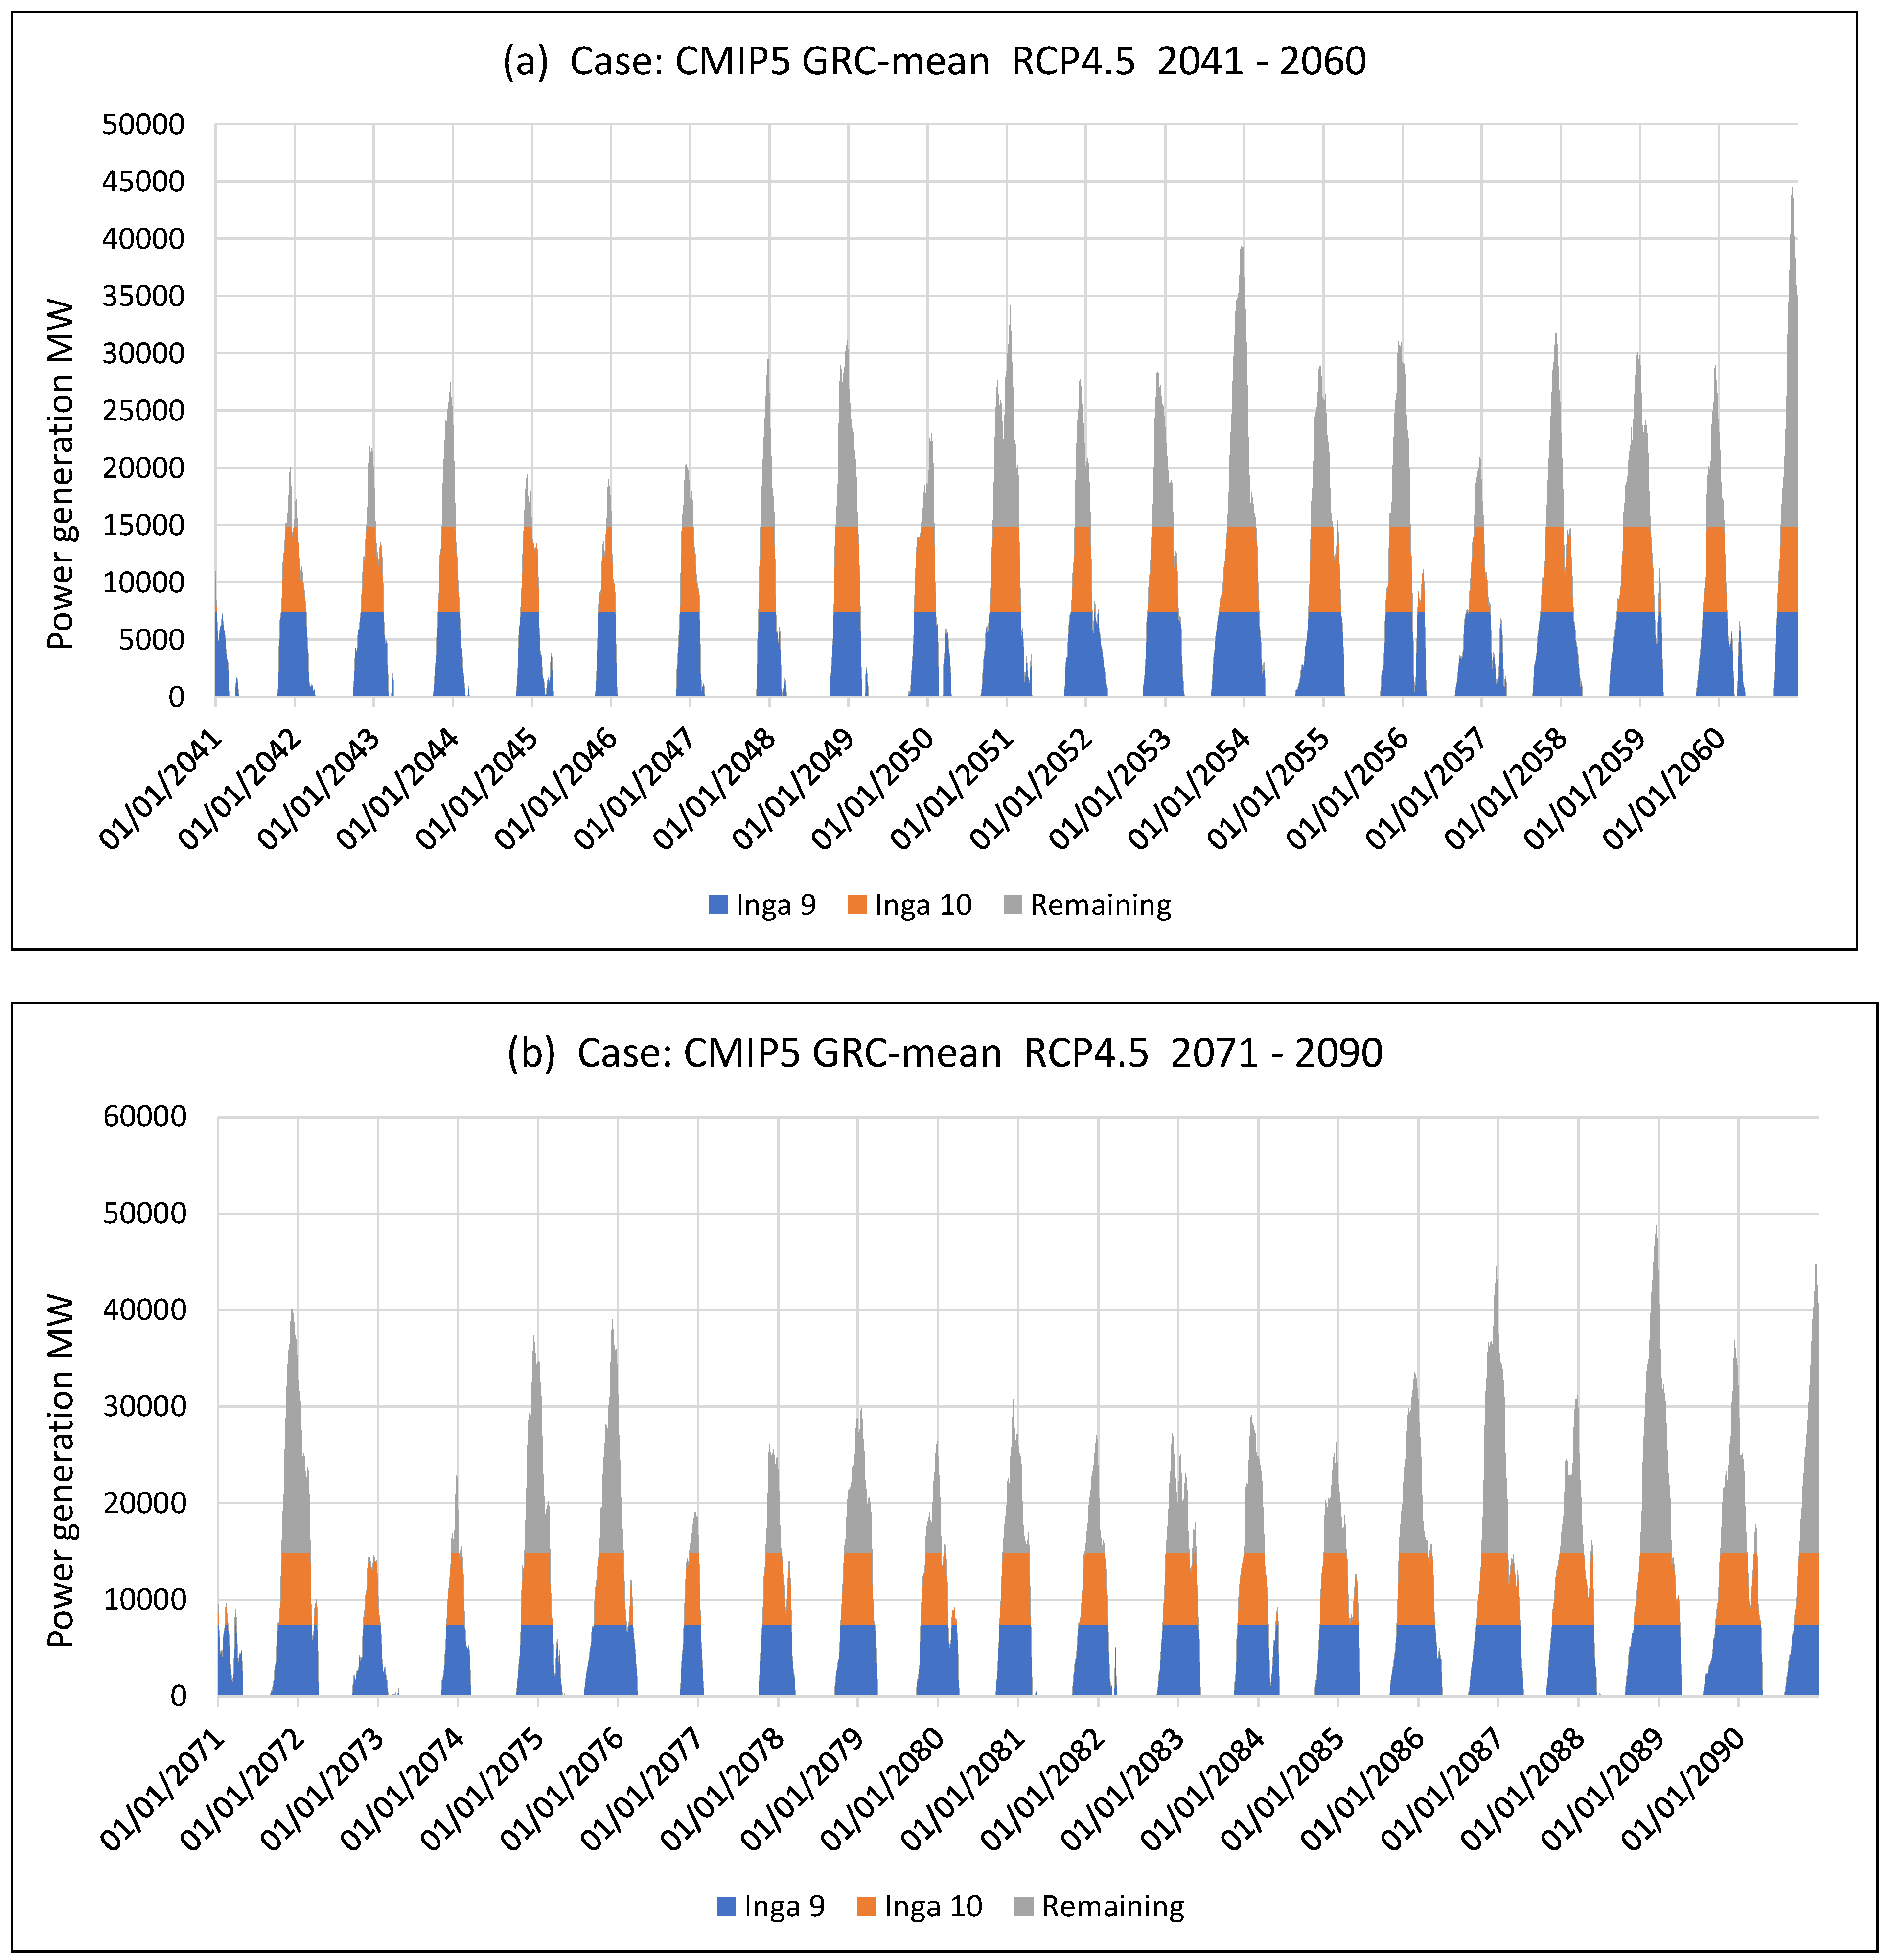
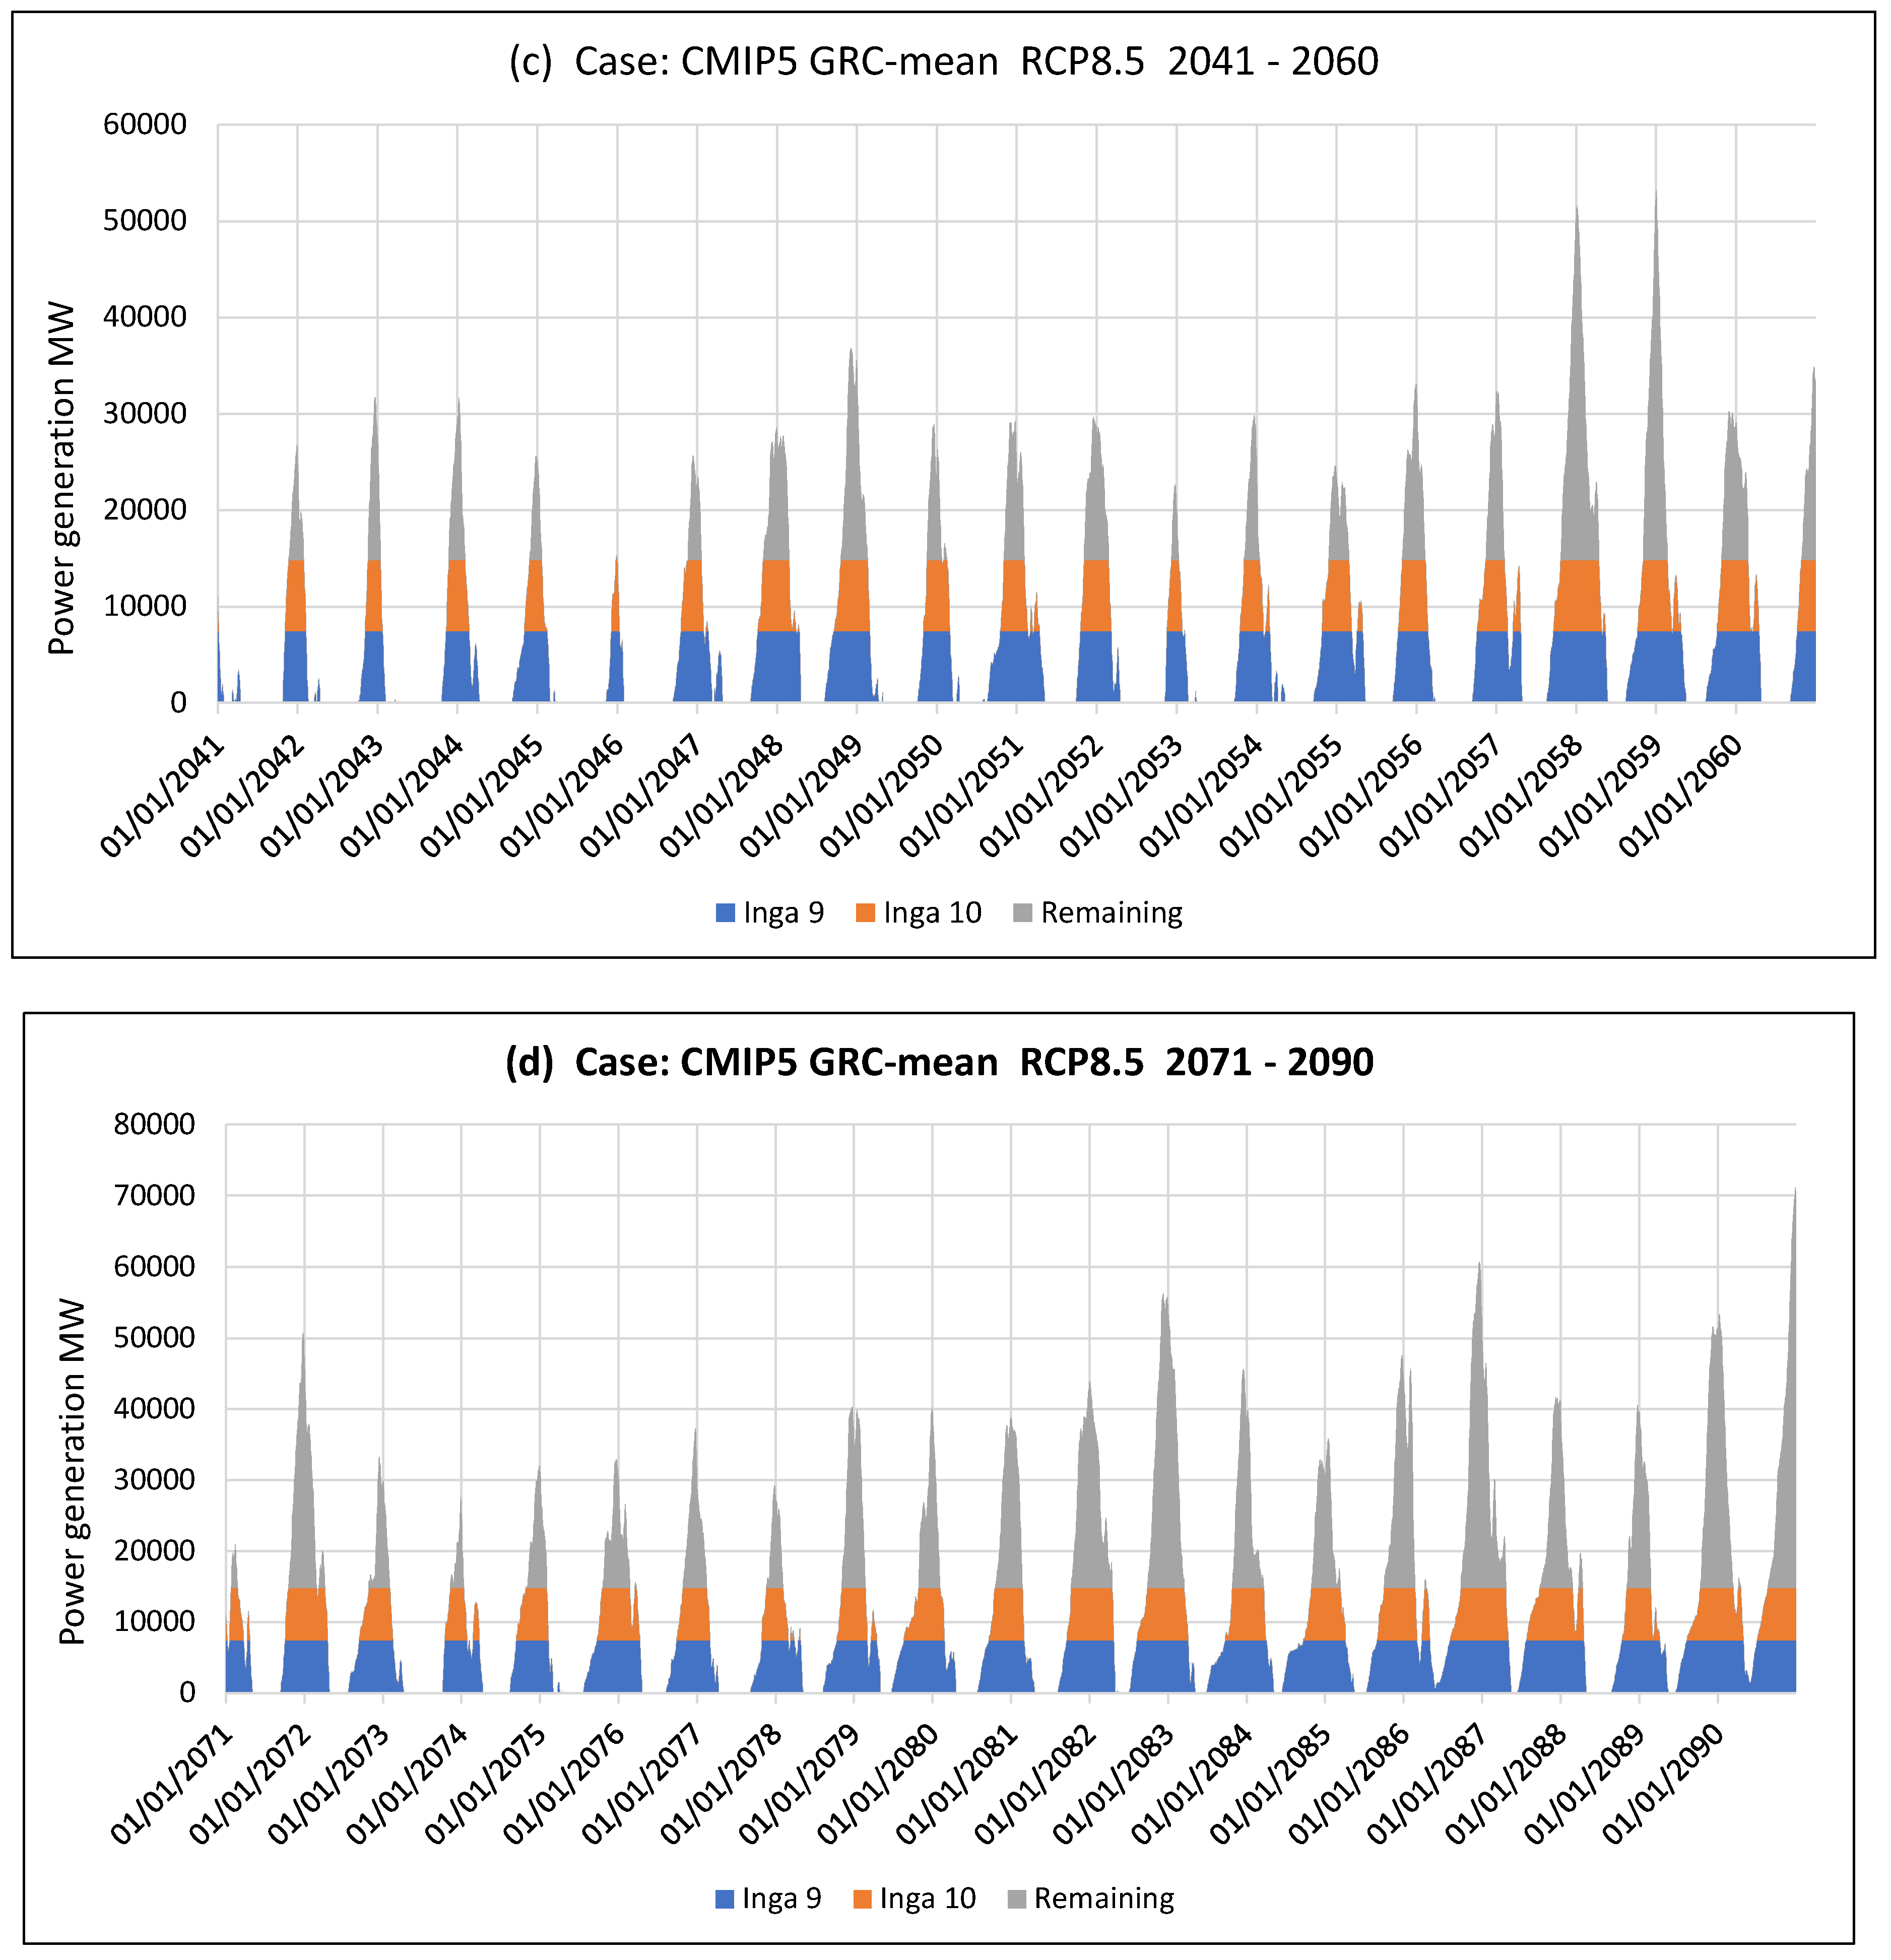
Figure 15.
Possible hydropower generation at Inga Falls beyond Inga 8 for GRC CMIP6 scenarios. .
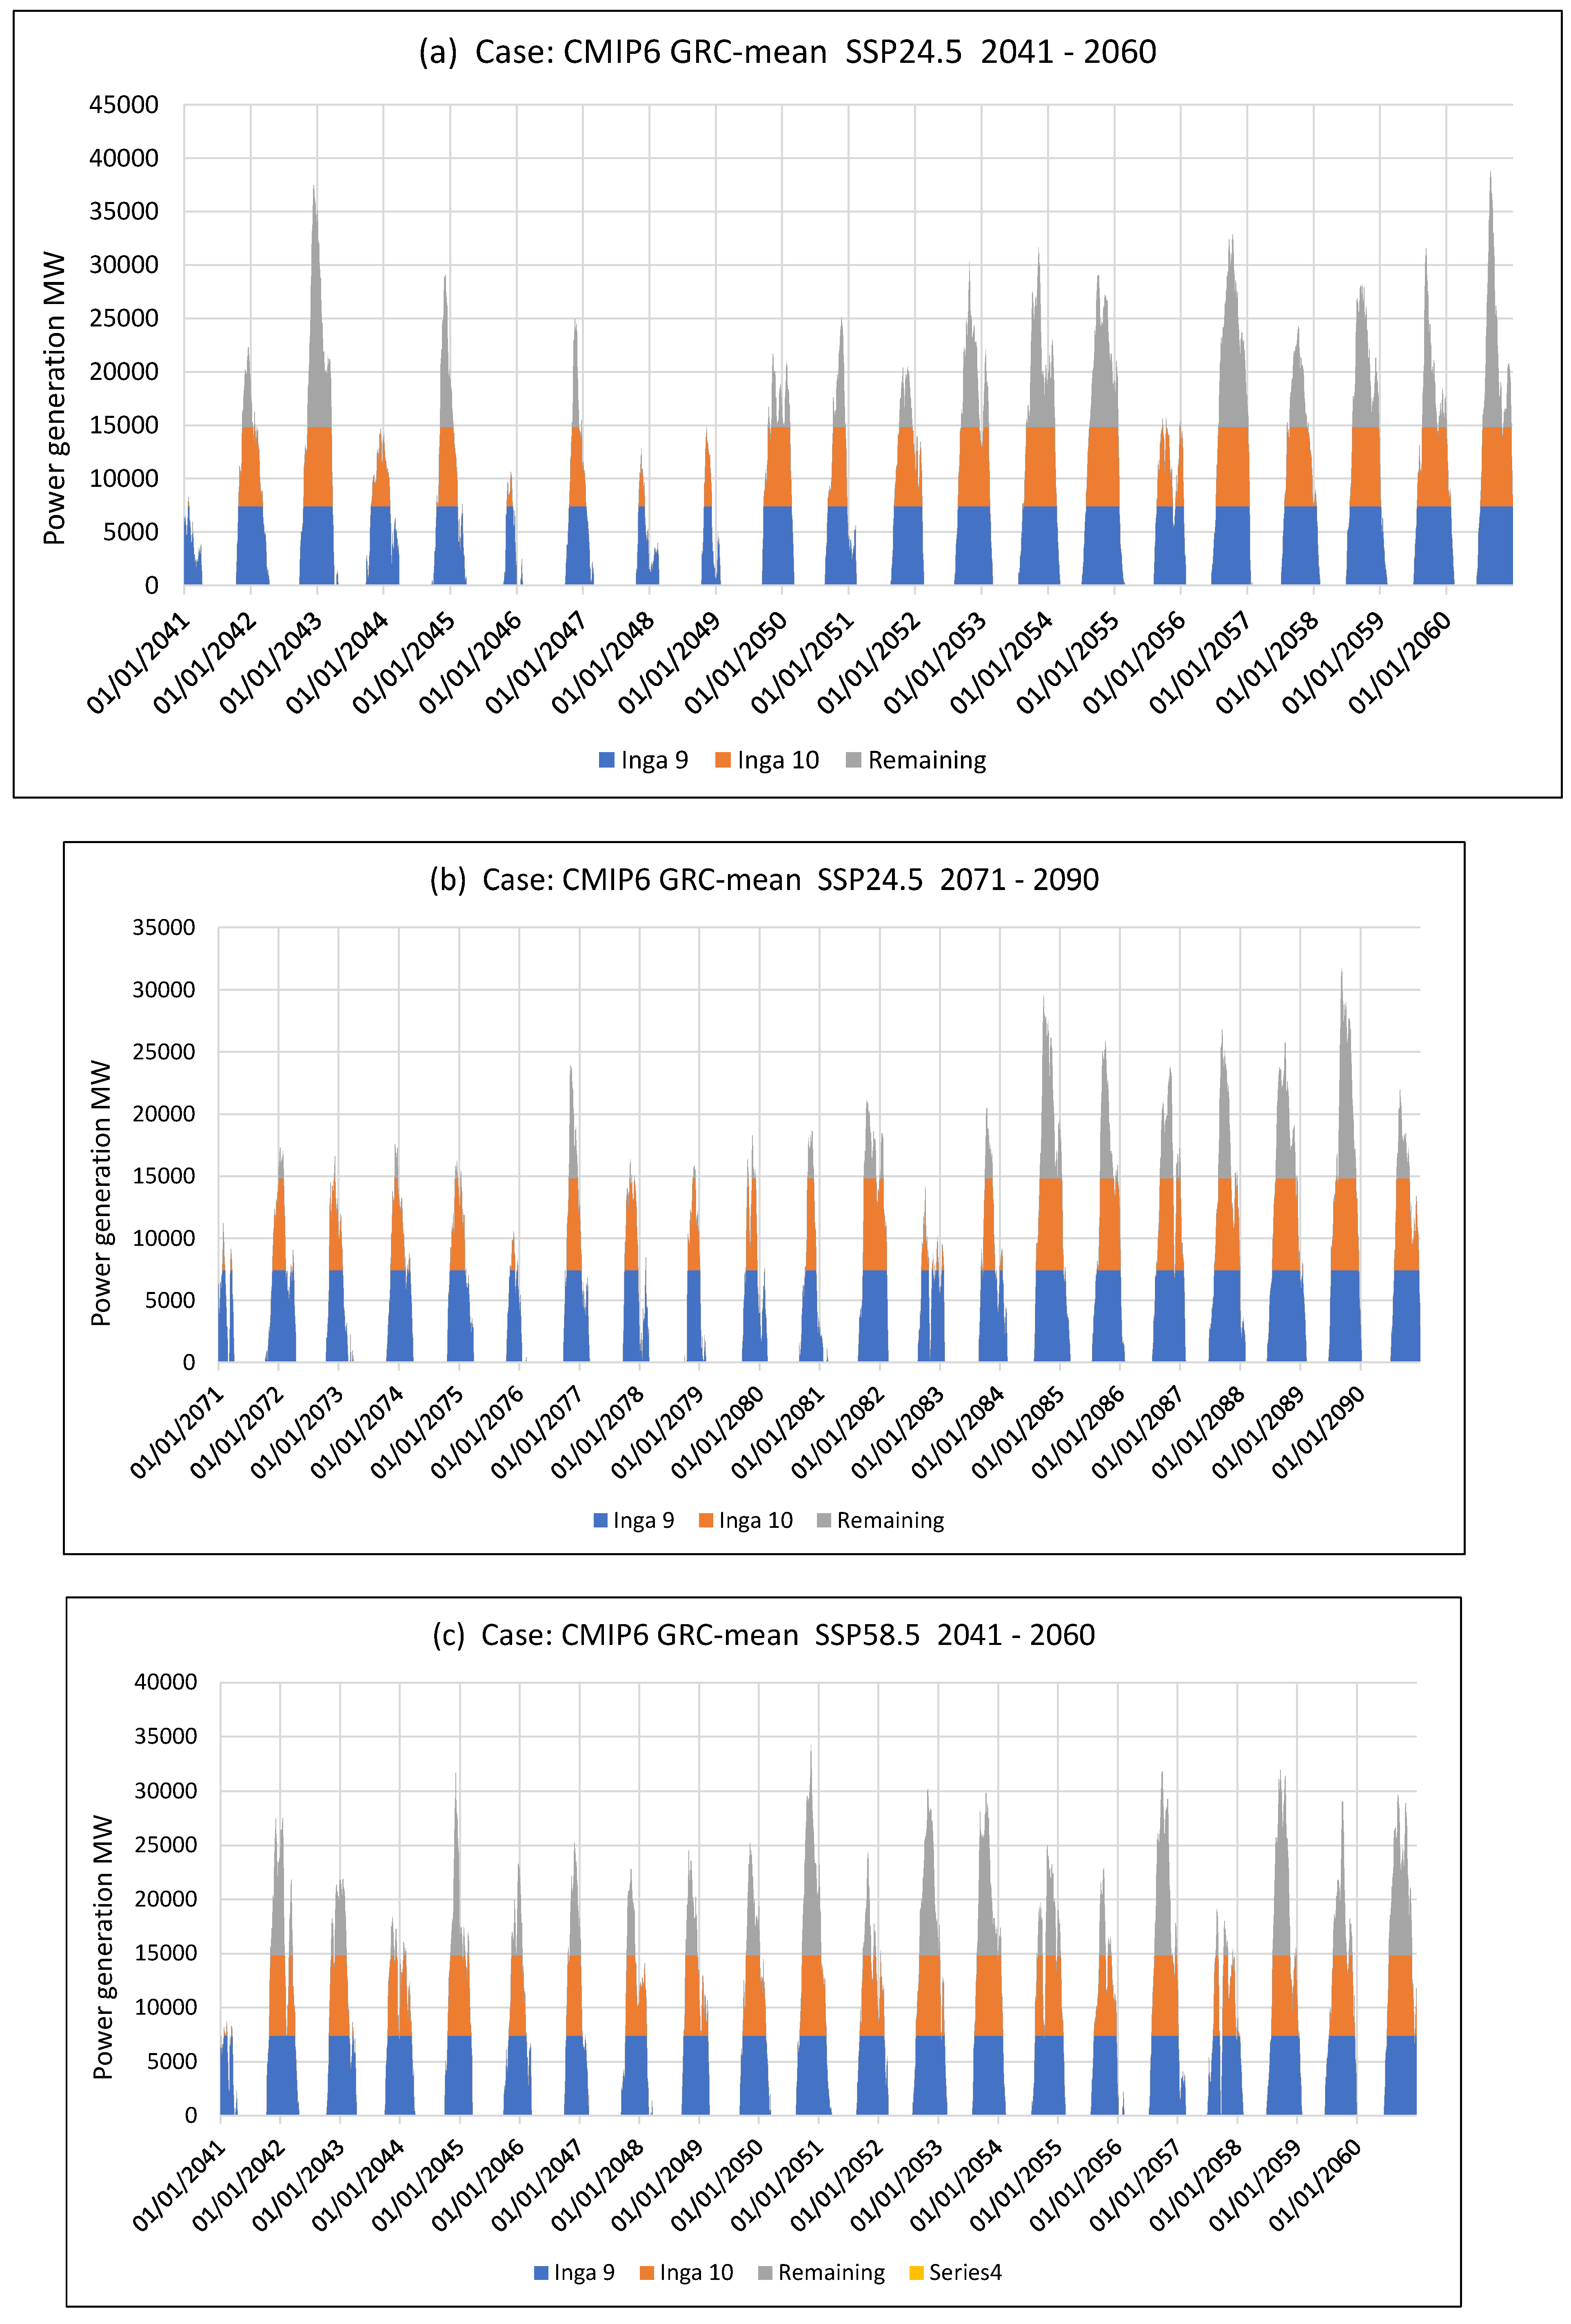
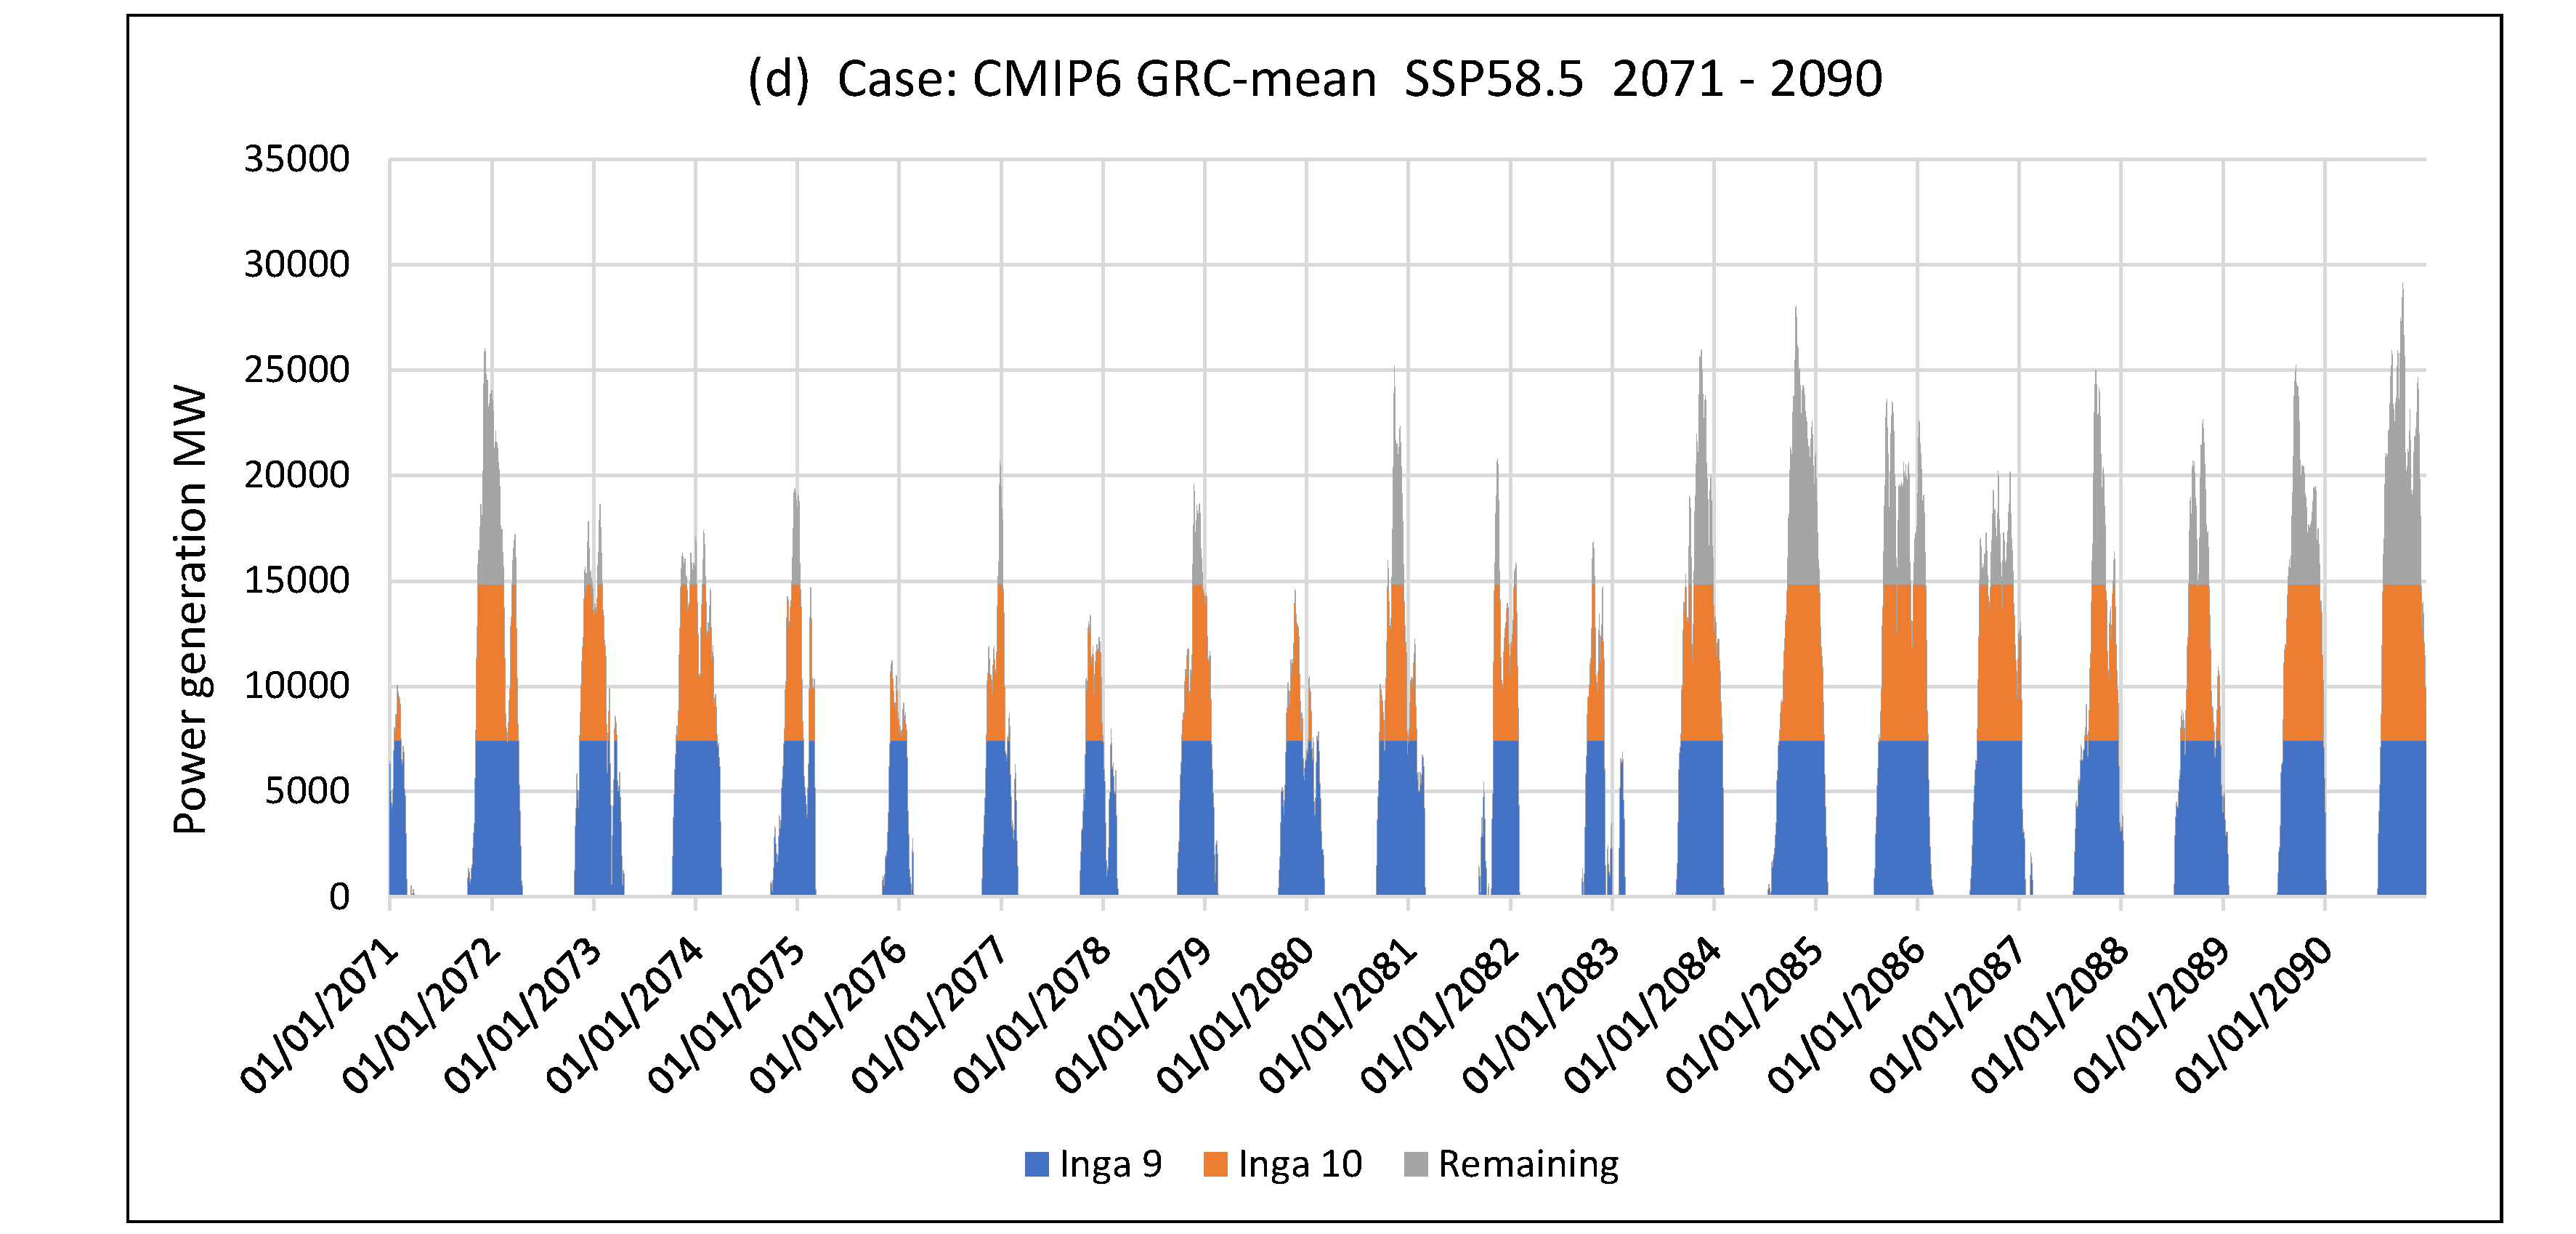

Table 1.
Main technical data for the Inga Falls hydropower system (Source: Nzakimuena et al.,2013).
| Main steps (Phases) in Inga’s development | Data per unit (turbine/generator) | |||||
|---|---|---|---|---|---|---|
| Phase | # of units | Qmax [m3/s] |
Head [m] |
EEQV1 [KWh/m3] |
EEQV2 [MW/m3/s] |
Pmax [MW] |
| Inga 1 | 6 | 130 | 50 | 0.125 | 0.450 | 58.5 |
| Inga 2 | 8 | 252.5 | 58 | 0.157 | 0.566 | 143 |
| Inga 3 | 11 | 600 | 150 | 0.376 | 1.354 | 813 |
| Inga 4 | 8 | 685 | 150 | 0.376 | 1.354 | 928 |
| Inga 5 | 8 | 685 | 150 | 0.376 | 1.354 | 928 |
| Inga 6 | 8 | 685 | 150 | 0.376 | 1.354 | 928 |
| Inga 7 | 8 | 685 | 150 | 0.376 | 1.354 | 928 |
| Inga 8 | 8 | 685 | 150 | 0.376 | 1.354 | 928 |
| Inga 9 | 8 | 685 | 150 | 0.376 | 1.354 | 928 |
| Inga 10 | 8 | 685 | 150 | 0.376 | 1.354 | 928 |
| Rest | 1 | |||||
Table 2.
Cumulative values of flow and capacity for each phase.
| Cumulative values | ||
| Qmax | Pmax | |
| Phase | m3/s | MW |
| Inga 1 Inga 2 |
780 2800 |
351 1495 |
| Inga 3 | 9400 | 10434 |
| Inga 4 | 14880 | 17856 |
| Inga 5 | 20360 | 25278 |
| Inga 6 | 25840 | 32700 |
| Inga 7 | 31320 | 40122 |
| Inga 8 | 36800 | 47544 |
Qmax: Max turbine flow; Head: Gross head Intake to Tailwater; EEQV1: Energy equivalent of water, KWh/m3; EEQV2: Power equivalent of water, MW per m3/s; Pmax: Power capacity at full turbine flow, MW.
Table 3.
Overview of 13 NEX-GDDP CMIP6 models and their predecessors CMIP5 using in this study.
| Model Name | Modeling Agency | Resolution Lon. x Lat. |
|
|---|---|---|---|
| CMIP6 | CMIP5 | ||
| BCC-CSM2-MR | BNU-ESM | Beijing Climate Center, China Meteorological Administration (China) | 0.25° x 0.25° |
| CanESM5 | CanESM2 | Canadian Centre for Climate Modelling and Analysis (Canada) | 0.25° x 0.25° |
| CNRM-CM6-1 | CNRM-CM5 | Centre National de Recherches Météorologiques, France | 0.25° x 0.25° |
| GFDL-CM4-gr2 | GFDL-ESM2G | Geophysical Fluid Dynamics Laboratory, USA | 0.25° x 0.25° |
| GFDL- ESM4 | GFDL-ESM2M | Geophysical Fluid Dynamics Laboratory, USA | 0.25° x 0.25° |
| INM-CM5-0 | INM-CM4 | Institute for Numerical Mathematics, Russian Academy of Science /Russia | 0.25° x 0.25° |
| IPSL-CM6A-LR | IPSL-CM5A-LR | L'Institut Pierre-Simon Laplace (France) | 0.25° x 0.25° |
| MIROC6 | MIROC-ESM | National Institute for Environmental Studies, The University of Tokyo (Japan) | 0.25° x 0.25° |
| MIROC-ES2L | MIROC-ESM-CHEM | National Institute for Environmental Studies, The University of Tokyo (Japan) | 0.25° x 0.25° |
| MPI-ESM-1-2-HR | MPI-ESM-MR | Max Planck Institute for Meteorology (Germany) | 0.25° x 0.25° |
| MPI-ESM-1-2-LR | MPI-ESM-LR | Max Planck Institute for Meteorology (Germany) | 0.25° x 0.25° |
| MRI-ESM2-0 | MRI-CGCM3 | Meteorological Research Institute (Japan) | 0.25° x 0.25° |
| NorESM2-LM | NorESM1-M | Norwegian Climate Centre (Norway) | 0.25° x 0.25° |
Table 4.
Inga Falls – Main results for simulated hydropower generation (1981-2000).
| Cumulative values | Results for 1981-2000 | ||||
|---|---|---|---|---|---|
| Qmax | Pmax | Energy | FLH | Cf | |
| Phase | m3/s | MW | TWh/yr | hours | % |
| Inga 1Inga 2 | 7802800 | 3511495 | 2.4 | 8760 | 100 |
| 10.4 | 8760 | 100 | |||
| Inga 3 | 9400 | 10434 | 88.7 | 8760 | 100 |
| Inga 4 | 14880 | 17856 | 153.7 | 8760 | 100 |
| Inga 5 | 20360 | 25278 | 218.7 | 8756 | 100 |
| Inga 6 | 25840 | 32700 | 280.5 | 8320 | 95 |
| Inga 7 | 31320 | 40122 | 328.8 | 6510 | 74 |
| Inga 8 | 36800 | 47544 | 360.1 | 4221 | 48 |
Table 6.
Main Results of CMIP6.
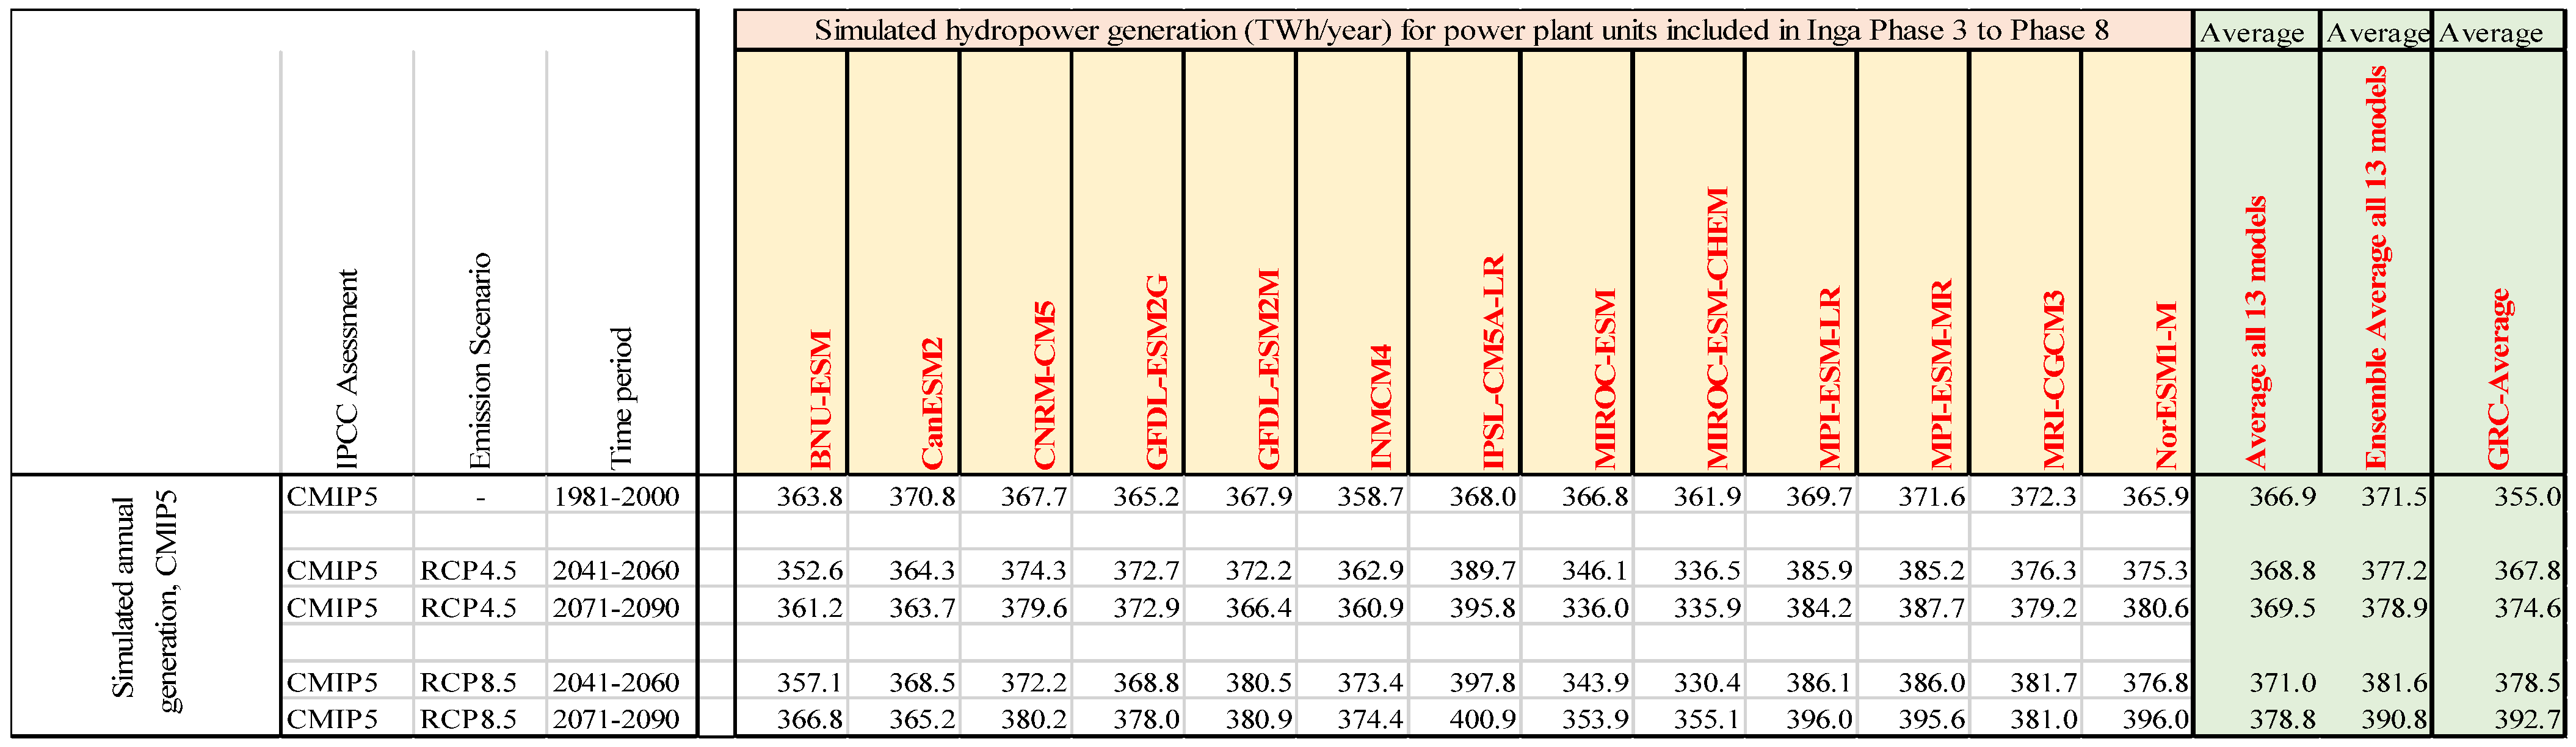
Table 7.
Main Results of change in hydropower generation due to Climate Change.
Disclaimer/Publisher’s Note: The statements, opinions and data contained in all publications are solely those of the individual author(s) and contributor(s) and not of MDPI and/or the editor(s). MDPI and/or the editor(s) disclaim responsibility for any injury to people or property resulting from any ideas, methods, instructions or products referred to in the content. |
© 2024 by the authors. Licensee MDPI, Basel, Switzerland. This article is an open access article distributed under the terms and conditions of the Creative Commons Attribution (CC BY) license (http://creativecommons.org/licenses/by/4.0/).
Copyright: This open access article is published under a Creative Commons CC BY 4.0 license, which permit the free download, distribution, and reuse, provided that the author and preprint are cited in any reuse.


