
Submitted:
21 March 2025
Posted:
24 March 2025
You are already at the latest version
Abstract
This study explores the implications of Solar Radiation Modification (SRM) on the rainfall and temperature patterns over the Eastern Africa region. The Geoengineering Model Intercomparison Project (GeoMIP) models under solar radiation modification of G6solar and G6sulfhur were evaluated against the Shared Social-economic Pathways (SSPs). First, six GeoMIP models are evaluated against historical data and are found to capture the climate patterns in the region fairly well. Secondly, the models are run under both SRM scenarios and SSP scenarios for 2051-2080. Results show that G6solar SRM scenario predict slightly increased annual precipitation in the region over SSP245 but predict reduced annual precipitation in the region over SSP585 in the same period. G6sulfur SRM scenario predict reduced annual precipitation over both SSP245 and SSP585 in most parts of the region with slightly more reduced precipitation over SSP585 compared to SSP245 in the same period. For temperature, G6solar SRM scenario predict reduced annual mean temperature over both SSP245 and SSP585 in most parts of the region with slightly reduced temperature over SSP585 compared to SSP245 in the same period. However, G6sulfur is shows some inconsistent results with some models such as IPSL-CM6A_LR predicting increased tem-peratures under SRM compared to SSPs especially SSP245.
Keywords:
Solar Radiation Modification
; Geoengineering
; Eastern Africa
; Climate Dynamics
1. Introduction
Climate change and variability are key global issues affecting almost all economic sectors, especially in the developing countries. Intergovernmental Panel on Climate Change (IPCC) reports have highlighted anthropogenic greenhouse gases as a major cause of global climate change in the recent past [1] Global efforts by different bodies such as the United Nations Framework Convention on Climate Change (UNFCCC) have proposed strategies aimed at addressing this climate change problem. For example, the Paris Agreement 2015 aims at reducing the mean global climate to 2oC below the pre-industrial values with a more ambitious target of keeping mean global temperature increases to within 1.5oC above the pre-industrial values [2].
In line with the Paris Agreement, countries have made pledges to reduce their greenhouse gas emissions through the Nationally Determined Contributions (NDCs). Even with this target, the submitted NDCs of greenhouse gas reductions from the various countries are expected to cause an average warming of between 2.6 and 3.1oC by 2100 which is far beyond the agreed warming levels [3]. Therefore, mitigation of climate change by reducing the amount of greenhouse gases in the atmosphere should be supplemented by other initiatives if future environmental sustainability is to be achieved.
Initiatives such as Solar Radiation Modification (SRM) that enhances the earth’s reflectivity are now being explored as supplementary strategies for reducing the trend of global warming by cooling the environment [4]. Solar Radiation Modification (SRM) has been defined by IPCC as a range of radiation modification measures not related to greenhouse gas (GHG) mitigation that seek to limit global warming [5]. The most common methods of SRM so far used are Stratospheric Aerosol Injection (SAI) and Marine Cloud Brightening (MCB) [4]. SAI involves injection of highly reflective aerosols (or their precursors) into the stratosphere to deflect more sunlight back to space and cool the climate. It is estimated that SAI can potentially reduce the earth’s energy by a radiative forcing of 2-5Wm-2 which is equivalent to approximately 1-2% of the total solar radiation absorbed by the earth [4]. MCB on the other hand involves adding suitable Cloud Condensation Nuclei (CCN); sub-microscopic particles that facilitate the condensation of water vapor in the atmosphere to form cloud droplets), like sea salt, into the low-level (~0-2 km) marine cloud layer. Then, evaporation of water from the droplets results in suspended sea salt particles which can act as CCN. This increase in CCN would produce both a higher number of cloud droplets and droplets of smaller size, which would increase the reflectivity of clouds and therefore scatter more radiation back to space [6].
Global initiatives such as the Geoengineering Model Intercomparison Project (GeoMIP) [7], the Geoengineering Large Ensemble (GLENS) [8] and Assessing Responses and Impacts of Solar climate intervention on the Earth system (ARISE) [9] have run Global Circulation Models (GCMs) with different SRM scenarios as an approach of manipulating the incoming solar radiation . Two SRM simulations G6solar and G6sulfur under GeoMIP were considered to represent SRM in this study [7]. The G6solar scenario simulates the effects of geoengineering by increasing the amount of solar radiation reflected away from the Earth. This is achieved theoretically by deploying reflective particles in the atmosphere or increasing the reflectivity of clouds [7]. The G6sulphur scenario simulates the effect of injecting sulfur dioxide (SO2) into the upper atmosphere to form sulfate aerosols [7]. Like the G6solar simulation, the goal is to increase the Earth's reflectivity, thereby reducing the amount of sunlight that reaches the surface and mitigating the effects of climate change. These global efforts of SRM need to be studied at regional and sub-regional scales to understand how the manipulated radiation budget might influence the climatic patterns at these scales. The need to study SRM at a regional level is particularly important for the Eastern Africa region that has a rather dynamic climate and whose economic development majorly depends on the variations in climatic parameters [10]. More specifically, the response of SRM on rainfall and temperature over Eastern Africa has not been adequately investigated. This study therefore, examines the GeoMIP simulations with an aim of understanding the impact of SRM on Eastern Africa climate patterns. This study addresses two research questions: (1) to what extent do GeoMIP GCM models represent historical rainfall and temperature patterns over the Eastern Africa region? (2) how does projected future SRM models compare with the Conventional Shared Social Economic Pathways (SSPs) in predicting rainfall and temperature patterns over Eastern Africa?
2. Materials and Methods
2.1. Study Area
This study focuses on the Eastern Africa region that comprises of eleven countries, including Ethiopia, Eritrea, Djibouti, Sudan, South Sudan, Somalia, Uganda, Burundi, Rwanda, Kenya and Tanzania (Figure 1). The study region is one of the most vulnerable to the impacts of climate change and variability, especially droughts and floods [11]. The rainfall patterns in the region are mainly influenced by the movement of the Inter-Tropical Convergence Zone (ITCZ) with the southern parts experiencing a bimodal rainfall regime while the northern parts are dominated by a uni-modal rainfall regime [10]. Teleconnections such as the El Niño-Southern Oscillation (ENSO) and the Indian Ocean Dipole (IOD) also modulate the rainfall patterns in the region especially in the September to December (SOND) season. The positive modes of ENSO and IOD tend to enhance the rainfall in the Eastern Africa region [12].
2.2. Data Sources
The study considered three different datasets, that is, the historical observations, historical model data, and future climate projections. Historical observations of rainfall and temperature were accessed from the Climate Hazards Group Infrared Precipitation (CHIRPS) for the period from 1981 to 2010 as a baseline to represent the historical observed climate. This data has a spatial resolution of 0.05°x 0.05o and was downloaded from https://www.chc.ucsb.edu/data/chirps. The CHIRPS dataset incorporates ground-based observations as extensively described in [13]. The CHIRPS dataset has been validated over the Eastern Africa region e.g [14]. In addition, many studies such as [15,16,17] have used CHIRPS to understand historical climate patterns. The historical observations were extracted in the form of monthly rainfall and temperature values, from which annual averages of temperature and annual totals of rainfall were computed.
We examine the historical model data included simulations of monthly precipitation and temperature for the same period of 1981–2010. This was obtained from the website for the Coupled Model Intercomparison Project Phase 6 (CMIP6) for six GeoMIP GCMs (https://esgf-node.llnl.gov/search/cmip6/) as indicated in Table 1. Future climate projections for the GCM runs were retrieved from the GeoMIP website (https://esgf.node.llnl.gov/search/cmip6/GEOMIP/). Two SRM scenarios of G6solar and G6sulphur and two Conventional Greenhouse gas scenarios of SSP245 (average) and SSP585 (high emission) were downloaded for a future period of 2051-2080
2.3. Data Analysis
The GCM datasets were regridded from their original resolutions indicated in Table 1 to the CHIRPS resolution of 0.05o using the bilinear interpolation method to enable the assessment of variations between the datasets. Comparisons were done at two levels: (1) Six GeoMIP models with the historical climate, and (2) SRM scenarios (G6solar and G6sulphur) with the conventional Shared Socioeconomic Pathways (SSPs) of SSP245 and SSP585. Analysis was done for both precipitation and temperature within the East African region.
We use the climatological means to assess how well the GeoMIP GCM simulations capture the annual cycle and inter-annual variability patterns based on CHIRPS. Future simulations of the same GCMs were regridded to the CHIRPS resolution for all the scenarios and compared with SSP585 and SSP245 in 2051-2080 climate period.
3. Results
3.1. Observed Historical Rainfall and Temperature Patterns
Observed mean annual average temperature and mean annual total rainfall are represented in Figure 2. Long term average total annual rainfall ranges from 700mm to 1900mm with lowest rainfall observed in the northern parts (Sudan) and Eastern parts (Somalia) while the highest rainfall is mainly in the highland areas of Ethiopia, Kenya and Uganda. The historical mean annual temperature, ranges between 21oC and 31oC with cooler temperatures observed in the highland areas and the highest temperatures observed in the northern parts of the region.
3.2. Evaluation of GEOMIP GCMs Using Historical Precipitation
Figure 3 shows the mean total annual rainfall of six GeoMIP GCMs in the historical period, 1981 to 2010. All the models capture the spatial patterns similar to those shown in CHIRPS (Fig. 2) with high rainfall amounts over the East African highlands as well as the Ethiopian highlands and low rainfall values observed over Sudan. Generally, mean annual rainfall of between 700mm and 1700mm is observed across the GCMs. The UKESM1-0-LL model produces the highest rainfall amounts in the region while MPI-ESM1-2-HR produces the lowest amount of rainfall across the region. In comparison to CHIRPS rainfall data over the same period, all models show less average long term rainfall compared to CHIRPS (dry bias) as shown in Figure 4. The dry bias of the GeoMIP GCMs is observed in the entire region with strong signals observed in highland areas. This might be due to failure of GCMs to capture the internal local effects of such highlands on the rainfall patterns [18,19].
3.3. Evaluation of GeoMIP GCMs Using Historical Temperature
Figure 5 shows the mean annual temperature of the six GeoMIP GCMs in the historical period, 1981 to 2010. Temperatures of between 17oC and 33oC can be seen in the region with highland areas having low values compared to other areas. In comparison with observed patterns, all the models apart from IPSL-CM6A-LR which shows lower temperatures than the historical in the entire region, all the other five models show an underestimation in the highland areas while other parts are comparing well with the historical with anomalies ranging between -1 and 1 (Figure 6). Most of the models also underestimate temperature patterns in the northern parts of the region especially in Sudan.
From evaluation of GeoMIP GCM models against the observations, the models are seen to capture the general expected temperature and rainfall patterns albeit a dry bias in rainfall, and some underestimation in the temperature especially in the highland areas. There is therefore some confidence that the GeoMIP models examined here will also fairly represent the future climate patterns in the region.
3.4. Projected Future Rainfall Patterns from SRM Models
Figure 7 and Figure 8 show projected future mean total rainfall for 2051-2080 under two SRM scenarios, G6solar and G6sulfur respectively. The SRM scenarios were run in the six GeoMIP GCMs and similar spatial patterns like historical data are observed in future projections with highest rainfall observed in the UKESM1-0-LL, and low rainfall observed in the MPI-ESM1-2-HR. No major differences are observed in the two SRM scenarios of G6solar and G6sulfur in these projections. Projected mean total annual rainfall ranges from 1000mm to 2400mm across the region.
3.6. Comparison of SRM Scenario of G6Sulfur and the Conventional SSPs Annual Total Precipitation
We examine the SRM scenarios of G6solar and G6sulfur for the six GeoMIP models and compare them with SSP245 and SSP585 the conventional greenhouse gas scenarios for the same GCMs over the period 2051 to 2080.
3.6.1. Comparison of SRM Scenario of G6Solar and the Conventional SSPs Total Annual Precipitation
Figure 9 and Figure 10 show the precipitation anomalies for SRM G6solar scenario evaluated against the conventional GHG scenarios of SSP245 and SSP 585 respectively. Analysis of the projections show that three GCMs; CNRM, MPI_LR and MPI_HR project that Gsolar will lead to increased rainfall compared to SSP245 in most parts of the region. Significant increases in annual precipitation are expected in the northern parts of the region especially under MPI-LR GCM. IPSL_CM61_LR and CESM2 models show that SRM under Gsolar will lead to a decreased rainfall in most parts of the region compared to SSP245 in the period 2051-2080. Annual rainfall increase of between 4 and 16mm over SSP245 is expected in most parts of the region under the SRM G6solar scenario.
Under SSP585 and SRM G6solar, most models predict less rainfall in the region from SRM scenarios compared to SSP585 scenario in the period 2051-2080 (Figure 10). Precipitation decreases of between 10 and 25mm are expected in region from most of the models. Its only MPI_LR GCM that shows a slight increase in annual precipitation in the northern parts of the region compared to SSP585.
Therefore, G6solar SRM scenario predict slightly increased annual precipitation in the region over SSP245 but predict reduced annual precipitation in the region over SSP585 in the same period of 2051-2080
3.6.2. Comparison of SRM Scenario of G6Sulfur and the Conventional SSPs Total Annual Precipitation
Figure 11 and Figure 12 show the precipitation anomalies for SRM G6sulfur scenario of the conventional GHG scenarios of SSP245 and SSP 585 respectively. Most models predict reduced annual precipitation in the southern parts of the region and slightly increased rainfall in the northern parts of the region for G6sulfur SRM scenario compared to SSP245 in the period 2051-2080 (Figure 11). The northern parts are expected to have annual rainfall increases of between 3 and 9mm while the southern parts are expected to have reduced rainfall of the same amount 3 to 9mm in the same period compared to the conventional SSP245.
For SSP585 and G6sulfur SRM scenario, all models apart from CNRM predict reduced annual precipitation in the region of between 12 and 24mm in most parts of the region under G6sulfur compared to SSP585 in the same period of 2051-2080.
Therefore, G6sulfur SRM scenario predict reduced annual precipitation over both SSP245 and SSP585 in most parts of the region with slightly more reduced precipitation over SSP585 compared to SSP245 in the same period.
3.7. Comparison of SRM Scenario of G6Sulfur and the Conventional SSPs Annual Mean Temperature
Further, we Analyze the SRM scenarios of G6solar and G6sulfur for the six GeoMIP models and compare them with SSP245 and SSP585 the conventional greenhouse gas scenarios for the same GCMs over the period 2051 to 2080
3.7.1. Comparison of SRM Scenario of G6Solar and the Conventional SSPs Annual Mean Temperature
Figure 13 and Figure 14 show the temperature anomalies for SRM G6solar scenario of the conventional GHG scenarios of SSP245 and SSP 585 respectively. Under G6solar, all the GeoMIP models examined here show that SRM will reduce mean annual temperature in the region (Figure 13). The UKESM1-0-LL and the CNRM_ESM2-1 project that SRM will reduce the mean annual temperature by between 0oC and 1oC while the rest of the models project that SRM will reduce the mean annual temperature in the region by between 1oC and 1.75oC compared to SSP245.
For SSP585 and SRM G6solar, all the GeoMIP models examined in the current study show that SRM will reduce mean annual temperature in the region compared to SSP585 (Figure 14). Four of the six models show that SRM under G6solar will reduce the annual mean temperature in the highland areas by between 1oC and 1.2oC, and the rest of the region by 0.75oC to 1.05oC compared to projected SSP585.
Therefore, G6solar SRM scenario predict reduced annual mean temperature over both SSP245 and SSP585 in most parts of the region with slightly more reduced temperature over SSP585 compared to SSP245 in the same period
3.7.2. Comparison of SRM Scenario of G6Sulfur and the Conventional SSPs Annual Mean Temperature
Figure 15 and Figure 16 show the temperature anomalies for SRM G6sulfur scenario of the conventional GHG scenarios of SSP245 and SSP 585 respectively. Under G6sulfur, IPSL-CM6A-LR and CNRM_ESM2-1 models show that SRM will increase the temperature in the region by up to 1.6oC. MPI-ESM1-2-HR and MPI-ESM1-2-LR show that SRM will reduce the temperature in highland areas by 0 to 0.4oC with the rest of the region expected to have an increase in temperature of up to 0.8oC. It is only UKESM1-0-LL that shows that SRM under G6sulfur will lead to reduced annual mean temperatures of between 0 and 0.8oC throughout the region compared to SSP245.
For SSP585 and SRM G6sulfur, three models, CNRM_ESM2-1, IPSL-CM6A-LR and CESM2 show that SRM will increase mean annual temperatures for the southern parts of the region by 0.5oC - 1.5oC but in the northern parts, temperatures are expected to reduce by 0 to 1oC compared to projected SSP585 temperatures. MPI-ESM1-2-HR and MPI-ESM1-2-LR show that SRM will reduce mean annual temperatures in the region by between 0.5oC and 1.5oC apart from South Sudan where SRM is expected to increase mean annual temperatures by between 0.5oC and 1oC compared to the high greenhouse gas emission scenario of SSP585.
Therefore, unlike G6solar scenario that predict reduced mean annual temperatures in the region over the SSP scenarios, G6sulfur is showing some inconsistent results with some models such as IPSL-CM6A_LR predicting increased temperatures under SRM compared to especially SSP245.
4. Discussion
We explore the potential impact of Solar Radiation Modification (SRM) on the rainfall and temperature characteristics over Eastern Africa. We examine the climate model experiments from the Geoengineering Model Intercomparison Project (GeoMIP). For the GeoMIP project simulations, we examine two SRM scenarios of G6Sulfur and G6Solar in this paper over the climate period 2051 to 2080. The SRM technique deployed in the simulations analysed in this study is the reduction of the solar constant for G6Solar simulations or the injection of stratospheric aerosols for G6Sulphur simulations Generally, there was no major variation in the two SRM scenarios for both rainfall and temperature spatial patterns. SRM scenarios of G6solar and G6sulfur show a cooling effect in the region compared to the conventional Shared Socioeconomic pathways (SSPs) of SSP245 and SSP585 in the future period. SRM induced cooling may lead to reduction in radiative forcing of the earth’s surface which may lead to reduced evaporation at the surface and this will affect atmospheric circulation patterns in the region [20]. SRM is expected to cool the climate since it reduces on the amount of solar radiation received on the earth by reflecting it back to space. This assumption however, is for the global simulation and therefore they could be regional differences of its impact in the different parts of the world.
Research on SRM in the different parts of the globe has shown that moderate SRM use can significantly reduce many of the impacts of climate change including average and extreme temperatures, water availability, and cyclone intensity but may not perfectly reverse these impacts [21,22]. Even with SRM differences in regional precipitation patterns, cloud cover, and atmospheric circulation could persist, with some regions experiencing increased rainfall while others will experience reduced rainfall as a result of SRM. Projections from some of the studies in Africa show less certainty in the expected rainfall changes across the continent with a possible drying in some areas in Sub-Sahara Africa (SSA) and increase in rainfall in other areas of tropical Africa [23]
In Eastern Africa, SRM's influence on temperature and precipitation is particularly significant due to the region's reliance on rainfall for agriculture and water resources which form the back born of its economies and also providing a livelihood to many of its people [24]. Modeling studies on SRM suggest that while global temperatures may decrease, regional responses can vary because of the already varying climatic conditions [25]. For example, many areas in Africa have already experienced warming at a rate higher than the global average and future projections show a high certainty of expected temperature in the region [26]. In Eastern Africa, SRM could potentially lead to changes in the hydrological cycle, affecting the onset, duration, and intensity of rainy seasons. These alterations could have significant implications for agriculture, water resources, and ecosystem services. However, the exact nature of these changes remains uncertain due to the complex interplay of atmospheric dynamics, regional climate systems, and local geographical features [27] In this study both G6solar and G6sulphur SRM scenarios show that temperatures are likely to decrease in most parts of the region compared to the conventional greenhouse gas scenarios of SSP245 and SSP585 in the period 2051-2080.
5. Conclusion
Solar Radiation Modification has the potential to influence regional temperature and precipitation patterns, including those in East Africa. Historical climate events and modeling studies indicate that changes in solar radiation can lead to significant climatic shifts. This study investigated the impact of two SRM scenarios G6solar and G6sulfur from the GEOMIP simulations over the conventional greenhouse gas scenarios of SSP245 and SSP585 in the Eastern Africa region. Results show that no clear trends are observed in SRM rainfall projections over SSPs with some places expecting an increase while others are expecting a decrease in rainfall in the 2051-2080 period. For temperature, G6solar SRM scenario predict reduced annual mean temperature over both SSP245 and SSP585 in most parts of the region with slightly more reduced temperature over SSP585 compared to SSP24. On the other hand, G6sulfur shows some contradicting results with some models such as IPSL-CM6A_LR predicting increased temperatures under SRM compared to especially SSP245. Therefore, as a whole SRM is expected to reduce the regional temperatures in most parts compared to the SSPs but the trend of rainfall is not very clear with some areas expected to increase in rainfall while others are expected to decrease in rainfall compared to the SSPs.
Author Contributions
N.A., conceptualization, data analysis, write-up, G.A., conceptualization, literature review, project administration, R.O., Data analysis and write-up, CM., conceptualization, Literature review, editing, LA., conceptualization, review and editing, M.O., conceptualization, literature review, editing, B.O., conceptualization, funding acquisition and supervision. All authors have read and agreed to the published version of the manuscript.
Funding
This work was supported by the degrees Modelling Fund (DMF) to the East African Research team
Institutional Review Board Statement
Not applicable.
Informed Consent Statement
Not applicable
Data Availability Statement
The original historical meteorological data used is openly available from https://www.chc.ucsb.edu/data/chirps and GeoMIP GCM data is available at https://esgf-node.llnl.gov/search/cmip6.
Conflicts of Interest
The authors declare no conflict of interest.
Abbreviations
| ARISE | Assessing Responses and Impacts of Solar climate intervention on the Earth system |
| CHIRPS | Climate Hazards Group Infrared Precipitation |
| CMIP6 | Coupled Model Intercomparison Project Phase 6 |
| CCN | Cloud Condensation Nuclei |
| DMF | Degrees Modeling Fund |
| ENSO | El Niño-Southern Oscillation |
| GCM | General Circulation Model |
| GeoMIP | Geoengineering Model Intercomparison Project |
| GHG | Green House Gas |
| GLENS | Geoengineering Large Ensemble |
| IPCC | Intergovernmental Panel on Climate Change |
| IOD | Indian Ocean Dipole |
| ITCZ | Inter-Tropical Convergence Zone |
| MCB | Marine Cloud Brightening |
| NDC | Nationally Determined Contribution |
| SAI | Stratospheric Aerosol Injection |
| SOND | September, October, November and December |
| SRM | Solar Radiation Modification |
| SSP | Shared Social-economic Pathway |
| UNFCCC | United Nations Framework Convention on Climate Change |
References
- IPCC. 2021a. 'Summary for Policymakers.' in V. Masson-Delmotte, P. Zhai, A. Pirani, S.L. Connors, C. Péan, S. Berger, N. Caud, Y. Chen, L. Goldfarb, M.I. Gomis, M. Huang, K. Leitzell, E. Lonnoy, J.B.R. Matthews, T.K. Maycock, T. Waterfield, O. Yelekçi, R. Yu and B. Zhou (eds.), Climate Change 2021. The Physical Science Basis. Contribution of Working Group I to the Sixth Assessment Report of the Intergovernmental Panel on Climate Change (Cambridge University Press: Cambridge, UK).
- UNFCCC. 2015. "Paris Agreement." COP 21. Le Bourget, France: United Nations Framework Convention on Climate Change (UNFCCC).
- Rogelj, J., den Elzen, M., Höhne, N., Fransen, T., Fekete, H.,Winkler, H., Schaeffer, R., Sha, F., Riahi, K., and Meinshausen, M. 2016. Paris Agreement climate proposals need a boost to keep warming well below 2o C, Nature, 534, 631–639. [CrossRef]
- Lawrence, Mark G., Stefan Schäfer, Helene Muri, Vivian Scott, Andreas Oschlies, Naomi E. Vaughan, Olivier Boucher, Hauke Schmidt, Jim Haywood, and Jürgen Scheffran. 2018. 'Evaluating climate geoengineering proposals in the context of the Paris Agreement temperature goals', Nature Communications, 9: 3734.
- IPCC. 2021b. 'Annex VII: Glossary.' in J.B.R. Matthews, J. S. Fuglestvedt, V. Masson-Delmotte, V. Möller, C. Méndez, R. van Diemen, A. Reisinger and S. Semenov (eds.), Climate Change 2021. The Physical Science Basis. Contribution of Working Group I to the Sixth Assessment Report of the Intergovernmental Panel on Climate Change (Cambridge University Press).
- Ahlm, L., A. Jones, C. W. Stjern, H. Muri, B. Kravitz, and J. E. Kristjánsson. 2017. 'Marine cloud brightening – as effective without clouds', Atmospheric Chemistry and Physics, 17: 13071-87.
- Kravitz1. B., A. Robock, S. Tilmes, O. Boucher, J. M. English, P. J. Irvine, A. Jones, M. G. Lawrence, M. MacCracken, H. Muri, J. C. Moore, U. Niemeier, S. J. Phipps, J. Sillmann, T. Storelvmo, H.Wang, and S. Watanabe. 2015. The Geoengineering Model Intercomparison Project Phase 6 (GeoMIP6): simulation design and preliminary results. Geosci. Model Dev., 8, 3379–3392. [CrossRef]
- Tilmes, S., MacMartin, D. G., Lenaerts, J. T. M., van Kampenhout, L., Muntjewerf, L., Xia, L., Harrison, C. S., Krumhardt, K. M., Mills, M. J., Kravitz, B., and Robock, A. 2020. Reaching 1.5 and 2.0 C global surface temperature targets using stratospheric aerosol geoengineering, Earth Syst. Dynam., 11, 579– 601, . [CrossRef]
- MacMartin, D. G., Visioni, D., Kravitz, B., Richter, J. H., Felgenhauer, T., Lee,W., Morrow, D., and Sugiyama, M. 2022. Scenarios for modeling solar geoengineering, P. Natl. Acad. Sci. USA, 119, e2202230119, . [CrossRef]
- Nicholson, S. E. 2016. An analysis of recent rainfall conditions in eastern Africa. Int. J. Climatol., 36(1), 526–532.
- Li, C. J., Y. Q. Chai, L. S. Yang, and H. R. Li. 2016. Spatio-temporal distribution of flood disasters and analysis of influencing factors in Africa, Nat. Hazards, 82(1), 721–731, . [CrossRef]
- Nicholson, S. E. 2015. Long-term variability of the Eastern Africa “short rains” and its links to large-scale factors. Int. J. Climatol., 35(13), 3979–3990. [CrossRef]
- 13. Funk, C, Peterson P, Landsfeld M, Pedreros, D., Verdin, J., Shukla, S., Husak, G., Rowland, J., Harrison, L., Hoell, A., Michaelsen, J., 2015. The climate hazards infrared precipitation with stations - A new environmental record for monitoring extremes. Sci. Data. 2: 1–21. [CrossRef]
- 14. Dinku Tufa, Chris Funk, Pete Peterson, Ross Maidment, Tsegaye Tadesse, Hussein Gadain and Pietro Ceccato. 2018. Validation of the CHIRPS satellite rainfall estimates over Eastern Africa. Advances in remote sensing of rainfall and snowfall. 144 (Suppl. 1): 292–312 . [CrossRef]
- 15. Gebrechorkos SH, Hülsmann S, Bernhofer C. 2018. Evaluation of multiple climate data sources for managing environmental resources in East Africa. 2018. Hydrol Earth Syst Sci.
- 16. Ayugi B, Tan G, Ullah W, Boiyo R, Ongoma V. 2019. Inter-comparison of remotely sensed precipitation datasets over Kenya during 1998–2016. Atmos Res. 2019;225:96–109. [CrossRef]
- 17. Ocen E, de Bie CAJM, Onyutha C. 2021. Investigating false start of the main growing season: a case of Uganda in East Africa. Heliyon. 7(11):e08428.
- Mearns, L. O., Giorgi, F., McDaniel, L., & Shields, C. 2003. Climate Scenarios for the Southeast U.S. Based on GCM and Regional Model Simulations. Journal of Climate, 16(6), 874-885.
- Ongoma, V., Chen, H., Omony, G. W., & Nzioki, R. 2021. The performance of regional climate models driven by various general circulation models in reproducing observed rainfall over East Africa. Theoretical and Applied Climatology, 143(3), 1297–1311.
- Trenberth, K. E. and Dai, A. 2007. Effects of Mount Pinatubo volcanic eruption on the hydrological cycle as an analog of geoengineering. Geophysical Research Letters, 34(15).
- Curry, C. L., Sillmann, J., Bronaugh, D., Alterskjaer, K., Cole, J. N. S., Ji, D., et al. 2014. A multimodel examination of climate extremes in an idealized geoengineering experiment. Journal of Geophysical Research: Atmospheres, 119, 3900–3923. [CrossRef]
- Muthyala, R., Bala, G., & Nalam, A. 2018. Regional scale analysis of climate extremes in an SRM geoengineering simulation, Part 1: precipitation extremes. Current Science, 114, 1024.
- Dosio, A., Jones, R. G., Jack, C., Lennard, C., Nikulin, G., & Hewitson, B. 2019. What can we know about future precipitation in Africa? Robustness, significance and added value of projections from a large ensemble of regional climate models. Climate Dynamics, 53(9-10), 5833–5858. [CrossRef]
- Ongoma, V., Chen, H and Gao. C. 2017. Projected changes in mean rainfall and temperature over East Africa based on CMIP5 models. International journal of climatology. [CrossRef]
- Niang, I., Ruppel, O., Abdrabo, M., Essel, A., Leonard, C., Padgham, J., et al. (2014). Chapter 22: Africa. Clim. Chang. 2014 Impacts, Adapt.Vulnerability, 1–115.
- Engelbrecht, F., Adegoke, J., Bopape, M.-J., Naidoo, M., Garland, R., Thatcher, M., et al. 2015. Projections of rapidly rising surface temperatures over Africa under low mitigation. Environmental Research Letters, 10(8), 85004. [CrossRef]
- 27. Izidine Pinto, Christopher Jack, Christopher Lennard, Simone Tilmes, and Romaric C. Odoulami. 2020. Africa's Climate Response to Solar Radiation Management With Stratospheric Aerosol. Geophysical Research Letters, 47, e2019GL086047. [CrossRef]
Figure 1.
Study area.

Figure 2.
Long Term Mean (LTM) annual temperature (left), and mean total annual rainfall (right) in Eastern Africa for a period of 1981 to 2010 based on CHIRPS.
Figure 2.
Long Term Mean (LTM) annual temperature (left), and mean total annual rainfall (right) in Eastern Africa for a period of 1981 to 2010 based on CHIRPS.
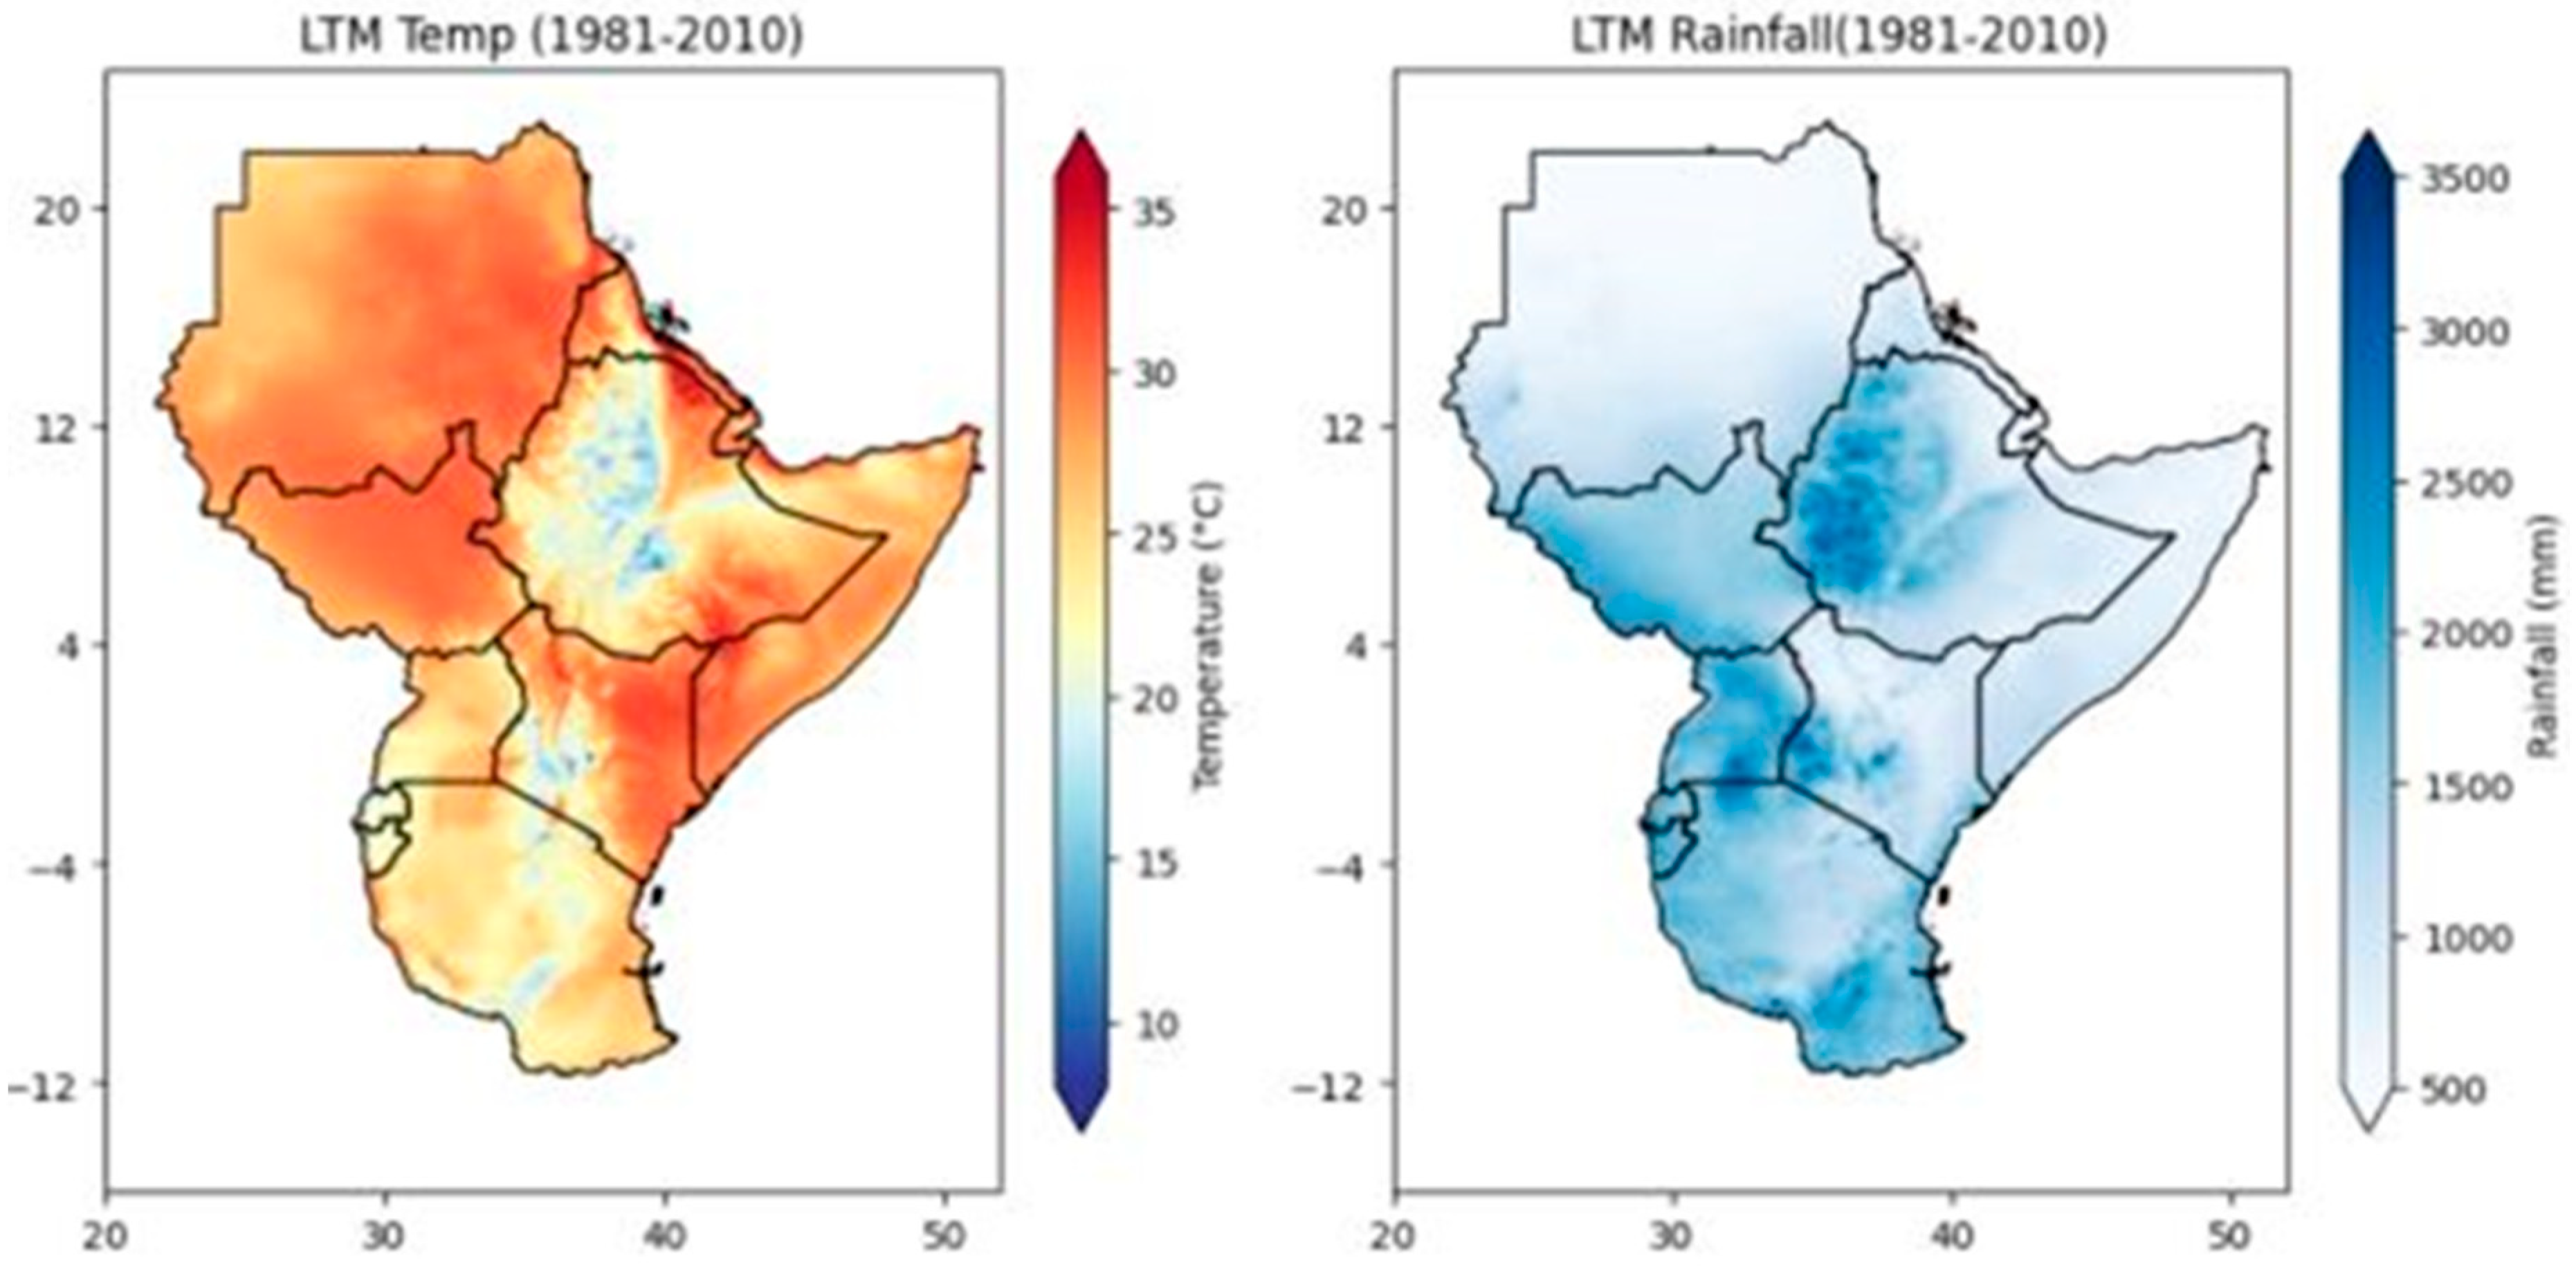
Figure 3.
Historical representation of mean annual rainfall in GeoMIP GCMs for 1981-2010.
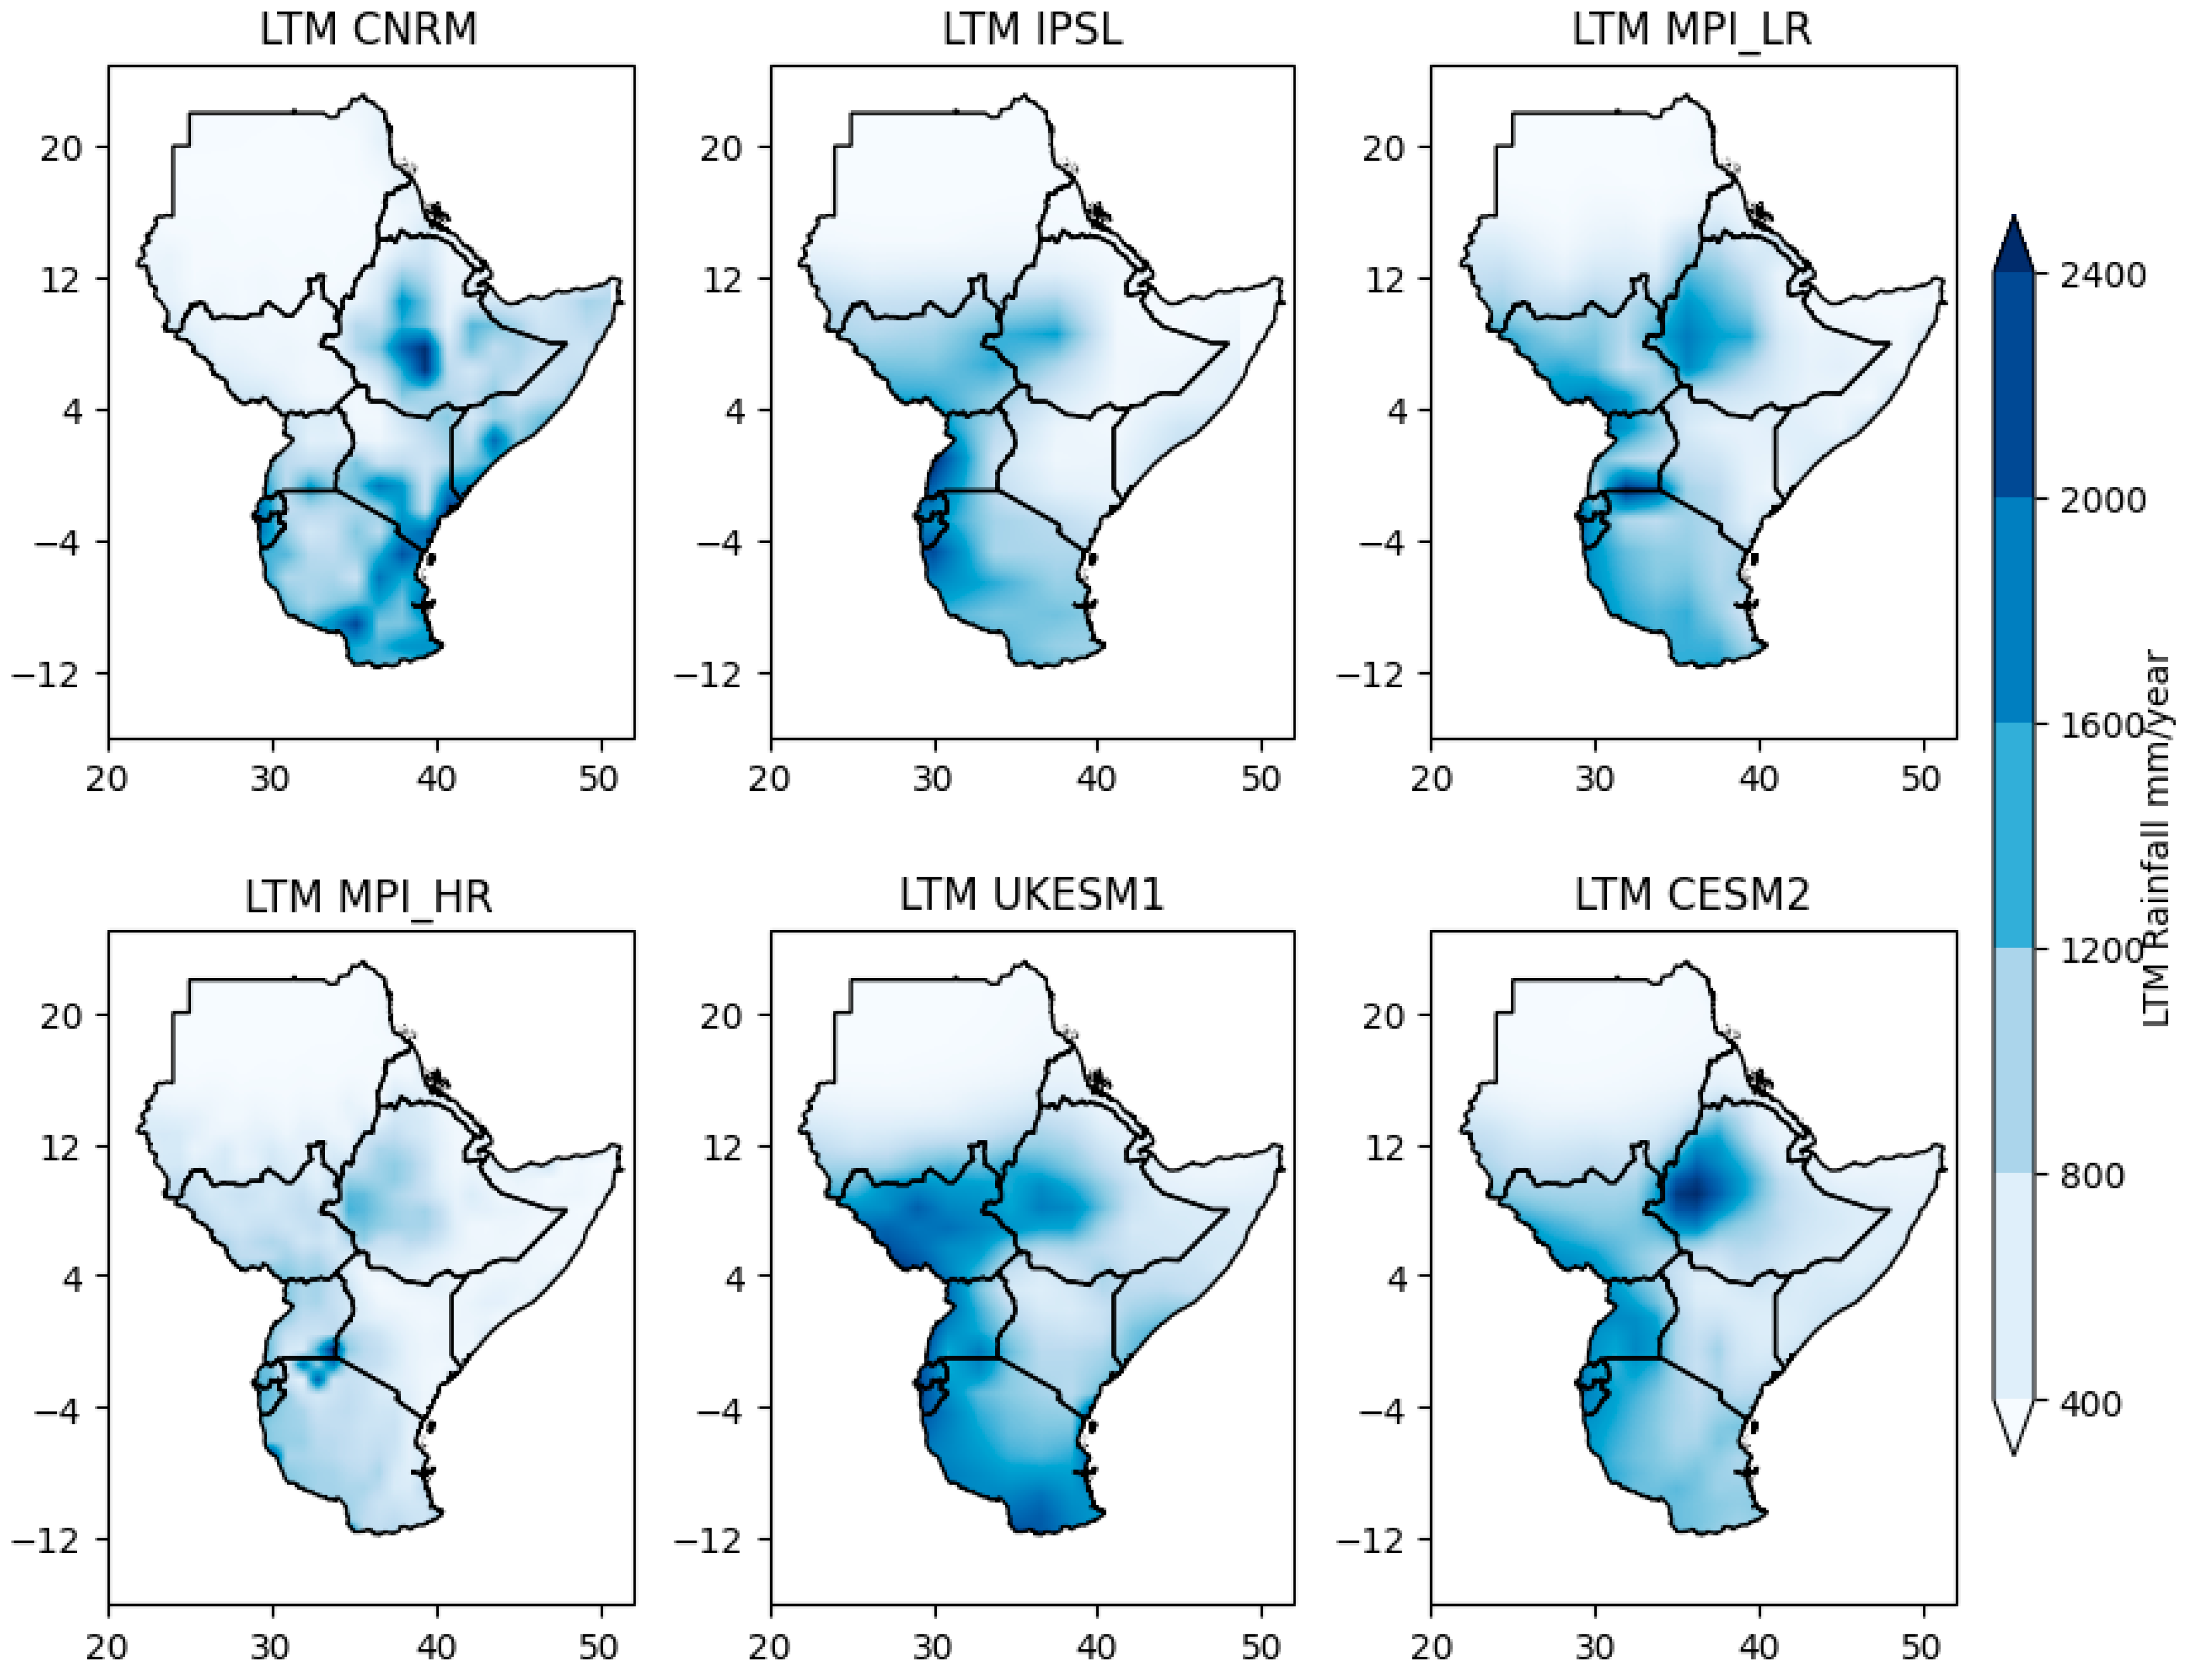
Figure 4.
Historical rainfall anomalies for the GeoMIP GCMs over CHIRPS in (1981-2010) period.
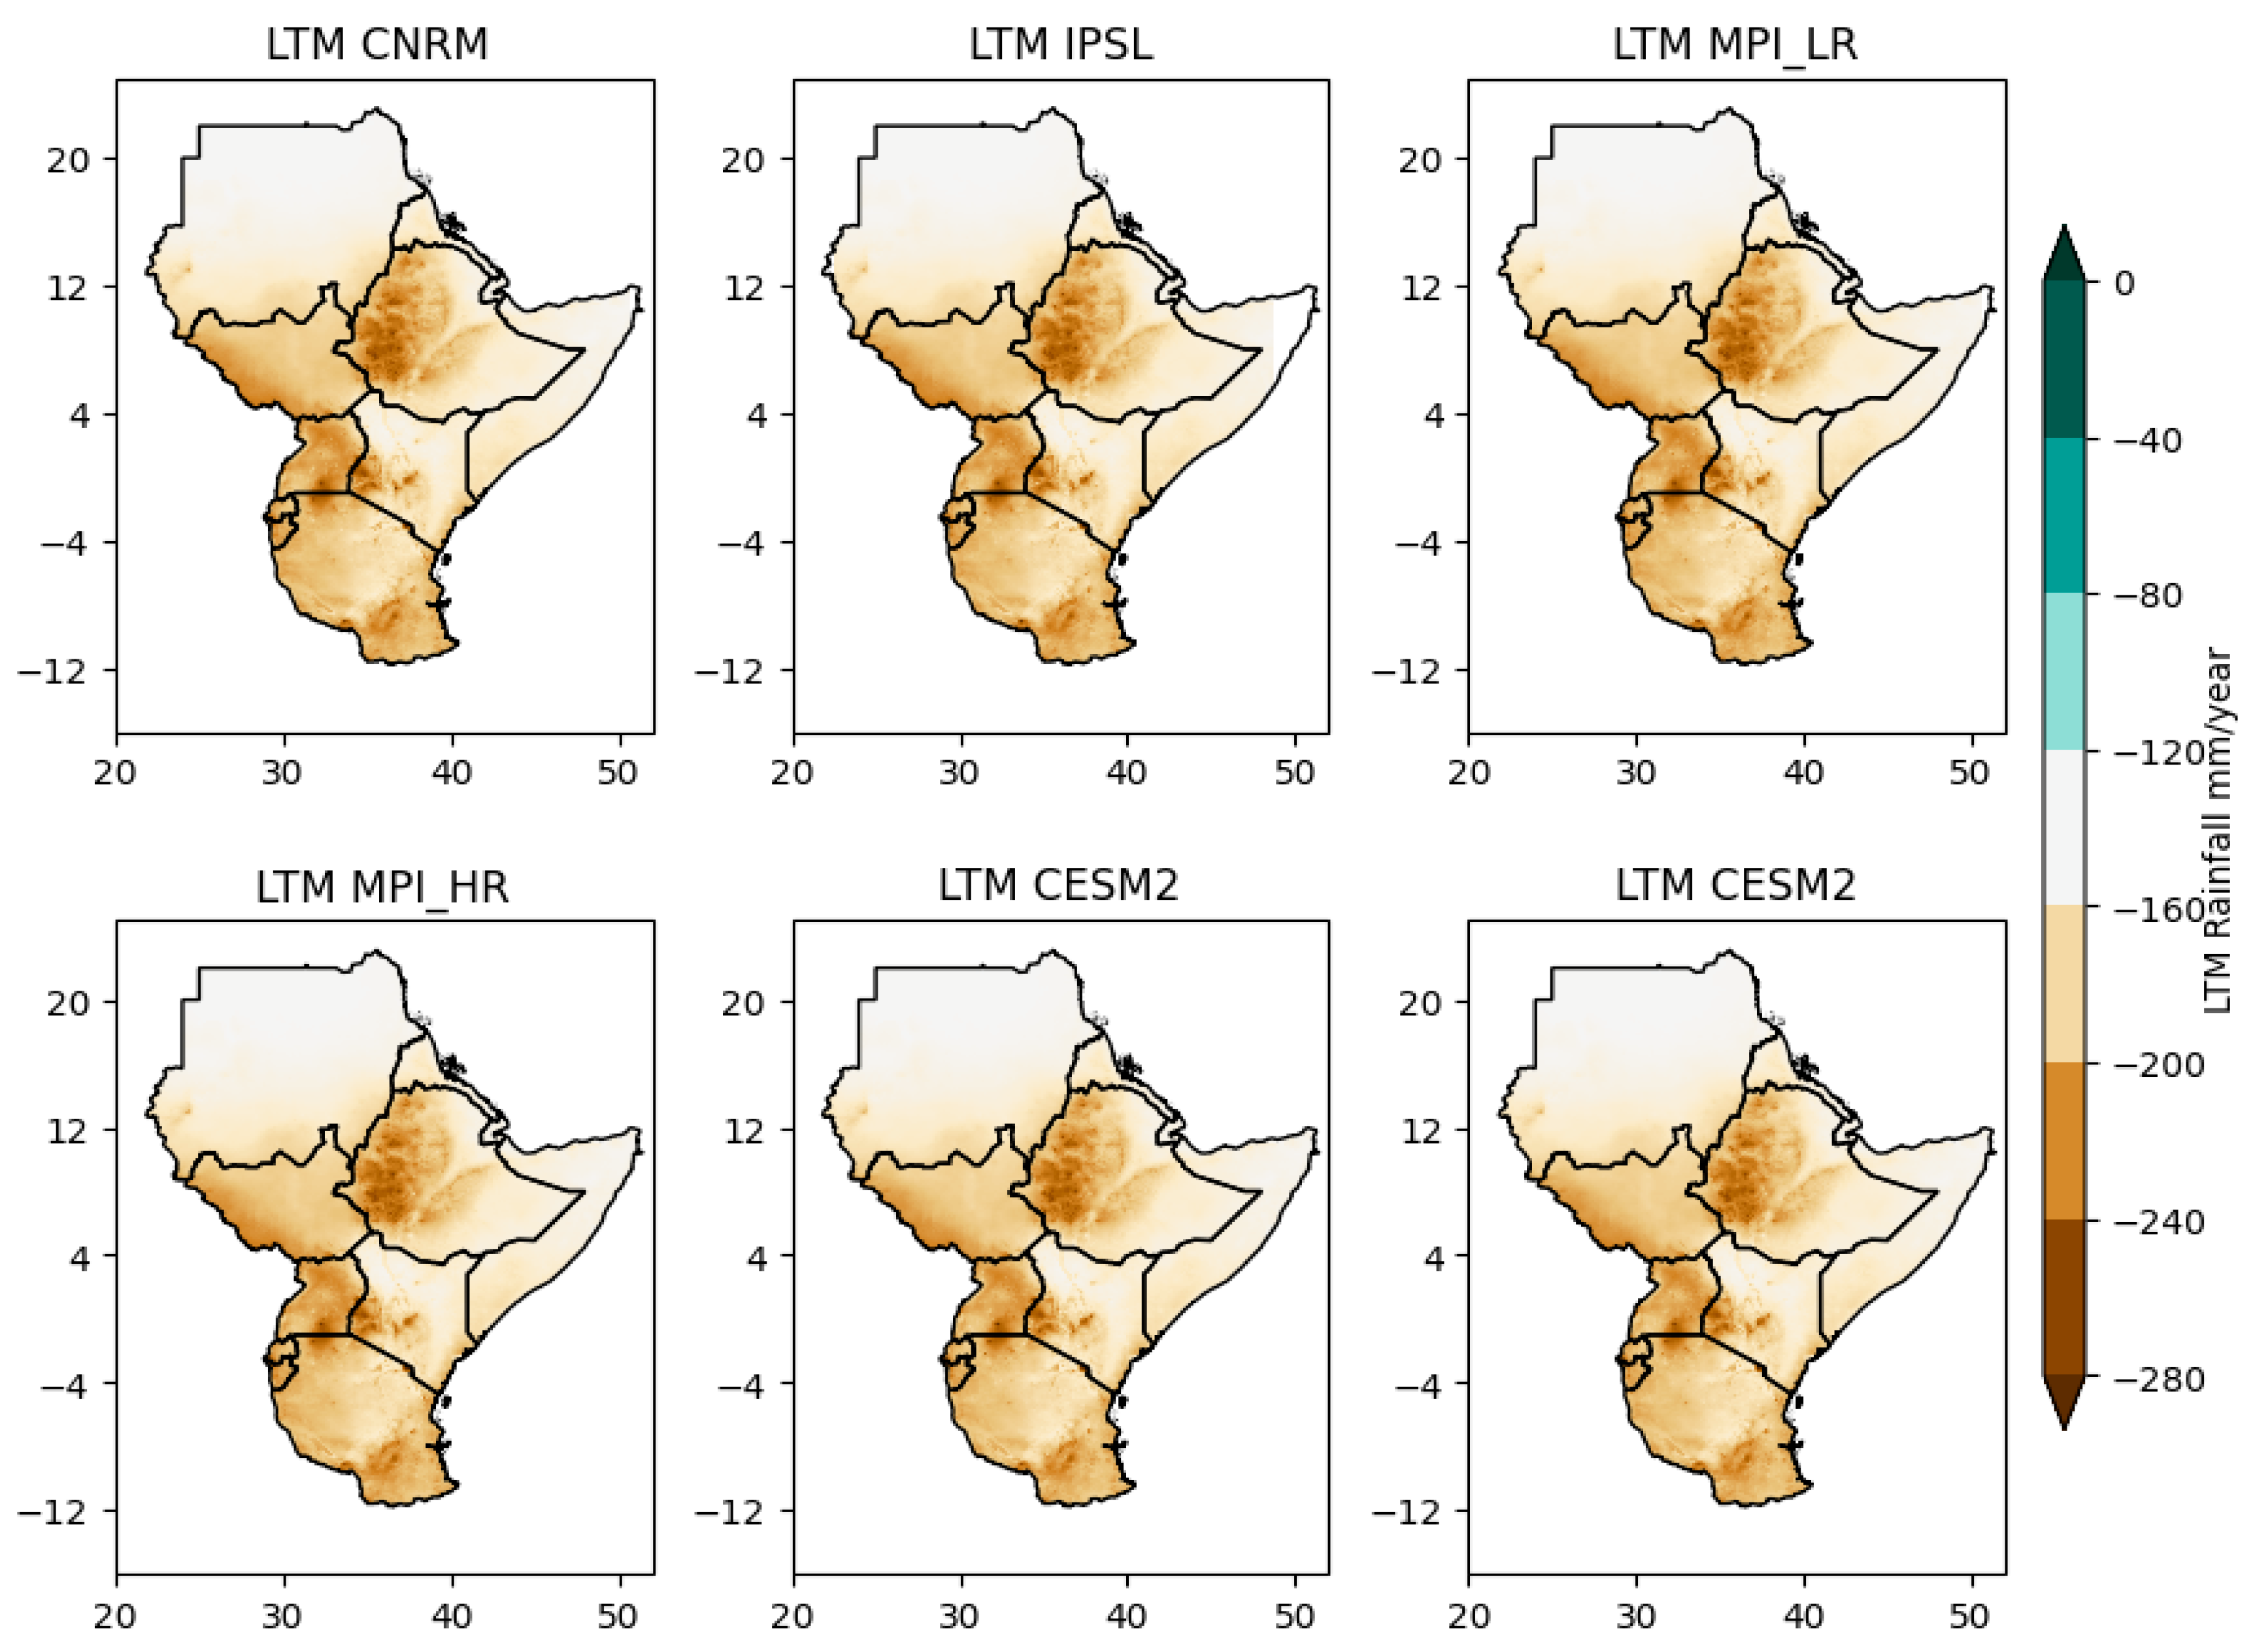
Figure 5.
Historical representation of mean annual mean temperature in GeoMIP GCMs for 1981-2010.
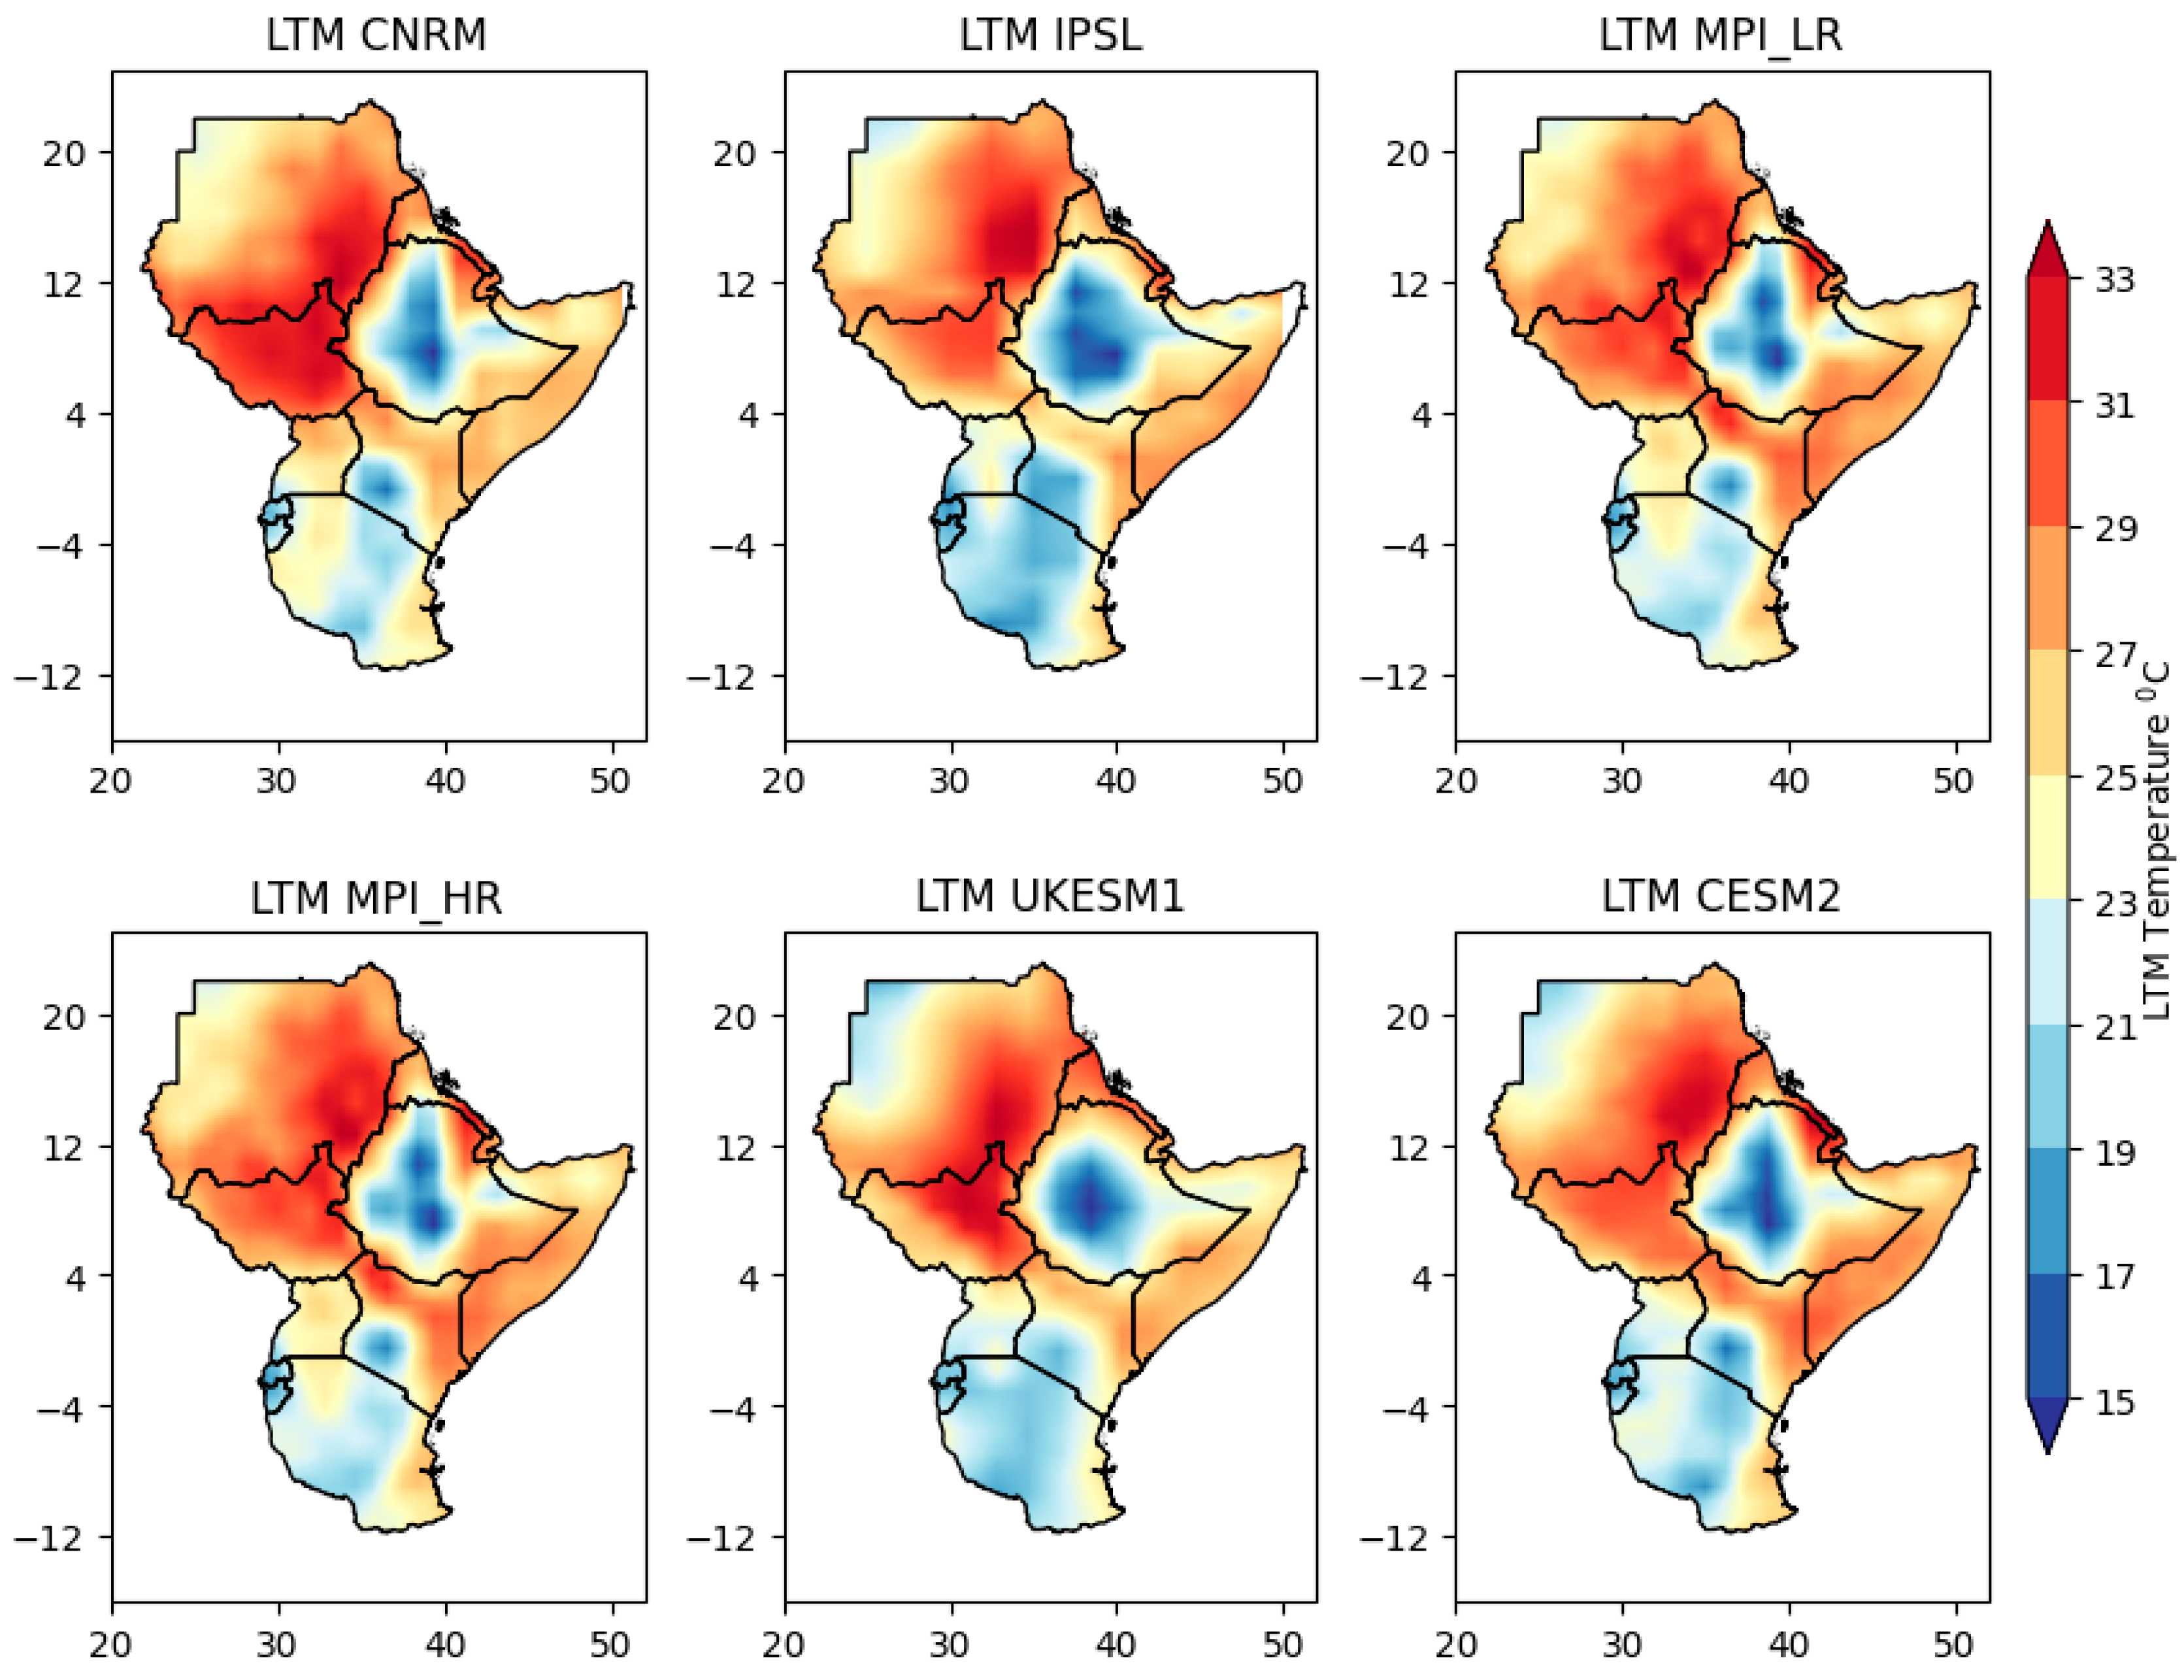
Figure 6.
Historical Temperature anomalies for the GeoMIP GCMs over CHIRPS in (1981-2010) period.
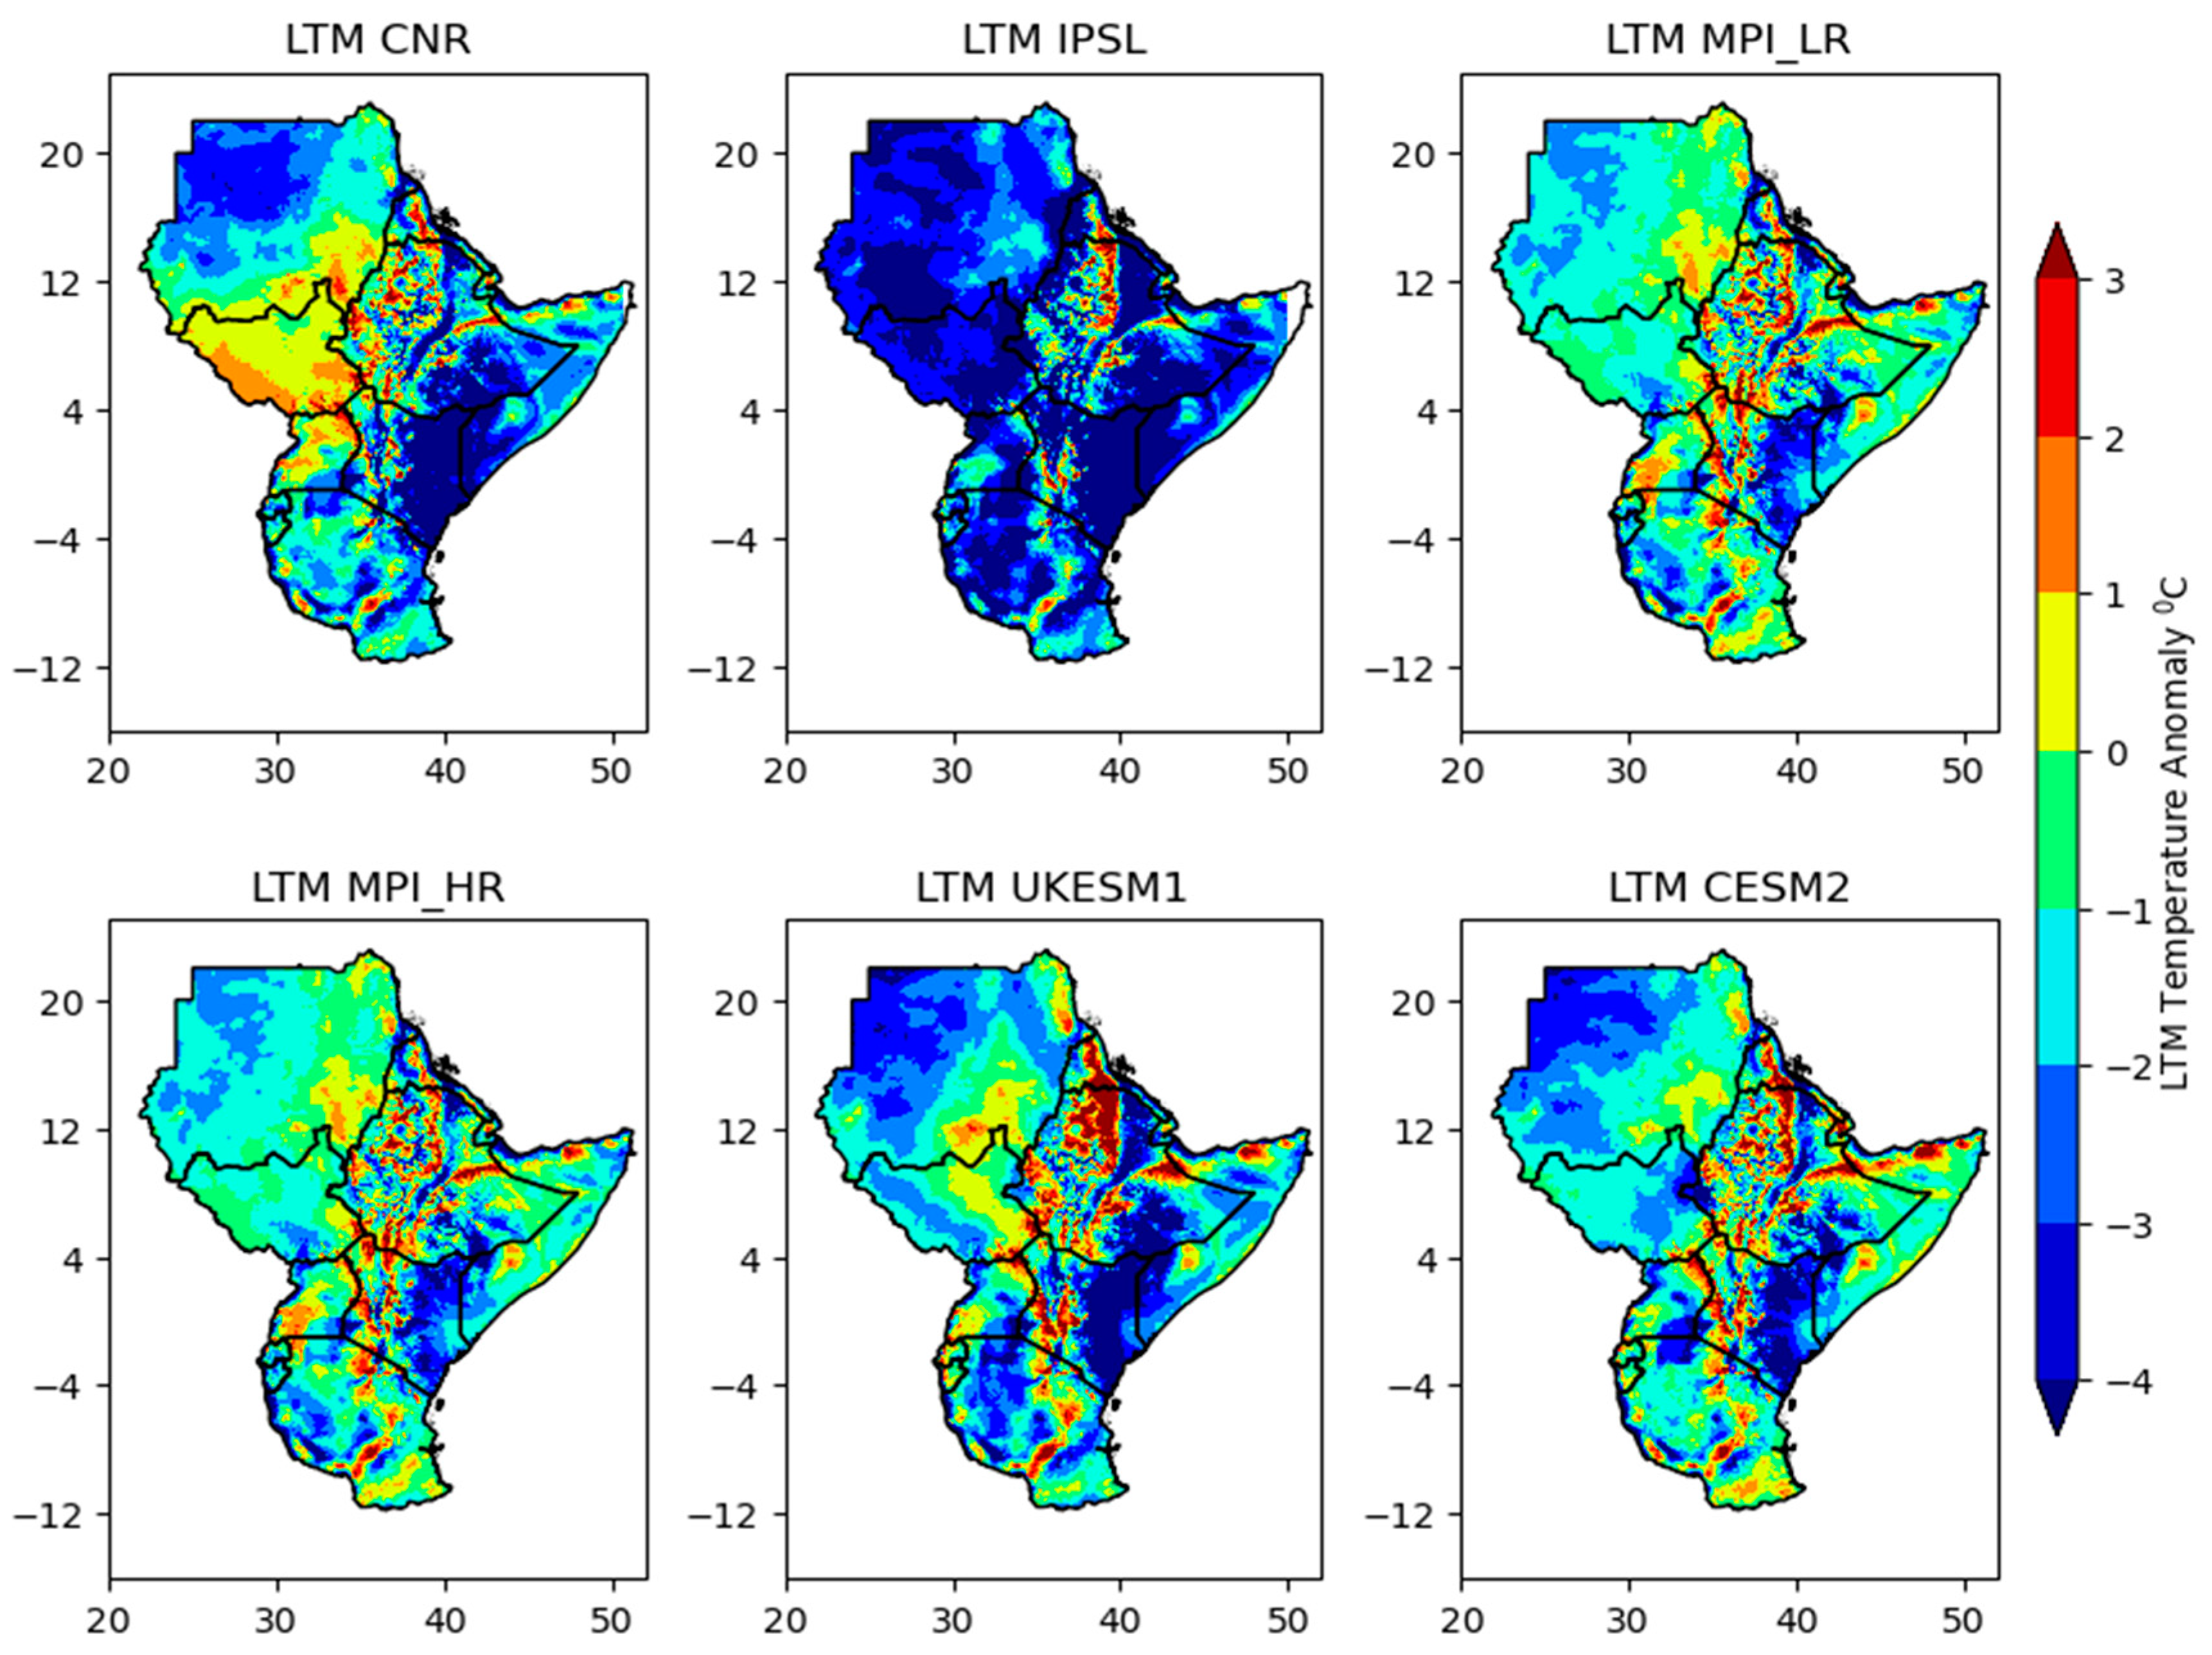
Figure 7.
Projected Average precipitation for GeoMIP models under G6Solar for 2051-2080.
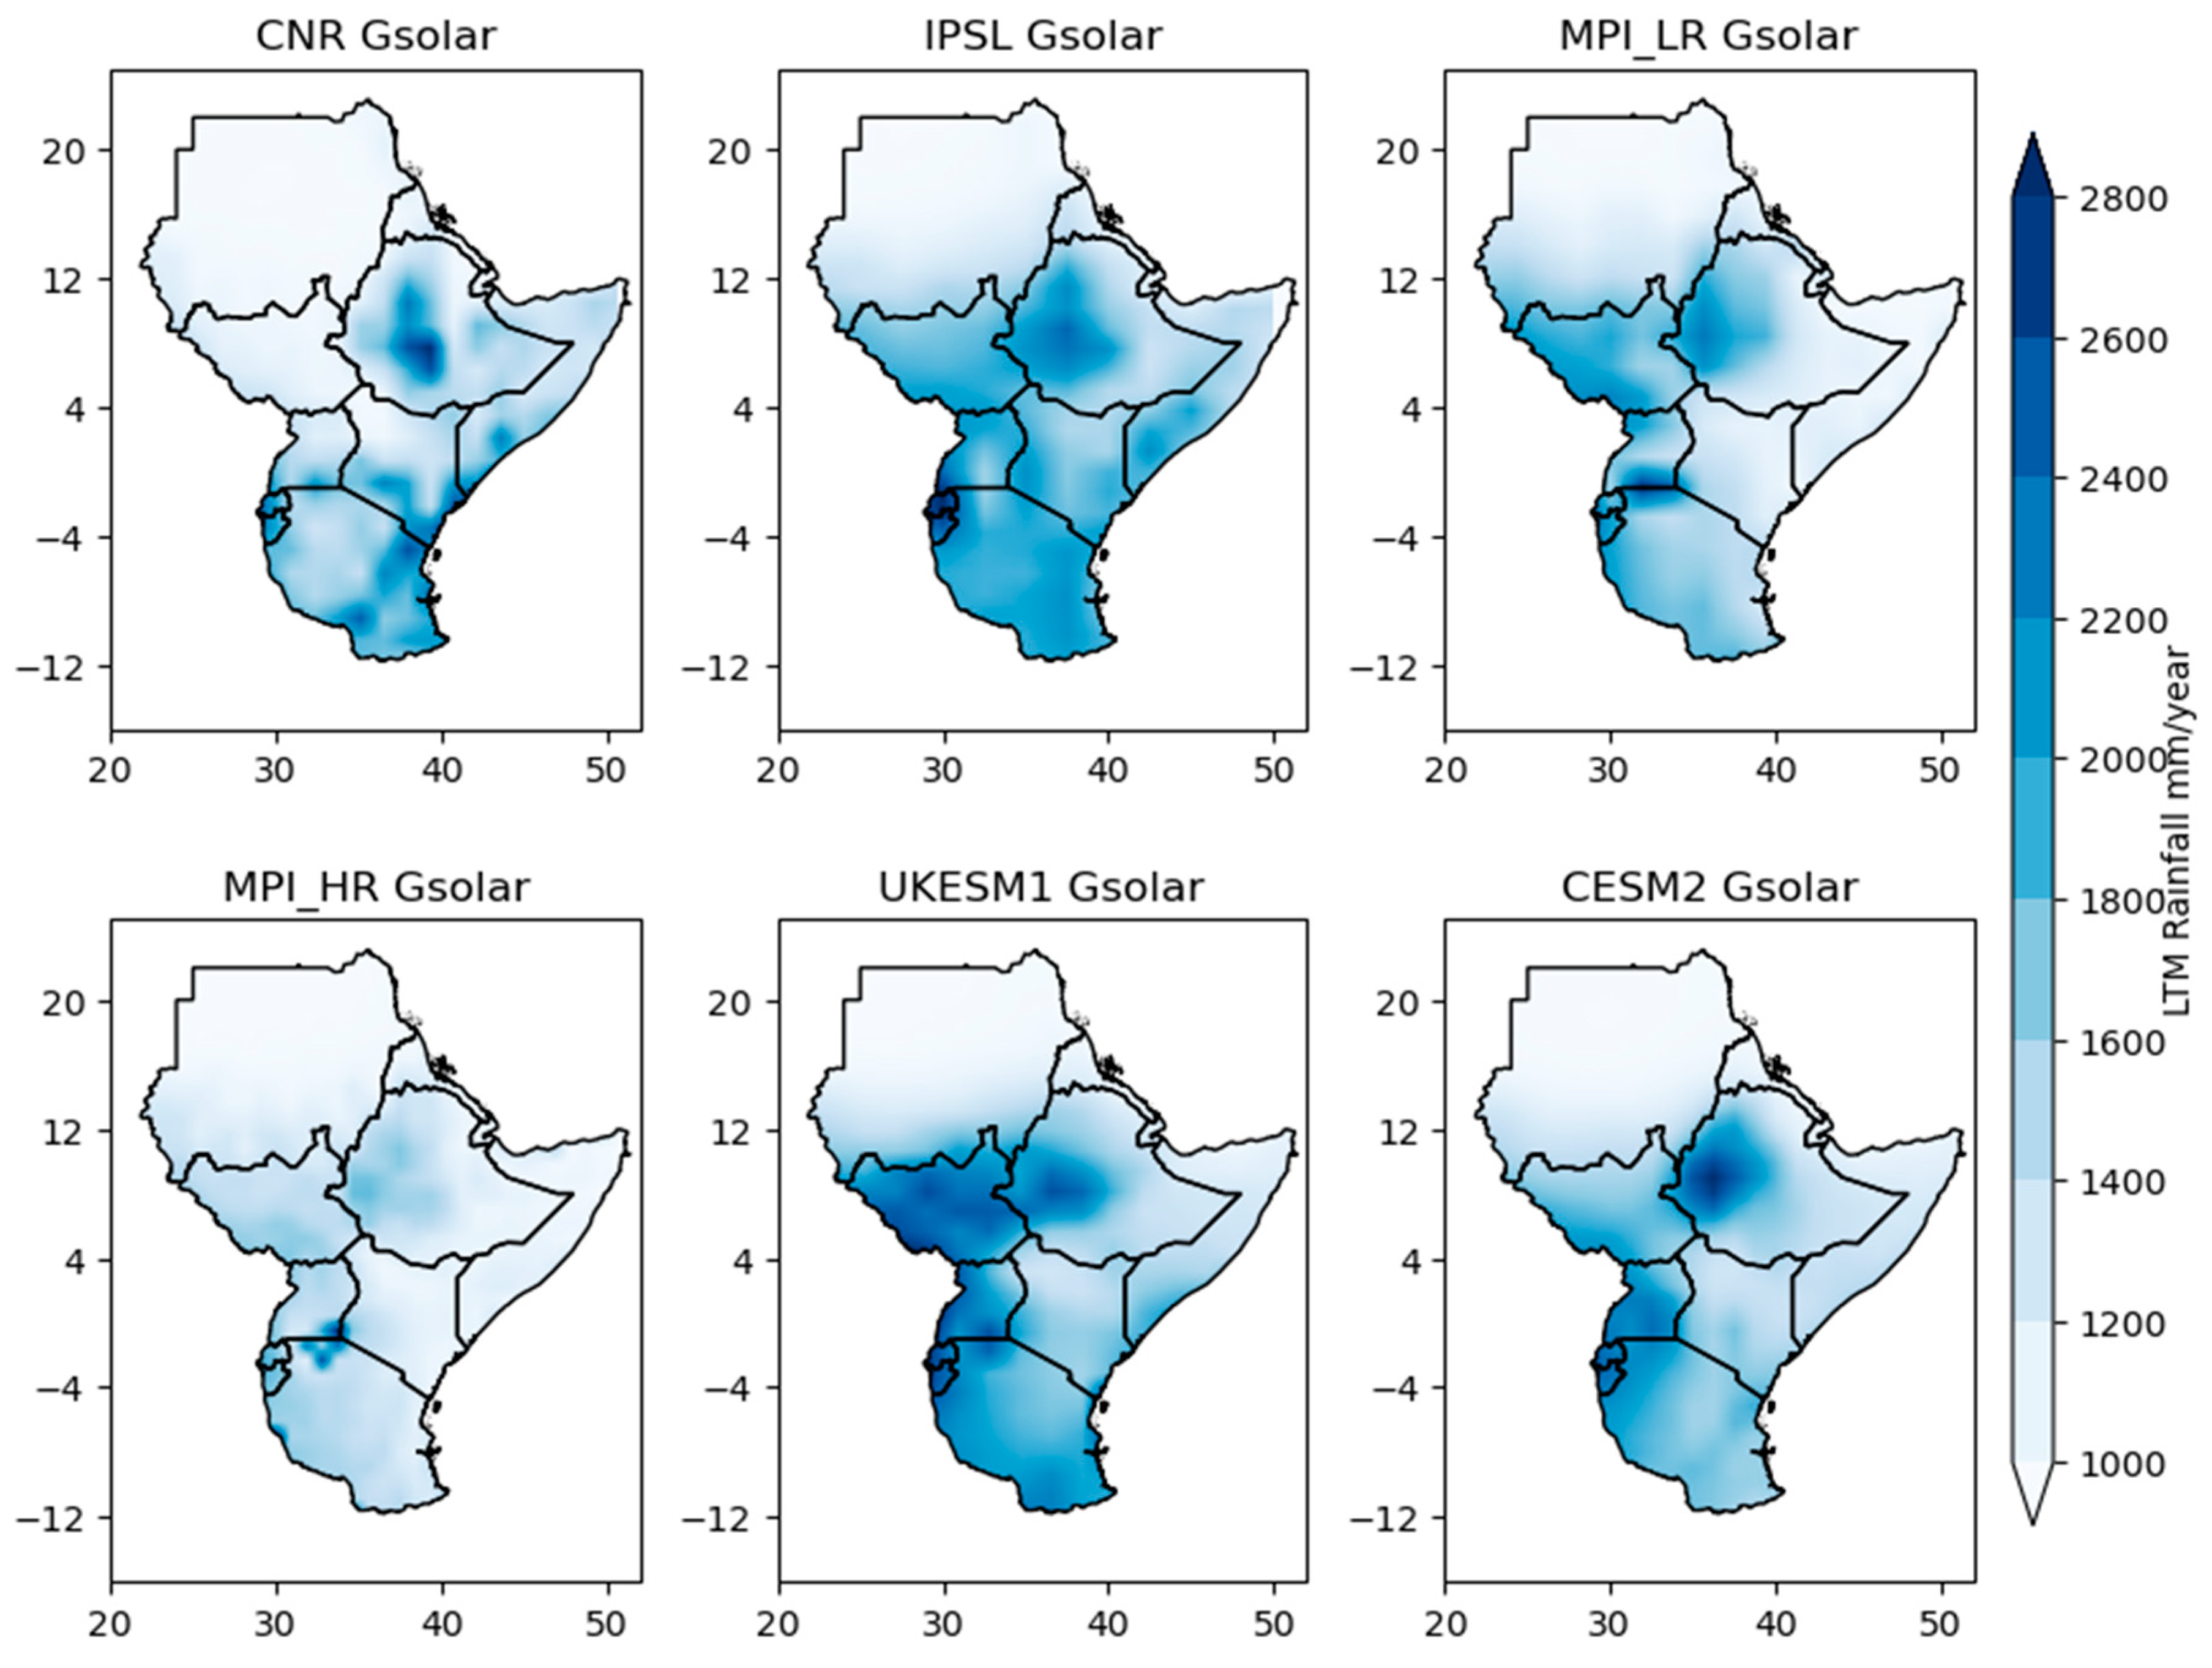
Figure 8.
Projected average precipitation based on GeoMIP models under G6Sulfur for 2051-2080.
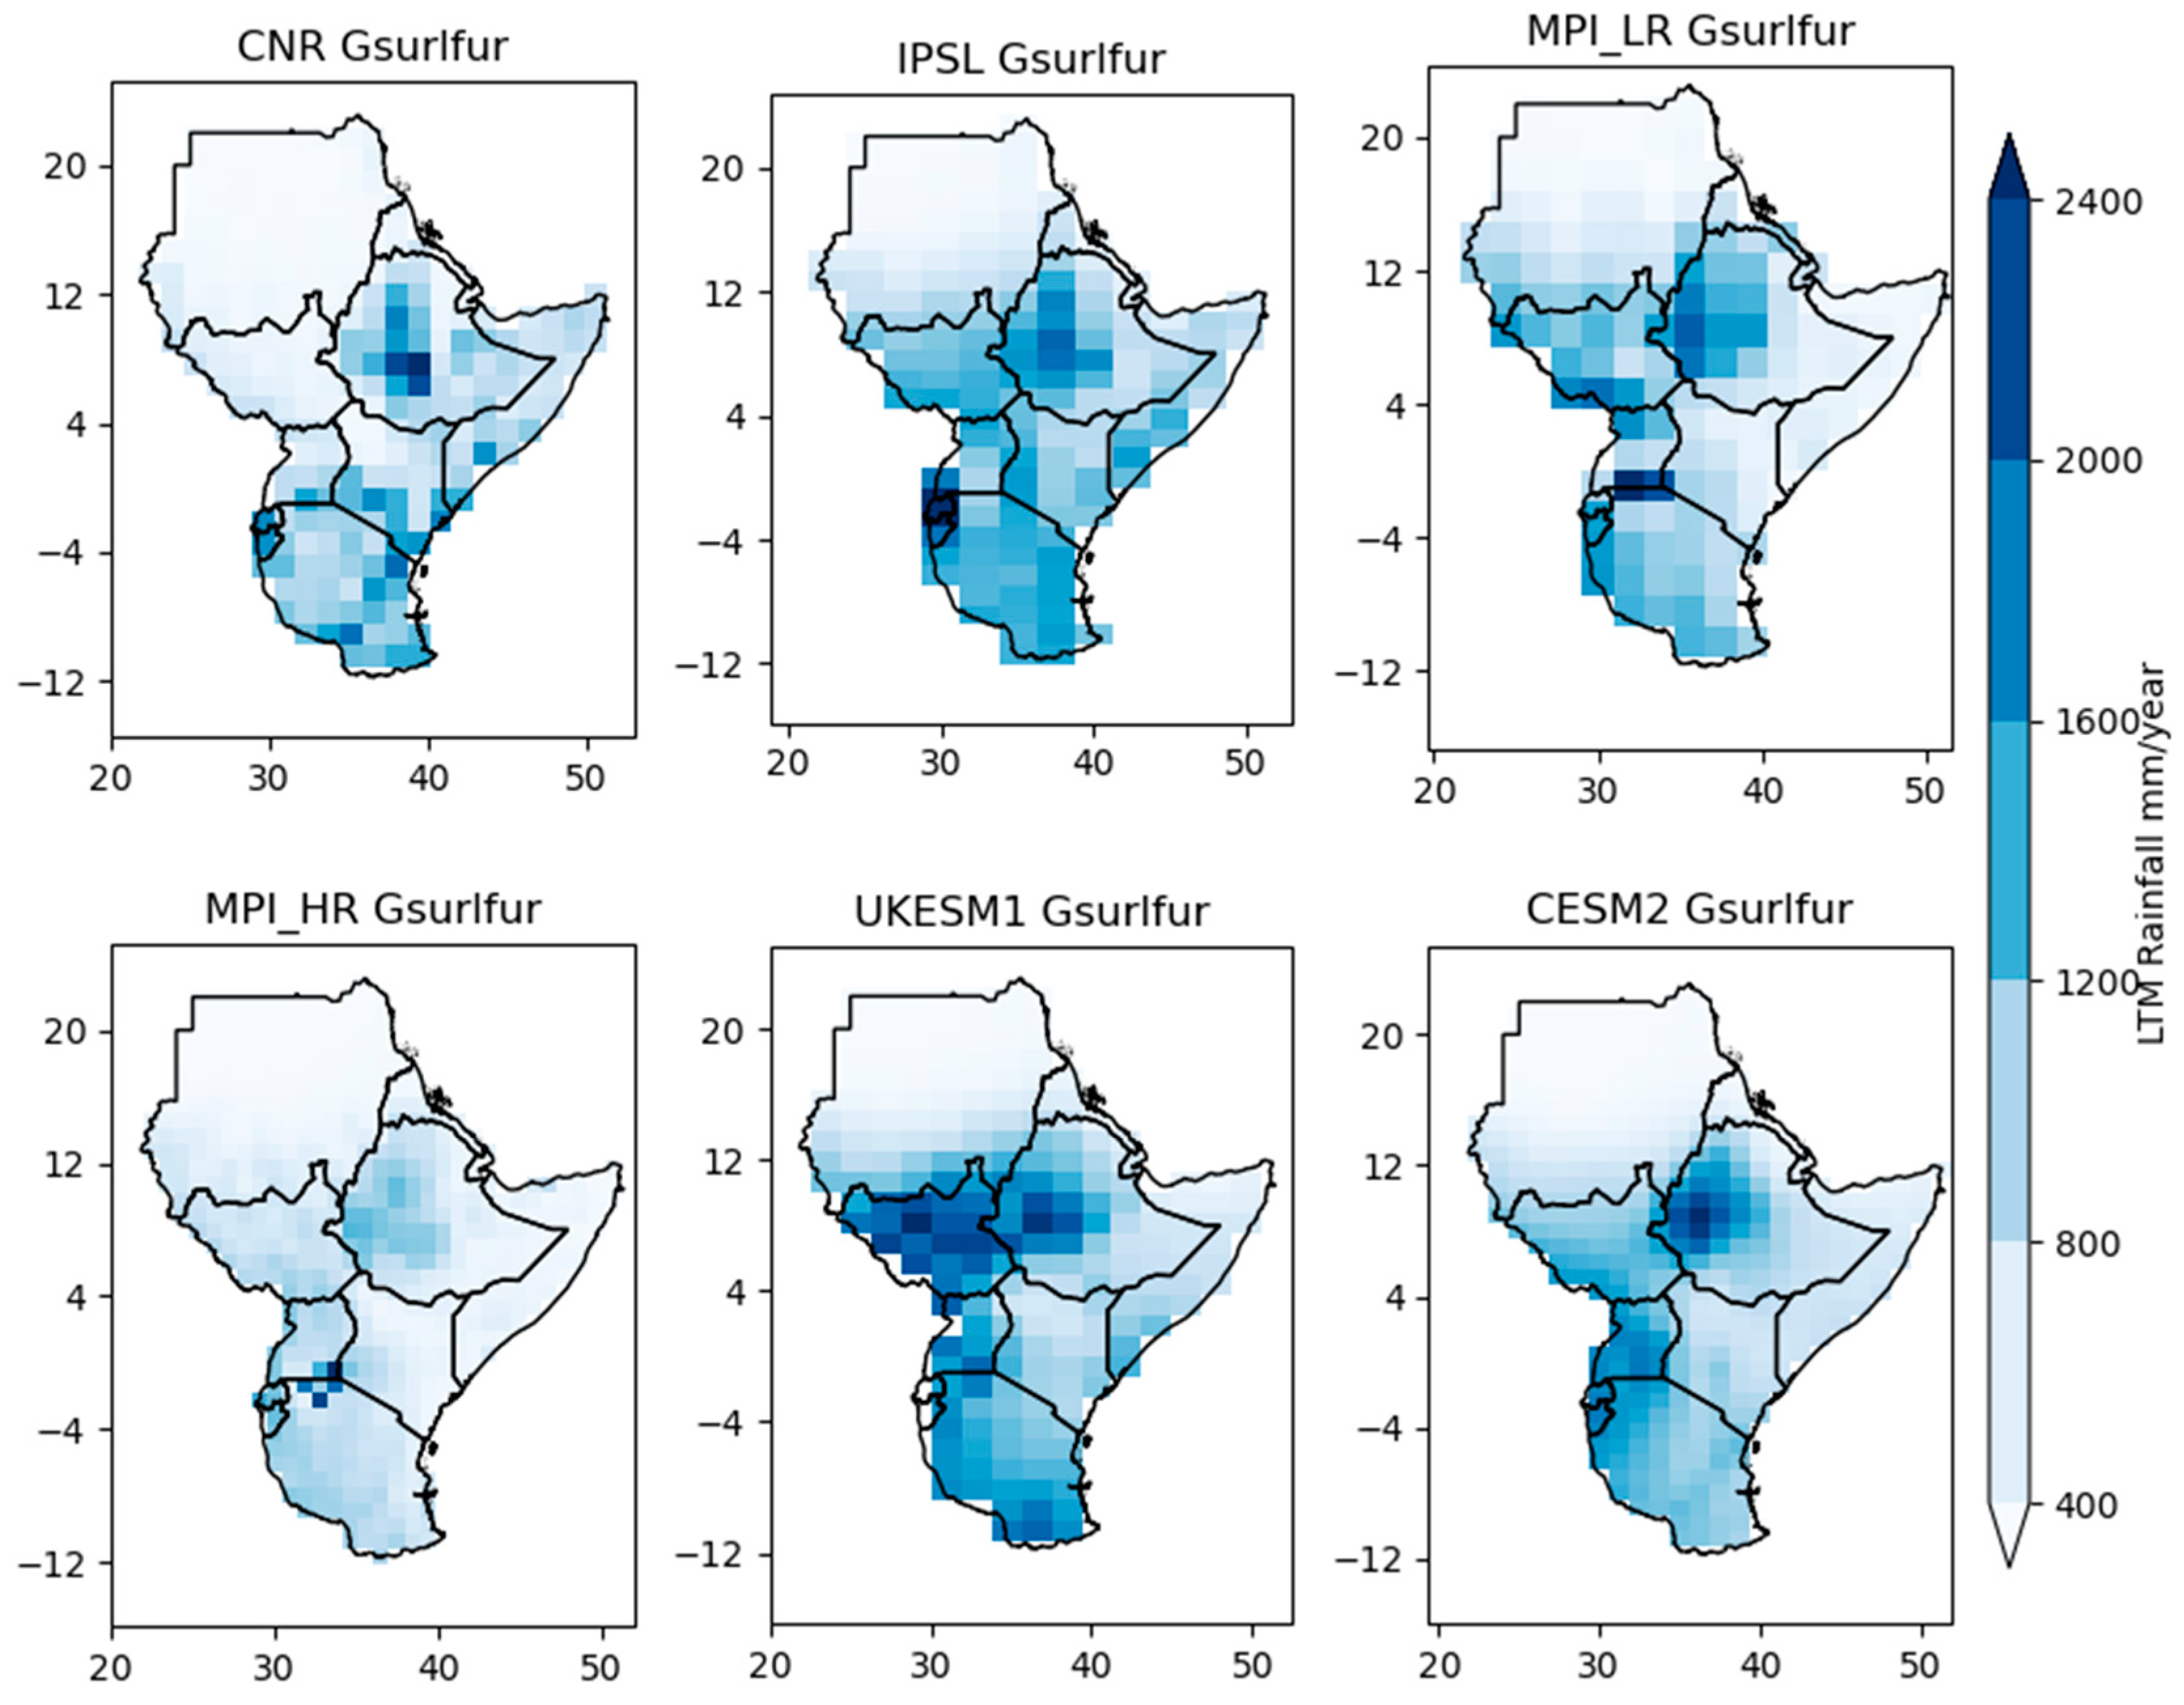
Figure 9.
Projected precipitation anomalies for SRM G6solar scenario over SSP245 GHG scenario for 2051-2080.
Figure 9.
Projected precipitation anomalies for SRM G6solar scenario over SSP245 GHG scenario for 2051-2080.
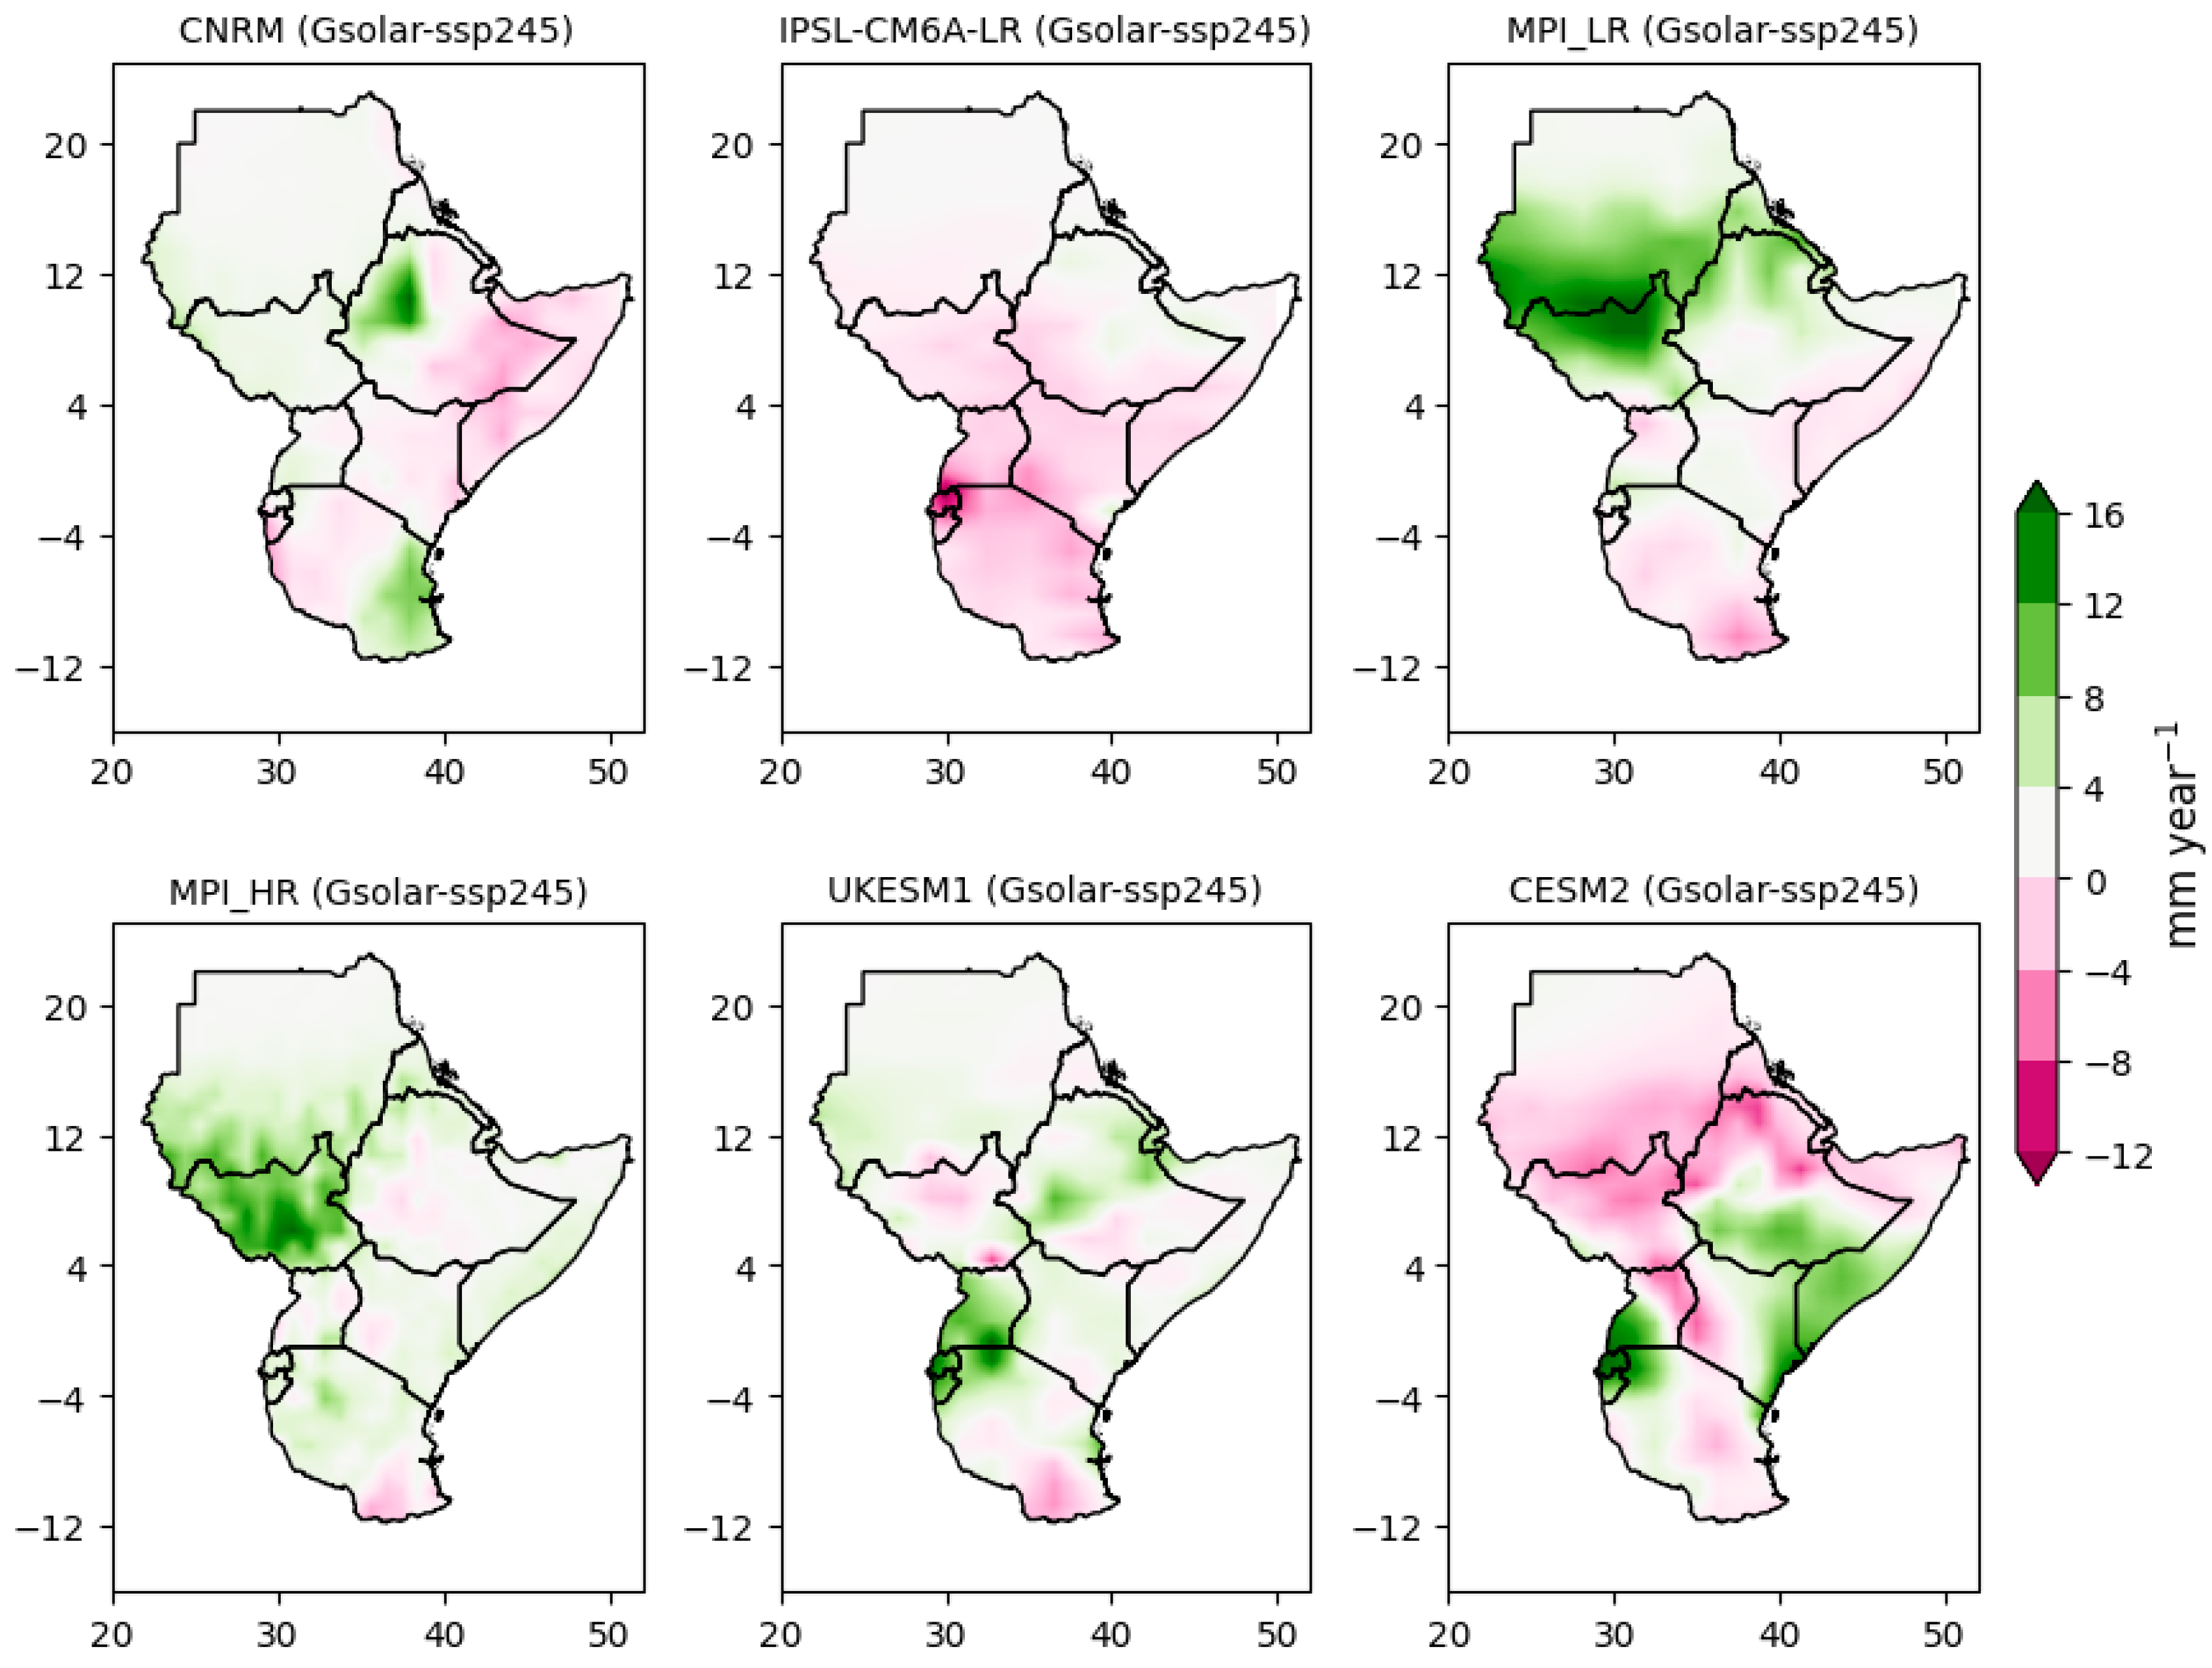
Figure 10.
Projected precipitation anomalies for SRM G6solar scenario over SSP585 GHG scenario for 2051-2080.
Figure 10.
Projected precipitation anomalies for SRM G6solar scenario over SSP585 GHG scenario for 2051-2080.
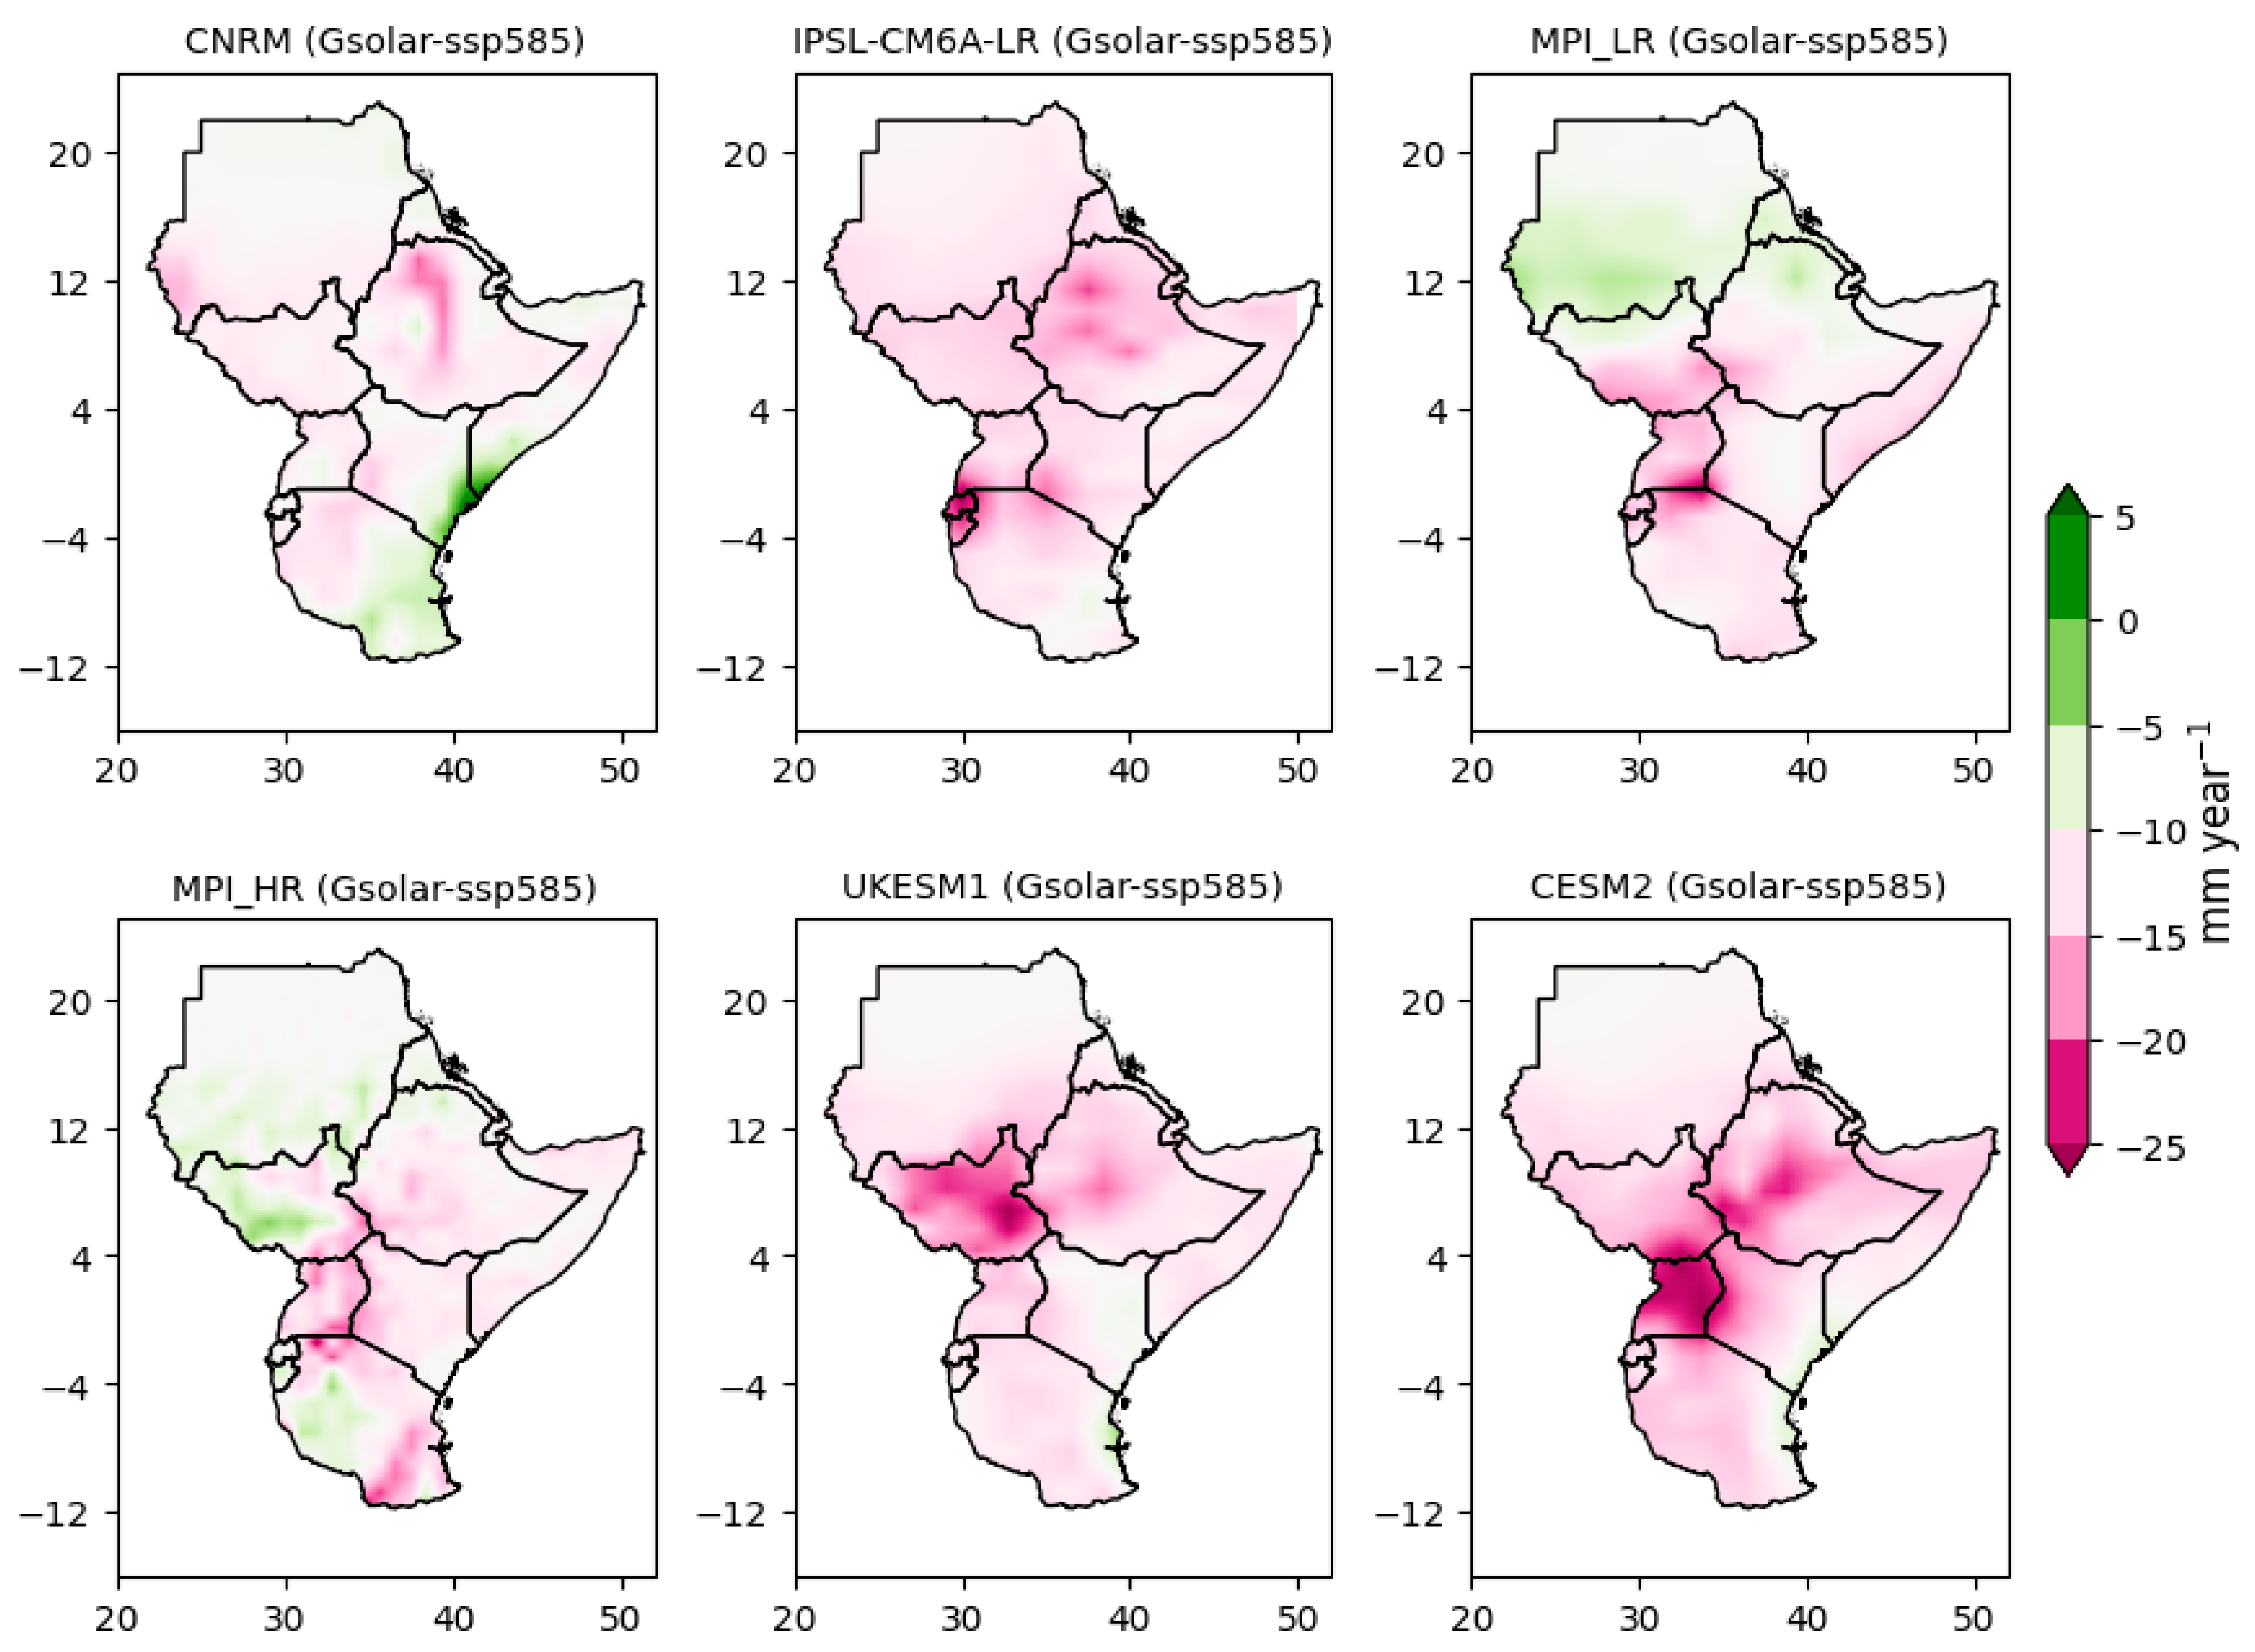
Figure 11.
Projected precipitation anomalies for SRM G6sulfur scenario over SSP245 GHG scenario for 2051-2080.
Figure 11.
Projected precipitation anomalies for SRM G6sulfur scenario over SSP245 GHG scenario for 2051-2080.
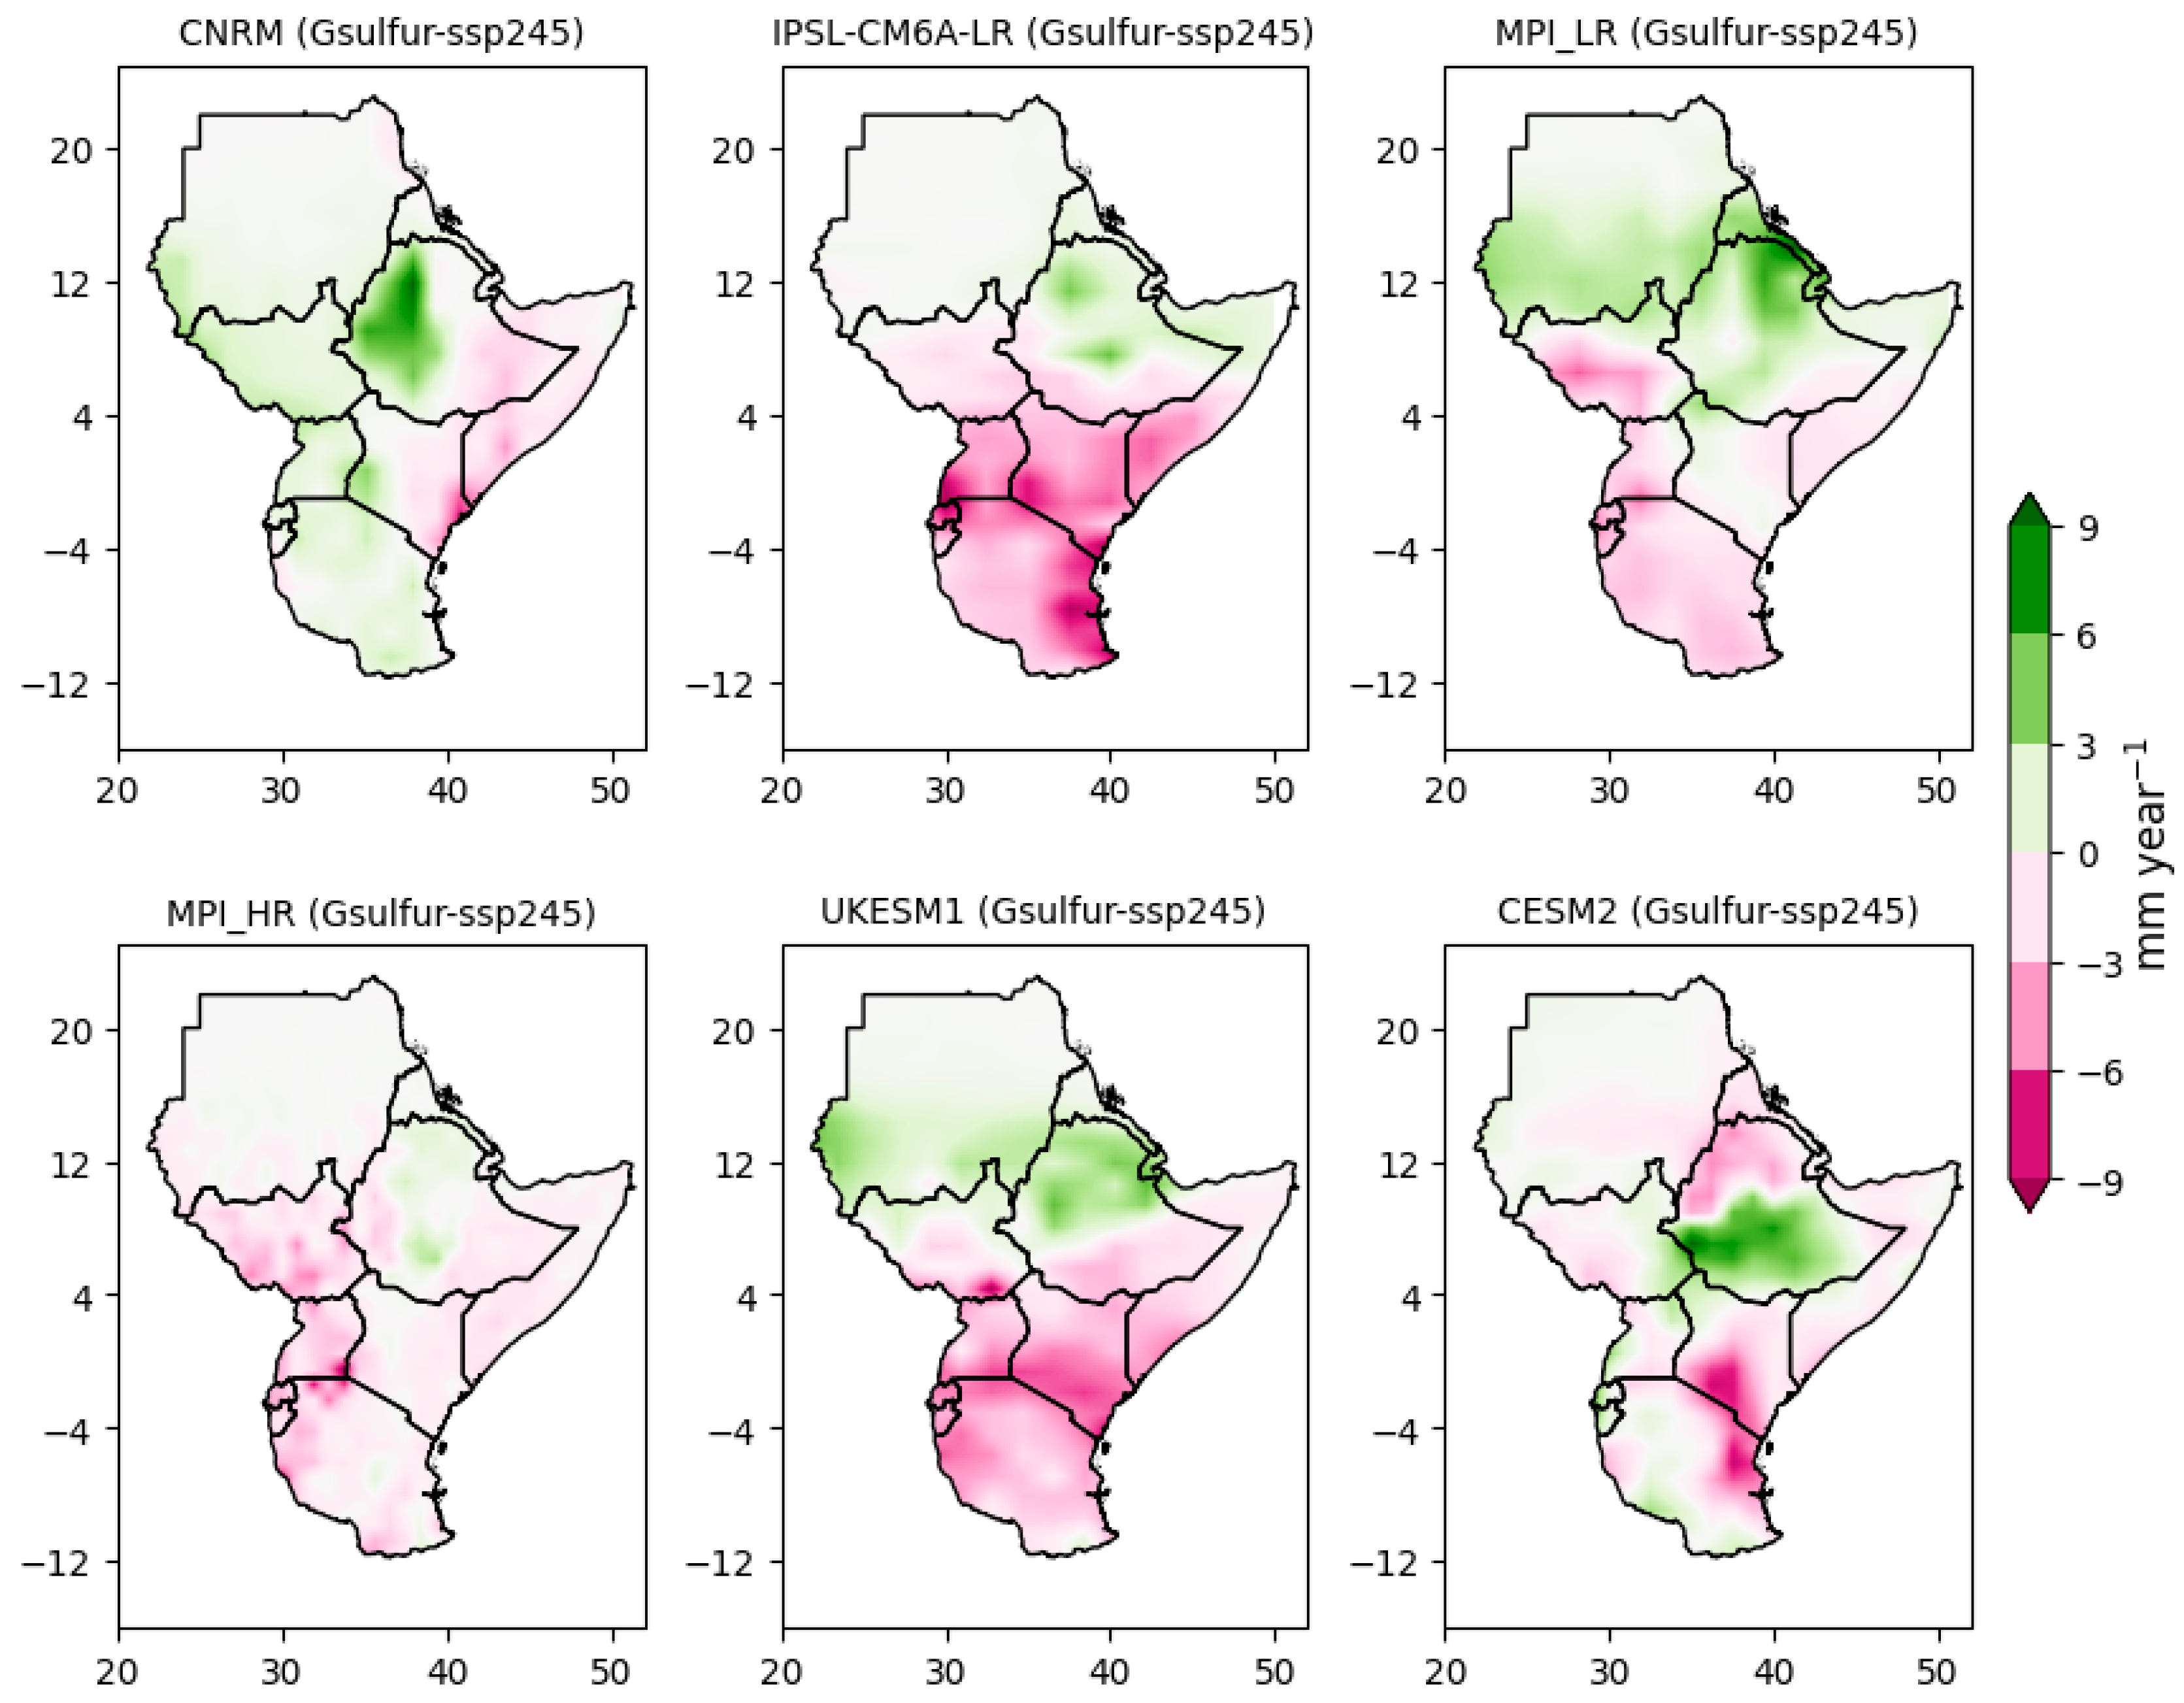
Figure 12.
Projected precipitation anomalies for SRM G6solar scenario over SSP245 GHG scenario for 2051-2080.
Figure 12.
Projected precipitation anomalies for SRM G6solar scenario over SSP245 GHG scenario for 2051-2080.
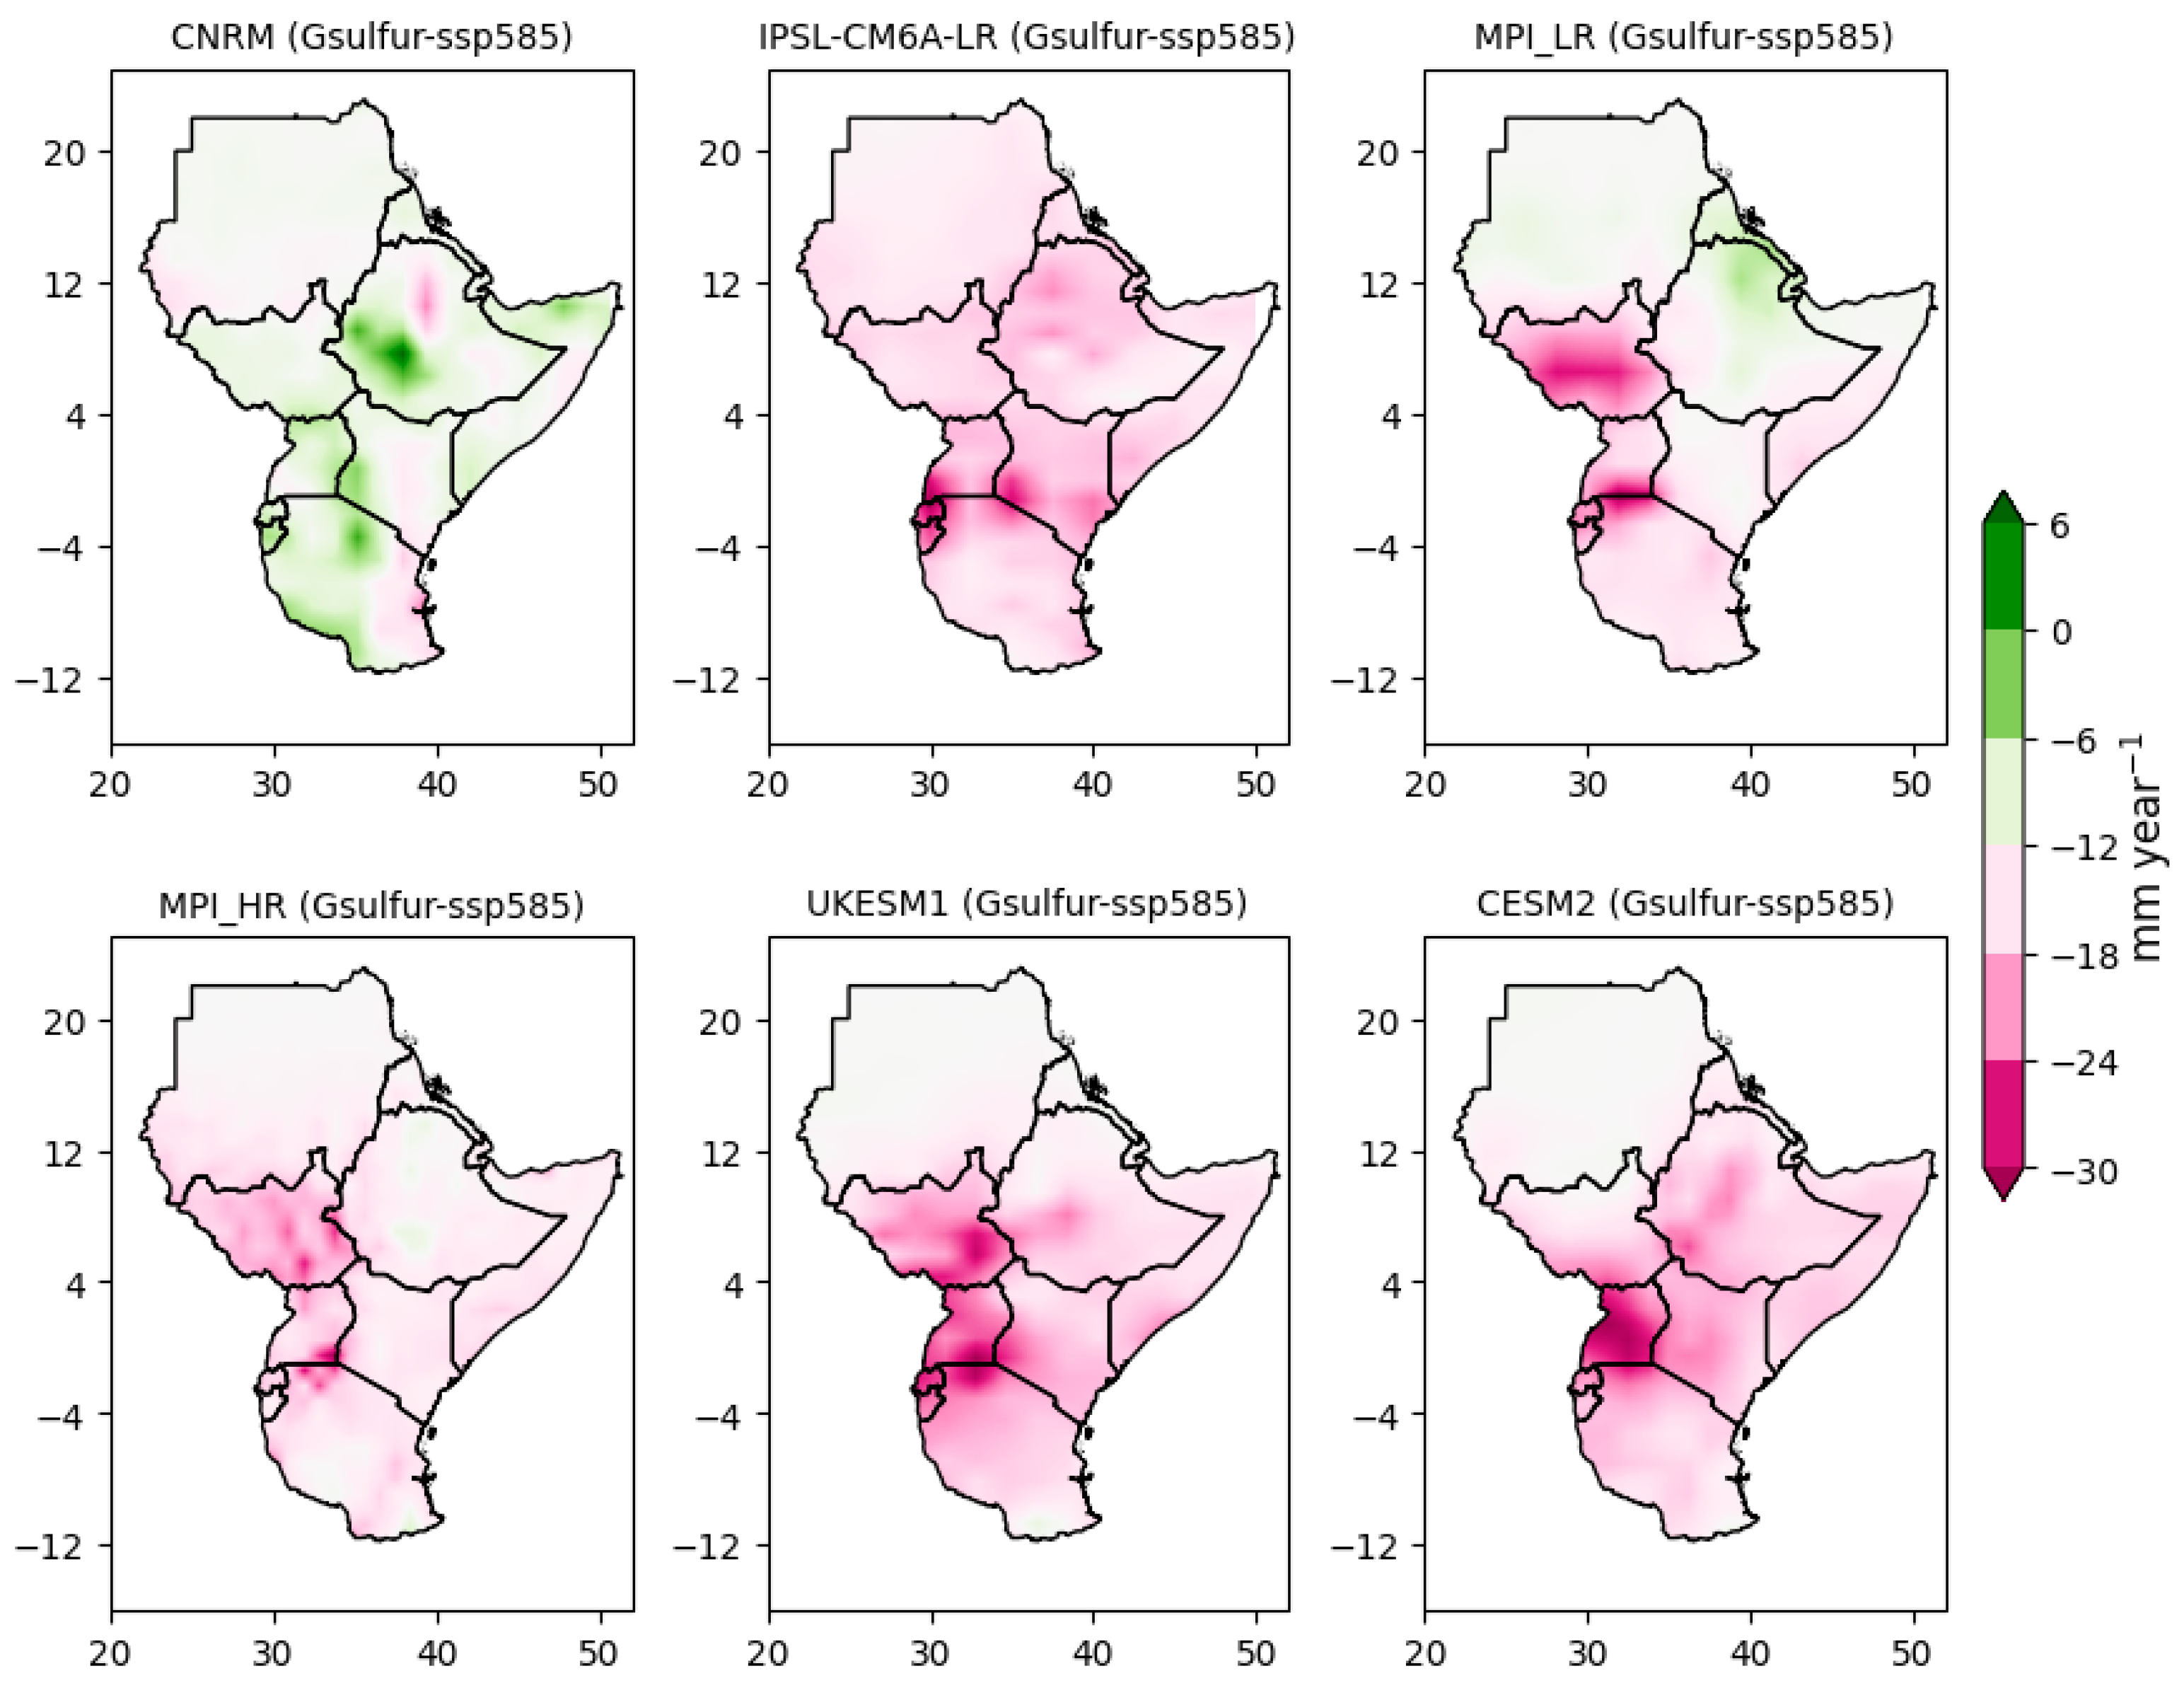
Figure 13.
G6Solar temperature anomalies in relation to SSP245 for 2051-2080 period.
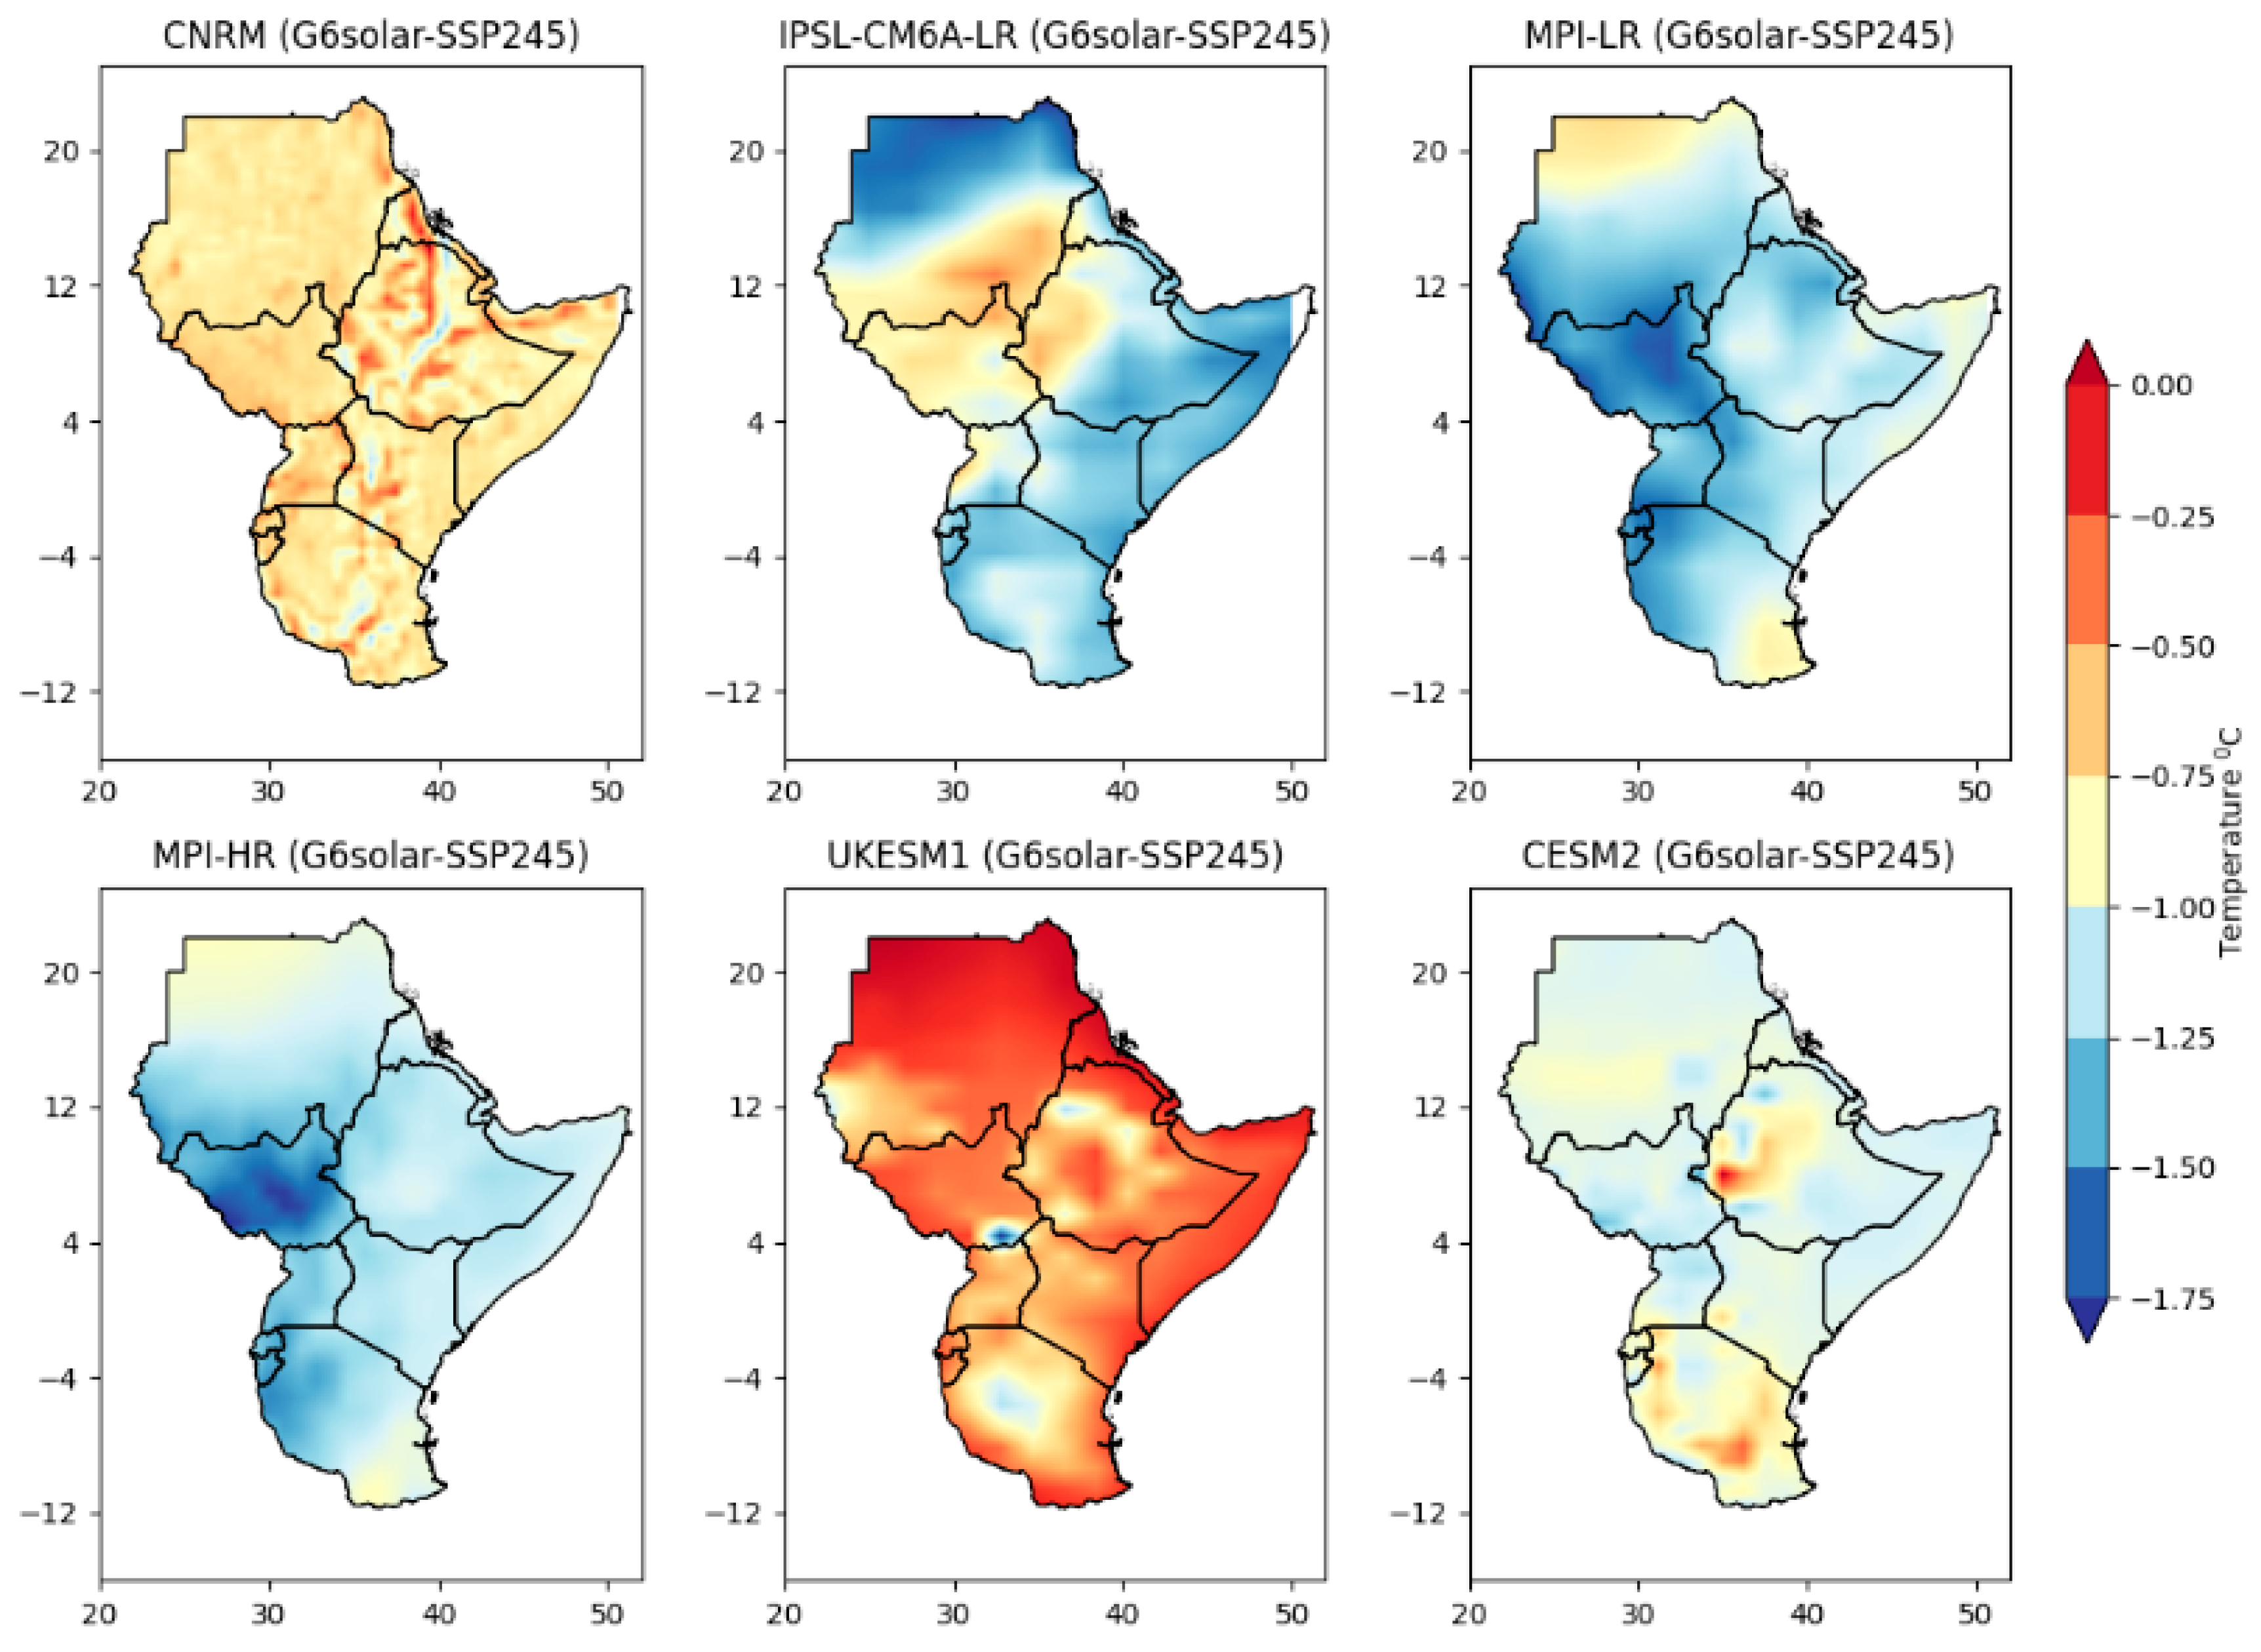
Figure 14.
G6Sulfur temperature anomalies in relation to SSP585 for 2051-2080.
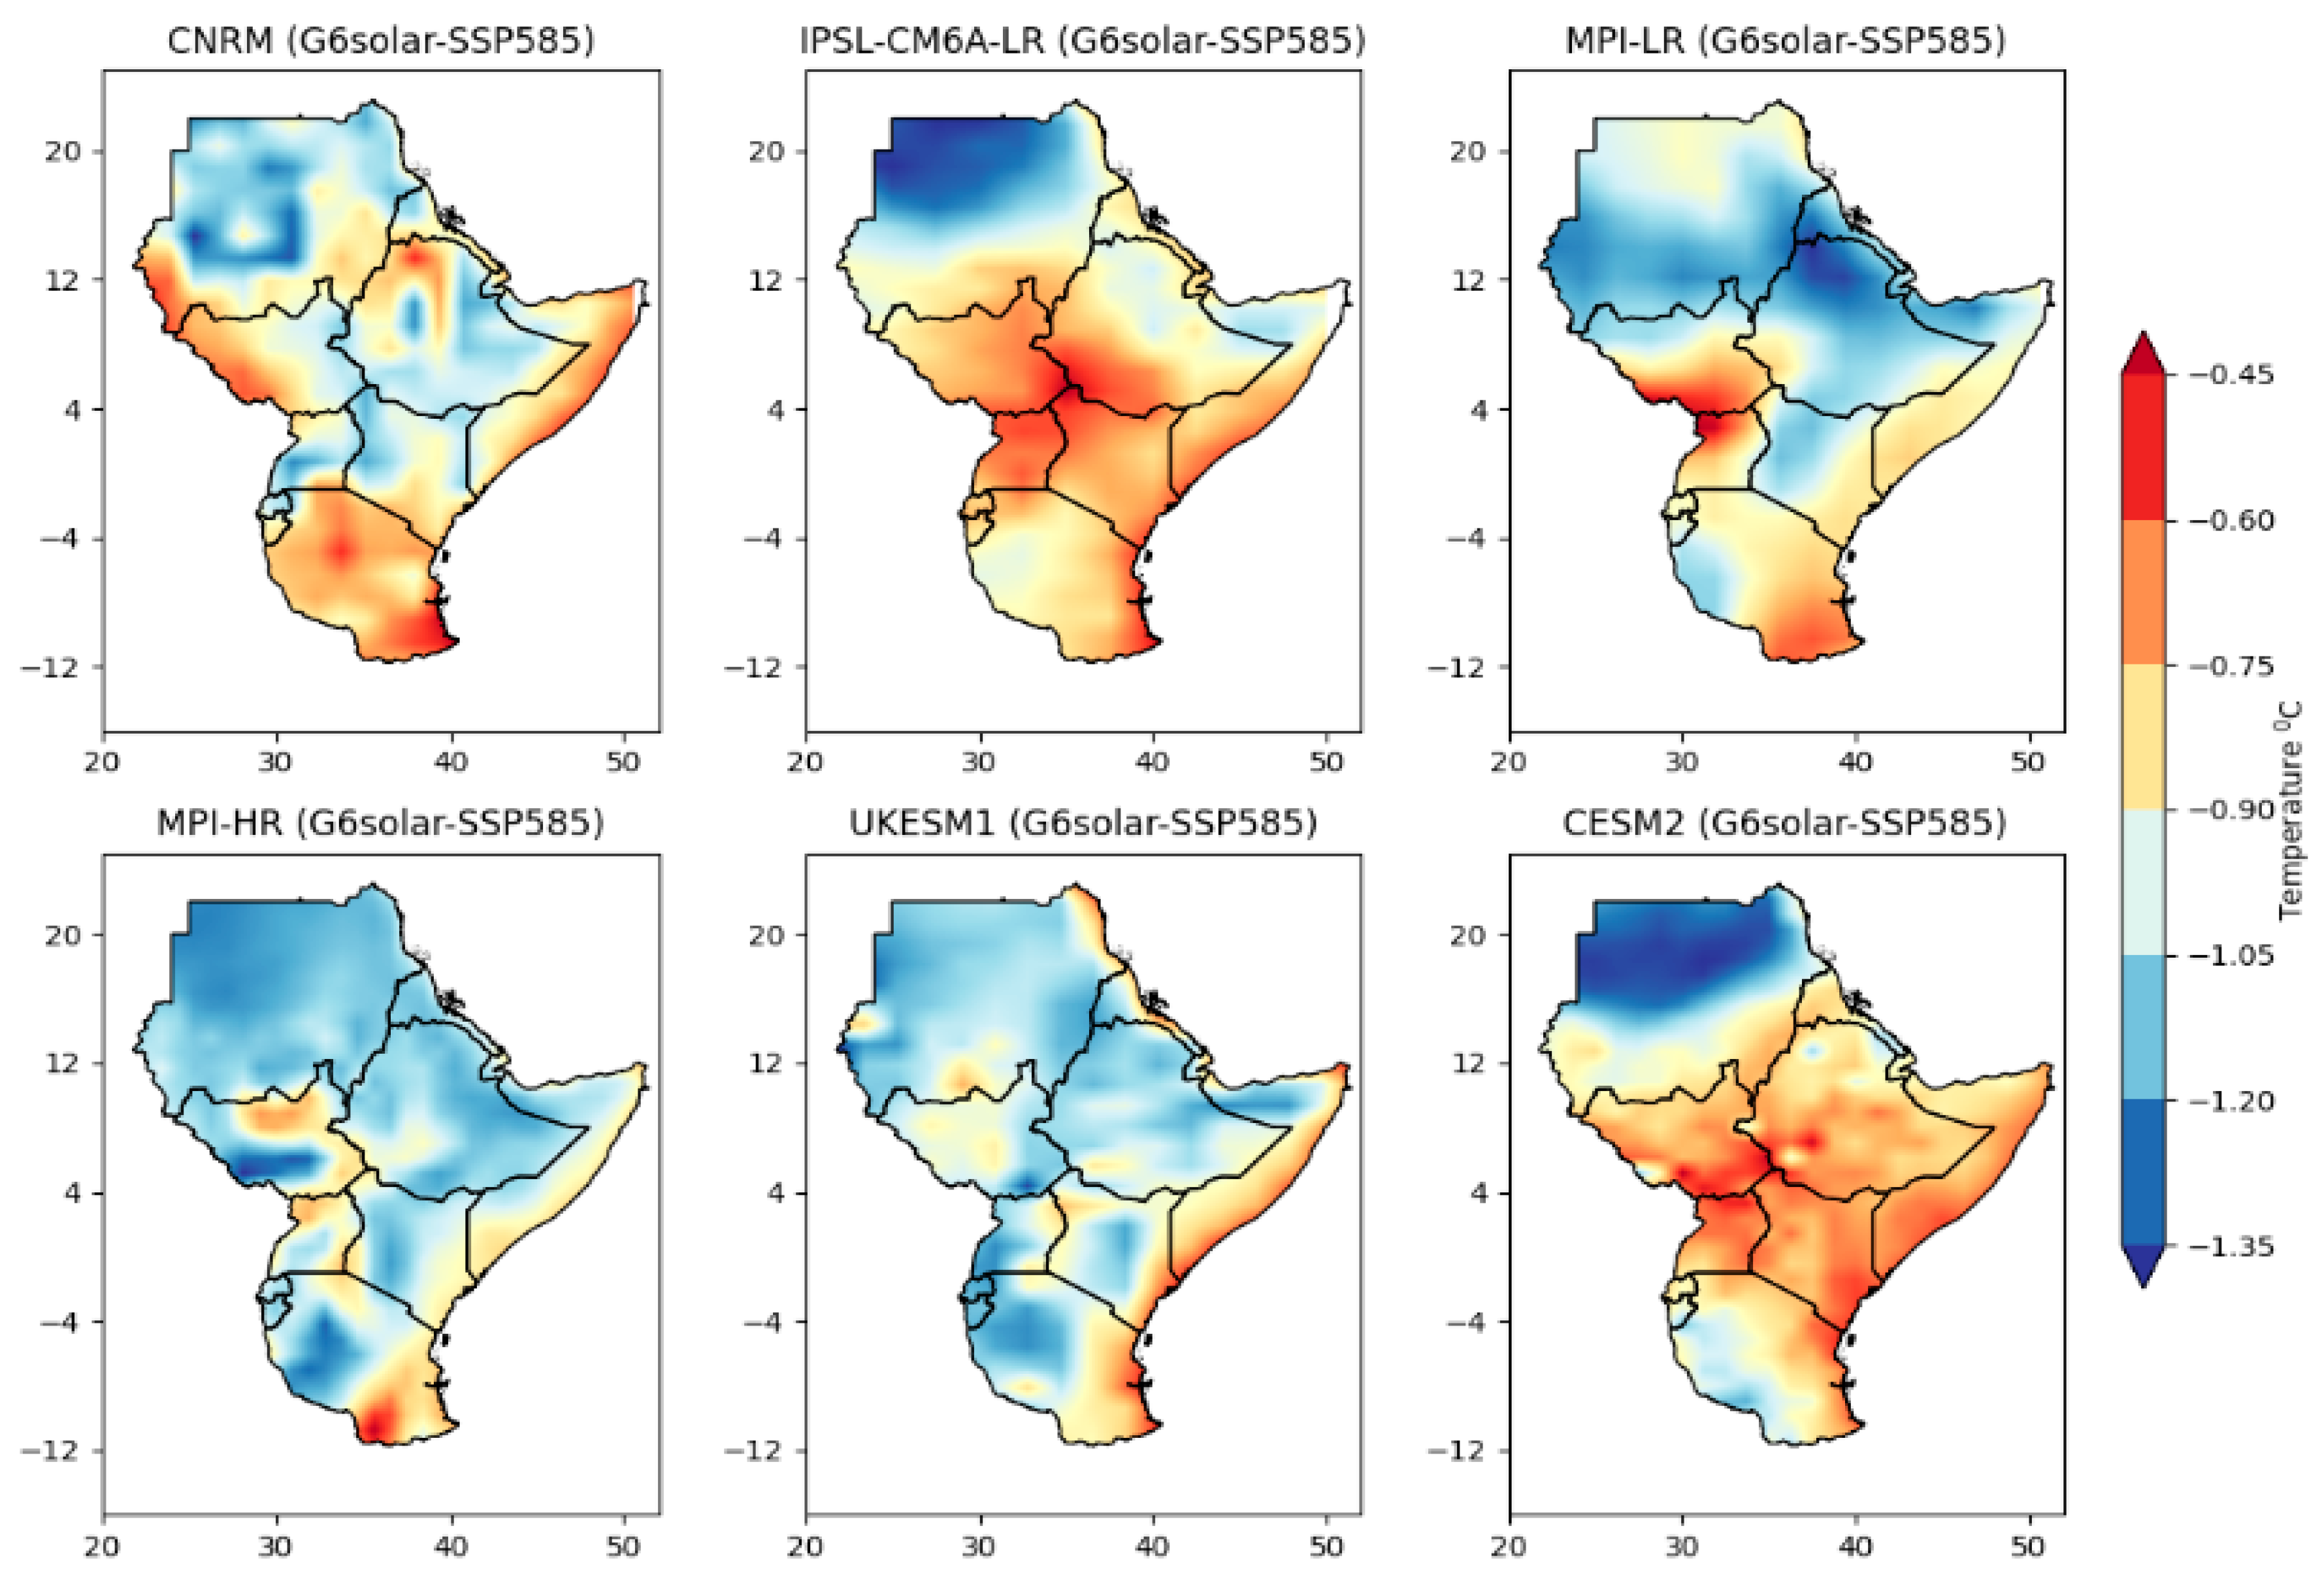
Figure 15.
G6Sulfur temperature anomalies in relation to SSP245 for 2051-2080.
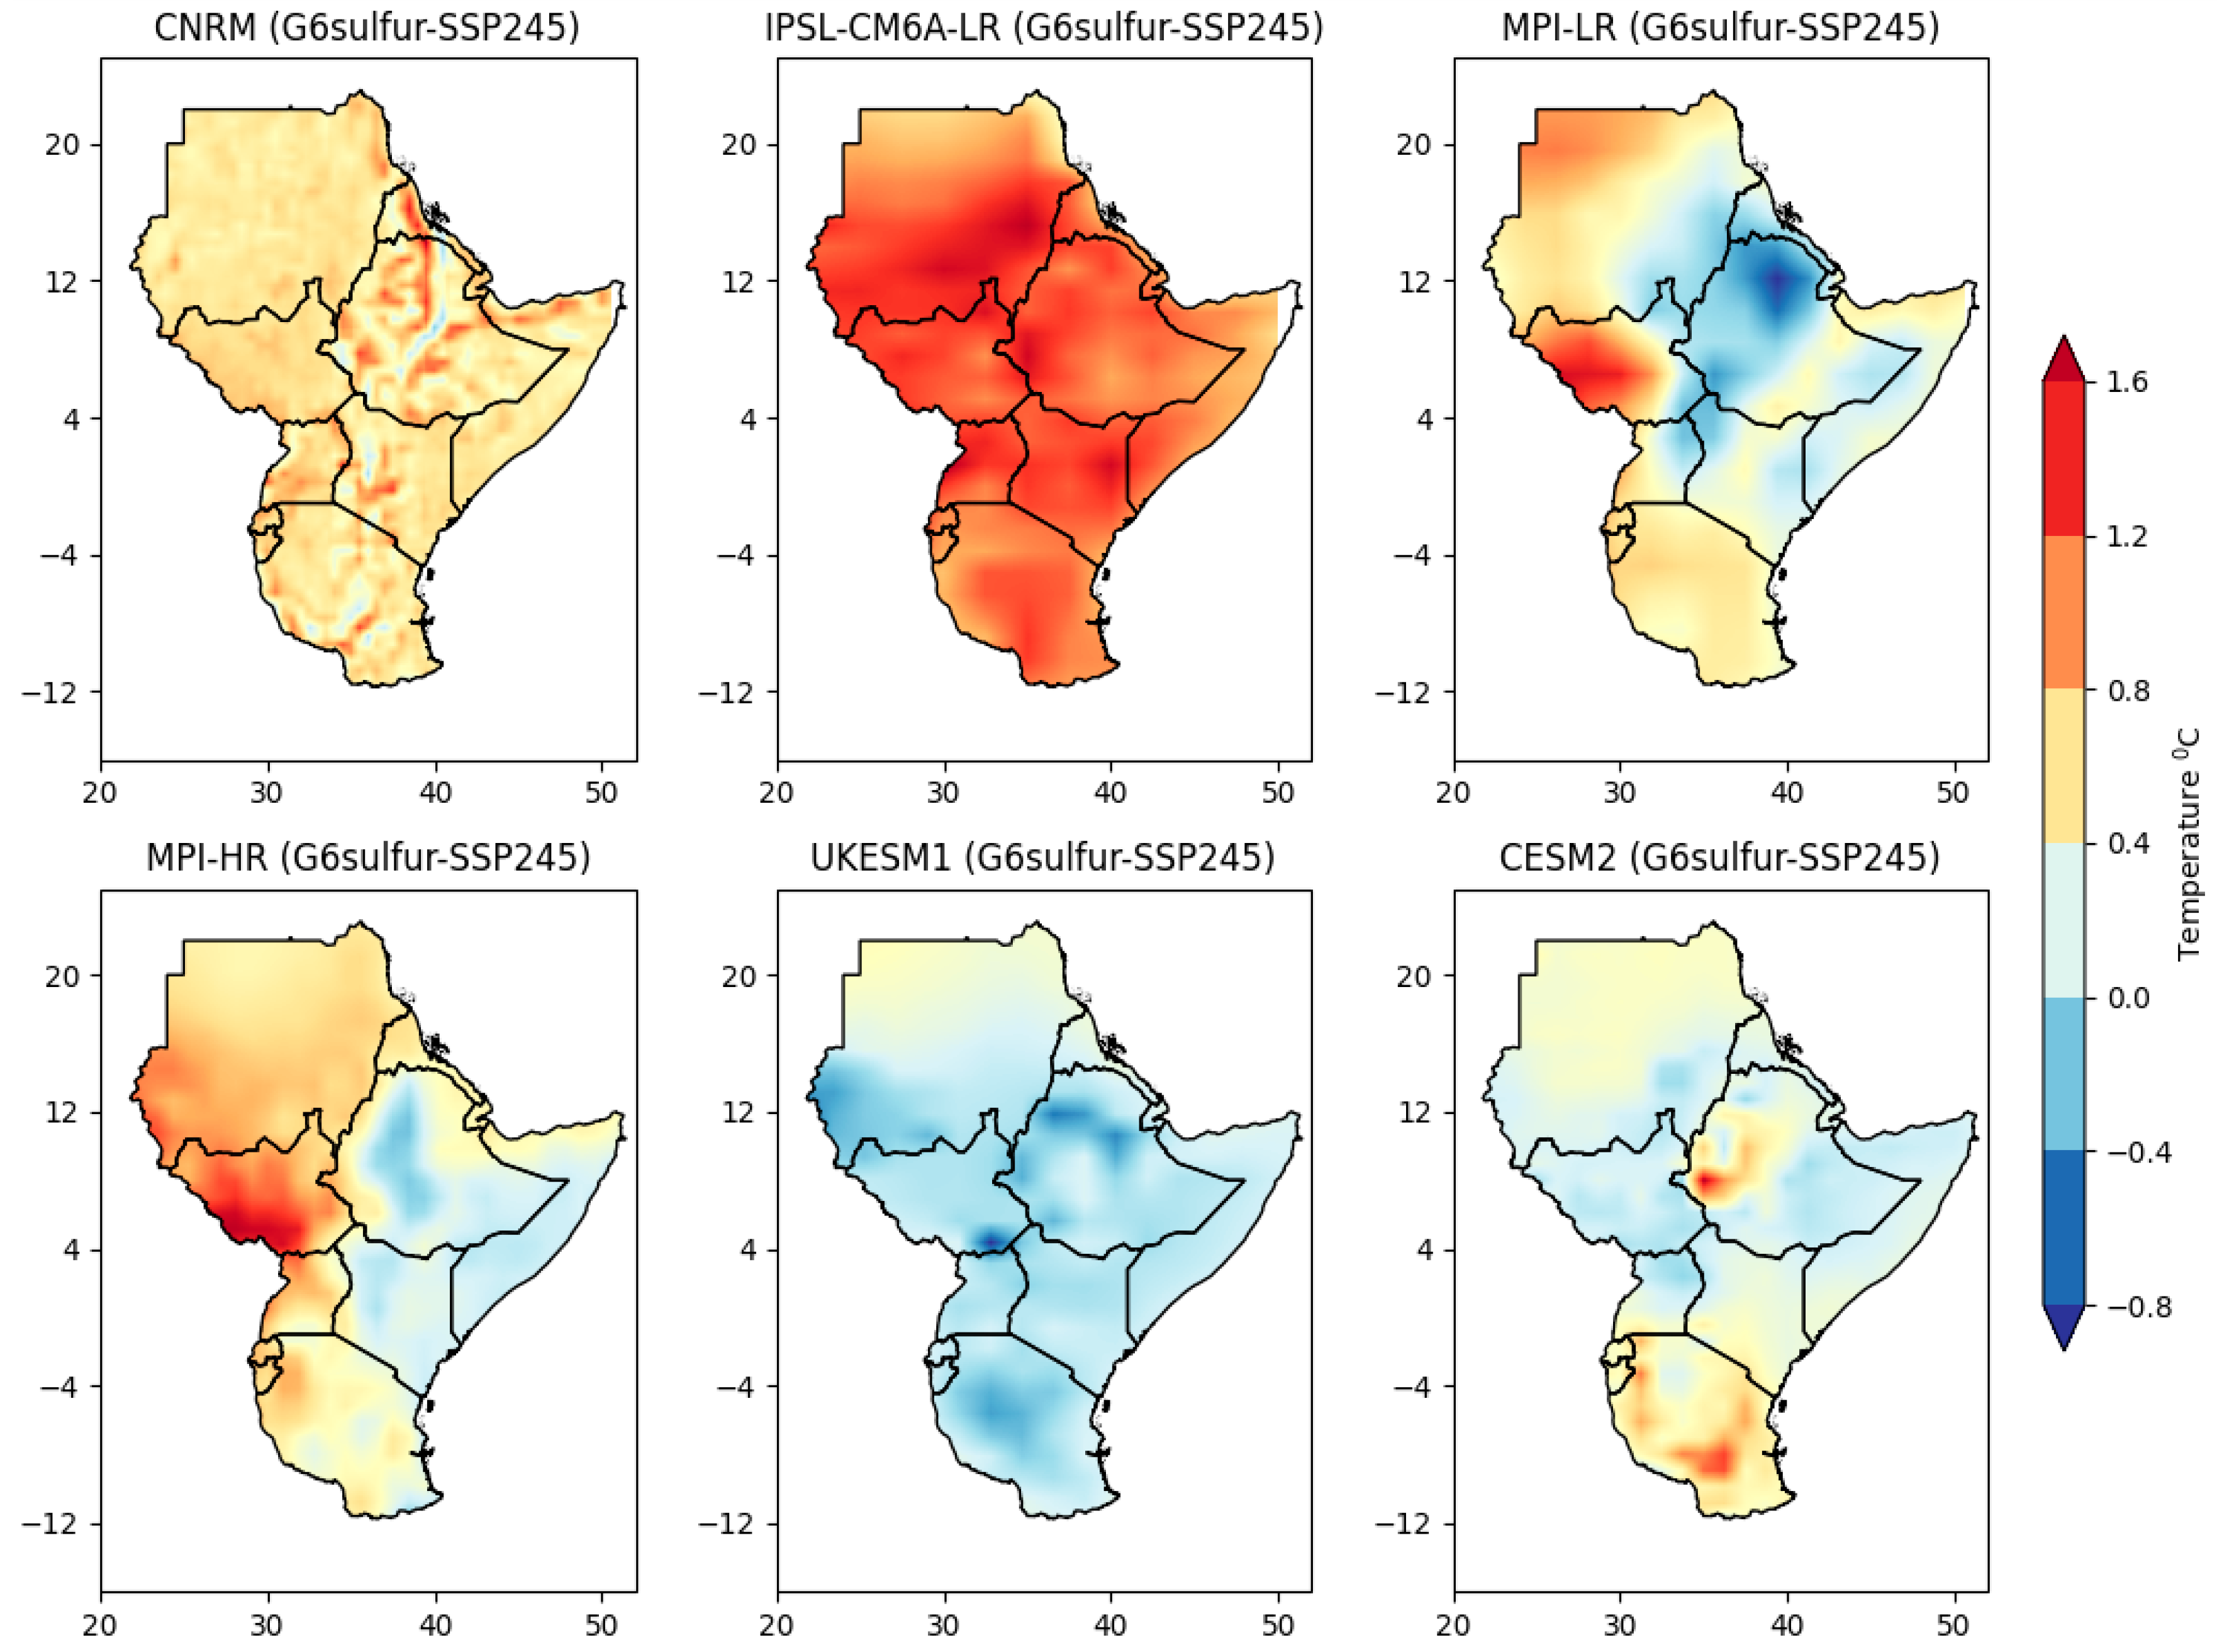
Figure 16.
G6Sulfur temperature anomalies in relation to SSP585 for 2051-2080.
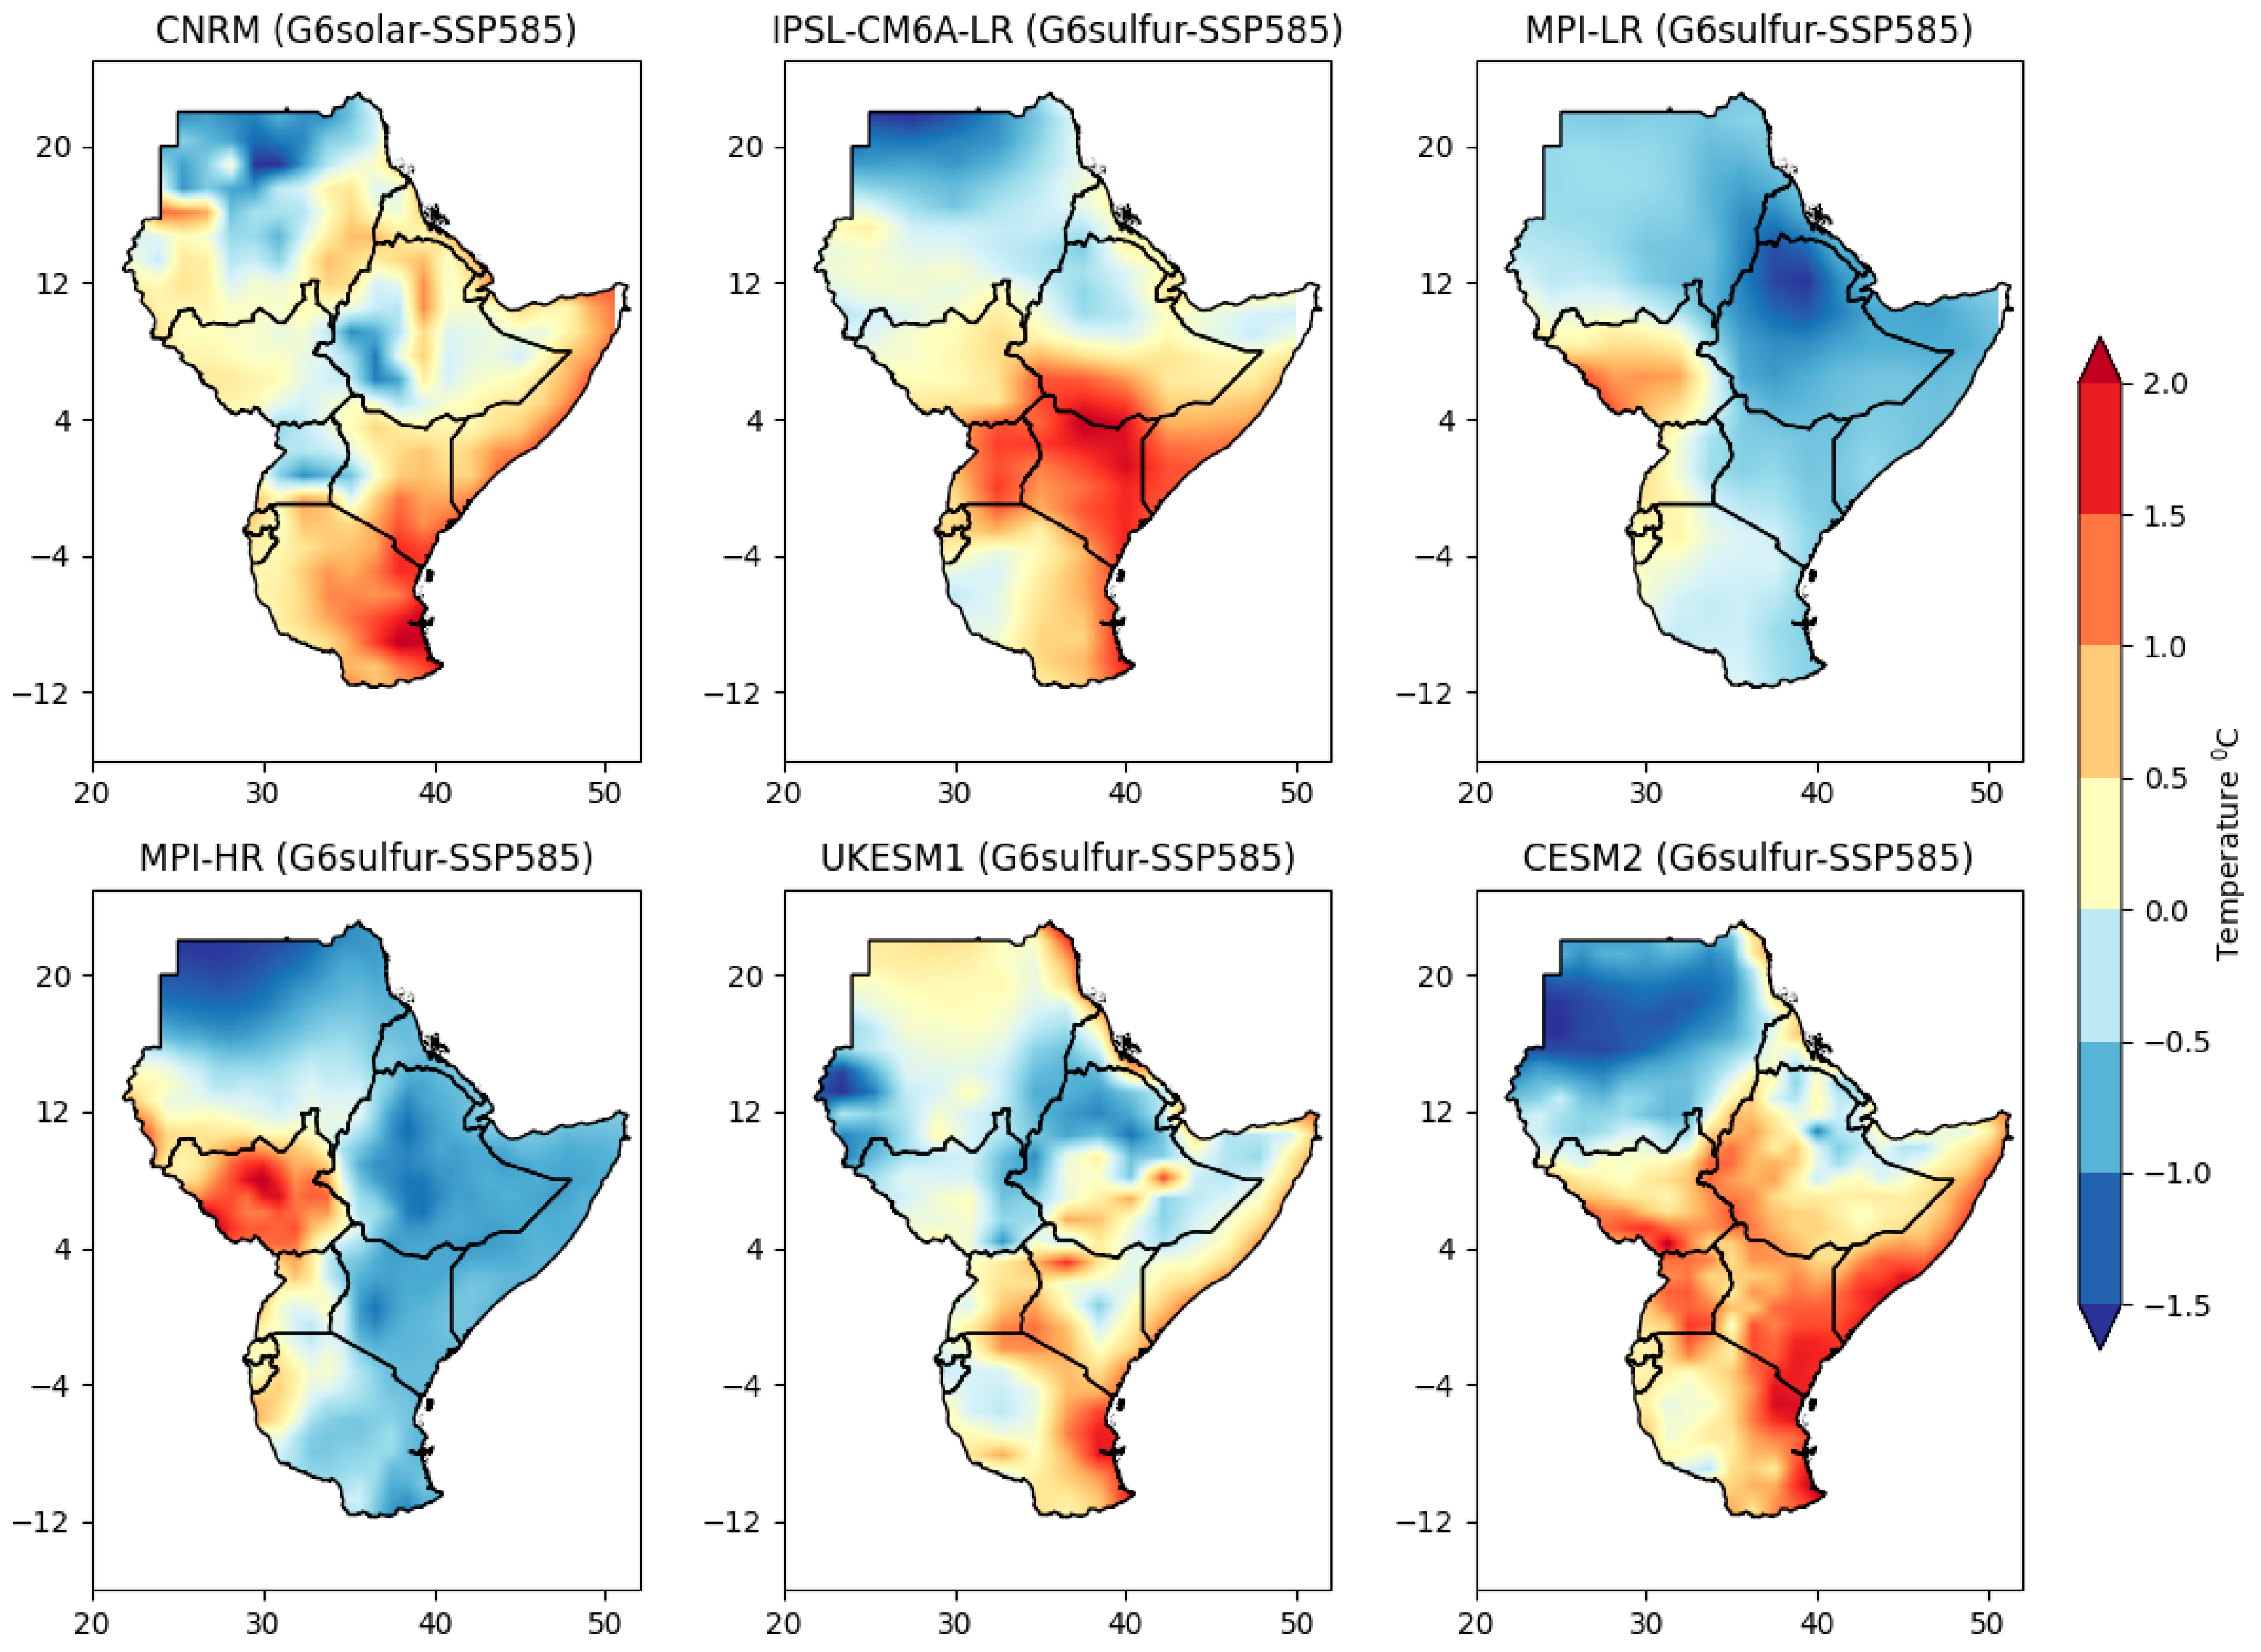

Table 1.
GeoMIP GCM models.
| No | Model Name | Institution/Modelling Centre | Resolution |
|---|---|---|---|
| 1 | CESM2 | National center for Atmospheric Research (NCAR), USA | 0.5o X0.5o |
| 2 | CNRM_ESM2-1 | Centre for de Recherches Meteorologiques (CNRM) in collaboration with the Centre Euopeen de Recherche et de Formation Avancee en Calcul Scientifique (CERFACS), France | 0.5o X0.5o |
| 3 | IPSL-CM6A-LR | Institut Pierre Simon Laplace, Paris, France | 1.9o X1.3o |
| 4 | MPI-ESM1-2-HR | Max Planck Institute for Meteorology, Hamburg, Germany | 2.5o X1.3o |
| 5 | MPI-ESM1-2-LR | Max Planck Institute for Meteorology, Hamburg, Germany | 0.9o X 0.9o |
| 6 | UKESM1-0-LL | Met Office Hadley Centre (MOHC), UK | 1.9o X 1.3o |
Disclaimer/Publisher’s Note: The statements, opinions and data contained in all publications are solely those of the individual author(s) and contributor(s) and not of MDPI and/or the editor(s). MDPI and/or the editor(s) disclaim responsibility for any injury to people or property resulting from any ideas, methods, instructions or products referred to in the content. |
© 2025 by the authors. Licensee MDPI, Basel, Switzerland. This article is an open access article distributed under the terms and conditions of the Creative Commons Attribution (CC BY) license (http://creativecommons.org/licenses/by/4.0/).
Copyright: This open access article is published under a Creative Commons CC BY 4.0 license, which permit the free download, distribution, and reuse, provided that the author and preprint are cited in any reuse.


