
Submitted:
16 November 2024
Posted:
19 November 2024
You are already at the latest version
Abstract
Background and Aims: Hepatoblastoma (HBL) and Fibrolamellar hepatocellular carcinoma (FLC) are the most common liver malignancies in children and young adults. FLC oncogenesis is associated with generation of the fusion kinase, DNAJB1-PKAc (J-PKAc). The J-PKAc has been found in 90% of FLC patients’ tumors, but not in other liver cancers. Since previous studies of J-PKAc were performed with adolescent patients, we asked if young children may ex-press the J-PKAc, and if there are consequences of such expression. Methods: Bio Bank of the pediatric HBL/HCN-NOS specimens were examined by QRT-PCR, Western Blot, RNA-Seq and by Immunostaining with fusion-specific antibodies. Results: J-PKAc is expressed in 70% of HBL/HCN-NOS patients. RNA-Seq analysis revealed that HBL tumors that do not have cells expressing J-PKAc show elevated expression of the Membrane Attack Complex (MAC), which eliminates cells expressing J-PKAc. The fusion-positive HBL/HCN-NOS samples have several signaling pathways that are different from fusion-negative HBLs. Upregulated pathways included genes involved in G1 to S transition and in liver cancer. Downregulated pathways included over 60 tumor suppressors, the CYP family, and the SLC family. The repression of these genes involves J-PKAc-beta-catenin-TCF4 mediated elevation of the HDAC1-Sp5 pathway. The identified upregulated and downregulated pathways are direct targets of the fusion kinase. The J-PKAc kinase is also detected in livers of 1 years old children with biliary atresia (BA). Conclusions: J-PKAc is expressed in both HBL tumor and BA liver samples, contributing to the development of HBL, and creating a transcriptome profiling consistent with potential development of liver cancer in young patients.
Keywords:
FLC
; hepatoblastoma
; Membrane Attack Complex
; beta-catenin
1. Introduction
Fibrolamellar hepatocellular carcinoma (FLC) has a unique single mutation that causes its development [1]. It has been demonstrated that about 90% of FLC patients have a large 400 kb genomic deletion, leading to the generation of a fusion oncoprotein, DNAJB1-PKAc (J-PKAc), between two proteins encoded by DNAJB1 and PKAc genes [2,3]. The presence of J-PKAc is sufficient to cause the main pathological features of FLC in mouse models [4]. J-PKAc possesses kinase activity; therefore, phosphorylation of new substrates is likely to be a critical component of FLC pathology. It was previously shown that J-PKAc phosphorylates b-catenin at Ser675 in mouse models of FLC, and that phosphorylation of b-catenin at Ser675 enhances FLC [4,5]. The J-PKAc fusion is highly specific to patients with FLC [2] with one report describing the presence on the fusion kinase in non-FLC cancers such as oncocytic pancreatic and biliary neoplasms [6]. The generation of animal models of FLC demonstrated that the initiation of the FLC-specific mutation occurs at an early age (2-week-old mice), with FLC developing later (12–14-month-old mice) [4]. This suggests a latency period following the creation of the mutant J-PKAc until the development of FLC pathology. It remains unknown how prevalent J-PKAc expression is in livers of young children and whether this presence ultimately results in FLC development.
Hepatoblastoma (HBL), the most common pediatric liver cancer, occurs early in children and is typically diagnosed at an advanced stage [7]. Genetic studies of HBL in children revealed that HBL is associated with a low rate of mutations, within CTNNB1 (around 80-90%), NRF2 (around 10%), and TERT1 (5%), suggesting the involvement of other pathways in HBL development [7,8]. Recent studies identified the post-translational modifications of key regulators in liver biology as additional contributors for HBL development [8,9,10]. Like in FLC, one of these modifications is the phosphorylation of b-catenin at Ser675, and subsequent oncogenic activation via the genomic regions called Cancer-Enhancing Genomic Regions, or Aggressive Liver Cancer Domains (CEGRs/ALCDs) [8,9,10]. Biliary atresia (BA), also presenting in infancy, is the most common indication for liver transplantation in the pediatric population. In this manuscript, we describe the identification of the J-PKAc in a portion of 1-3-year-old infants and children with HBL/HCN-NOS and BA and further demonstrate alterations of downstream targets of the J-PKAc-b-catenin-CEGRs/ALCDs pathway in affected samples, suggesting a wider prevalence of J-PKAc in young livers as well as a role in tumorigenesis.
2. Materials and Methods
2.1. Pediatric HBL Patients, FLC Patients, Biliary Atresia Patients and Patient-Derived Cell Lines
This work was approved by the Institutional Review Board (IRB) at CCHMC (protocol numbers 2012-3320, 2016-9497, and 2023-0451). Informed consent was obtained from each study patient, or their parents as indicated, prior to obtaining specimens. In this study, we investigated specimens from 25 HBL, 3 hepatocellular carcinoma (HCC), 3 hepatocellular neoplasm not otherwise specified (HCN-NOS), 2 FLC and 6 livers from patients with BA. Background liver regions from patients with HBL include the sections of “healthy” portions of liver taken from the same patients’ livers adjacent to the tumor section, whereas tumor sections are labelled as “hepatoblastoma” (HBL). Below is a list of HBL/HCN-NOS patients, tumors of which expressed high levels of the fusion J-PKAc protein: HBL49, HBL72, HBL74, HCN-NOS76, HBL97, HCN-NOS108, HBL111, HBL114, HBL116, HBL117, HCN-NOS77, HBL119, HBL121, HBL123. In this paper, we used specimens from FLC patients: FLC6, FLC51, FLC110 and FLCH01. Cell lines were generated from patients FLC110, HBL111 and HBL114 as described below.
2.2. Generation of Primary Cell Lines flc110 and hbl Cells
Small fragments of tumors were plated on collagen plates containing DMEM with 10% FBS. Released cells were trypsinized, sub-cultured on plates and further investigated. Experiments with primary cell lines were performed with cells from passages 3-5, during which the natural microenvironments are preserved. The hbl14 cells were treated with 1mM and 5mM of PRI-724 for 48 hours. Proteins were isolated and analyzed by Western Blot.
2.3. Examination of J-PKAc Pathways in HepG2 Cells and Huh6 Cells
HepG2 and Huh6 cells were maintained in Dulbecco’s Modified Eagle Medium (DMEM, Fisher Scientific 11-965-092) supplemented with 10% FBS and penicillin/streptomycin in a 37°C, 5% CO₂ incubator. Cells were transfected with a DNAJB1-PKAc plasmid; and protein extracts were isolated 16 hours after transfections and analyzed as described below. The DNAJB1-PKAc plasmid was from Addgene, catalogue number #100891.
2.4. Antibodies
Antibodies used include: HDAC1 (EMD Millipore Corp, clone 2E10), Sp5 (Abcam, ab36593), β-catenin (Abcam, [E247] ab32572), ph-S675-β-catenin (Cell Signaling Tech, 4176S), TCF4 (Cell Signaling, C48H11), CDK4 (Abcam, ab137675), CDK1/cdc2 (Santa Cruz, B6:sc-8395), GPC3 (LS Bio, clone SPM595), DNAJB1/HSP40 (Abcam, ab223610), PKAc-A2 (Santa Cruz, sc:28315), Anti-neurotensin (Millipore Sigma, SAB42000703), and b-actin (Santa Cruz, sc-47778). We also generated new J-PKAc fusion-specific antibodies called Fus-Abs. For immunization, we used a 13 AA peptide covering the fusion region of the protein, DRYGEE/VKEFLAK. The generation of antibodies was performed with the help of YenZymTM Antibodies, LLC company. The dilutions of antibodies in Western Blot were adjusted for each type of antibodies. The range of dilutions was from 1/5000 (b-actin) to 1/500 (Fus-Abs).
2.5. RNA-Seq Analysis of Tissues from HBL Patients
Total RNA was extracted from fresh tissues using the Trizol/chloroform extraction. RNA-Seq was performed by the CCHMC DNA Sequencing and Genotyping Core. Analyses were performed on two paired-end samples using raw (>15 Gb) and trimmed data (>12 Gb), and the Q30 percentages of raw and trimmed data were >90% and >95%, respectively. Data were processed using kallisto (Pachter Lab), which accurately and rapidly assigns reads to genomic locations using pseudoalignment, with transcripts per million (TPM) as output. All reasonably expressed transcripts (TPM>3 in >20% of samples) were included in statistical analyses, which included moderated t-tests with significance defined as p<0.05 and fold change >2. We have made a comparison of the genes which are differentially expressed in fusion-negative and fusion-positive HBL/HCN-NOS. Supplemental tables 1, 2 and 3 show individual genes with altered expression in fusion-positive HBL/HCN-NOS compared to backgrounds and to fusion-negative HBLs.
2.6. Real-Time Quantitative Reverse Transcriptase-PCR
RNA was isolated by the TRIzol/chloroform extraction method and used for cDNA synthesis. cDNA was synthesized by using 2μg of RNA applying the High-Capacity RNA-to-cDNA kit (Applied Biosystems, 4387406). QRT-PCR was performed in duplicate using TaqMan probes and TaqMan Gene Expression Master Mix (Applied Biosystems, 4369016) and analyzed by the delta-delta CT method. mRNA levels were quantified using GraphPad Prism 9.5 software. TaqMan probes used included: CDK1, CDK4, HRG, AKAP12, AKAP13, Col2A1, Col1A1, C6, C7, C8a, C8b, C9, FCN3, MBL2, Cyp2B6, Cyp3A4, Cyp2A1, Cyp2C8, SLC10A1, SLC25A47, SLC22A1, HDAC1, Sp5, DLK1, AFP, HMGA2, TNFRSF19, RBFOX3, SRCAP, NTS, Col4A1, FAP, MYCN, and SLC22A7.
2.7. Protein Isolation and Western Blotting
Whole Cell Extracts (WCEs) were isolated and Western Blot was performed as described previously5,11. 30-50 mg of protein was loaded on the gels. Protein levels were quantitated as ratios to b-actin using ImageJ software.
2.8. Statistical Analysis
All continuous values are presented as mean + SEM using GraphPad Prism 9.5. Where indicated, Student’s t-tests and One-Way ANOVA analyses were used. p value <0.05 was considered significant.
3. Results
3.1. Identification of the J-PKAc Fusion Kinase in Pediatric Liver Cancers
We have previously found that b-catenin is phosphorylated at Ser675 in HBL patients [10]. Since PKAc phosphorylates b-catenin at Ser675 [4], we studied HBL samples using Western Blots with Abs to the C-terminus of PKAc. We found that a large group of our HBL samples (from children 1–3 years old) expressed an immunoreactive band which has electrophoretic mobility like the J-PKAc fusion kinase. Figure 1A demonstrates our first case, where we observed the J-PKAc kinase (HBL72). Background sections of the liver from this patient contained native PKAc, and weak signals for J-PKAc kinase. However, the tumor section revealed a strong band for J-PKAc. To confirm the expression of J-PKAc, QRT-PCR was done with primers that detect the fusion kinase mRNA. Figure 1A (bottom) shows that the tumor section of HBL72 expresses mRNA coding for the J-PKAc compared to another sample (HBL107). Additional pediatric liver cancer samples (8 HBL samples and 3 HCC samples) collected at CCHMC were analyzed. 3 HBL samples were identified as having strong J-PKAc signals; weaker, but detectable J-PKAc signals were identified in additional HBL samples (Figure 1B, top). For further mechanistic studies, we focused on HBL specimens with high levels of J-PKAc. QRT-PCR with specific primers showed that HBL patients with strong signals for J-PKAc protein also expressed the fusion transcript (Figure 1B, bottom). Note that, in some cases, we did not detect the fusion transcript, but the fusion protein was well detected. Examination of pediatric HCC & HCN-NOS samples identified high levels of J-PKAc in case HCN-NOS77, while cases HCC84 and HCC107 did not show detectable J-PKAc (Figure 1B). To confirm that the immunoreactive protein (49kD) is the fusion J-PKAc kinase, we generated antibodies that specifically interact with the amino acid sequence containing the fusion part of J-PKAc. Figure 1C shows a sequence of the peptide covering this region, DRYGEE/VKEFLAK, which was used for immunization. The specificity of these fusion-specific antibodies (further called Fus-Abs) were confirmed by several tests. Western Blot with protein extracts from FLC liver tumor and lung metastasis confirmed that the Fus-Abs specifically recognize the fusion protein and do not interact with the native PKAc kinase (Figure 1C). Re-probing the same membrane with antibodies to the PKAc revealed strong native PKAc signals, establishing that the Fus-Abs do not interact with the native kinase. No interactions of Fus-Abs with native DNAJB1 were found. FLC tumor tissues from FLC51, FLC110, and FLC6 were stained with Fus-Abs, and found that they specifically stain cells expressing the fusion kinase (Figure 1D). We found that the J-PKAc is localized in cytoplasm, in cell membranes and in nuclei. Using these antibodies, Western Blots were done with proteins isolated from HBL samples that were positive for J-PKAc in the Western Blot for native PKAc. Figure 1E shows that examined HBL tumors expressed the J-PKAc fusion kinase. Since the Fus-Abs only interact with the amino acid sequence containing the fusion region of J-PKAc, this data confirms that the detected protein is the result of fusion of DNAJB1 and PKAc genes. Immunohistochemistry of the fusion-positive HCN-NOS108 and HBL114 samples found strong signals of the fusion kinase (Figure 1F). Note that like in FLC samples, the fusion kinase is observed in nuclei and in the membranes of the fusion-expressing cells. Thus, several approaches identified HBL/HCN-NOS samples with varying levels of the J-PKAc. We further focused our studies on molecular and cellular differences between HBL/HCN-NOS patients with strong expression of J-PKAc (further called fusion-positive pediatric liver cancer) and patients with no or very weak expression of the J-PKAc (further called fusion-negative pediatric liver cancers). The list of the fusion positive HBL/HCN-NOS samples is shown in Materials and Methods. Note that we analyzed 3 HCN-NOS patients (HCN-NOS76, HCN-NOS77 and HCN-NOS108) and found that all three were fusion-positive.
3.2. RNA-Seq Analysis Showed that J-PKAc-Negative HBL Cells Have High Levels of Complement Cascade and Membrane Attack Complex, While These Pathways Are Reduced in J-PKAc-Positive HBL/HCN-NOS
RNA-seq analysis was done to determine signaling pathways that support cells expressing the fusion J-PKAc in J-PKAc-positive HBL/HCN-NOS, and pathways in J-PKAc-negative HBLs. Liver samples from 3 background sections, 3 tumors of fusion-negative HBL and 5 tumors of fusion-positive HBL/HCN were studied. We focused on pathways upregulated in fusion-negative HBLs and pathways downregulated in fusion-positive HBLs relative to the background because these pathways showed the largest differences. The group of altered genes contains genes of the complement cascade, including those that initiate the mannose-binding lectin complement pathway and Membrane Attack Complex (MAC), suggesting that the membranes of fusion-positive cells might be under MAC influence (Figure 2A, B). Therefore, we examined the cellular membranes’ integrity in the J-PKAc-positive cells in FLC samples and in HBL samples with high levels of the fusion protein. In fusion-positive HBL/HCN-NOS, the membranes were intact likely due to reduction of the complement cascade/MAC (Figure 2C). However, in FLC patients, the membranes were damaged or destroyed in a portion of cells with strong J-PKAc signals (Figure 2D, red open arrows). This data suggests that, in FLC patients, a portion of the J-PKAc-expressing cells might be targeted by MAC and, as a result, they are experiencing membrane disintegration, but the membranes in the remaining FLC cells are not affected due to low levels of MAC. Therefore, we suggest that down-regulation of the complement cascade and MAC might permit the expansion of J-PKAc-expressing cells in fusion-positive HBL/HCN-NOS patients (Figure 2E).
3.3. The Cell Line flc110 Derived from Fibrolamellar HCC Patient Contains Cells with Disintegrated Fusion-Positive Membrane
To further investigate membrane integrity of fusion- expressing cells, we generated a cell line from fresh tumor specimen of a FLC110 patient who expressed the fusion oncoprotein detected by immunostaining (Figure 2D). Western blot analysis with three types of antibodies using background (non-tumor) and tumor sections of FLC110 patient confirmed that the J-PKAc is detected in tumor sections, while native PKAc kinase is observed in background (non-tumor) and in tumor sections (Figure 3A). QRT-PCR with specific primers to the fusion transcript detected the fusion transcript in tumor of FLC110 patient (Figure 3B). To generate flc110 cell line, we plated a segment of the FLC110 tumor tissue on collagen plate and monitored the exit of cancer cells from the tumor. Figure 3C (exit) shows examples of the cell exit from the FLC110 tumor. Note that, in some cases, we observed the exit of cell clusters. Once the exiting cells reached 70-80% confluence, cells (further called flc110) were trypsinized and propagated in culture for several passages. Figure 3C (right) shows images of flc110 cells after 1st and 2nd passages. While the 1st passage revealed the individual cells, the second passage of flc110 cells showed the formation of elongated structures, in which cells display strong cell-to-cell interactions. Western Blot analysis with fusion-specific Abs and with Abs to PKAc showed that the generated fcl110 cells express the J-PKAc (Figure 3D). For examination of the membrane integrity of the flc110 cells, we analyzed the cells of the first passage since they are closer to the natural environment of HBL110 tumors. Staining of flc110 cells with the Fus-Abs confirmed expression of the J-PKAc. Figure 3E shows examples of immunostaining of flc110 cells on day one and day 6 after plating. We found the fusion J-PKAc positive signals in membranes, cytoplasm and nuclei of the flc110 cells (Figure 3F). Some fusion positive flc110 cells were characterized by cell damage and destruction of the membranes. Some flc110 cells were nuclei-free (Figure 3F). These findings agree with those described in original liver tumors of FLC110 patient (Figure 2D). Together, these studies support the hypothesis that J-PKAc is in nuclei, and in cytoplasm and membranes. Cellular membranes in a portion of the fusion-expressing cells undergo destruction and cell damage.
3.4. J-PKAc Fusion-Positive HBL/HCN-NOS Tumors Have Increased Activation of Cancer-Related Pathways Compared to Fusion-Negative HBLs
We next looked at the differences in gene expression between J-PKAc positive and negative HBLs (Figure 4A). The heatmap shows the elevation of pathways in fusion-positive HBL/HCN-NOS relative to fusion-negative HBLs, but the most notable differences were observed in pathways that are downregulated in fusion-positive HBL/HCN-NOS specimens (Figure 4B). We found that fusion-positive HBL/HCN-NOS have higher levels of genes involved in the progression from the G1 to the S phase, the docking of the mature histone mRNA complex TAP at nuclear pore complexes (NPC), NOTCH2 signaling, tRNA processing and transcription factor TFTC complex (Figure 4C and D). The higher activation of the NOTCH2 pathway in fusion-positive HBLs is likely to further promote the progression of HBL since NOTCH2 elevation is associated with liver cancer [11]. NOTCH2 also promotes the development of liver cancer in mouse models [12]. Increased docking of TAP at NPCs suggests that this pathway is involved in the increase of translocation of replication-dependent histone mRNAs, which are 3-5 folds increased before entry of proliferating cells into S-phase [13,14]. tRNA processing was also found to be an essential part of tumor progression [15].
3.5. J-PKAc Increases Expression of Cell Cycle Genes and Reduces Levels of Tumor Suppressors
We further investigated the expression of genes which promote liver proliferation as well as expression of tumor suppressors. QRT-PCR studies showed that two key drivers of liver proliferation cdk1 (cdc2) and cdk4 are increased to a higher degree in fusion-positive HBL/HCN-NOS relative to fusion-negative HBLs (Figure 4E). We identified mRNAs of over 64 tumor suppressors which are dramatically (from -100 to -6-fold) down-regulated in fusion-positive HBL/HCN-NOS compared to fusion negative HBL. The list of 25 downregulated genes ranging from -96 to -8.6-fold reduction is shown in Figure 4F (left). The remaining down-regulated tumor suppressors can be found in Supplemental Table 3. Among these tumor suppressors is histidine rich glycoprotein (HRG), which suppresses HCC via inhibition of proliferation and increasing apoptosis [16,17]. Among others, Ficolin 3 (FCN3), which inhibits the progression of HCC by suppressing blockage of the p53 pathway and inhibits lung adenocarcinoma [18], and the tumor suppressor TMPRSS2, which inhibits lung adenocarcinoma [19]. SOCS2 has been identified as a strong inhibitor of tumor metastases in HCC [20]. QRT-PCR confirmed the reduction of HRG and FCN3 in fusion-positive HBLs relative to fusion-negative HBLs, as well as in FLC samples (Figure 3F). Interestingly, although HRG is reduced in most HBL/HCN-NOS specimens of our biobank (n=40), the patients with the highest reduction of HRG are positive for J-PKAc (Figure 4F). Another downregulated tumor suppressor is the E3 ligase NEURL3, which suppresses epithelial-mesenchymal transition and metastasis in nasopharyngeal carcinoma [21]. Among other downregulated tumor suppressors, we found CNTFR, which inhibits tumor growth in xenograft models [22]; Orphan Nuclear Receptor (NROB2), which suppresses tumorigenesis in mouse models by modulating expression of cyclin D1 [23]; TRIM15, which inhibits tumor cell invasion [24]; Decorin (DCN), which displays anti-tumor activities in breast cancer [25]; Alcohol Dehydrogenases 1c and 4, which inhibit growth, migration, invasion, and colony formation in CRC cancer [26]; secreted phosphoprotein 2 (SPP2) which inhibits liver regeneration [27]. Figure 4F shows reduction of other genes with anti-tumor activities. Given this substantial number of down-regulated tumor suppressors and elevation of cdk1 and cdk4, we conclude that fusion-positive HBL/HCN-NOS have more severe liver cancers relative to fusion-negative HBLs.
3.6. Fusion-Positive HBL/HCN-NOS Patients Display Fibrolamellar-Specific Characteristics Including Fibrotic Lamellar-Like Structures
We next examined the potential FLC-specific alterations in HBL/HCN-NOS patients with high levels of J-PKAc. Examination of FLC-specific genes AKAP12 and AKAP13 showed that corresponding mRNAs were higher in fusion-positive HBL/HCN-NOS compared to fusion-negative HBLs (Figure 5A). In FLC patients, J-PKAc promotes fibrosis and the formation of fibrolamellar structures [1]. Our RNA-Seq analysis identified elevation of the fibrotic markers Col2A1 (41-fold) and Col1A1 (7.7-fold) in J-PKAc-positive HBL/HCN-NOS. QRT-PCR confirmed that these genes are more highly expressed in fusion-positive HBL/HCN-NOS relative to fusion-negative HBLs (Figure 5A). We next examined the liver histopathology of fusion-positive tumors. H&E staining showed that fusion-positive HBLs had fibrotic structures that looked identical to the lamellar structures observed in FLC samples. Figure 5B shows typical images of lamellar-like structures in J-PKAc-positive cases HBL72, HBL97, HBL111, HBL115, HBL116, HCN-NOS76, and HCN-NOS77. These structures were not observed in fusion-negative HBLs and in HBL/HCN-NOS with low levels of the fusion kinase such as HBL83, HCC84, HBL107, and HBL98 (Figure 5B). We next performed staining of the fusion-positive and fusion negative HBL/HCN-NOS with a marker of fibrosis Sirius Red. These studies showed that fusion-negative HBLs and background regions of fusion-positive HBLs/HCN-NOSs have low levels of fibrosis; however, fusion-positive HBLs have a dramatic increase of the Sirius Red staining, located in the lamellar-like structures (Figure 5C). Thus, these studies revealed that the fusion-positive HBL/HCN-NOS patients display fibrolamellar-specific characteristics including elevation of AKAP12 and AKAP13, elevation of markers of fibrosis and formation of fibrotic lamellar-like structures.
3.7. Members of the Complement Cascade and MAC Are Downregulated in J-PKAc-Positive HBL/HCN-NOS, in Tumors of FLC Patients and in Hepatoblastoma Cells with Ectopic Expression of the J-PKAc
Since RNA-Seq-based examination of down-regulated pathways in fusion-positive HBLs/HCN-NOSs identified a dramatic reduction of the Complement Cascade and MAC (Figure 4D), we have performed a careful analysis of these pathways using additional approaches and biological systems. Figure 6A shows the list of the complement cascade and Membrane Attack Complex (MAC) which are reduced in fusion-positive HBL/HCN-NOS. Since the MAC consists of C6, C7, Ca, C8b and C9 proteins, we examined the levels of their corresponding mRNAs and the mRNA levels of genes coding for complement cascade initiators Ficolin 3 (FCN3) and MBL2, which, once activated, trigger the formation of the MAC on the surfaces of the foreign membranes. Levels of these mRNAs are lower in fusion-positive HBL/HCN-NOS than in fusion-negative HBLs (Figure 6A, middle). Examination of a large cohort of HBL patients showed that FCN3 is reduced almost in all HBL, but the highest level of reduction is observed in fusion-positive HBL/HCN-NOS (Figure 6A, right).
We next asked if the J-PKAc might cause downregulation of the members of the complement cascade or MAC. The HBL cell-line, Huh6, was transfected with a plasmid expressing J-PKAc, and levels of mRNA coding for FCN3, MBL2, and MAC members were determined. Figure 6B shows that the ectopic expression of J-PKAc repressed expression of FCN3, MBL2, and MAC members, suggesting that similar repression might take place in fusion-positive HBLs. To further examine the role of J-PKAc in reduction of expression of MAC members and in expansion of fusion-expressing cells, we examined mRNAs of MAC members, FCN3, and MBL2 in tumors of five patients with FLC. Figure 6C shows that FLC patients have lower levels of FCN3, MBL2, and low levels of members of the MAC compared to non-tumor sections that do not express the fusion kinase.
3.8. Alterations of Gene Expression Identified in Fusion-Positive HBLs/HCN-NOS Are Observed in Patients with Fibrolamellar HCC
To further examine if overexpression of J-PKAc in liver tumors represses CYP and SLC proteins, we examined RNA-Seq data of tumor sections of 5 FLC patients’ tumors and adjacent liver regions as well as in HBL samples. We confirmed that fusion kinase expression was present in our biobank of FLC samples with our fusion-specific antibodies (Figure 7A). RNA-Seq results identified that seven CYP genes and seven SLC genes were downregulated in FLC tumors, compared to non-tumor sections (Figure 7B). Seven analyzed mRNAs, including CYP3A4, CYP2C8, CYP4A11, SLC25A47, SLC22A1 SLC38A3 and SLC10A1, were also downregulated in fusion-positive HBL samples relative to fusion-negative HBL samples. QRT-PCR further confirmed that low levels of these mRNAs were present in FLC samples. Figure 7B shows the reduction of mRNAs for CYP3A4 and SLC22A1. Since the reduction of expression for the CYP and SLC families is mediated by HDAC1-Sp5 complexes [28], we examined this pathway in our FLC samples and found the elevation of HDAC1 and Sp5 in tumor sections (Figure 7C). Consistent with data for fusion-positive HBLs, QRT-PCR also showed an elevation of cdk1, cdk4, and Col1A1 in FLC tumors (Figure 7D).
3.9. J-PKAc Enhances Expression of CEGRs/ALCDs-Dependent Genes in HBL/HCN-NOS Patients
J-PKAc phosphorylates b-catenin at Ser675 and activates CEGRs/ALCDs-containing oncogenes [6,10], therefore we examined this pathway in fusion-positive and fusion-negative HBLs. Ph-S675-β-catenin protein levels were analyzed by Western Blot, revealing that the level of phosphorylation of b-catenin at Ser675 is higher in J-PKAc positive HBL/HCN-NOS (Figure 7E, Western Blot). Note that a portion of b-catenin is also phosphorylated in fusion-negative HBLs, suggesting that the CEGRs/ALCDs-dependent downstream targets are also increased to some degree in these samples. With QRT-PCR, we found that stem cell markers DLK1 and AFP are higher in fusion-positive HBL/HCN-NOS, while levels of OCT4 and Thy1 are identical (data not shown). Examination of CEGRs/ALCDs-dependent oncogenes [9,10] showed higher levels of HMGA2, TNFRSF19, NeuN, and SRCAP in fusion positive HBL/HCN-NOS compared to fusion negative HBLs (Figure 7F).
3.10. Ectopic Expression of J-PKAc in Hepatoblastoma Cell Lines HepG2 and Huh6 Enhances ph-S675-b-Catenin and HDAC1-Sp5 Pathways Leading to Alterations Like Those Observed in Fusion-Positive HBLs/HCN-NOSs
To examine if J-PKAc causes alterations in gene expression that are found in J-PKAc-positive HBLs, we transfected HepG2 and Huh6 cells with a plasmid that expresses the fusion J-PKAc and examined the levels of downstream targets. Figures 8A and B show that cells transfected with the J-PKAc plasmid express high levels of the fusion kinase, and that phosphorylation of b-catenin at Ser675 is higher in cells expressing the fusion kinase. Analysis of HDAC1-Sp5 and CERGs/ALCDs-dependent targets in the J-PKAc-transfected Huh6 and HepG2 cells showed upregulation of HDAC1, Sp5 and the CEGRs/ALCDs-dependent genes neurotensin (NTS), a marker of neurons, and Col4A1, a marker of fibrosis (Figure 8C). We next examined expression of the FLC-specific genes AKAP12 and AKAP13 and the cell proliferation markers cdk1 and cdk4, finding that AKAP12 and AKAP13 are increased in both HepG2 and Huh6 cells transfected with the fusion kinase. cdk1 and cdk4, as well as the biomarkers fibroblast activation protein 1 (FAP) and N-myc, were also increased in cells expressing the fusion kinase (Figure 8C).
Since the efficiency of transfection was around 30%, we next examined the J-PKAc-dependent HDAC1-Sp5 pathway in transfected cells by staining cells with fusion-J-PKAc and HDAC1. Figure 8D and E show that transfected HepG2 and Huh6 cells (in green) have strong HDAC1 expression (red). Fus-Abs-HDAC1/DAPI merge images revealed that the Co-staining is observed in nuclei and in cytoplasm. Since HDAC1 represses the transcription of CYP and SLC genes, we looked at the expression of CYP and SLC genes by QRT-PCR, finding that CYP3A4, CYP2C8, SLC22A7 and SLC22A1 are repressed by the overexpression fusion kinase. We next asked if J-PKAc might be responsible for HRG downregulation observed in the fusion-positive HBLs. QRT-PCR revealed that HRG is dramatically repressed by the fusion J-PKAC kinase in both HepG2 and Huh6 cells (Figure 8F). Thus, the studies reveal the causal role of J-PKAc in enhancing the b-catenin-TCF4-CEGRs/ALCDs pathway and expression of its downstream targets, as well as the causal role of J-PKAc in HDAC1-Sp5-dependent downregulation of CYP and SLC family members and HRG.
3.11. The Cell Line hbl114, Derived from J-PKAc-Positive HBL114, Displays Characteristics of the FLC-Specific Cell Line flc110
To further investigate the role of J-PKAc in HBL, we generated two cell lines from fusion-positive HBL samples, HBL111 and HBL114 (hbl111 and hbl114). Figure 9A shows that the fusion J-PKAc kinase was expressed in original tumors of HBL111 and HBL114 patients, although HBL111 contained lower levels of the fusion kinase. For generation of patient-derived cell lines, we have utilized a recently established “cell free-exit” protocol [29]. Small sections of liver tumors of HBL111 and HBL114 were placed on collagen plates (Figure 9B). In 1-2 weeks, the cells were released into the media and then attached to the plates. Cells were trypsinized and further maintained in culture for several passages. Western blots with PKAc and fusion-specific antibodies revealed that the fusion kinase was detected in the hbl114 line but was not observed in the hbl111 cell line (Figure 9B). To further confirm the expression of the fusion kinase in hbl114 cells, the cells were stained with fusion-specific Abs. These studies confirmed that hbl14 have fusion-positive cells (Figure 9C). We note that the hbl114 cell line is heterogeneous and contained large cells and small cels. These studies also showed that the J-PKAc fusion kinase is in the membranes of fusion-positive cells, some of them displayed mitotic figures (Figure 9C). We next compared the proliferation of fibrolamellar-derived flc110 and HBL-fusion positive hbl114 and fusion-negative hbl111 cells 2-3 weeks after plating. Bright-field microscopy showed that, in agreement with our previous observations [29], the fusion-negative hbl111 cells formed tumor clusters with well-organized centers; while the fusion-kinase expressing flc110 and hbl114 lines formed elongated structures that are similar in organization to the lamellar structures in FLC patients (Figure 9D). The staining of flc110 and hbl114 with fusion-specific Abs after 2-3 weeks in culture showed that these cell lines formed fusion-positive elongated structures that appear like lamellar structures (Figure 9E). We have previously found that the inhibition of b-catenin reduces expression of the J-PKAc [5]. Therefore, we asked if the elimination of the J-PKAc protein might affect formation of lamellar-like structures. Following treatment with DMSO and with two doses of the inhibitor of b-catenin PRI-724, we examined the expression of the fusion kinase in hbl114 cells. Figure 9F shows that the PRI-724 dramatically reduces levels of the fusion kinase. The PRI-724-mediated elimination of the fusion kinase blocked formation of lamellar-like structures, and the cells stay as individual cells (Figure 9F bottom). These studies demonstrated that the expression of the J-PKAc fusion kinase in HBL cells causes formation of lamellar-like structures.
3.12. Livers from Young Patients with Biliary Atresia (BA) Express J-PKAc and Have Transcriptome Profiling which Suggests a Risk for Development of Liver Cancer
The age of examined J-PKAc-positive patients with HBL ranged from 1 to 3 years old. We asked if the J-PKAc fusion kinase might be observed in livers from children of this age who do not have liver cancer. We have received 6 liver samples from BA patients. Figure 10A shows the main characteristics of these BA patients. It is interesting that our further studies revealed that the fusion- positive BA patients (2, 4, and 5) have slightly higher levels of AST and ALT than fusion negative BA. We first examined the expression of fusion kinase by Western blot using antibodies to native PKAc, DNAJB1 and Fus-Abs. 3 samples (2, 4 and 5) were found to have J-PKAc expression, while the other 3 did not express detectable amounts of J-PKAc (Figure 10B). The proteins involved in the ph-S675-b-catenin-TCF4 pathway and its downstream targets GPC3, Thy1, cdk1, and NTS are elevated in J-PKAc-positive BA livers (Figure 10B). QRT-PCR showed that the FLC-specific genes Col1A1, Col4A1, AKAP12 and AKAP1 were also upregulated in fusion-positive BAs (Figure 10C). Expression of genes involved in liver proliferation cdk1, cdk4, FAP and NTS is also increased in J-PKAc-positive BA samples compared to fusion-negative BA samples (Figure 10D).
3.13. Further Defining the Prevalence of J-PKAc in Pediatric Livers
We have recently obtained specimens from six additional HBL patients and asked if these tumors might express J-PKAc. Western Blot with antibodies to native kinase and with Fus-Abs showed that the J-PKAc was detectable in these patients (Figure 10E). In summary, the age of examined children (HBL plus BA; n=31) was 1-3 years old. The J-PKAc kinase was found in twenty-six samples, showing that around 70% of examined young children had the FLC-specific fusion J-PKAc in liver-derived tissue samples. However, the development of FLC in adolescent humans is rare and is observed only in adolescent patients. Therefore, we propose that the appearance of the J-PKAc is not rare, and a considerable number of young children (1-3 years) have varying amounts of J-PKAc-expressing cells in the liver (Figure 10F). Given the elevated levels of MAC in fusion-negative HBLs, we further propose that, in these HBLs, the fusion expressing cells are eliminated by the complement cascade and/or MAC at later ages. In rare cases, this elimination does not occur due to the decreased expression of complement cascade components or due to the lack of activation of MAC, leading to the development of FLC.
4. Discussion
Although previous reports have observed J-PKAc predominantly in FLC patients, we found many samples in our liver tissue biobank that expressed the J-PKAc fusion kinase. This observation raised several questions regarding the mechanisms behind FLC and HBL. One of these critical findings is that the complement cascade and MAC are highly elevated in fusion-negative HBL samples but are dramatically reduced in fusion-positive HBL/HCN-NOS. Of these components, MBL2 and FCN3 are some of the mannose-binding lectin pathways complement initiators that bind to antigens on the cell membrane of cancer cells or cells initiating activation of the complement cascade [30]. Although interactions of cancer cells with MAC components are complicated [31], we hypothesize that one of these ligands or antigens that bind to complement initiators is the fusion J-PKAc, or a membrane protein altered by the J-PKAc. The complement cascade terminates cells in three main mechanisms: membrane disruption via the MAC complex, opsonization of the foreign cell to attract macrophages, and the release of anaphylatoxins to recruit other immune cells [31,32]. Several reports showed that the activation of complement leads to insertion of MAC complexes into the membranes of cancer cells, causing intracellular damage and disruption of these membranes [33]. In agreement with these reports, FLC patients have damaged J-PKAc-positive membranes and destroyed J-PKAc positive cells (Figure 2D and Figure 3F). These observations suggest a working hypothesis that, in fusion-negative HBLs, the fusion expressing cells were eliminated by the activated complement cascade (see Figure 10F). Although other reports showed that overexpression of CD55 and CD59 protected cells from attack by MAC [34], this mechanism is unlikely in HBL/HCN-NOS patients since we did not find differences in expression of CD55 and CD59. A crucial difference in our work compared to previous studies is that the J-PKAc was previously investigated in adolescent and adult patients, while we detected the J-PKAc protein in around 70% of our samples collected from 1–3-year-old patients. Therefore, data suggests that the J-PKAc fusion is frequently created in the livers of young children when the liver is still in its proliferative phase. A favorable outcome in most patients at adolescent age suggests the successful elimination of the J-PKAc fusion-expressing cells, perhaps via complement-mediated immunity, and the rare development of FLC occurs in patients whose immune systems failed to eliminate these cells (Figure 10F). In support of our hypothesis, transcriptomic characterization of 27 specimens from patients with FLC identified a reduction of expression of 22 genes coding for complement cascade/MAC and genes coding for proteins that increase activity of the complement cascade/MAC [35]. It is interesting that an additional examination of an FLC patient found the reduction of components of MAC C8B, CFP, C9 and the regulator FCN2 [36].
A second critical question regarding the expression of J-PKAc in HBL/HCN-NOS patients’ tumors was whether J-PKAc enhances oncogenic and cancer-related pathways in HBL/HCN-NOS and if J-PKAc brings FLC-specific alterations to HBL/HCN-NOS. A summary of these studies is presented in Figure 10G. We found that J-PKAc-positive HBLs/HCN-NOSs tumors have increased PKAc-ph-S675-b-catenin/CEGRs/ALCDs axis. RNA-Seq analysis showed that the rate of proliferation, fibrosis, and expression of FLC-specific genes are indeed higher in fusion-positive HBLs with elevated ph-S675-b-catenin-CEGRs/ALCDs pathway. The J-PKAc plays a critical role in the regulation of these pathways since they are also increased in tissue culture systems with overexpression of J-PKAc. Although the fusion-positive BA patients did not have liver cancer, the patterns of gene expression suggest that, permitted to propagate longer term, such livers have a theoretical risk for the development of liver cancer. Future studies including liver biopsies from infants with BA at diagnosis are needed to investigate whether persistent hepatic expression J-PKAc in the liver is linked to rapid fibrosis progression in BA requiring liver transplantation. We have previously found that HBL patients have an elevated ph-S675-b-catenin pathway [10], which increases expression of HDAC1 and Sp5, leading to the repression of two families of proteins: Cytochromes (CYP) and Solute Carrier (SLC) transporters [28]. In the current manuscript, we found that J-PKAc enhances the repression of these HDAC1-Sp5-dependent targets in fusion-positive HBL/HCN-NOS, in HepG2 and Huh6 cells, and these targets are also repressed in FLC patients. Our examination of the fusion-transfected hepatoblastoma cell lines HepG2 and Huh6 suggests a causal relationship between the expression of J-PKAc and the enhanced HDAC1-dependent repression of CYP and SLC proteins. In agreement with these data, the previous report described down-regulation of CYP family and SLC family genes in 27 specimens, derived from FLC patients [35]. Further investigations aim to expand our understanding of J-PKAc in FLC and HBL/HCN-NOS and to define related biological targets amenable to expanding diagnostics and therapeutic development.
5. Conclusions
Identification of the oncogenic fusion J-PKAc kinase in livers of very young children and the reduction of complement cascade/MAC provides understanding of the development of fibrolamellar hepatocellular carcinoma. In young kids with fusion-containing hepatoblastoma, the J-PKAc worsens cancer by activation of fibrosis, liver proliferation and by massive repression of tumor suppressors.
Author contribution: YF generated the design, performed investigations of the specimens from HBL/HCN-NOS and FLC patients, was involved in discussion of data for the manuscript and in writing the manuscript. RG performed experiments with HBL specimens, analyzed data, and participated in writing the manuscript. KJ has performed staining of hbl and flc cells with Abs to the fusion protein. JG, GT, and AB participated in the surgeries, collection of specimens, and generation of design for cell treatments and in interpretation of results. RK has performed biostatistical analysis of RNA-Seq data and was involved in interpretation of data and preparation of the manuscript. LT has generated hbl and flc cell lines, generated the design for treatments of cells with inhibitor of b-catenin PRI-724, cell propagation and analysis of the results. NT has generated overall design for the project, performed a portion of molecular studies of HBL/HCN-NOS and FLC patients. He has written the manuscript and obtained funds for the studies. All authors have read and agreed to the submitted version of the manuscript.
Funding
The work was supported by internal funds from the Division of Pediatric Surgery, CCHMC, by NIH R01 CA278834 (NT), by R01095001 (AGM) and by funds from Grace Foundation. We thank NIH P30 DK078392 of the Digestive Diseases Research Core Center in Cincinnati Children Hospital for the support of these studies.
Informed Consent Statement
This work was approved by the Institutional Review Board (IRB) at CCHMC (protocol numbers 2012-3320, 2016-9497, and 2023-0451. Informed consent was obtained from all subjects involved in the study.
Data Availability Statement
The manuscript contains RNA-Seq analysis, which is available in supplemental tables 1, 2 and 3.
Acknowledgments
We thank NIH P30 DK078392 of the Digestive Diseases Research Core Center in Cincinnati for the support of these studies.
Conflicts of Interest
The authors declare no conflicts of interest.
References
- Alshareefy Y, Shen CY, Prekash RJ. Exploring the molecular pathogenesis, diagnosis and treatment of fibrolamellar hepatocellular carcinoma: A state of art review of the current literature. Pathol Res Pract. 2023 Aug;248:154655.
- Lalazar G, Simon SM. Fibrolamellar Carcinoma: Recent Advances and Unresolved Questions on the Molecular Mechanisms. Semin Liver Dis. 2018 Feb;38(1):51-59.
- Honeyman JN, Simon EP, Robine N, Chiaroni-Clarke R, Darcy DG, Lim II, Gleason CE, Murphy JM, Rosenberg BR, Teegan L, Takacs CN, Botero S, Belote R, Germer S, Emde AK, Vacic V, Bhanot U, LaQuaglia MP, Simon SM. Detection of a recurrent DNAJB1-PRKACA chimeric transcript in fibrolamellar hepatocellular carcinoma. Science. 2014 Feb 28;343(6174):1010-4.
- Kastenhuber ER, Lalazar G, Houlihan SL, Tschaharganeh DF, Baslan T, Chen CC, Requena D, Tian S, Bosbach B, Wilkinson JE, Simon SM, Lowe SW. DNAJB1-PRKACA fusion kinase interacts with β-catenin and the liver regenerative response to drive fibrolamellar hepatocellular carcinoma. Proc Natl Acad Sci U S A. 2017 (50):13076-13084.
- Gulati R, Johnston M, Rivas M, Cast A, Kumbaji M, Hanlon M, Lee S, Zhou P, Lake Ch, Scheper E, Min KW, Yoon JH, Karns R, Reid LM, Lopez-Terrada D, Timchenko LT, Parameswaran S, Weirauch MT, Ranganathan S, Bondoc A, Geller J, Tiao G, Shin S, Timchenko NA. β-catenin cancer-enhancing genomic regions axis is involved in the development of fibrolamellar hepatocellular carcinoma. Hepatol Commun. 2022 6(10):2950-2963.
- Vyas M, Hechtman JF, Zhang Y, Benayed R, Yavas A, Askan G, Shia J, Klimstra DS, Basturk O. DNAJB1-PRKACA fusions occur in oncocytic pancreatic and biliary neoplasms and are not specific for fibrolamellar hepatocellular carcinoma. Mod Pathol. 2020 (4):648-656.
- Ranganathan S, Lopez-Terrada D, Alaggio R. Hepatoblastoma and Pediatric Hepatocellular Carcinoma: An Update. Pediatr Dev Pathol. 2019 Sep 25:1093526619875228.
- Johnston M, and Timchenko NA. Molecular Signatures of Aggressive Pediatric Liver Cancer. Archives of Stem Cell and Therapy, 2021, 2(1):1-4.
- Johnston ME 2nd, Rivas MP, Nicolle D Gorse A, Gulati R, Kumbaji M, Weirauch MT, Bondoc A, Cairo S, Geller J, Tiao G, Timchenko N. Olaparib Inhibits Tumor Growth of Hepatoblastoma in Patient Derived Xenograft Models. Hepatology. 2021 May 26.
- Gulati R, Hanlon MA, Lutz M, Quitmeyer T, Geller J, Tiao G, Timchenko L, Timchenko NA. Phosphorylation-Mediated Activation of b-Catenin-TCF4-CEGRs/ALCDs Pathway Is an Essential Event in Development of Aggressive Hepatoblastoma. Cancers 2023, 14, 6065.
- Huang G, Jiang H, Lin Y, Wu Y, Cai W, Shi B, Luo Y, Jian Z, Zhou X. lncAKHE enhances cell growth and migration in hepatocellular carcinoma via activation of NOTCH2 signaling. Cell Death Dis. 2018, 9(5):487.
- Wu WR, Zhang R, Shi XD, Yi C, Xu LB, Liu C. Notch2 is a crucial regulator of self-renewal and tumorigenicity in human hepatocellular carcinoma cells. Oncol Rep. 2016, 36(1):181-8.
- Fang S, Liu M, Li L, Zhang FF, Li Y, Yan Q, Cui YZ, Zhu YH, Yuan YF, Guan XY. Lymphoid enhancer-binding factor-1 promotes stemness and poor differentiation of hepatocellular carcinoma by directly activating the NOTCH pathway. Oncogene. 2019, 38(21):4061-4074.
- Yoo Y, Park SY, Jo EB, Choi M, Lee KW, Hong D, Lee S, Lee CR, Lee Y, Um JY, Park JB, Seo SW, Choi YL, Kim S, Lee SG, Choi M. Overexpression of Replication-Dependent Histone Signifies a Subset of Dedifferentiated Liposarcoma with Increased Aggressiveness Cancers (Basel). 2021, 13(13):3122.
- Wang J, Hong M, Cheng Y, Wang X, Li D, Chen G, Bao B, Song J, Du X, Yang C, Zheng L, Tong. Targeting c-Myc transactivation by LMNA inhibits tRNA processing essential for malate-aspartate shuttle and tumour progression. Clin Transl Med. 2024 (5):e1680.
- Cedervall J, Zhang Y, Ringvall M, Thulin A, Moustakas A, Jahnen-Dechent W, Siegbahn A, Olsson AK. HRG regulates tumor progression, epithelial to mesenchymal transition and metastasis via platelet-induced signaling in the pre-tumorigenic microenvironment. Angiogenesis. 2013 (4):889-902.
- Zou X, Zhang D, Song, Y Liu S, Long Q, Yao L, Li W, Duan Z, Wu D, Liu L. HRG switches TNFR1-mediated cell survival to apoptosis in Hepatocellular Carcinoma. Theranostics. 2020 (23):10434-10447.
- Ma D, Liu P, Wen J, Gu Y, Yang Z, Lan J, Fan H, Liu Z, Guo D. FCN3 inhibits the progression of hepatocellular carcinoma by suppressing SBDS-mediated blockade of the p53 pathway Int J Biol Sci 2023 (2):362-376.
- Liu Z, Lu Q, Zhang Z, Feng Q, Wang X. TMPRSS2 is a tumor suppressor, and its downregulation promotes antitumor immunity and immunotherapy response in lung adenocarcinoma. Respir Res. 2024, 25 (1):238.
- Lv Y, Xie X, Zou G, Kong M, Yang J, Chen J, Xiang B. SOCS2 inhibits hepatoblastoma metastasis via downregulation of the JAK2/STAT5 signal pathway. Sci Rep. 2023, 13(1):21814.
- Zhou SQ, Feng P, Ye ML, Huang SY, He SW, Zhu XH, Chen J, Zhang Q, Li YQ. The E3 ligase NEURL3 suppresses epithelial-mesenchymal transition and metastasis in nasopharyngeal carcinoma by promoting vimentin degradation. J Exp Clin Cancer Res. 2024, 43(1).
- Kim JW, Marquez CP, Kostyrko K, Koehne AL, Marini K, Simpson DR, Lee AG, Leung SG, Sayles LC, Shrager J, Ferrer I, Paz-Ares L, Gephart MH, Vicent S, Cochran JR, Sweet-Cordero EA. Antitumor activity of an engineered decoy receptor targeting CLCF1-CNTFR signaling in lung adenocarcinoma. Nat Med. 2019 (11):1783-1795.
- Zhang Y, Xu P, Park K, Choi Y, Moore DD, Wang L. Orphan receptor small heterodimer partner suppresses tumorigenesis by modulating cyclin D1 expression and cellular proliferation. Hepatology. 2008 (1):289-98.
- Chen W, Lu C, Hong J. TRIM15 Exerts Anti-Tumor Effects Through Suppressing Cancer Cell Invasion in Gastric Adenocarcinoma. Med Sci Monit. 2018; 24:8033-8041.
- Hu X, Villodre ES, Larson R, Rahal OM, Wang X, Gong Y, Song J, Krishnamurthy S, Ueno NT, Tripathy D, Woodward WA, Debeb BG. Decorin-mediated suppression of tumorigenesis, invasion, and metastasis in inflammatory breast cancer. Commun Biol. 2021 Jan 15;4(1):72.
- Li S, Yang H, Li W, Liu JY, Ren LW, Yang YH, Ge BB, Zhang YZ, Fu WQ, Zheng XJ, Du GH, Wang JH. ADH1C inhibits progression of colorectal cancer through the ADH1C/PHGDH /PSAT1/serine metabolic pathway. Acta Pharmacol Sin. 2022; 43(10):2709-2722.
- Lin YH, Zeng Q, Jia Y, Wang Z, Li L, Hsieh MH, Cheng Q, Pagani CA, Livingston N, Lee J, Zhang Y, Sharma T, Siegwart DJ, Yimlamai D, Levi B, Zhu H. In vivo screening identifies SPP2, a secreted factor that negatively regulates liver regeneration Hepatology. 2023; 78(4):1133-1148.
- Rivas M, Johnston ME 2nd, Gulati R, Kumbaji M, Margues Aguiar TF, Timchenko T, Krepischi A, Shin S, Bondoc A, Tiao G, Geller J, Timchenko N. HDAC1-Dependent Repression of Markers of Hepatocytes and P21 is involved in Development of Pediatric Liver Cancer. Cell Mol Gastroenterol Hepatol. 2021; 12(5):1669-1682.
- Gulati R, Lutz M, Hanlon M, Cast A, Karns R, Geller J, Bondoc A, Tiao G, Timchenko L, Timchenko NT. Cellular Origin and Molecular Mechanisms of Lung Metastases in Patients with Aggressive Hepatoblastoma. Hepatol Commun. 2024; 8(2):e0369.
- Garred P, Genster N, Pilely K, Bayarri-Olmos R, Rosbjerg A, Ma YJ, Skjoedt MO. A journey through the lectin pathway of complement-MBL and beyond. Immunol Rev 2016; 274(1):74-97.
- Merle NS & Roumenina LT. The complement system as a target in cancer immunotherapy. Eur J Immunol. 2024 Jul 12:e2350820.
- O’Neill K, Pastar I, Tomic-Canic M, Strbo N. Perforins Expression by Cutaneous Gamma Delta T Cells. Front Immunol. 2020; 11:1839.
- Jane-Wit D, Song G, He L, Jiang Q, Barkestani M, Wang S, Wang Q, Ren P, Fan M, Johnson J, Mullan C. Complement Membrane Attack Complexes Disrupt Proteostasis to Function as Intracellular Alarmins. Res Sq. 2024 Jun 19:rs.3.rs-4504419.
- Spiller OB, Criado-García O, Rodríguez DCS, Morgan BP. Cytokine-mediated up-regulation of CD55 and CD59 protects human hepatoma cells from complement attack. Clin Exp Immunol. 2000, 121(2):234-41.
- Simon EP, Freije CA, Farber BA, Lalazar G, Darcy DG, Honeyman JN, Chiaroni-Clarke R, Dill BD, Molina H, Bhanot UK, La Quaglia MP, Rosenberg BR, Simon SM. Transcriptomic characterization of fibrolamellar hepatocellular carcinoma. Proc Natl Acad Sci U S A. 2015 Nov 3;112(44):E5916-25. Epub 2015 Oct 21. [CrossRef]
- Xu L, Hazard FK, Zmoos AF, Jahchan N, Chaib H, Garfin PM, Rangaswami A, Snyder MP, Sage J. Genomic analysis of fibrolamellar hepatocellular carcinoma. Hum Mol Genet. 2015 Jan 1;24(1):50-63. Epub 2014 Aug 13. [CrossRef] [PubMed] [PubMed Central]
Figure 1.
Identification of the J-PKAc kinase in 1-3 years old children with hepatoblastoma and with HCN-NOS. A) The identification of the J-PKAc in a HBL patient (HBL72). The top image is a Western Blot to PKAc. FLC: protein extract from a FLC patient (control sample); B: background (adjacent to tumor) region of the liver; T: Tumor. The bottom image shows the detection of the J-PKAc fusion mRNA in the tumor of HBL72. B) Identification of the J-PKAc in pediatric HBL, HCC, and HCN-NOS specimens in a large biobank at CCHMC. The top panel is a Western Blot with HBL specimens using antibodies that recognize both fusion and native PKAc. Specimens with high level of J-PKAc are shown in red. The Bottom left image shows QRT-PCR analysis of the J-PKAc fusion transcript in two J-PKAc fusion positive samples. The bottom right image shows detection of the fusion kinase in HCN-NOS77. C) Generation of the J-PKAc-fusion-specific antibody. Top: Peptide sequence that was used for generation of a fusion-specific antibody. Bottom: Western Blots of background and tumor sections of FLC51 and FLC lung metastasis with the fusion antibody. The membrane was re-probed with antibodies that recognize both J-PKAc and native PKAc. D) Immunohistochemistry of tumor sections of three FLC patients with the fusion-specific antibody. Magnification = 10x. Scale bars = 50μM. Inserts show individual cells under 40X. E) Expression of the fusion J-PKAc in HBL/HCN-NOS was examined by Western Blot with Fus-Abs. The membrane was re-probed with Abs to cdc2 (cdk1) and to b-actin as a loading control. F) Immunohistochemistry of tumor sections of sample HBL114 and HCN-NOS108. Images of individual cells are shown in boxes. Magnification = 10x. Scale bars = 50μM.
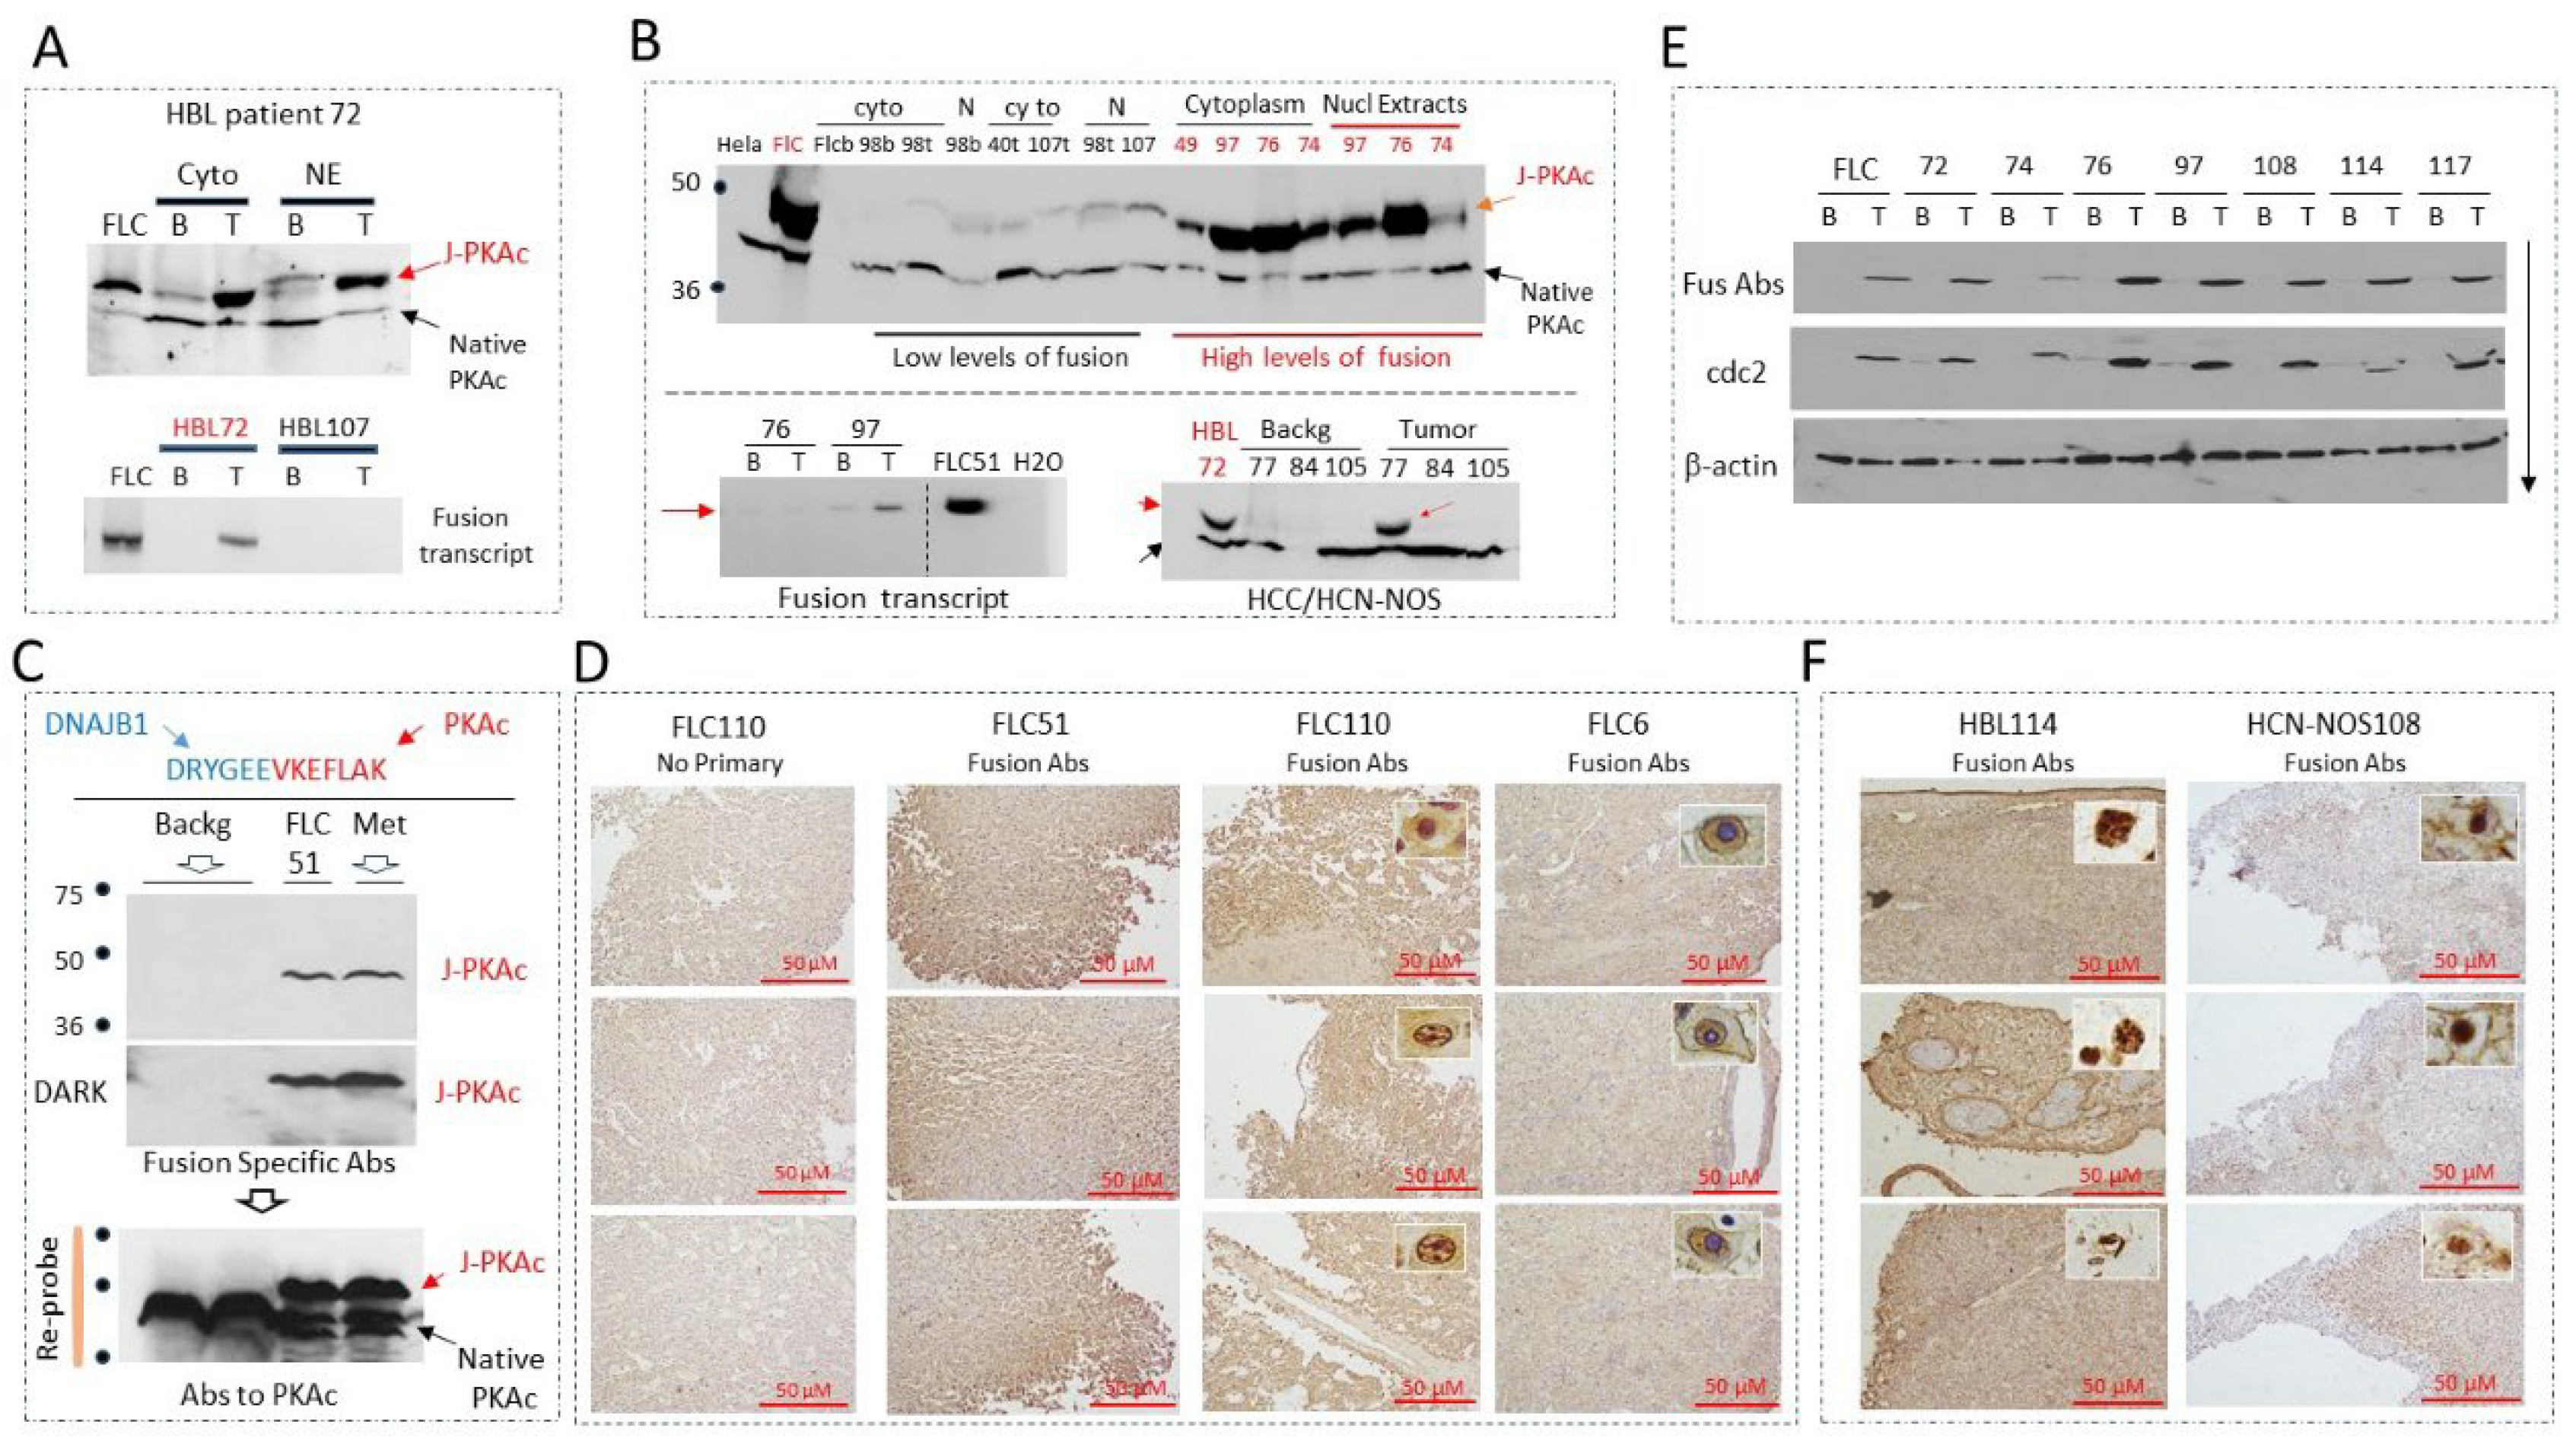
Figure 2.
RNA-Seq analyses of the J-PKAc-positive HBL/HCN-NOS and J-PKAc-negative HBLs. A) Pathways that are upregulated in fusion-negative HBLs (n=3) compared to background tissue (n=3). B) Pathways that are downregulated in fusion-positive (n=5) HBLs compared to background tissue (n=3). C) Nuclear and membrane immunostaining in fusion-positive HBL114 and HCN-NOS108. D) Examination of the integrity of the fusion-positive membranes in patients with FLC by immunostaining with Fus-Abs. Black arrows point cells with membrane and nuclear Fus-staining. Examples of destruction of fusion-positive membranes in tumors of samples FLC110 and FLCH01 are shown by open red arrows. E) A hypothesis for the process of distraction of fusion-expressing cells in fusion-negative HBL patients.
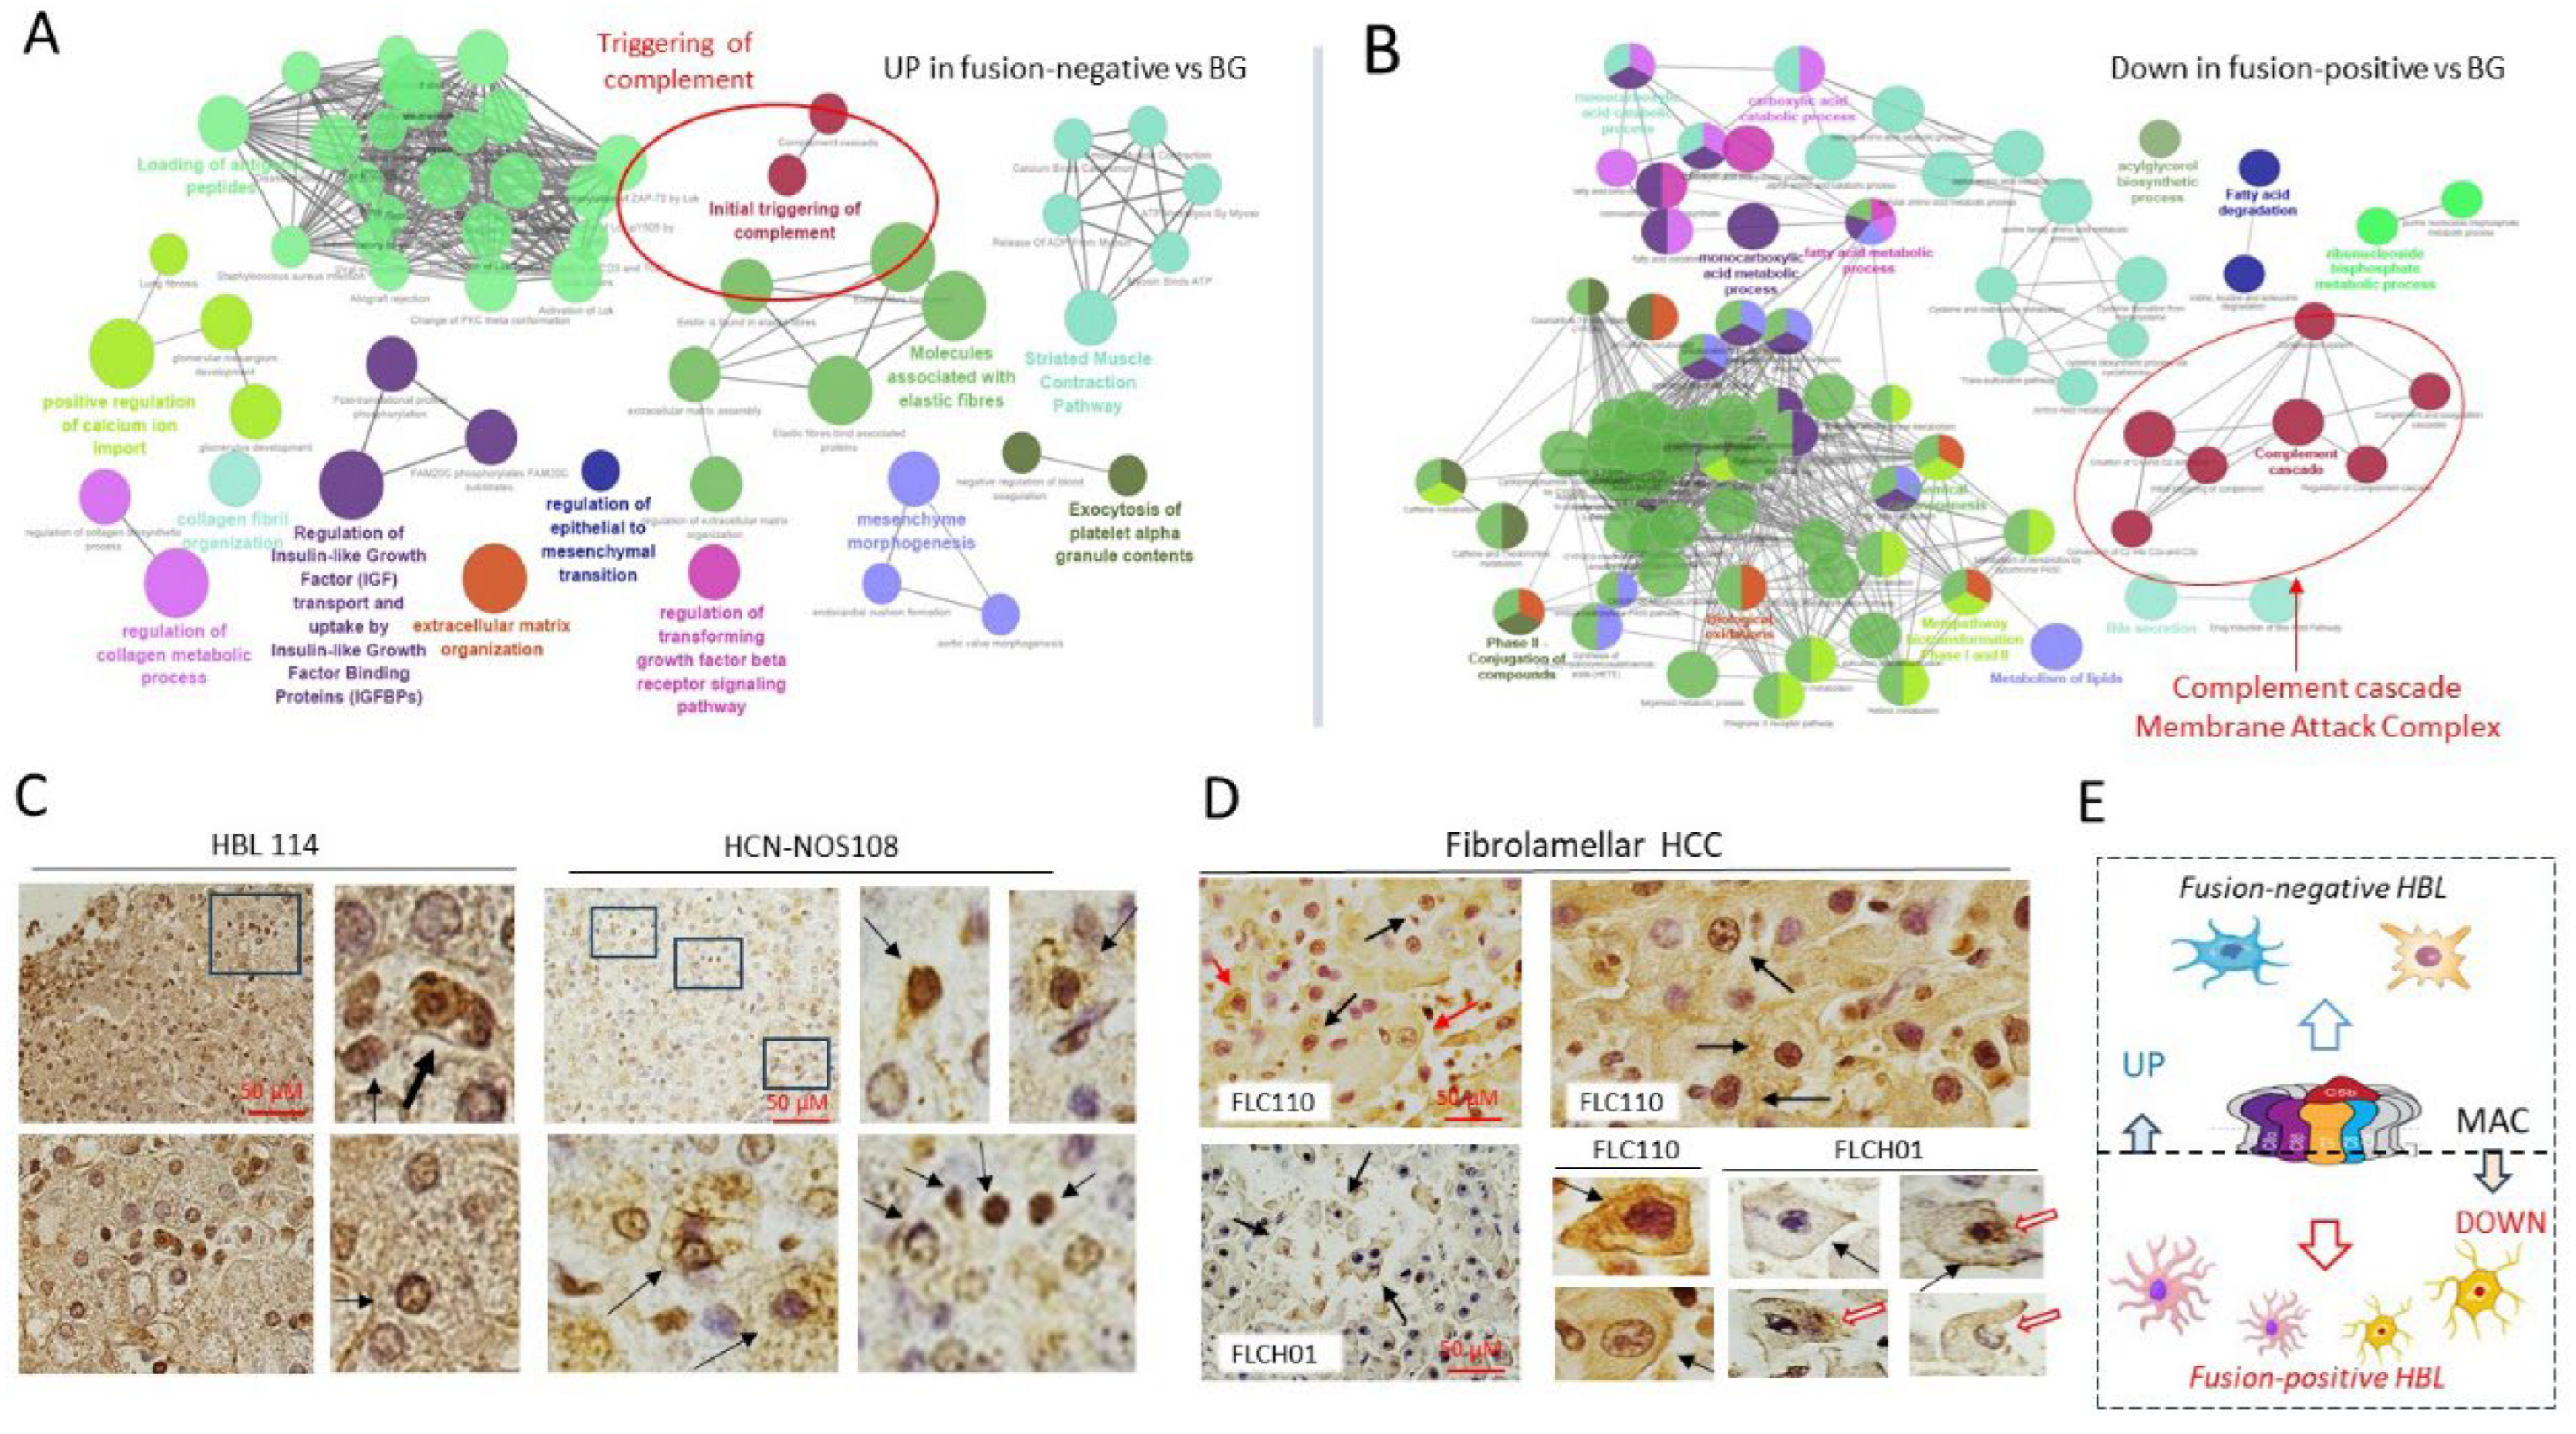
Figure 3.
The cell line flc110, derived from Fibrolamellar HLC110 patient, contains cells with disintegrated fusion positive membranes. A) Examination of J-PKAc kinase in tumors of FLC110 patient. Cytoplasm and nuclear extracts from background (adjacent, non-tumor) and tumor sections were examined by Western Blot assay with antibodies to PKAc, Abs to N-terminus of DNAJB1 and with Fus-Abs. Upper image shows integrity of the proteins determined by Coomassie stain. B) Detection of the fusion J-PKAc mRNA by QRT-PCR. C) Generation of FLC110-derived cell line. Images of cells exiting the tumor (exit) and images of cells after 1st and 2nd passages are shown. D) Western blot of WCEs from HepG2 and flc110 cells with Fusion-Specific Abs and with Abs to PKAc. E) Immunostaining of flc110 cells with fusion-specific Abs. F) Fusion/DAPI/Merged images of flc110 cells stained with Fus-Abs. Cells with membrane and nuclear immunostaining are shown. Arrows show fusion-positive cells with destructed nuclei and cells with cell damage.
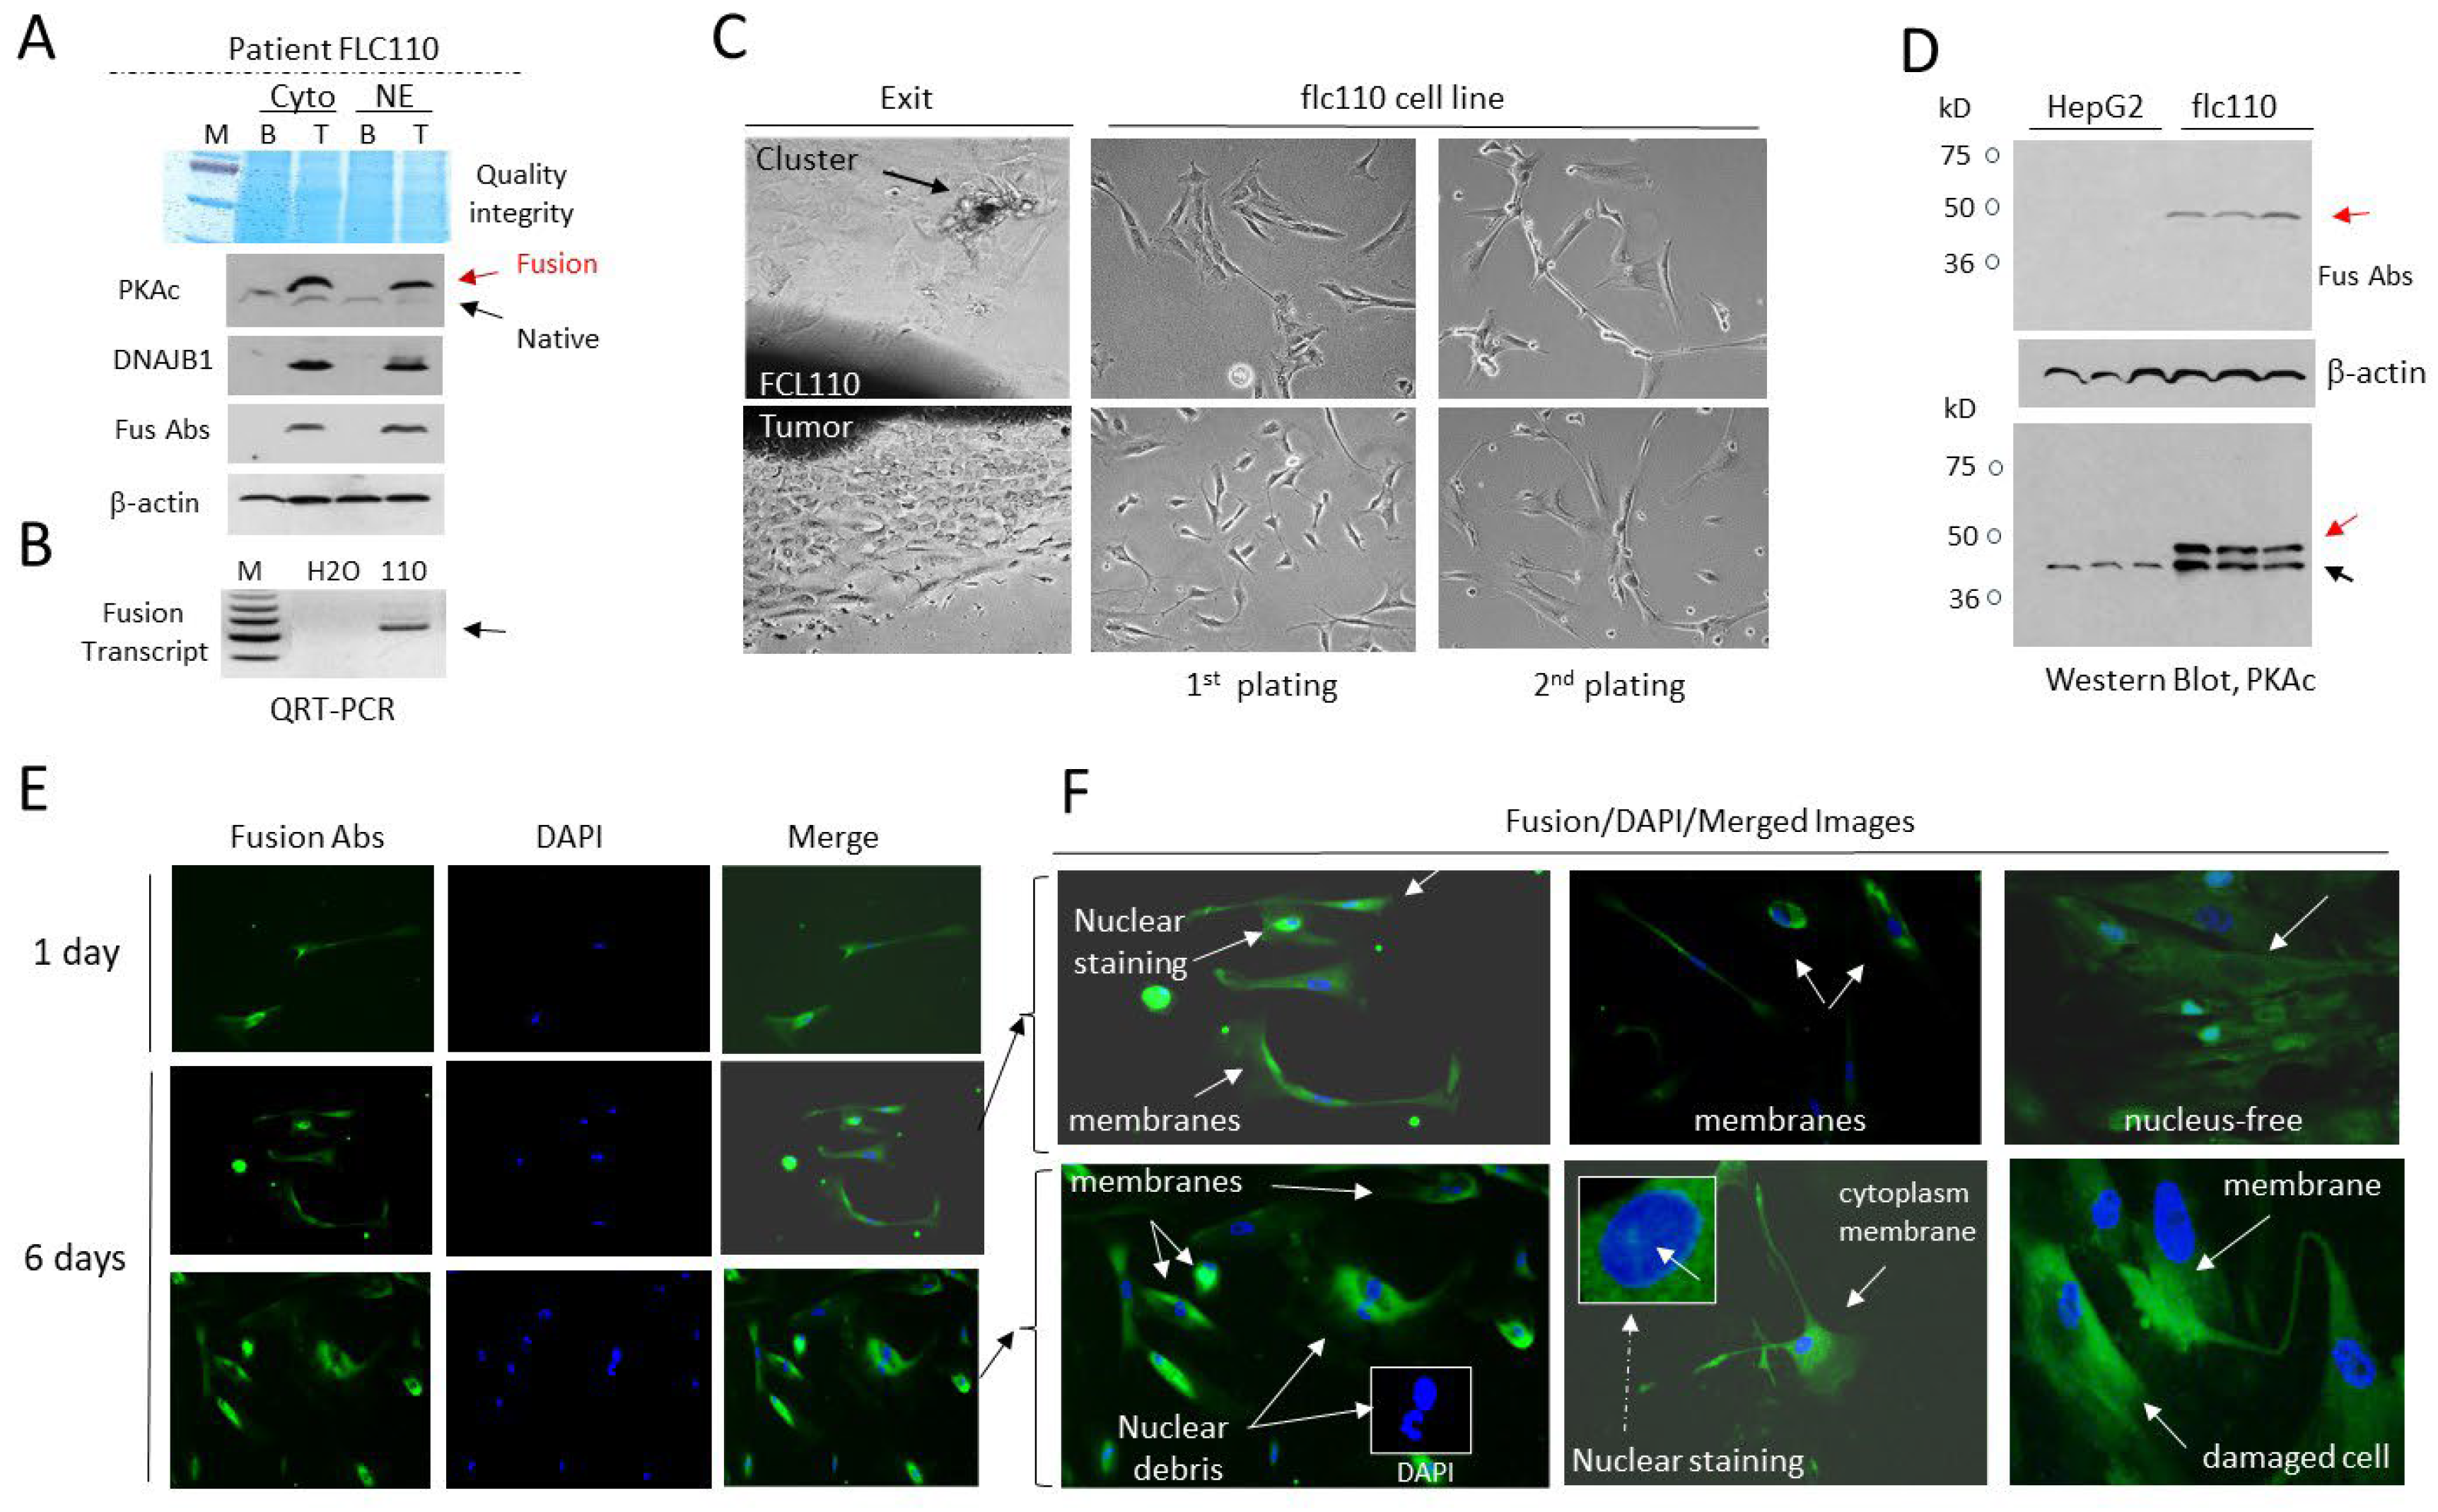
Figure 4.
RNA-Seq-based comparison of pathways that are different in J-PKAc-positive HBL/HCN-NOS compared to J-PKAc-negative HBLs. A) List of compared HBL/HCN-NOS samples. B) A heatmap that shows the differences in pathways between fusion-positive HBL/HCN-NOS and fusion-negative HBLs. C) Pathways that are upregulated in fusion-positive (n=5) HBLs. D) Pathways that are downregulated in fusion-positive HBLs (n=5) compared to fusion-negative HBLs (n=3). E) Levels of mRNAs coding for markers of proliferation cdk1 and cdk4 as averages of duplicate measurements in fusion positive (n=7) vs. fusion negative samples (n=8). Paired t-tests were performed (*: p<0.05); differences are not significant in unlabeled plots. F) List of tumor suppressors and levels of their fold-reduction in fusion-positive HBL/HCN-NOS compared to fusion-negative HBLs. QRT-PCR shows a reduction of the tumor suppressor histidine rich glycoprotein (HRG) in a large biobank of HBL/HCN-NOS samples (n=40) and confirmation of the reduction of HRG in fusion-positive HBL/HCN-NOS (n=5) compared to fusion-negative HBLs (n=3) as averages of duplicate measurements. Bottom QRT-PCR graph shows a reduction of HRG in FLC patients (n=5) as averages of duplicate measurements. Paired t-tests were performed (****: p<0.0001); differences are not significant in unlabeled plots.
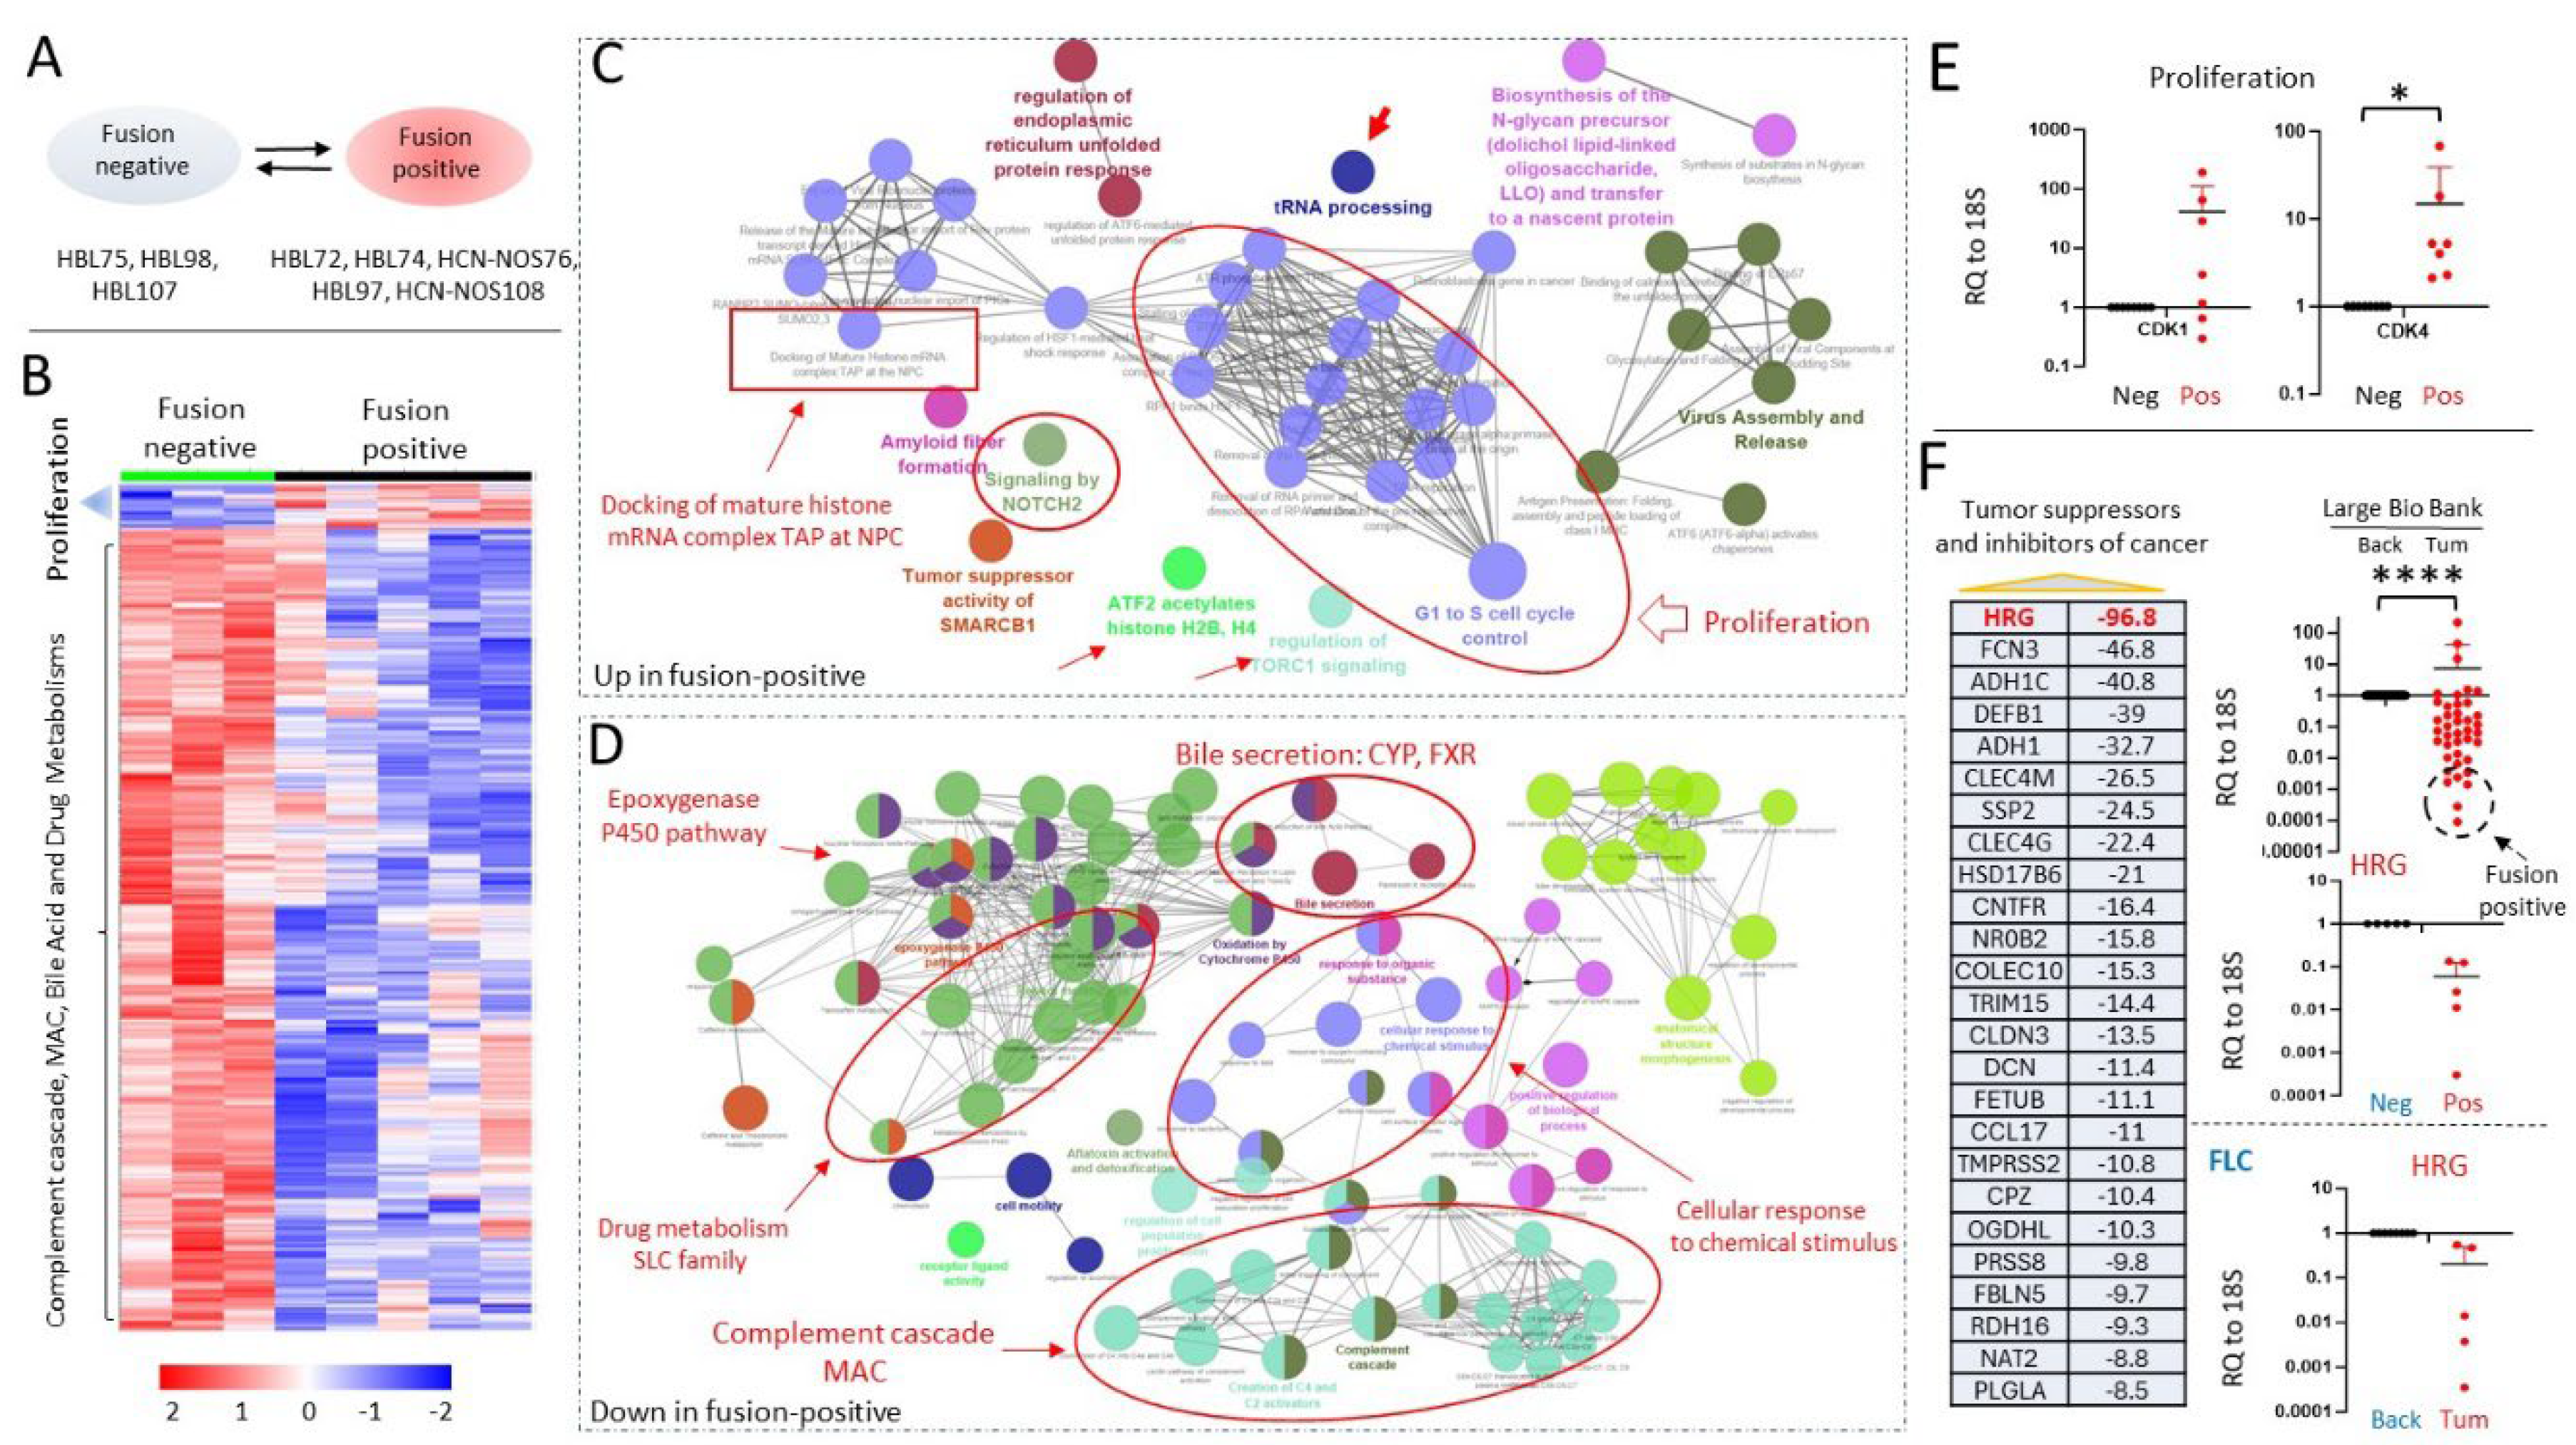
Figure 5.
J-PKAc-positive HBLs are characterized by high levels of fibrosis. A) QRT-PCR showed that levels of AKAP12 and AKAP13 mRNAs are increased in fusion positive (n=7) vs fusion negative HBLs/HCCs (n=5). Levels of Col2A1 mRNAs are increased in fusion positive (n=5) vs fusion negative HBLs/HCCs (n=3), and levels of Col1A1 mRNAs are increased in fusion-positive (n=8) compared to fusion-negative HBLs/HCCs (n=10). Paired t-tests were performed (*: p<0.05); differences are not significant in unlabeled plots. B) H&E staining of tumors and backgrounds of J-PKAc-negative and J-PKAc-positive HBLs, HCCs, and HCN-NOSs. Arrows show lamellar structures (for FLC) and lamellar-like structures (for HBLs). C) Sirius Red staining of the fusion-negative and fusion-positive HBLs. FLC110 and FLC6; staining of the tumor sections of two FLC patients. Arrows show Sirius Red positive lamellar-like structures.
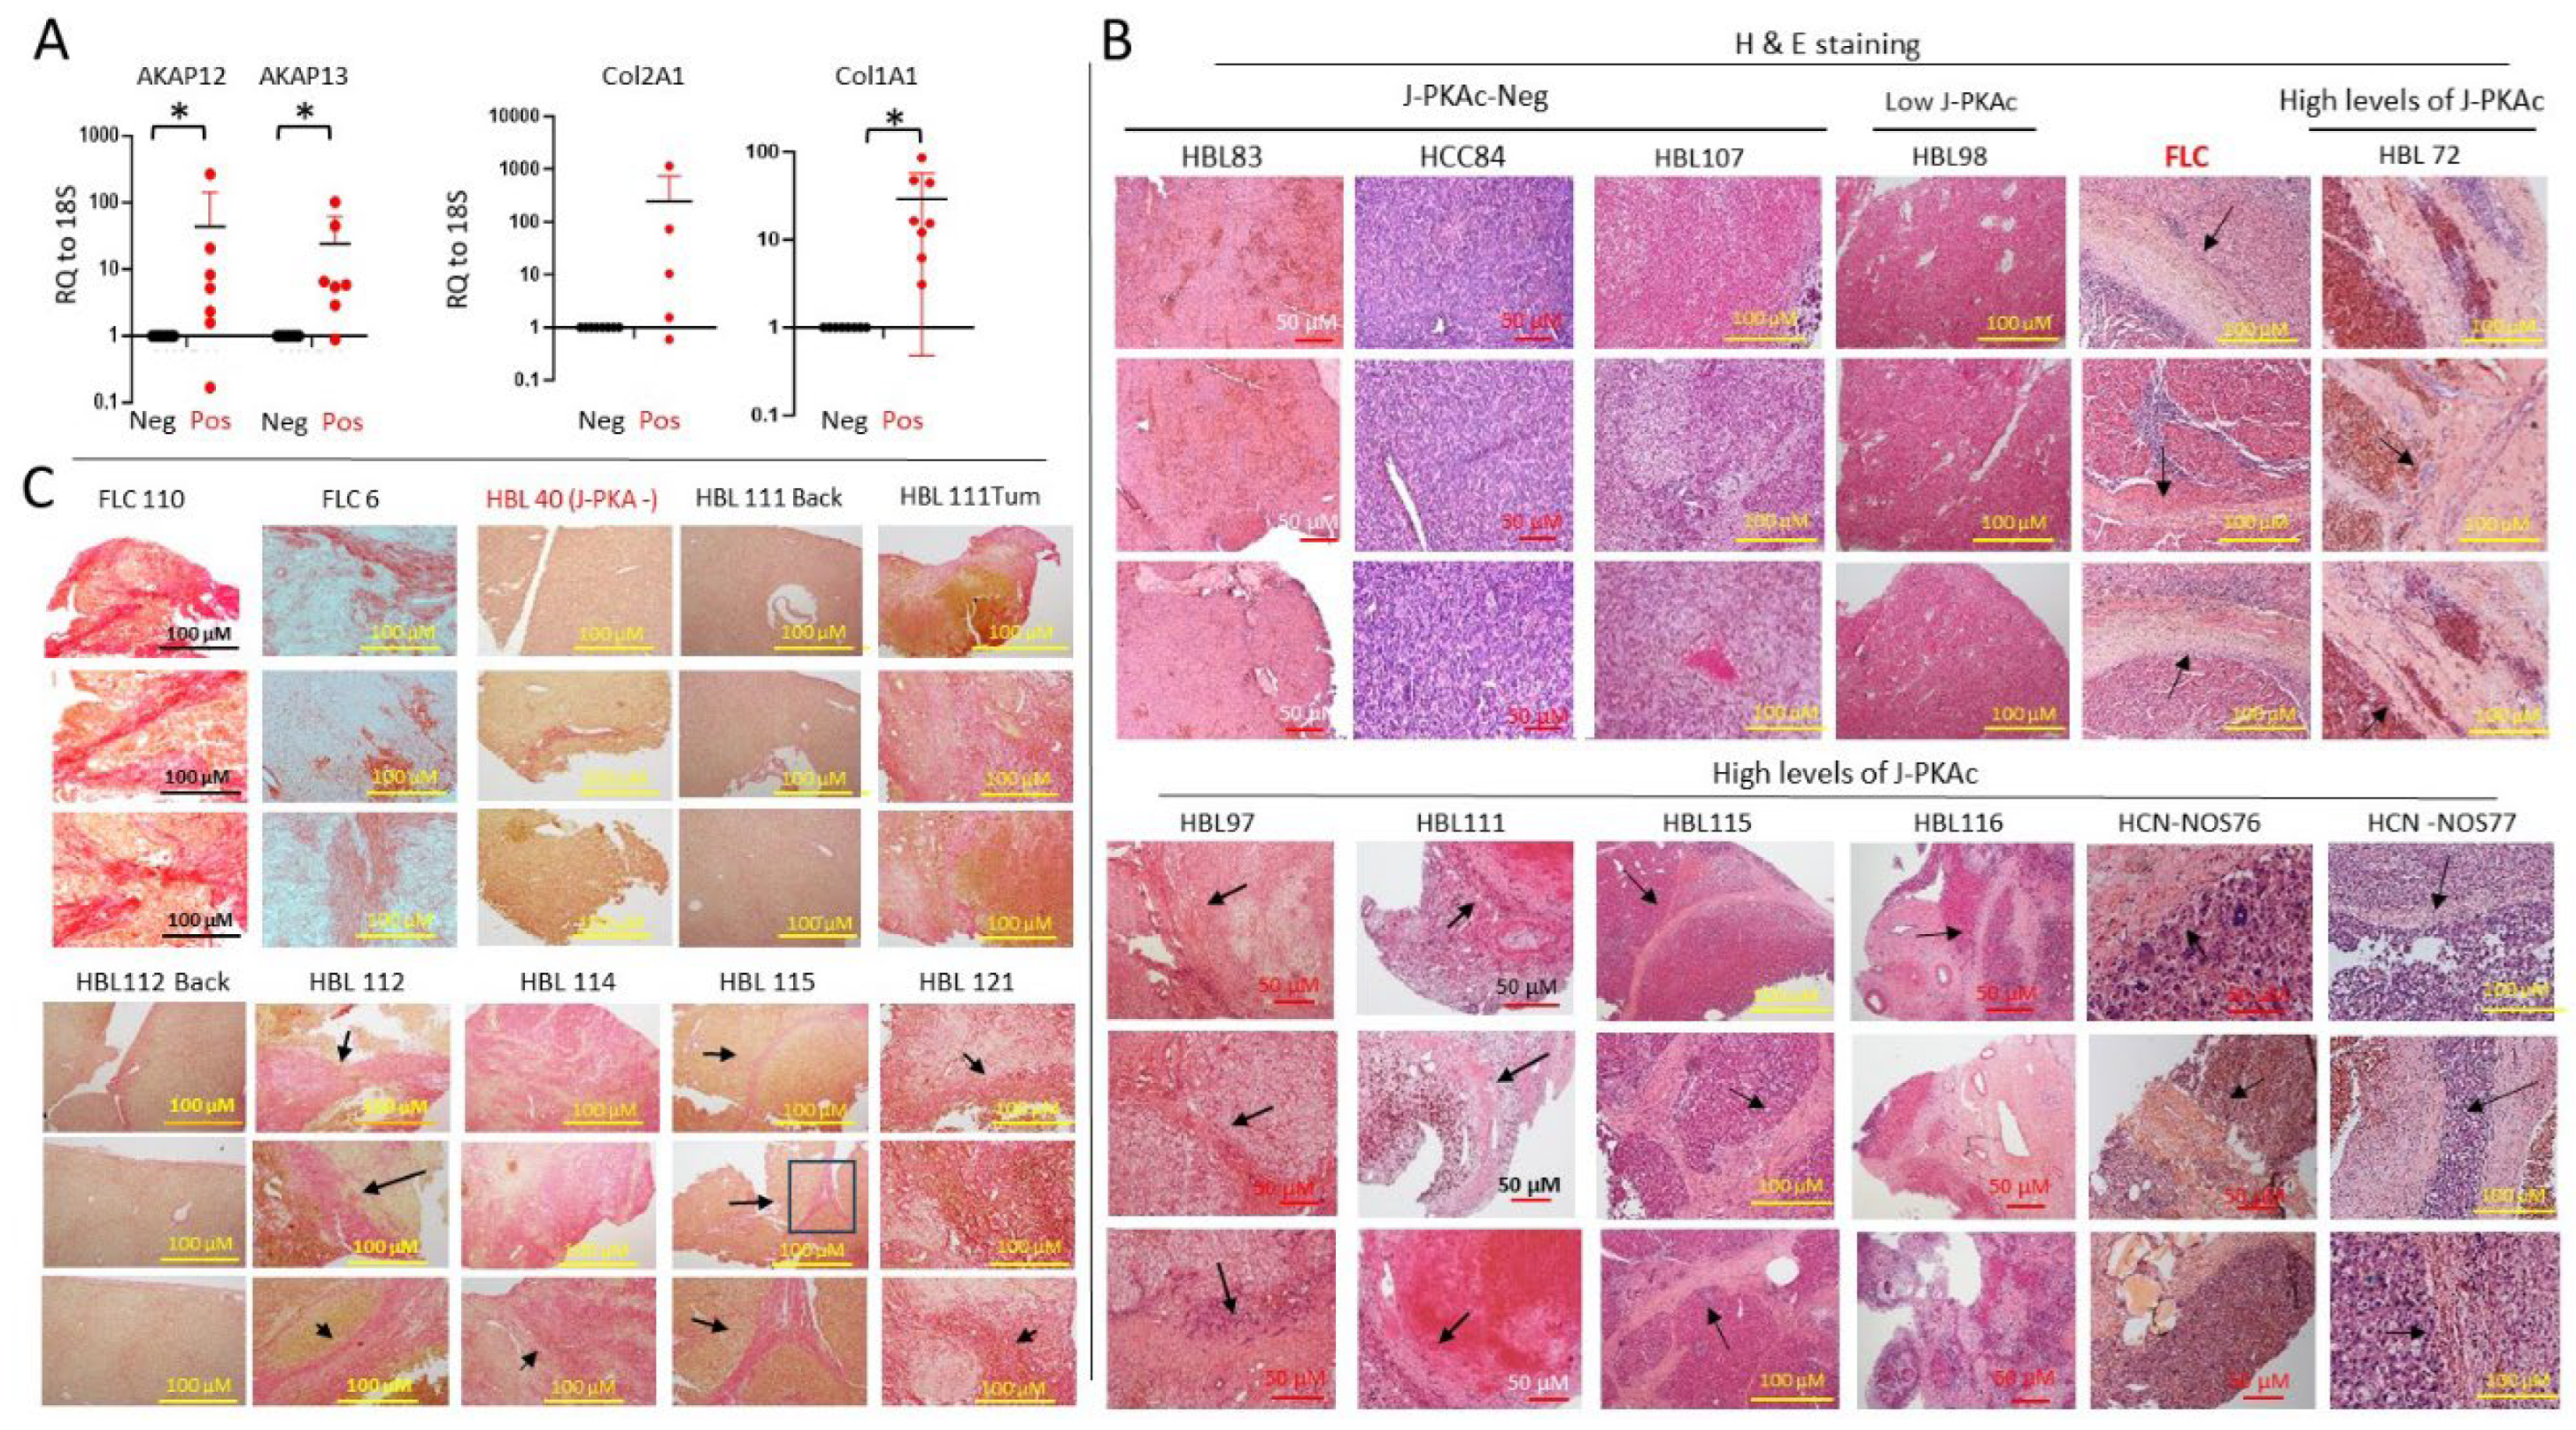
Figure 6.
Components of the complement cascade/MAC and expression of the genes of bile acid/drug metabolisms are reduced in J-PKAc-positive HBLs. A) Upper-Left: RNA-Seq based list and fold reduction of mRNAs coding for complement cascade and membrane attack complex. Middle: QRT-PCR shows levels of corresponding mRNAs in fusion-negative (n=3) and fusion-positive (n=5) HBLs as averages of duplicate measurements. Right: Levels of FCN3 in a large bio bank (n=42) were determined by QRT-PCR as averages of duplicate measurements. Paired t-tests were performed (****: p<0.0001); differences are not significant in unlabeled plots. B) QRT-PCR shows levels of mRNAs coding for complement cascade/MAC in Huh6 cells transfected with the fusion kinase (n=3) compared to untransfected cells (n=3) as averages of duplicate measurements. Paired t-tests were performed (*: p<0.05, ***: p<0.001); differences are not significant in unlabeled plots. C) Levels of complement cascade/MAC in patients with FLC (n=5) as averages of duplicate measurements. Paired t-tests were performed; differences are not significant in unlabeled plots. D-E) The list of members of CYP and SLC families that are down-regulated in fusion-positive HBLs relative to fusion-negative HBLs. The right part shows QRT-PCR for CYP2B6 and SLC members in fusion-positive (n=5) and fusion-negative HBLs (n=3) and CYP3A4 in fusion-positive (n=7) and fusion-negative (n=9) HBLs as averages of duplicate measurements. Paired t-tests were performed; differences are not significant in unlabeled plots.
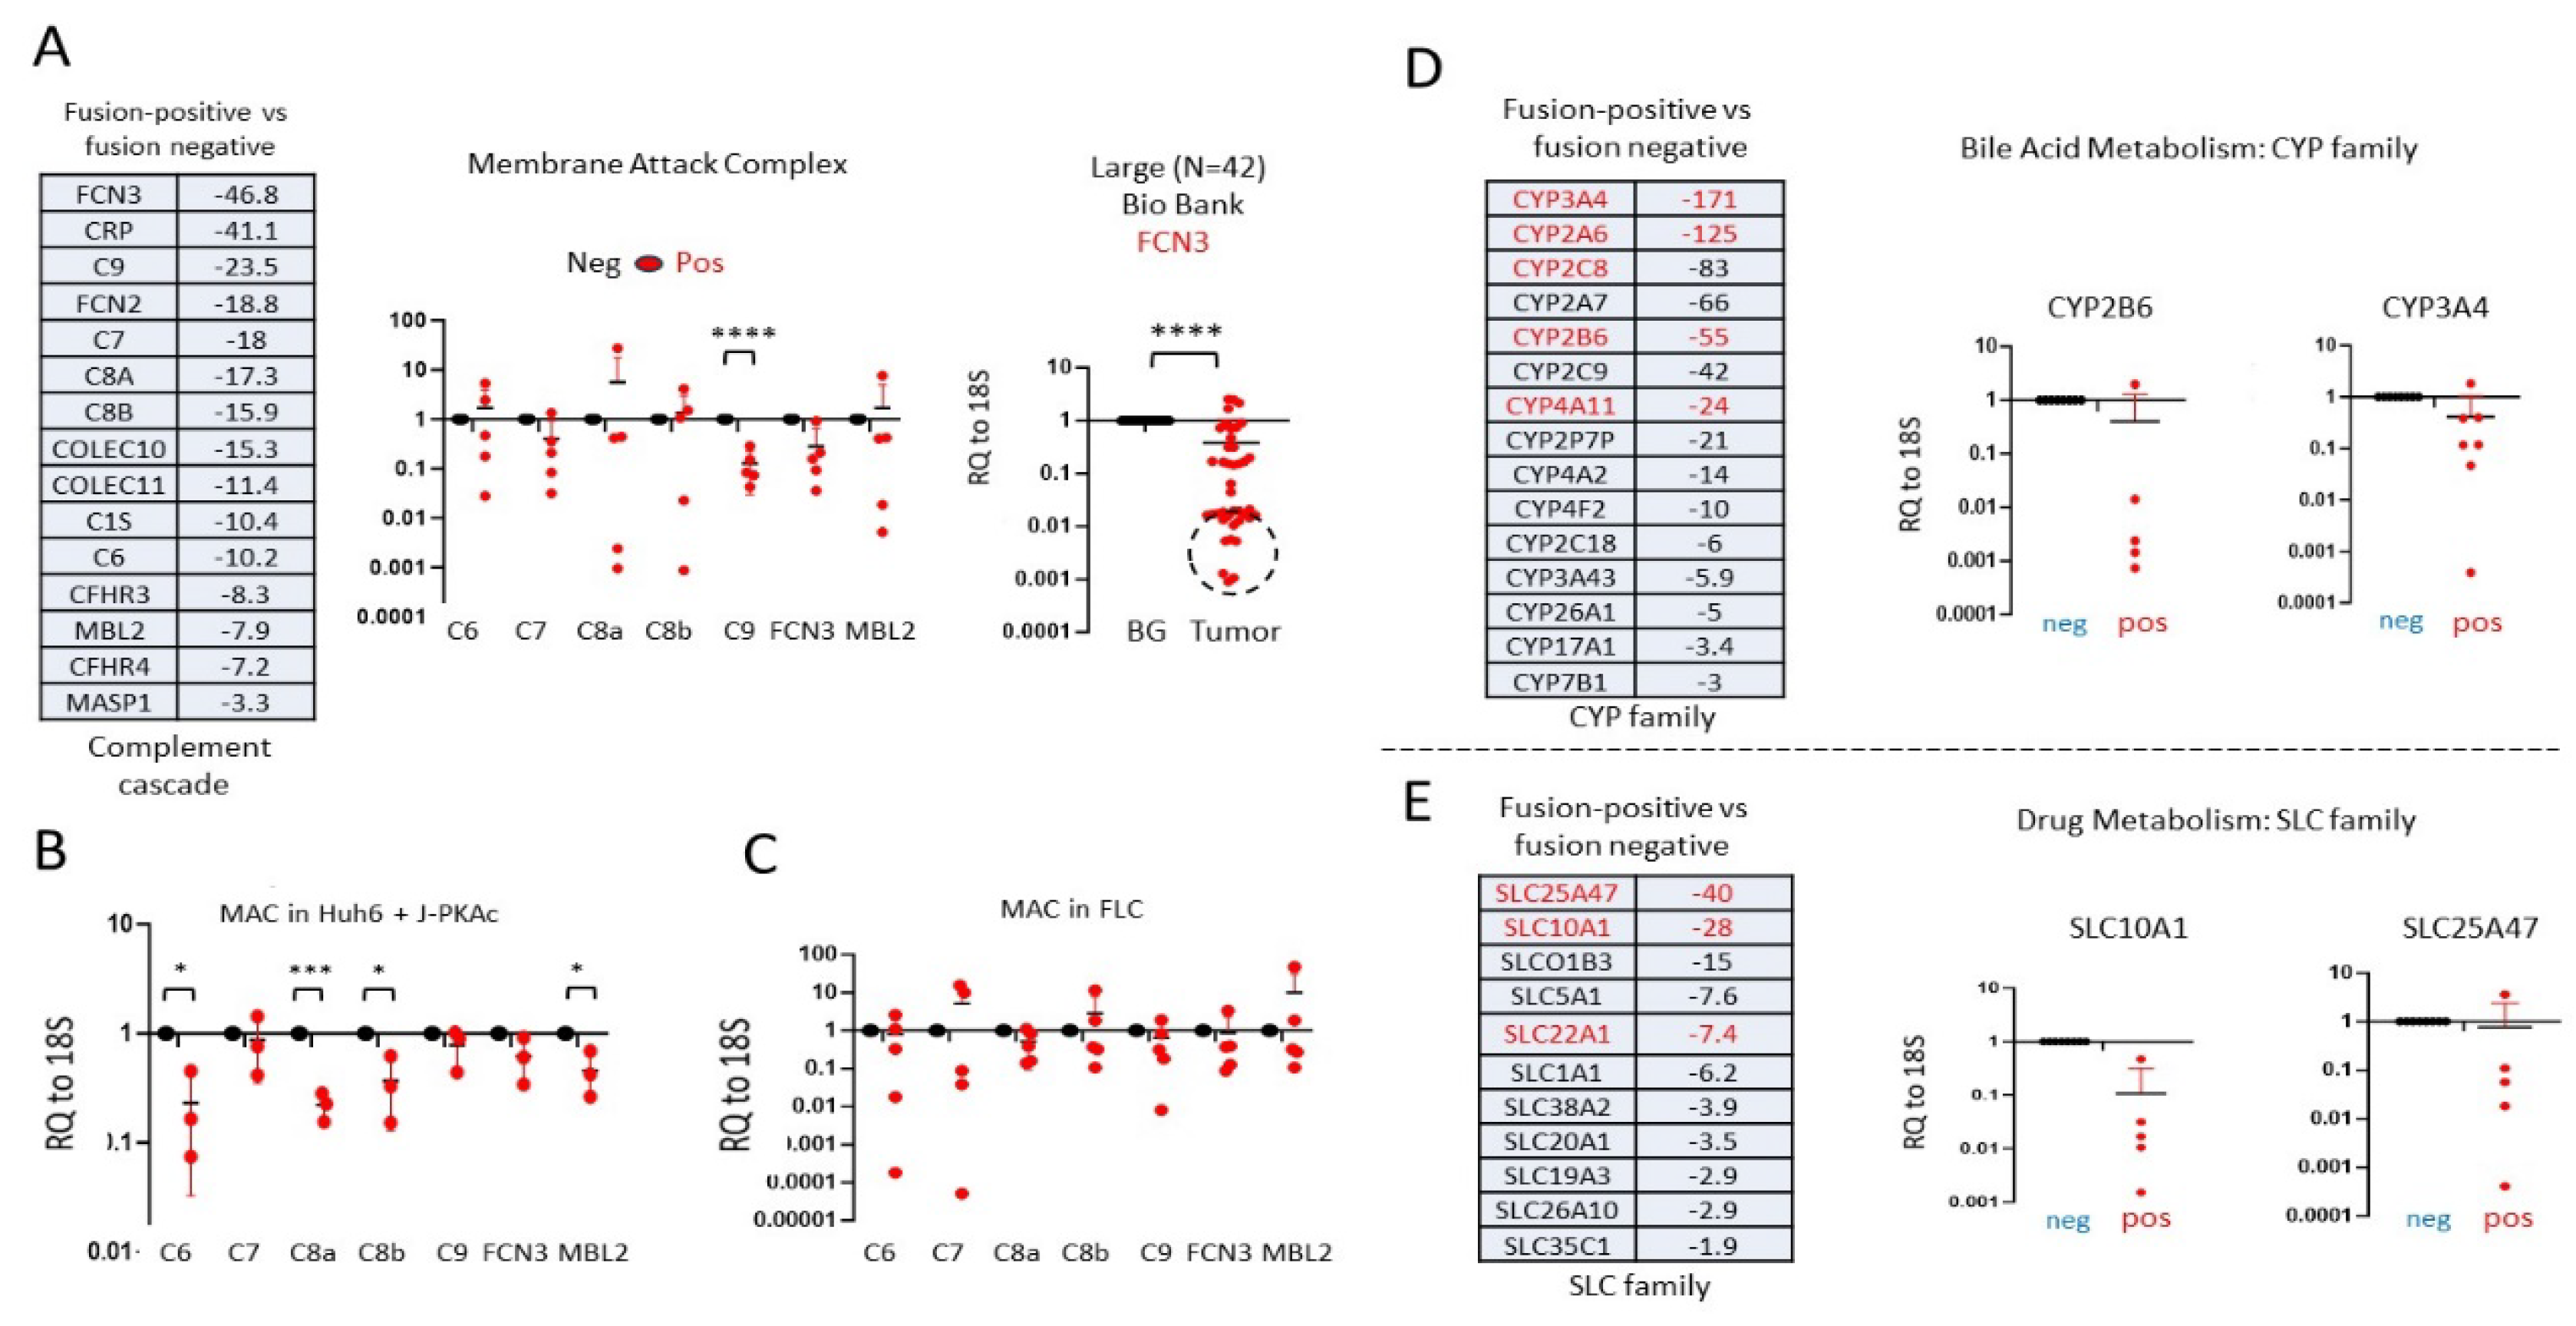
Figure 7.
Levels of mRNAs in patients with fibrolamellar HCC which were differentially expressed in fusion-positive HBLs. A) Western Blot of protein extracts from 5 FLC patients with Fus-Abs shows expression of J-PKAc in tumor sections of the livers. B) Levels of CYP and SLC family mRNAs are reduced in FLC patients. Left: Red color shows mRNAs that are down-regulated in fusion-positive HBLs compared to fusion-negative HBLs. Right: QRT-PCR analysis is shown as averages of duplicate measurements in FLC patients (n=5). Paired t-tests were performed; differences are not significant in unlabeled plots. C) Levels of Sp5 (n=6) and HDAC1 (n=8) are increased in tumors of FLC samples, shown as averages of duplicate measurements. Paired t-tests were performed (**: p<0.01); differences are not significant in unlabeled plots. D) Markers of liver proliferation, cdk1 and cdk4, and the marker of fibrosis Col1A1 are increased in FLC samples (n=5), shown as averages of duplicate measurements. Paired t-tests were performed; differences are not significant in unlabeled plots. E) ph-S675-b-catenin pathway is enhanced in patients with J-PKAc. Left: a diagram showing the J-PKAc-b-catenin pathway described in our previous paper5. Western: levels of the fusion J-PKAc kinase and ph-S675-b-catenin were examined by Western Blot. Bar graphs show ratios of ph-S675-b-catenin to b-actin. F) Levels of J-PKAc-b-catenin-CEGRs/ALCDs pathway-dependent stem cell markers and cancer-associated mRNAs in J-PKAc-negative (n=5) and J-PKAc-positive HBL/HCN-NOS (n=8), shown as averages of duplicate measurements. Unpaired t-tests were performed; differences are not significant in unlabeled plots.
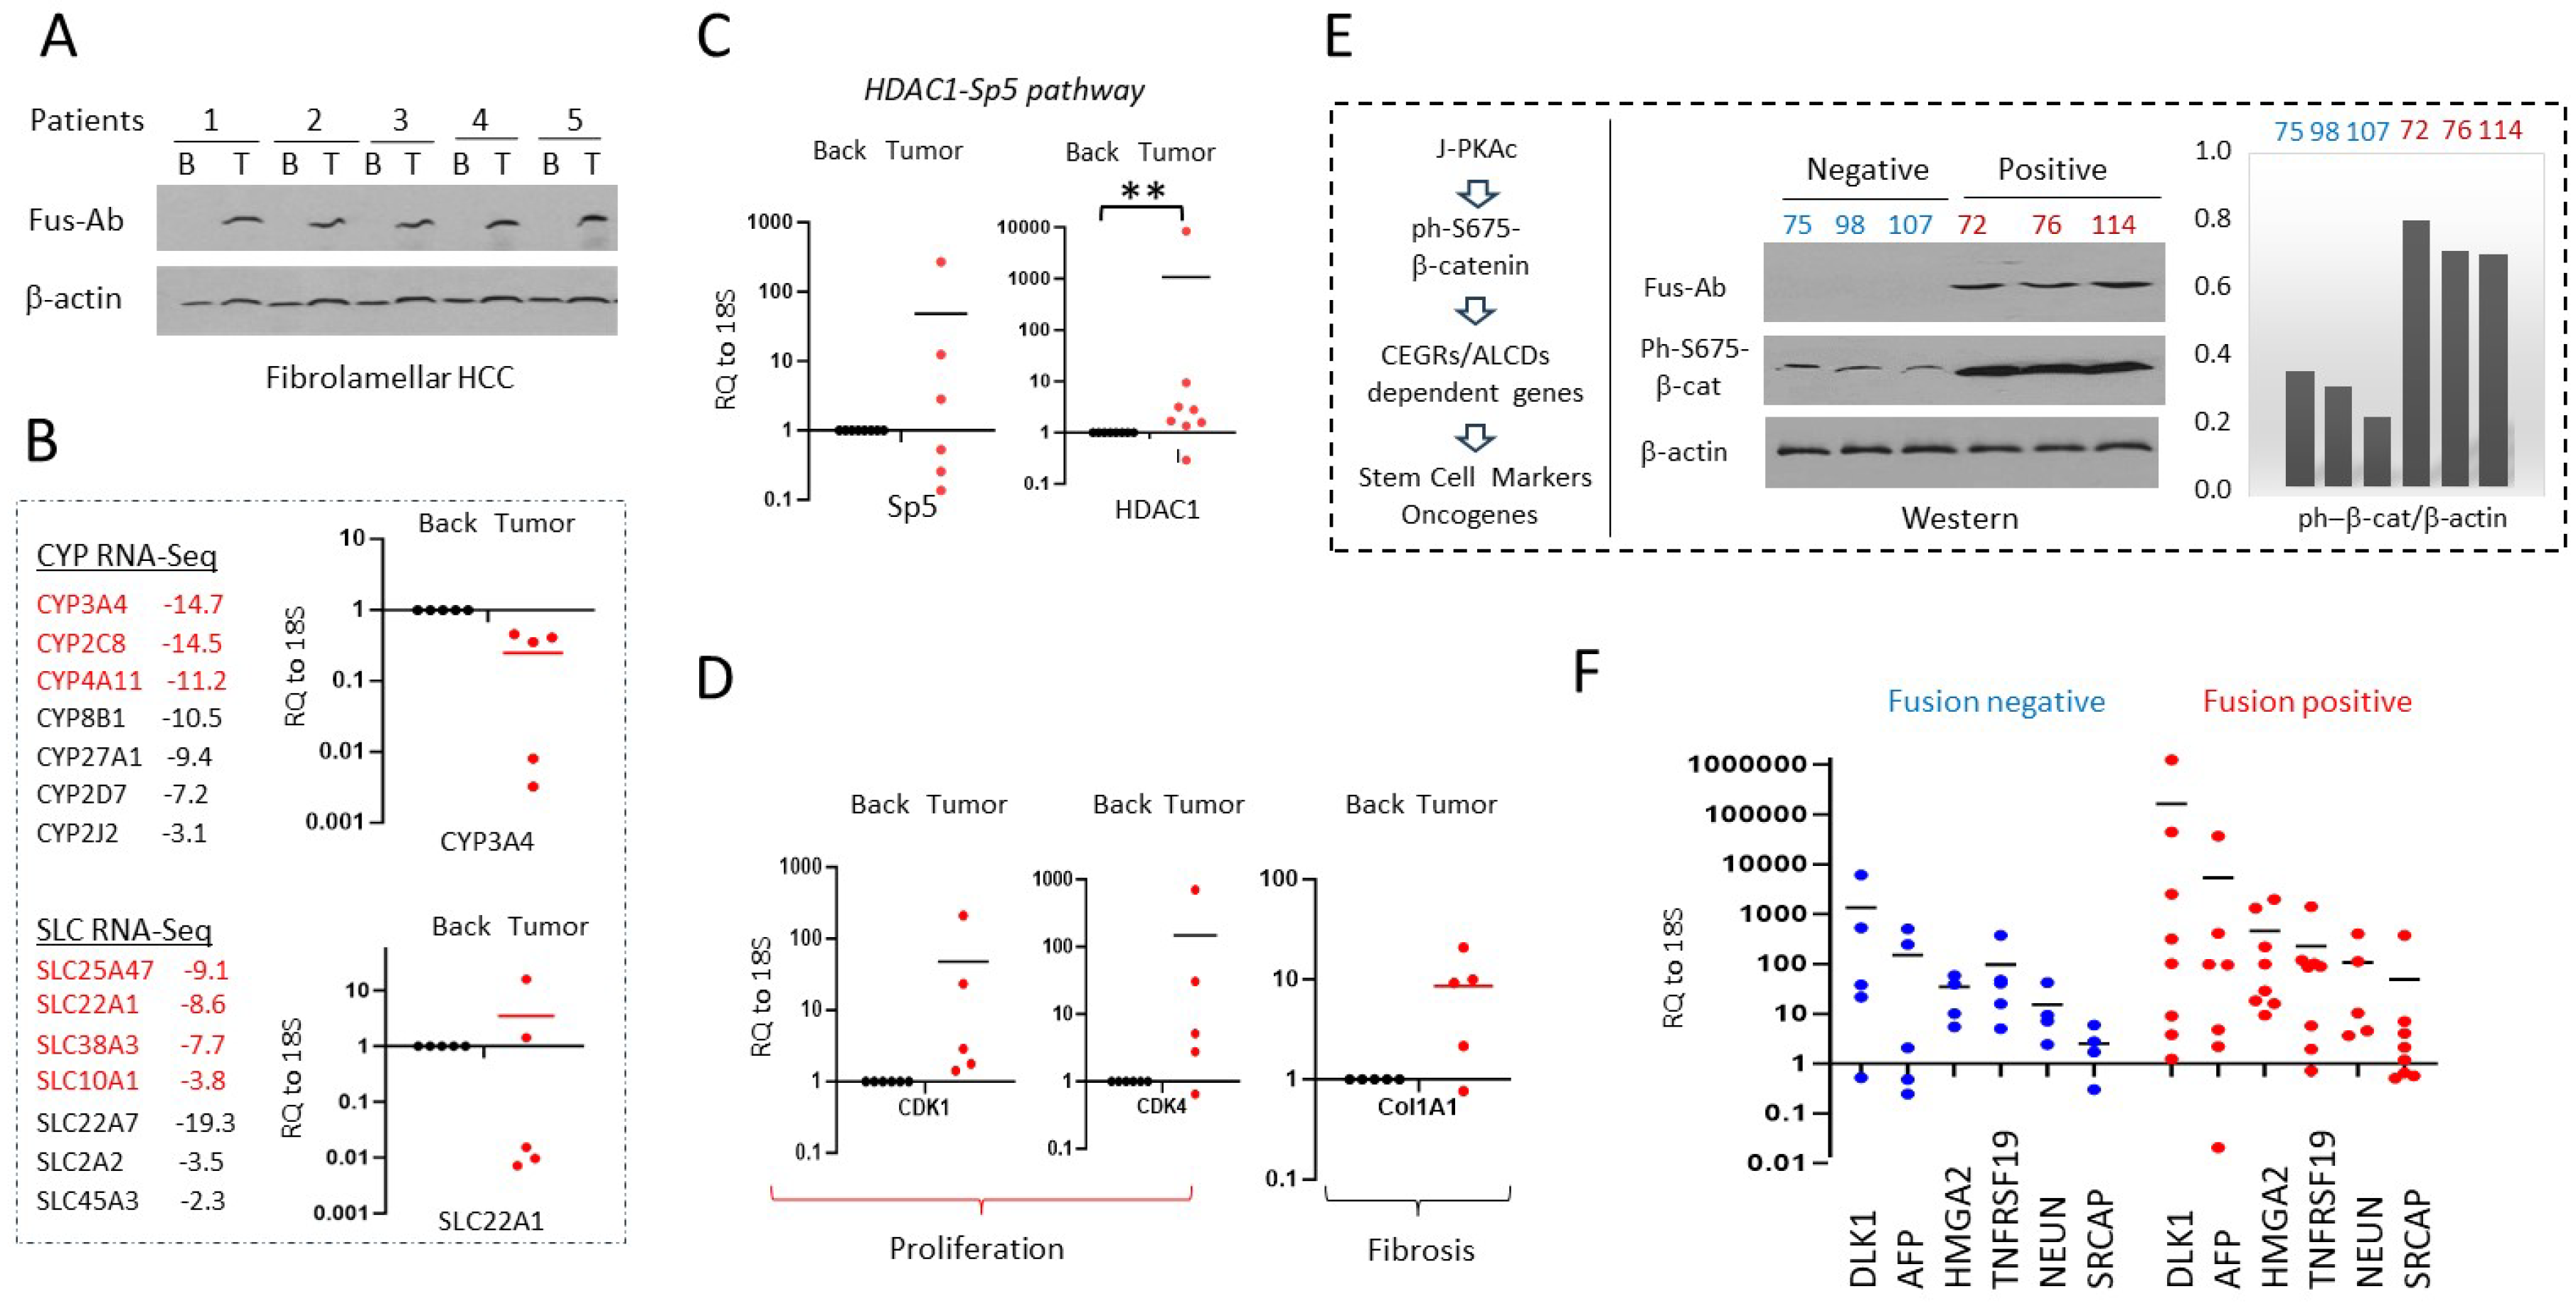
Figure 8.
J-PKAc fusion kinase directly regulates pathways that are differentially expressed in J-PKAc-positive HBLs. A and B) Ectopic expression of J-PKAc in HepG2 (A) and Huh6 (B) cells enhanced phosphorylation of b-catenin at Ser675. Upper images show Western Blot with proteins from cells transfected with lipofectamine (Lip) and DNAJB1-PKAc plasmid using Abs to PKAc (which recognize native and fusion kinases) and with Abs to ph-S675-b-catenin. The bar graphs below show levels of ph-S675-b-catenin calculated as a ratio to the loading control b-actin in duplicate. Unpaired t-tests were performed (*: p<0.05); differences are not significant in unlabeled plots. C) A summary of elevation of mRNAs corresponding to J-PKAc-b-catenin dependent genes in HepG2 (n=3) and in Huh6 cells (n=3) transfected with a DNAJB1-PKAc-expressing plasmid compared to untransfected HepG2 (n=3) and Huh6 cells (n=3), shown as averages of duplicate measurements. D and E) Images of HepG2 and Huh6 cells transfected with DNAJB1-PKAc plasmid in triplicate and stained with the fusion-specific antibody (green), HDAC1 (red), and DAPI. Three fields of images for each type of cell are shown. Bottom images show high magnifications of the merges of the positive cells. F) Left: levels of mRNAs of HDAC1-Sp5-dependent CYP and SLC genes in cells transfected by DNAJB1-PKAc. Right: levels of mRNA coding for the tumor suppressor HRG in transfected cells. Both are shown as averages of duplicate measurements for transfected (n=3) compared to untransfected cells (n=3).
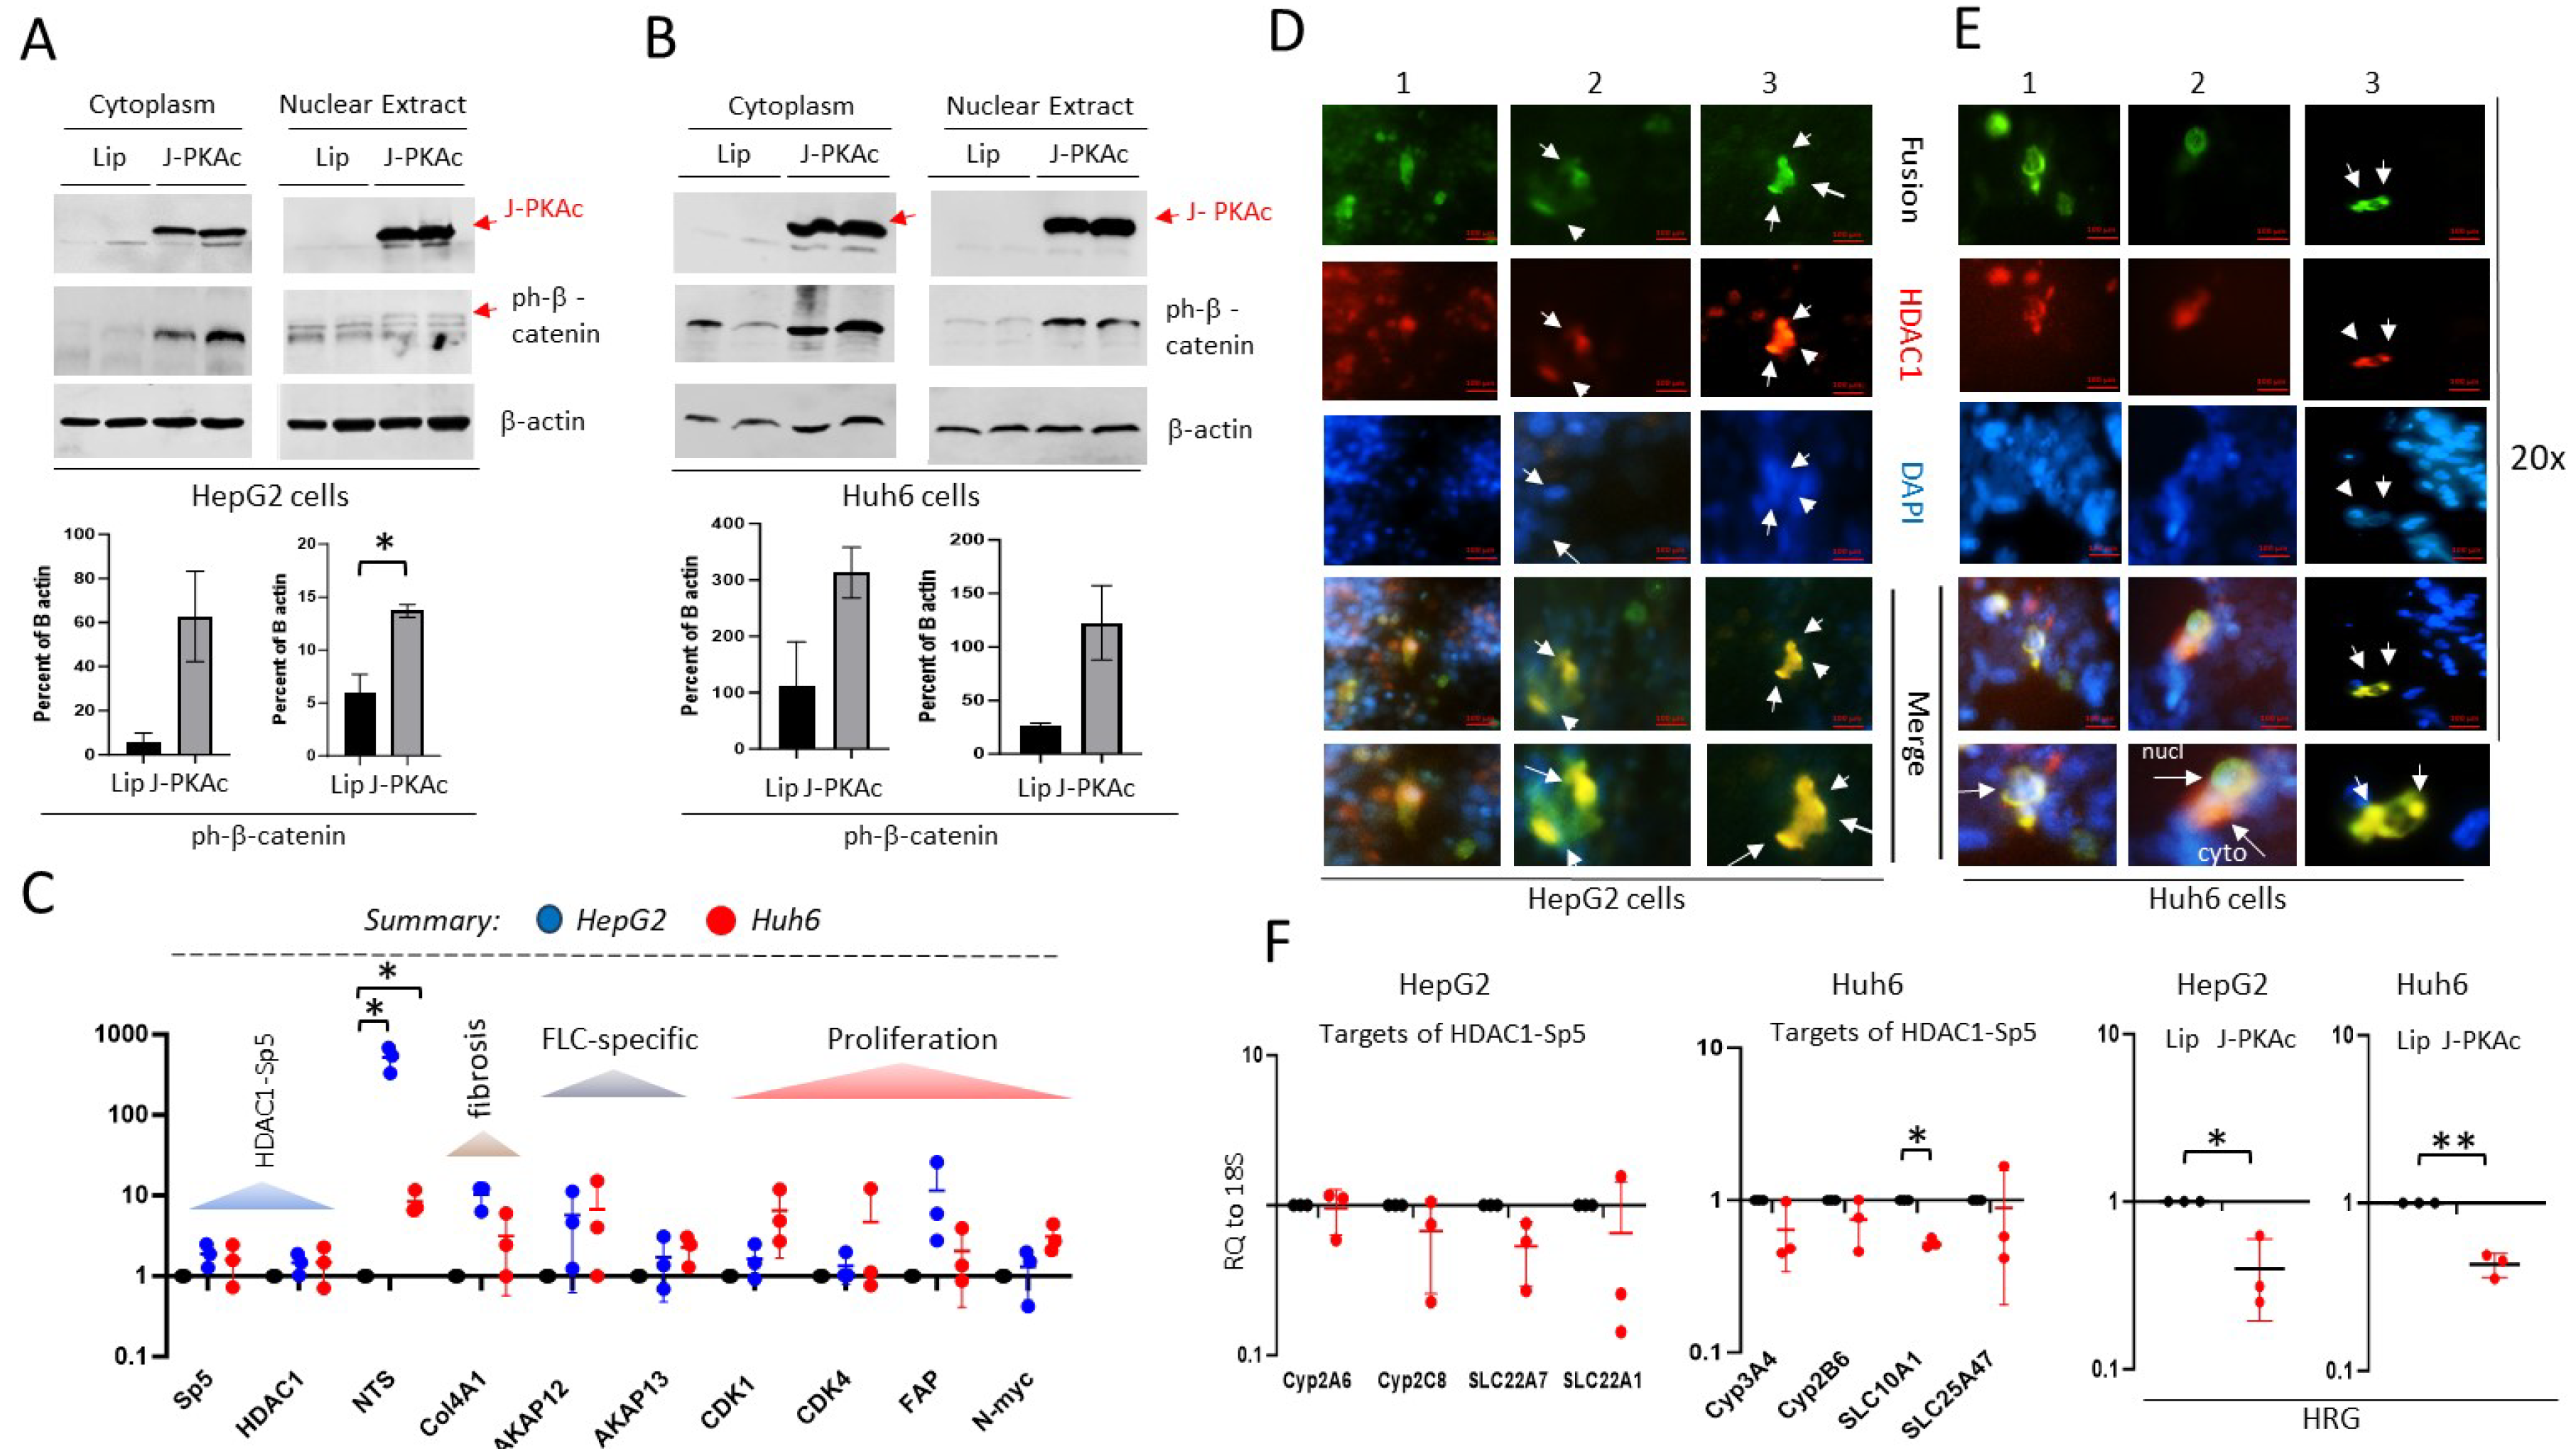
Figure 9.
The expression of J-PKAc fusion kinase in a patient-derived HBL cell line determines formation of elongated lamellar-like structures. A) Expression of the fusion kinase in livers of HBL patients, tumors of which were used for generation of cell lines. The position of the fusion kinase is shown by a red arrow. B) Generation of hbl111 and hbl114 cell lines. Left part shows a “cell-free exit” strategy; right part shows Western Blot of whole cell extracts isolated from generated cell lines with Abs to C-terminal part of the PKAc and with Fus-Abs. C) Immunostaining of hbl114 cell line with fusion-specific Abs at 3-5 days after plating. D) Typical images of tumor clusters and elongated lamellar-like structures in cell lines hbl111, flc110 and hbl114 at 12 days after plating at low density. E) Immunostaining of the flc110 and hbl114 cells with Fus-Abs at 12 days after plating at low density. F) Elimination of the fusion kinase by inhibition of b-catenin-CEGRs/ALCDs pathway prevents formation of elongated structures in hbl114 cell line. The upper image shows Western Blots of proteins isolated from DMSO and PRI-724-treated hbl114 cells with Abs to PKAc and with Fus-Abs. The bottom part shows images of cells forming elongated structures and cells after treatments with PRI-724.
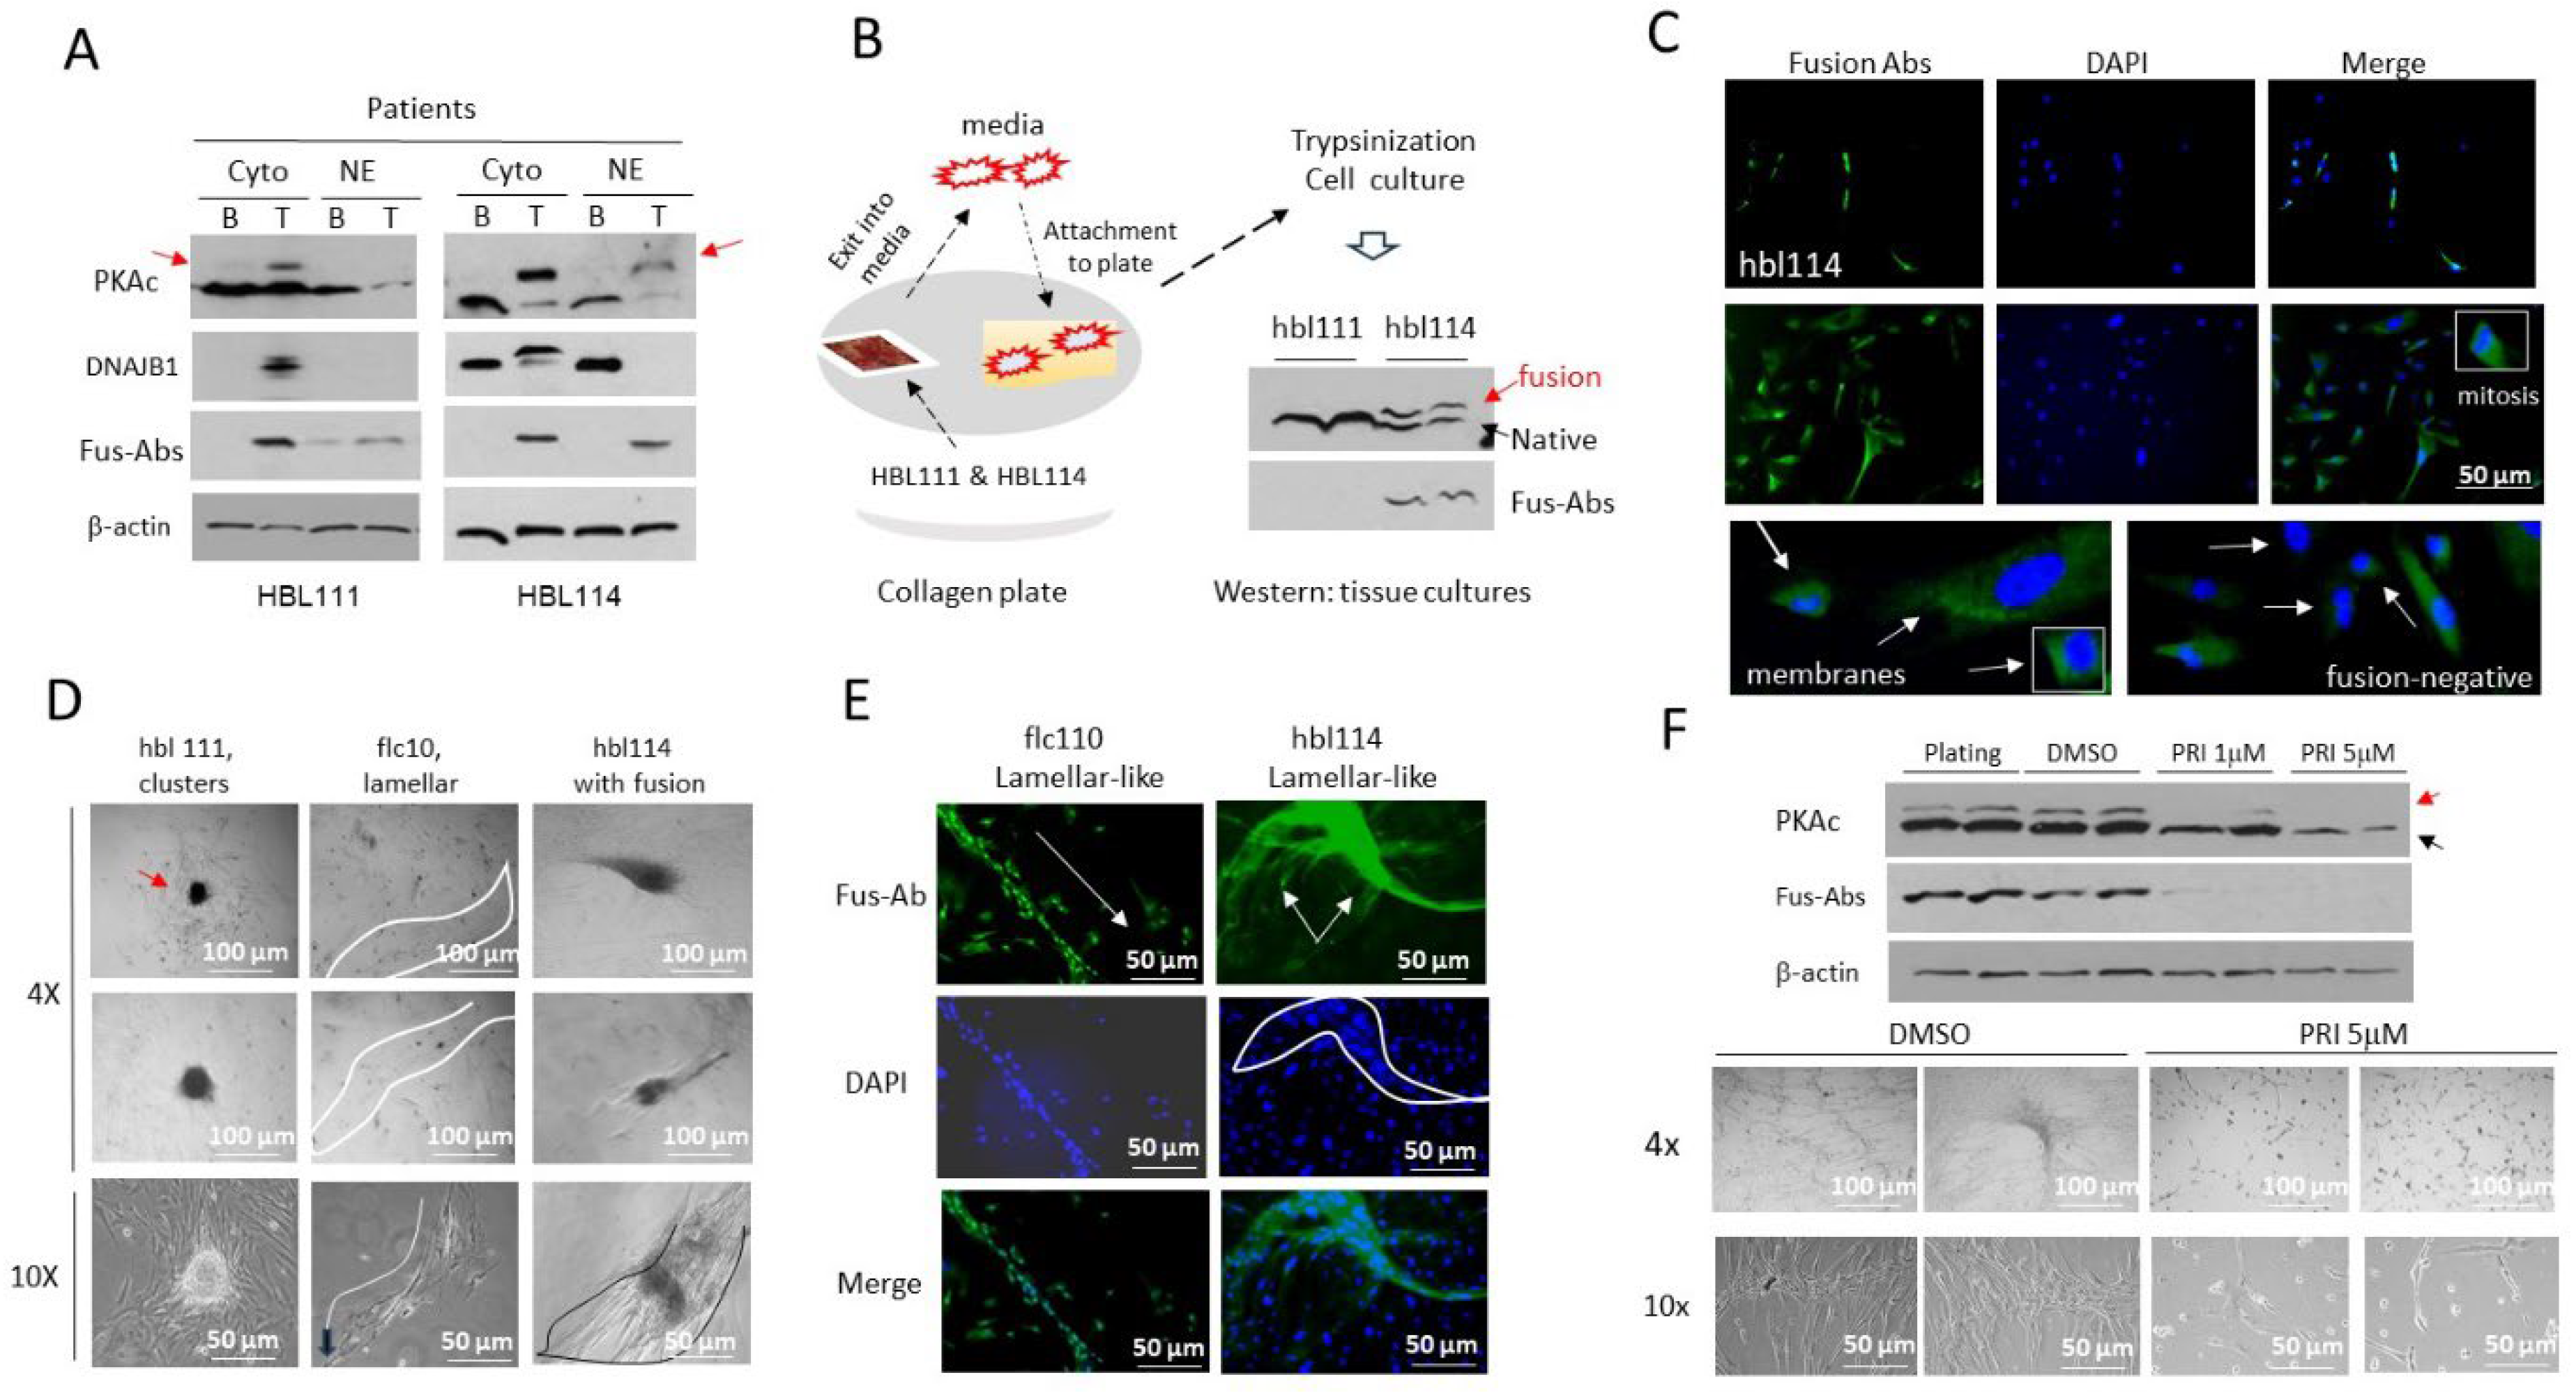
Figure 10.
A portion of patients with biliary atresia expresses the J-PKAc which correlates with elevation of J-PKAc-ph-S675-b-catenin dependent genes, fibrolamellar HCC specific genes and with elevation of mRNAs coding for cell cycle proteins. A) A table showing pathological characteristics of the six BA patients, livers of which were investigated. Age and levels of ALT/AST in fusion-positive patients are shown in red. B) Western Blots of protein extracts from 6 BA patients with antibodies to PKAc, to fusion kinase, to J-PKAc-b-catenin-TCF4 axis, and to downstream targets and proliferation markers. Coomassie staining on the top shows the integrity of proteins. Bar graphs show levels of proteins as ratios to b-actin determined by ImageJ software. C) Expression of FLC-specific mRNAs in all available fusion-positive BA samples (n=3) compared to fusion-negative samples (n=3), shown as averages of duplicate measurements. Paired t-tests were performed; differences are not significant in unlabeled plots. D) Expression of markers of proliferation in all available fusion-positive BA samples (n=3) compared to fusion-negative BA samples (n=3), shown as averages of duplicate measurements. Paired t-tests were performed; differences are not significant in unlabeled plots. E) Expression of the fusion kinase in recently collected specimens from patients with HBL was detected by Western blot with antibodies to PKAc (upper) and with Fus-Abs (bottom). The membrane was re-probed with antibody to b-actin. F) A hypothesis for the elimination of fusion-expressing cells with age and for development of FLC in patients who failed to eliminate the fusion-expressing cells. G) A summary showing J-PKAc-dependent pathways that are increased in fusion-positive HBL/HCN-NOS.
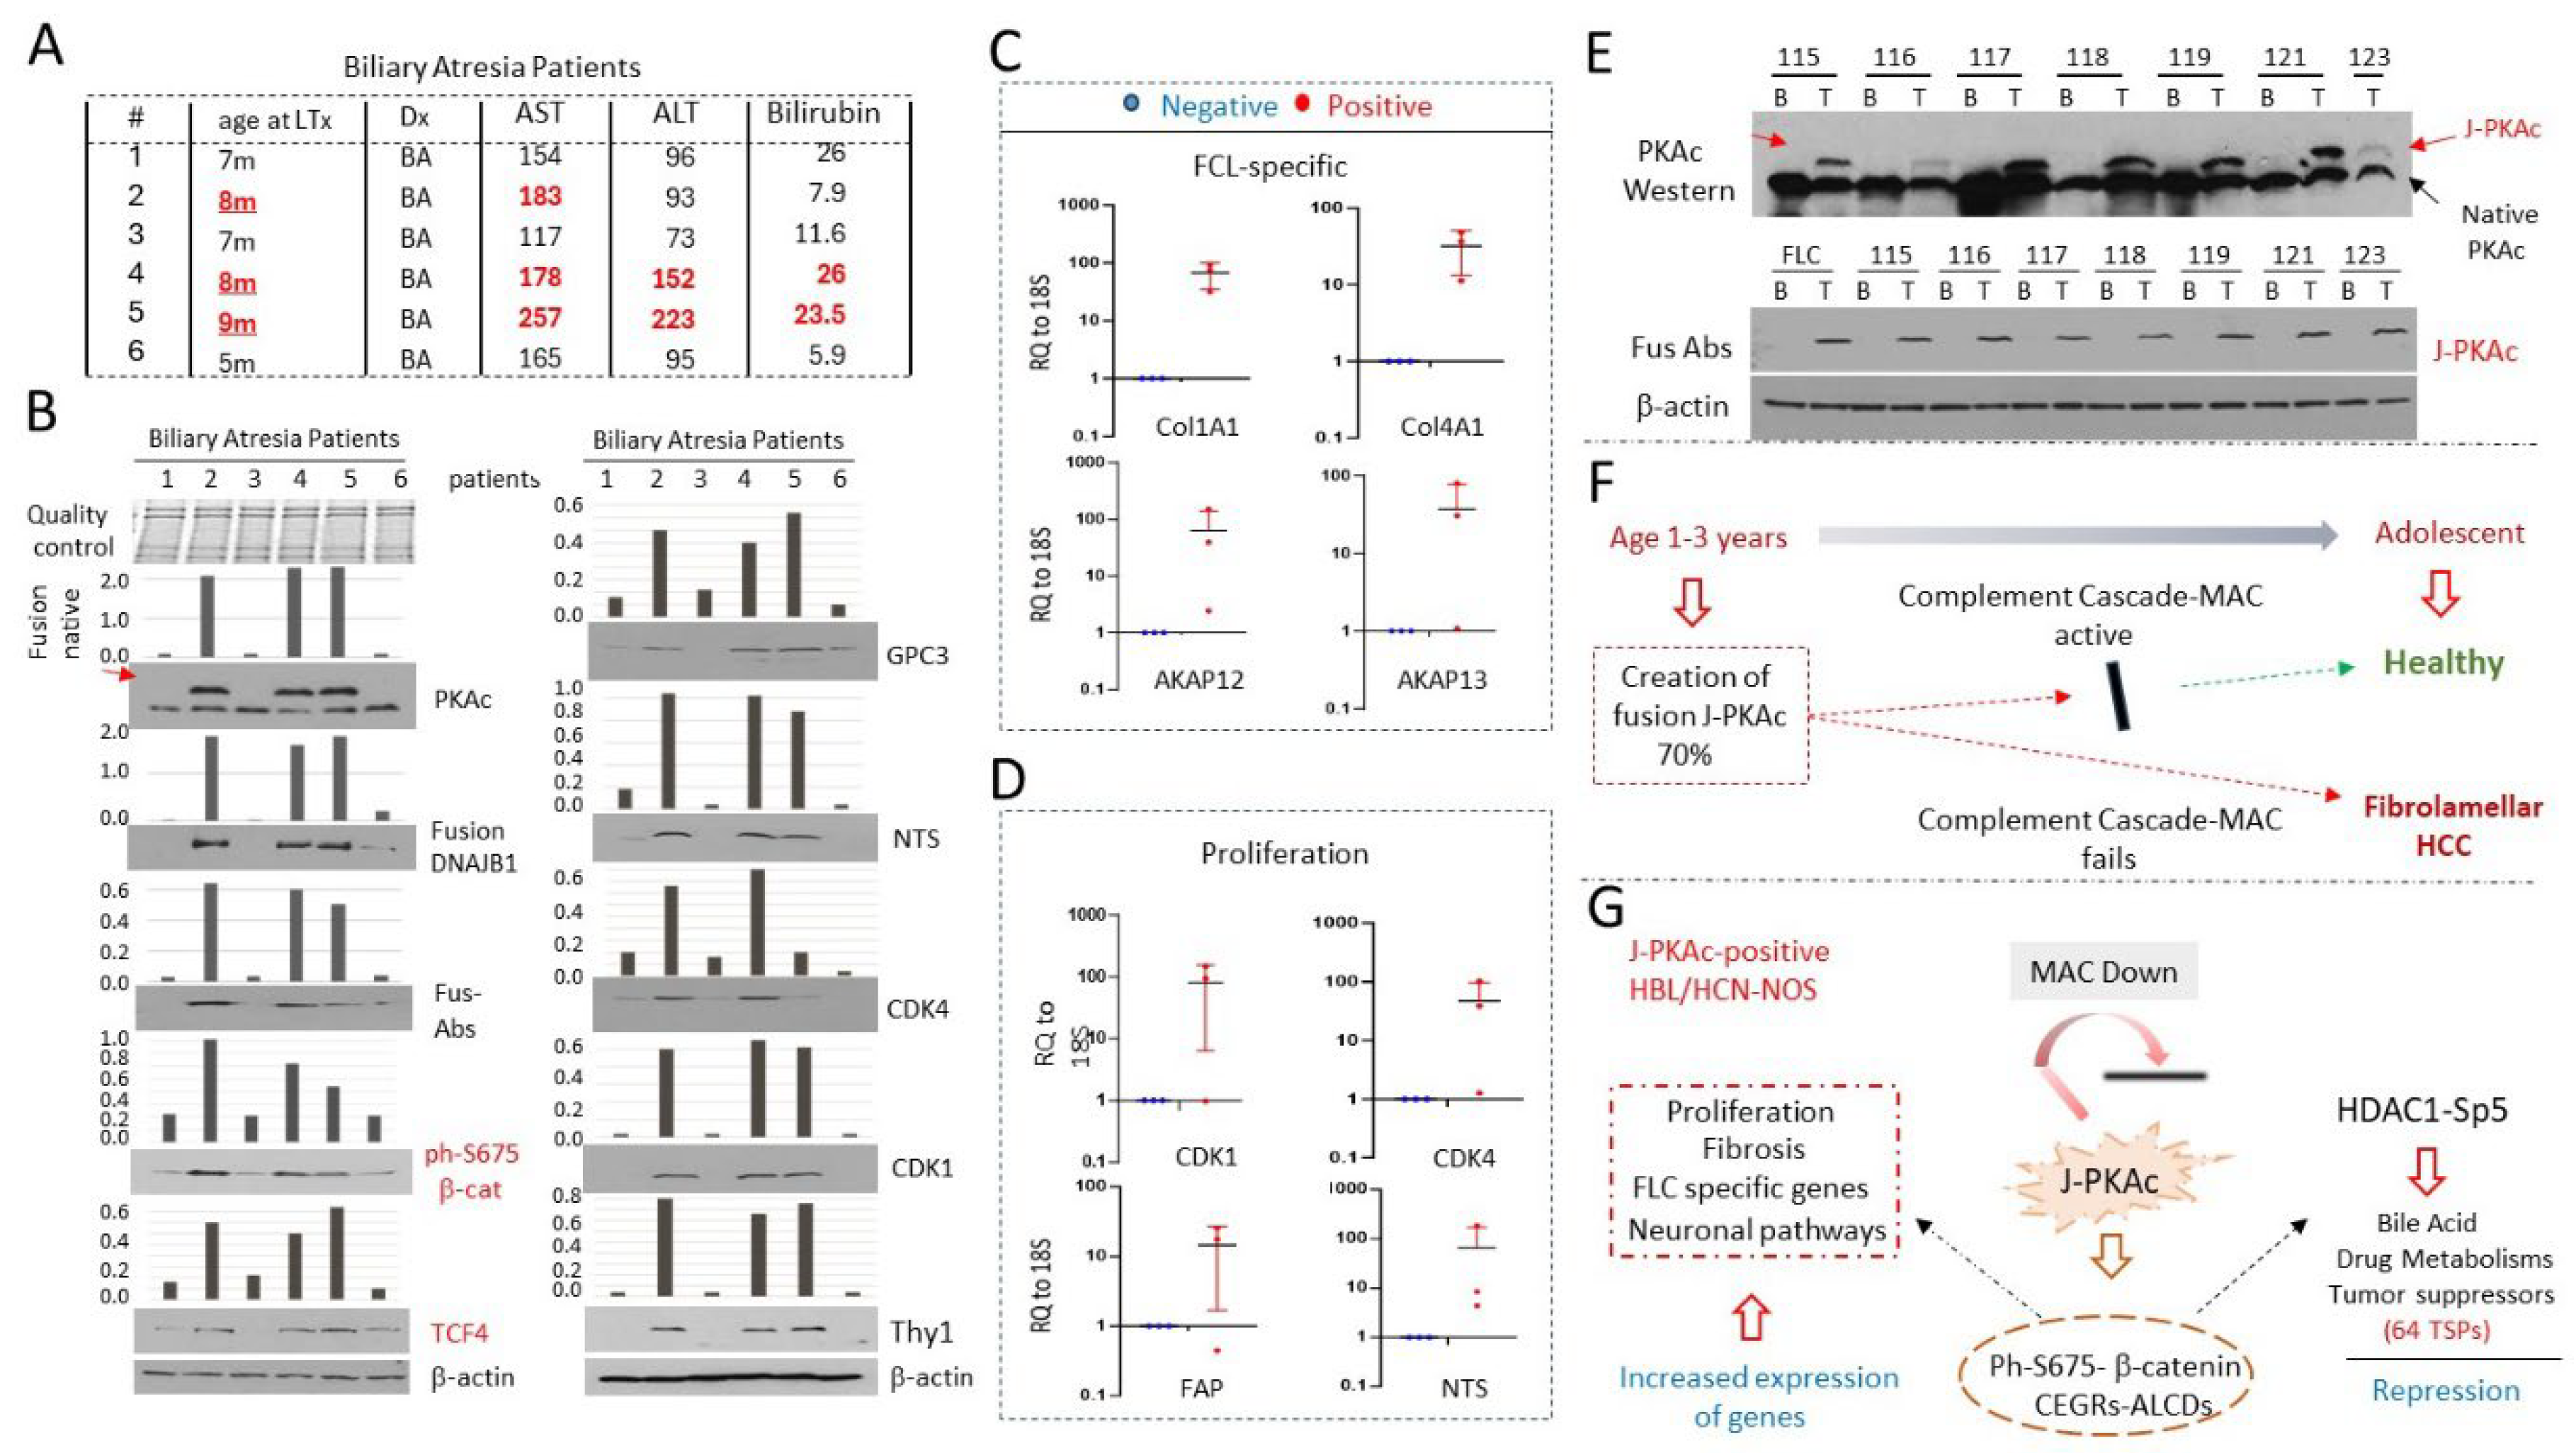
Disclaimer/Publisher’s Note: The statements, opinions and data contained in all publications are solely those of the individual author(s) and contributor(s) and not of MDPI and/or the editor(s). MDPI and/or the editor(s) disclaim responsibility for any injury to people or property resulting from any ideas, methods, instructions or products referred to in the content. |
© 2024 by the authors. Licensee MDPI, Basel, Switzerland. This article is an open access article distributed under the terms and conditions of the Creative Commons Attribution (CC BY) license (http://creativecommons.org/licenses/by/4.0/).
Copyright: This open access article is published under a Creative Commons CC BY 4.0 license, which permit the free download, distribution, and reuse, provided that the author and preprint are cited in any reuse.


