Submitted:
15 November 2024
Posted:
18 November 2024
You are already at the latest version
Abstract
Dielectric spectroscopy is known as one of the most powerful technique for studying ferroelectric and other polar materials. Since the discovery of ferroelectricity in LCs it was successfully employed for characterization of ferro-, antiferro- and ferri-electric liquidcrystalline phases. However, recently the Boulder group raised the question of the applicability of dielectric spectroscopy for characterization ferroelectric nematics due to parasitic effect of the insulating alignment layers. This effects on the apparent/measured values of the dielectric permittivity. In this paper we study this effect in greater detail. The following issues will receive special attention. Are the real values of dielectric permittivity lower or higher than the measured ones? Can the real values of dielectric permittivity be recovered in the cell with alignment layers? We also provide an example of the effect of insulating alignment layers in non-ferroelectric nematic phase.
Keywords:
ferroelectric nematic
; Liquid Crystals
; dielectric spectroscopy and permittivity
1. Introduction
Dielectric spectroscopy is one of the most sensitive method for study ferroelectric and other polar materials/phases. This was successfully employed for characterization of ferro-[1–4] / antiferro- [5,6] and ferri-electric [7,8] liquidcrystalline phases. The dielectric spectroscopy was applied for characterization of two independently discovered compounds exhibiting the ferroelectric nematic (NF) phase [9,10]. Ferroelectric nematic materials are characterized by a large spontaneous electric polarization ~ 5 μC/cm2 due to a strong order of dipoles resulting in giant / Colossal dielectric Permittivity (CP) in order of 10,000 and even higher [9,11–21]. Interestingly, some materials show optical activity from mirror symmetry breaking [22–24] in the ferroelectric nematic as well in high temperature “classical” paraelectric nematic phases. CP was also observed earlier in the bent-core LC compounds [25,26].
2. Results
2.1. Limitation of Apparent Capacitance due to Alignment Layers
Recently the Boulder group poured a cold shower on entire dielectric society, raising the question of the applicability of dielectric spectroscopy for ferroelectric nematics due to effect of the insulating alignment layers on the apparent/measured values of the dielectric permittivity [27]. They have noticed that the apparent capacitance Capp of LC cell can be expressed as two capacitances in series: capacitance of the LC layer, CLC and capacitance of insulating alignment layers, Cal. Hence the apparent capacitance is
There can be two possible opposite cases: the ordinary case, where CLC « Cal, and the opposite extraordinary case, where CLC » Cal. In the ordinary one, i.e., in LCs with the low/moderate dielectric permittivity, capacitance of the LC layer CLC « Cal and the apparent capacitance according Eq(1) equals to capacitance of LC cell, Capp= CLC and it gives real/actual value of the capacitance and dielectric permittivity. However, in the liquids/LCs with very high dielectric permittivity (ε > 10,000), such as in the bent-core compounds [25,26] and the ferroelectric NF phase, the capacitance of LC cell can exceed the capacitance of the alignment layer, CLC » Cal. In such extraordinary case, the apparent capacitance is limited to the capacitance of the alignment layers, Cal. We term it as the Clark’s limit, Capp= Cal or . Therefore, the answer to the first raised question “Are the real values of dielectric permittivity lower or higher than the measured ones?” is obviously “lower”. However and surprisingly, the original paper [27] states opposite: “… deriving dielectric constants from electrical impedance measurements of high-polarization ferroelectric liquid crystals, …, can result in overestimation of the ε’ values of the LC by many orders of magnitude.” [27], i.e., CLC ≪ Capp. An explanation of this contradiction will be given at the end of the article. This limit was studied experimentally which confirms that it is proportional to the cell thickness. In other words in the extraordinary case the apparent capacitance will be linearly dependent on ratio and these feature were observed and confirmed experimentally [28,29,30,31,32].
In such extraordinary case, CLC » Cal, the apparent LC capacitance Capp (and dielectric permittivity) would be limited by Clark’s limit Cal, which is temperature independent. This can be illustrated in the Figure 1(a), which shows the apparent capacitance as function of the actual capacitance of LC cell for Cal= 100.
It should be noticed that this dependence is rather smooth, so that even at CLC = 10∙Cal the apparent capacitance is not completely saturated, reaches only 90% of limit value Cal and still has 10 % to grow showing weak temperature dependence. Such weak temperature dependence can be seen in the Figure 1 (b) which presents the temperature dependence of the dielectric strengths of three relaxation processes Δεi and the total dielectric permittivity, (which includes all three relaxation processes in the measured frequency range, i.e., ) of 4 μm DIO homeotropic cell, adopted from [20]. In the middle temperature range where the total dielectric permittivity is rather moderate (~< 1000), i.e., well below the limit, all relaxation processes show strong temperature dependence. However, in the low and high temperature range where the total dielectric permittivity is rather high ~< 3700 the temperature dependence of dielectric strengths shows very weak temperature dependence indicating that they are rather close to the Clark’s limit (~4000 see as dash line Figure 1(b)) as expected in extraordinary case. Moreover, in the high temperature range the apparent permittivity is higher than in high temperature range it shows weaker temperature dependence according to the Figure 1(a).
Summarizing the effect of alignment layers in extraordinary case we notice three important features: (i) the apparent capacitance (permittivity) shows very weak temperature dependence; (ii) is linearly dependent on the cell thickness and (iii) the measured dielectric permittivity is limited by the alignment layers.
2.2. Reconstruction of Accutial Value of Apparent Capacitance
Now let’s return to the second question “Can the real values of dielectric permittivity be recovered in the cell with alignment layers?”. In this regard, it is worth noting the following publication which is directly related to this issue and entitled “Constraining the value of the dielectric constant of the ferroelectric nematic phase.” [30]. The word “constraining” explicitly implies that the measured value of dielectric permittivity is overestimated as noticed in the Ref. [27] and can be corrected to lower value. To check this question, let’s notice the real dielectric permittivity value, even being limited, can be deduced or recovered from the Eq. (1) with more or less accuracy depending on accuracy of assumed value of limit. Eq.(1) can be rewritten as or as for dielectric permittivity.
Figure 2(a) presents the dependence of “recovered” LC dielectric permittivity on the apparent permittivity for Clark’s limit of as 4000 and temperature dependence of “recovered” dielectric permittivity of 4 μm DIO homeotropic cell. The value recovered dielectric permittivity diverges on approaching the limit value (Figure 2(a)) and high recovered permittivity value due to ions (Figure 2(b)) might have a certain error. However, in the low temperature range corresponding to NF phase the apparent permittivity is ~3200 which is rather far from the limit of 4000, the value of recovered permittivity ~10000 is rather confident and typical for ferroelectric nematic phase.
2.3. Materials and Methods
We performed the dielectric spectroscopy study of new ferroelectric nematic compound WJ-16, which molecular structure and phase transitions are shown in the Figure 3.
This compound was derived from DIO by replacing the fluorinated benzene ring with pyrimidine. This substitution increases the dipole moment by 1 D to 10.8 D. However, this increase does suppress the NF phase but induces SmA instead. This shows that the large dipole moment is not sufficient condition for formation of ferroelectric nematic phase [13,21]. This phenomenon was explained theoretically and experimentally. Madhusudana theoretically showed the importance of specific charge distribution along the molecule for formation ferroelectric state [33]. Finally, Li et al. [13] systematically analyzed more than 100 new ferrogenic nematic compounds and defined the Pearson’s coefficient (or impact) of different parameters responsible for ferroelectric nematic phase. The most important of them are: the dipole moment (0.26); molecular length (0.19); and the dipole angle (0.16). Therefore the dipole moment itself being most important parameter cannot however guarantee the formation of ferroelectric nematic phase. Therefore the absence of NF phase in WJ-16, which has a higher dipole moment DIO is not a surprise.
2.4. Dielectric Spectroscopy of Polymer-Coated Planar LC Cells
Dielectric spectroscopy measurements over a frequency range 0.1 Hz–10 MHz were made using a broadband Alpha High Resolution Dielectric Analyzer (Novocontrol GmbH, Germany). We used commercial cells (E.H.C ltd., Japan) of different thicknesses (2, 4, 9, 15 and 25 μm) with both homeotropic and planar alignment and also with uncoated bare ITO electrodes to avoid possible limitation from alignment layers. The ITO electrodes used in these cells have very low sheet resistance (5 Ω/□) to avoid the parasitic peak arising from the sheet resistance of ITO in series with the capacitance of the cell. The measurements were carried out under the application of weak voltage 0.1 V applied across the cell. The temperature of the sample is stabilized to within ± 0.05 oC. The dielectric spectra are analyzed using the Novocontrol WINFIT program.
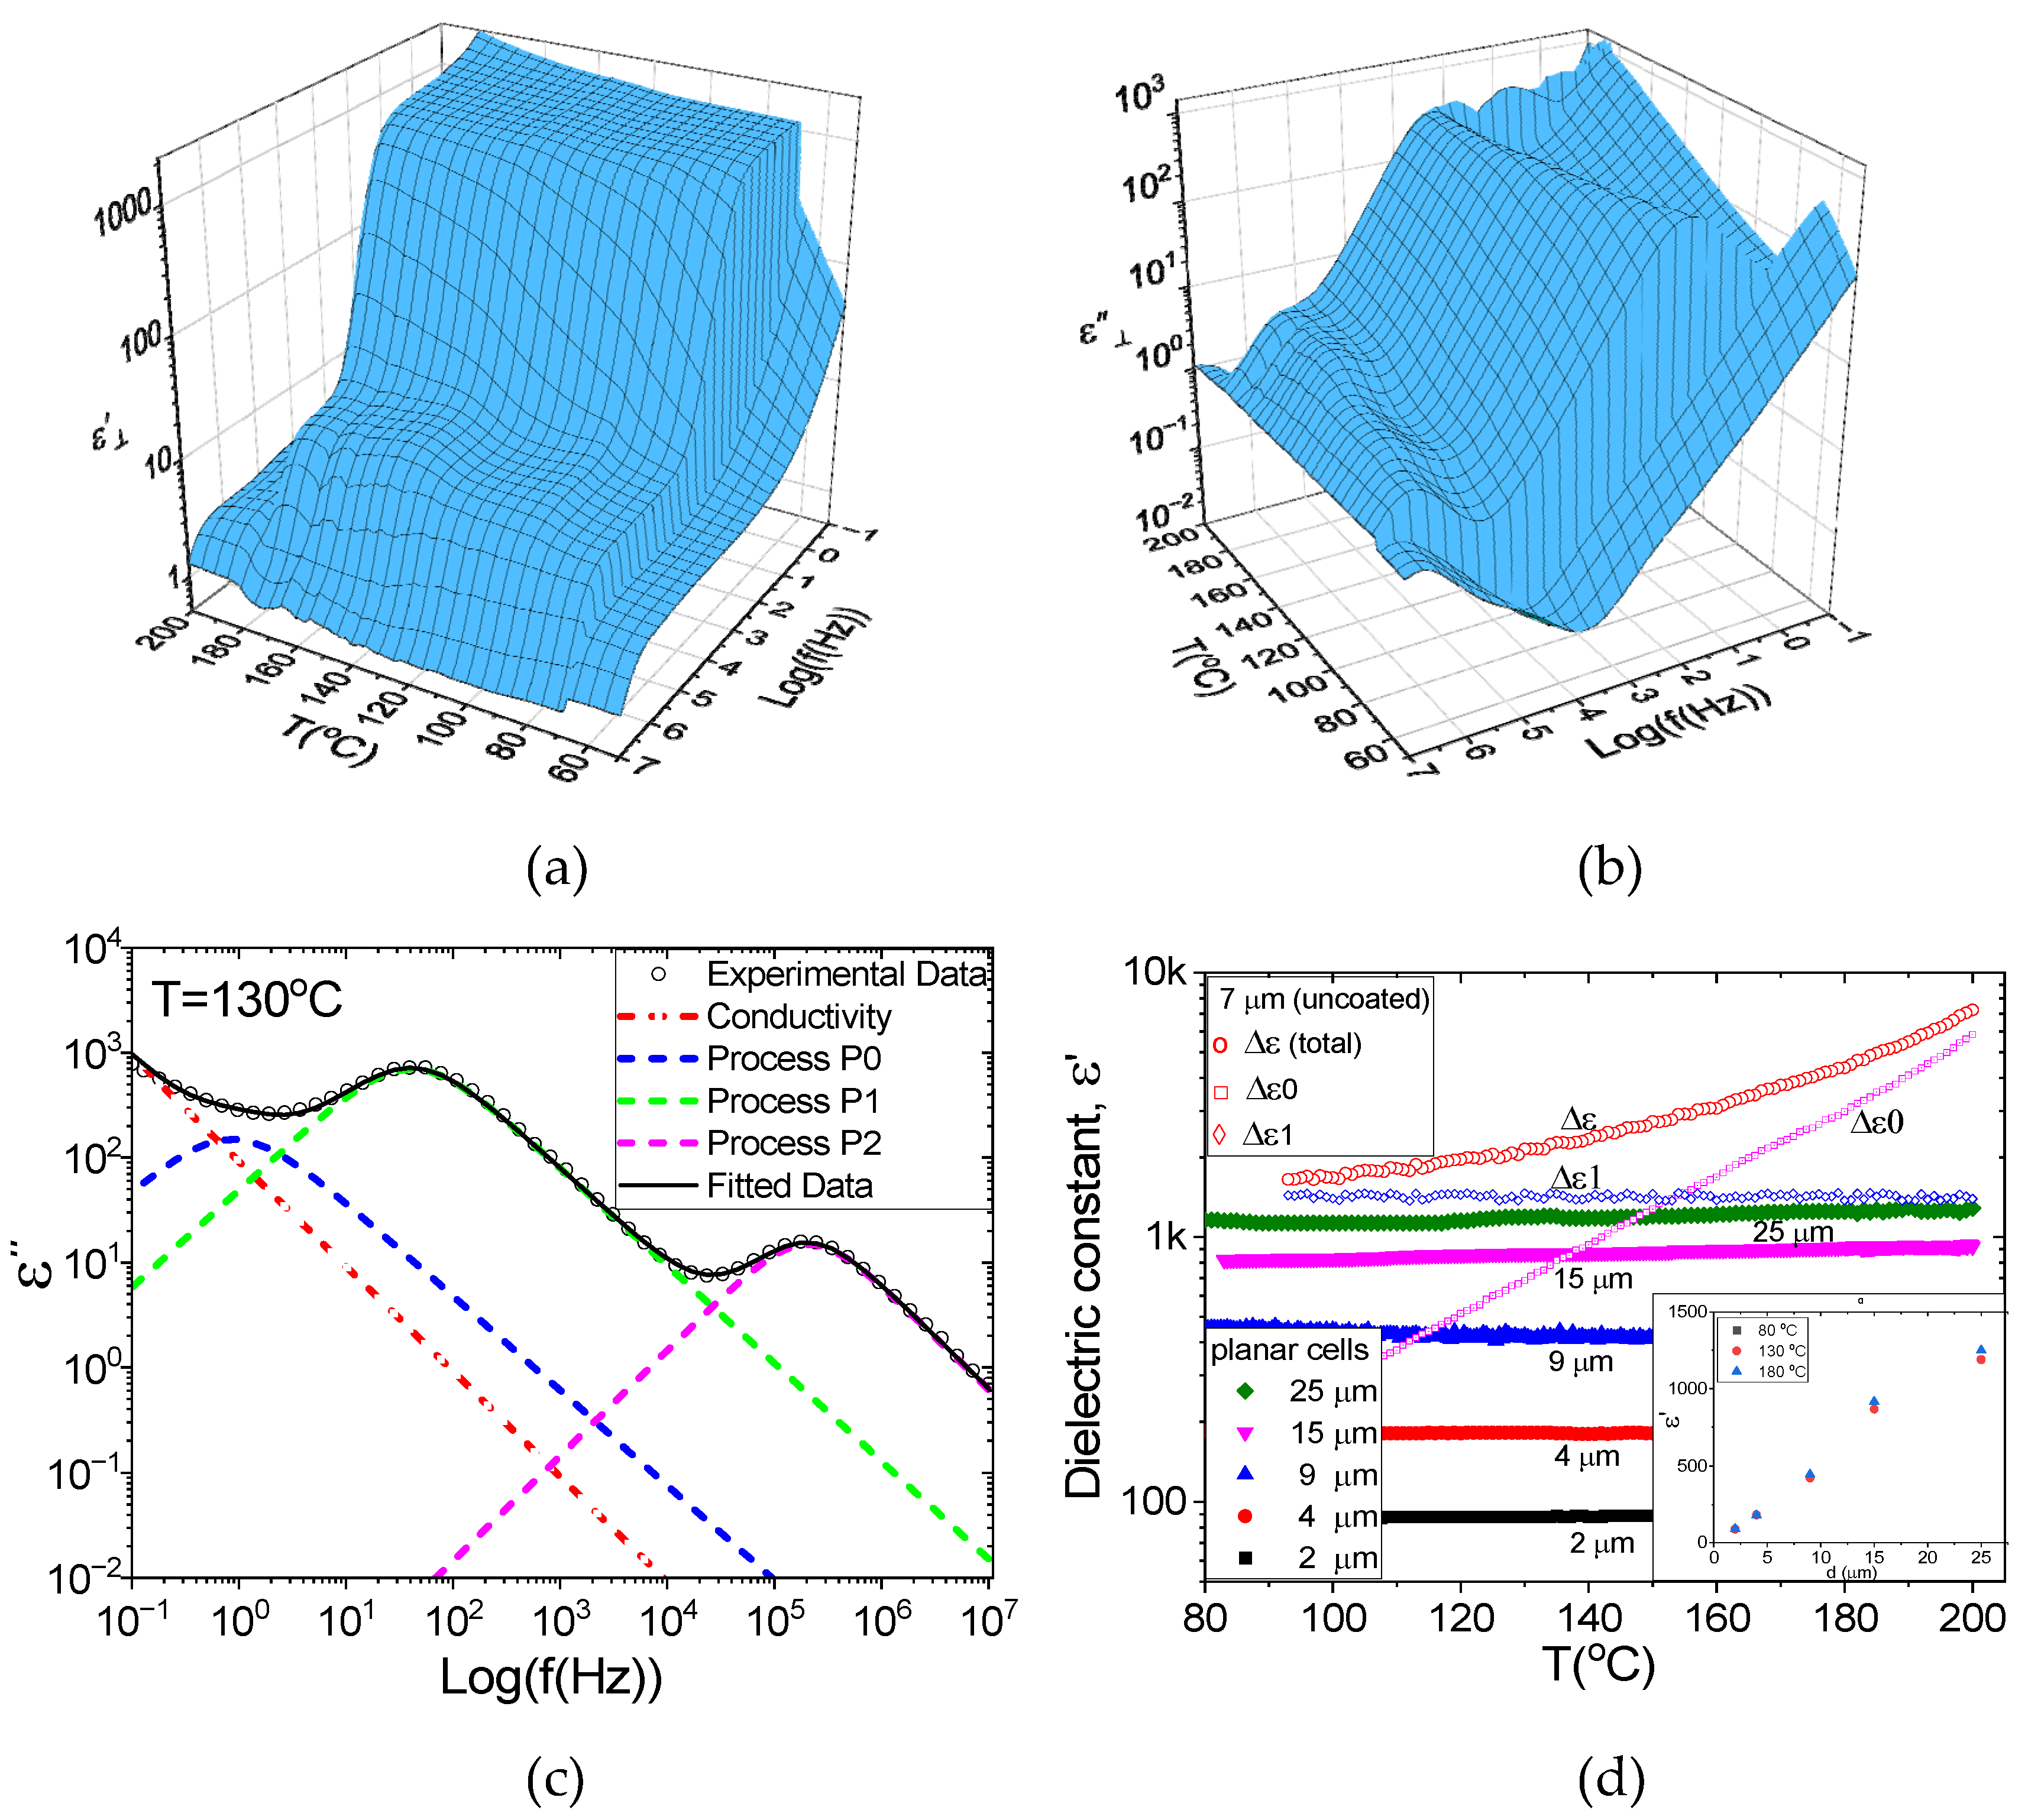
Figure 4 (a,b) shows 3D temperature dependencies of the real (ε’) and imaginary (ε”) parts of the complex permittivity in the frequency range of 0.1 Hz to 10 MHz in a 7 μm uncoated cell.
Let’s consider the results on the cells with electrodes coated by planar alignment layer first. Figure 3(d) presents the temperature dependence of dielectric permittivity at 0.1 Hz for planar cells of different thicknesses. The dielectric permittivity of these cells is temperature independent and linearly dependent on the cell thickness showing both main features of extraordinary case (CLC » CAL) and therefore they restricted by Clark’s limit which is linearly increase with cell thickness.
We can estimate capacitance of the insulating alignment layers of our cells , and assuming the layer thickness dal= 200 nm, and its permittivity as εal ~ 5, we obtain Cal ~ 5.5 nF. This capacitance limits the apparent value of the dielectric permittivity for 4 μm cell to ~100 which is in good agreement with the experimental value of 180, considering that the actual values of thickness and the permittivity of alignment layer may be different from the assumed values. In order to avoid this limitation and to get the actual values of the dielectric permittivity, one needs to increase capacitance of the alignment layers Cal in approaching the ordinary case Cal » CLC. The only way to do this is to increase the ratio d/dAL or just to use uncoated (bare) metal/ITO electrodes [11,12,13,14,16,17,28,29,30,31,32]. This removes alignment layers limit and allows to measure permittivity up to fantastic ~ 300,000 [29].
2.5. Dielectric Spectroscopy of Uncoated Cells and Super-Paraelectrics
Figure 3(d) shows the temperature dependence of total dielectric permittivity of uncoated 7 μm cell which is shown as open red circles. The texture was quasi-planar and the expected value of dielectric permittivity of 7 planar cell with alignment layers is ~ 300 (see the inset Figure 4 (d)). However the permittivity of uncoated cell is ~1300 and it is also temperature dependent, which means we have the ordinary case (C « CAL) and the apparent (measured) value corresponds to real dielectric permittivity.
The complex permittivity data of 7 μm uncoated cell were fitted to the Havriliak-Negami, Eqn. (2) below to three relaxation processes, P0–P2, and as example of fitting quality for 130 oC is shown in the Figure 4 (c).
Looking at Figure 3, the unusual temperature behavior of the relaxation processes P0 and P1 immediately catches the eye. The dielectric strength of the P0, Δε0 increases exponentially on heating while the Δε1 is independent off temperature.
The relaxation processes in WJ-16 are somehow similar to those observed in DIO where the physical origin of the relaxation processes in DIO were assigned as follows [17,18,19,20]: the least frequency P0 arises from the dynamics of ions in the medium having accumulated on the alignment layers [34,35], which sometime is called as Electrode Polarization (EP) process [36] and highest frequency process P2 is individual molecular dynamics around long molecular axis. The lowest frequency relaxation process P0 which is usually considered as “parasitic” and is responsible for abnormal rise of dielectric permittivity on heating to the Isotropic phase.
However the middle frequency relaxation process P1 in WJ-16 has different physical origin than P1 in DIO. In DIO The largest P1 is observed only in NF phase and was theoretically developed as so-called polarization-capacitance Goldstone (PCG) mode [27].
However, in WJ-16 it can’t be a Goldstone PCG mode because, firstly, this material does not possess the ferroelectric NF phase. Secondly, it is also observed in all phases including SmA, nematic and evenisotropic, and thirdly, its dielectric strength is independent of temperature (see Figure 3(d)). Despite the Colossal Polarization (CP), this substance does not exhibit any ferroelectric properties, instead of that it shows perfect homogeneous domain-free texture and hysteresis-free switching and linear P-E dependence [37], i.e., behaves overall as typical paraelectric. These properties, together with CP, allow this material to be classified as Super-Para-Electric (SPE). Further details on assignment and other features of SPE are given in the Ref. [37] here we just use this example to show that the Clark’s limit is observed in non-ferroelectric LCs as well.
In summary we experimentally confirm the limiting effect of alignment layer capacitance. This limit is due to the total dielectric permittivity, which is the sum of contributions of all relaxation processes in the cell. For example, (Figure 1(b)) in the low temperature range of DIO corresponding to the NF phase the saturation occurs mainly due to the Goldstone mode (P1) while in high temperature range, i.e., in paraelectric N phase, the main contribution comes from the ionic accumulation or EP process. However, WJ-16 does not have ferroelectric NF but also exhibits CP in SPE state. The dielectric permittivity in SPE (~1300) is about one order smaller than in NF phase however it may show an extraordinary case in the commercial cells due to rather high alignment layer thickness.
2.6. Further Discussions on Accual Capacitance
Here we switch our attention from the limiting effect of alignment layers to its interpretation in relation of apparent (measured) and real (actual) values of dielectric permittivity. Even though all the research groups agree with this effect, but its interpretation sounds absolutely opposite.
Now it’s the right time to clarify this issue. That this limitation occurs when capacitance of LC exceeds the capacitance of alignment layers, i.e., CLC >> Cal ≈ Capp. This explicitly supposes that real capacitance and dielectric permittivity is higher than the apparent value. This is illustrated by number of papers, here we will only give a couple of excerpts from them. Ref. [17]: “Thus, for studied here materials with very high permittivity the measured equivalent capacity of the circuit might be considerably lower than the actual capacity of LC”. Ref. [32]: “… the relative permittivity of the ferroelectric nematics is indeed huge, and it is even higher than the apparent measured values” and “… measurements confirm a huge relative permittivity of the ferroelectric nematic phase, which can even be orders of magnitude larger than the measured apparent values”.
However, according to the original opinion [27] supported in other papers [30] the Clark’s limit “…can result in overestimation of the ε’ values of the LC by many orders of magnitude.”, i.e., CLC ≪ Capp. However, this contradicts the condition for such limit, i.e., CLC >> Cal ≈ Capp
Such curious contradiction can be easily explained by different interpretation of the term “relative permittivity” or historically “dielectric constant”. The Ref. [30] states that “In this paper, we have once again ruled out the CP values of the NF phase. In doing so, we have followed the classical definition of permittivity, which does not include the spontaneous polarization, as in solid ferroelectrics.” Therefore, according to this interpretation, which excludes the ferroelectric Goldstone mode (Δε1) contributing the largest to the total permittivity, and the rest of the permittivity from other weaker processes (Δε2) is less than the apparent one. It is not clear from [27,30] whether the authors also exclude Δε0 due to the ionic process P0? If not, as they didn’t mention about it explicitly, the total dielectric permittivity or capacitance may exceed the capacitance of alignment layers without ferroelectric Goldstone mode due to exclusively by ionic mode Δε0 as can be seen in the Figure 1 (b) for T > 150 oC.
However, such a definition of relative permittivity can hardly be accepted as “classical”. According to classical definition of “dielectric constant” (or “relative permittivity”) it is defined as ratio of the total dielectric permittivity to the permittivity of vacuum, , where ε(ω) is the complex frequency-dependent permittivity of the material which includes all relaxation processes and can be measured as . Accepting this “classical” definition the actual dielectric permittivity in (not only) ferroelectric nematics is higher than the apparent one.
3. Conclusions
In this paper we study different issues related to the applicability of dielectric spectroscopy for studying ferroelectric nematic LCs. The main issue was a fact that in the ferroelectric nematics with the giant dielectric permittivity the LC capacitance may exceed the capacitance of alignment layers and the apparent (measured) capacitance will be limited by Cal. In this study we showed that such limitation is also observed in non-ferroelectric but paraelectric nematic phase due to high contribution of ionic separation process to the total dielectric permittivity and in new superparaelectric (SPE) materials, such as WJ-16. We have also demonstrated how an actual dielectric permittivity can be retrieved from the limited apparent value.
Although such limitation effect is well-accepted their interpretation is different and depends on certain definition of dielectric permittivity. According “classical” definition where the permittivity of the material includes all relaxation processes the actual dielectric permittivity is higher than the apparent one. According to other definition of dielectric permittivity, which does not include the ferroelectric Goldstone mode the actual dielectric permittivity is lower than the apparent one.
References
- C. Filipic, T. Carlson, A. Levstik, B. Zekz, R. Blinc, F. Gouda, S. T. Lagerwall and K. Skarp, Dielectric properties near the smectic-C*–smectic-A phase transition of some ferroelectric liquid-crystalline systems with a very large spontaneous polarization., Phys.Rev.A, 38, 5833 (1988).
- A.M. Biradar, S. S. Bawa, and Subhas Chandra, Dielectric relaxation in a high-tilt-angle chiral-nematic–smectic-C* ferroelectric liquid crystal., Phys.Rev.A, 45, 7282 (1992).
- F. Gouda, W. Kuczynski, S. T. Lagerwall, M. Matuszczyk, T. Matuszczyk and K. Skarp, Determination of the dielectric biaxiality in a chiral smectic-C phase., Phys.Rev.A, 46, 951 (1992).
- Yu. P. Panarin, Yu. P. Kalmykov, S. T. Mac Lughadha, H. Xu and J. K. Vij, Dielectric Response of SSFLC Cells., Phys.Rev.E, 50, 4763-4772 (1994).
- M. Fukui, H. Orihara, A. Suzuki, Y. Ishibashi, Y. Yamada, N. Yamamoto, K. Mori, K. Nakamura, Y. Suzuki, I. Kawamura., Dielectric Dispersion in the Antiferroelectric Liquid Crystal MHPOBC., Jpn.J.Appl.Phys., 29, L329 (1990).
- Yu. P. Panarin, O. E. Kalinovskaya and J. K. Vij, The investigation of the relaxation processes in AFLCs by broad band dielectric and electro-optic spectroscopy., Liq.Cryst., 25(2), 241-252 (1998).
- K. Hiraoka, A. Taguchi, Y Liq.Cryst.,25(2),241-252u. Ouchi, H. Takezoe, A. Fukuda., Jpn.J.Appl.Phys., 29, L103 (1990).
- Yu. P. Panarin, O. E. Kalinovskaya, J. K. Vij and J. W. Goodby., Observation and Investigation of the Ferrielectric Subphase with high qT parameter., Phys.Rev.E, 55, 4345 (1997).
- H. Nishikawa, K. Shiroshita, H. Higuchi, Y. Okumura, Y. Haseba, S. Yamamoto, K. Sago and H. Kikuchi, A fluid liquid-crystal material with highly polar order, Adv. Mater., 29, 1702354 (2017). [CrossRef]
- R. J. Mandle, S. J. Cowling and J. W. Goodby, Rational design of rod-like liquid crystals exhibiting two nematic phases, Chemistry-a European Journal, 23, 14554 (2017). [CrossRef]
- N. Sebastian, L. Cmok, R. J. Mandle, M. R. de la Fuente, I. Drevenšek Olenik, M. Copic, and A. Mertelj, Phys.Rev.Lett. 124, 037801 (2020).
- X. Chen, E. Korblova, D. Dong, X. Wei, R. Shao, L. Radzihovsky, M. Glaser, J. Maclennan, D. Bedrov, D. Walba et al., Proc. Natl. Acad. Sci. USA, 117, 14021 (2020).
- J. Li, H. Nishikawa, J. Kougo, J. Zhou, S. Dai, W. Tang, X. Zhao, Y. Hisai, M. Huang, and S. Aya, Sci. Adv., 7, eabf5047 282930 (2021).
- H. Nishikawa and F. Araoka, Adv. Mater., 2101305 (2021).
- A. Manabe, M. Bremer, and M. Kraska, Liq. Cryst., 48, 1079 (2021).
- X. Zhao, J. Zhou, H. Nishikawa, J. Li, J. Kougo, Z. Wan, M. Huang, and S. Aya, Proc. Natl. Acad. Sci. USA, 118, e2111101118 (2021).
- Brown, E. Cruickshank, J. M. D. Storey, C. T. Imrie, D. Pociecha, M. Majewska, A. Makal, and E. Gorecka, ChemPhysChem, 22, 2506 (2021).
- H. Nishikawa, K. Sano, and F. Araoka, Nat. Comms., 13, 1142 (2022).
- N. Yadav, Y. P. Panarin, J. K. Vij, W. Jiang, G. H. Mehl, J. Mol. Liq., 378, 121570 (2023).
- N. Yadav, Yu. P. Panarin, W. Jiang, G.H. Mehl and J. K. Vij, Crystals, 13, 962 (2023).
- J. Hobbs, C. J. Gibb, and R. J. Mandle, Small Sci., 2400189 (2024).
- P. Kumari, B. Basnet, M. O. Lavrentovich, O. D. Lavrentovich, Science, 383, 1364–1368 (2024).
- N. Yadav, Y. P. Panarin, W. Jiang, G. H. Mehl, J. K. Vij, Phys.Chem.Chem.Phys., 25, 9083 (2023).
- N. Yadav, Y.P. Panarin, J. K. Vij, W. Jiang, G. H. Mehl, Liq.Cryst., 50, 1375-1382 (2023).
- L. Guo, E. Gorecka, D. Pociecha, N. Vaupotič, M. Čepič, R. A. Reddy, K. Gornik, F. Araoka, N. A. Clark, D. M. Walba, K. Ishikawa, H. Takezoe, Phys. Rev. E, 84, 031706 (2011).
- S. Nakasugi, S. Kang, Tso-Fu. M. Chang, T. Manaka, H. Ishizaki, M. Sone, J. Watanabe, J. Phys. Chem. B, 127, 6585−6595 (2023).
- N. A. Clark, X. Chen, J.E. Maclennan, M.A. Glaser, Phys. Rev. Research, 6, 013195 (2024).
- A. Erkoreka, A. Mertelj, M. Huang, S. Aya, N. Sebastian, and J. Martinez-Perdiguero, Journal of Chemical Physics, 159, 184502 (2023).
- Erkoreka, J. Martinez-Perdiguero, R. J. Mandle, A. Mertelj, N. Sebastián, Journal of Molecular Liquids, 387, 122566 (2023).
- Erkoreka and J. Martinez-Perdiguero, Phys. Rev. E, 110, L022701 (2024).
- Adaka, M. Rajabi, N. Haputhantrige, S. Sprunt, O. D. Lavrentovich, and A. Jákli, Phys. Rev. Lett., 133, 038101 (2024).
- V. Matko, E. Gorecka, D. Pociecha, J. Matraszek and N. Vaupotič, Arxiv:2401.16084 (2024).
- N. V. Madhusudana, Phys Rev. E 2021, 104, 014704.
- S. Murakami, H. Iga, H. Naito, J. Appl. Phys., 80, 6396 (1996).
- A. Kumar, D. Varshney, J. Prakash, Journal of Molecular Liquids, 303, 112520 (2020).
- F. Kremer, A. Schönhals (Eds.), Broadband Dielectric Spectroscopy, Springer Berlin, Heidelberg, Berlin, Heidelberg, (2003).
- Yu. P. Panarin, W. Jiang, N. Yadav, M. Sahai, Y. Tang, X. Zeng, O. E. Panarina, G. H. Mehl, J. K. Vij, “Colossal Dielectric Permittivity and Superparaelectricity in phenyl pyrimidine based liquid crystals.” J.Mater.Chem. C, 2024. [CrossRef]
Figure 1.
(a) Schematical diagram of the apparent capacitance dependence on the total capacitance LC layer for taking the capacitance of alignment layers as 100. (b) Temperature dependence of dielectric permittivity of 4 μm DIO homeotropic cell. The data points show the dielectric strengths of different relaxation processes: red (P0), green (P1), blue (P2) and the total permittivity (black). The horizontal dash line at ~ 4000 is estimated value Clark’s limit for this certain cell.
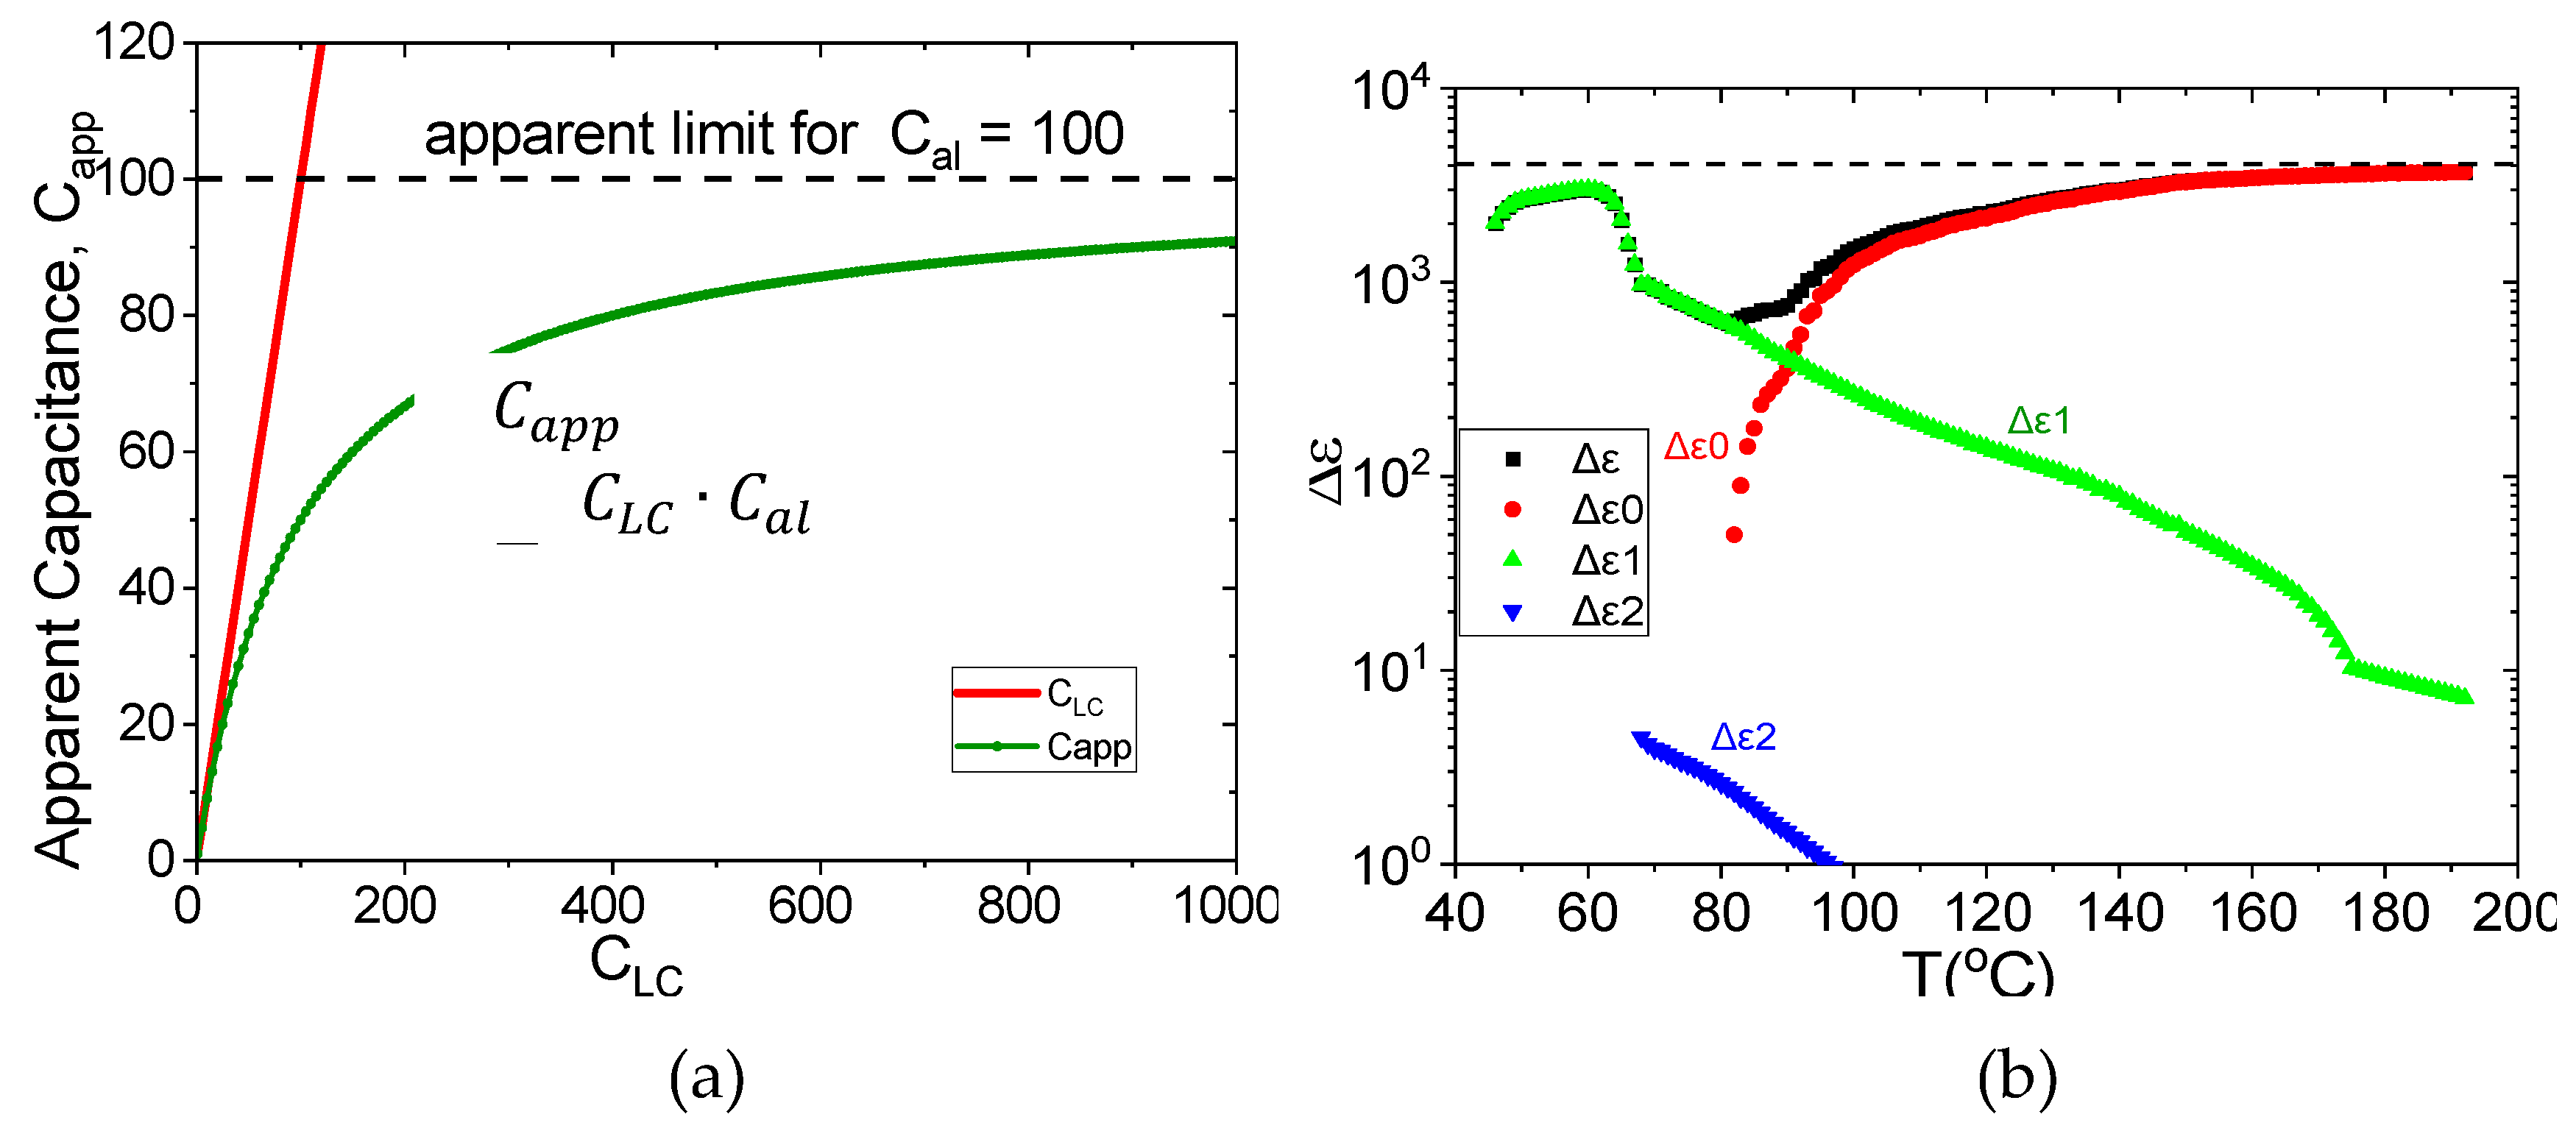
Figure 2.
(a) Schematical diagram of the LC dielectric permittivity dependence on the apparent permittivity for Clark’s limit of as 4000. (b) Temperature dependence of “recovered” dielectric permittivity of 4 μm DIO homeotropic cell. The data points show the dielectric strengths of different relaxation processes: red (P0), green (P1), blue (P2) and the total permittivity (black).
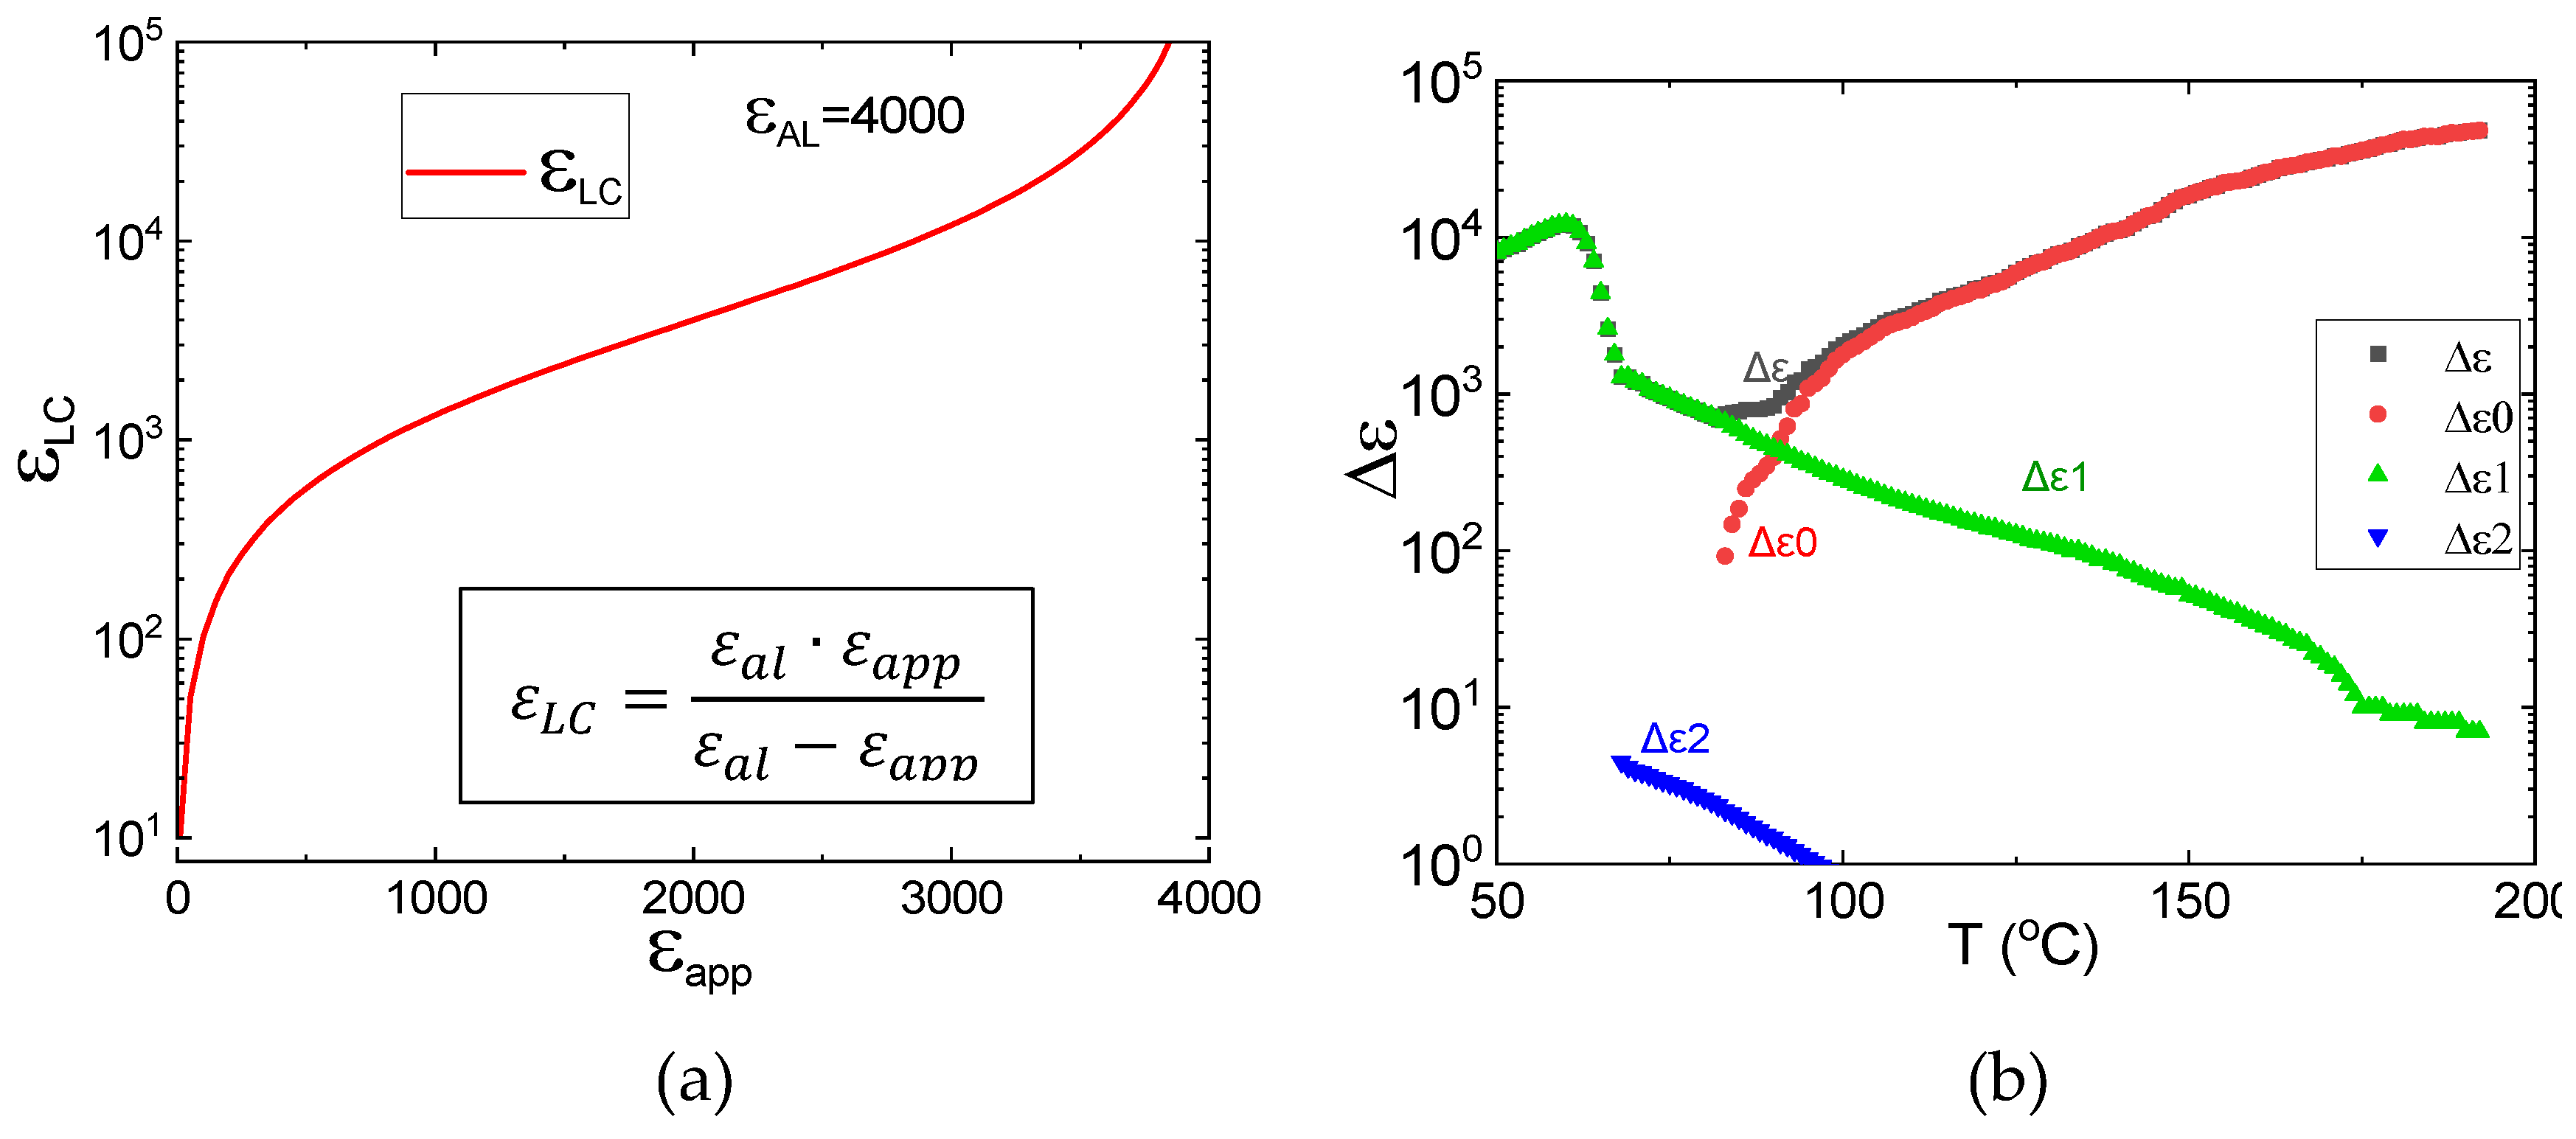
Figure 3.
The molecular structure, phase-sequence, and transition temperatures of WJ-16.
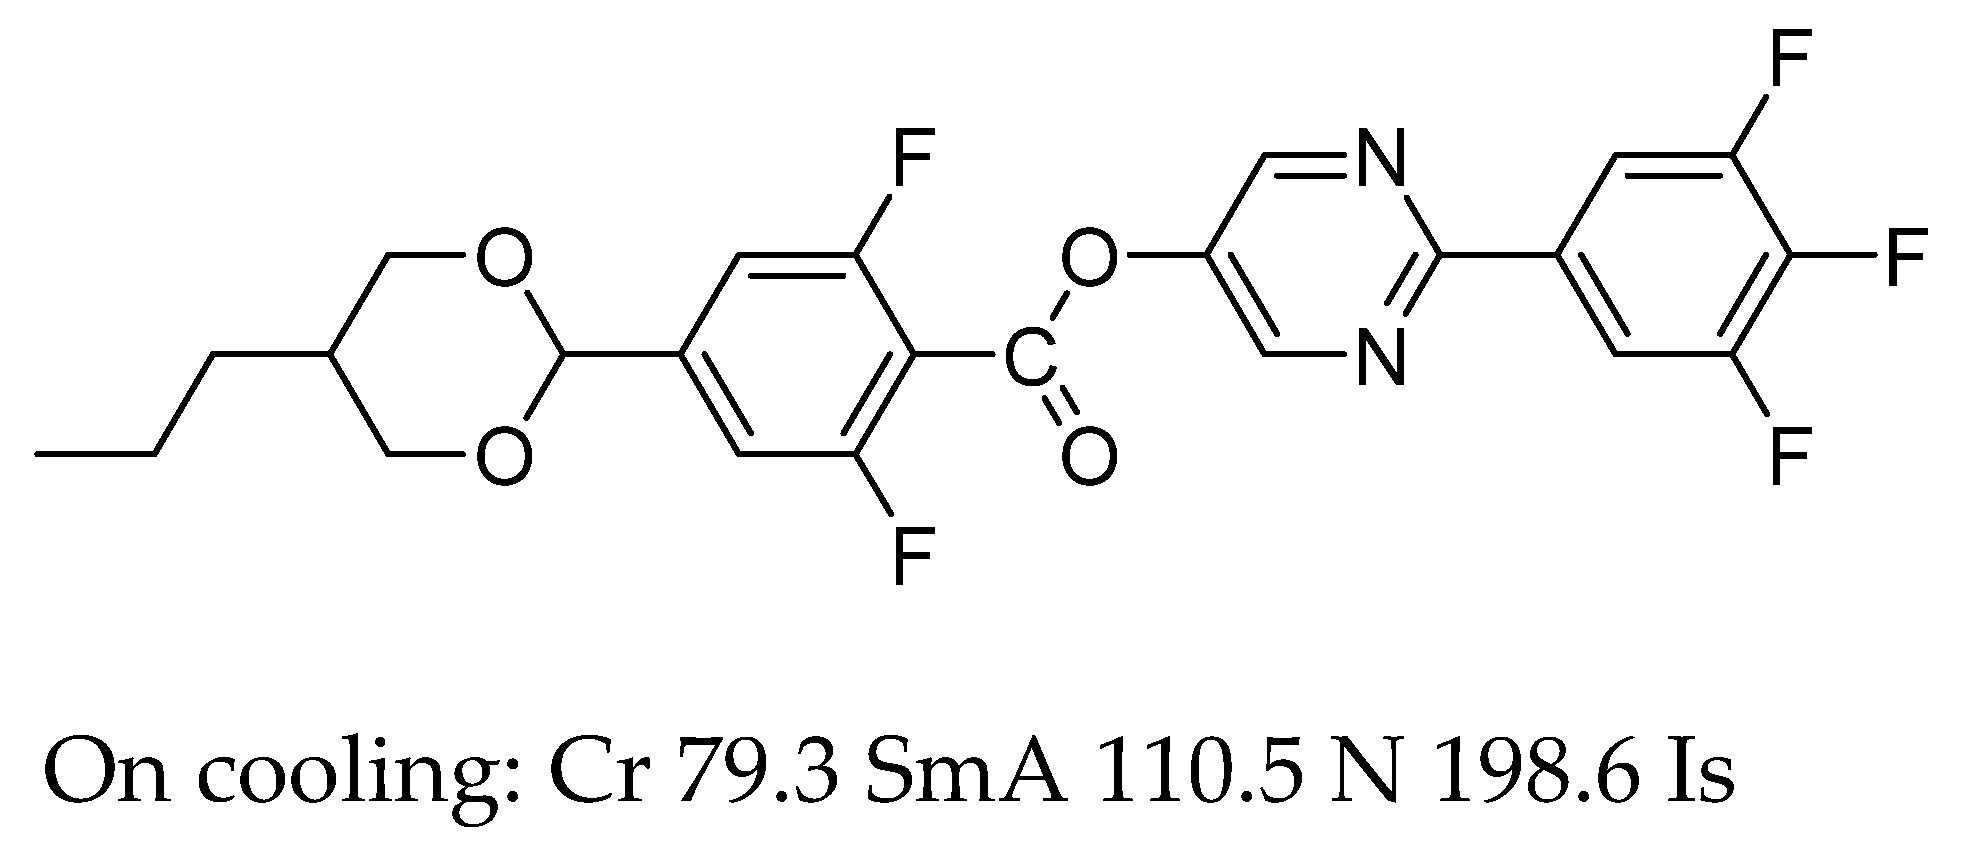
Figure 4.
Temperature dependence of dielectric permittivity(a) and loss (b) spectra of 7 μm WJ-16 cell with uncoated electrodes. (c) Example of the dielectric spectrum fitted at 130 oC by three relaxation processes: Black (P0), Red (P1) and Blue (P2). The subscripts: 0, 1 and 2 denoted according to the increase of relaxation frequencies of processes P0, P1 and P2, respectively. Error! Bookmark not defined.(d) Temperature dependence of total dielectric permittivity for planar cells of different thicknesses (filed symbols) and the total dielectric strength () in 7 μm uncoated cell (open red circles) and □, ◊ are the dielectric strengths of individual processes P0 and P1. Inset: Thickness dependence of dielectric permittivity ε’ of planar cells for three different temperatures.
Disclaimer/Publisher’s Note: The statements, opinions and data contained in all publications are solely those of the individual author(s) and contributor(s) and not of MDPI and/or the editor(s). MDPI and/or the editor(s) disclaim responsibility for any injury to people or property resulting from any ideas, methods, instructions or products referred to in the content. |
© 2024 by the authors. Licensee MDPI, Basel, Switzerland. This article is an open access article distributed under the terms and conditions of the Creative Commons Attribution (CC BY) license (http://creativecommons.org/licenses/by/4.0/).
Copyright: This open access article is published under a Creative Commons CC BY 4.0 license, which permit the free download, distribution, and reuse, provided that the author and preprint are cited in any reuse.


