
Submitted:
14 November 2024
Posted:
17 November 2024
You are already at the latest version
Abstract
Integrating remote monitoring systems is crucial in the ever-changing field of data center management to enhance performance and guarantee reliability. This paper outlines a comprehensive strategy for monitoring remote servers by utilizing agents that establish connections to the Redfish API (Application Programming Interface) and vSphere hypervisor API. Our solution uses the Redfish standard to provide secure and standardized management of hardware components in diverse server environments. This improves interoperability and scalability. Simultaneously, the vSphere agent enables monitoring and hardware administration in vSphere-based virtualized environments, offering crucial insights into the state of the underlying hardware. This system, which employs two agents, simplifies the management of servers and seamlessly integrates with current data center infrastructures, enhancing efficiency. The policy-based alerting system built on top of these agents offers a lot of capabilities based on both agents leveraging their alerting systems. This, in turn, can improve the capabilities of next-generation data centers.
Keywords:
remote server monitoring
; Redfish API
; vSphere API
; data center management
; virtualization
; interoperability
; scalability
1. Introduction
Effective remote server management is essential for preserving hardware integrity, enhancing performance, and guaranteeing uninterrupted operation in modern data centers. This paper examines the amalgamation of Redfish API and vSphere API to create a unified framework for policy-driven server monitoring.
The Redfish API offers a robust, standardized approach for managing and monitoring physical hardware components, including processors, memory, storage, and power supplies. It facilitates remote access and control of servers at a detailed level, permitting administrators to oversee the real-time status of hardware components. Simultaneously, the vSphere API delivers comprehensive functionalities for administering virtualized environments, offering insights into the performance and condition of virtual machines and the foundational hardware. By integrating the capabilities of these two APIs, organizations can establish automated protocols that guarantee ongoing monitoring of server health, identify potential problems promptly, and initiate automated responses or maintenance activities before critical failures. This method facilitates enhanced resource allocation, reduces downtime, and ultimately augments the resilience and efficiency of server management across both physical and virtual infrastructures.
There are four scientific contributions from this paper:
- The paper introduces a unified framework that combines RedFish and vSphere APIs to create a comprehensive policy-driven server monitoring system. This integration provides real-time monitoring of hardware health and system resources across physical, virtual or container-based environments;
- The framework proposed in this paper facilitates interoperability among different server infrastructures and improves scalability for hyper-scale data centers;
- The paper introduces a unified, policy-based alert system that leverages the integrated monitoring capabilities of both RedFish and vSphere. This system automates alerts and actions based on predefined rules, leading to proactive hardware management and reduced downtime, which would be beneficial if one of the APIs failed while working;
- The framework introduced in this paper can serve as a basis for creating additional AI/ML-based frameworks for hardware failure detection and prediction in the future.
This paper is organized as follows: in the next two sections, the state of the research field and the proposed system architecture and all its sub-services will be analyzed in detail. As a result of the proposed architecture, an application available for download from GitHub was developed [1], which will be described in detail in the next section. A section about analysis and discussion will follow this. The last part of this paper is related to sections about future work and a conclusion.
2. Related Works
As the world is transitioning to a software-defined paradigm, hardware management capabilities must evolve to address that shift in the data center. In the context of disaggregated hardware, management software needs to combine the independent pieces of hardware, such as trays, modules, silicon, etc., to create a composed logical system [2]. Therefore, efficient data center management is crucial in today's rapidly evolving technological environment to maximize performance and guarantee reliability. Traditional server management methods are based on the operating system and suffer from poor timeliness, difficulty identifying the cause of server crashes, and severe resource occupation by servers [3]. Conventional monitoring systems frequently face problems when dealing with contemporary server environments' intricate and diverse nature. To tackle these difficulties, they suggest an all-encompassing solution for monitoring the arbitrary number of remote servers. Our solution makes use of agents that are connected to the Redfish API and vSphere API. Redfish is an open industry standard specification and schema for system management as defined by the Distributed Management Task Force (DMTF). Redfish aims to simplify and assure the management of scalable (hyperscale) data center hardware [4]. It improves interoperability among different server infrastructures. The vSphere agent enables comprehensive monitoring of virtualized environments, providing valuable information on the state of the hardware running the vSphere hypervisor. Combining these two information sources gives us a lot of scope to create advanced alarms and alerts based on either or both sources, which can be hugely beneficial for various environments.
The operations domain functions at this layer include traditional server management functions implemented in microcontrollers, such as IPMI, HPE (Houston, TX, US) iLO (Integrated Lights-Out), and Dell (Round Rock, TX, US) iDRAC [5]. There are established protocols that enable a uniform interface to the server infrastructure. The idea behind remote server management started in 1998 when Intel introduced the Intelligent Platform Management Interface (IPMI) specification, which is compatible with over 200 computer system manufacturers. The Redfish standard, developed by the Distributed Management Working Group (DMTF), replaced it due to its security vulnerabilities. It offers a straightforward and secure method for handling a combination of different types of infrastructure. This includes guidelines for managing server, processor, memory, storage, network devices, and peripheral component models. From our perspective, Redfish is a management standard that uses a data model representation with a RESTful interface [6]. To provide that "common ground," a Redfish interoperability profile allows the definition of a set of schemas and property requirements that meet the needs of a particular class of product or service [7]. As the remote server management platform presented in this paper on HPE servers was being developed, the focus was on iLO4 and iLO5 using Redfish for their remote management interfaces. Using Redfish will help us ensure servers' availability and reliability [8].
The goal of this paper is not to discuss energy efficiency. It doesn’t matter which remote management tooling was used; the built-in sensor inaccuracies diminish the overall accuracy used to attribute power consumption to virtual machines (VMs) [9]. It is oriented to hardware monitoring via Redfish, for example, using the Redfish protocol to monitor the CPU temperature [10]. These remote monitoring standards use a BMC (Baseboard Management Controller) to collect sensor information [11].
There are also security issues related to remote management interfaces. Depending on the version of the software in use, an attacker can obtain full access (supervisor, root, admin) to the system after successfully cracking its hash password in IPMI [12]. There are also performance issues with BMC controllers, as they’re usually slow and slow to reboot after a firmware update or configuration change necessitates a reboot.
Performance monitoring is essential for analyzing resource utilization and detecting anomalies, and it is important to notify the user if any issues arise. Utilizing the gathered data makes it feasible to conduct a more comprehensive examination of the workload on a specific server. Hence, developing a system that facilitates streamlined resource status and availability monitoring is imperative and promptly alerts users when data values change by predefined alert rules. Therefore, the fast booting of the operating system used by BMC is required to quickly identify the point of the problem and recover from failures [13], should any failures happen. Research shows remote management can be used for wider-scale fault detection, such as IPMI-based for HPC (High-Performance Computing) environments [14]. Also, research shows that this can be used for risk management and workload placement decisions [15].
There are also scalability issues when dealing with larger data centers. Previous research states that traditional BMC-based out-of-band management methods, such as IPMI, Redfish, etc., will face new challenges today since data centers have already expanded to be large-scale [16]. This complicates the remote management of HPC-based environments, as they might have very diverse administration domains, with administrators managing each fabric differently through different tools [17].
The rest of this paper is organized as follows: First, we’ll discuss the proposed system architecture and its subcomponents necessary for our application to work. Then, we’ll discuss our application's capabilities in terms of agent configuration, checking server status, working with rules and conditions, and notifications. Then, we’ll present some test results and analytics before discussing future research directions and conclusions.
3. Proposed System Architecture
The system comprises a user web application that establishes a connection with the server through the Representative State Transfer Application Programming Interface (REST API). The server is responsible for the creation and management of agents, as well as the storage of data in the Postgres database, as shown in Figure 1:
The Redfish agent establishes a connection with the iLO API, while the vSphere agent establishes a connection with the vSphere API. The Prometheus "pull" method fetches data from agents and stores it internally.
Alert rules are configured within Prometheus, which dispatches alerts to the alert manager responsible for handling notifications. Grafana was utilized for data visualization, employing PromQL to generate queries for the Prometheus data source. This architecture was developed using Prometheus 2.40.0, Alertmanager 0.24.0, and Grafana 9.2.4. On the server side, vSphere 7.0u3 was used.
This architecture was developed as a modular part of a more extensive architecture related to the HPC datacenter, as described in another paper [18]. It served as a critical research area for figuring out how multiple remote monitoring sources can be used in a unified matter to gain insight into the state of server hardware. This is important because the developed HPC architecture relies on servers working and analyzes risks associated with running a workload on a server. For example, if a server has a failed RAM stick, it would be prudent not to place a new workload on that server until the RAM issue is resolved.
Let’s now discuss these services to explain their interaction and interoperability further.
3.1. Backend Service
The backend is implemented in Golang 1.19, utilizing the Echo library 4.9.1. The Echo library is a web application framework designed to enhance performance and improve manageability by scaling multiple devices.
The user's web application communicates with the server web server by transmitting a representative state. The system establishes a connection with the database during the initialization process and generates tables. It then executes Redfish and vSphere agents, configures routes, and activates a web server.
Upon logging in, a JWT (JSON Web Token) token is utilized to verify the user's identity. Creating a new agent instantiates a fresh RedfishClient object that establishes a connection with the designated server. The connection is added to the collection, which is then added to the collection during the scraping process. Scraping is employed to extract data from all interconnected servers. Figure 2 shows part of the code used for the central part of the backend service:
During the request, an authorization token in the request header is verified.
3.2. Custom Redfish Agent
The addition of Redfish server functionality was accomplished by abstracting the Redfish agent, manager, and client, as shown in Figure 3:
The code contains a Redfish agent named RedfishExporter. This aims to activate the web server, initialize the Redfish manager, and establish the Prometheus registry. The RedfishExporter structure includes several elements. The Port element is a numeric value that specifies the port on which the web server will listen. The MetricsPath element is a text value that determines the route where the collected data will be accessible. The Server field is a pointer to the HTTP instance. The server is configured to enable the configuration and operation of the web server. RedfishManager refers to an example of RedfishManager that oversees the connections and configurations of Redfish clients.
The register variable is a pointer to the memory address of the Prometheus object. The registry records Prometheus collectors and gathers their metrics.
The NewRedfishExporter function initializes the Prometheus registry and the Redfish manager. If the Redfish manager meets the requirements of the Prometheus collector interface, it is added to the registry.
The Prometheus collector interface requires the presence of a Describe method for adding descriptions of metrics, as well as a Collect method for collecting metrics. A new route for /Redfish is created, in which the web server will utilize the MetricsHandler method to present the data gathered from the previously included Redfish hosts. Ultimately, a RedfishExporter object is returned, as shown in Figure 4:
The RedfishClient class implements several methods. These include GetSession, which retrieves or updates a session; CreateRequest, which creates a custom request containing an X-Auth-Token; GetPower, which retrieves the server's current electricity consumption; GetThermal, which retrieves temperature and status data of components and sensors; and Logout, which logs out of the session.
Sensor metrics are divided into two categories. The Sensor Health metric includes server address labels, component number, sensor name, and physical location. The value is assigned an enumeration, where 1 represents the correct state, and 0 represents the incorrect state. The sensor temperature metric includes server address labels, sensor number and name, physical location, unit of measurement, and critical and fatal temperature limits.
3.3. Custom vSphere Agent
The additional functionality for connecting to the vSphere hypervisor is implemented by abstracting the vSphere agent, manager, and client. The agent's structure mirrors the implementation structure of the Redfish agent. The vSphere agent in the code is called VsphereExporter. The difference between Redfish and vSphere agents is in the client and manager. The manager differs in the types of metrics it collects, so the Collect and Describe methods vary, as shown in Figure 5:
The status metric includes labels for the ESXi server addresses and vCenter addresses. The value is assigned an enumeration, with 2 representing the correct condition, 1 representing a warning, and 0 representing a critical condition.
3.4. Prometheus
To ensure proper configuration, it is imperative to edit the prometheus.yml file and define the sections for global, rule_files, alerting, and scraping_configs. The Global configuration dictates the predetermined settings. The scrape_interval parameter determines the spacing between data collections. The rule_files function establishes a connection to the alert.rules file, which houses the specific criteria to activate a particular action. Alerting specifies the location of the Alertmanager service. Scrape_configs is a collection of settings that determine the data Prometheus will collect from the exporter's parameters, as shown in Figure 6:
A practical method for incorporating rules for alerts is utilizing the rule_files feature within the prometheus.yml file. Service_rules consist of three specific rules: service_down, sensor_down, and fan_down. The first rule universally applies to all services, including the up metric. An alarm will be activated if the service remains inactive for two minutes. If the component sensor or fan sensor fails to operate for one minute, an alarm will be activated by the other two rules, as shown in Figure 7:
Grafana provides a more accessible way of creating rules and conditions, using various sources to present the acquired information in real time.
3.5. Alertmanager
Alertmanager dispatches notifications to the email channel specified in the config.yml configuration file, as shown in Figure 8:
One of the benefits of this system is that it allows for grouping alerts with similar parameters into a single notification. Additionally, it provides the ability to temporarily silence alerts based on specific conditions set on the web interface.
3.6. Grafana
Grafana is a tool for creating graphs using different input sources. In this case, to visualize the data collected in Prometheus. It is necessary to add a default user account to the configuration.monitoring file to access the user interface. One way to add a data source is through the datasource.yml configuration file, as shown in Figure 9:
One way to add dashboards is through provisioning, by adding the provisioning/dashboards/dashboard.yml configuration file that will register all the dashboards located in the /etc/grafana/provisioning/dashboards directory of the container. That directory is mapped from local storage to the Grafana container, so it's available to add.
This method is convenient because it automatically adds data sources and dashboards when you start Grafana. The dashboard is created via the Grafana user interface, exported in JSON (JavaScript Object Notation) format, and stored in the provisioning/dashboard directory, as shown in Figure 10:
The provisioning dashboard configuration mode enables automated access to preconfigured dashboards upon launching the Grafana service.
3.7. Frontend Services
The user web application was created utilizing the Vue.js JavaScript framework and the Quasar library. This combination allows for the efficient development of responsive websites and applications compatible with web browsers and easily converted into mobile applications.
The software package includes pre-built elements such as forms, dialogs, and buttons. Quasar handles reducing the size of HTML/CSS/JS files and converting ES6 code while adhering to the most effective techniques in web development. The development process is executed using the "quasar dev" command, which offers real-time updates of any changes made.
The user interface enables you to authenticate into the system and input Redfish and vSphere agent login credentials. You can also access the raw data about the agents. Grafana empowers the utilization of dashboards via an iFrame HTML element.
4. Application Capabilities
The application that was developed has a set of beneficial capabilities. First and foremost, after logging in, it has a set of wizards to add Redfish and vSphere agents. For example, the wizard for Redfish is shown in Figure 11:
After adding Redfish and vSphere agents, the actual capabilities of our application started to emerge. The first one is the ability to display server status via the Redfish agent, as shown in Figure 12:
Then, the vSphere agent-based server status dashboard can be used. There’s a subtle difference here – a warning being displayed for one of the servers connected via the vSphere agent., as shown in Figure 13:
The sensor's temperature is presented as a Bar gauge, with the sensor's name linked to the corresponding temperature values. Processor utilization is represented by a graph showing the usage amount in the unit of measurement MHz. The RAM utilization is represented by a graph showing the memory amount used, measured in megabytes (MB). The graph also displays the present electricity consumption in Watts. The storage component's health status is shown as a card containing the disk's name and corresponding status. The card is green if the disk functions correctly and red if not. The ESXi server's comprehensive health status is presented as a card, including the server address and current state.
Next, various rules and conditions for alerts can be added. To incorporate a rule, details must be added to the rule's name, and the "Grafana managed alert" rule must be chosen, the metric query selected with a new condition established, and alert conditions specified. The notification details are also mandatory, as shown in Figure 14:
When constructing a query, a visual representation of the query is provided, and the maximum threshold for the defined alert is indicated. Once an alert policy is added, the "Alerting" main interface will present a comprehensive set of rules. Then, in the “Contact points” tab, a new contact point to set up notifications can be created. Specifically, Alertmanager can be used to make a contact point, as shown in Figure 15:
Once the alert rule is activated, Prometheus recognizes that the notification must be sent to the Alert Manager. It then transmits the notification through specified channels, specifically email.
The following section will compare a test scenario and analysis to see how this process applies to real-world use cases.
5. Test Analysis And Discussion
A notification rule has been established with the criterion that triggers an alert when the CPU utilization exceeds 200 MHz. Then, a virtual machine will be started, running the Ubuntu operating system on the vSphere server at IP address 10.10.51.15. The activation of the CPU load alarm upon system initialization can be noticed, as can be seen in Figure 16:
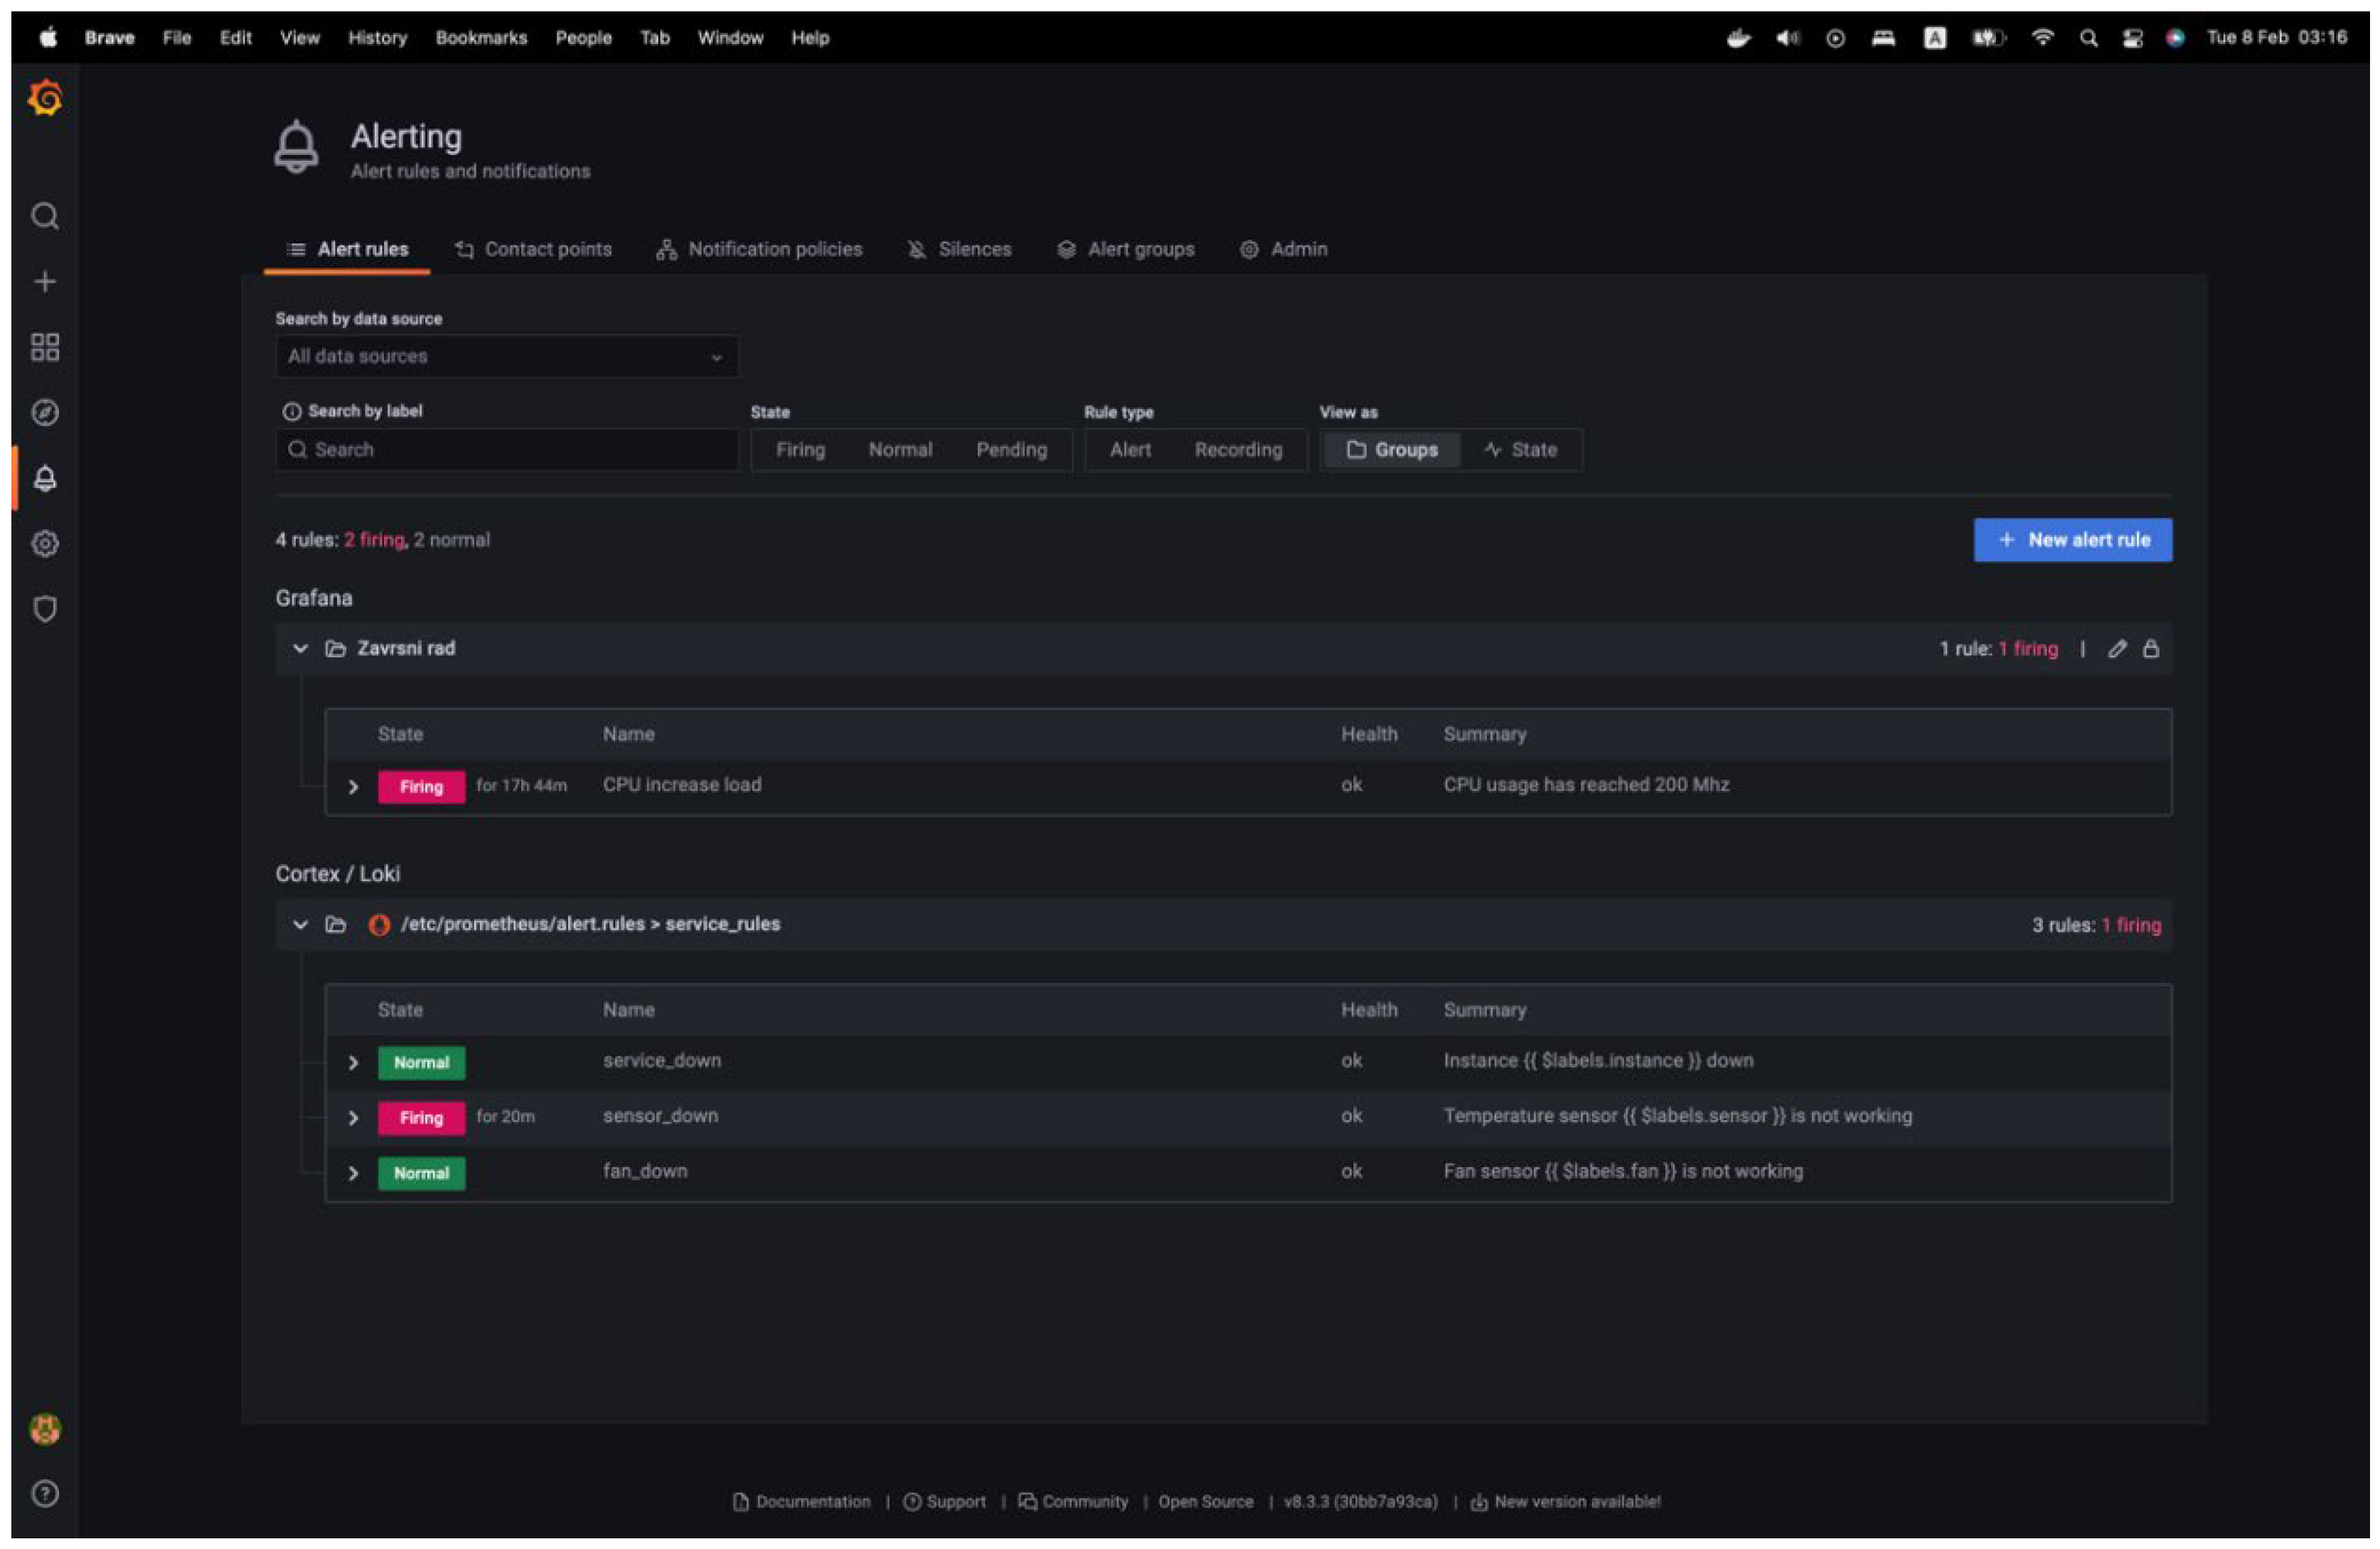
There has been an increase in resource utilization, as evidenced by the graph. Consequently, the alert rule has been activated, and the alert status on Prometheus can be observed by accessing the "Alerting" view. Two out of the four alarm types have been activated. These are the principles of maximizing processor utilization and ensuring sensor accuracy, as is shown in Figure 17:
Since two agents were developed, combining those two data sources can create a hybrid alarm set. This could be a precious option for environments with VMware’s version of vSphere installed without vendor-based add-ons. That, in turn, means that there are no additional options to check sensor information from the server motherboard, which means that vSphere can’t provide that information. For example, an alarm that uses a Redfish agent can be created to get information about memory status and combine that with a vSphere alarm for situations where the vSphere host starts running out of memory. That would be a scenario in which there could be a correlation between a failed stick of memory and the available memory capacity on the vSphere host. It’s unnecessary to buy a separate (and costly) application to do this kind of monitoring, as the application created while working on this paper is hosted on GitHub and entirely free and MIT-licensed.
6. Future Works
Potential areas for future development and research of the hardware monitoring application discussed in this paper offer multiple promising avenues to enhance its capabilities. Advancements in physical server health could prioritize the utilization of sensors and data analytics to provide comprehensive insights into server conditions. Utilizing historical health data to create predictive algorithms can potentially anticipate hardware failures, reducing downtime and maintenance expenses.
From an operational perspective, the application could be improved to enable simultaneous iLO firmware upgrades for multiple servers. Implementing this would significantly improve the operational efficiency of the firmware upgrade process, alleviating the burden on individuals responsible for lifecycle management operations. It would also lower the costs as centralized applications with this ability are pretty high.
Continuous adaptation of Machine Learning (ML) models in anomaly detection is crucial for improving accuracy in distinguishing genuine anomalies from normal fluctuations, thereby enhancing monitoring capabilities. Incorporating contextual awareness into these models would improve their capacity to identify intricate problems across various metrics.
Aggregating logs from different sources within the server infrastructure will be crucial for thorough monitoring. Future endeavors could focus on developing a cohesive logging system that streamlines data gathering and examination, facilitating the identification of patterns and possible problems.
Enhancing event correlation can be achieved by creating advanced algorithms that establish connections between related events occurring in various components. This enables a more profound understanding of the events and facilitates faster problem resolution. This can promote a more streamlined approach to identifying and resolving the underlying factors contributing to system problems.
Resource forecasting is a promising field that can benefit from further advancements. Machine learning models can be used to anticipate future resource requirements by analyzing current and past usage patterns. This can significantly improve capacity planning and resource allocation. Implementing this would allow for proactive resource management, mitigating the potential for resource scarcity or excessive allocation.
Integrating artificial intelligence with resource forecasting and anomaly detection can significantly enhance the application's effectiveness. Artificial intelligence (AI) can offer immediate and valuable information, automate decision-making, and improve the accuracy of predicting resource requirements and potential irregularities. This ultimately results in a more robust and efficient server management system. These advancements collectively strive to develop a hardware monitoring solution that is more resilient, intelligent, and proactive.
7. Conclusions
The Redfish protocol offers a standardized interface for data collection in infrastructure environments with various server types. Combining a pre-built metrics management system with the integration of customized agents has demonstrated itself as a rapid, effortless, and practical approach to achieving a high-quality product.
Throughout the project's development, a comprehensive comprehension of the Prometheus system's operational mode and the proper methodology for constructing agents capable of gathering diverse data types were attained.
The solution's implementation consists of a user web application that offers a user interface for adding and viewing Redfish and vSphere agents. Additionally, a server application handles multiple Redfish and vSphere agents. These agents collect data and deliver it to the Prometheus monitoring system. A system has been devised to gather and display data from an unlimited number of servers and to send notifications when an alarm is triggered according to predefined rules. Prometheus gathers and retains data from Redfish and vSphere agents to initiate alerts. The data is displayed using Grafana dashboards.
The application created for this paper demonstrated its efficiency as a comprehensive solution for monitoring the workload of servers in a diverse infrastructure without any additional cost. By utilizing the collected data, various analytical methods can be employed to compare consumption at a specific load and optimize infrastructure utilization, which could improve environment efficiency and design. It could also be used to learn about the reliability of any given environment, feed information to an AI engine, and, with some development, predict large-scale failures based on agent data.
Author Contributions
Conceptualization, V.D. and K.B.; methodology, V.D. and K.B.; software, K.B.; validation, J.R., and D.R.; formal analysis, J.R., and D.R.; resources, V.D.; data curation, D.R.; writing—original draft preparation, V.D. and K.B.; writing—review and editing, V.D., J.R., and D.R.; visualization, K.B.; supervision, V.D. All authors have read and agreed to the published version of the manuscript.
Funding
This research received no external funding.
Data Availability Statement
The original contributions presented in the study are included in the article material; further inquiries can be directed to the corresponding author.
Conflicts of Interest
The authors declare no conflicts of interest.
References
- GitHub HybridMonitor page. Available online: https://github.com/kerlexov/HybridMonitor (accessed on 9 Oct 2024).
- Distributed Management Task Force. Redfish Composability White Paper [Internet]. Portland, OR.: Distributed Management Task Force. October 2023. Available online: https://www.dmtf.org/sites/default/files/standards/documents/DSP2050_1.3.0.pdf (accessed on 1 June 2024).
- Li, J.; Wang, P.; He, Y.; Jia, L. Application of IPMI technology in PDM server cluster. 2022 International Conference on Image Processing and Computer Vision (IPCV). 2023. [Google Scholar] [CrossRef]
- Rosendo, D.; Gomes, D.; Santos, G.L.; Goncalves, G.; Moreira, A.; Ferreira, L.; Endo, P.T.; Kelner, J.; Sadok, D.; Mehta, A.; Wildeman, M. A methodology to assess the availability of next-generation data centers. The Journal of Supercomputing. 2019, 75, 6361–6385. [Google Scholar] [CrossRef]
- Roozbeh, A.; Soares, J.; Maguire, G.Q.; Wuhib, F.; Padala, C.; Mahloo, M.; Turull, D.; Yadhav, V.; Kostic, D. Software-Defined “Hardware” Infrastructures: A Survey on Enabling Technologies and Open Research Directions. IEEE Communications Surveys & Tutorials. 2018, 20, 2454–2485. [Google Scholar] [CrossRef]
- Distributed Management Task Force. Redfish Interoperability Profiles [Internet]. Portland, OR.: Distributed Management Task Force. December 2021. Available online: https://www.dmtf.org/sites/default/files/standards/documents/DSP0272_1.5.0.pdf (accessed on 1 June 2024).
- Distributed Management Task Force. Redfish Specification [Internet]. Portland, OR.: Distributed Management Task Force. April 2024. Available online: https://www.dmtf.org/sites/default/files/standards/documents/DSP0266_1.20.1.pdf (accessed on 1 June 2024).
- Goncalves, G.; Rosendo, D.; Ferreira, L.; Santos, G.L.; Gomes, D.; Moreira, A.; Kelner, J.; Sadok, D.; Wildeman, M.; Endo, P.T. A Standard to Rule Them All: Redfish. IEEE Communications Standards Magazine. 2019, 3, 36–43. [Google Scholar] [CrossRef]
- Kavanagh, R.; Armstrong, D.; Djemame, K. Accuracy of Energy Model Calibration with IPMI. 2016 IEEE 9th International Conference on Cloud Computing (CLOUD). 2016. [Google Scholar] [CrossRef]
- Ali, G.; Wofford, L.; Turner, C.; Chen, Y. Automating CPU Dynamic Thermal Control for High-Performance Computing. 2022 22nd IEEE International Symposium on Cluster, Cloud and Internet Computing (CCGrid); 2022. [Google Scholar] [CrossRef]
- Hongsong, C.; Xiaomei, W. Design and Implementation of Cloud Server Remote Management System Based on IMPI Protocol. 2015 IEEE 12th Intl Conf on Ubiquitous Intelligence and Computing and 2015 IEEE 12th Intl Conf on Autonomic and Trusted Computing and 2015 IEEE 15th Intl Conf on Scalable Computing and Communications and Its Associated Workshops (UIC-ATC-ScalCom); 2015. [Google Scholar] [CrossRef]
- Rosemond Dora, J.; Hluchy, L.; Nemoga, K. Detection and Exploitation of Intelligent Platform Management Interface (IPMI) *. 2024 IEEE 22nd World Symposium on Applied Machine Intelligence and Informatics (SAMI); 2024. [Google Scholar] [CrossRef]
- Kim, A.; An, J.; Kim, Y.; Hong, J. Hibernation Based Hybrid Booting for Baseboard Management Controller. 2022 International Conference on Computational Science and Computational Intelligence (CSCI) 2022. [Google Scholar] [CrossRef]
- Rajachandrasekar, R.; Besseron, X.; Panda, D.K. Monitoring and Predicting Hardware Failures in HPC Clusters with FTB-IPMI. 2012 IEEE 26th International Parallel and Distributed Processing Symposium Workshops & PhD Forum; 2012. [Google Scholar] [CrossRef]
- Li, J.; Ali, G.; Nguyen, N.; Hass, J.; Sill, A.; Dang, T.; Chen, Y. MonSTer: An Out-of-the-Box Monitoring Tool for High Performance Computing Systems. 2020 IEEE International Conference on Cluster Computing (CLUSTER); 2020. [Google Scholar] [CrossRef]
- Liu, H.; Xia, H.; Tu, B. Secure and Efficient BMC-Based Centralized Management Method for Large-Scale Data Centers. 2022 IEEE 24th Int Conf on High Performance Computing & Communications; 8th Int Conf on Data Science & Systems; 20th Int Conf on Smart City; 8th Int Conf on Dependability in Sensor, Cloud & Big Data Systems & Application (HPCC/DSS/SmartCity/DependSys); 2022. [Google Scholar] [CrossRef]
- Cayton, P.; Aguilar, M.; Pinto, C. Sunfish: An Open Centralized Composable HPC Management Framework. In Proceedings of the SC '23 Workshops of The International Conference on High Performance Computing, Network, Storage, and Analysis; 2023. [Google Scholar] [CrossRef]
- Dakić, V.; Kovač, M.; Slovinac, J. Evolving High-Performance Computing Data Centers with Kubernetes, Performance Analysis, and Dynamic Workload Placement Based on Machine Learning Scheduling. Electronics 2024, 13, 2651. [Google Scholar] [CrossRef]
Figure 1.
Proposed system architecture.
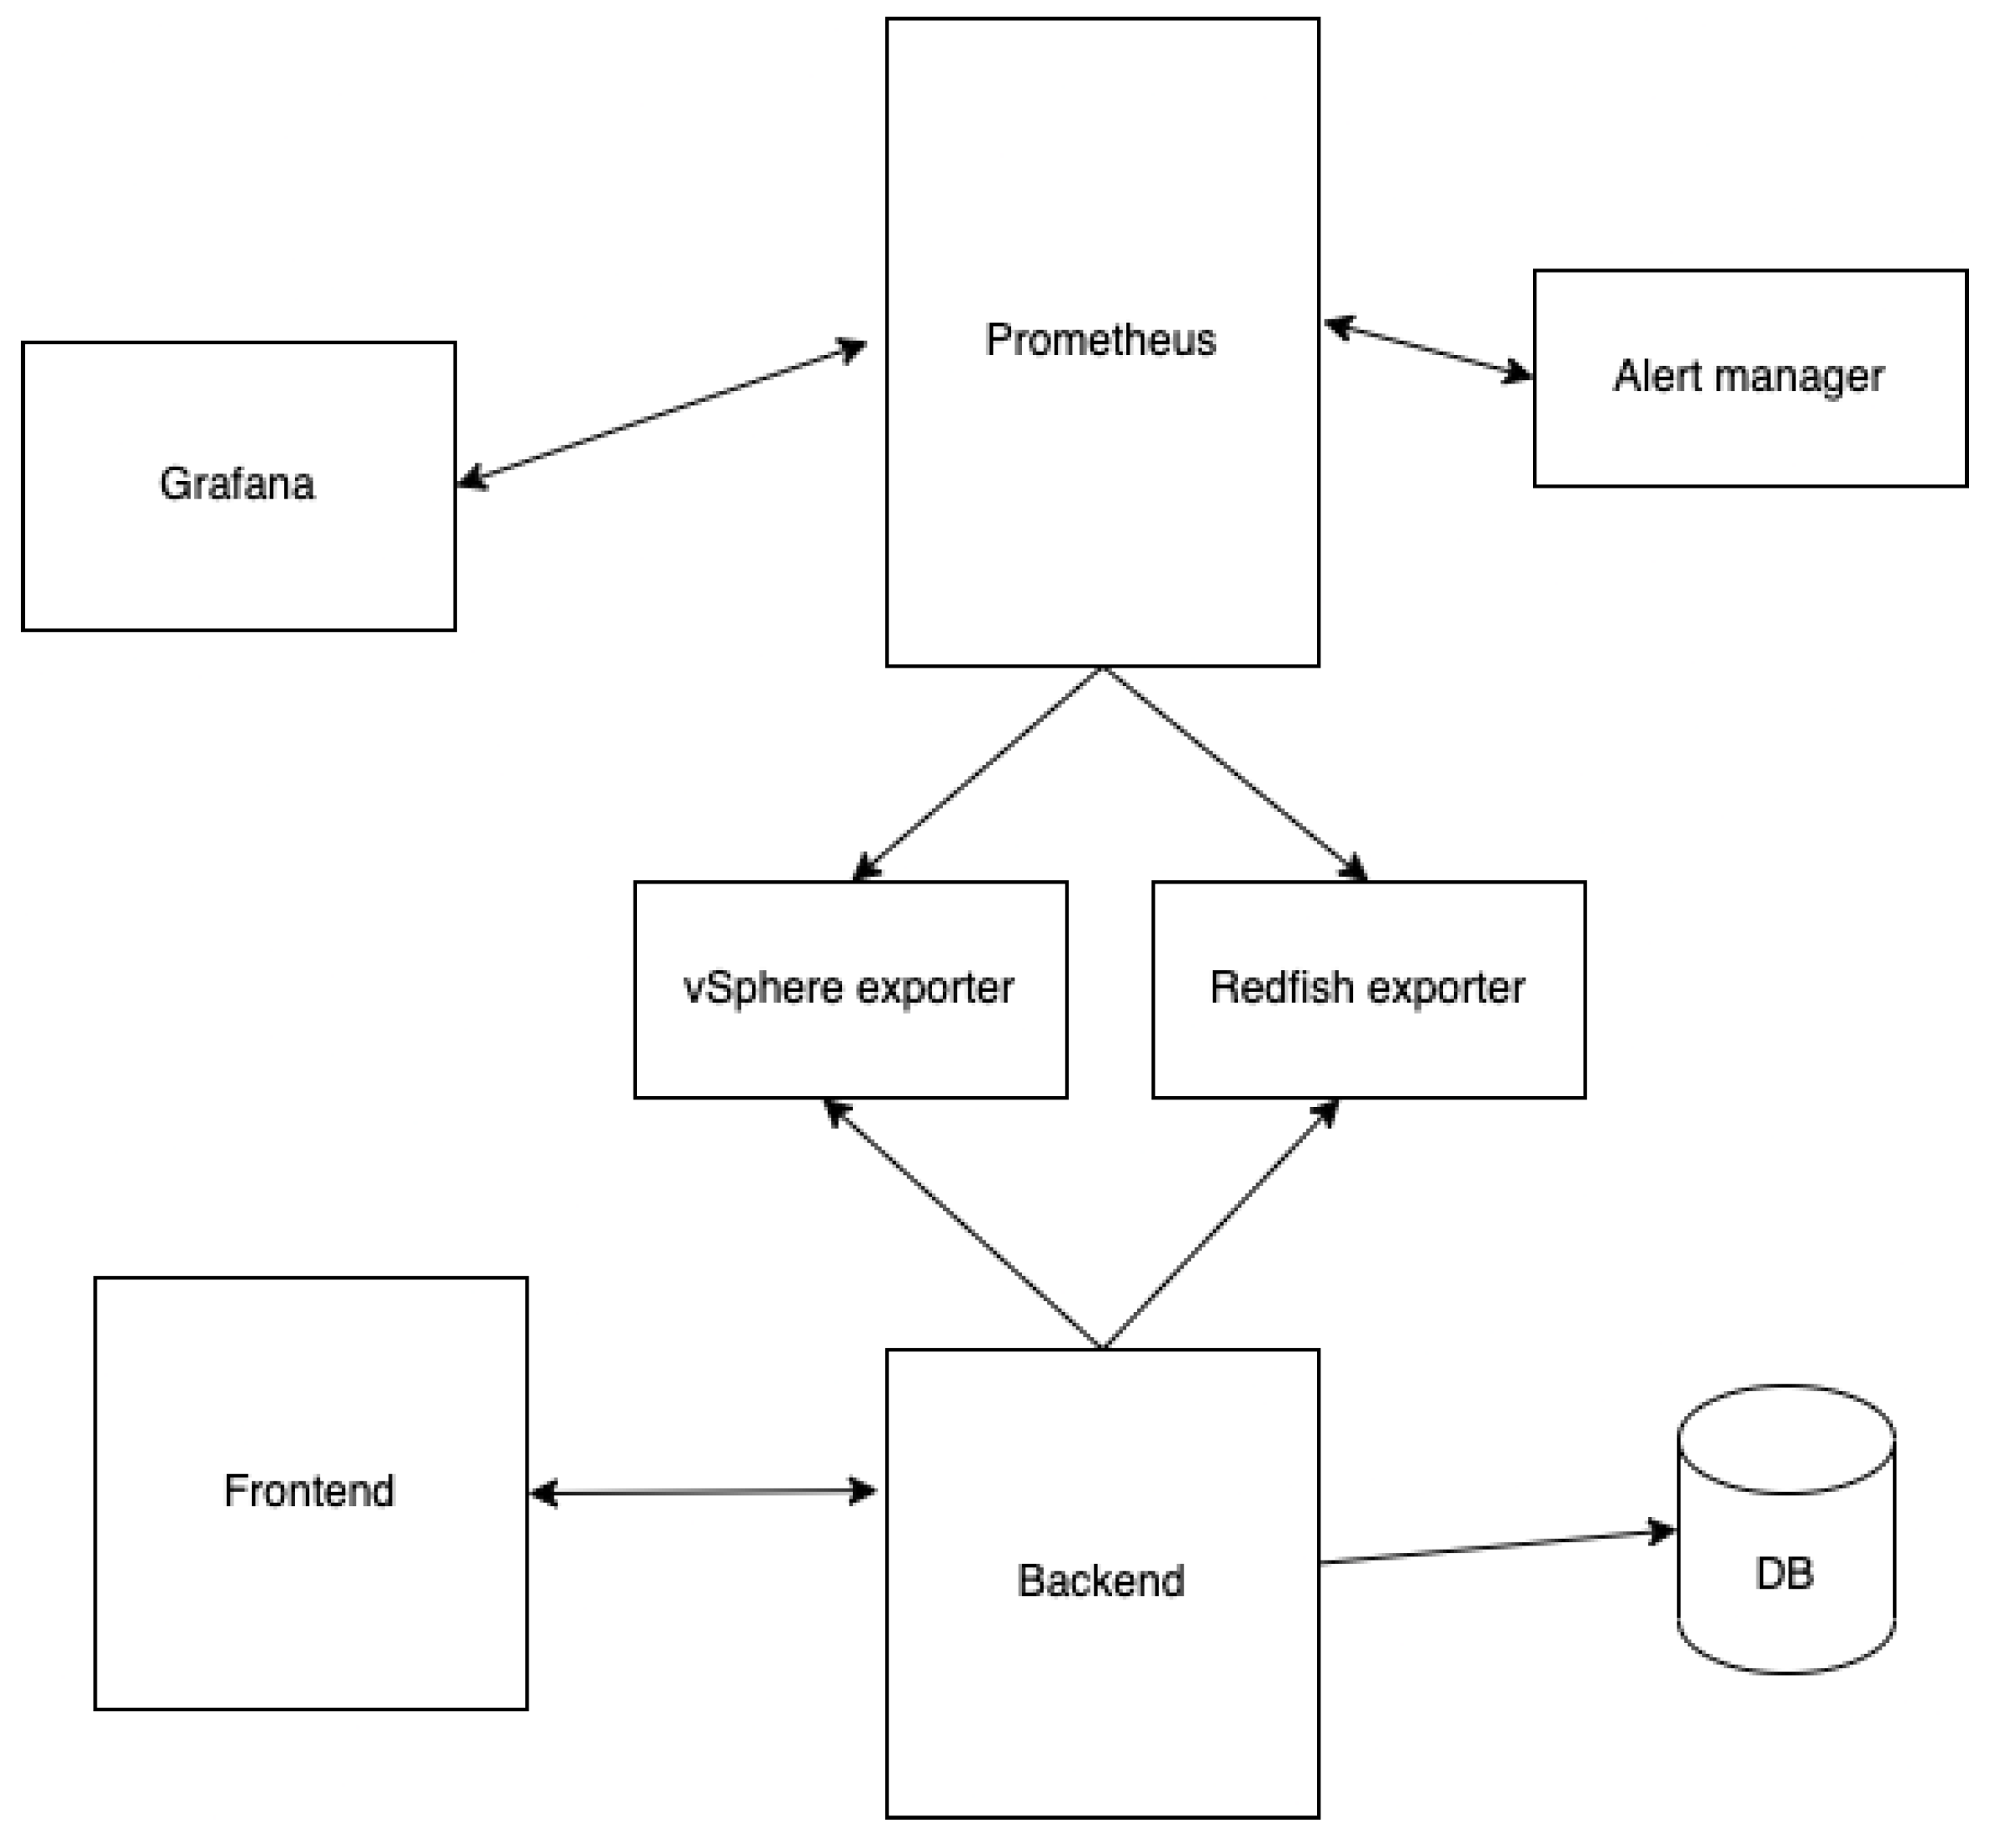
Figure 2.
Part of the backend service code in Go.
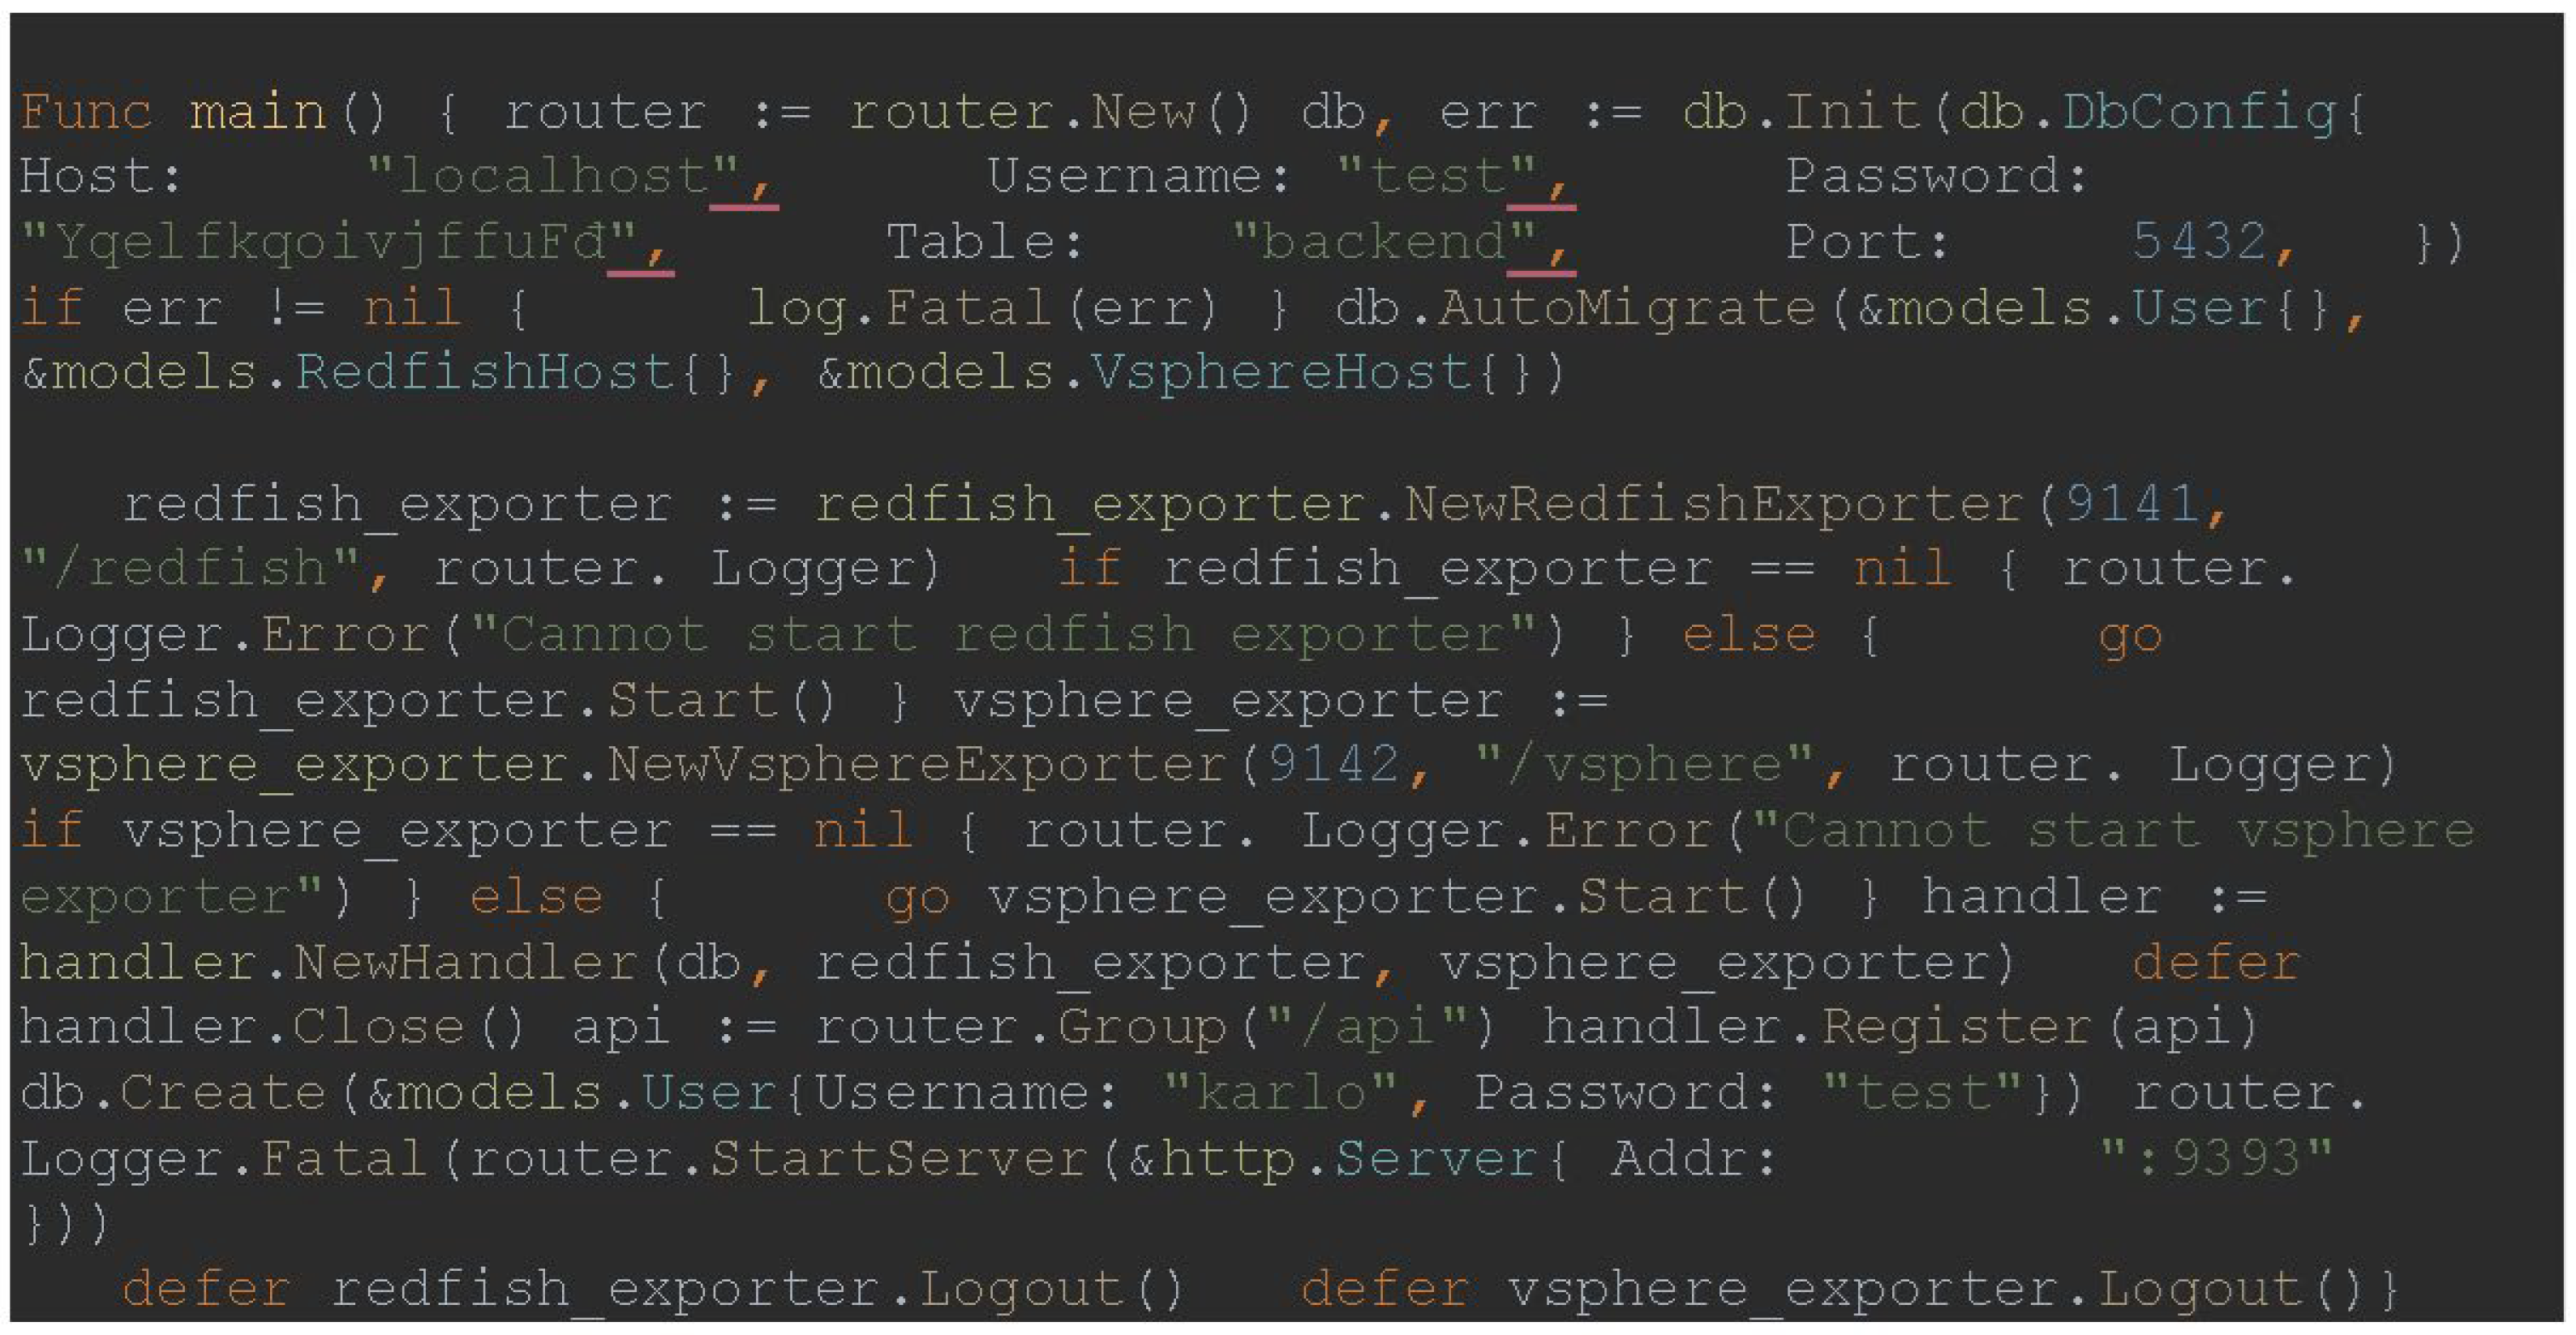
Figure 3.
Abstraction of the Redfish agent.
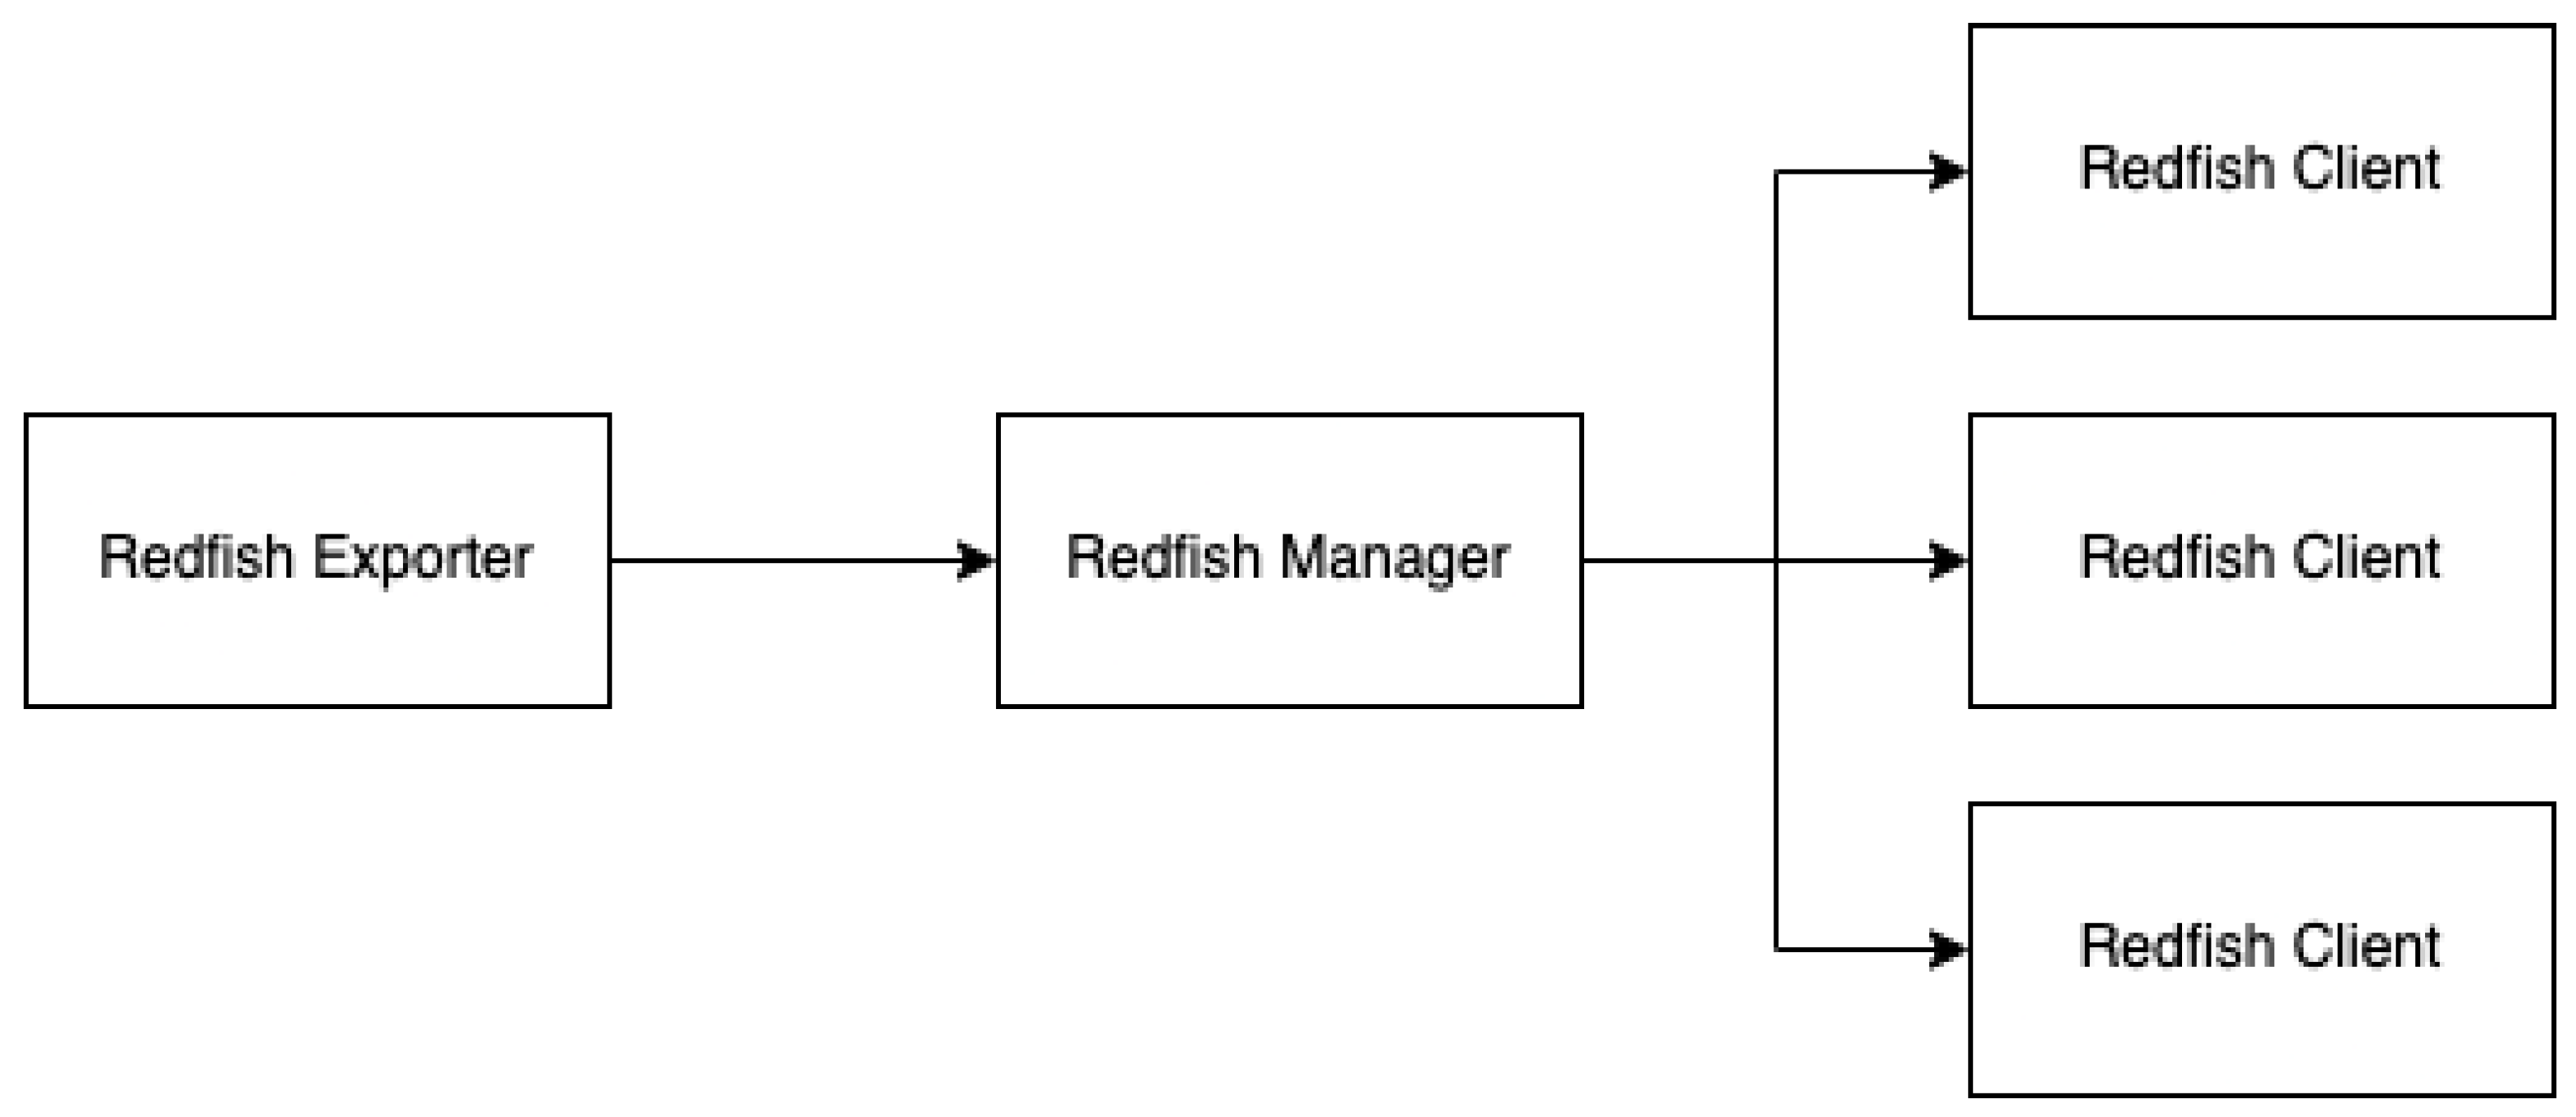
Figure 4.
The function that initializes the Redfish agent.
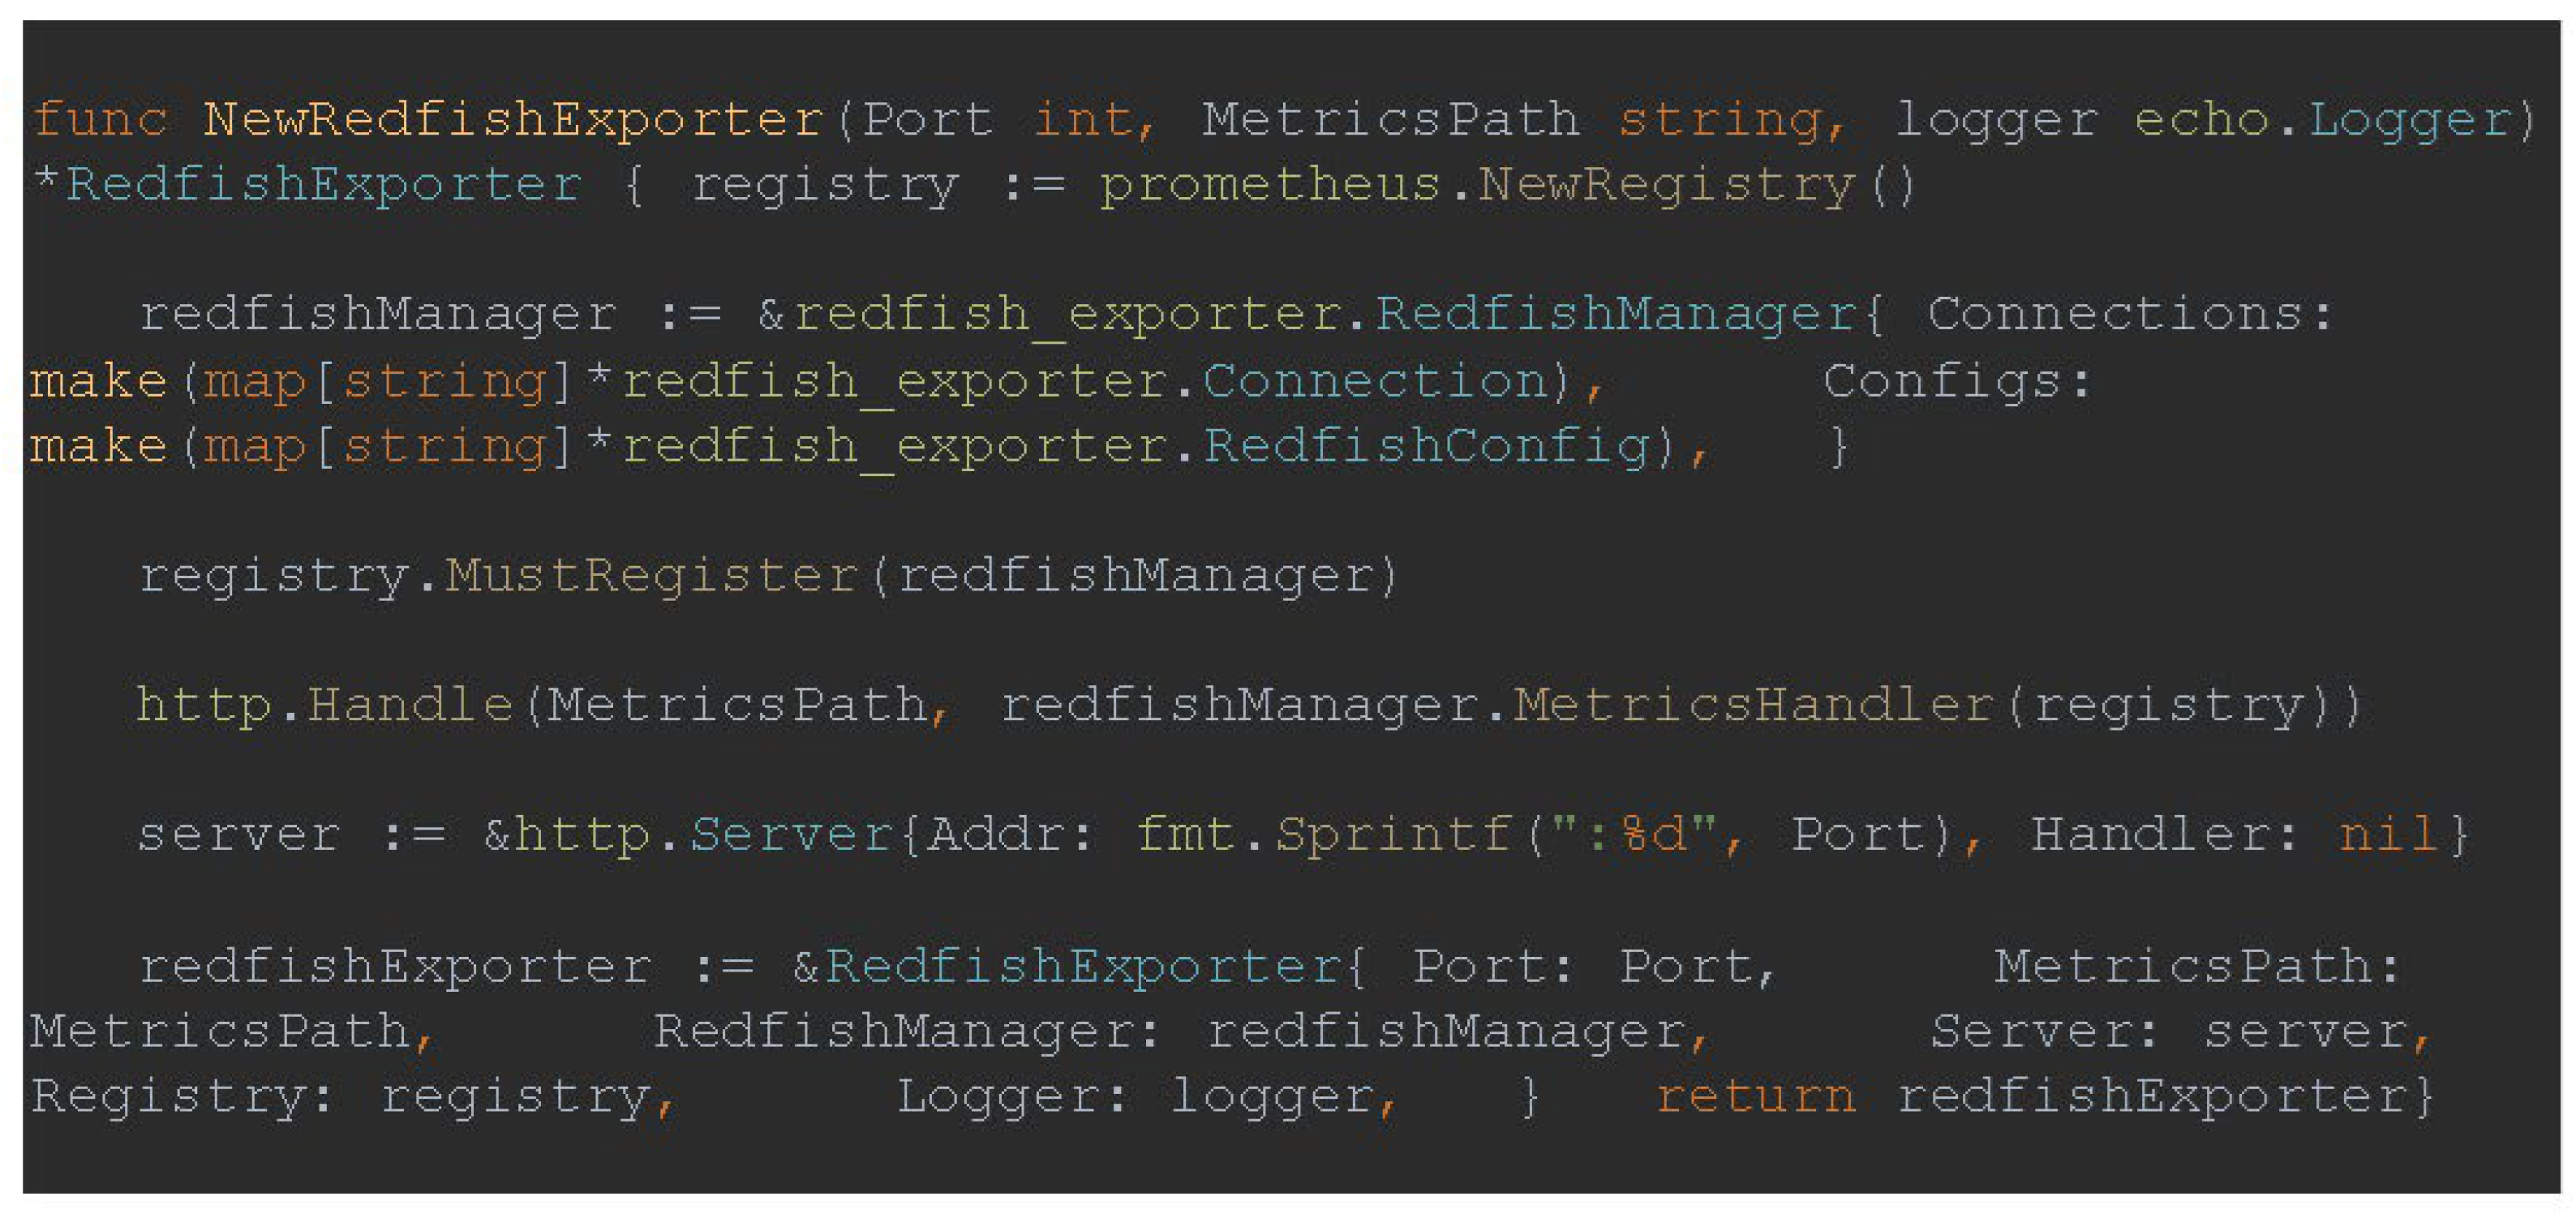
Figure 5.
Abstraction of the vSphere agent.
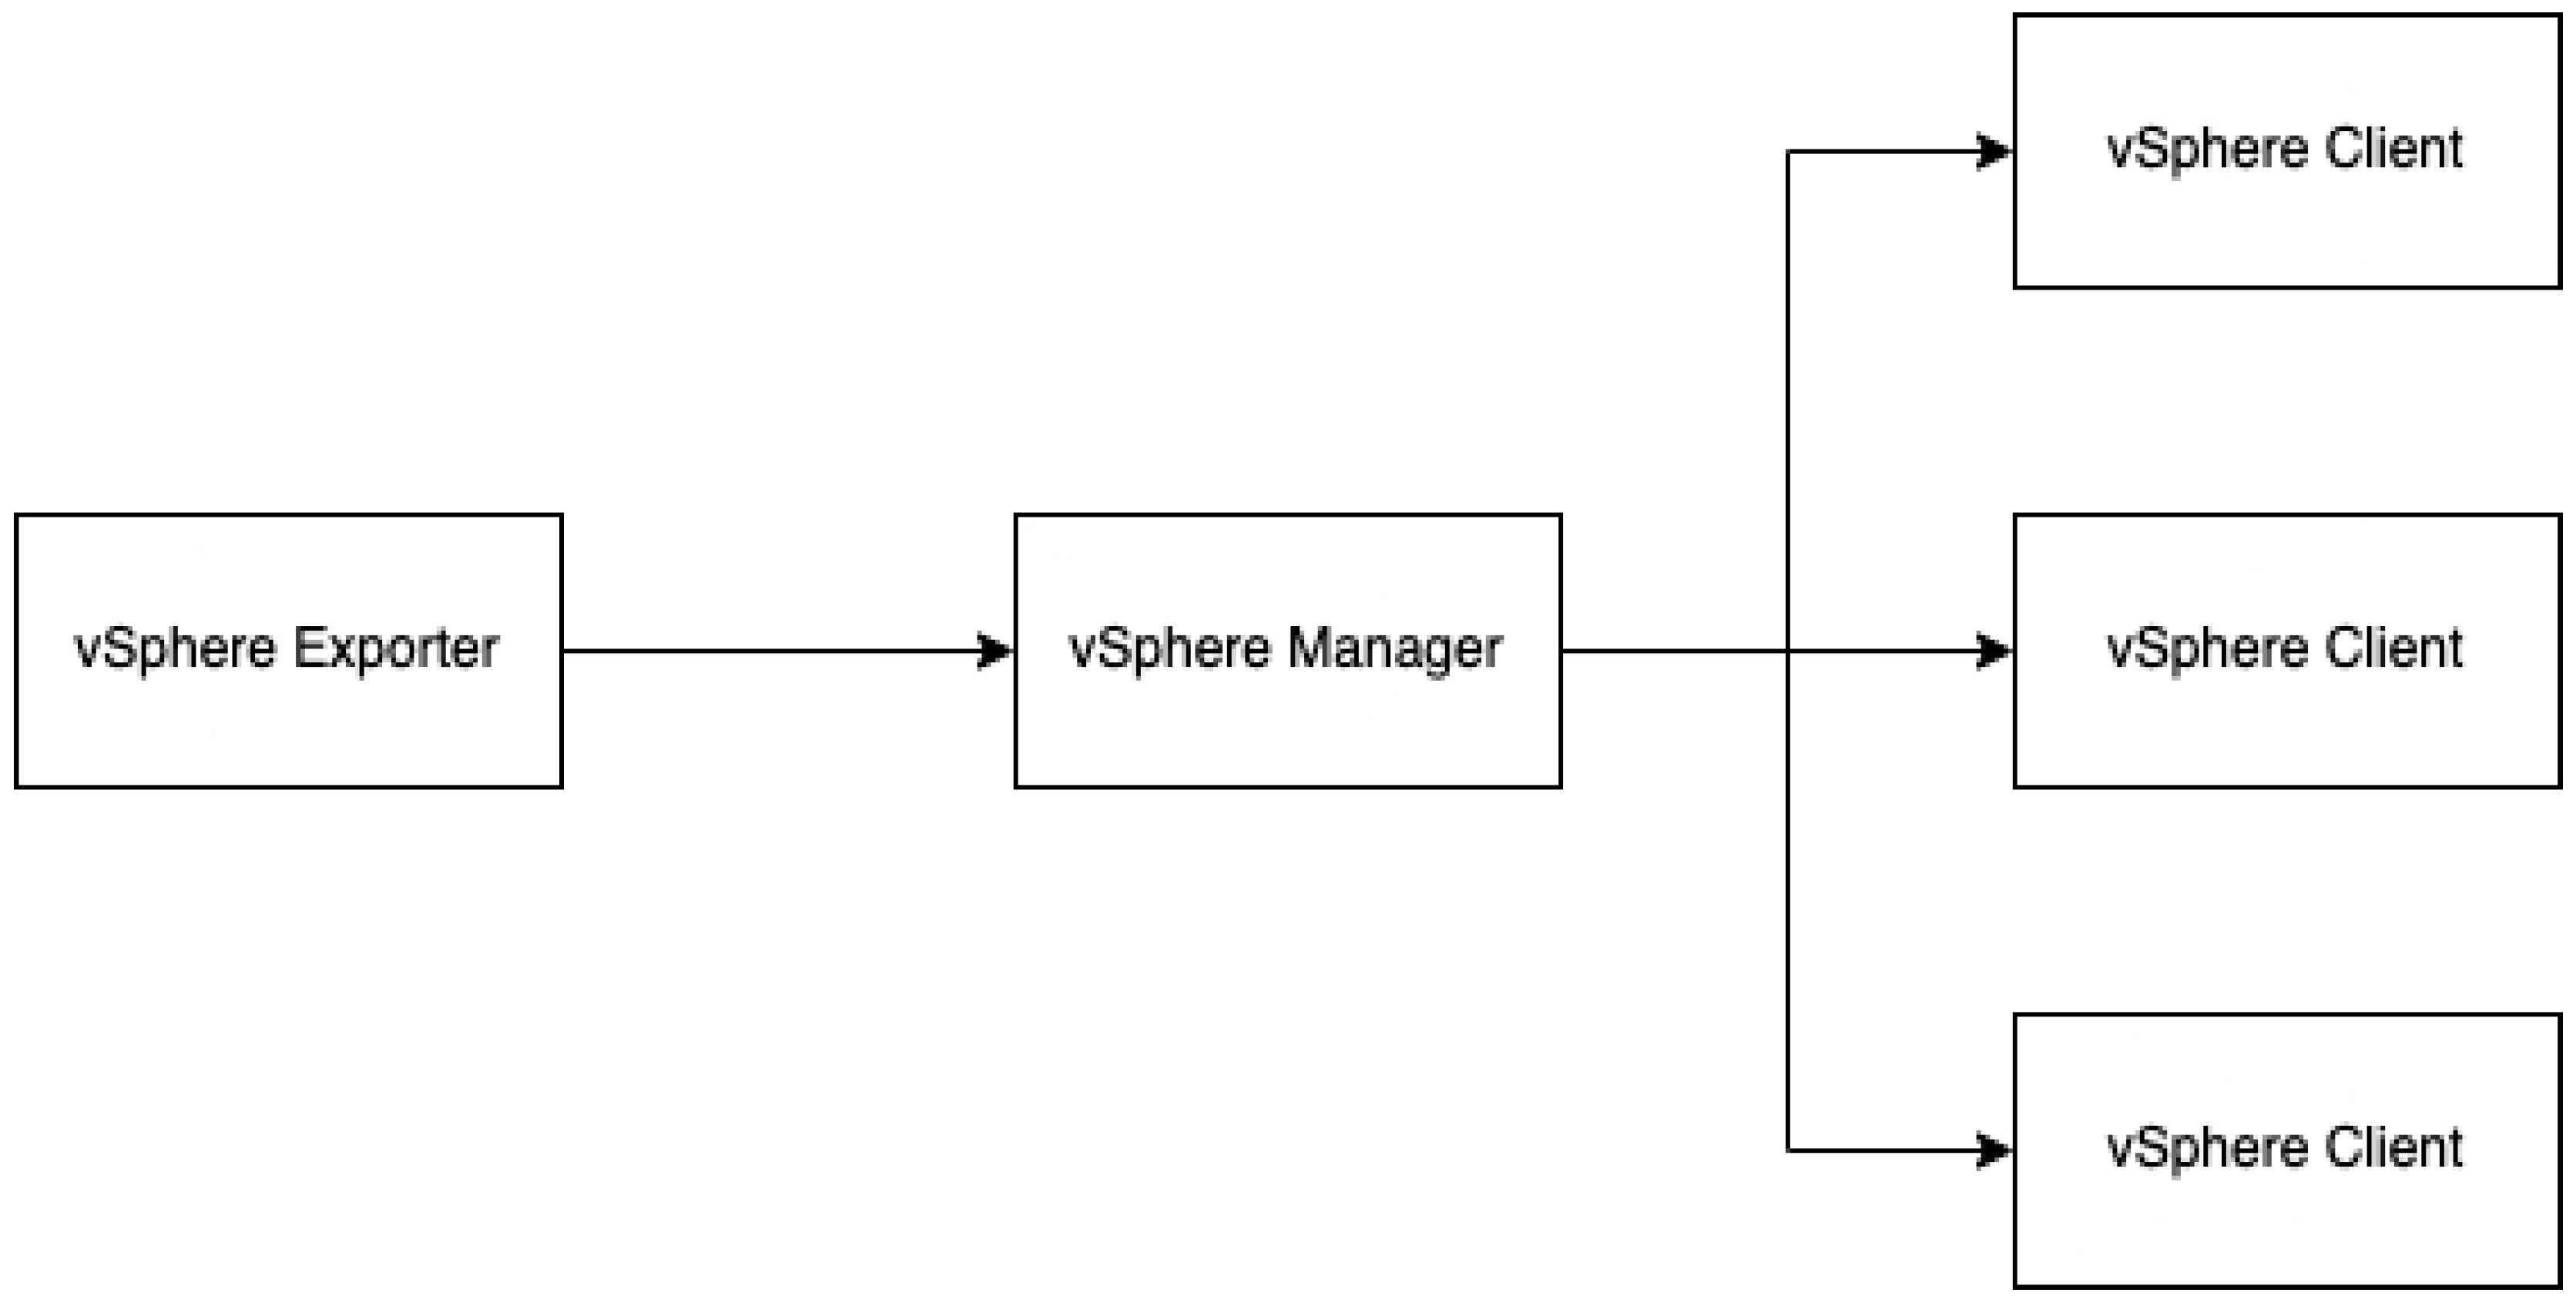
Figure 6.
Prometheus configuration definition.
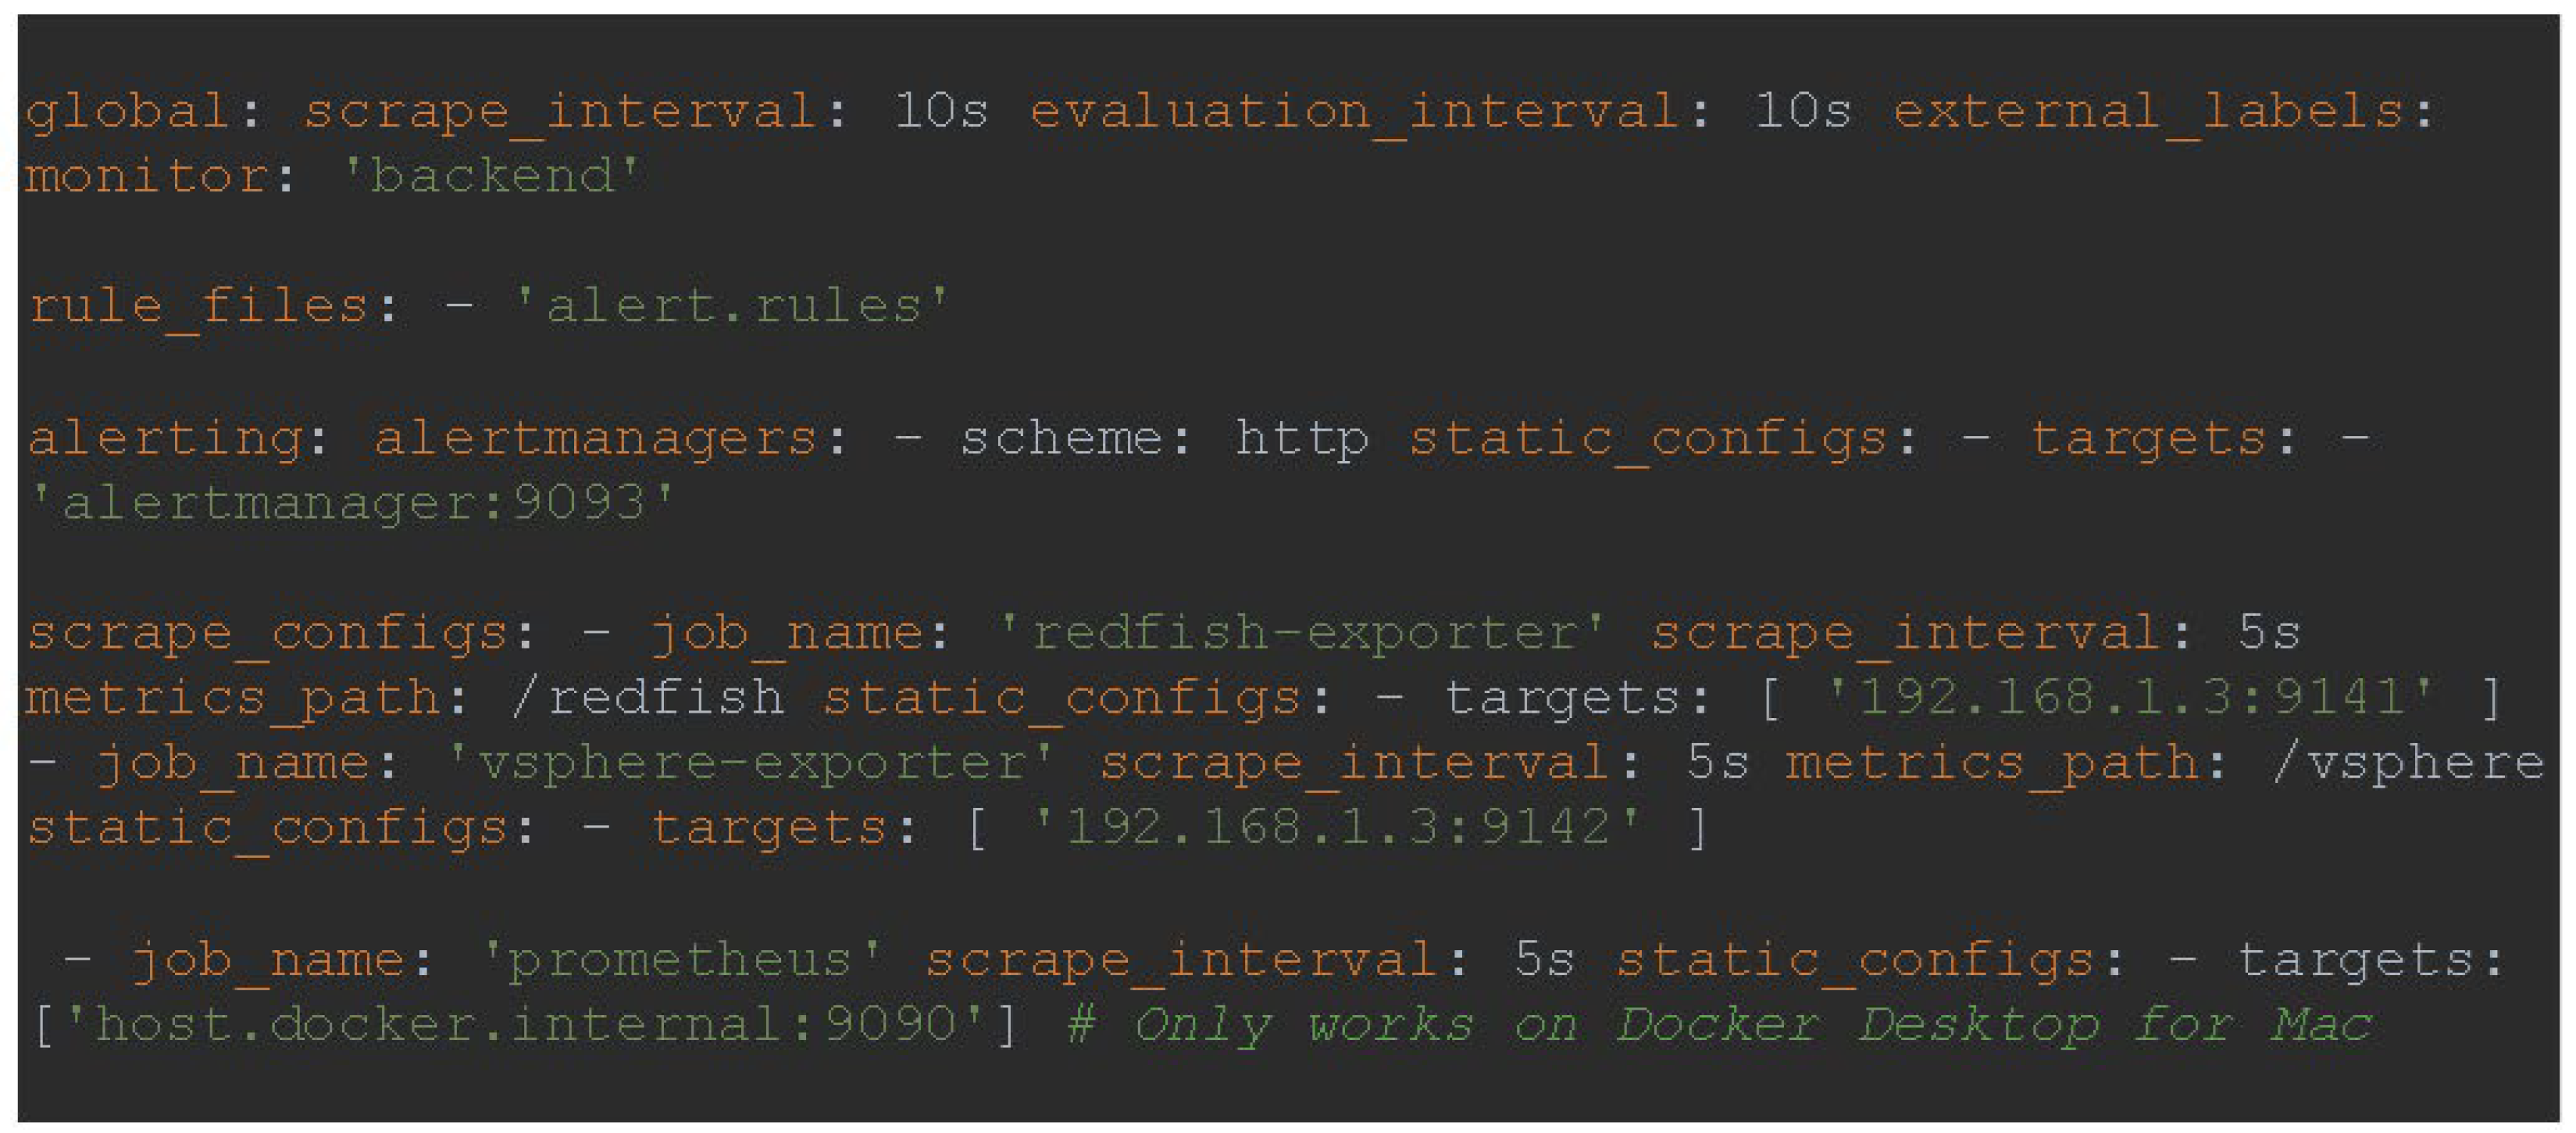
Figure 7.
Default Alert Policy configuration definition.
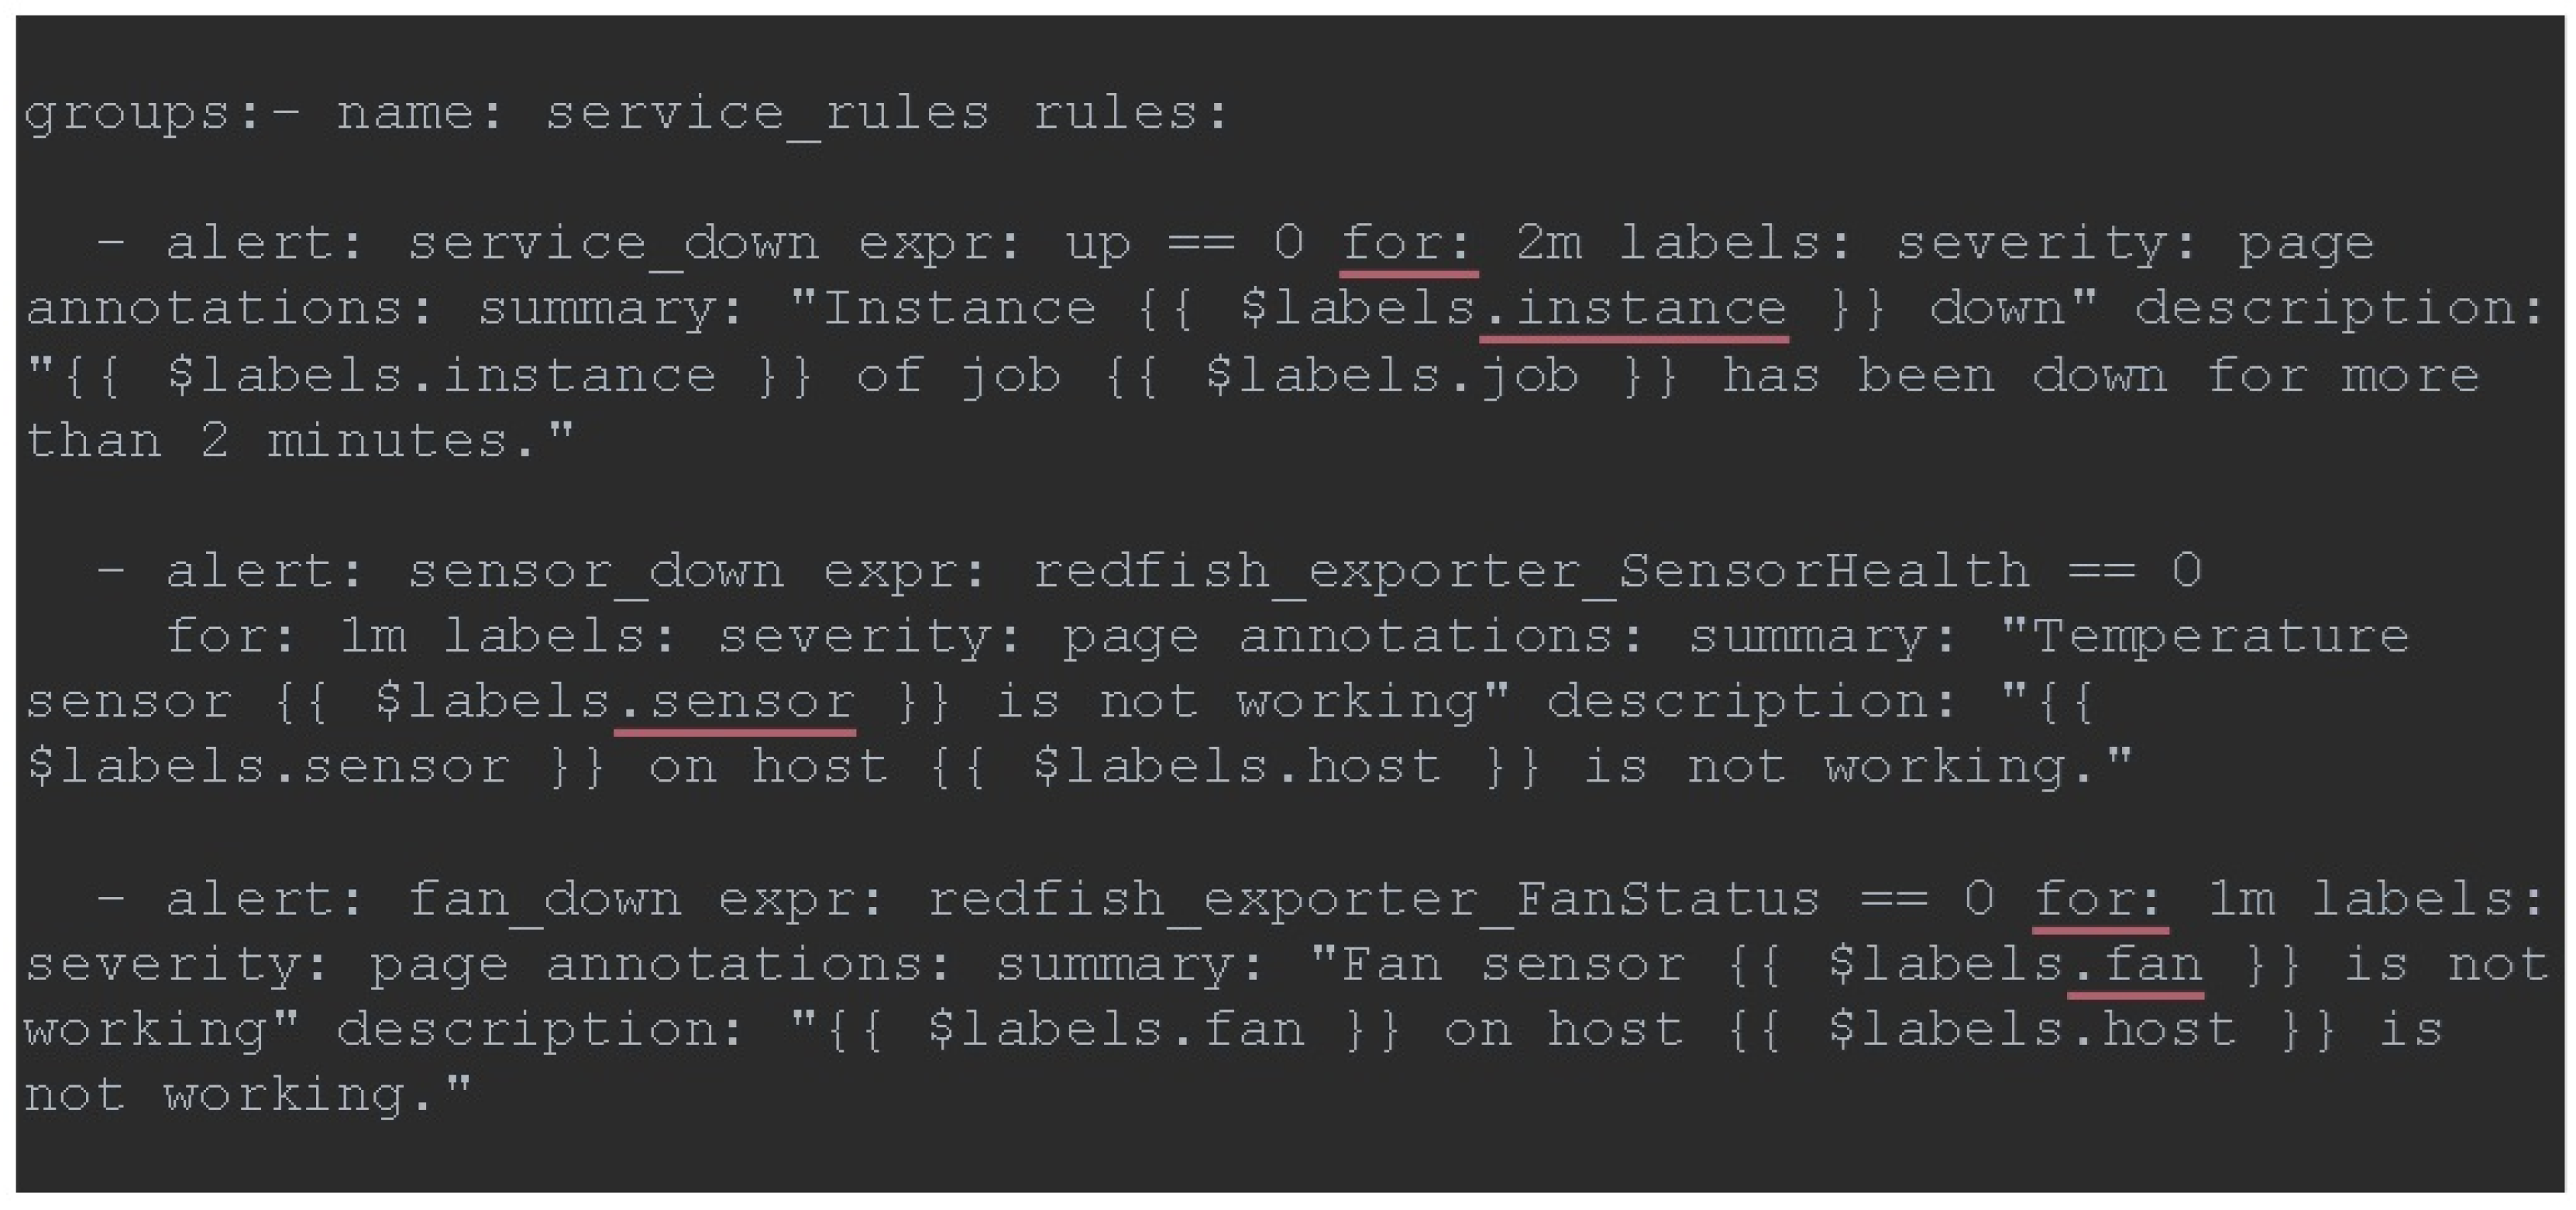
Figure 8.
Alertmanager configuration definition.
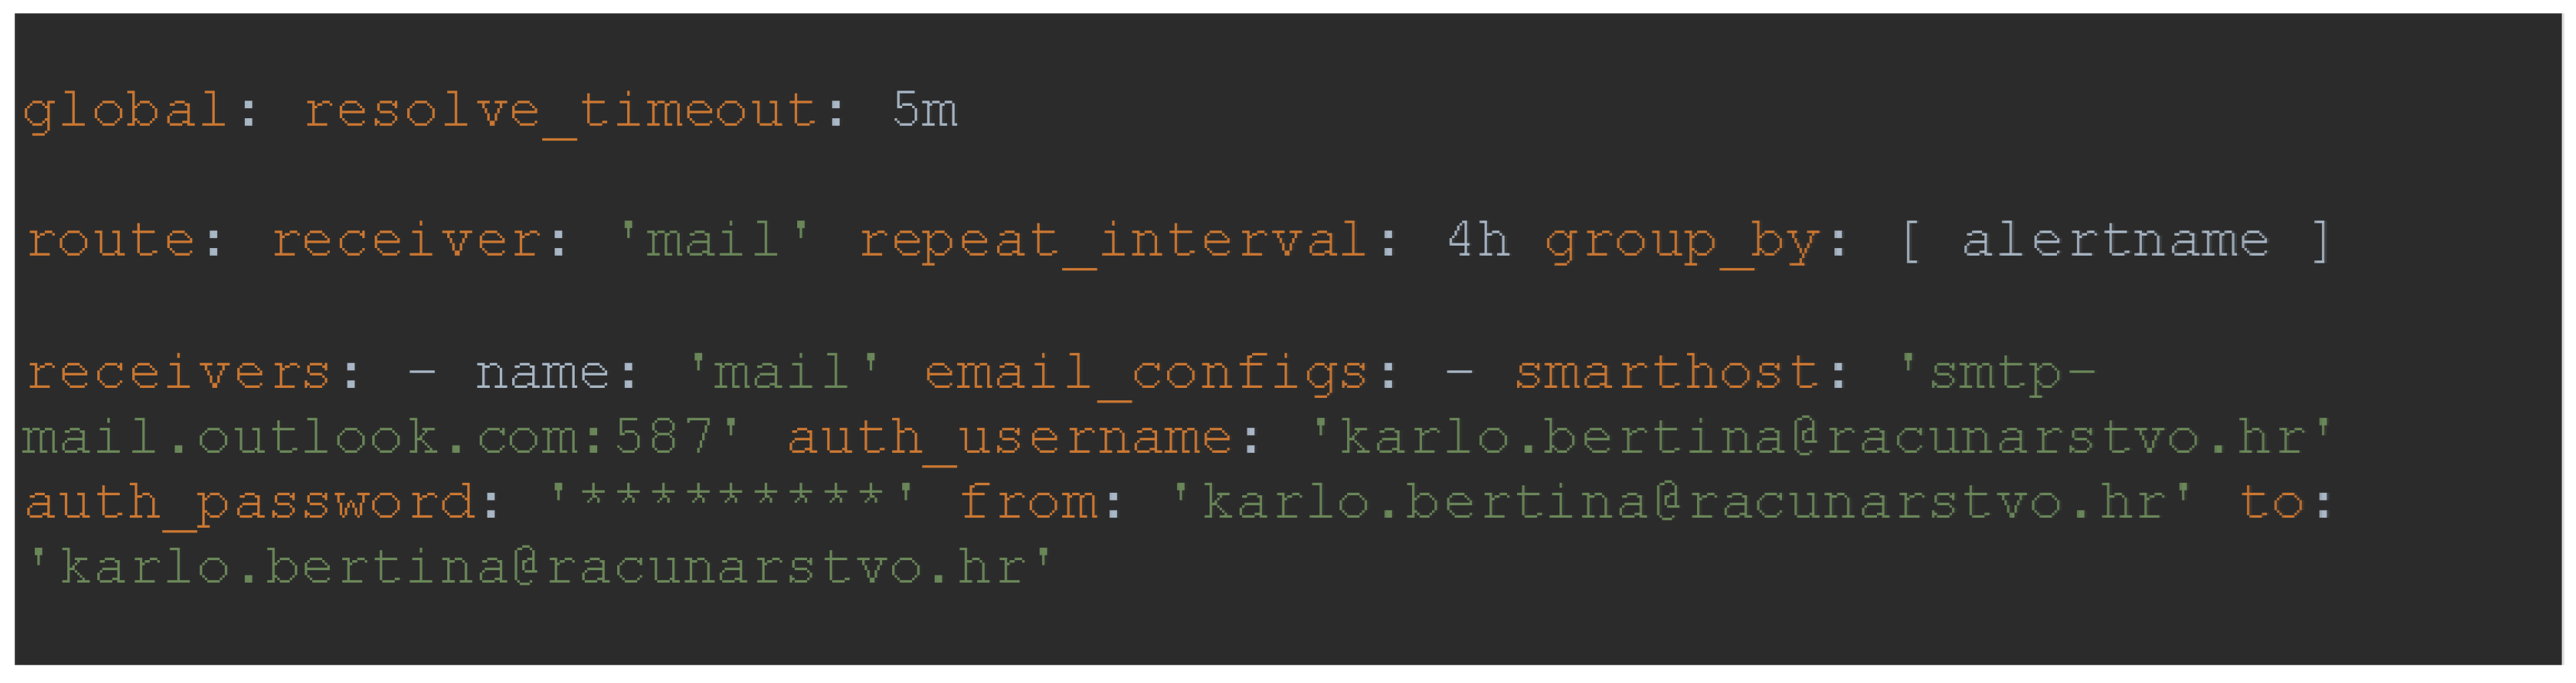
Figure 9.
Default data source definition.
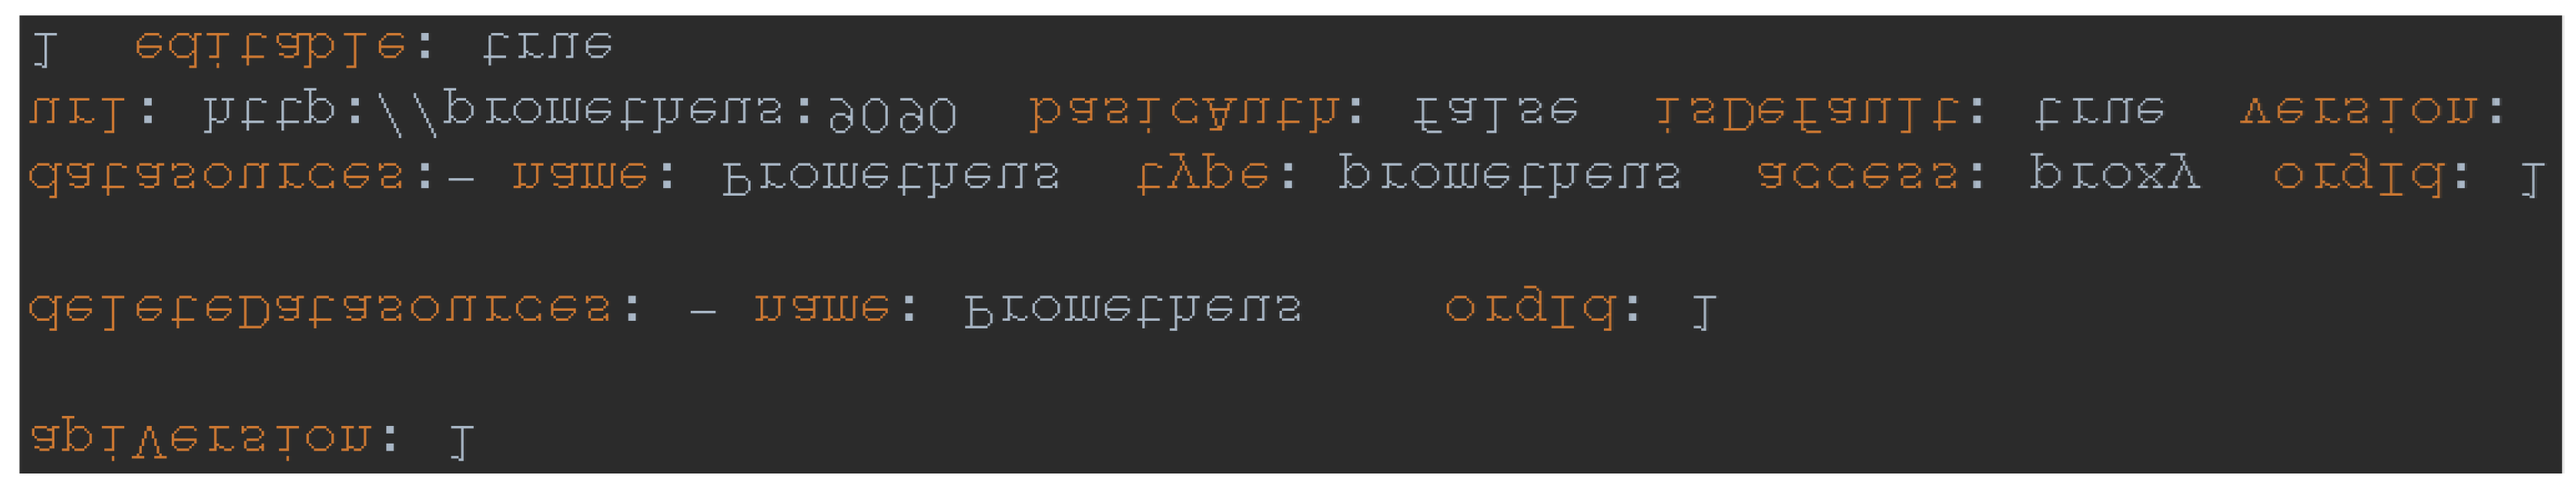
Figure 10.
Default dashboard definition.
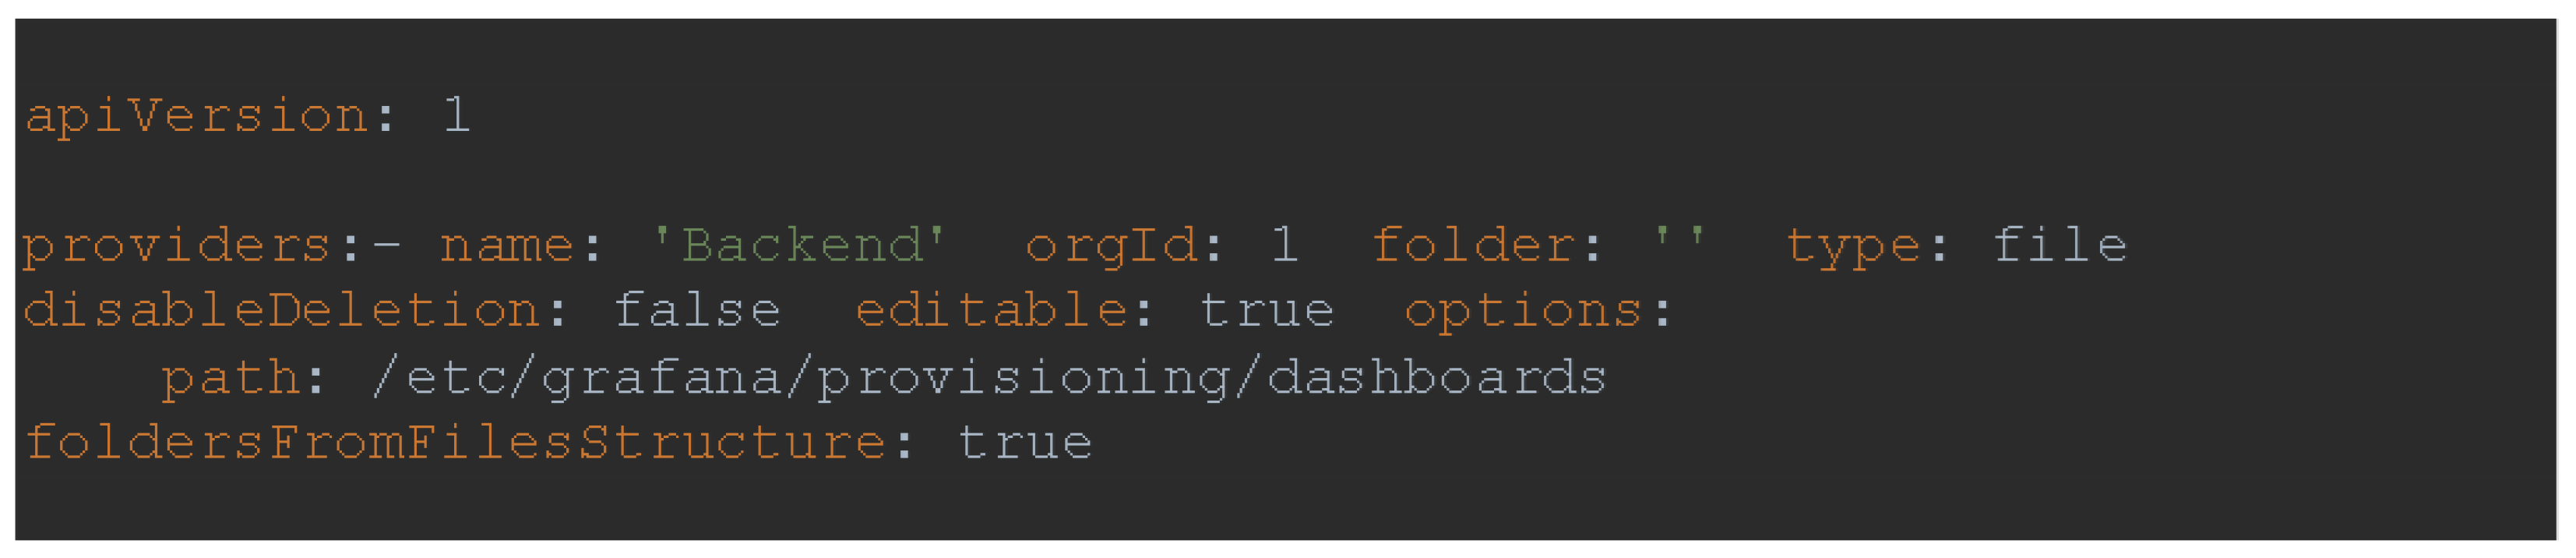
Figure 11.
Redfish agent configuration.
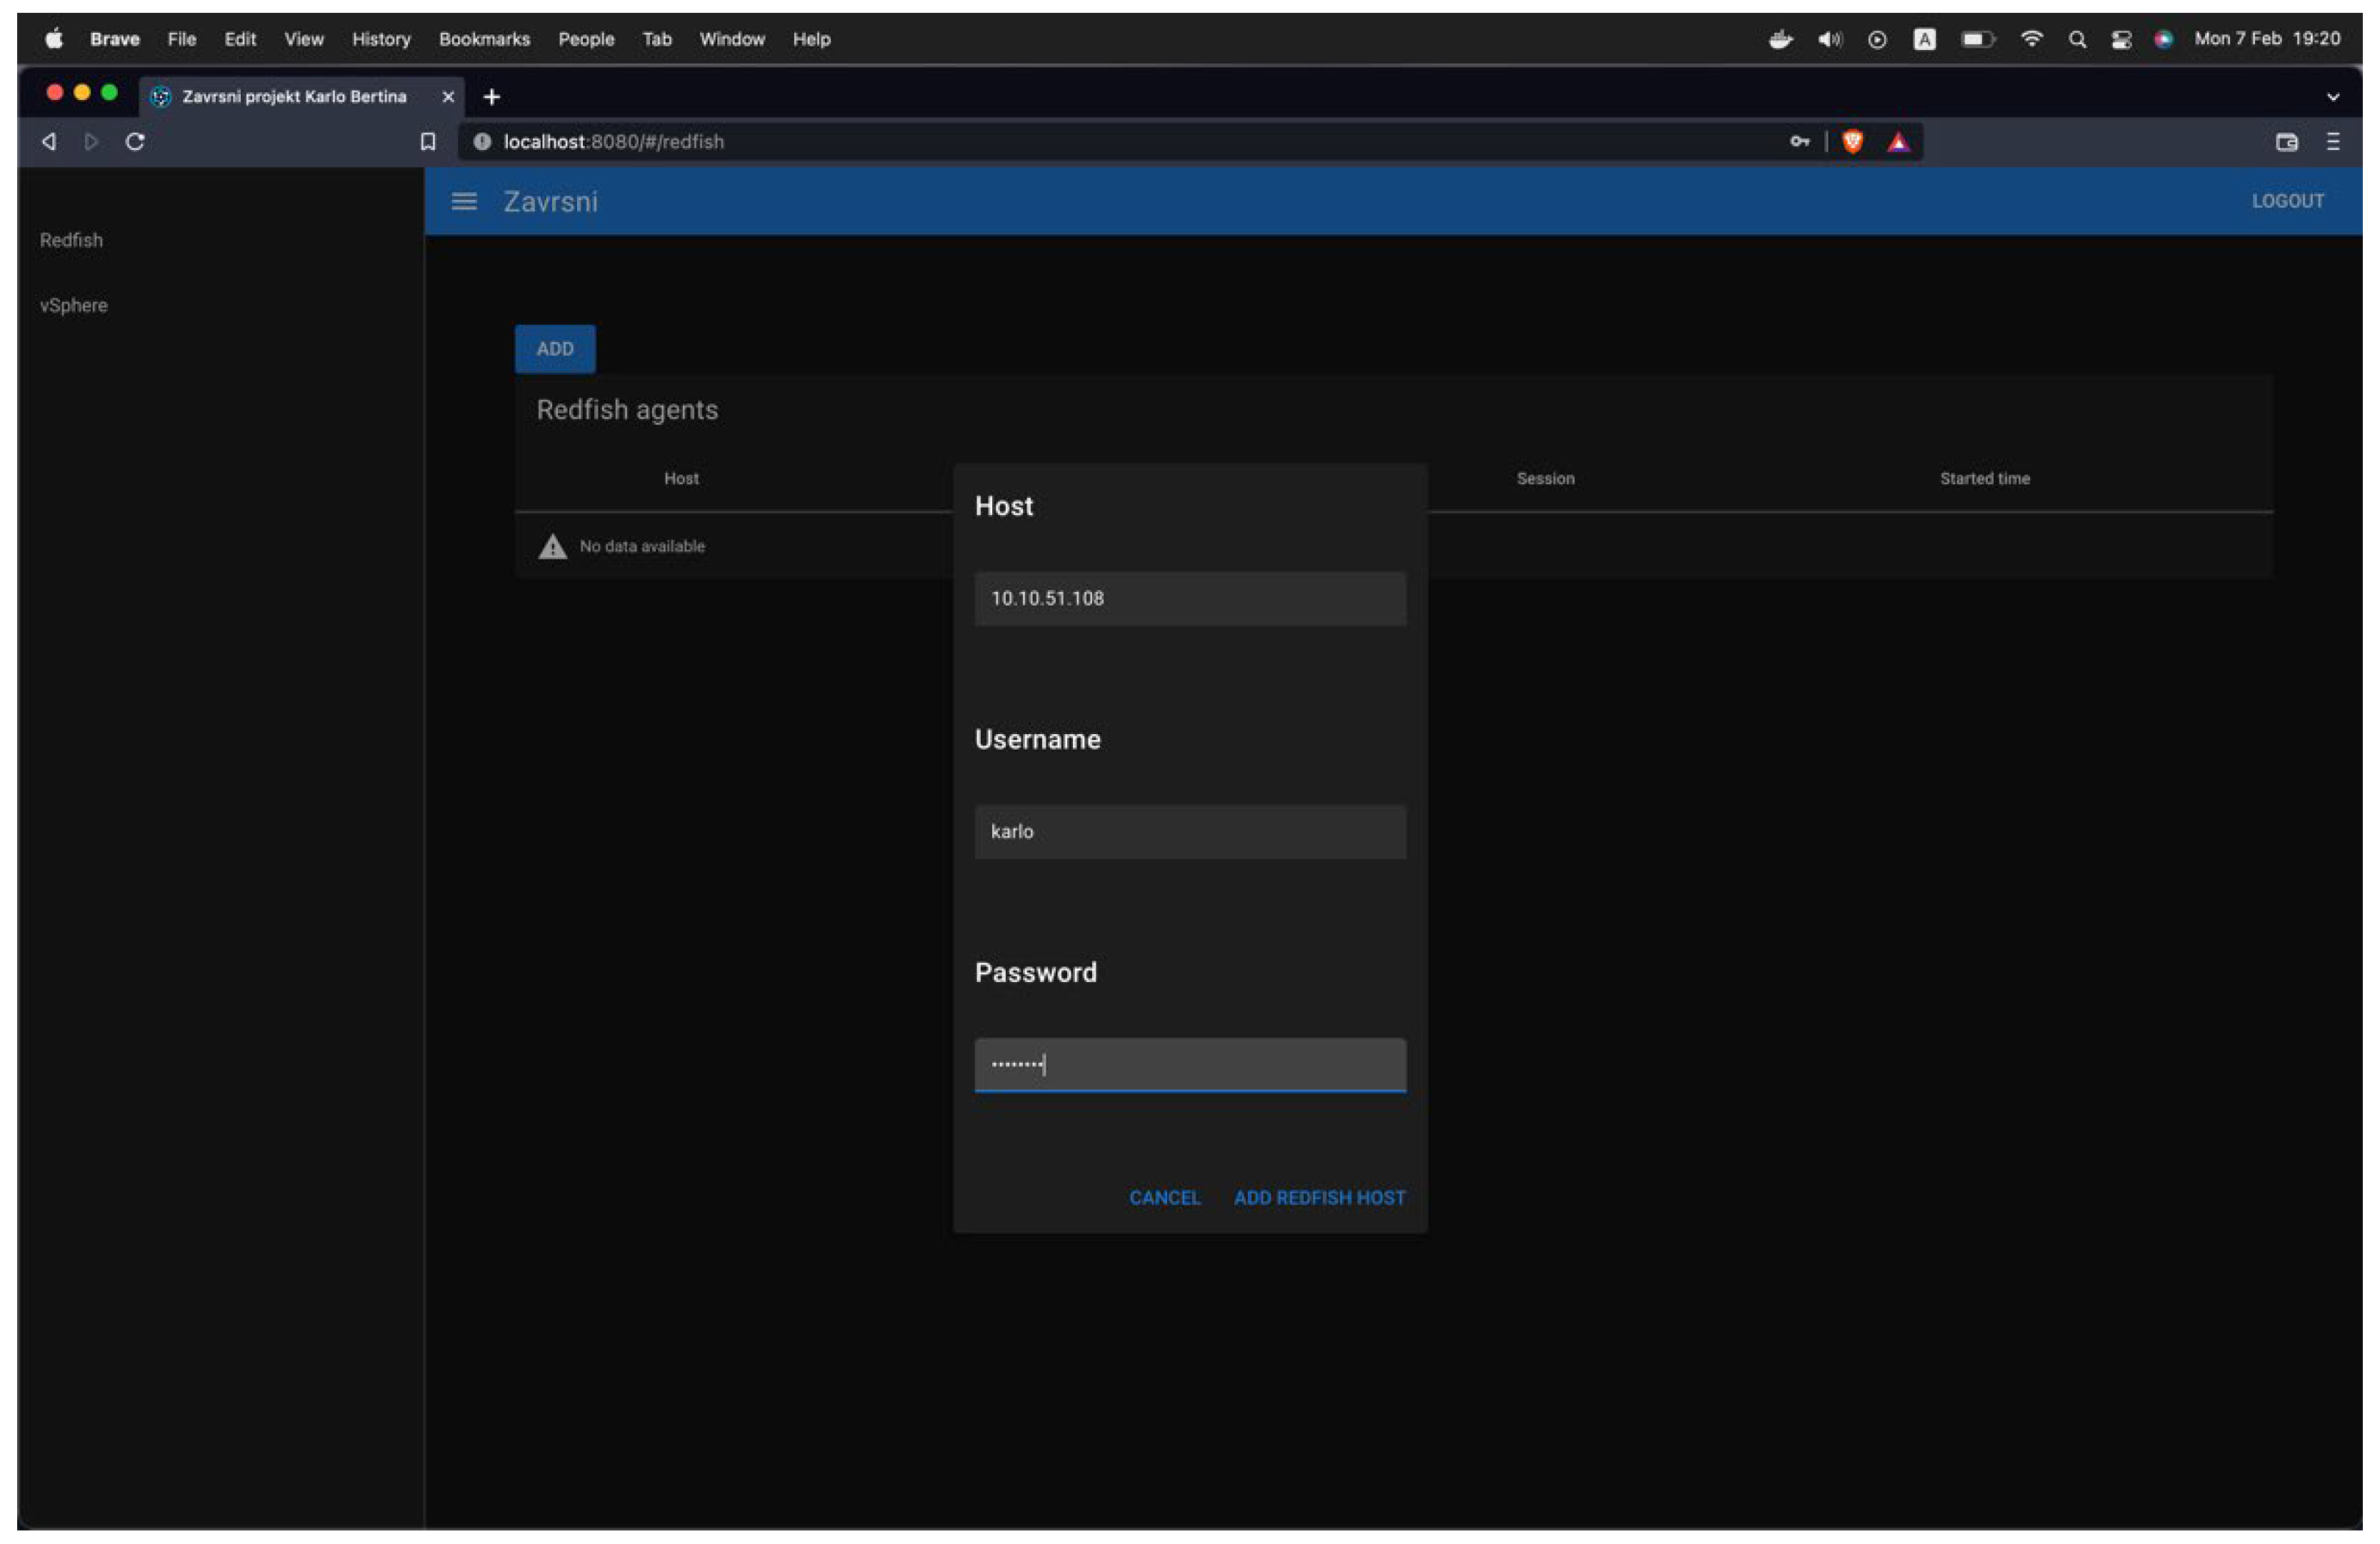
Figure 12.
Server status dashboard via Redfish agent.
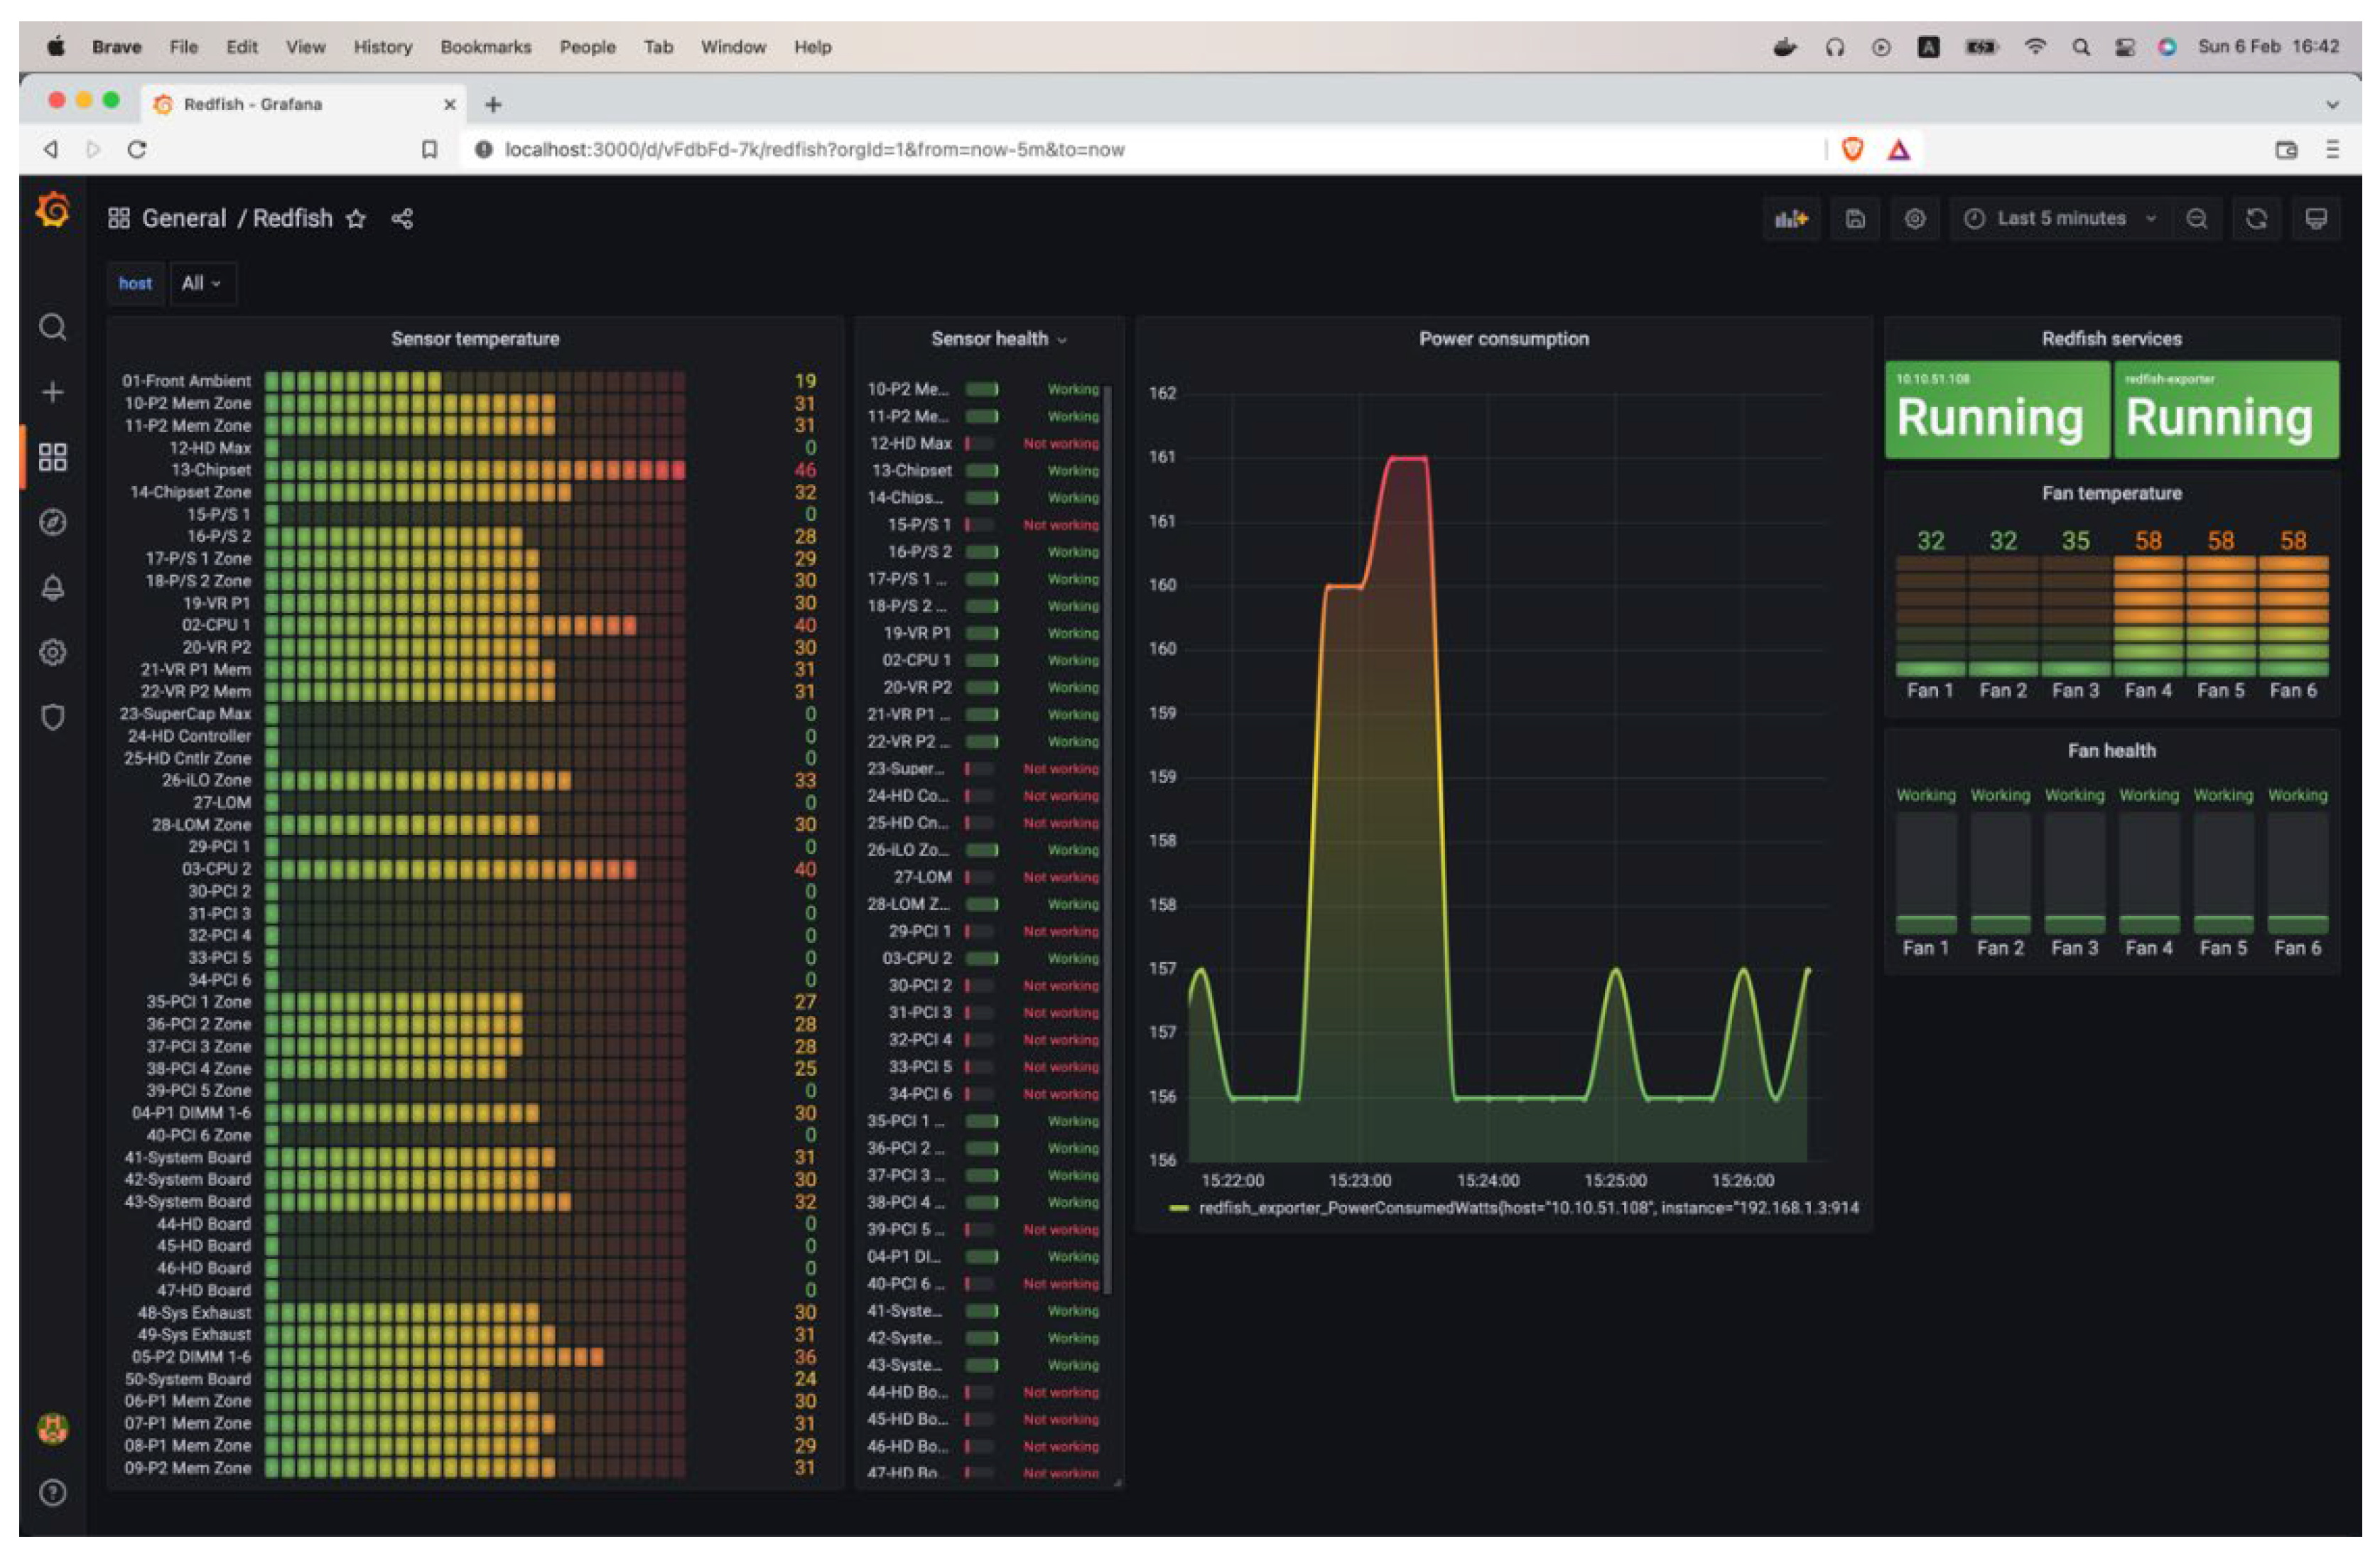
Figure 13.
Server status dashboard via vSphere agent.
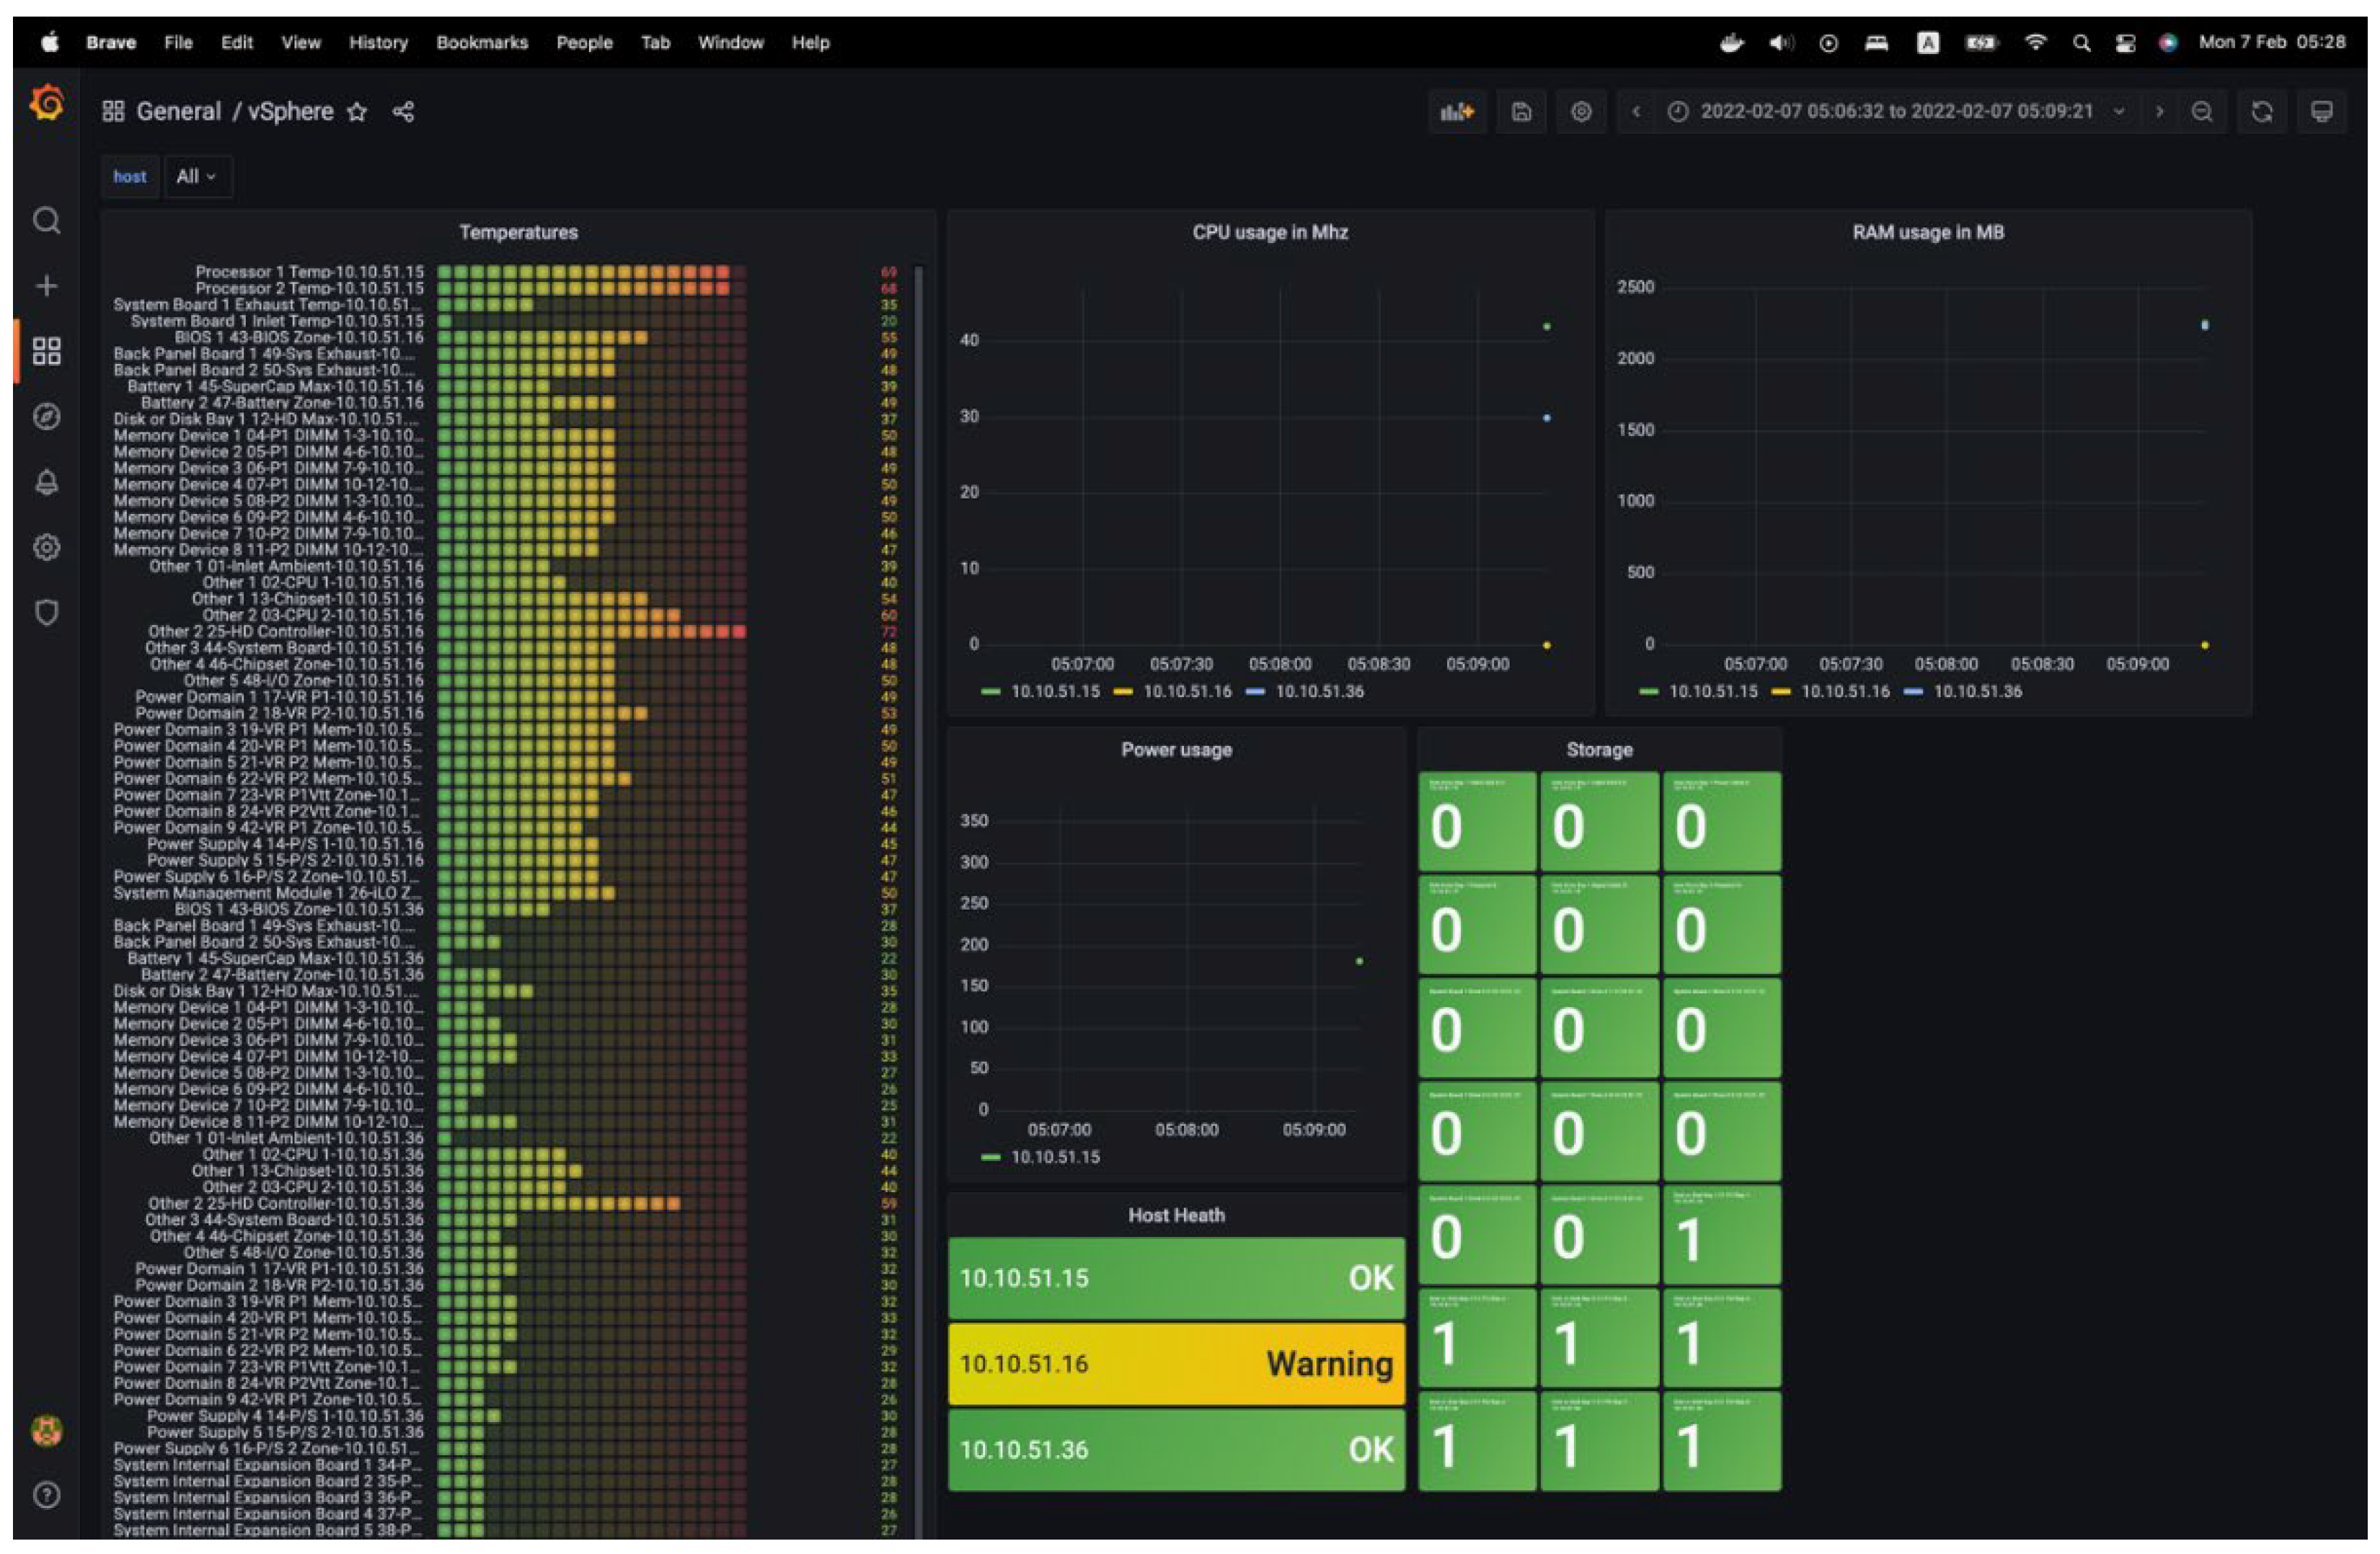
Figure 14.
Wizard for creating an alert rule.
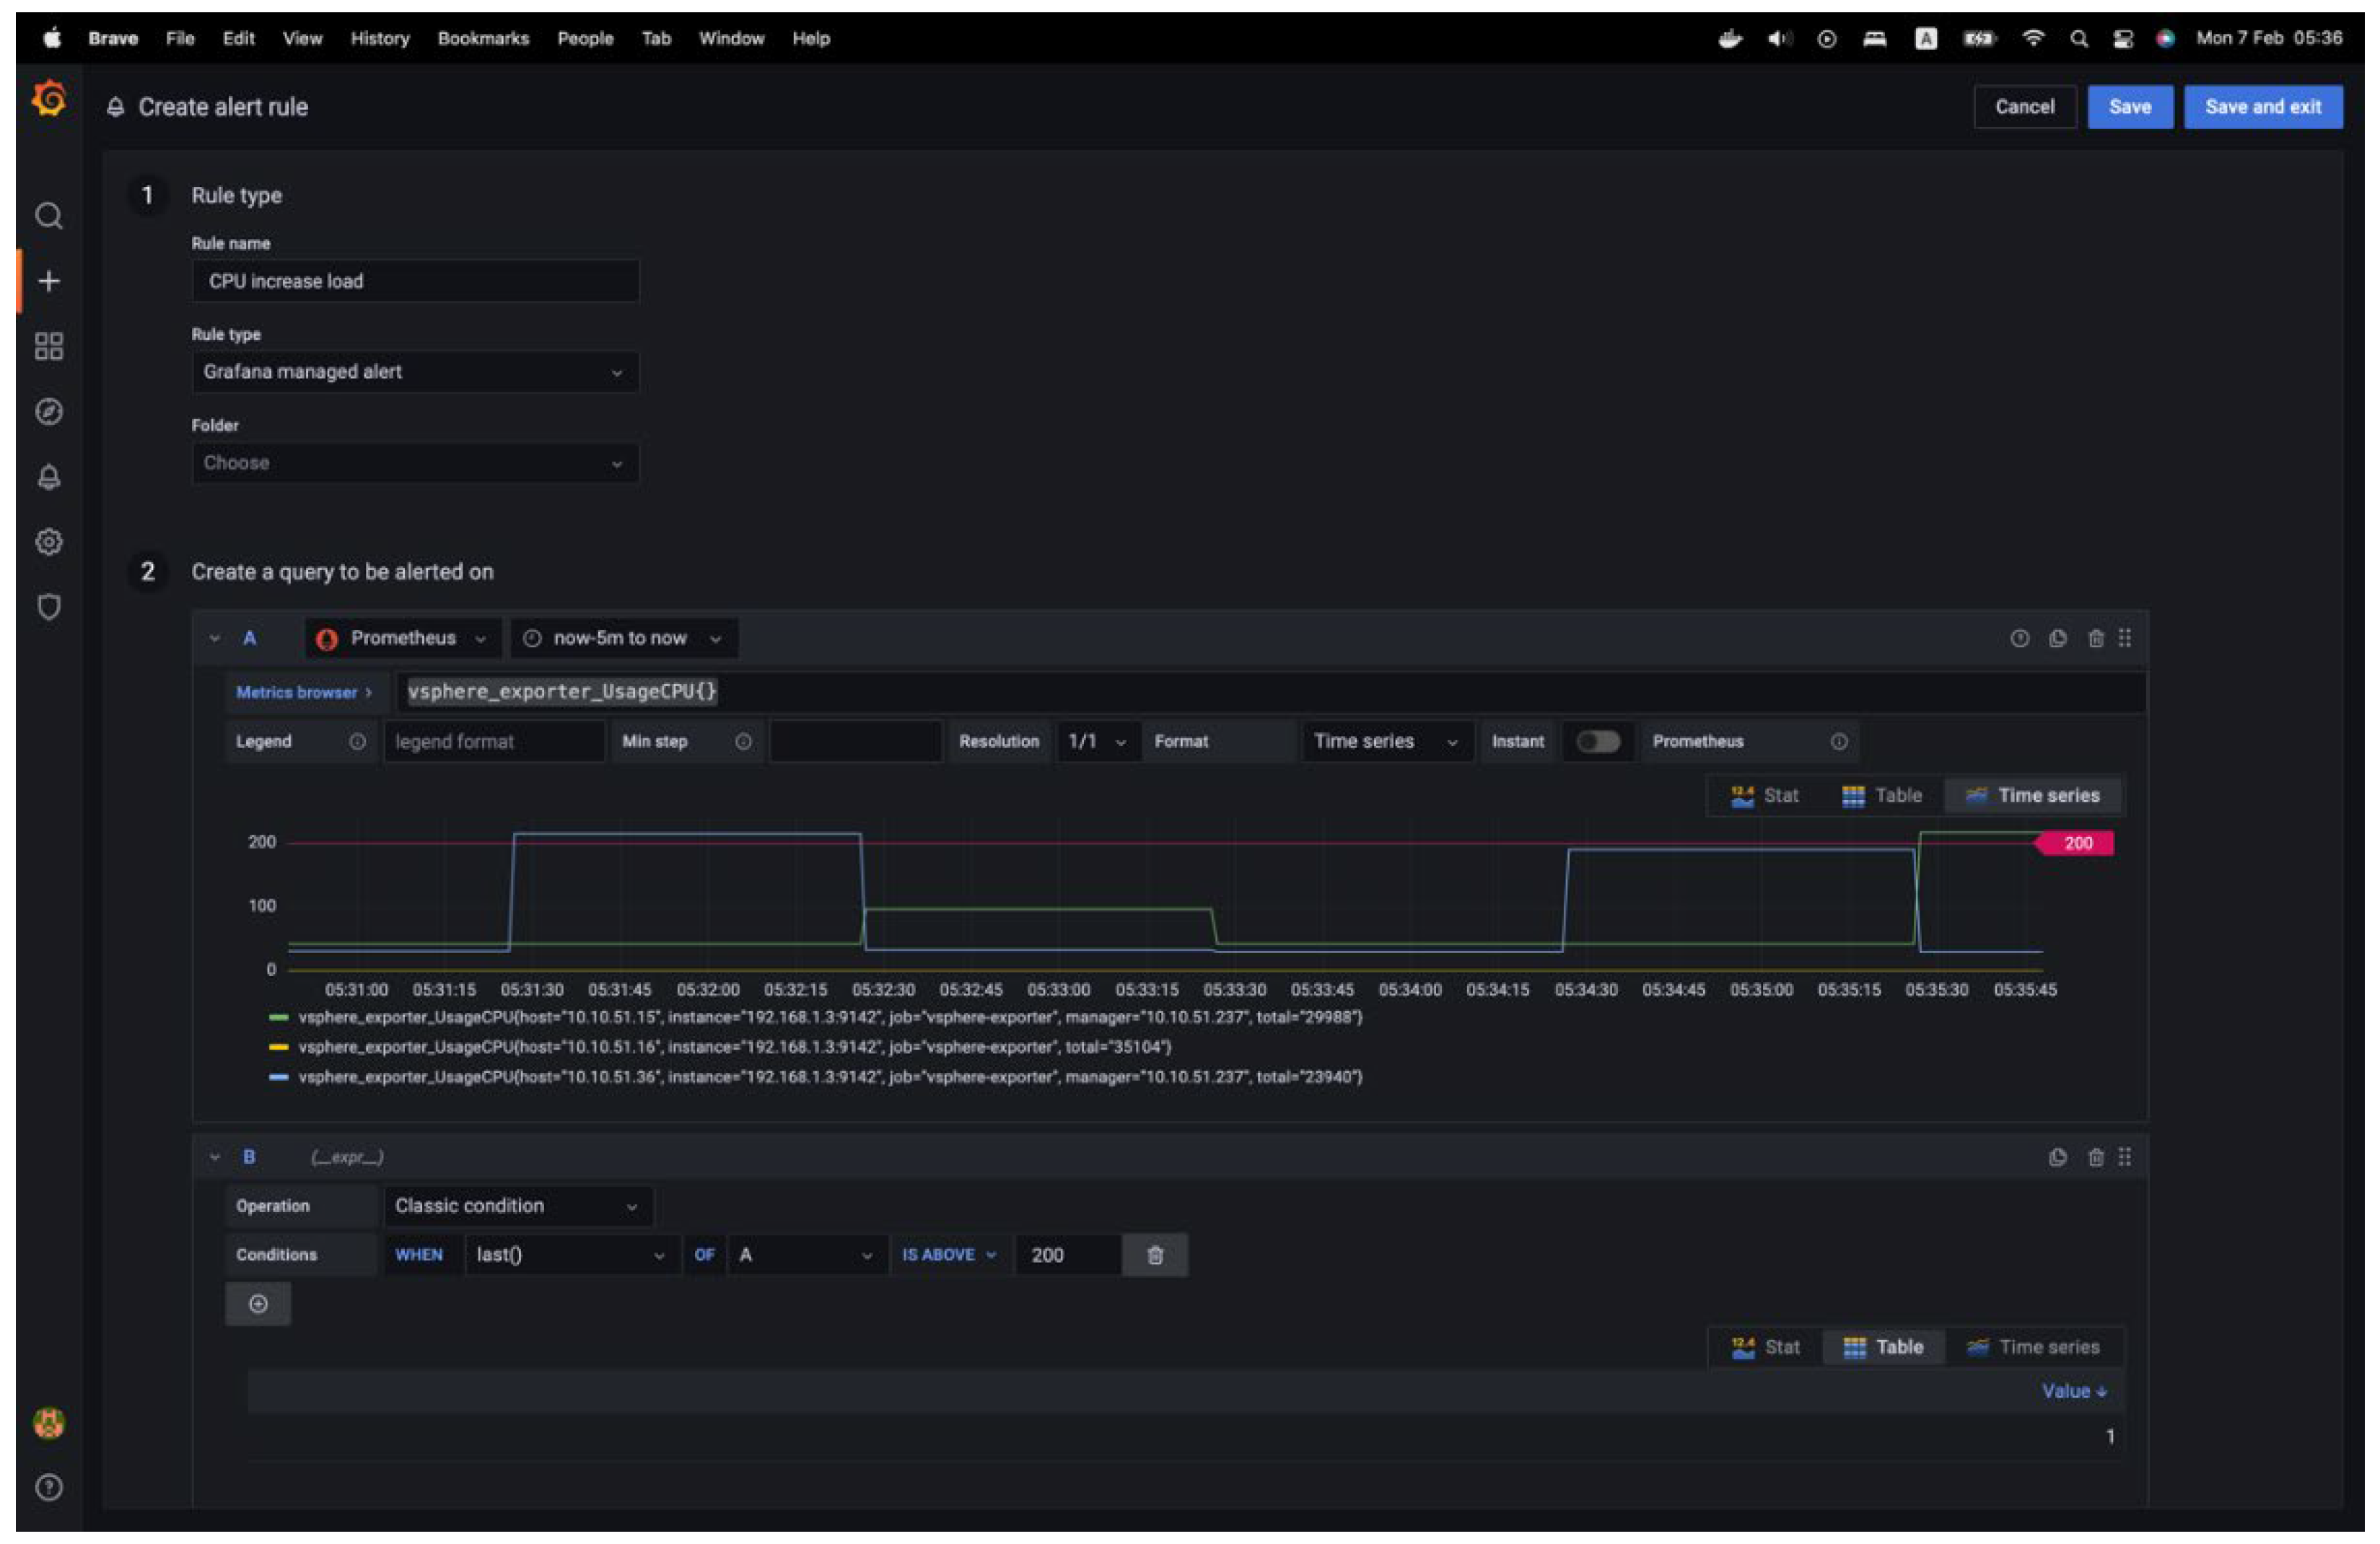
Figure 15.
Adding a contact point.
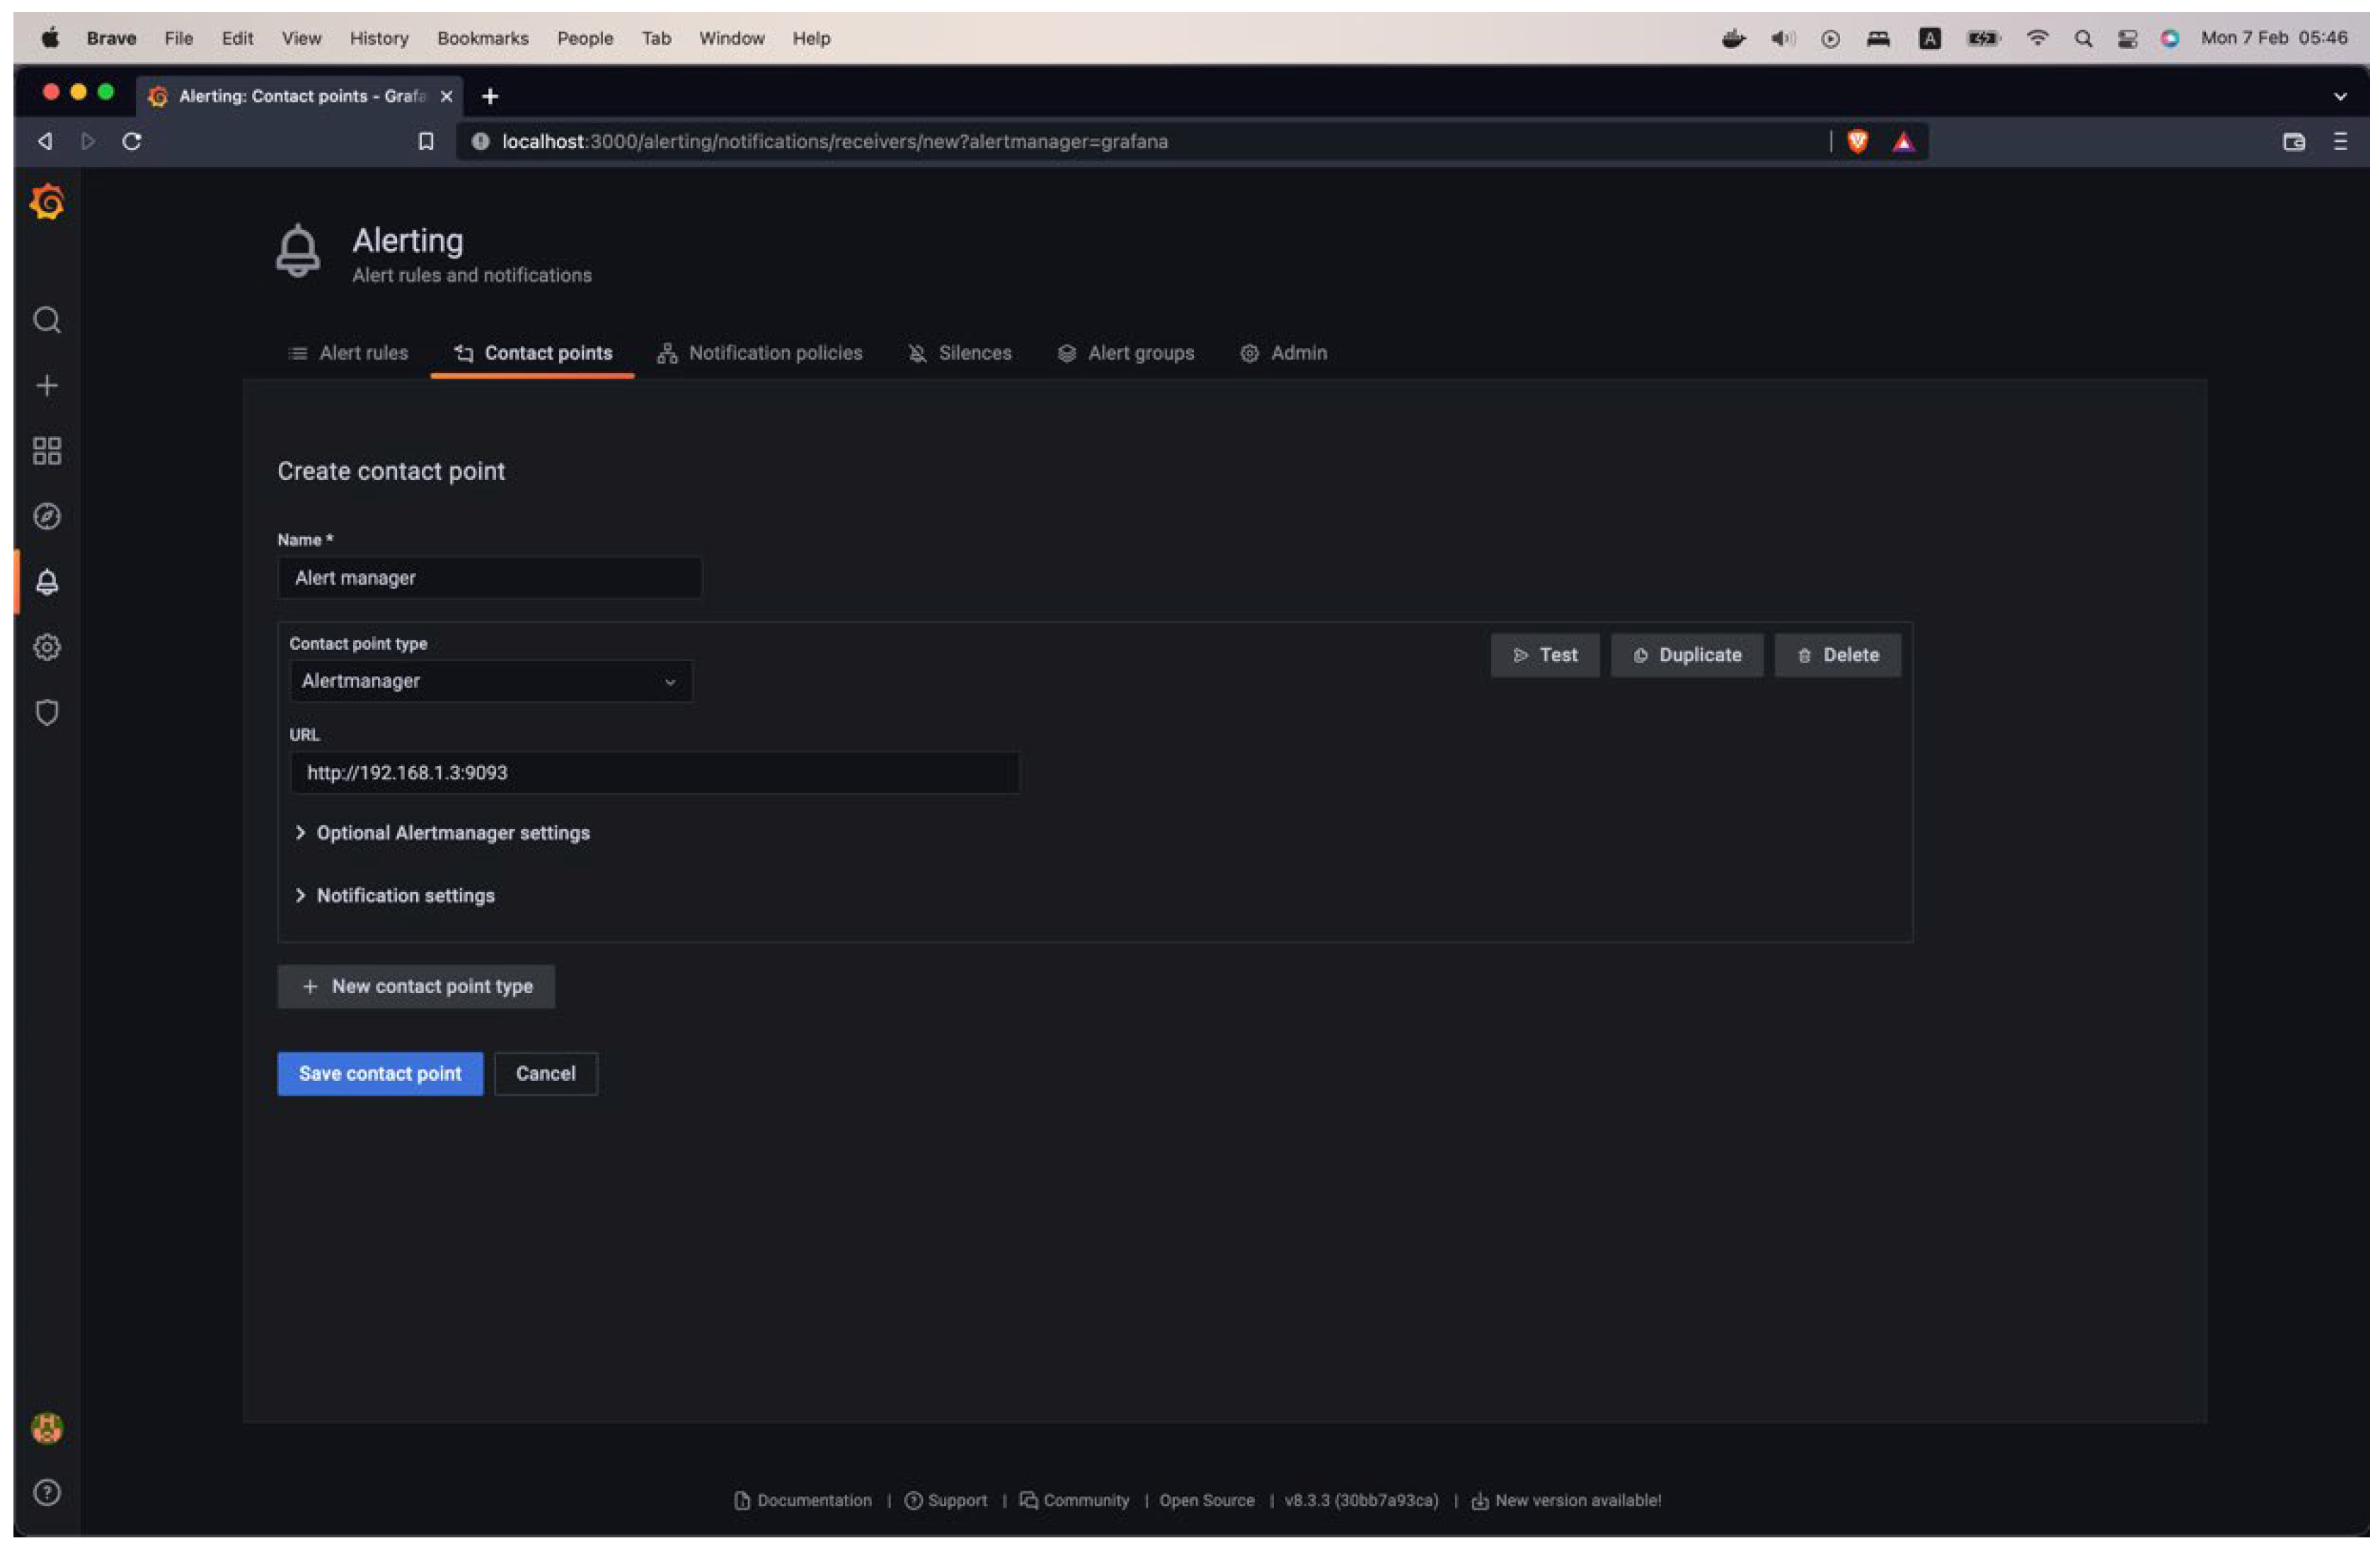
Figure 16.
Display of server state change – new workload started.
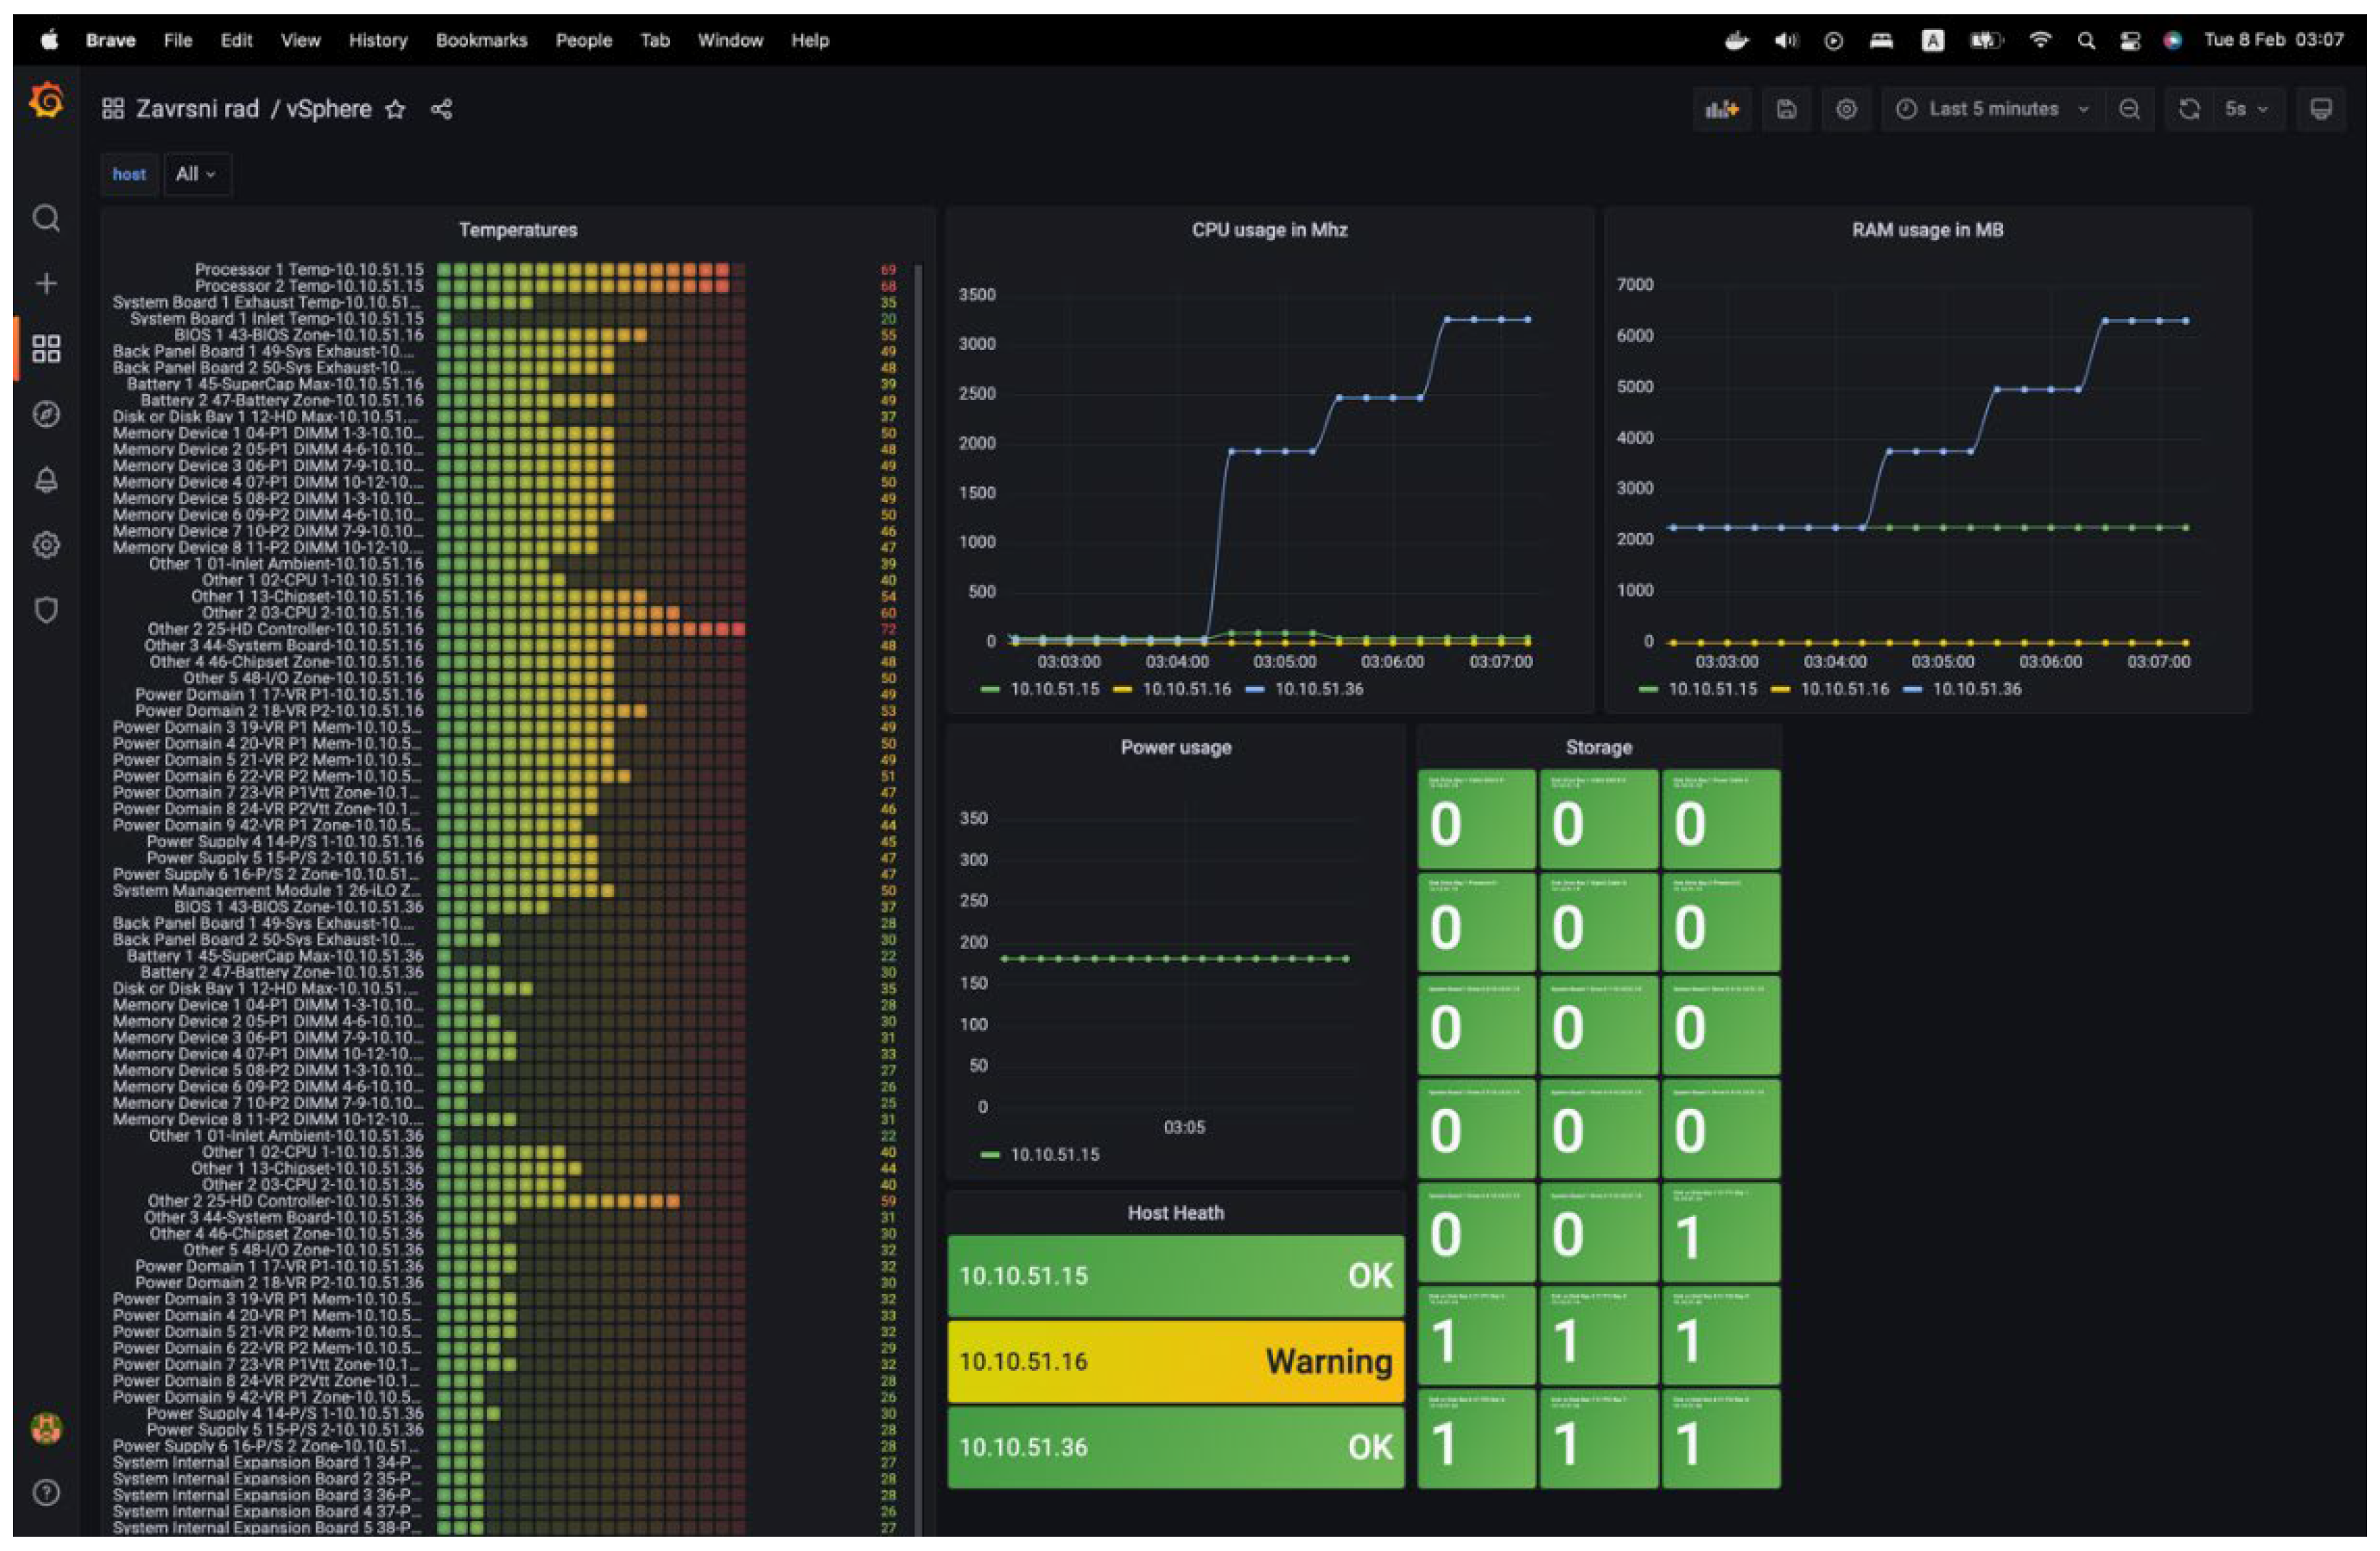
Figure 17.
Display of alert status changes.
Disclaimer/Publisher’s Note: The statements, opinions and data contained in all publications are solely those of the individual author(s) and contributor(s) and not of MDPI and/or the editor(s). MDPI and/or the editor(s) disclaim responsibility for any injury to people or property resulting from any ideas, methods, instructions or products referred to in the content. |
© 2024 by the authors. Licensee MDPI, Basel, Switzerland. This article is an open access article distributed under the terms and conditions of the Creative Commons Attribution (CC BY) license (http://creativecommons.org/licenses/by/4.0/).
Copyright: This open access article is published under a Creative Commons CC BY 4.0 license, which permit the free download, distribution, and reuse, provided that the author and preprint are cited in any reuse.


