
Submitted:
13 November 2024
Posted:
15 November 2024
You are already at the latest version
Abstract
Background: A complex interplay between immune cells and abnormal tumor vasculature in the tumor microenvironment has been previously shown in preclinical studies, while clinical data suggest that angiogenesis biomarkers may be useful as predictors of prognosis and treatment response in immunotherapy-treated solid tumors, including non-small cell lung cancer (NSCLC). Our primary aim was to investigate the prognostic and predictive value of baseline and post-treatment levels of serum vascular endothelial growth factor-A and –B (VEGF-A and VEGF-B, respectively), soluble programmed cell death-1 (sPD-1) and programmed cell death-ligand 1 (sPD-L1) in patients with advanced NSCLC treated with immune checkpoint inhibitors (ICIs).
Methods: 55 patients with advanced NSCLC eligible to receive ICIs (as monotherapy or in combination with chemotherapy) were prospectively enrolled. A group of sex- and age-matched healthy controls (n=16) was also recruited, for determination of the optimal cut-offs and the potential diagnostic value of the examined biomarkers. Serum VEGF-A, VEGF-B, sPD-1 and sPD-L1 levels were measured in peripheral blood samples using ELISA, both at baseline and at the time of treatment response evaluation, and were correlated with treatment response, prognosis (PFS, OS), and the remaining clinicopathological features of patients.
Results: Mean age of patients was 66.5 years (SD=8.0 years); 65,5% of patients received chemo-therapy and pembrolizumab combination while the remaining patients received pembrolizumab monotherapy. VEGF-B and sPD-1 levels were significantly decreased and increased, respectively, after treatment (p=0,028 and p
Keywords:
immune checkpoint inhibitors
; non-small cell lung cancer
; sPD-1
; sPD-L1
; VEGF-A
; VEGF-B
1. Introduction
The advent of immune checkpoint inhibitors (ICIs) has revolutionized the treatment landscape in advanced non-small cell lung cancer (NSCLC), particularly in the subset of patients with non-oncogene-addicted disease, where ICIs, with or without chemotherapy, is the recommended first-line therapy [1]. Previous trial data have shown that first-line monotherapy with single-agent ICI in this setting may significantly prolong survival as compared to platinum doublet chemotherapy, particularly among patients with high programmed death-ligand 1 (PD-L1) expression, achieving as of yet unprecedented 5-year survival rates in this selected subgroup [2,3,4,5]. Most, but not all, observational studies seem to confirm these results in real-world practice as well, but the maximum benefit is again observed among patients resembling the selected populations of the above pivotal trials, with regard to disease stage, performance status and PD-L1 status, while older or more fragile patients often show significantly worse outcomes [6,7,8,9]. Evidently, not all patients derive a significant benefit from ICIs, while those who do benefit are at risk of treatment-related toxicity due to the potential occurrence of immune-related adverse events (irAEs) of variable severity, ranging from mild to life-threatening; furthermore, secondary resistance following the initial response ensues eventually, throughout the course of treatment, in the majority of cases [10,11,12]. All the above emphasize the need for treatment stratification based on robust and longitudinal predictive biomarkers, with the ability to accurately predict which patients are more likely to respond favorably to these agents, so as to select them accordingly, thus increasing treatment efficacy while reducing the risk of unnecessary treatment-related toxicity.
Immunohistochemical PD-L1 expression, routinely assessed on histological samples as tumor proportion score (TPS), is the most widely used predictor of ICI response until now, but its real-world applications are often limited by significant challenges, mainly including the need for invasive sampling methods, its heterogeneous expression in tumor tissue, reflecting the intratumoral heterogeneity of NSCLC, as well as the suboptimal standardization of the diagnostic assays employed and variability of the scoring systems and cut-off values used [11,13,14]. Tumor mutational burden (TMB), and microsatellite instability/mismatch repair deficiency (MSI/MMR) are additional tissue-based biomarkers widely applied for prediction of ICI response, either independently or in combination with PD-L1 TPS, often providing stronger predictive information as compared to PD-L1 status alone, but failing as well to consistently provide clinically relevant and reproducible results or to accurately reflect the temporal and spatial heterogeneity of advanced NSCLC [14,15].Therefore, there clearly remains an unmet need to identify novel, ideally blood-based, predictive biomarkers in immunotherapy-treated NSCLC.
Abnormal tumor vasculature may interact with immune cells in the tumor microenvironment, in a complex interplay, ultimately leading to immune suppression which in its turn may further drive angiogenesis, “in a vicious cycle of impaired immune activation” as described by Rahma and Hodi [16]. On the other hand, antiangiogenic therapy can reverse this process, by normalizing the tumor blood vessels and restoring the normal function of immune cell factors, thus potentially enhancing the efficacy of immunotherapy as well [17,18]. In accordance to these preclinical data, there is increasing clinical evidence that combination of ICIs with antiangiogenic agents may not only be tolerable but also efficacious in prolonging survival as compared to ICI monotherapy in advanced NSCLC, while a variety of angiogenesis biomarkers, such as the VEGF family, are being studied for their potential utility as predictors of prognosis and treatment response in immunotherapy-treated NSCLC [18,19,20].
The primary aim of our study was to investigate the prognostic and predictive value of baseline and post-treatment levels of a panel of angiogenesis and immune-related markers, including serum vascular endothelial growth factor-A (VEGF-A), vascular endothelial growth factor-B (VEGF-B), soluble programmed cell death-1 (sPD-1) and programmed cell death-ligand 1 (sPD-L1) in patients with advanced NSCLC treated with ICIs. Secondary aims included the investigation of any potential correlations between the above candidate markers and the remaining clinicopathological features studied.
2. Materials and Methods
2.1. Patient Population and Study Design
Consecutive patients (n=55) with advanced NSCLC who were eligible to receive immunotherapy (as monotherapy or in combination with chemotherapy) were prospectively enrolled. A group of sex and age-matched healthy controls (n=16) was recruited as well, for determination of the optimal cut-off point between normal and increased serum levels of VEGF-A, VEGF-B, sPD-1 and sPD-L1. The study protocol was approved by the ethics committee of our institution (approval number: 25244/25-10-19) and written informed consent was obtained from all participants prior to recruitment.
Inclusion criteria were defined as follows: written informed consent, age>18 years, histologically or cytologically confirmed diagnosis of NSCLC, advanced disease stage (IIIB to IV) and eligibility for treatment with ICIs. Patients with operable NSCLC or severe comorbidities, significantly limiting life expectancy (e.g. end-stage cardiac, renal or liver failure) or with other prior or concomitant malignancies were excluded from the study. Tumors were classified using the latest World Health Organization (WHO) histological classification. Staging was done according to the eighth edition of the International Association for Lung Cancer (IASLC) TNM classification system [21]. Standard staging procedures were used, including a complete history and physical examination, blood tests, computed tomography (CT) of the chest and abdomen, positron emission tomography (PET) scan and a computed tomography (CT) scan (PET/CT scan) and CT or magnetic resonance imaging of the brain; bone involvement was documented by PET/CT scan or bone scintigraphy.
All patients were treated with ICIs, with or without chemotherapy, as determined by the attending physician. Follow up evaluations (clinical examination, CT scan and routine laboratory investigations) were carried out at 3-month intervals. Treatment response was assessed using Response Evaluation Criteria in Solid Tumors (RECIST, version 1.1), and was classified as complete response (CR), partial response (PR), stable disease (SD) or progressive disease (PD). Progression-free survival (PFS) was calculated from the start date of the first treatment cycle to the time of first documentation of PD or until death by any cause. Overall survival (OS) was defined as the time from diagnosis to the date of death by any cause.
2.2. Sample Collection
Peripheral venous blood samples (for measuring serum levels of VEGF-A, VEGF-B, sPD-1 and sPD-L1) were collected from patients at the following time points: a) at baseline/before treatment (at the first day of the first cycle of immunotherapy treatment, before administering the therapeutic agent) and b) after treatment (at the time of treatment response evaluation). All samples were allowed to coagulate at room temperature for 30 minutes. Serum was separated by centrifugation at 2000 g for 10 minutes and stored at -20°C until used for the ELISA measurements.
The levels of all biomarkers evaluated (pretreatment and posttreatment levels and the change between the two measurements) were correlated with standard clinicopathological features of patients, including age, sex, smoking history, disease stage, ECOG PS at diagnosis, histological type of tumor, immunohistochemical expression of PD-L1 in the primary tumor, type of treatment (monotherapy vs. combo), treatment-related toxicity(irAEs), treatment response, progression-free survival (PFS) and overall survival (OS).
2.3. ELISA Measurements
sPD-1, sPD-L1, VEGF-A and VEGF-B serum levels were measured in all samples in duplicate using a quantitative sandwich enzyme immunoassay technique.
More specifically, sPD-1 was measured using the Human PD-1 sandwich ELISA Kit (ProteintechR KE00075) with intra-assay and inter-assay coefficients of variation (CV) less than 3.7% and 5.8%, respectively. The assay detection range was 125 pg/ml-8000 pg/ml. The minimum detectable dose of human PD1 is 43.0pg/ml.
sPD-L1 was measured using the Human PD-L1 sandwich ELISA Kit (ProteintechR KE00074) with intra-assay and inter-assay coefficients of variation (CV) less than 7.8% and 7.0%, respectively. The assay detection range was 0.156 ng/ml-10 ng/ml. The minimum detectable dose of human PD1 is 0.04ng/ml.
VEGF-A was measured using the Human VEGF-A ELISA Kit (InVitrogen BMS277-2) with minimum intra-assay and inter-assay coefficients of variation (CV) less than 11.7% and 8.9%, respectively. Detection range was 15.6 ng/ml-1000 pg/ml. The limit of detection was 7.9pg/ml.
VEGF-B was measured using the Human VEGF-B ELISA Kit (InVitrogen EH481RB) with intra-assay and inter-assay coefficients of variation (CV) less than 10% and CV%<12%, respectively. Detection range was 0.41 ng/ml-100 ng/ml. The minimum detectable dose of human VEGF-B was 0.4ng/ml.
2.4. Statistical Analysis
Quantitative variables were expressed as mean (Standard Deviation) or as median (interquartile range). Categorical variables were expressed as absolute and relative frequencies. For the comparison of proportions chi-square and Fisher’s exact tests were used. Independent samples of Student’s t-tests were used for the comparison of age between patients and healthy participants. Wilcoxon signed rank-test was used for the comparison of pre- and post- treatment biomarker values, while Spearman correlation coefficient (rho) was used to measure the strength of correlation between two quantitative variables. ROC curves (Receiver operating characteristic curves) were used in order to estimate the diagnostic ability of biomarkers. Sensitivity, specificity, negative and positive prognostic value were calculated for determination of the optimal cut-offs. The area under the curve (AUC) was also calculated. The prognostic value of each biomarker was first assessed by univariate Cox regression analysis. Variables that showed significant association with the outcome were included in the multivariate Cox proportional-hazard model in a stepwise method in order to determine the independent predictors for survival. The assumption of proportional hazards was evaluated by testing for interaction with a continuous time variable. Hazard ratios (HR) with 95% confidence intervals (95% CI) were computed from the Cox regression analyses. Kaplan – Meier survival estimates for survival were graphed over the follow-up period. All reported p values are two-tailed. Statistical significance was set at p<0.05 and analyses were conducted using SPSS statistical software (version 26.0).
3. Results
3.1. Clinicopathological Features of Patients
The clinicopathological characteristics of all study participants (55 patients and 16 healthy controls) are presented in Table 1. Mean age of patients and controls was 66.5 years (SD=8.0 years) and 65.4 years (SD=9.1 years), respectively. Also, the majority of both patients and healthy participants were males (69.1% and 56.3% respectively). Patients and controls had similar age (p=0.650) and gender (p=0.339) distribution.
Histological type of tumor was adenocarcinoma in 35 cases (35/55, 63.6%), squamous cell carcinoma in 18 cases (18/55, 32.7%), adenosquamous carcinoma in 1 case (1/55, 1.8%) and NOS in 1 case as well (1/55, 1.8%). Most patients (51/55, 92,7%) had disease stage IV, ECOG PS 1 (34/55. 61,8%), and received first-line treatment (44/55, 84,6%). Pembrolizumab and chemotherapy combination was administered in 36/55 cases (65,5%) while the remaining patients (19/55, 34.5%) received pembrolizumab monotherapy. Disease progression was observed in 35.2% (19/55) and treatment-related toxicity (irAEs) in 40.0% (22/55) of patients.
3.2. Levels of Biomarkers and Their Diagnostic Accuracy
Pre- and post-treatment levels of the examined biomarkers are summarized in Table 2. Significant changes (between pre- and post-treatment values) were found only in VEGFB (p=0,028) and sPD-1 (p<0,001). More specifically, VEGFB decreased significantly after treatment, while sPD-1 increased significantly.
The diagnostic ability of the biomarkers evaluated was examined via ROC analysis (Table 3).
The optimal cut-off for VEGFB was ≤10.94 pg/ml, with a sensitivity of 83.7% and specificity of 87.5%. Also, 83.7% (n=41) of the patients had VEGFB≤10.94, while the corresponding percentage for controls was 12.5% (n=2) (p<0.001). The optimal cut-off for sPD-1 was ≤34.54 pg/ml, with a sensitivity of 80.4% and a specificity of 62.5%. Also, 80.4% (n=41) of patients had sPD-1≤34.54, while the corresponding percentage for controls was 37.5% (n=6) (p=0.003).
3.3. Associations Between Biomarkers and Clinicopathological Features
Higher posttreatment VEGFA και sPD-L1 levels were associated with 2nd or 3rd line therapy. Higher posttreatment sPD-L1 levels were also correlated with the administration of pembrolizumab monotherapy.
Spearman's correlation analysis showed a significant correlation between the following variables: a) higher pack-years and greater change of sPD-L1, b) higher tumor PD-L1 (TPS) and higher post-treatment sPD-L1 και sPD-1 c)higher tumor PD-L1 and greater change of sPD-1. Spearman’s correlation analysis also revealed various correlations between the study biomarkers (presented in Table 4).
3.3. Correlation with Treatment Response and Survival Analysis
Mean time to disease progression was 26,9 months (SE=2,5 months). Only irAEs were found to significantly correlate with treatment response, both in univariate and in multivariate analysis; more specifically, patients who developed IrAEs had a reduction of hazard for disease progression by 87%, as compared to patients with no toxicity (HR=0.13; p=0.006).
During follow-up, 38.2% of patients (n=21) died and mean survival time was 41.2 months (SE=4.3 months) (Figure 2).
Univariate Cox regression analysis showed that higher pre-treatment values of sPD-L1 (HR=1.68; p=0.040) and sPD-1 (HR=10.96; p=0.037) were significantly associated with greater hazard (Table 5).
Similarly, higher post-treatment values of VEGF-B (HR=2.99; p=0.049) were significantly associated with greater hazard. Multivariate Cox regression analysis results are presented in Table 6.
Higher pre-treatment values of sPD-L1 (HR=2.10; p=0.014) and higher post-treatment values of VEGFB (HR=3.37; p=0.032) were significantly associated with greater hazard.
4. Discussion
In the present study, higher serum levels of pretreatment sPD-L1 and posttreatment VEGF-B were found to independently predict a worse OS in ICI-treated advanced stage NSCLC. The remaining biomarkers evaluated, i.e. VEGF-A and sPD-1, failed to show any statistically significant correlation with prognosis, while none of the blood-based biomarkers included in our panel was found to be significantly associated with treatment response. An independent predictive value was revealed for ICI-related toxicity only, among all parameters studied, thus confirming its well-established role as a clinical predictor of response to ICI in this setting [22].
Given the intrinsic limitations of tissue biomarkers, such as PD-L1 TPS, especially for the purpose of longitudinal real-time monitoring of patients with advanced NSCLC, there is an ongoing quest for the identification of blood-based predictors, enabling repeat evaluations throughout the disease and treatment course, without the need for invasive sampling methods. Both PD-1 and PD-L1 checkpoint molecules can be detected not only on tissue samples (as membrane-bound PD-1 and PD-L1), but in the peripheral blood as well, in the form of soluble proteins (sPD-1 and sPD-L1), thus enabling convenient monitoring of their levels at any time point needed. Most previous studies investigating baseline sPD-L1 in ICI-treated NSCLC seem to generally concur that it may represent a useful prognostic and predictive biomarker in this setting. A recent meta-analysis concluded that high sPD-L1 may predict a worse OS and PFS in lung cancer patients treated with ICIs [23], confirming the results of three previous meta-analyses [24,25,26], and in agreement with the results presented herein.
Previous data on the clinical relevance of sPD-1 in ICI-treated NSCLC are much more limited (as compared to PD-L1) but seem to largely concur that higher posttreatment sPD-1 levels may represent a marker of an improved survival. As reported by Himuro et al [27], increased sPD-L1 levels at baseline were significantly correlated with worse PFS and OS in NSCLC patients receiving ICI monotherapy but not in those receiving ICIs-chemotherapy combination, while higher posttreatment sPD-1 and PD-L1 levels were predictive of an improved and worse OS, respectively, suggesting, as emphasized by the authors, that both pretreatment sPD-L1 as well as posttreatment sPD-1 and sPD-L1 may represent useful prognostic biomarkers in this setting. In another study, posttreatment sPD-1 levels were again correlated with improved OS in the ICI monotherapy subgroup of NSCLC patients [28]. Interestingly, Ohkuma et al [29] suggested a potential involvement of sPD-1 in primary resistance to anti-PD-1 ICIs in patients with various solid tumors including NSCLC, and that early changes of this marker during the course of treatment may help identify patients least likely to respond. Furthermore, a composite sPD-L1/sPD-1 biomarker for the prediction of ICI efficacy has also been proposed, based on the observed independent correlation of baseline positivity for both markers with a worse PFS [30]. In our study we failed to demonstrate any correlation between sPD-1 levels and treatment response or survival, but this may be due to inclusion of patients receiving both ICI monotherapy and ICI-chemotherapy combination.
Despite the well-established interplay between angiogenesis and immune cell factors in the tumor microenvironment [16,17,18], exerting a critical role in the progression of NSCLC and its response to immunotherapy, research on the potential prognostic and predictive significance of peripheral blood levels of angiogenesis markers in ICI-treated NSCLC, especially with regard to VEGF-B, is sparse. In a previous study combining preclinical and clinical research, VEGF-B was shown to promote metastasis in human and mouse tumor models through remodeling of tumor microvasculature, in a process seemingly independent of VEGF-A (also known as VEGF), and despite parallel suppression of primary tumor growth; furthermore, high VEGF-B tumor tissue expression was shown to correlate with worse survival in two separate cohorts of patients with squamous cell lung cancer and melanoma, respectively, suggesting, that VEGF-B may adversely impact prognosis [31]. On the other hand, decreased tissue expression of VEGF-B (along with increased VEGF-A expression) were correlated with worse time to progression (TTP) and OS in resectable NSCLC in another study [32]. Increased levels of posttreatment VEGF-B were shown to independently correlate with reduced OS in our study, thus suggesting that VEGF-B may represent an adverse prognostic indicator in ICI-treated NSCLC. To the best of our knowledge, there is no previous study evaluating the prognostic and predictive significance of serum VEGF-B levels in this setting. Therefore, additional investigations of this candidate biomarker are warranted to further support our preliminary observations.
Previous studies on the potential prognostic and predictive relevance of VEGF-A levels in the peripheral blood of patients with ICI-treated NSCLC are limited. Continuous decrease in plasma VEGF-A levels, from baseline to day 14 of treatment, was previously correlated with prolonged PFS in patients with advanced NSCLC receiving chemotherapy-ICI combination therapy, suggesting the potential predictive value of this marker [33]. In another study, lower baseline sPD-L1 and higher post-treatment VEGF levels were both independently associated with increased and reduced PFS, respectively, in NSCLC patients treated with PD-L1 inhibitors combined with anti-angiogenetic therapy [34]. Hu et al [35] reported that increased VEGF levels at baseline was correlated with worse PFS in advanced non-small cell lung cancer treated with ICI, while Shibaki et al [36] similarly observed a worse overall response rate to anti-PD-1 antibody treatment among fragile patients with advanced NSCLC and higher serum VEGF levels, thus reinforcing the hypothesis that increased VEGF levels may be predictive of reduced efficacy to these agents.
Although not our primary aim, in the present study we also found a potential value of VEGF-B and sPD-1 as diagnostic biomarkers. More specifically, VEGF-B and sPD-1 levels were both found to be significantly decreased in NSCLC patients as compared to healthy sex- and age-matched controls and to be able to discriminate between patients and controls with an optimal cut-off of 10.94 pg/ml and 34.54 pg/ml, respectively. These findings seem to be in contrast to some previous studies reporting increased sPD-1 levels in the serum or plasma of patients with advanced NSCLC as compared to healthy controls [37,38]. Peng et al [37] investigated the clinical significance of sPD-1 and other soluble immune checkpoint markers including sTIM-3, sCD137, sCD27, sLAG-3, sIDO, sPD-L2, sCD152 and sCD8 in NSCLC, and reported increased serum levels of all examined biomarkers (including sPD-1) in patients with advanced-stage disease versus controls; nevertheless, sPD-1 was the only marker that failed to confirm its diagnostic value in subsequent ROC analysis while a higher diagnostic accuracy was reached when a combined detection assay of sTIM-3, sLAG-3 and sCD137 was performed [37]. On the other hand, our own current findings of decreased sPD-1 levels in advanced NSCLC as compared to controls concur with those recently reported by Gu et al [39]. In the latter study, sPD-1 serum levels were found to be significantly reduced in NSCLC, and the authors hypothesized that this striking observation of a reduction instead of an increase of sPD-1 levels might be due to either reduced production of sPD-1 or to increased expression of its ligand PD-L1; increased expression of sPD-L1 may, conceivably, lead to reduction of the detectable sPD-1 levels due to binding of sPD-L1 with sPD-1 in the peripheral circulation [39].
Although strengthened by the prospective design of our study and the evaluation of all clinical aspects (diagnostic, prognostic and predictive) of the examined biomarkers, our results need to be evaluated in the context of some limitations as well. First, our patient population sample was relatively small, limiting the statistical power of our analysis and the ability to perform stratified analyses in specific subgroups, such as the pembrolizumab monotherapy group. To minimize the latter limitation, the type of ICI treatment (pembrolizumab monotherapy vs combo) was included as a variable in our study and found to be correlated with higher posttreatment sPD-L1 levels only, while failing to show a significant association with any other parameter, including of course prognosis and treatment response. An additional limitation of our study is the fact that patients receiving second-line treatment and beyond were also included, albeit as a minority subgroup (15.4%), thus reducing the homogeneity of our population but also better reflecting the characteristics of a real-world cohort. Finally, it must also be emphasized that our findings warrant additional confirmation in a validation cohort.
5. Conclusions
Our study results revealed an independent prognostic significance of pretreatment sPD-L1, thus confirming previous reports, but also highlighted serum VEGF-B, a biomarker relatively understudied as of yet, as a novel predictor of prognosis in ICI-treated advanced NSCLC. Undoubtedly, additional studies are needed to delineate the exact role of these candidate biomarkers, particularly VEGF-B, in treatment response and overall prognosis of patients. Optimization of ICI-based treatment planning in advanced NSCLC will, most likely, require designation of a combination of markers instead of a single one, following their robust validation in large prospective series.
Author Contributions
Conceptualization, D.G. and E.K.; methodology, E.K, A.P and P.M.; validation, E.K., S.G. and A.P.; formal analysis, D.G.; investigation, E.K and S.G.; resources, A.P.; data curation, E.K., A.P. and S.G; writing—original draft preparation, D.G.; writing—review and editing, E.K.; visualization, E.K; supervision, K.S.; project administration, K.S., P.B and G.P.
Funding
This research received no external funding.
Institutional Review Board Statement
The study was conducted in accordance with the Declaration of Helsinki and approved by the Ethics Committee of Sotiria Thoracic Diseases Hospital, Athens Greece (protocol code 25244 and date of approval 25-10-19).
Informed Consent Statement
Informed consent was obtained from all subjects involved in the study.
Data Availability Statement
The original contributions presented in the study are included in the article.
Conflicts of Interest
The authors declare no conflicts of interest.
References
- Mogavero, A.; Cantale, O.; Mollica, V.; Anpalakhan, S.; Addeo, A.; Mountzios, G.; Friedlaender, A.; Kanesvaran, R.; Novello, S.; Banna, G.L. First-line immunotherapy in non-small cell lung cancer: how to select and where to go. Expert Rev Respir Med. 2023, 17, 1191–1206. [Google Scholar] [CrossRef] [PubMed]
- Reck, M.; Rodríguez-Abreu, D.; Robinson, A.G.; Hui, R.; Csőszi, T.; Fülöp, A.; Gottfried, M.; Peled, N.; Tafreshi, A.; Cuffe, S.; O'Brien, M.; Rao, S.; Hotta, K.; Vandormael, K.; Riccio, A.; Yang, J.; Pietanza, M.C.; Brahmer, J.R. Updated Analysis of KEYNOTE-024: Pembrolizumab Versus Platinum-Based Chemotherapy for Advanced Non-Small-Cell Lung Cancer With PD-L1 Tumor Proportion Score of 50% or Greater. J Clin Oncol. 2019, 37, 537–546. [Google Scholar] [CrossRef] [PubMed]
- Reck, M.; Rodríguez-Abreu, D.; Robinson, A.G.; Hui, R.; Csőszi, T.; Fülöp, A.; Gottfried, M.; Peled, N.; Tafreshi, A.; Cuffe, S.; O'Brien, M.; Rao, S.; Hotta, K.; Leal, T.A.; Riess, J.W.; Jensen, E.; Zhao, B.; Pietanza, M.C.; Brahmer, J.R. Five-Year Outcomes With Pembrolizumab Versus Chemotherapy for Metastatic Non-Small-Cell Lung Cancer With PD-L1 Tumor Proportion Score ≥ 50. J Clin Oncol. 2021, 39, 2339–2349. [Google Scholar] [CrossRef] [PubMed] [PubMed Central]
- Herbst, R.S.; Giaccone, G.; de Marinis, F.; Reinmuth, N.; Vergnenegre, A.; Barrios, C.H.; Morise, M.; Felip, E.; Andric, Z.; Geater, S.; Özgüroğlu, M.; Zou, W.; Sandler, A.; Enquist, I.; Komatsubara, K.; Deng, Y.; Kuriki, H.; Wen, X.; McCleland, M.; Mocci, S.; Jassem, J.; Spigel, D.R. Atezolizumab for First-Line Treatment of PD-L1-Selected Patients with NSCLC. N Engl J Med. 2020, 383, 1328–1339. [Google Scholar] [CrossRef] [PubMed]
- Sezer, A.; Kilickap, S.; Gümüş, M.; Bondarenko, I.; Özgüroğlu, M.; Gogishvili, M.; Turk, H.M.; Cicin, I.; Bentsion, D.; Gladkov, O.; Clingan, P.; Sriuranpong, V.; Rizvi, N.; Gao, B.; Li, S.; Lee, S.; McGuire, K.; Chen, C.I.; Makharadze, T.; Paydas, S.; Nechaeva, M.; Seebach, F.; Weinreich, D.M.; Yancopoulos, G.D.; Gullo, G.; Lowy, I.; Rietschel, P. Cemiplimab monotherapy for first-line treatment of advanced non-small-cell lung cancer with PD-L1 of at least 50%: a multicentre, open-label, global, phase 3, randomised, controlled trial. Lancet. 2021, 397, 592–604. [Google Scholar] [CrossRef] [PubMed]
- Macioch, T.; Krzakowski, M.; Gołębiewska, K.; Dobek, M.; Warchałowska, N.; Niewada, M. Pembrolizumab monotherapy survival benefits in metastatic non-small-cell lung cancer: a systematic review of real-world data. Discov Oncol. 2024, 15, 303. [Google Scholar] [CrossRef] [PubMed] [PubMed Central]
- Wagenius, G.; Vikström, A.; Berglund, A.; Salomonsson, S.; Bencina, G.; Hu, X.; Chirovsky, D.; Brunnström, H. First-line Treatment Patterns and Outcomes in Advanced Non-Small Cell Lung Cancer in Sweden: A Population-based Real-world Study with Focus on Immunotherapy. Acta Oncol. 2024, 63, 198–205. [Google Scholar] [CrossRef] [PubMed] [PubMed Central]
- Amrane, K.; Geier, M.; Corre, R.; Léna, H.; Léveiller, G.; Gadby, F.; Lamy, R.; Bizec, J.L.; Goarant, E.; Robinet, G.; Gouva, S.; Quere, G.; Abgral, R.; Schick, U.; Bernier, C.; Chouaid, C.; Descourt, R. First-line pembrolizumab for non-small cell lung cancer patients with PD-L1 ≥50% in a multicenter real-life cohort: The PEMBREIZH study. Cancer Med. 2020, 9, 2309–2316. [Google Scholar] [CrossRef] [PubMed] [PubMed Central]
- Cortellini, A.; Cannita, K.; Tiseo, M.; Cortinovis, D.L.; Aerts, J.G.J.V.; Baldessari, C.; Giusti, R.; Ferrara, M.G.; D'Argento, E.; Grossi, F.; Guida, A.; Berardi, R.; Morabito, A.; Genova, C.; Antonuzzo, L.; Mazzoni, F.; De Toma, A.; Signorelli, D.; Gelibter, A.; Targato, G.; Rastelli, F.; Chiari, R.; Rocco, D.; Gori, S.; De Tursi, M.; Mansueto, G.; Zoratto, F.; Filetti, M.; Bracarda, S.; Citarella, F.; Russano, M.; Cantini, L.; Nigro, O.; Buti, S.; Minuti, G.; Landi, L.; Ricciardi, S.; Migliorino, M.R.; Natalizio, S.; Simona, C.; De Filippis, M.; Metro, G.; Adamo, V.; Russo, A.; Spinelli, G.P.; Di Maio, M.; Banna, G.L.; Friedlaender, A.; Addeo, A.; Pinato, D.J.; Ficorella, C.; Porzio, G. Post-progression outcomes of NSCLC patients with PD-L1 expression ≥ 50% receiving first-line single-agent pembrolizumab in a large multicentre real-world study. Eur J Cancer. 2021, 148, 24–35. [Google Scholar] [CrossRef] [PubMed]
- Lin, X.; Xie, M.; Yao, J.; Ma, X.; Qin, L.; Zhang, X.M.; Song, J.; Bao, X.; Zhang, X.; Zhang, Y.; Liu, Y.; Han, W.; Liang, Y.; Jing, Y.; Xue, X. Immune-related adverse events in non-small cell lung cancer: Occurrence, mechanisms and therapeutic strategies. Clin Transl Med. 2024, 14, e1613. [Google Scholar] [CrossRef] [PubMed] [PubMed Central]
- Spagnolo, C.C.; Pepe, F.; Ciappina, G.; Nucera, F.; Ruggeri, P.; Squeri, A.; Speranza, D.; Silvestris, N.; Malapelle, U.; Santarpia, M. Circulating biomarkers as predictors of response to immune checkpoint inhibitors in NSCLC: Are we on the right path? Crit Rev Oncol Hematol. 2024, 197, 104332. [Google Scholar] [CrossRef] [PubMed]
- Frisone, D.; Friedlaender, A.; Addeo, A.; Tsantoulis, P. The Landscape of Immunotherapy Resistance in NSCLC. Front Oncol. 2022, 12, 817548, Erratum in: Front Oncol. 2023 Apr 04;13:1187021. doi: 10.3389/fonc.2023.1187021. [Google Scholar] [CrossRef] [PubMed] [PubMed Central]
- Qi, C.; Li, Y.; Zeng, H.; Wei, Q.; Tan, S.; Zhang, Y.; Li, W.; Tian, P. Current status and progress of PD-L1 detection: guiding immunotherapy for non-small cell lung cancer. Clin Exp Med. 2024, 24, 162. [Google Scholar] [CrossRef] [PubMed] [PubMed Central]
- So, W.V.; Dejardin, D.; Rossmann, E.; Charo, J. Predictive biomarkers for PD-1/PD-L1 checkpoint inhibitor response in NSCLC: an analysis of clinical trial and real-world data. J Immunother Cancer. 2023, 11, e006464. [Google Scholar] [CrossRef] [PubMed] [PubMed Central]
- Rosca, O.C.; Vele, O.E. Microsatellite Instability, Mismatch Repair, and Tumor Mutation Burden in Lung Cancer. Surg Pathol Clin. 2024, 17, 295–305. [Google Scholar] [CrossRef] [PubMed]
- Rahma, O.E.; Hodi, F.S. The Intersection between Tumor Angiogenesis and Immune Suppression. Clin Cancer Res. 2019, 25, 5449–5457. [Google Scholar] [CrossRef] [PubMed]
- Huang, Y.; Kim, B.Y.S.; Chan, C.K.; Hahn, S.M.; Weissman, I.L.; Jiang, W. Improving immune-vascular crosstalk for cancer immunotherapy. Nat Rev Immunol. 2018, 18, 195–203. [Google Scholar] [CrossRef] [PubMed] [PubMed Central]
- Ma, K.; Guo, Q.; Li, X. Efficacy and safety of combined immunotherapy and antiangiogenic therapy for advanced non-small cell lung cancer: a real-world observation study. BMC Pulm Med. 2023, 23, 175. [Google Scholar] [CrossRef] [PubMed] [PubMed Central]
- Fang, L.; Zhao, W.; Ye, B.; Chen, D. Combination of Immune Checkpoint Inhibitors and Anti-Angiogenic Agents in Brain Metastases From Non-Small Cell Lung Cancer. Front Oncol. 2021, 11, 670313. [Google Scholar] [CrossRef] [PubMed] [PubMed Central]
- He, D.; Wang, L.; Xu, J.; Zhao, J.; Bai, H.; Wang, J. Research advances in mechanism of antiangiogenic therapy combined with immune checkpoint inhibitors for treatment of non-small cell lung cancer. Front Immunol. 2023, 14, 1265865. [Google Scholar] [CrossRef] [PubMed] [PubMed Central]
- Goldstraw, P.; Chansky, K.; Crowley, J.; Rami-Porta, R.; Asamura, H.; Eberhardt, W.E.; Nicholson, A.G.; Groome, P.; Mitchell, A.; Bolejack, V.; International Association for the Study of Lung Cancer Staging and Prognostic Factors Committee, Advisory Boards, and Participating Institutions; International Association for the Study of Lung Cancer Staging and Prognostic Factors Committee Advisory Boards and Participating Institutions. The IASLC Lung Cancer Staging Project: Proposals for Revision of the TNM Stage Groupings in the Forthcoming (Eighth) Edition of the TNM Classification for Lung Cancer. J Thorac Oncol. 2016, 11, 39–51. [Google Scholar] [CrossRef] [PubMed]
- Grangeon, M.; Tomasini, P.; Chaleat, S.; Jeanson, A.; Souquet-Bressand, M.; Khobta, N.; Bermudez, J.; Trigui, Y.; Greillier, L.; Blanchon, M.; Boucekine, M.; Mascaux, C.; Barlesi, F. Association Between Immune-related Adverse Events and Efficacy of Immune Checkpoint Inhibitors in Non-small-cell Lung Cancer. Clin Lung Cancer. 2019, 20, 201–207. [Google Scholar] [CrossRef] [PubMed]
- Zhang, N.; Chang, J.; Liu, P.; Tian, X.; Yu, J. Prognostic significance of programmed cell death ligand 1 blood markers in non-small cell lung cancer treated with immune checkpoint inhibitors: a systematic review and meta-analysis. Front Immunol. 2024, 15, 1400262. [Google Scholar] [CrossRef] [PubMed] [PubMed Central]
- Cheng, Y.; Wang, C.; Wang, Y.; Dai, L. Soluble PD-L1 as a predictive biomarker in lung cancer: a systematic review and meta-analysis. Future Oncol. 2022, 18, 261–273. [Google Scholar] [CrossRef] [PubMed]
- Wang, Y.; He, H. Prognostic value of soluble programmed cell death ligand-1 in patients with non-small-cell lung cancer: a meta-analysis. Immunotherapy. 2022, 14, 945–956. [Google Scholar] [CrossRef] [PubMed]
- Fazekas, T.; Váncsa, S.; Váradi, M.; Kovács, P.T.; Krafft, U.; Grünwald, V.; Hadaschik, B.; Csizmarik, A.; Hegyi, P.; Váradi, A.; Nyirády, P.; Szarvas, T. Pre-treatment soluble PD-L1 as a predictor of overall survival for immune checkpoint inhibitor therapy: a systematic review and meta-analysis. Cancer Immunol Immunother. 2023, 72, 1061–1073. [Google Scholar] [CrossRef] [PubMed] [PubMed Central]
- Himuro, H.; Nakahara, Y.; Igarashi, Y.; Kouro, T.; Higashijima, N.; Matsuo, N.; Murakami, S.; Wei, F.; Horaguchi, S.; Tsuji, K.; Mano, Y.; Saito, H.; Azuma, K.; Sasada, T. Clinical roles of soluble PD-1 and PD-L1 in plasma of NSCLC patients treated with immune checkpoint inhibitors. Cancer Immunol Immunother. 2023, 72, 2829–2840. [Google Scholar] [CrossRef] [PubMed] [PubMed Central]
- Bar, J.; Leibowitz, R.; Reinmuth, N.; Ammendola, A.; Jacob, E.; Moskovitz, M.; Levy-Barda, A.; Lotem, M.; Katsenelson, R.; Agbarya, A.; Abu-Amna, M.; Gottfried, M.; Harkovsky, T.; Wolf, I.; Tepper, E.; Loewenthal, G.; Yellin, B.; Brody, Y.; Dahan, N.; Yanko, M.; Lahav, C.; Harel, M.; Raveh Shoval, S.; Elon, Y.; Sela, I.; Dicker, A.P.; Shaked, Y. Biological insights from plasma proteomics of non-small cell lung cancer patients treated with immunotherapy. Front Immunol. 2024, 15, 1364473. [Google Scholar] [CrossRef] [PubMed] [PubMed Central]
- Ohkuma, R.; Ieguchi, K.; Watanabe, M.; Takayanagi, D.; Goshima, T.; Onoue, R.; Hamada, K.; Kubota, Y.; Horiike, A.; Ishiguro, T.; Hirasawa, Y.; Ariizumi, H.; Tsurutani, J.; Yoshimura, K.; Tsuji, M.; Kiuchi, Y.; Kobayashi, S.; Tsunoda, T.; Wada, S. Increased Plasma Soluble PD-1 Concentration Correlates with Disease Progression in Patients with Cancer Treated with Anti-PD-1 Antibodies. Biomedicines. 2021, 9, 1929. [Google Scholar] [CrossRef] [PubMed] [PubMed Central]
- Tiako Meyo, M.; Jouinot, A.; Giroux-Leprieur, E.; Fabre, E.; Wislez, M.; Alifano, M.; Leroy, K.; Boudou-Rouquette, P.; Tlemsani, C.; Khoudour, N.; Arrondeau, J.; Thomas-Schoemann, A.; Blons, H.; Mansuet-Lupo, A.; Damotte, D.; Vidal, M.; Goldwasser, F.; Alexandre, J.; Blanchet, B. Predictive Value of Soluble PD-1, PD-L1, VEGFA, CD40 Ligand and CD44 for Nivolumab Therapy in Advanced Non-Small Cell Lung Cancer: A Case-Control Study. Cancers (Basel). 2020, 12, 473. [Google Scholar] [CrossRef] [PubMed] [PubMed Central]
- Yang, X.; Zhang, Y.; Hosaka, K.; Andersson, P.; Wang, J.; Tholander, F.; Cao, Z.; Morikawa, H.; Tegnér, J.; Yang, Y.; Iwamoto, H.; Lim, S.; Cao, Y. VEGF-B promotes cancer metastasis through a VEGF-A-independent mechanism and serves as a marker of poor prognosis for cancer patients. Proc Natl Acad Sci U S A. 2015, 112, E2900-9. [Google Scholar] [CrossRef] [PubMed] [PubMed Central]
- Sanmartín, E.; Sirera, R.; Usó, M.; Blasco, A.; Gallach, S.; Figueroa, S.; Martínez, N.; Hernando, C.; Honguero, A.; Martorell, M.; Guijarro, R.; Rosell, R.; Jantus-Lewintre, E.; Camps, C. A gene signature combining the tissue expression of three angiogenic factors is a prognostic marker in early-stage non-small cell lung cancer. Ann Surg Oncol. 2014, 21, 612–620. [Google Scholar] [CrossRef] [PubMed]
- Tozuka, T.; Yanagitani, N.; Sakamoto, H.; Yoshida, H.; Amino, Y.; Uematsu, S.; Yoshizawa, T.; Hasegawa, T.; Ariyasu, R.; Uchibori, K.; Kitazono, S.; Seike, M.; Gemma, A.; Nishio, M. Association between continuous decrease of plasma VEGF-A levels and the efficacy of chemotherapy in combination with anti-programmed cell death 1 antibody in non-small cell lung cancer patients. Cancer Treat Res Commun. 2020, 25, 100249. [Google Scholar] [CrossRef] [PubMed]
- Dong, C.; Hui, K.; Gu, J.; Wang, M.; Hu, C.; Jiang, X. Plasma sPD-L1 and VEGF levels are associated with the prognosis of NSCLC patients treated with combination immunotherapy. Anticancer Drugs. 2024, 35, 418–425. [Google Scholar] [CrossRef] [PubMed]
- Hu, Y.; Li, S.; Xiao, H.; Xiong, Y.; Lu, X.; Yang, X.; Luo, W.; Luo, J.; Zhang, S.; Cheng, Y.; Zhang, L.; Dai, X.; Yang, Y.; Wang, D.; Li, M. Distinct circulating cytokine/chemokine profiles correlate with clinical benefit of immune checkpoint inhibitor monotherapy and combination therapy in advanced non-small cell lung cancer. Cancer Med. 2023, 12, 12234–12252. [Google Scholar] [CrossRef] [PubMed] [PubMed Central]
- Shibaki, R.; Murakami, S.; Shinno, Y.; Matsumoto, Y.; Yoshida, T.; Goto, Y.; Kanda, S.; Horinouchi, H.; Fujiwara, Y.; Yamamoto, N.; Yamamoto, N.; Ohe, Y. Predictive value of serum VEGF levels for elderly patients or for patients with poor performance status receiving anti-PD-1 antibody therapy for advanced non-small-cell lung cancer. Cancer Immunol Immunother. 2020, 69, 1229–1236. [Google Scholar] [CrossRef] [PubMed] [PubMed Central]
- Peng, Y.; Zhang, C.; Rui, Z.; Tang, W.; Xu, Y.; Tao, X.; Zhao, Q.; Tong, X. A comprehensive profiling of soluble immune checkpoints from the sera of patients with non-small cell lung cancer. J Clin Lab Anal. 2022, 36, e24224. [Google Scholar] [CrossRef] [PubMed] [PubMed Central]
- He, J.; Pan, Y.; Guo, Y.; Li, B.; Tang, Y. Study on the Expression Levels and Clinical Significance of PD-1 and PD-L1 in Plasma of NSCLC Patients. J Immunother. 2020, 43, 156–164. [Google Scholar] [CrossRef] [PubMed]
- Gu, Y.; Tang, Y.Y.; Wan, J.X.; Zou, J.Y.; Lu, C.G.; Zhu, H.S.; Sheng, S.Y.; Wang, Y.F.; Liu, H.C.; Yang, J.; Hong, H. Sex difference in the expression of PD-1 of non-small cell lung cancer. Front Immunol. 2022, 13, 1026214. [Google Scholar] [CrossRef] [PubMed] [PubMed Central]
Figure 1.
ROC curves for a) VEGF-B and b) sPD-1.
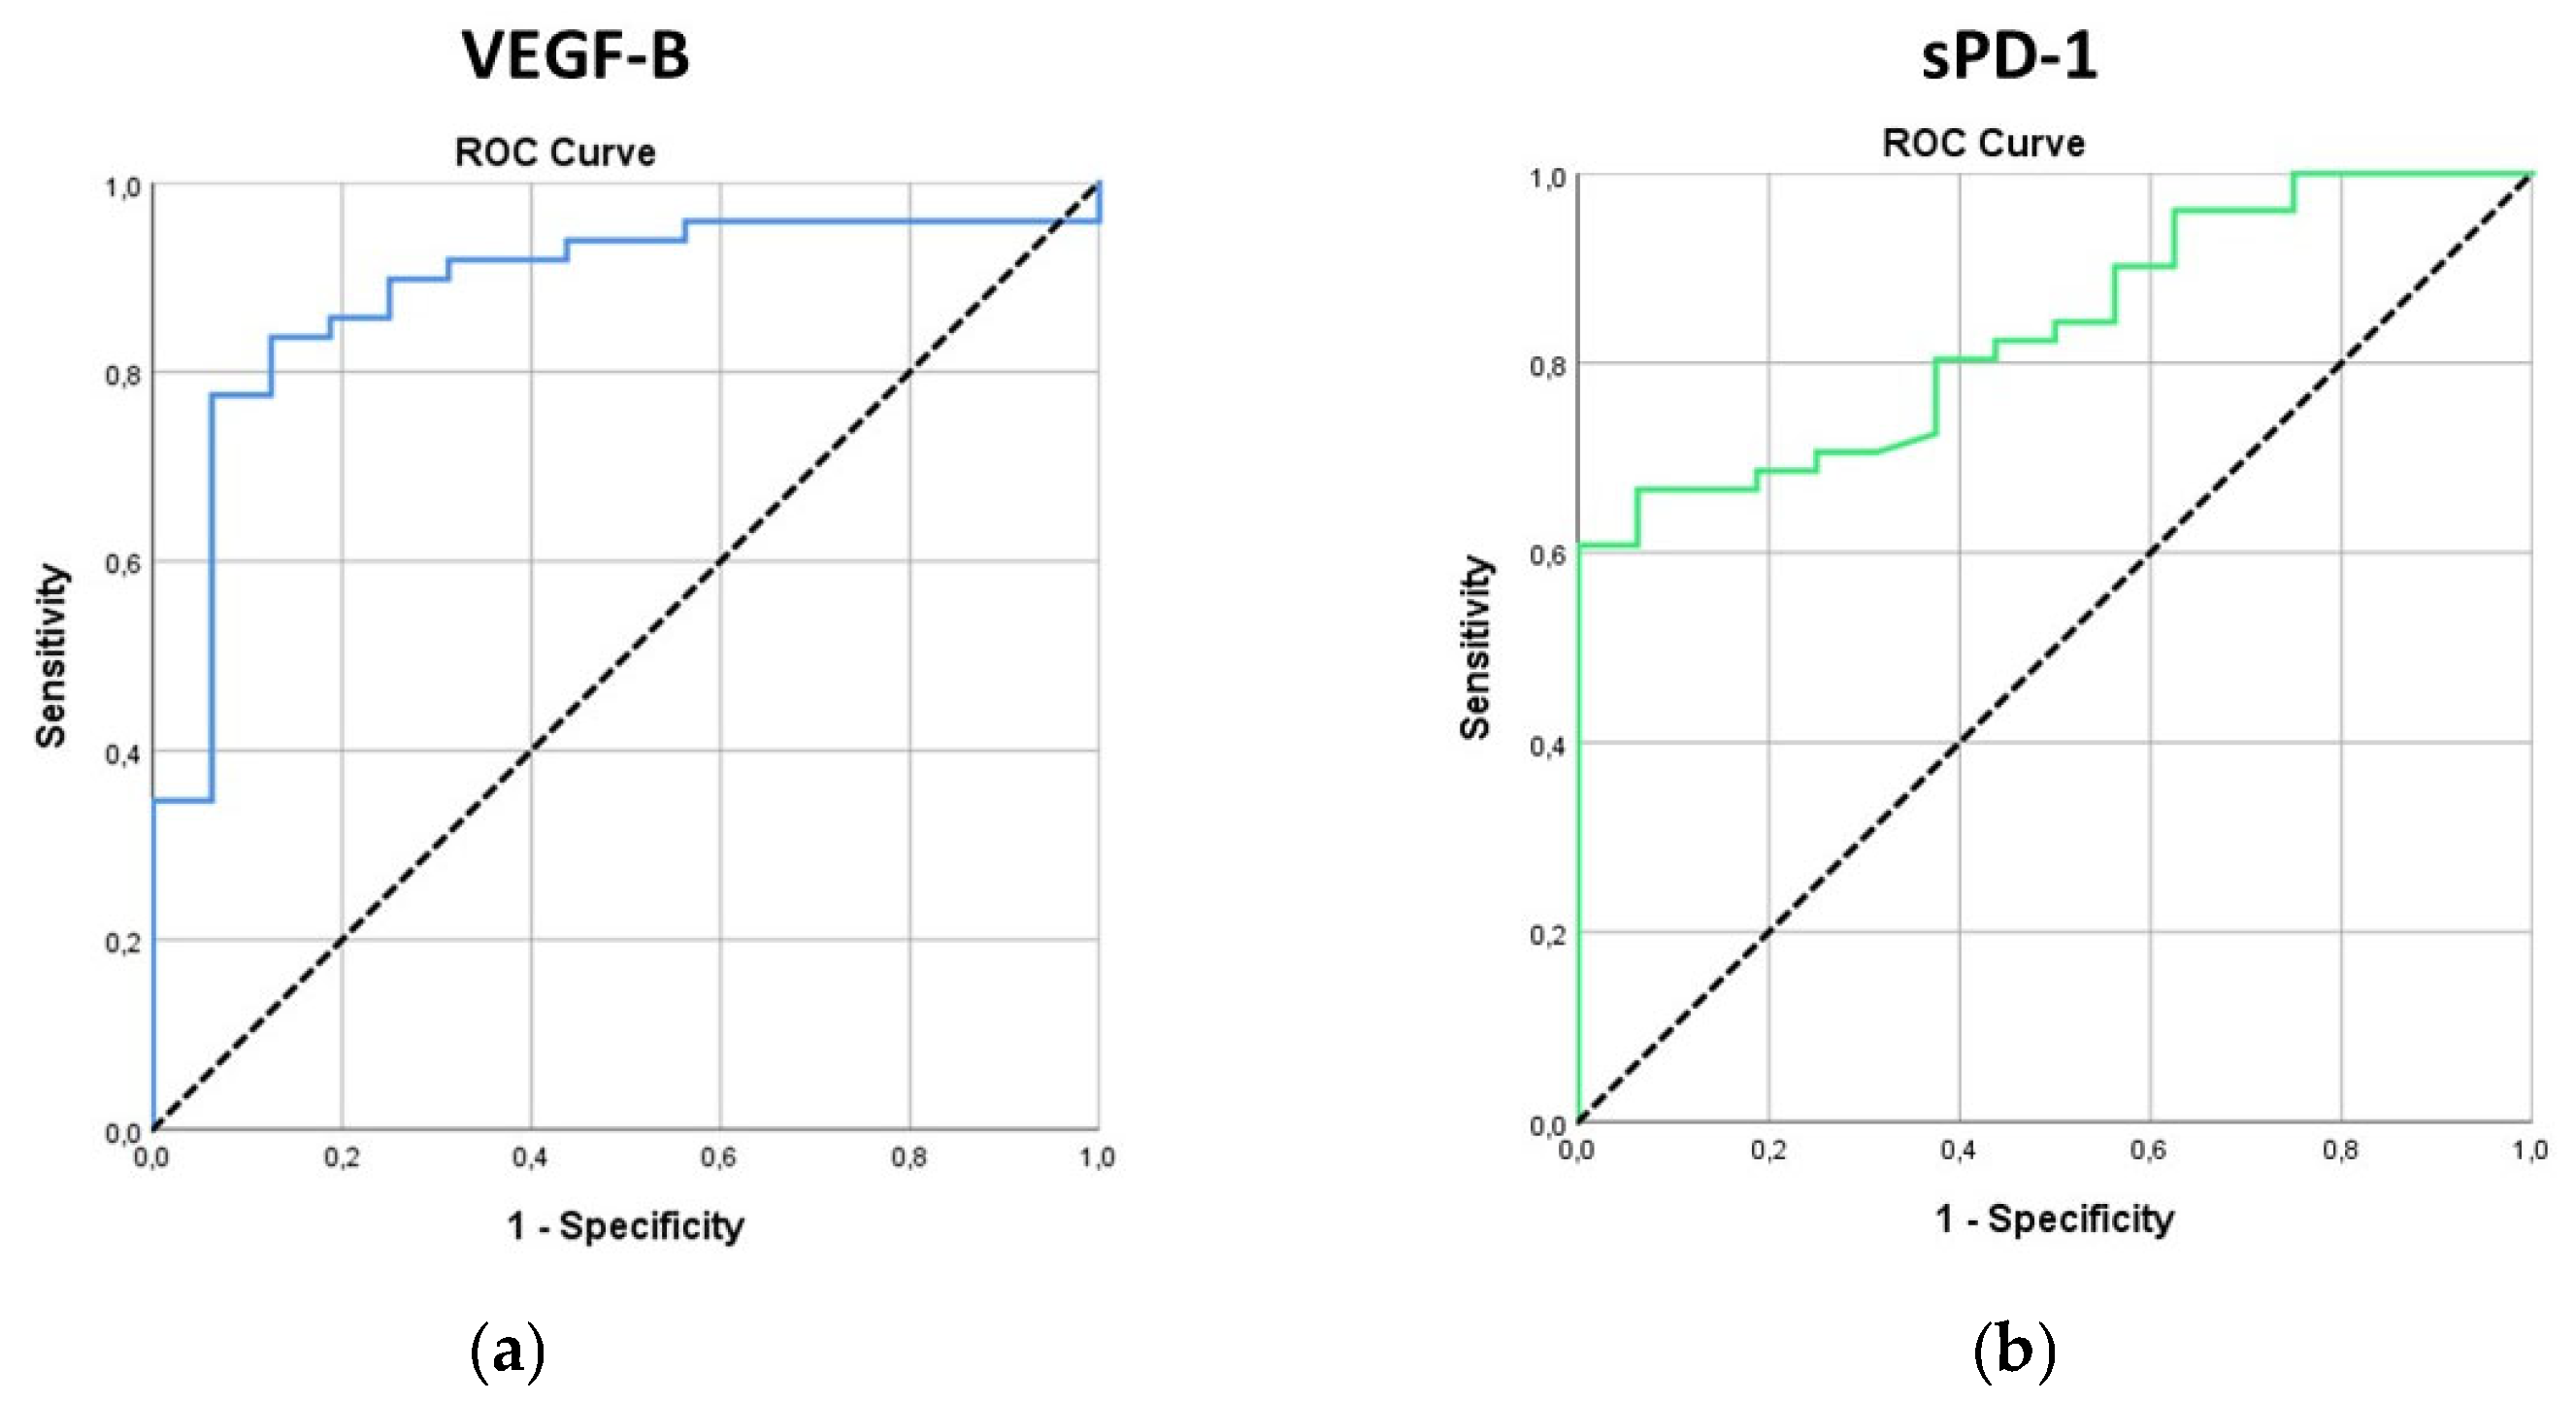
Figure 2.
Kaplan-Meier curve for survival of patients.
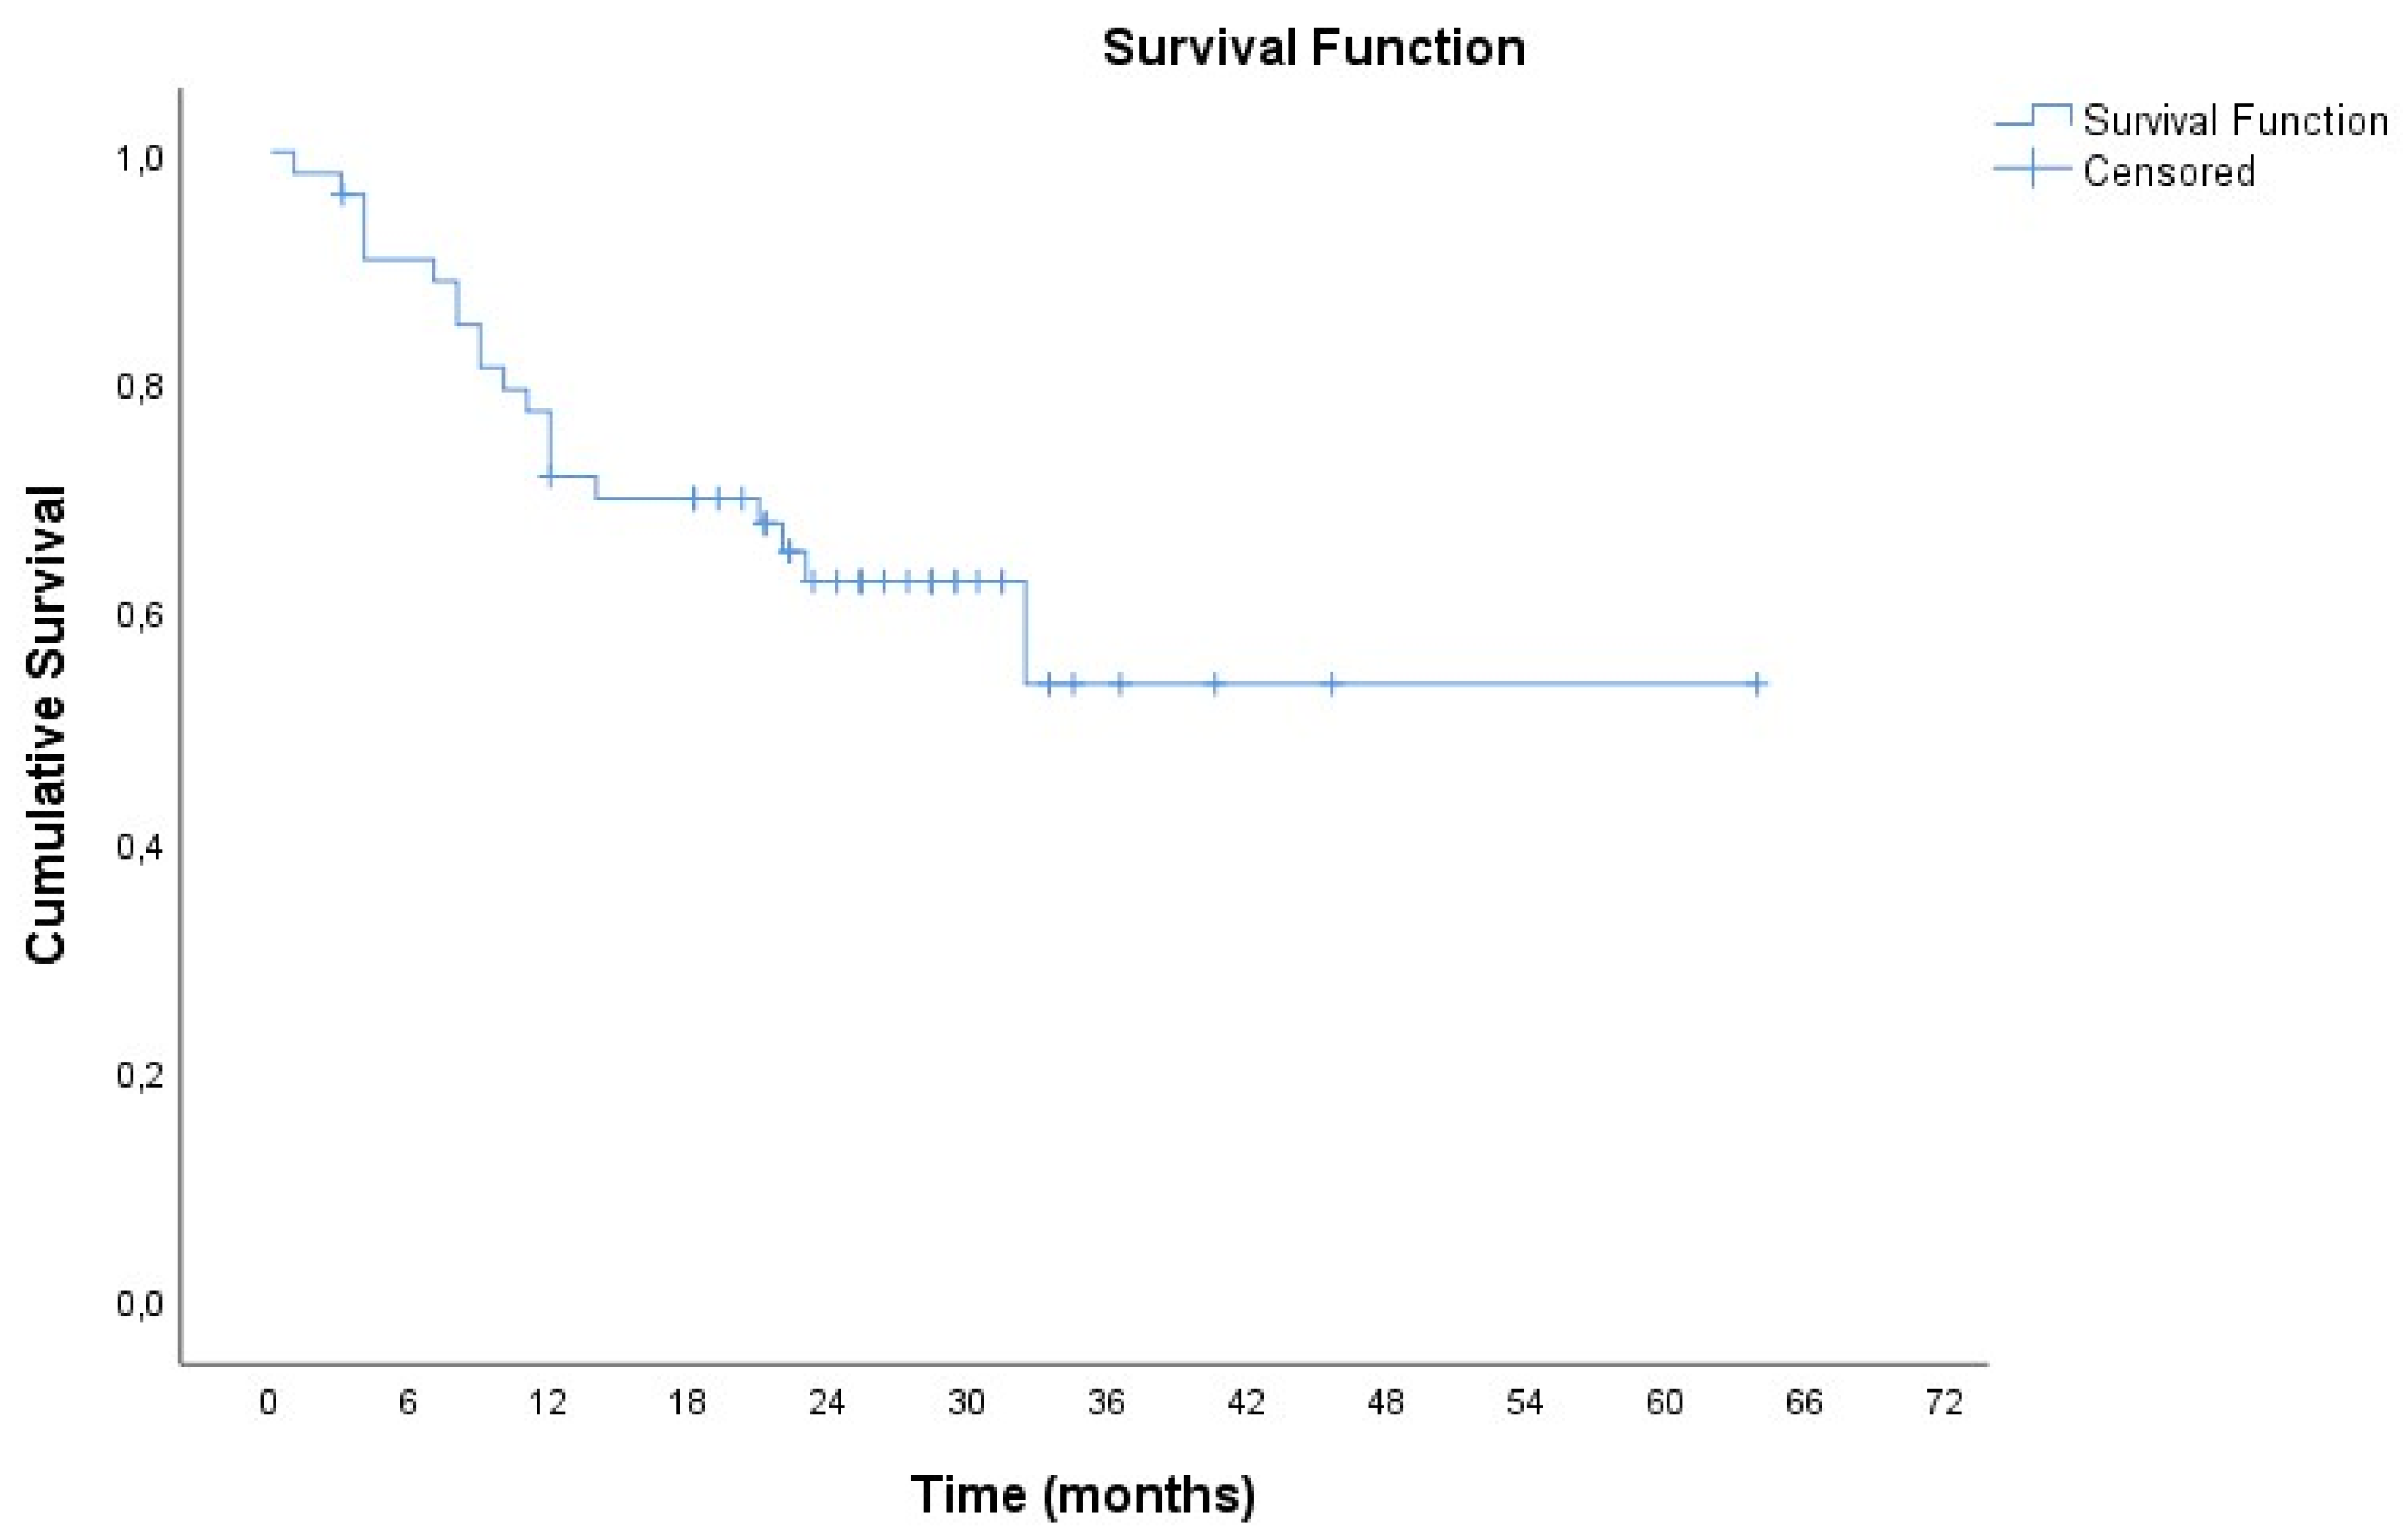

Table 1.
Demographics and clinicopathological features of patients and controls.
| n (%) | ||
|---|---|---|
| Patients (n=55) | ||
| Gender | ||
| Male | 38 (69.1) | |
| Female | 17 (30.9) | |
| Age (years), mean (SD) | 66.5 (8.0) | |
| Pack-Years, mean (SD) | 64.7 (27.6) | |
| ECOG Performance Status | ||
| 0 | 12 (21.8) | |
| 1 | 34 (61.8) | |
| 2 | 8 (14.5) | |
| 3 | 1 (1.8) | |
| Type of treatment | ||
| Pembrolizumab monotherapy | 19(34.5) | |
| Pembrolizumab + chemotherapy | 36(65.5) | |
| Treatment line | ||
| 1 | 44 (84.6) | |
| 2 | 7 (13.5) | |
| 3 | 1 (1.9) | |
| Disease Stage | ||
| ΙΙΙ | 4 (7.3) | |
| IV | 51 (92.7) | |
| Histological type of tumor | ||
| Adenocarcinoma | 35 (63.6) | |
| Squamous cell carcinoma | 18(32.7) | |
| Adenosquamous carcinoma | 1 (1.8) | |
| NOS | 1 (1.8) | |
| PD-L1, mean (SD) | 44.7 (36) | |
| Response to treatment | ||
| Partial response | 14 (25.9) | |
| Stable disease | 21 (38.9) | |
| Disease progression | 19 (35.2) | |
| Toxicity (irAEs) | 22 (40.0) | |
| Healthy controls (n=16) | ||
| Gender | ||
| Male | 9 (56.3) | |
| Female | 7 (43.8) | |
| Age (years), mean (SD) | 65.4 (9.1) | |
Table 2.
Pretreatment and posttreatment levels of the examined biomarkers.
| n | Mean (SD) | Median (IQR) | |
|---|---|---|---|
| Pre-treatment | |||
| VEGFA | 51 | 504.86 (311.46) | 433.05 (221.39 ─ 731.57) |
| VEGFB | 49 | 77.22 (474.79) | 4.97 (3.02 ─ 8.2) |
| sPD-L1 | 51 | 0.17 (0.09) | 0.16 (0.09 ─ 0.25) |
| sPD-1 | 51 | 18.17 (17.52) | 12.29 (3.75 ─ 29.17) |
| Post-treatment | |||
| VEGFA | 42 | 430.17 (286.33) | 321.19 (214.66 ─ 650.97) |
| VEGFB | 42 | 17.69 (31.66) | 6.44 (4.13 ─ 16.8) |
| sPD-L1 | 43 | 0.2 (0.11) | 0.16 (0.11 ─ 0.3) |
| sPD-1 | 42 | 56.22 (99.02) | 40.31 (22.92 ─ 52.68) |
| Change | |||
| VEGFA | 40 | -62.95 (218.99) | -19.26 (-148.18 ─ 94.36) |
| VEGFB | 38 | -78.62 (514.62) | 1.74 (-1.18 ─ 3.83) |
| sPD-L1 | 41 | 0.02 (0.13) | 0.01 (-0.06 ─ 0.09) |
| sPD-1 | 40 | 39.97 (102.04) | 19.06 (6.73 ─ 39.07) |
Table 3.
Levels of biomarkers in patients and controls and their diagnostic ability, via Roc analysis.
Table 3.
Levels of biomarkers in patients and controls and their diagnostic ability, via Roc analysis.
| Patients | Healthy sample | |||||||||||
|---|---|---|---|---|---|---|---|---|---|---|---|---|
| Mean (SD) | Median (IQR) | Mean (SD) | Median (IQR) | ROC | 95% CI | P | Optimal cut-off | Sensitivity (%) | Specificity (%) | PPV (%) | NPV (%) | |
| VEGFA | 504.86 (311.46) | 433.05 (221.39 ─ 731.57) | 410.46 (222.32) | 347.39 (256.17 ─ 552.22) | 0.58 | 0.44 - 0.72 | 0.339 | - | - | - | - | - |
| VEGFB | 77.22 (474.79) | 4.97 (3.02 ─ 8.2) | 53.39 (39.45) | 44.77 (16 ─ 100) | 0.88 | 0.79 - 0.98 | <0.001 | ≤10.94 | 83.7 | 87.5 | 95.3 | 63.6 |
| sPD-L1 | 0.17 (0.09) | 0.16 (0.09 ─ 0.25) | 0.19 (0.1) | 0.15 (0.12 ─ 0.21) | 0.47 | 0.32 - 0.62 | 0.702 | - | - | - | - | - |
| sPD-1 | 18.17 (17.52) | 12.29 (3.75 ─ 29.17) | 73.14 (119.28) | 39.09 (25.17 ─ 63.39) | 0.83 | 0.74 - 0.93 | <0.001 | ≤34.54 | 80.4 | 62.5 | 87.2 | 50 |
Table 4.
Spearman’s correlation analysis results for all studied biomarkers.
| Pretreatment | Posttreatment | Change | ||||||||||
|---|---|---|---|---|---|---|---|---|---|---|---|---|
| VEGFB | sPD-L1 | sPD-1 | VEGFA | VEGFB | sPD-L1 | sPD-1 | VEGFA | VEGFB | sPD-L1 | sPD-1 | ||
| Pretreatment | ||||||||||||
| VEGFA | rho | -0,04 | 0,19 | -0,16 | 0,76 | 0,16 | 0,48 | 0,23 | -0,37 | 0,31 | 0,25 | 0,35 |
| P | 0,780 | 0,192 | 0,256 | <0,001 | 0,330 | 0,002 | 0,160 | 0,019 | 0,061 | 0,109 | 0,025 | |
| VEGFB | rho | 1,00 | 0,26 | 0,09 | -0,04 | 0,45 | 0,17 | 0,00 | 0,08 | -0,26 | -0,04 | -0,05 |
| P | 0,074 | 0,540 | 0,814 | 0,005 | 0,298 | 0,999 | 0,628 | 0,118 | 0,786 | 0,743 | ||
| sPD-L1 | rho | 1,00 | 0,07 | 0,19 | 0,05 | 0,25 | -0,12 | -0,17 | -0,17 | -0,54 | -0,10 | |
| P | 0,622 | 0,234 | 0,747 | 0,109 | 0,477 | 0,308 | 0,316 | <0,001 | 0,545 | |||
| sPD-1 | rho | 1,00 | -0,36 | 0,38 | 0,18 | 0,32 | -0,33 | 0,29 | 0,10 | -0,34 | ||
| P | 0,022 | 0,014 | 0,262 | 0,041 | 0,040 | 0,081 | 0,522 | 0,031 | ||||
| Posttreatment | ||||||||||||
| VEGFA | rho | 1,00 | 0,03 | 0,29 | 0,01 | 0,23 | 0,14 | 0,22 | 0,28 | |||
| P | 0,851 | 0,067 | 0,974 | 0,155 | 0,393 | 0,172 | 0,085 | |||||
| VEGFB | rho | 1,00 | 0,26 | 0,30 | -0,10 | 0,55 | 0,19 | 0,08 | ||||
| P | 0,101 | 0,050 | 0,537 | <0,001 | 0,231 | 0,627 | ||||||
| sPD-L1 | rho | 1,00 | 0,43 | -0,25 | 0,11 | 0,62 | 0,35 | |||||
| P | 0,005 | 0,119 | 0,502 | <0,001 | 0,028 | |||||||
| sPD-1 | rho | 1,00 | -0,42 | 0,34 | 0,56 | 0,74 | ||||||
| P | 0,008 | 0,038 | <0,001 | <0,001 | ||||||||
| Change | ||||||||||||
| VEGFA | rho | 1,00 | -0,20 | -0,10 | -0,20 | |||||||
| P | 0,236 | 0,536 | 0,222 | |||||||||
| VEGFB | rho | 1,00 | 0,26 | 0,21 | ||||||||
| P | 0,120 | 0,212 | ||||||||||
| sPD-L1 | rho | 1,00 | 0,49 | |||||||||
| P | 0,001 | |||||||||||
No other statistically significant associations were observed between the biomarkers evaluated (pretreatment, post-treatment and change between the two measurements) and the remaining clinicopathological features and treatment data of patients (sex, age, ECOG PS, disease stage, treatment-related toxicity).
Table 5.
Univariate Cox analysis results for survival, with biomarkers as independent variables.
| HR (95% CI)1 | P | |
|---|---|---|
| Pre-treatment | ||
| VEGFA | 0.97 (0.83 ─ 1.13) | 0.673 |
| VEGFB | 1.03 (0.97 ─ 1.10) | 0.297 |
| sPD-L1 | 1.68 (1.02 ─ 2.74) | 0.040 |
| sPD-1 | 10.96 (1.15 ─ 104.19) | 0.037 |
| Post-treatment | ||
| VEGFA | 1.02 (0.85 ─ 1.23) | 0.828 |
| VEGFB | 2.99 (1.01 ─ 8.89) | 0.049 |
| sPD-L1 | 0.30 (0.00 ─ 28.71) | 0.601 |
| sPD-1 | 0.90 (0.45 ─ 1.85) | 0.777 |
| Change | ||
| VEGFA | 0.94 (0.74 ─ 1.20) | 0.628 |
| VEGFB | 0.96 (0.90 ─ 1.03) | 0.243 |
| sPD-L1 | 0.02 (0.00 ─ 1.63) | 0.079 |
| sPD-1 | 0.82 (0.35 ─ 1.96) | 0.659 |
1 Hazard Ratio (95% Confidence Interval).
Table 6.
Multivariate Cox analysis results for survival in a stepwise method.
| HR (95% CI)1 | P | |
|---|---|---|
| sPD-L1 pre-treatment | 2.10 (1,16 ─ 3.80) | 0.014 |
| VEGFB post-treatment | 3.37 (1.11 ─ 10.22) | 0.032 |
1 Hazard Ratio (95% Confidence Interval).
Disclaimer/Publisher’s Note: The statements, opinions and data contained in all publications are solely those of the individual author(s) and contributor(s) and not of MDPI and/or the editor(s). MDPI and/or the editor(s) disclaim responsibility for any injury to people or property resulting from any ideas, methods, instructions or products referred to in the content. |
© 2024 by the authors. Licensee MDPI, Basel, Switzerland. This article is an open access article distributed under the terms and conditions of the Creative Commons Attribution (CC BY) license (https://creativecommons.org/licenses/by/4.0/).
Copyright: This open access article is published under a Creative Commons CC BY 4.0 license, which permit the free download, distribution, and reuse, provided that the author and preprint are cited in any reuse.


