
Submitted:
14 November 2024
Posted:
14 November 2024
You are already at the latest version
Abstract
Cannabis sativa flower glandular trichomes (GTs) are the main site of cannabinoid synthesis. Phytohormones, such as jasmonic acid (JAS) and salicylic acid (SAL) have been shown to increase cannabinoid content in Cannabis flowers, but how this is regulated remains unknown. This study aimed to understand the mechanisms of action of phytohormones on mature GT disc cells using an in vitro assay. Live GT disc cells were isolated from a high-tetrahydrocannabinol Cannabis cultivar and incubated on basal media plates supplemented with either kinetin (KIN), JAS, SAL, abscisic acid, ethephon, gibberellic acid, brassinolide, or sodium diethyldithiocarbamate. Quantitative proteomic analysis revealed that KIN, JAS and SAL caused the greatest number of changes in the GT disc cell proteome. Surprisingly, none of the treatments concertedly increased cannabinoid content or the abundance of related biosynthetic proteins in the GT, suggesting that cannabinoid increases in previous in planta phytohormone studies are likely due to other processes, such as increased GT density. As well, KIN, JAS and SAL treated GTs had numerous differentially abundant proteins in common. Several were key proteins for leucoplast differentiation, cuticular wax and fatty acid metabolism and primary metabolism regulation. Denoting that cytokinin, JAS and SAL signalling are likely important for coordinating Cannabis GT differentiation and development.
Keywords:
Cannabis sativa
; jasmonic acid
; salicylic acid
; cytokinin
; diethyldithiocarbamate
; cannabinoids
; leucoplast
; plastid
; cuticular wax
; metabolism
1. Introduction
Female flowers of Cannabis (Cannabis sativa L.) possess a proliferous number of ‘peltate’ stalked glandular trichomes (GTs) on their surface [1,2,3]. These defensive structures develop predominantly in conjunction with female floral tissue and provide protection [4,5,6] by producing and storing large amounts of secondary metabolites, that include cannabinoids [1,7]. These metabolites are particularly interesting due to their medicinal properties, acting via the human endocannabinoid and central nervous systems [8,9].
Cannabis GTs have a basic morphology composed of a base that attaches to the floral epidermis, a multicellular stalk that extends outwards to act as conduit for photoassimilate transport and a globular head that is supported by the stalk [2,10]. The GT head is composed of a ring of non-photosynthetic secretory disc cells that synthesize secondary metabolites that are then stored in an extracellular storage cavity that sits adaxially to the disc cells [11]. Attaching the disc to the stalk is a cluster of photosynthetic stipe cells that sit at the centre of the disc cell ring. The cannabinoid biosynthetic pathway is highly active in the disc cells [10], and is fed by the polyketide and methylerythritol 4-phosphate (MEP) pathways that provide olivetolic acid and geranyl pyrophosphate (GPP), respectively, for the synthesis of cannabigerolic acid (CBGA), the first cannabinoid synthesized in the pathway. The fatty acid hexanoic acid is the initial precursor of the cytosolically located polyketide pathway that is used to synthesize OA by way of hexanoyl-CoA synthetase, tetraketide synthase (TKS) and finally olivetolic acid cyclase (OAC) [12,13]. CBGA is then synthesized in leucoplasts by aromatic prenyltransferases, one of which being aromatic prenyltransferase 1 (CsPT1) [14], and is then transported to the storage cavity where outer cell wall-bound [11] tetrahydrocannabinolic acid synthases (THCAS) synthesize THCA from CBGA [15]. CBGA is also a precursor for other cannabinoids such as cannabidiolic acid (CBDA) and cannabichromenic acid (CBCA). ‘Acid-form’ cannabinoids can be converted into their ‘neutral-form’ by auto-decarboxylation.
Recent advances have shown that the regulatory nodes that control trichome initiation and development are broadly conserved between distantly related species [16], and phytohormones play a major role in regulating these processes [16,17,18]. Jasmonic acid (JA) is often a focus of study, having been shown to stimulate both glandular and non-glandular trichome initiation in Artemesia [19], Arabidopsis [20], and tomato [21]. Moreover, JA was recently demonstrated to induce increased floral cannabinoid content [22] and trichome density [23] in Cannabis. Other phytohormones have been studied for their effects on trichomes. One study found that application of either auxins, gibberellic acid, or JA uniformly increased non-glandular trichome density on Arabidopsis and poplar, but did not increase the amount of all trichome types on tomato [17]. In another study, brassinosteroids caused tomato glandular trichome density to decrease by inhibiting JA signalling [24].
Most of these studies have focused on trichome initiation and morphogenesis, leaving open the question as to what roles phytohormones have in regulating mature trichomes, specifically in relation to their productivity. For Cannabis, the question of productivity is an important one since GTs are the site for cannabinoid production, which in elite drug-type cultivars can account up to at least 20% of dry flower weight [25]. GTs in general have restructured metabolism to support high productivity; for example, tomato type VI GTs have modified central carbohydrate metabolism to feed precursors directly into secondary metabolism [26], and this is similar in Cannabis [10]. Recently, productivity in Cannabis GTs has been shown to be dynamic as specific cannabinoids increased with daytime progression [27], with glycolysis being an important control point. However, the main mechanisms that control GT productivity via primary metabolism [28] and the role of phytohormones are largely unknown.
Several studies have examined phytohormone regulation in Cannabis, typically looking at the effects of exogenously applied compounds on floral cannabinoid content. These in planta experiments have found several phytohormones to be effective at changing cannabinoid production. Methyl jasmonate [22,29], salicylic acid [30], and abscisic acid [31] were found to increase cannabinoid content. Gibberellic acid decreased cannabinoids [32], while auxin analogue 1-naphthalenaecetic acid cytokinin analogue 6-benzylaminopurine [33], and ethylene donor ethephon [34] did not cause any changes. These previous studies did not discriminate between phytohormonal effects on floral tissues and trichomes. While they found cannabinoid phenotypes, the location of phytohormonal action could not be investigated in detail using in planta spraying. In fact, no study to date has looked at phytohormonal regulation of trichomes in isolation. Furthermore, it remains unknown if these phytohormones reach the GT disc cells and whether they would have a direct effect on GT regulation. The effects on productivity may be indirect as a result of manipulating whole plant regulatory mechanisms.
GTs are inherently challenging to study in isolation due to their microscopic size and complexity to purify in sufficient quantities. The biggest bottleneck to studying these cells is that without the ability to isolate them, it is difficult to understand the direct impact of regulatory signals on GT function. Biochemical experiments using isolated GTs have been reported for peppermint [35,36]. Utilizing a similar system for Cannabis, we studied the effects of different classes of phytohormones in vitro on live GT disc cells, using quantitative proteomics and targeted metabolite analysis.
We asked which phytohormones exert influence on trichome metabolism at a disc cell level in the following terms: control of the cannabinoid biosynthetic pathway and cannabinoid content, magnitude of change in the disc cell proteome, and if affected proteins have roles in trichome functioning/development. Since GTs are primarily defensive structures [6], we hypothesized that phytohormones involved in environmental stress response (specifically JA, salicylic acid, and abscisic acid) will play important roles in regulating GTs and therefore may upregulate the cannabinoid biosynthetic pathway.
2. Results
2.1. Isolated Glandular Trichome Disc Cell Response to In Vitro Conditions for 24 h
A total of 1,400 proteins were quantified via SWATH-MS analysis in glandular trichome disc cells across all timepoints and under all treatment conditions in the in vitro agar plate experimental set up (Supplementary Dataset S1).
Under control conditions, 24 h plate incubation resulted in changes to the GT disc cell proteome, with 3.2% of proteins decreased in abundance and 5.3% of proteins increased (Figure 1A). Enrichment analysis of the differentially abundant proteins (DAPs) identified several biological processes that were affected over the course of 24 h (Figure 1B). Biological processes (BP) that were enriched in DAP’s that increased included purine metabolism, amino acid metabolism, ribosomal assembly, aerobic respiration, catabolism, and terpenoid biosynthesis. In contrast, BP enriched among decreasing DAPs included responses to desiccation and high light intensity, gluconeogenesis and monocarboxylic acid metabolism.
Of the cannabinoids that can be quantified with the HPLC method used, only CBGA, THCA and CBCA were measured above detectable threshold levels from all isolated GT disc cell samples.
Metabolite analysis on the isolated disc cells revealed that CBGA significantly decreased by a fold-change (FC) of 0.30 over the course of 24 h under control conditions. While not significant (p=0.089), THCA also showed a decrease with a FC trend of 0.63 over the same period (Figure 1C).
Several key proteins involved in stress response and energy production/allocation were differentially abundant after 24 h of incubation (Figure 1D). RESPONSIVE TO DEHYDRATION22 (RD22) and DEGP PROTEASE 7 (DEG7) decreased in abundance while MITOCHODRIAL ATP SYNTHASE subunit D (ATPd) and ATP CITRATE LYASE A-1 (ACLA-1) increased.
2.2. Proteome Responses of Glandular Trichome Disc Cells to Phytohormone Treatments
Principal component analysis (Figure 2A) revealed that the GT disc cell proteome responded differently to a range of phytohormone treatments. Treatment with ethephon (ETH), abscisic acid (ABA) or brassinolide (BRA) overlapped with the ellipse from the 24 h control proteome (CTR_24h), while the response of those treated with gibberellic acid (GA3), diethyldithiocarbamate (DIE), kinetin (KIN), jasmonic acid (JAS) and salicylic acid (SAL) segregated away from CTR_24h. Of note, KIN, JAS and SAL separated furthest away from CTR_24h. DIE is an inhibitor of jasmonic acid synthesis, thereby inhibiting its signalling pathway [37,38].
A total of 448 proteins (32% of quantified proteome) were differentially abundant due to at least one phytohormone treatment when compared to the CTR_24h (Figure 2B). Hierarchical clustering revealed that DAPs grouped into two clusters, those that generally increased in response to a phytohormone and those that generally decreased (Figure 2B). Phytohormones grouped into two clusters as well with group 1 comprising of GA3, BRA, DIE, ETH, and ABA and group 2 comprising of KIN, SAL, and JAS. DAPs in the increasing cluster generally enriched for processes involved in carbohydrate metabolism, phenylpropanoid biosynthesis and jasmonic acid biosynthesis, while DAPs in the decreasing cluster enriched for catabolism, fatty acid, amino acid and isoprenoid metabolism (Supplementary Figure S1).
Group 2 phytohormones caused the greatest change in the GT disc cell proteome (Figure 2C) with KIN, SAL and JAS causing 3.4%, 4.0% and 3.7% of proteins to increase in abundance, respectively, and 7.3%, 9.0% and 8.1% of proteins to decrease in abundance, respectively. Group 1 phytohormones caused a lower amount of change in the proteome with GA3, BRA, DIE, ETH, and ABA causing at most 2.9% of the quantified proteins to increase in abundance and at most 2.6% to decrease.
Gene ontology (GO) enrichment analysis was conducted on each of the individual phytohormone DAP groups (Figure 3). For group 1 phytohormones, increasing DAPs of BRA, ETH and ABA did not enrich significantly for any biological processes. DIE caused an increased enrichment for terms involved in phenylpropanoid biosynthetic process, and tetrahydrofolate metabolic process and GA3 did so for terms related to glycolysis and nucleoside catabolism (Figure 3A). In contrast, increasing DAPs in all three group 2 phytohormones enriched for specific biological processes. Both SAL and JAS enriched for photosynthesis and generation of precursor metabolites and energy. SAL additionally enriched for phenylpropanoid biosynthetic process and alpha-amino acid metabolic process. KIN only enriched for lipid oxidation and water stress (Figure 3A).
Decreasing DAPs due to the phytohormone treatments enriched for a range of biological processes in GT disc cells (Figure 3B). DAPs of group 1 phytohormones enriched for different processes with some overlap, with the exception of ABA which did not enrich for any biological processes. Decreasing DAPs of GA3, BRA and DIE enriched for nucleotide metabolic processes. DIE additionally caused a decrease in DAPs enriched for small molecule catabolic processes. DAPs decreased by ETH enriched for fatty acid metabolism. In contrast, DAPs decreased by KIN, SAL or JAS all enriched for similar biological processes. These included monocarboxylic acid metabolism, small molecule catabolic process, cellular respiration, generation of precursor metabolites and energy, and amino acid metabolism (Figure 3B).
Gene ontology gene cluster semantic similarity allowed for the pairwise comparison between each group of decreasing and increasing DAPs resulting from the phytohormone treatments in order to measure how biologically similar they are to one another (Figure 4). Hierarchically clustering the similarity scores identified that the groups of decreasing DAPs due to KIN, SAL or JAS treatments had high biological similarity to each other. This was also the case for the groups of increasing DAPs due to KIN, SAL or JAS.
2.3. DAPs and Biological Processes Shared Between Group 2 Phytohormones
Amongst group 2 phytohormones, 126 unique DAPs increased of which 28 (22%) were affected by at least 2 of 3 phytohormones of the group (Figure 5A). Similarly, 225 unique DAPs decreased, with 90 (40%) of them affected by at least 2 of 3 phytohormones (Figure 5B).
Seven DAPs of interest were identified that exclusively increased or decreased by at least two of the following phytohormones: KIN, SAL, and/or JAS. These are implicated in biological processes involving trichome differentiation/morphogenesis, carbohydrate metabolism or fatty acid metabolism. Three DAPs involved in plastidial function (Figure 5C-E) included WHAT’S THIS FACTOR 1 (WTF1) that was increased by KIN, SAL and JAS, chloroplastic protein translocase subunit SECA1 (cpSecA) that was increased by SAL and JAS, and translocon at the inner envelope membrane of chloroplasts 214 (TIC214) that was increased by KIN and JAS. ACLA-1 decreased in the presence of KIN, SAL and JAS, and is involved in cytosolic acetyl-CoA synthesis (Figure 7F). Lastly, three DAPS involved in fatty acid metabolism (Figure 7G-I) were affected. These included very-long chain enoyl-CoA reductase (CER10) which increased due to KIN and SAL, eceriferum 2 (CER2) which decreased due to KIN and JAS, and chloroplastic long chain acyl-CoA synthetase 9 (LACS9), which decreased due to KIN and SAL.
2.4. Phytohormonal Effects on Cannabinoid Metabolism
Phytohormonal effects on disc cell cannabinoid content were measured and compared to the CTR_24h values (Figure 6). DIE application resulted in a significant decrease in CBGA by causing a FC of 0.13, and while not significant (p=0.058) a trend in decreasing THCA (FC of 0.71) content was notable. ETH also caused a notable increasing trend (p=0.058) in CBGA content (FC of 1.43). CBCA and total cannabinoid content did not change for any of the treatments.
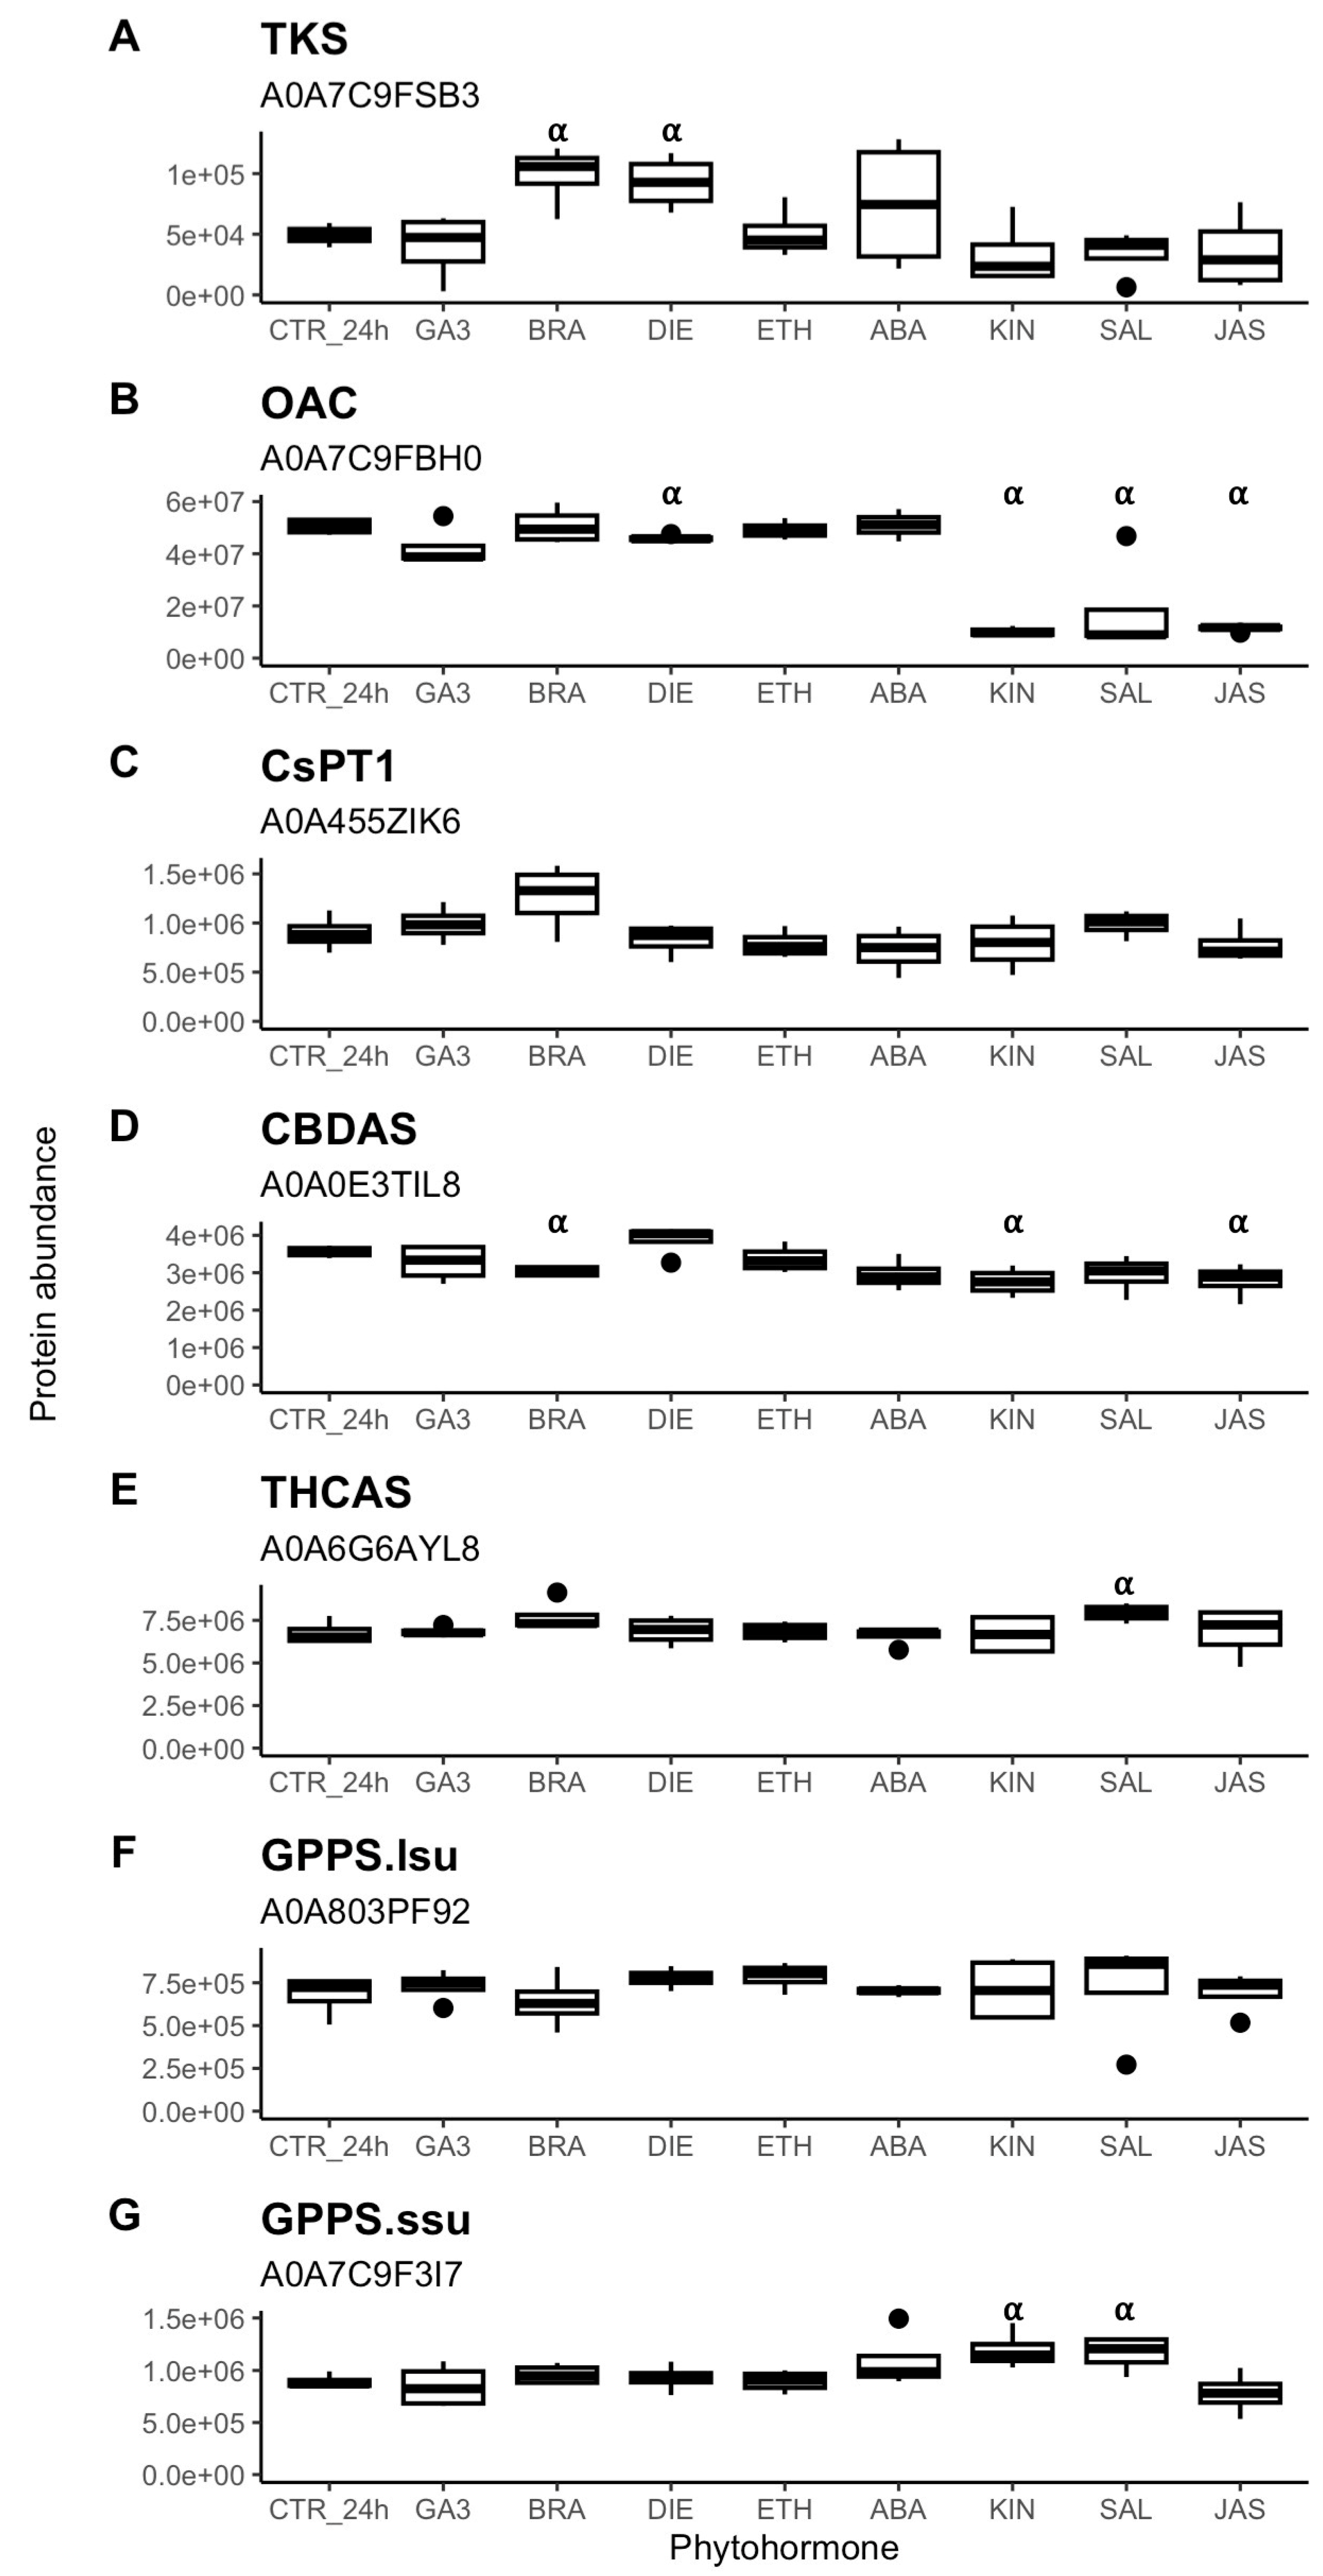
SWATH-MS allowed the relative abundance levels of seven key cannabinoid biosynthetic proteins (Figure 7) to be calculated: tetraketide synthase (TKS), olivetolic acid cyclase (OAC), aromatic prenyltransferase1 (CsPT1), cannabidiolic acid synthase (CBDAS), tetrahydrocannabinolic acid synthase (THCAS), geranylgeranyl pyrophosphate synthase 1 GPPLsu (GPPS.lsu) and geranylgeranyl pyrophosphate reductase GPPSsu (GPPS.ssu). Neither GA3, ETH, nor ABA had any effect on the abundance of these seven proteins. Both BRA and DIE application resulted in increases in TKS, while DIE, KIN, SAL and JAS application caused OAC to decrease. CBDAS decreased due to the application of BRA, KIN and JAS. SAL application resulted in an increase in THCAS. GPPS.ssu increased due to the application of KIN and SAL. None of the treatments had any effect on the abundance of CsPT1 or GPPS.lsu.
Figure 7.
Abundance of key proteins involved in cannabinoid biosynthesis (A-E) and geranyl pyrophosphate synthesis (F and G) in Cannabis glandular trichome disc cells when treated in vitro with phytohormones (n=4). Boxplots represent median, interquartile range, maximum, minimum and outliers (closed circles). Significance (denoted by ⍺) determined by two sample student’s t-test (p-value <0.05) by comparing phytohormone treatments to the control (CTR_24h). Abbreviations: ABA, abscisic acid; BRA, brassinolide; DIE, diethyldithiocarbamate; ETH, ethephon; GA3, gibberellic acid; KIN, kinetin; JAS, jasmonic acid; SAL, salicylic acid; TKS, tetraketide synthase; OAC, olivetolic acid synthase; CsPT1, Cannabis sativa aromatic prenyltransferase 1; CBDAS, cannabidiolic acid synthase; THCAS, tetrahydrocannabinolic acid synthase; GPPS.lsu, geranylgeranyl pyrophosphate synthase 1 GPPLsu; GPPS.ssu, geranylgeranyl pyrophosphate reductase GPPSsu. UniProt accession number listed underneath protein names.
3. Discussion
3.1. In Vitro GT Assay Proof of Concept
In vitro experiments have previously been carried out on isolated peppermint GTs to study how carbon flux in these cells affect terpenoid biosynthesis, these experiments used small amounts of trichome heads which were incubated in a liquid culture for only 1 hour [35,36]. In this study, we wanted to understand phytohormonal control of Cannabis GTs in in vitro isolated conditions to remove the potential effects of other signalling pathways that would be active in in planta conditions.
Unlike McCaskill, et al. [36], solid plate culturing was chosen since initial attempts of culturing in liquid media proved unsuccessful. Cannabis GT cells hyperaccumulated polyphenolic pigments when in liquid, indicating a high level of cell stress. We surmised this was due to the relatively anoxic environment of the liquid media compared to the solid plate culture. The GT disc cells were incubated for 24 h to give enough time for turnover of the proteome and changes in CBGA content in response to treatments. As an intermediate cannabinoid, CBGA experiences high flux and abundance can change in as little as 6 h. Changes in abundance can be used as a broad gauge for cannabinoid pathway activity [27]. The cells were incubated in constant light to mimic daytime conditions, which is when Cannabis GTs are most metabolically active for cannabinoid biosynthesis [27].
We initially expected that GT disc cells would experience some level of stress in the in vitro assay, but proteomic data suggested otherwise. Separated from their stalks that are the efficient conduits supplying photoassimilates [10], the GTs were in an artificial environment where nutrient availability varies from what is supplied when attached on the plant. Some increased DAPs (Supplementary Figure S3) such as a sucrose synthase (SUS3) and several aminotransferases and synthetases (ALAAT2, ATCS-C, and ASN1) may indicate to sugar starvation [39]. Yet, changes in other key regulators indicate that the cells were not metabolically stressed. Mitochondrial ATP synthase subunit d (ATPd) increased in abundance (Figure 1D), indicative of greater ATP generation [40]. Importantly, ACLA-1 also increased in abundance (Figure 1D). By being a non-redundant subunit of ATP citrate lyase, ACLA-1 abundance controls the available pool of cytosolic acetyl-CoA and acts as a regulator wherein a decrease in ACLA-1 induces metabolic stress and upregulation of stress response genes, causing the plant to reallocate the limited pool of acetyl-CoA to specific metabolic pathways [41]. Thus, increase in ACLA-1 would indicate that GT disc cells were not stressed and have carbon resources available. In addition, we observed that the cells responded accordingly to lower levels of high light stress and osmotic stress. DEG7 (Figure 1D), a plastidial DegP protease that responds to high light conditions and damage by photoinhibition [42], and RD22 (Figure 1D), a key positive regulator of drought stress response [43], both decreased in abundance. Lastly, microbial contamination was likely not a stressor for GT disc cells since none of the DAPs enriched for biotic stress response at 24 h (Figure 1B) and microbial contamination was not apparent until 48 h in initial time course trials (Supplementary Figure S2).
Evidence suggested continued and sustained secondary metabolism by GT cells after 24h of incubation under control conditions. Key enzymes involved in cannabinoid biosynthesis (TKS, OAC, CsPT1, THCAS, CBDAS, GPPS.ssu, GPPS.lsu) did not change in abundance (Supplementary Figure S3), indicating that the cannabinoid pathway was affected by the in vitro conditions. Correspondingly, THCA, CBCA and total cannabinoid content did not significantly change (Figure 1C). While CBGA content did decrease after 24h (Figure 1C), its continued presence would indicate to sustained CBGA synthesis, albeit at a lower rate. Otherwise, if CBGA synthesis had halted, then its content would have decreased to negligeable amounts, as it did with the DIE treatment (Figure 6). Cannabinoids are produced specifically by the non-photosynthetic secretory cells in the GT disc, making the GT disc a strong sink tissue reliant on photoassimilate import via the GT stalk [10]. This means that CBGA content likely correlates with the amount of photoassimilates available to the GT [27]. Thus, the lower CBGA content seen after 24h would suggest that sugar availability to GTs in vitro was lower than normally found in planta, which fits the increased SUS3 abundance seen in vitro (Supplementary Figure S3).
3.2. Phytohormone Regulation of Cannabinoid Biosynthesis
The in vitro phytohormone treatments in large did not cause concerted changes in cannabinoid pathway biosynthetic proteins (Figure 7) and cannabinoid content (Figure 6) within a period of 24 h. This juxtaposes several in planta studies where phytohormones were tested by spraying on plants and changes in floral cannabinoid flower and/or gene expression were assessed. In these studies, GA3 [32] was found to decrease total tetrahydrocannabinol (THC) content after 24 h, while ABA [31] caused total THC content to increase 24 h after 3 days of treatment. JAS [22,29,44] caused total THC content to increase after several weeks of treatment. ETH [34] caused cannabidiol to increase 24 h after 6 days of treatment. SAL caused THCA [44] content to decrease 1 week after 8 weeks of treatment. Garrido, et al. [44] also tested if JAS or SAL changed the gene expression of either OAC, CBDAS and THCAS, and found neither treatment had effects on these enzymes. In contrast, Sands, et al. [30] reported that SAL positively regulated the expression of TKS, OAC, CsPT1, CBDAS and GPPS.ssu as early as three hours after treatment. The differences in gene expression results could be due to the different cultivars and/or treatment methods used. For example, Garrido, et al. [44] applied weekly foliar sprays throughout floral development while Sands, et al. [30] used a onetime foliar application. These in planta studies were unable to explain the actual mechanisms that resulted in changed cannabinoid content in the GT since they were limited to examining at the floral tissue level. The lack of change in cannabinoid content and proteins in our in vitro experiment compared to the changes in the whole plant experiments point to phytohormones exerting control on cannabinoid biosynthesis indirectly in planta. In fact, Garrido, et al. [44] found that cannabinoid content correlated with plant growth and not with expression of the biosynthetic genes. Likely avenues of phytohormonal control over cannabinoid biosynthesis include manipulating primary metabolism and resource allocation in the short term or affecting trichome density in the long term.
3.2. GT Changes in Common Between Kinetin, Jasmonic Acid, and Salicylic Acid Indicate Roles in Coordinating Trichome Specific Features
Group 2, comprised of KIN, SAL, and JAS (Figure 2B), caused much larger proteome changes (greater than 10% each) than those observed for group 1 hormones. These phytohormones induced responses in the GT disc cells that were biologically similar to each other (Figure 4), as evidenced by a large number of increasing and decreasing DAPs in common (Figure 5). Significant interplay between these three hormones occurs in plants. JAS and SAL are largely antagonistic to each other to reduce redundancy [45], while cytokinins act synergistically with SAL to activate pathogen defences [46], as well with JAS to confer resistance to feeding insects [47]. Interestingly, we found that KIN, JAS and SAL caused OAC to decrease in abundance in a similar fashion by an average fold-change of 0.26 times (Figure 6), which may point to a common regulatory mechanism of OAC shared by the three. This stands in contrast to Sands, et al. [30] who had found that SAL increased OAC expression.
In Arabidopsis [18] and conserved in other species [16], trichome initiation is centrally controlled by the MYB/bHLB/WD40 (MBW) complex. Trichome development is influenced by integrating through the MBW complex developmental, stress and phytohormonal signals [18], which include the KIN, JA and SA signalling pathways [48]. Together, the magnitude of impact (Figure 2) and similarity in responses (Figure 4 and Figure 5) suggest that KIN, SAL, and JAS may have important roles in regulating Cannabis trichome development, morphology and/or productivity, by regulating many of the same biological processes (Figure 3).
When examined in detail, seven DAPs that were affected by either KIN, SAL and/or JAS point to these phytohormones’ involvement in trichome differentiation and morphogenesis processes (Figure 5C-I). These included CER10, CER2, and LACS9 that are involved in very long chain fatty acid (VLCFA) elongation for cuticular wax synthesis. As well cpSecA, TC214 and WTF1 that are involved in plastidial function and development. Also important was ACLA-1 that is involved in cytosolic acetyl-CoA synthesis.
CER10 is an enoyl-CoA reductase involved in VLCFA elongation that is required for cuticular wax synthesis. It has been shown to have a conserved role in trichome development in both tomato and Arabidopsis [49], and knock out mutants resulted in reduced trichome densities. Cannabis GTs have prolonged development that spans flower development [2], and involves remodelling of the cell wall and cuticle thickening of the apical surface of disc cells to create the storage cavity [50]. Not only did we see CER10 increasing when mature GTs were treated with either KIN, JAS, or SAL (known to positively regulate trichome initiation across species), but it also decreased in the 24h vs. 0h controls when no exogenous hormones were present (Supplementary Figure S3). This would suggest that CER10 has a role in regulating GT differentiation that would be likely linked to cell wall synthesis and storage cavity formation. This further implies that constant rates of JAS, SAL or KIN may be needed to maintain GT homeostasis.
Changes in CER2 and LACS9 abundance by KIN, SAL and JAS further substantiates their roles in directing cuticular wax formation in GTs (Figure 5H-I). CER2 is required for the fatty acid elongase complex to synthesise VLCFAs of lengths greater than 28 carbons [51]. We observed that the three phytohormones caused CER2 to decrease by an average FC of 0.17X, indicating that GT cuticular wax composition would be shifted, possibly to shorter chain length VLFCAs, by these phytohormones. This parallels what is seen in Arabidopsis trichomes which have an altered cuticular wax composition and is attributable to altered expression of the cuticular wax pathway that includes low expression of CER2 [52,53]. LACS are a family of long-chain acyl-CoA synthetases that catalyse free fatty acids into fatty acyl-CoAs and are involved in fatty acid transport in the cell [54,55]. In Arabidopsis, LACS9 is responsible for 90% of LACS activity in leaf plastids [56], thus having it decrease by KIN and SAL may indicate to a shift in fatty acid allocation in Cannabis GT metabolism.
Increased abundances of plastidial proteins cpSecA, TIC214 and WTF1 by KIN, SAL and JAS suggests roles in regulating GT leucoplast function (Figure 5C-E). CpSecA is a translocation ATPase, and part of the chloroplast secretory (cpSec) pathway [57]. The cpSec pathway is responsible for transport of unfolded proteins into the chloroplast lumen and is essential for development and differentiation of chloroplasts and all other plastid types [58,59]. Proper functioning of this pathway is essential for trichome development, as ATcpSecA deficient mutants result in malformed Arabidopsis trichomes [57]. TIC214 is a component of the TOC-TIC system, another plastidial protein transport system, where direct regulation of TOC-TIC plays a role in proteome remodelling and plastid biogenesis [60]. WTF1 is also important for plastidial function, as it is a required component of the splicing machinery in chloroplasts that splices group II introns, and is needed for proper chloroplast function [61]. Interestingly, WTF1 decreased in abundance in the 24h control (Supplementary Figure S3), and only KIN, JAS and SAL were able to restore abundance (Figure 5C). These changes would suggest that KIN, JAS and SAL have a role in regulating leucoplast differentiation in Cannabis GT non-photosynthetic secretory cells, which are sites of secondary metabolite synthesis [11].
Common decreasing DAPs enriched for multiple components of primary metabolism, and could indicate a role for KIN, JAS and SAL in restructuring metabolism that occurs during trichome development, where primary metabolism is streamlined to feed into cannabinoid synthesis. An indication that resource allocation in GTs is manipulated by these three phytohormones is the decrease in ACLA-1 in treated trichomes (Figure 5F). ACLA-1 is a non-redundant subunit of ATP citrate lyase, and a decrease would result in limiting the cytosolic acetyl-CoA pool which plants typically respond to by prioritizing acetyl-CoA to certain metabolic processes that include stress responses [41]. Primary metabolism in photosynthetic tomato type VI trichomes is heavily modified with the uncoupling of light photosynthesis from dark reactions. While tomato trichomes receive their carbon from leaf sucrose, the uncoupling allows energy and reducing power from GT photosynthesis to directly feed into their secondary metabolism [26]. A similar mechanism is thought to exist in Cannabis GTs, but in this case it is the GT disc’s central stipe cells (these interface between the secretory cells and the stalk) that are photosynthetic and provide reducing power to the secretory cells’ secondary metabolism [10]. Several subunits of photosystems I and II also increased in abundance by KIN, JAS and SAL (Supplementary Dataset S1), which point to possible upregulation of photosynthesis in the stipe cells, as disc cells are non-photosynthetic, leading to possible greater production of reducing equivalents [10,26].
3.3. Diethyldithiocarbamate (DIE) Is a Negative Regulator of Cannabinoid Biosynthesis
DIE is a strong reducing agent that can be used to reduce 13(S)-hydroperoxylinolenic acid (HPOTrE) to 13-hydrolinolenic acid in plants, thereby reducing the pool of HPOTrE that is a precursor for cyclization into jasmonic acid [37]. The compound can be used exogenously to disrupt JA signalling in planta, as done to induce powdery resistance in wheat [38]. While a changing proteome of the GT disc cells treated with DIE indicated that they were still alive, the observed increases in phenylpropanoid and tetrahydrofolate metabolism together with the decrease in catabolism would indicate that they were likely stressed (Figure 3). Also indicative of stress is that DIE caused a decrease in CBGA, one of the GT’s main metabolic outputs, (Figure 6) without a concomitant decrease in abundance of cannabinoid biosynthesis proteins (Figure 7).
While negative regulation of cannabinoid biosynthesis by DIE cannot be readily explained, it is indicative that disruption of JA signalling is stressful to Cannabis GTs and that JAS may be needed for trichome homeostasis. One possible mechanism could be that DIE disrupts fatty acid metabolism in the trichome, thereby limiting the availability of hexanoic acid needed for olivetolic acid biosynthesis and subsequently causing CBGA content to decrease. Fatty acid synthesis occurs in plastids, and since it appears that JAS is important for proper plastid function in trichomes (Figure 5), disruption of JAS signalling by DIE could interfere with trichome leucoplast function. DIE has been observed to affect fatty acid metabolism in other species, where it modulated fatty acid composition in wheat [38], and decreased fatty acid content in grape berries [62].
3.4. JAS Is a Key Coordinating Phytohormone for GT Initiation and Development in Cannabis
Our study supports recent research that established JA signalling as a key regulatory pathway for the initiation, development and function of Cannabis glandular trichomes. While foliar application of JAS caused increased cannabinoid content in floral tissue [22], this increase is unlikely due to upregulation of the cannabinoid biosynthetic pathway. CBGA synthesis is a likely rate-limiting step in the pathway [27], and is synthesised by two aromatic prenyltransferases: CsPT1 and CsPT4. The expression of these two enzymes has been found to be unresponsive to methyl jasmonate and promoter regions of their genes do not have JAS responsive elements [30]. We similarly found that JAS did not affect the abundance of CsPT1, tetraketide synthase, THCA synthase, or subunits of GPP synthase (GPPS.ssu and GPPS.lsu), while it caused a decrease in olivetolic acid cyclase and CBDA synthase (Figure 6). Congruently, exposure of GT disc cells to JAS did not increase either CBGA or THCA content in vitro (Figure 7). Consequently, increased floral cannabinoid content in planta by JAS [22] may be caused by some mechanism other than upregulation of biosynthetic enzymes. This could either be by increasing the allocation of carbon to secondary metabolism, which some plants do when under stress [63], or by promoting GT initiation to increase overall floral GT density, a phenomenon recently observed in Cannabis [23].
Huang, et al. [23] found that a methyl jasmonate (MeJA) mediated pathway was involved in trichome formation. Foliar application of MeJA increased trichome density on Cannabis flowers and RNA-Seq analysis detected a cluster of MeJA responsive genes that strongly correlated with GT formation during flower development. CsMYC4, a bHLH transcription factor (TF), was identified as a key regulatory gene in the cluster, and is a close homolog of the trichome inducing SlMYC1 TF in tomato [64]. Consequently, Huang, et al. [23] proposed a MYC-JAZ complex as the JAS-induction mechanism for GT initiation. This is similar to the mechanism in tomato and Artemisia [65] and the MBW model of multicellular trichome initiation [16]. Our research further substantiates Huang, et al. [23] findings that JAS is important for Cannabis GT development. We observed that 11.8% of quantified proteins responded to JAS in mature GTs that were sampled at 6 weeks into flowering. As well, we found that treating GTs with DIE likely inhibited the jasmonic acid pathway which resulted in GTs showing signs of a stress response. These two observations indicated that mature GTs are receptive to jasmonic acid signalling past the trichome initiation stage, and that JAS is likely important for maintaining GT homeostasis. Furthermore, JAS regulated key proteins involved in leucoplast formation, cuticle and cell wall modification and energy metabolism, which are processes needed for the development of mature Cannabis GTs. Finally, the similarity of the KIN and SAL responses to JAS suggests a more complex integration of hormonal interplay to be of importance for GT homeostasis in Cannabis.
4. Materials and Methods
4.1. Grow Conditions and Plant Propagation
High-THC Hindu Kush cultivar of Cannabis sativa L. was provided by Cann Group Ltd for our study. Plants were grown in a secure grow room at Southern Cross University under an authority issued by the New South Wales Department of Health.
Clonal plants were propagated from cuttings taken from mother plants and implanted into wetted rockwool plugs with Clonex® rooting gel (3.0 g/L indole acetic acid). The clones were then incubated in a growth chamber (Conviron ATC60) for 2 weeks at 28°C, under long-day cycles (20 h light/4 h dark) and ambient relative humidity to promote root development.
Once roots were established, clones were potted into 5 L pots with potting mix (70:30% blend of coco-perlite) and osmocote fertilizer (6.4 g/L) and transferred into a large grow tent in the grow room for 26 vegetative growth days. The grow room was set at 26°C with ambient relative humidity. Plants were exposed to long-day cycles (20 h light/4 h dark) using LED lighting (ViparSpectra©) at constant intensity (800 µmol m2 sec−1 at canopy height), in the absence of UV-B light. Plants were watered daily with tap water.
After 44 days plants were moved out of the tent and onto grow room benches with a capillary watering system. Flowering was induced with short-day light cycles (12 h light/12 h dark) using LED lighting. PAR during flowering was constant throughout the day at an average of 650 µmol m−2 s−1 at the top of plant canopies, approximately 60 cm below LED lights. Plants were used for experiments at 49 flowering days (from onset of short-day cycle), where flowers developed to mid-maturity (30-50% pistils senescing, and flower buds have taken on a “frosty” look due to proliferous GT development).
4.2. Trichome Disc Cell Isolation
Cannabis disc cells were isolated using the same method as in Dimopoulos, et al. [27]. Flowers from four plants were carefully harvested to avoid cutting the sugar leaves or bracts and to exclude fan leaves from the harvested material to ensure no mesophyll tissue contamination in the final trichome isolation. Flowers were first dipped in ice-cold ethanol (100% v/v) for 15 seconds and then dipped twice in ice-cold water for 20 seconds each to promote the rupturing and washing away of the trichome resin storage cavity.
After dipping, the batch of flowers was then gently washed in a small washing machine (BubbleBagDude©, Bubble Machine) for 10 minutes with ice-cold water to detach the GTs. Material was then drained through a series of sieves (220 μm,120 μm and 25 μm). Trichome disc cells were collected from the 25 μm sieve and resuspended in ice-cold mannitol buffer (0.2 M mannitol, 0.05 M Tris-HCl, 0.005 M MgCl 2, 0.01 M KCl, 0.0005 M K2HPO 4, 0.001 M EGTA, pH 6.0) in a 50 ml tube. The washing and trichome disc cell collection were repeated twice more on the same batch of flowers. Once collection was completed, the trichome disc cells were gently washed three times with fresh mannitol buffer and then resuspended in a new 50 ml tube to a final volume of 30 ml (Supplementary Figure S4).
4.3. In vitro Phytohormone Treatment
Sterile basal agar plates [1.5% (w/v) agar] supplemented with 0.02 M sucrose and 0.02 M raffinose were prepared with different phytohormonal treatments in order to test the response of isolated trichome disc cells under in vitro conditions. The hormone concentrations applied were as follows: 20 μM (+)-cis,trans-Abscisic acid (Astral Scientific, A-1003); 20 μM Salicylic acid (Sigma-Aldrich, S7401); 20 μM (±) JA (Sigma-Aldrich, J2500); 1 mM Sodium diethyldithiocarbamate (Sigma-Aldrich, 228680); 20 μM Brassinolide (Sapphire Bioscience, 21594); 20 μM Ethephon (Sigma-Aldrich, C0143); 20 μM Gibberellic acid (ChemSupply, GL003); 20 μM Indole acetic acid (Biosynth, FI09866); 20 μM Kinetin (Acros Organics, 226500050); Start point control (CTR_0h); End point control (CTR_24h). Phytohormones were prepared as 1000X stock solutions dissolved in 100% (v/v) ethanol and then added to the molten agar post-sterilization. Equivalent amounts of 100% (v/v) ethanol were added to molten control agar post-sterilization as the treatments. While working under sterile conditions in a laminar flow hood, the trichome disc suspension (500μL) in mannitol buffer (0.2 M mannitol, 0.05 M Tris-HCl, 0.005 M MgCl2, 0.01 M KCl, 0.0005 M K2HPO4, 0.001 M EGTA, pH 6.0) was pipetted onto the petri plates which were then gently tilted to spread the cells across before air drying and sealing with parafilm.
The plates were incubated in an environmental chamber (Sanyo model no. MLR-350H) set to 26°C with 24-hour light (200 µmol m2 sec−1) for a period of 25.5 hours. Continuous light was used to maintain GT disc cells in a state where cannabinoid anabolism is most active [27]. Each plate was considered a biological replicate, with four replicates prepared per treatment (n=4). After incubation, trichome disc cells were harvested from each plate using a cell scraper, resuspended in 900 μL of mannitol buffer and then split into aliquots. Trichome disc cells were spun down at 4°C 12,000 g for 2 minutes to remove the supernatant before flash freezing in liquid nitrogen and storage at -80°C.
4.4. Protein Extraction
Pelleted trichome cells were first disrupted by adding a 5 mm steel ball into the sample tube and shaken while frozen at 26 Hz for 20 seconds on a TissueLyser II (Qiagen). While working on ice, the powdered pellets were then each resuspended with 220 μL of suspension buffer (0.4 M mannitol, 1.086 M glycerol, 0.0054 M Tris-MES, 0.0013 M dithiothritol) and vortexed. A 100 μL aliquot of the suspension was frozen away at -80°C and a second one was taken for protein extraction, where 50 μL of each 10X TE buffer, 0.5% (w/v) sodium deoxycholate and 72% (w/v) trichloroacetic acid were added sequentially to the sample and vortexed with each addition. Protein extraction samples were incubated on ice for one hour and then centrifuged at 14,000 g and 4°C for 20 minutes. The supernatant was then carefully aspirated without disturbing the protein pellets, and pellets were resuspended in 100 μL 90% (v/v) methanol before incubating overnight at -20°C.
The next day, protein samples were centrifuged at 14,000 g and 4°C for 20 minutes. The supernatant was aspirated, and the protein pellet was resuspended in 100 μL of ice cold 90% (v/v) methanol. This pellet washing was repeated three times after which the pellets were centrifuged and the supernatant aspirated for a final time. The protein pellets were then left to dry in a fume hood for approximately one hour, with the open lids covered with a Kimwipe. Once dry the pellets were stored at -80°C prior to Mass Spectrometry analysis by Sequential Window of All Theoretical Mass Spectra (SWATH-MS) at the IMB Proteomics facility of the University of Queensland.
4.5. LC–MS/MS Analysis of Cannabis GT Proteome
Proteomic analysis of trichome-derived peptides was conducted on an Ekspert nano LC400 uHPLC system (SCIEX, Canada), interfaced with a TripleTOF 6600 QTOF mass spectrometer (SCIEX, Canada), which was equipped with a PicoView nanospray source (New Objective, USA). Separation of peptides was facilitated by a dual-column setup, employing a 5 mm x 300 mm C18 3 µm trap column (SGE, Australia) and a 75 µm x 150 mm ChromXP C18 CL 3 µm analytical column (SCIEX, Canada). The elution gradient was formulated with 0.1% formic acid in both water (Solvent A) and acetonitrile (Solvent B), increasing Solvent B from 2% to 40% over 60 minutes, followed by a ramp to 90% for 5 minutes, and maintained at 90% for another 5 minutes before re-equilibrating to 2%. The flow rate of the mobile phase was maintained at 400 nL/min, and the column was thermostatically controlled at 45°C. Sample peptides, in 5 µL aliquots, were introduced to the trap column at a flow rate of 10 µL/min for 5 minutes, then transferred to the analytical column at a consistent flow rate. The SWATH acquisition mode was employed for MS/MS analysis, capturing 100 product ion spectra per cycle across the range of m/z 350 to 1,500, with each product ion window defined at 6 Da. Variable collision energies were applied, ranging from 16 to 60 V, with an energy spread of 5 V. The TOF-MS scans were conducted with an acquisition time of 50 ms, and each product ion scan was allotted 25 ms.
Data collection and processing were executed using Analyst TF software version 1.7 (SCIEX, Canada). The SWATH-MS data underwent spectral alignment and targeted data extraction using the SWATH Processing Micro App within PeakView software (Version 1.2, SCIEX), leveraging an inhouse assembled spectral library built from Hindu Kush spectral data [27]. The extraction parameters were set with a 15-minute window and included ten peptides per protein, five transitions per peptide, a peptide confidence threshold of greater than 95%, exclusion of shared peptides, and an extracted ion chromatogram width of 75 ppm.
4.6. Metabolite Extraction from Cannabis GT
Cannabinoids were extracted from GTs with one aliquot taken for each biological replicate. While still frozen, a 5 mm steel ball was added to each tube and cells were pulverized by shaking on a TissueLyser II (Qiagen) at 20 Hz for 12 sec. Once pulverized, 1000 μL of 100% (v/v) ethanol (HPLC-grade) was added to each sample, then briefly vortexed and the liquid sample transferred to a new pre-weighed 2 ml tube. The samples were then sonicated for 30 min at 30 Hz, centrifuged at 16,000 g for 20 min at 20°C and the supernatant transferred to a new tube and stored at -20°C for further analysis. The pellet was left to air-dry in a fume hood overnight and the pellet dry weight was measured. On day of analysis, the stored supernatant was sonicated once more for 30 min at 30 Hz and then centrifuged at 16,000 g for 5 min to pellet any undissolved precipitate with supernatant transferred to an HPLC vial for analysis.
4.7. HPLC-UV Analysis of Cannabinoids from Cannabis GT Cells
Targeted cannabinoid analysis was performed using HPLC (Agilent LC 1260 Infinity II) with a UV lamp and an Agilent 1260 Infinity II Diode Array Detector HS (Agilent Technologies, Santa Clara, CA, USA) using a method adapted from Hewavitharana, et al. [66]. This method allows for quantification of CBGA, THCA, CBDA, CBCA, cannabidivarinic acid (CBDVA), tetrahydrocannabivarinic acid (THCVA), and tetrahydrocannabinol (THC). Separation was attained by using a reverse phase column (Agilent Infinity Poroshell 120, HPH-C18, 2.1 × 150 mm, 2.7 µm, narrow bore LC column, Agilent Technologies, Santa Clara, CA, USA) with a water/acetonitrile/methanol gradient. A 1 µL aliquot was injected for each sample. The column temperature was set at 30°C with a flow rate of 0.3 mL/min. The mobile phase first started with water/acetonitrile/methanol (35/50/15, v/v/v) and changed to water/acetonitrile/methanol (1/99/0, v/v/v) over a period of 10 min and held for 2 min and then changed back to water/acetonitrile/methanol (35/50/15, v/v/v) over a period of 1 min and then held for 5 min. Chromatographic peaks were analysed using Agilent OpenLab CDS (version 2.7), with CBGA and THCA identified by retention time with their absorbance signals measured at 270 nm and calibrated against commercially available cannabinoid standards (Novachem, VIC, Australia). Cannabinoid content was expressed as mg g−1 (DW) GT disc cells.
4.8. Statistical and Bioinformatic Analyses
Statistical analyses were conducted in R (v4.3.1) using various packages. Two-sample student’s t-test was used to determine significant differences for protein and metabolite abundance, between treatments and control. A p-value < 0.05 with either a fold-change < 0.67 or a fold-change > 1.5 was considered significant for proteins and a p-value < 0.05 was considered significant for metabolites. Principal component analysis (factoextra package v1.0.7) was used to cluster GT proteome samples. Heatmaps were created using the pheatmap (v1.0.12) and hierarchically clustered by Ward clustering using Euclidean distance. Like in Dimopoulos, et al. [27] and other studies with non-model plants [67], the functional annotation of the identified Cannabis GT proteins was determined by aligning sequences to the best BLASTP matches within the National Center for Biotechnology Information (NCBI) and UniprotKB/SwissProt databases, utilizing Arabidopsis as a reference organism. The threshold for significance was set at an e-value of less than 1e-5. Gene ontology enrichment analysis of groups of differentially abundant proteins was conducted using the clusterProfiler (v4.12.6) package [68,69] with the R package org.At.tair.db: genome-wide annotation package for Arabidopsis (v3.19.1). Enriched ontology terms were considered significant when the adjusted (Benjamini-Hochberg) p-value < 0.05. Gene ontology semantic similarity analysis was performed with the GOSemSim (v2.30.2) package for R [70].
Supplementary Materials
The following supporting information can be downloaded at the website of this paper posted on Preprints.org. Supplementary Dataset S1 – Statistics results for glandular trichome proteome analysis. Supplementary Figure S1 – Enriched GO terms of global increased and decreased DAPs. Supplementary Figure S2 – Photos of control time course trial. Supplementary Figure S3 – Abundances of key proteins in controls at 0h and 24h. Supplementary Figure S4 – Photos of high purity trichome disc cells.
Author Contributions
ND and TK: conceptualization; ND and QG: formal analysis; TK and BB: funding acquisition; ND and LL: investigation; ND, LL, QG, MN, RD and LG: methodology; TK: project administration; JM: resources; TK and BB: supervision; ND, LL and QG: validation; ND: visualization; ND: writing – original draft; all authors: writing – review & editing.
Funding
This project received grant funding from the Australian Government via the Department of Industry, Science, Energy and Resources, as part of the Cooperative Research Centres Project (CRC-P) program—Round 7—Growing the medicinal Cannabis industry—precision farming to pharmaceuticals. The CRC-P program is an industry-led research collaboration and Cann Group Ltd. is the lead partner organization.
Data Availability Statement
The primary data supporting this study includes the raw mass spectrometry proteomics data and metabolite data. All primary data have been deposited (ID 991013205013802368) to the Southern Cross University research portal (https://researchportal.scu.edu.au/) and are openly available at https://doi.org/10.25918/data.382.
Conflicts of Interest
The authors declare that Cann Group Ltd. was a funding partner for this project through the CRC-P program.
Acknowledgments
We would like to thank Cann Group Ltd., for supplying the proprietary germplasm and training in cultivation and husbandry techniques. We would particularly like to acknowledge Filippa Brugliera, James Yodgee and Stefanie Kabitz of Cann Group Ltd. for their valuable input into industry needs and developments. Thank you to Alun Jones of the Institute of Molecular Bioscience at the University of Queensland for providing access to the mass spectrometry facilities for our proteomic analyses supported through an ARC LIEF grant LE170100192. Lastly, we would like to thank the broader Cannabis rights community for tirelessly advocating for the legal reform of medicinal Cannabis laws that has allowed Cannabis research possible.
References
- Kovalchuk, I.; Pellino, M.; Rigault, P.; Velzen, R.V.; Ebersbach, J.; Ashnest, J.R.; Mau, M.; Schranz, M.E.; Alcorn, J.; Laprairie, R.B. The genomics of Cannabis and its close relatives. Annual Review of Plant Biology 2020, 16. [Google Scholar] [CrossRef]
- Livingston, S.J.; Quilichini, T.D.; Booth, J.K.; Wong, D.C.J.; Rensing, K.H.; Laflamme-Yonkman, J.; Castellarin, S.D.; Bohlmann, J.; Page, J.E.; Samuels, A.L. Cannabis glandular trichomes alter morphology and metabolite content during flower maturation. Plant Journal 2020, 101, 37–56. [Google Scholar] [CrossRef] [PubMed]
- Potter, D. The propagation, characterisation and optimisation of Cannabis sativa L as a phytopharmaceutical. King’s College London, London, United Kingdom, 2009.
- Mahlberg, P.G.; Eun, S.K. Accumulation of cannabinoids in glandular trichomes of Cannabis (Cannabaceae). Journal of Industrial Hemp 2004, 9, 15–36. [Google Scholar] [CrossRef]
- Small, E.; Naraine, S.G.U. Size matters: evolution of large drug-secreting resin glands in elite pharmaceutical strains of Cannabis sativa (marijuana). Genetic Resources and Crop Evolution 2016, 63, 349–359. [Google Scholar] [CrossRef]
- Stack, G.M.; Snyder, S.I.; Toth, J.A.; Quade, M.A.; Crawford, J.L.; McKay, J.K.; Jackowetz, J.N.; Wang, P.; Philippe, G.; Hansen, J.L.; et al. Cannabinoids function in defense against chewing herbivores in Cannabis sativa L. Horticulture Research 2023, 10. [Google Scholar] [CrossRef]
- Nuutinen, T. Medicinal properties of terpenes found in Cannabis sativa and Humulus lupulus. Eur J Med Chem 2018, 157, 198–228. [Google Scholar] [CrossRef]
- Zou, S.; Kumar, U. Cannabinoid receptors and the endocannabinoid system: Signaling and function in the central nervous system. International Journal of Molecular Sciences 2018, 19. [Google Scholar] [CrossRef]
- Russo, E.B. Taming THC: potential cannabis synergy and phytocannabinoid-terpenoid entourage effects. British Journal of Pharmacology 2011, 163, 1344–1364. [Google Scholar] [CrossRef]
- Conneely, L.J.; Mauleon, R.; Mieog, J.; Barkla, B.J.; Kretzschmar, T. Characterization of the Cannabis sativa glandular trichome proteome. PLoS ONE 2021, 16. [Google Scholar] [CrossRef]
- Livingston, S.J.; Rensing, K.H.; Page, J.E.; Samuels, A.L. A polarized supercell produces specialized metabolites in cannabis trichomes. Current Biology 2022, 1–8. [Google Scholar] [CrossRef]
- Flores-Sanchez, I.J.; Verpoorte, R. PKS activities and biosynthesis of cannabinoids and flavonoids in Cannabis sativa L. plants. Plant and Cell Physiology 2008, 49, 1767–1782. [Google Scholar] [CrossRef] [PubMed]
- Gagne, S.J.; Stout, J.M.; Liu, E.; Boubakir, Z.; Clark, S.M.; Page, J.E. Identification of olivetolic acid cyclase from Cannabis sativa reveals a unique catalytic route to plant polyketides. Proceedings of the National Academy of Sciences of the United States of America 2012, 109, 12811–12816. [Google Scholar] [CrossRef] [PubMed]
- Fellermeier, M.; Zenk, M.H. Prenylation of olivetolate by a hemp transferase yields cannabigerolic acid, the precursor of tetrahydrocannabinol. FEBS Letters 1998, 427, 283–285. [Google Scholar] [CrossRef] [PubMed]
- Sirikantaramas, S.; Taura, F.; Tanaka, Y.; Ishikawa, Y.; Morimoto, S.; Shoyama, Y. Tetrahydrocannabinolic Acid Synthase, the Enzyme Controlling Marijuana Psychoactivity, is Secreted into the Storage Cavity of the Glandular Trichomes. Plant and Cell Physiology 2005, 46, 1578–1582. [Google Scholar] [CrossRef]
- Suárez-Baron, H.; Alzate, J.F.; Ambrose, B.A.; Pelaz, S.; González, F.; Pabón-Mora, N. Comparative morphoanatomy and transcriptomic analyses reveal key factors controlling floral trichome development in Aristolochia (Aristolochiaceae). Journal of Experimental Botany 2023, 74, 6588–6607. [Google Scholar] [CrossRef]
- Maes, L.; Goossens, A. Hormone-mediated promotion of trichome initiation in plants is conserved but utilizes species- and trichome-specific regulatory mechanisms. Plant Signaling and Behavior 2010, 5, 205–207. [Google Scholar] [CrossRef]
- Matías-Hernández, L.; Aguilar-Jaramillo, A.E.; Cigliano, R.A.; Sanseverino, W.; Pelaz, S. Flowering and trichome development share hormonal and transcription factor regulation. Journal of Experimental Botany 2016, 67, 1209–1219. [Google Scholar] [CrossRef]
- Maes, L.; Van Nieuwerburgh, F.C.W.; Zhang, Y.; Reed, D.W.; Pollier, J.; Vande Casteele, S.R.F.; Inzé, D.; Covello, P.S.; Deforce, D.L.D.; Goossens, A. Dissection of the phytohormonal regulation of trichome formation and biosynthesis of the antimalarial compound artemisinin in Artemisia annua plants. New Phytologist 2011, 189, 176–189. [Google Scholar] [CrossRef]
- Traw, M.B.; Bergelson, J. Interactive effects of jasmonic acid, salicylic acid, and gibberellin on induction of trichomes in Arabidopsis. Plant Physiology 2003, 133, 1367–1375. [Google Scholar] [CrossRef]
- Chen, G.; Klinkhamer, P.G.L.; Escobar-Bravo, R.; Leiss, K.A. Type VI glandular trichome density and their derived volatiles are differently induced by jasmonic acid in developing and fully developed tomato leaves: implications for thrips resistance. Plant Science 2018, 276, 87–98. [Google Scholar] [CrossRef]
- Welling, M.T.; Deseo, M.A.; O’Brien, M.; Clifton, J.; Bacic, A.; Doblin, M.S. Metabolomic analysis of methyl jasmonate treatment on phytocannabinoid production in Cannabis sativa. Frontiers in Plant Science 2023, 14. [Google Scholar] [CrossRef] [PubMed]
- Huang, X.; Chen, W.; Zhao, Y.; Chen, J.; Ouyang, Y.; Li, M.; Gu, Y.; Wu, Q.; Cai, S.; Guo, F.; et al. Deep learning-based quantification and transcriptomic profiling reveal a methyl jasmonate-mediated glandular trichome formation pathway in Cannabis sativa. The Plant Journal 2024, n/a. [Google Scholar] [CrossRef] [PubMed]
- Campos, M.L.; De Almeida, M.; Rossi, M.L.; Martinelli, A.P.; Litholdo Junior, C.G.; Figueira, A.; Rampelotti-Ferreira, F.T.; Vendramim, J.D.; Benedito, V.A.; Pereira Peres, L.E. Brassinosteroids interact negatively with jasmonates in the formation of anti-herbivory traits in tomato. Journal of Experimental Botany 2009, 60, 4347–4361. [Google Scholar] [CrossRef] [PubMed]
- Janatová, A.; Fraňková, A.; Tlustoš, P.; Hamouz, K.; Božik, M.; Klouček, P. Yield and cannabinoids contents in different cannabis (Cannabis sativa L.) genotypes for medical use. Industrial Crops and Products 2018, 112, 363–367. [Google Scholar] [CrossRef]
- Balcke, G.U.; Bennewitz, S.; Bergau, N.; Athmer, B.; Henning, A.; Majovsky, P.; Jiménez-Gómez, J.M.; Hoehenwarter, W.; Tissier, A. Multi-omics of tomato glandular trichomes reveals distinct features of central carbon metabolism supporting high productivity of specialized metabolites. The Plant Cell 2017, 29, 960–983. [Google Scholar] [CrossRef]
- Dimopoulos, N.; Guo, Q.; Purdy, S.J.; Nolan, M.; Halimi, R.A.; Mieog, J.C.; Barkla, B.J.; Kretzschmar, T. From dawn ‘til dusk: daytime progression regulates primary and secondary metabolism in Cannabis glandular trichomes. Journal of Experimental Botany 2024. [Google Scholar] [CrossRef]
- Brand, A.; Tissier, A. Control of resource allocation between primary and specialized metabolism in glandular trichomes. Current Opinion in Plant Biology 2022, 66, 102172. [Google Scholar] [CrossRef]
- Apicella, P.V.; Sands, L.B.; Ma, Y.; Berkowitz, G.A. Delineating genetic regulation of cannabinoid biosynthesis during female flower development in Cannabis sativa. Plant Direct 2022, 6, e412. [Google Scholar] [CrossRef]
- Sands, L.B.; Haiden, S.R.; Ma, Y.; Berkowitz, G.A. Hormonal control of promoter activities of Cannabis sativa prenyltransferase 1 and 4 and salicylic acid mediated regulation of cannabinoid biosynthesis. Scientific Reports 2023, 13, 8620. [Google Scholar] [CrossRef]
- Mansouri, H.; Asrar, Z.; Szopa, J. Effects of ABA on primary terpenoids and Δ9- tetrahydrocannabinol in Cannabis sativa L. at flowering stage. Plant Growth Regulation 2009, 58, 269–277. [Google Scholar] [CrossRef]
- Mansouri, H.; Asrar, Z.; Mehrabani, M. Effects of gibberellic acid on primary terpenoids and Δ9 -tetrahydrocannabinol in Cannabis sativa at flowering stage. Journal of Integrative Plant Biology 2009, 51, 553–561. [Google Scholar] [CrossRef] [PubMed]
- Burgel, L.; Hartung, J.; Schibano, D.; Graeff-Hönninger, S. Impact of different phytohormones on morphology, yield and cannabinoid content of Cannabis sativa L. Plants 2020, 9, 725. [Google Scholar] [CrossRef] [PubMed]
- Mansouri, H.; Salari, F.; Asrar, Z. Ethephon application stimulats cannabinoids and plastidic terpenoids production in Cannabis sativa at flowering stage. Industrial Crops and Products 2013, 46, 269–273. [Google Scholar] [CrossRef]
- McCaskill, D.; Croteau, R. Monoterpene and sesquiterpene biosynthesis in glandular trichomes of peppermint (Mentha x piperita) rely exclusively on plastid-derived isopentenyl diphosphate. Planta 1995, 197, 49–56. [Google Scholar] [CrossRef]
- McCaskill, D.; Gershenzon, J.; Croteau, R. Morphology and monoterpene biosynthetic capabilities of secretory cell clusters isolated from glandular trichomes of peppermint (Mentha piperita L.). Planta 1992, 187, 445–454. [Google Scholar] [CrossRef]
- Farmer, E.E.; Caldelari, D.; Pearce, G.; Walker-Simmons, M.K.; Ryan, C.A. Diethyldithiocarbamic acid inhibits the octadecanoid signaling pathway for the eound induction of proteinase inhibitors in tomato leaves. Plant Physiology 1994, 106, 337–342. [Google Scholar] [CrossRef]
- Li, Y.; Qiu, L.; Zhang, Q.; Zhuansun, X.; Li, H.; Chen, X.; Krugman, T.; Sun, Q.; Xie, C. Exogenous sodium diethyldithiocarbamate, a jasmonic acid biosynthesis inhibitor, induced resistance to powdery mildew in wheat. Plant Direct 2020, 4, e00212. [Google Scholar] [CrossRef]
- Yu, S.-M. Cellular and Genetic Responses of Plants to Sugar Starvation. Plant Physiology 1999, 121, 687–693. [Google Scholar] [CrossRef]
- Liu, T.; Arsenault, J.; Vierling, E.; Kim, M. Mitochondrial ATP synthase subunit d, a component of the peripheral stalk, is essential for growth and heat stress tolerance in Arabidopsis thaliana. The Plant Journal 2021, 107, 713–726. [Google Scholar] [CrossRef]
- Fatland, B.L.; Nikolau, B.J.; Wurtele, E.S. Reverse genetic characterization of cytosolic acetyl-CoA generation by ATP-citrate lyase in Arabidopsis. The Plant Cell 2005, 17, 182–203. [Google Scholar] [CrossRef]
- Sun, X.; Fu, T.; Chen, N.; Guo, J.; Ma, J.; Zou, M.; Lu, C.; Zhang, L. The stromal chloroplast Deg7 protease participates in the repair of photosystem II after photoinhibition in Arabidopsis. Plant Physiology 2010, 152, 1263–1273. [Google Scholar] [CrossRef] [PubMed]
- Harshavardhan, V.T.; Van Son, L.; Seiler, C.; Junker, A.; Weigelt-Fischer, K.; Klukas, C.; Altmann, T.; Sreenivasulu, N.; Bäumlein, H.; Kuhlmann, M. AtRD22 and AtUSPL1, members of the plant-specific BURP domain family involved in Arabidopsis thaliana drought tolerance. PLOS ONE 2014, 9, e110065. [Google Scholar] [CrossRef] [PubMed]
- Garrido, J.; Rico, S.; Corral, C.; Sánchez, C.; Vidal, N.; Martínez-Quesada, J.J.; Ferreiro-Vera, C. Exogenous application of stress-related signaling molecules affect growth and cannabinoid accumulation in medical cannabis (Cannabis sativa L.). Frontiers in Plant Science 2022, 13. [Google Scholar] [CrossRef] [PubMed]
- Aerts, N.; Pereira Mendes, M.; Van Wees, S.C.M. Multiple levels of crosstalk in hormone networks regulating plant defense. The Plant Journal 2021, 105, 489–504. [Google Scholar] [CrossRef]
- Jiang, C.-J.; Shimono, M.; Sugano, S.; Kojima, M.; Liu, X.; Inoue, H.; Sakakibara, H.; Takatsuji, H. Cytokinins act synergistically with salicylic acid to activate defense gene expression in rice. Molecular Plant-Microbe Interactions® 2013, 26, 287–296. [Google Scholar] [CrossRef]
- Zhang, X.; Liu, D.; Gao, D.; Zhao, W.; Du, H.; Qiu, Z.; Huang, J.; Wen, P.; Wang, Y.; Li, Q.; et al. Cytokinin confers brown planthopper resistance by elevating jasmonic acid pathway in rice. International Journal of Molecular Sciences 2022, 23, 5946. [Google Scholar] [CrossRef]
- An, L.; Zhou, Z.; Yan, A.; Gan, Y. Progress on trichome development regulated by phytohormone signaling. Plant Signaling & Behavior 2011, 6, 1959–1962. [Google Scholar] [CrossRef]
- Berhin, A.; Nawrath, C.; Hachez, C. Subtle interplay between trichome development and cuticle formation in plants. New Phytologist 2022, 233, 2036–2046. [Google Scholar] [CrossRef]
- Livingston, S.J.; Bae, E.J.; Unda, F.; Hahn, M.G.; Mansfield, S.D.; Page, J.E.; Samuels, A.L. Cannabis glandular trichome cell walls undergo remodeling to store specialized metabolites. Plant and Cell Physiology 2021, 62, 1944–1962. [Google Scholar] [CrossRef] [PubMed]
- Haslam, T.M.; Mañas-Fernández, A.; Zhao, L.; Kunst, L. Arabidopsis ECERIFERUM2 is a component of the fatty acid elongation machinery required for fatty acid extension to exceptional lengths. Plant Physiology, 2012; 160, 1164–1174. [Google Scholar] [CrossRef]
- Hegebarth, D.; Buschhaus, C.; Wu, M.; Bird, D.; Jetter, R. The composition of surface wax on trichomes of Arabidopsis thaliana differs from wax on other epidermal cells. The Plant Journal 2016, 88, 762–774. [Google Scholar] [CrossRef] [PubMed]
- Hegebarth, D.; Buschhaus, C.; Joubès, J.; Thoraval, D.; Bird, D.; Jetter, R. Arabidopsis ketoacyl-CoA synthase 16 (KCS16) forms C36/C38 acyl precursors for leaf trichome and pavement surface wax. Plant, Cell & Environment 2017, 40, 1761–1776. [Google Scholar] [CrossRef]
- Jessen, D.; Roth, C.; Wiermer, M.; Fulda, M. Two activities of long-chain acyl-coenzyme A synthetase are involved in lipid trafficking between the endoplasmic reticulum and the plastid in Arabidopsis. Plant Physiology 2014, 167, 351–366. [Google Scholar] [CrossRef] [PubMed]
- Schnurr, J.A.; Shockey, J.M.; de Boer, G.-J.; Browse, J.A. Fatty acid export from the chloroplast. Molecular characterization of a major plastidial acyl-coenzyme A synthetase from Arabidopsis. Plant Physiology 2002, 129, 1700–1709. [Google Scholar] [CrossRef] [PubMed]
- Schnurr, J.; Shockey, J.; Browse, J. The acyl-CoA synthetase encoded by LACS2 is essential for normal cuticle development in Arabidopsis. The Plant Cell 2004, 16, 629–642. [Google Scholar] [CrossRef] [PubMed]
- Liu, D.; Gong, Q.; Ma, Y.; Li, P.; Li, J.; Yang, S.; Yuan, L.; Yu, Y.; Pan, D.; Xu, F.; et al. cpSecA, a thylakoid protein translocase subunit, is essential for photosynthetic development in Arabidopsis. Journal of Experimental Botany 2010, 61, 1655–1669. [Google Scholar] [CrossRef]
- Summer, E.J.; Cline, K. Red bell pepper chromoplasts exhibit in vitro import competency and membrane targeting of passenger proteins from the thylakoidal sec and ΔpH pathways but not the chloroplast signal recognition particle pathway. Plant Physiology 1999, 119, 575–584. [Google Scholar] [CrossRef]
- Xu, X.; Ouyang, M.; Lu, D.; Zheng, C.; Zhang, L. Protein sorting within chloroplasts. Trends in cell biology 2021, 31, 9–16. [Google Scholar] [CrossRef]
- Richardson, L.G.L.; Schnell, D.J. Origins, function, and regulation of the TOC–TIC general protein import machinery of plastids. Journal of Experimental Botany 2019, 71, 1226–1238. [Google Scholar] [CrossRef]
- Kroeger, T.S.; Watkins, K.P.; Friso, G.; van Wijk, K.J.; Barkan, A. A plant-specific RNA-binding domain revealed through analysis of chloroplast group II intron splicing. Proceedings of the National Academy of Sciences 2009, 106, 4537–4542. [Google Scholar] [CrossRef]
- Li, J.; Javed, H.U.; Wu, Z.; Wang, L.; Han, J.; Zhang, Y.; Ma, C.; Jiu, S.; Zhang, C.; Wang, S. Improving berry quality and antioxidant ability in ‘Ruidu Hongyu’ grapevine through preharvest exogenous 2,4-epibrassinolide, jasmonic acid and their signaling inhibitors by regulating endogenous phytohormones. Frontiers in Plant Science 2022, 13. [Google Scholar] [CrossRef]
- Kreuzwieser, J.; Meischner, M.; Grün, M.; Yáñez-Serrano, A.M.; Fasbender, L.; Werner, C. Drought affects carbon partitioning into volatile organic compound biosynthesis in Scots pine needles. New Phytologist 2021, 232, 1930–1943. [Google Scholar] [CrossRef] [PubMed]
- Xu, J.; Van Herwijnen, Z.O.; Dräger, D.B.; Sui, C.; Haring, M.A.; Schuurink, R.C. SlMYC1 regulates type VI glandular trichome formation and terpene biosynthesis in tomato glandular cells. Plant Cell 2018, 30, 2988–3005. [Google Scholar] [CrossRef] [PubMed]
- Chalvin, C.; Drevensek, S.; Dron, M.; Bendahmane, A.; Boualem, A. Genetic control of glandular trichome development. Trends in Plant Science 2020, 25, 477–487. [Google Scholar] [CrossRef] [PubMed]
- Hewavitharana, A.K.; Gloerfelt-Tarp, F.; Nolan, M.; Barkla, B.J.; Purdy, S.; Kretzschmar, T. Simultaneous quantification of 17 cannabinoids in Cannabis inflorescence by liquid chromatography-mass spectrometry. Separations 2022, 9. [Google Scholar] [CrossRef]
- Guo, Q.; Liu, L.; Rupasinghe, T.W.T.; Roessner, U.; Barkla, B.J. Salt stress alters membrane lipid content and lipid biosynthesis pathways in the plasma membrane and tonoplast. Plant Physiology 2022, 189, 805–826. [Google Scholar] [CrossRef]
- Wu, T.; Hu, E.; Xu, S.; Chen, M.; Guo, P.; Dai, Z.; Feng, T.; Zhou, L.; Tang, W.; Zhan, L.; et al. clusterProfiler 4.0: A universal enrichment tool for interpreting omics data. The Innovation 2021, 2. [Google Scholar] [CrossRef]
- Yu, G.; Wang, L.-G.; Han, Y.; He, Q.-Y. clusterProfiler: an R package for comparing biological themes among gene clusters. OMICS: A Journal of Integrative Biology 2012, 16, 284–287. [Google Scholar] [CrossRef]
- Yu, G.; Li, F.; Qin, Y.; Bo, X.; Wu, Y.; Wang, S. GOSemSim: an R package for measuring semantic similarity among GO terms and gene products. Bioinformatics 2010, 26, 976–978. [Google Scholar] [CrossRef]
Figure 1.
Cannabis glandular trichome disc cells were incubated in vitro on plates (n=4) under control conditions over 24 h. Proteome was compared at 24 h versus 0 h (A), and a gene ontology (GO) enrichment analysis identified top biological processes enriched in amongst differentially abundant proteins (B). Trichome cannabinoid content (C) and abundance of key regulatory proteins quantified (D). Significance (denoted by ⍺) by two-sample student’s t-test. Proteins deemed differentially abundant when p-value < 0.05 and when fold-change < 0.67 or > 1.5. Cannabinoids significantly different if p-value < 0.05. Boxplots represent median, interquartile range, maximum and minimum and outliers (closed circles). Abbreviations: CBGA, cannabigerolic acid; THCA, tetrahydrocannabinolic acid; CBCA, cannabichromenic acid; RD22, responsive to dehydration22; DEG7, degp protease 7; ATPd, mitochondrial ATP synthase subunit d; ACLA-1, ATP citrate lyase A-1. Listed in titles are protein names, closest Arabidopsis homolog, and UniProt accession number.
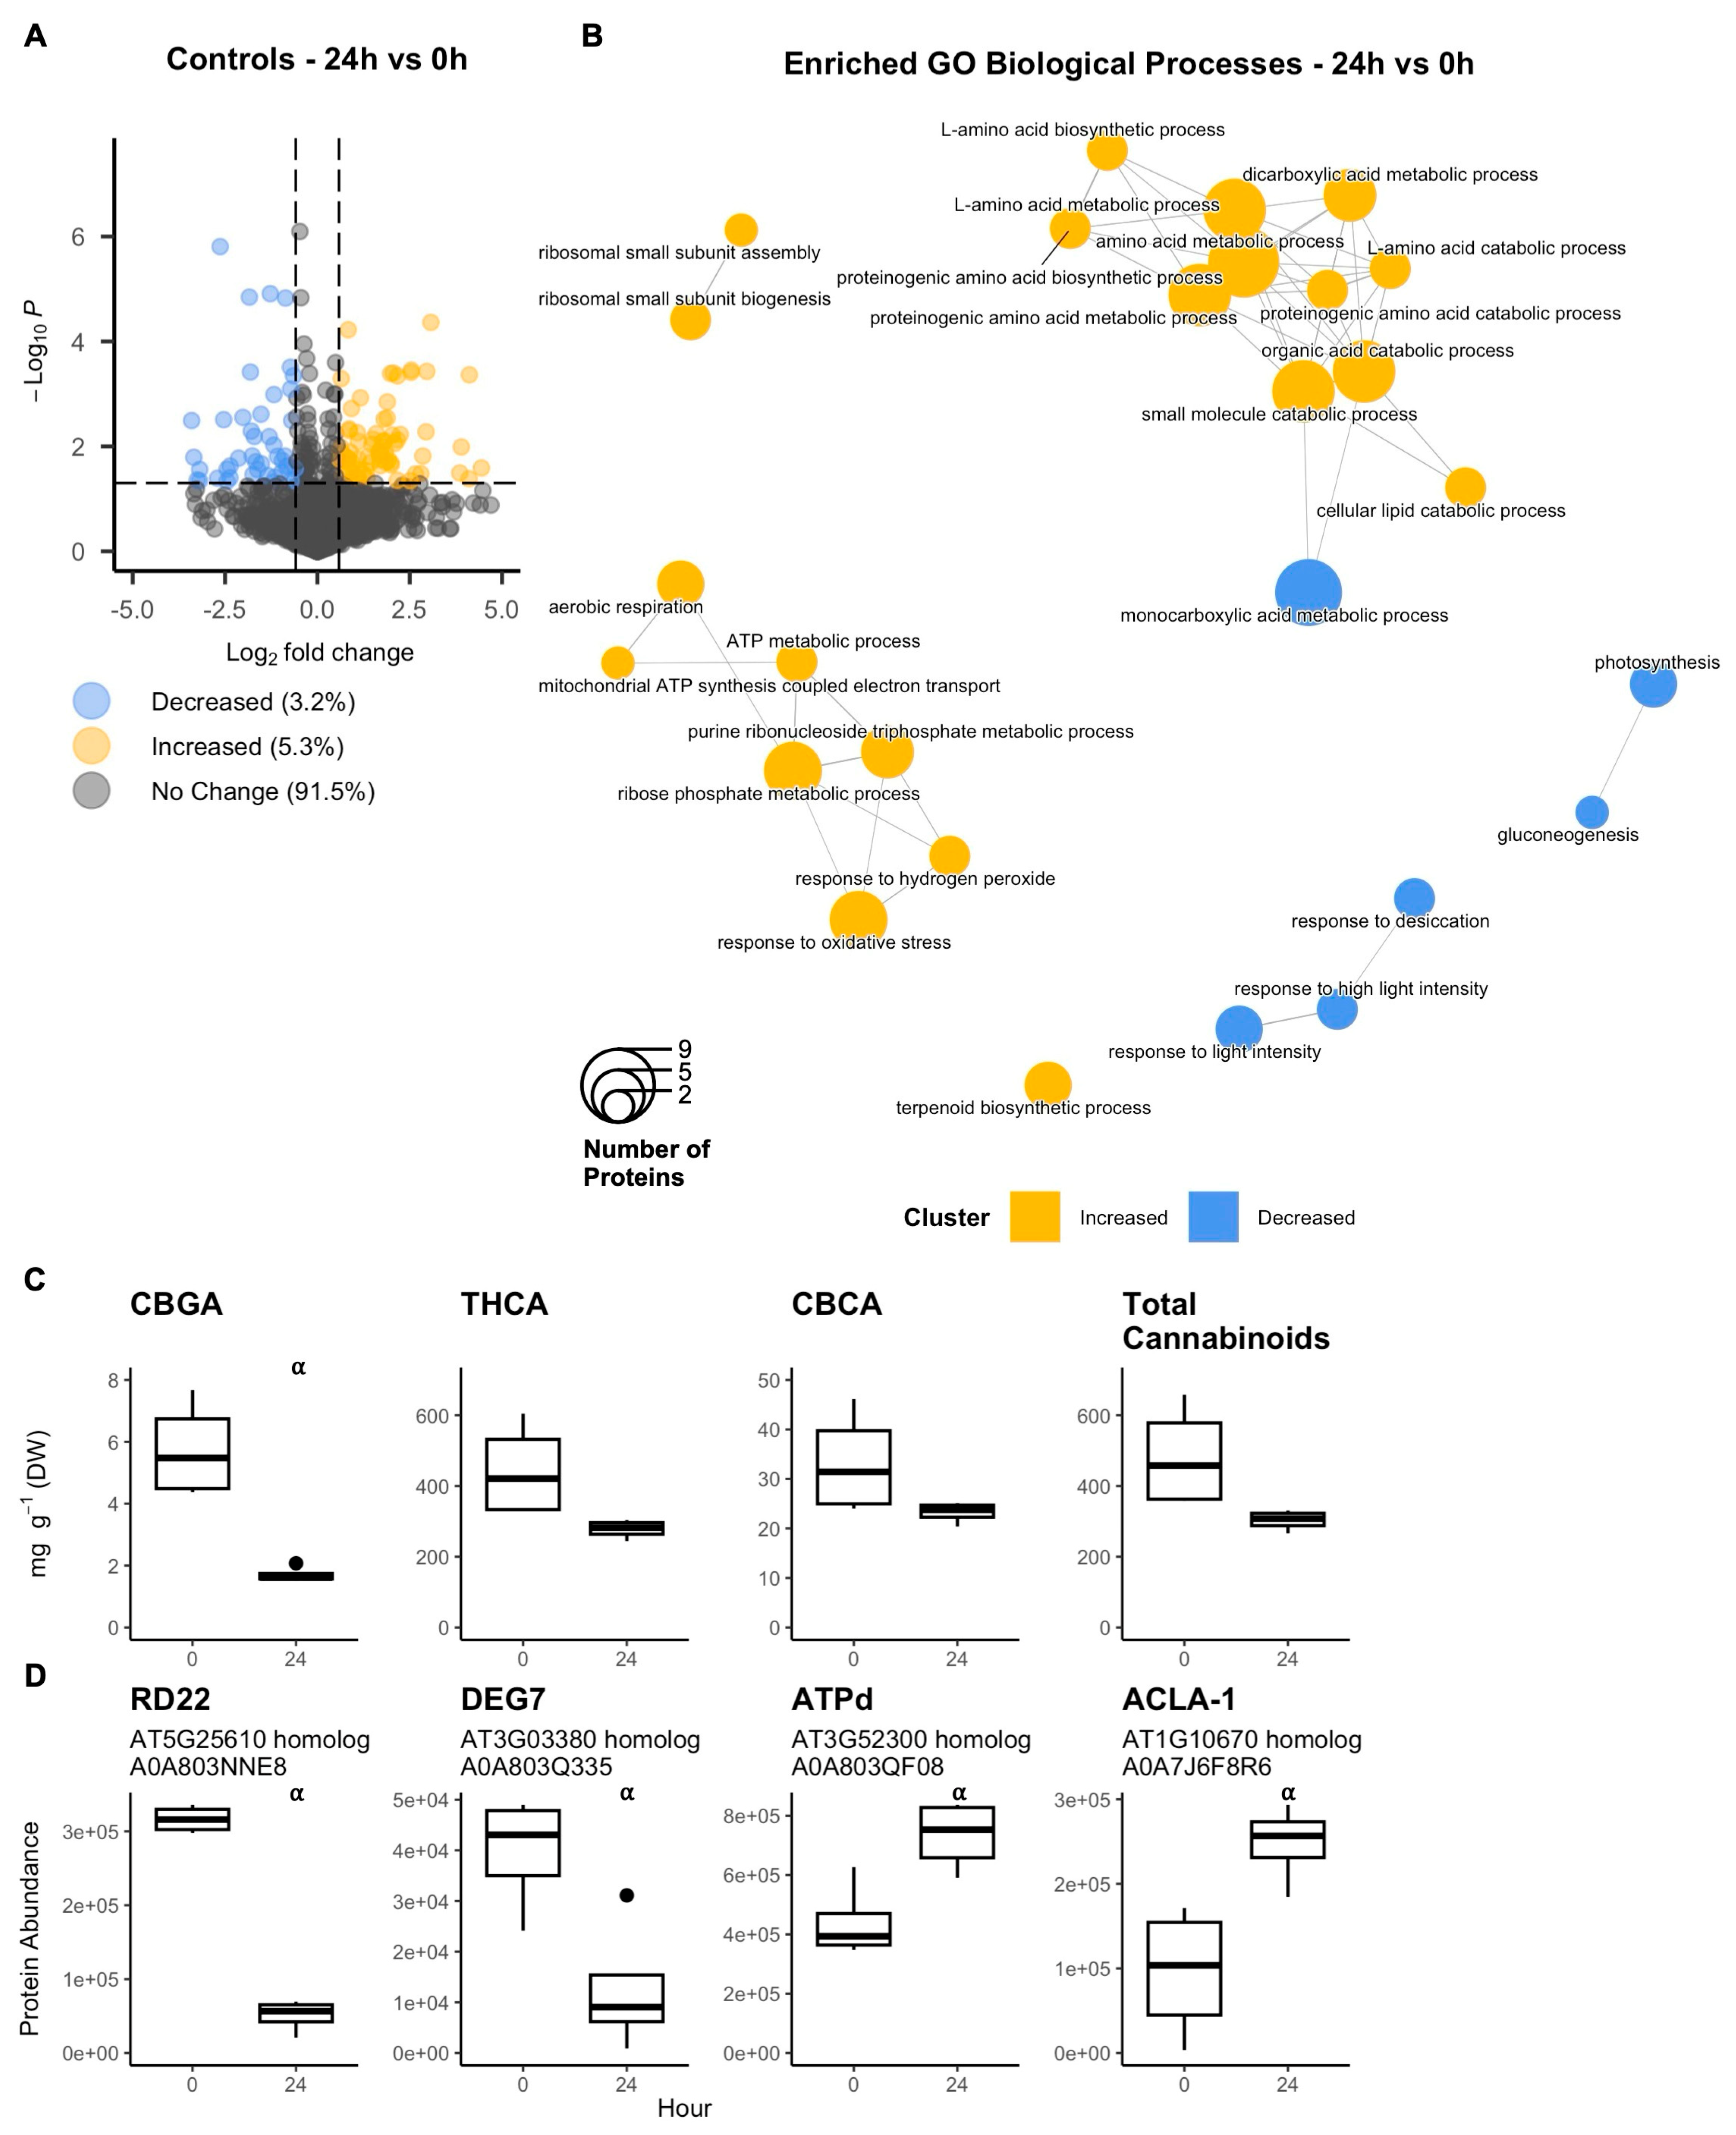
Figure 2.
Cannabis glandular trichome disc cells were incubated in vitro on plates (n=4) for 24 h with different phytohormone treatments and their proteome quantified (1400 proteins). Treatments were separated by principal component analysis (A), and hierarchical clustering (ward’s method) by log2(fold-change) of the differentially abundant proteins (DAPs) (B). Non-significance assigned a log2(FC) of 0. The percent change of the total quantified proteome was tabulated for each phytohormone treatment (C). DAP significant if p < 0.05 and fold-change either < 0.67 or > 1.5). Abbreviations: CTR_0h, 0 h control; CTR_24h, 24 h control; ABA, abscisic acid; BRA, brassinolide; DIE, diethyldithiocarbamate; ETH, ethephon; GA3, gibberellic acid; KIN, kinetin; JAS, jasmonic acid; SAL, salicylic acid.
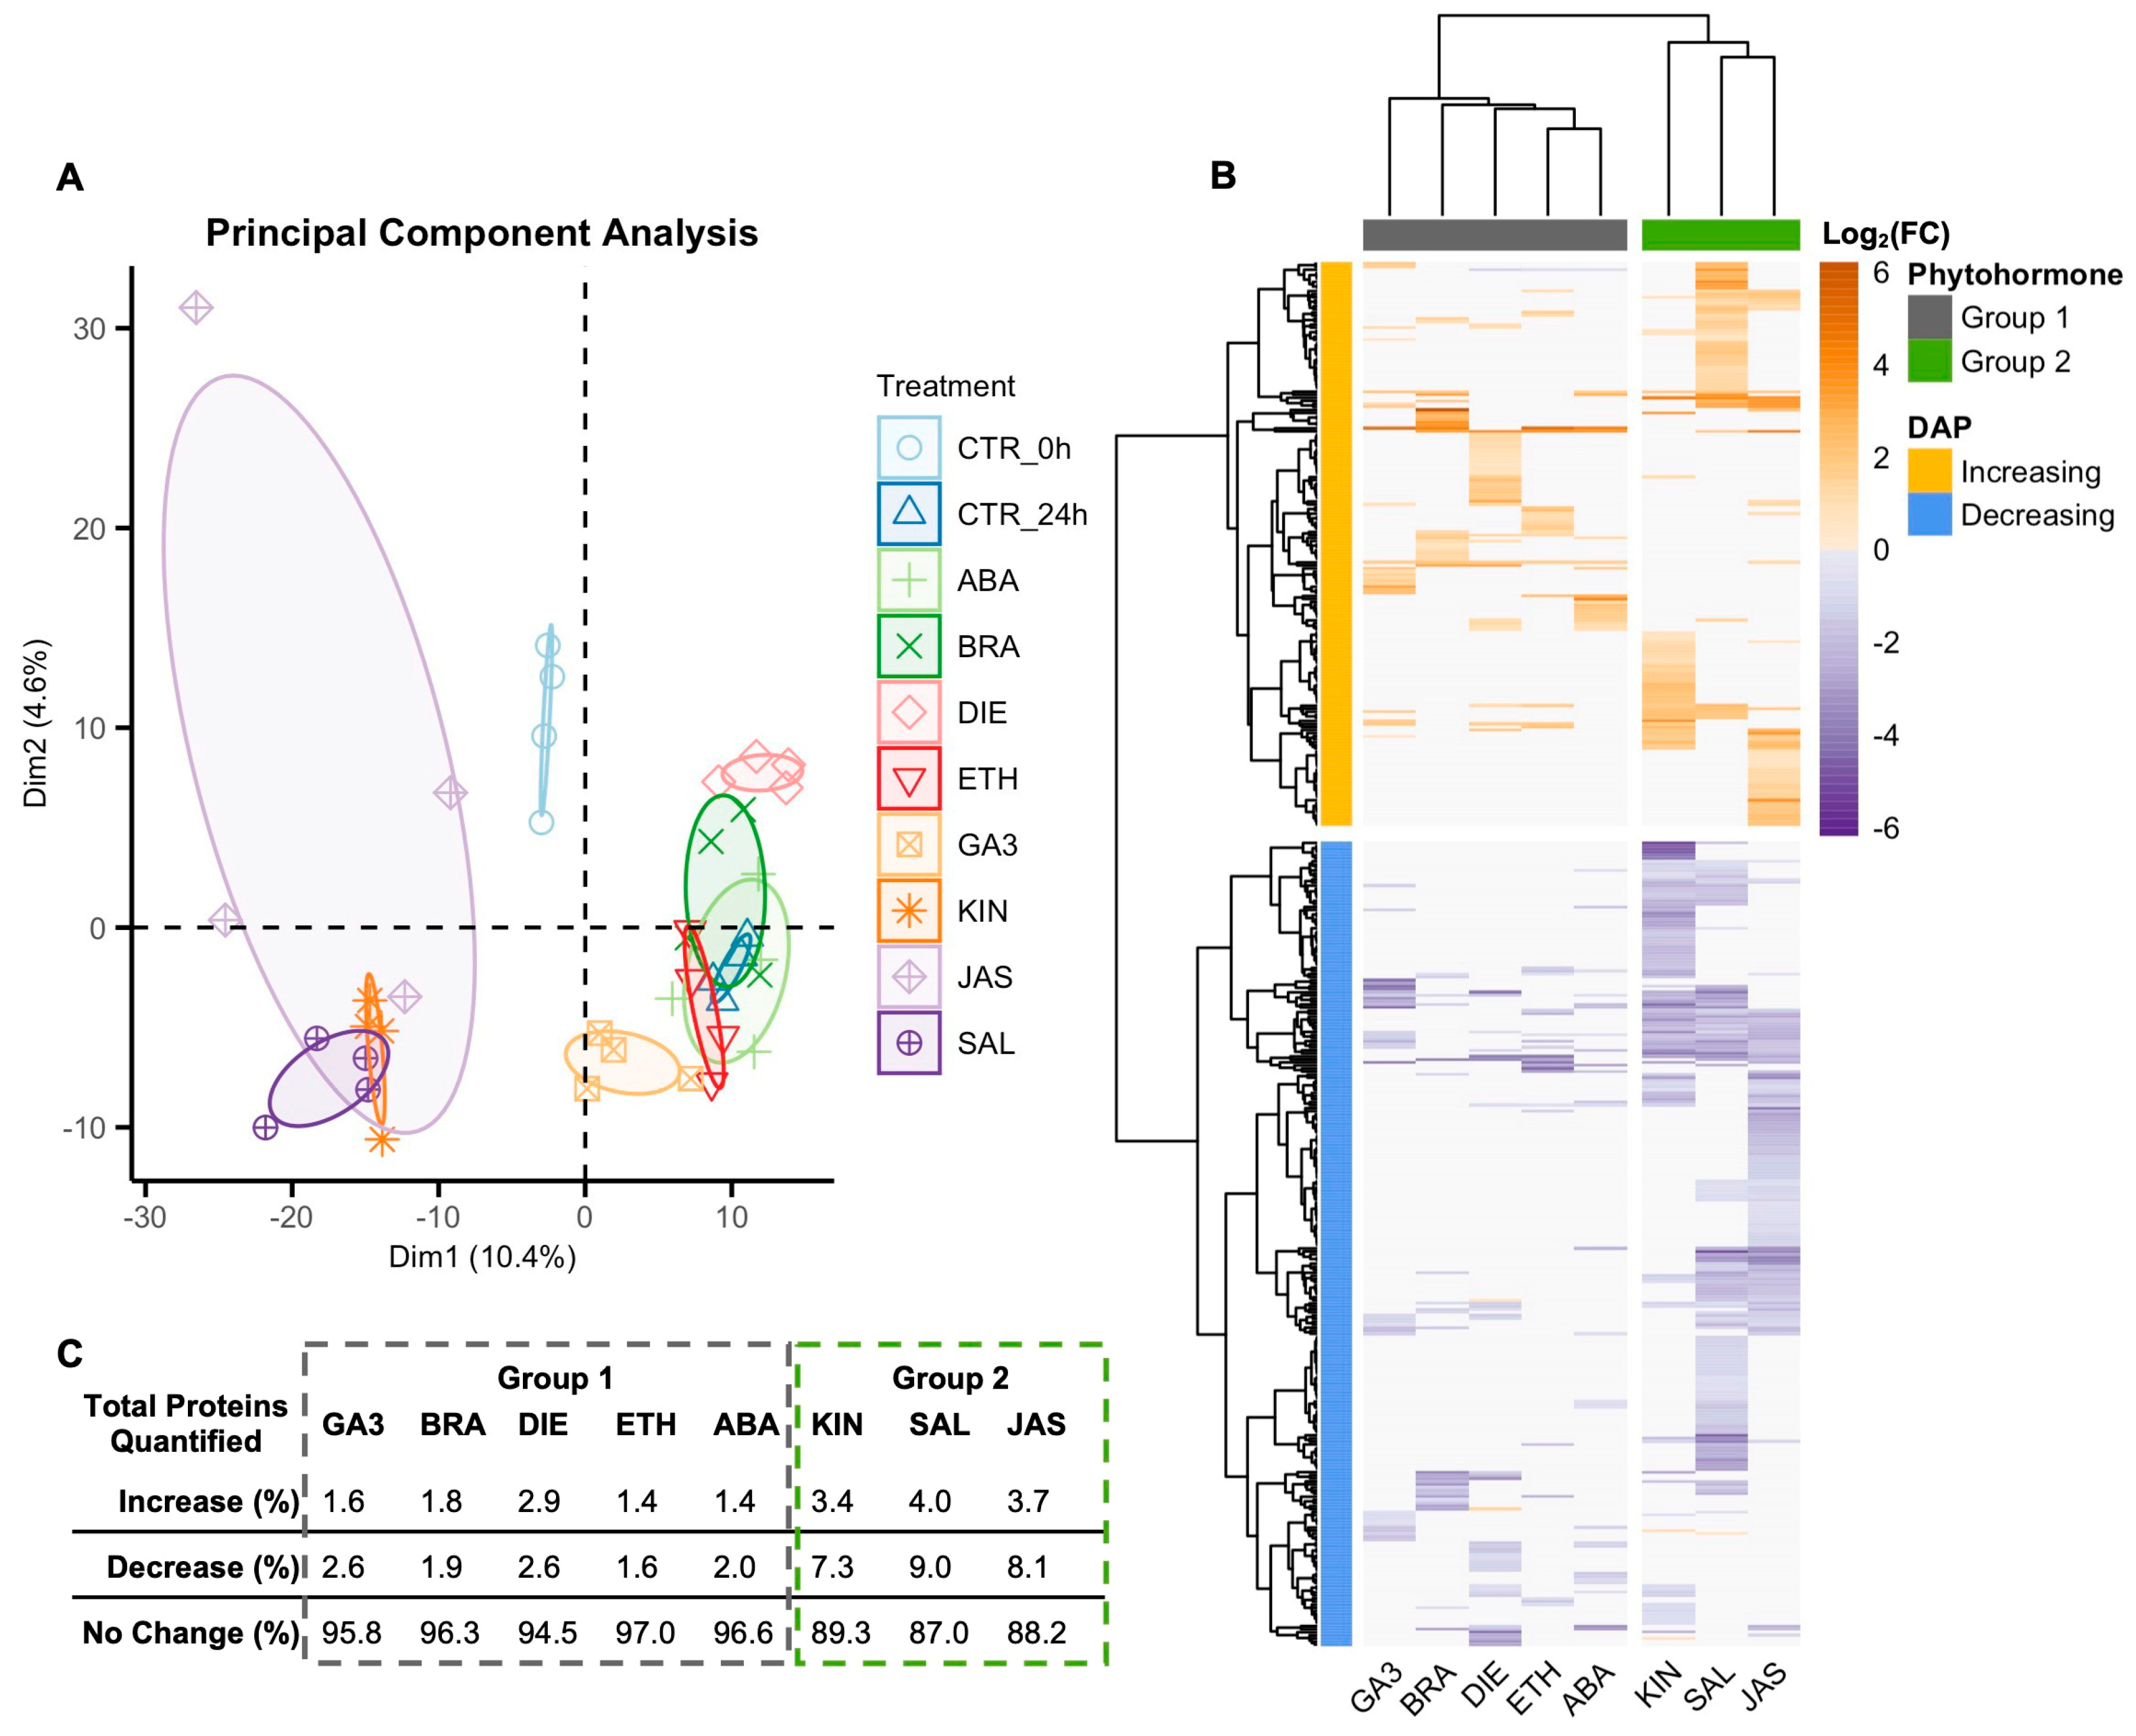
Figure 3.
Gene ontology (GO) enrichment analysis identified enriched biological processes of increasing (A) and decreasing (B) differentially abundant proteins (DAPs) when Cannabis glandular trichome disc cells responded to phytohormones in vitro. Groups that did not enrich for any processes were not shown; no enrichment found for abscisic acid. Go term deemed enriched when p.adjust < 0.05. Count represents number of DAPs associated with GO term. Abbreviations: BRA, brassinolide; DIE, diethyldithiocarbamate; ETH, ethephon; GA3, gibberellic acid; KIN, kinetin; JAS, jasmonic acid; SAL, salicylic acid.
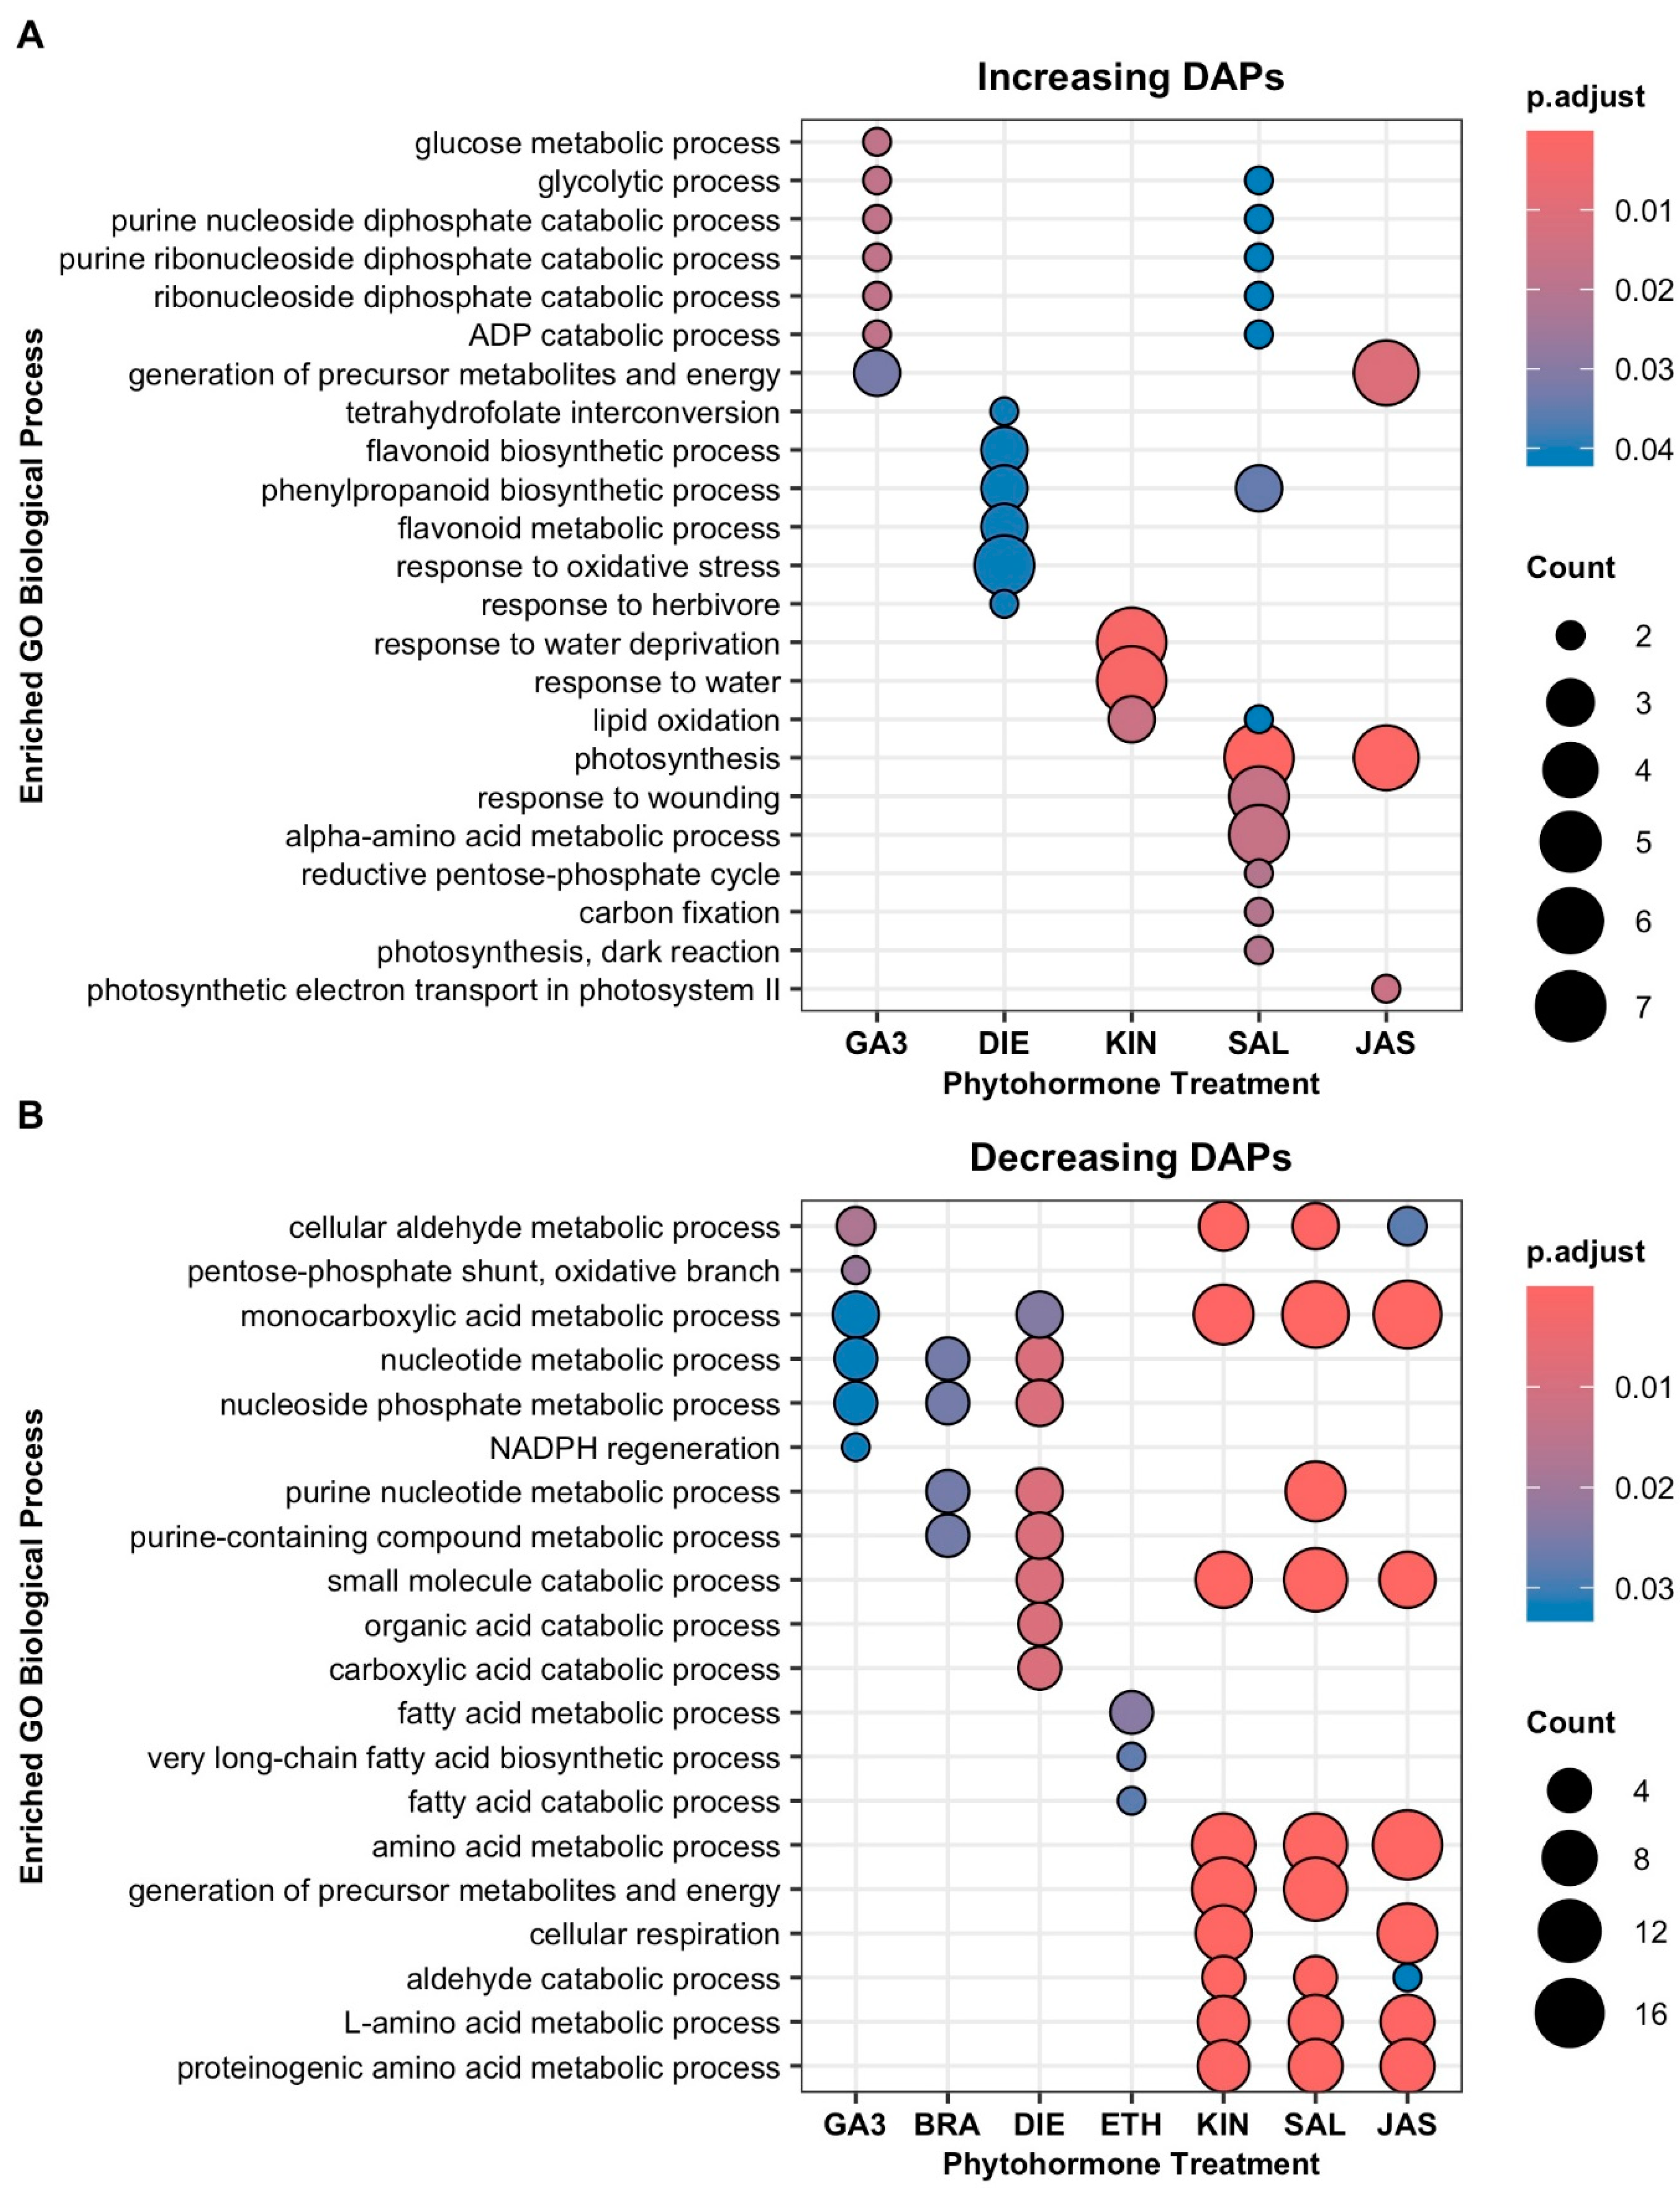
Figure 4.
Hierarchically clustered (Ward’s method) gene cluster semantic similarity analysis of increasing (up) and decreasing (down) differentially abundant proteins when Cannabis glandular trichome disc cells responded to phytohormones in vitro. Similarity analysis used the gene ontology of the closest Arabidopsis homologs of the Cannabis proteins of interest. Abbreviations: ABA, abscisic acid; BRA, brassinolide; DIE, diethyldithiocarbamate; ETH, ethephon; GA3, gibberellic acid; KIN, kinetin; JAS, jasmonic acid; SAL, salicylic acid.
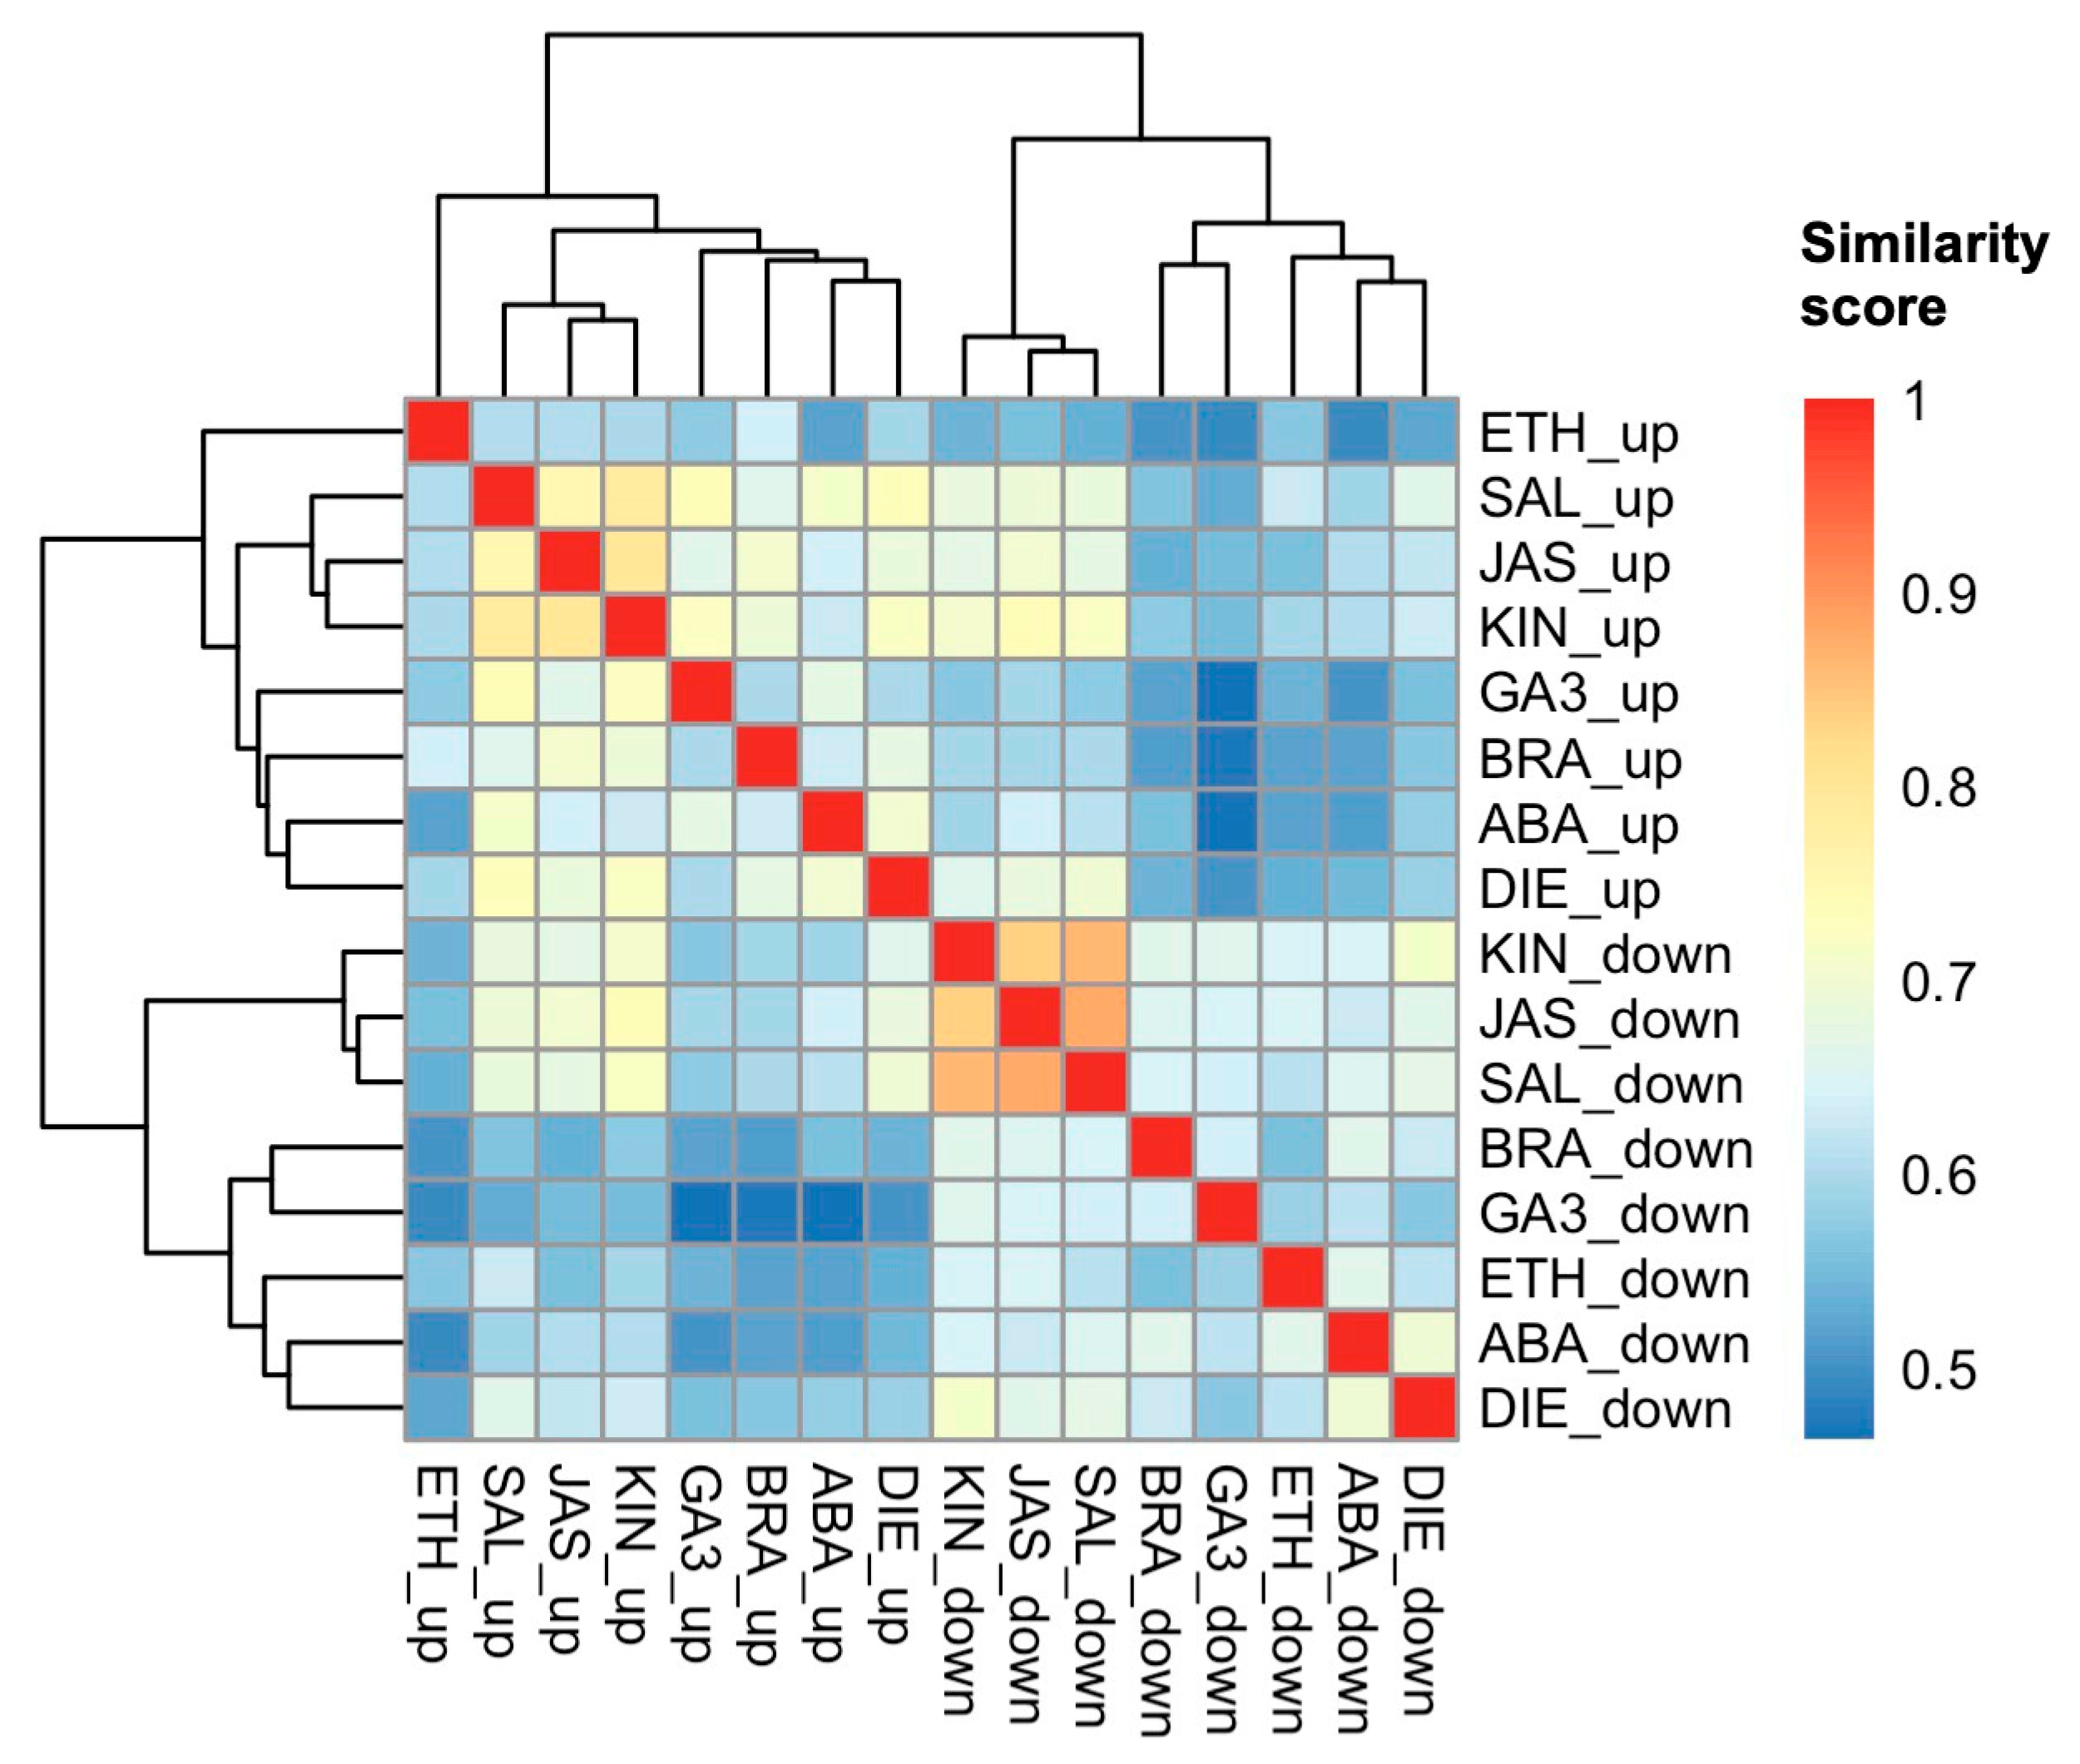
Figure 5.
Comparison of differentially abundant proteins (DAPs) in Cannabis glandular trichome disc cells when treated in vitro (n=4) with either kinetin (KIN), jasmonic acid (JAS) or salicylic acid (SAL). Venn diagrams represent intersecting increasing (A) and decreasing (B) differentially DAPs between KIN, JAS and SAL. Key differentially abundant proteins affected by at least two of the phytohormones included those related to plastidial function (C-E), cytosolic acetyl-CoA synthesis (F), and fatty acid metabolism (G-I). Boxplots represent median, interquartile range, maximum, minimum and outliers (closed circles). Significance (denoted by ⍺) determined by two sample student’s t-test (p-value <0.05) by comparing phytohormone treatments (n=4) to the control (CTR_24h). Abbreviations: WTF1, WHAT’S THIS FACTOR 1; cpSecA, chloroplastic protein translocase subunit SECA1; TIC214, translocon at the inner envelope membrane of chloroplasts 214; ACLA-1, ATP citrate lyase A-1; CER10, very-long chain enoyl-CoA reductase; CER2, eceriferum 2; LACS9, chloroplastic long chain acyl-CoA synthetase 9. Listed in titles are protein names, closest Arabidopsis homolog, and UniProt accession number.
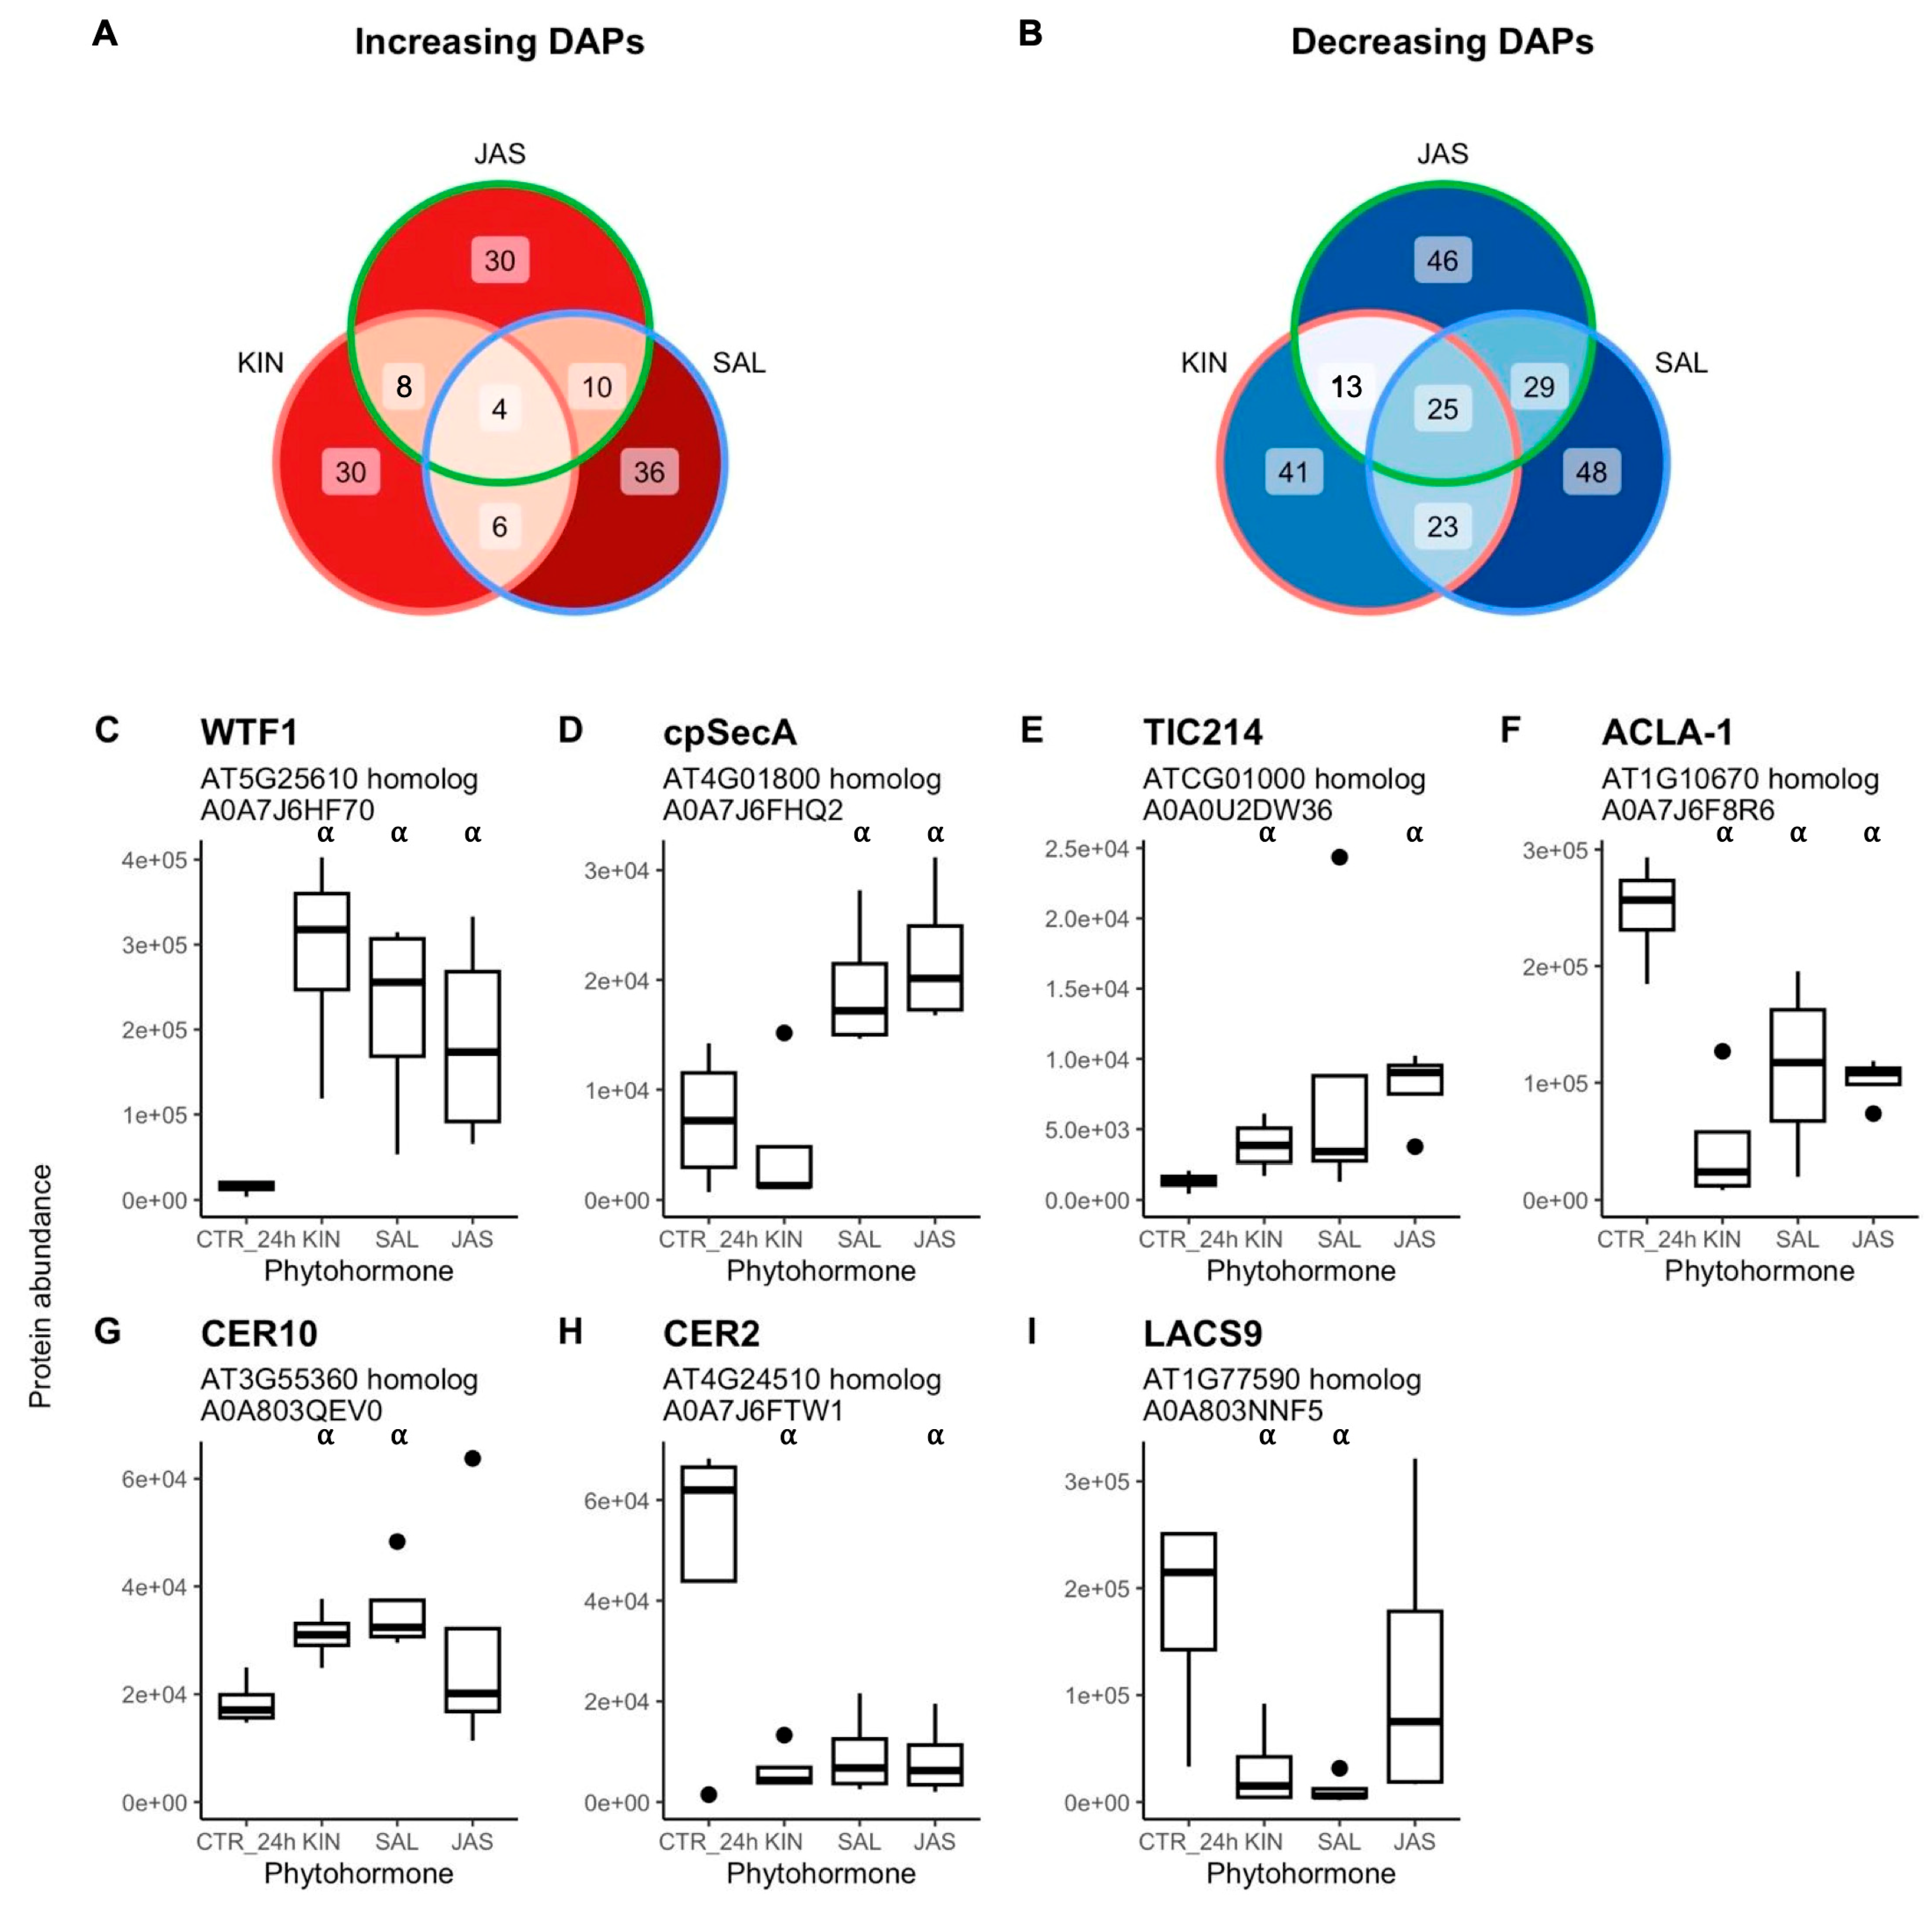
Figure 6.
Cannabinoid [mg g−1 (DW)] content of isolated Cannabis glandular trichome disc cells when treated in vitro with phytohormones (n=4). Boxplots represent median, interquartile range, maximum and minimum and outliers (closed circles). Significance (denoted by ⍺) determined by two-sample student’s t-test (p-value <0.05) by comparing phytohormone treatments to the control (CTR_24h). Abbreviations: CBGA, cannabigerolic acid; THCA, tetrahydrocannabinolic acid; CBCA, cannabichromenic acid; ABA, abscisic acid; BRA, brassinolide; DIE, diethyldithiocarbamate; ETH, ethephon; GA3, gibberellic acid; KIN, kinetin; JAS, jasmonic acid; SAL, salicylic acid.
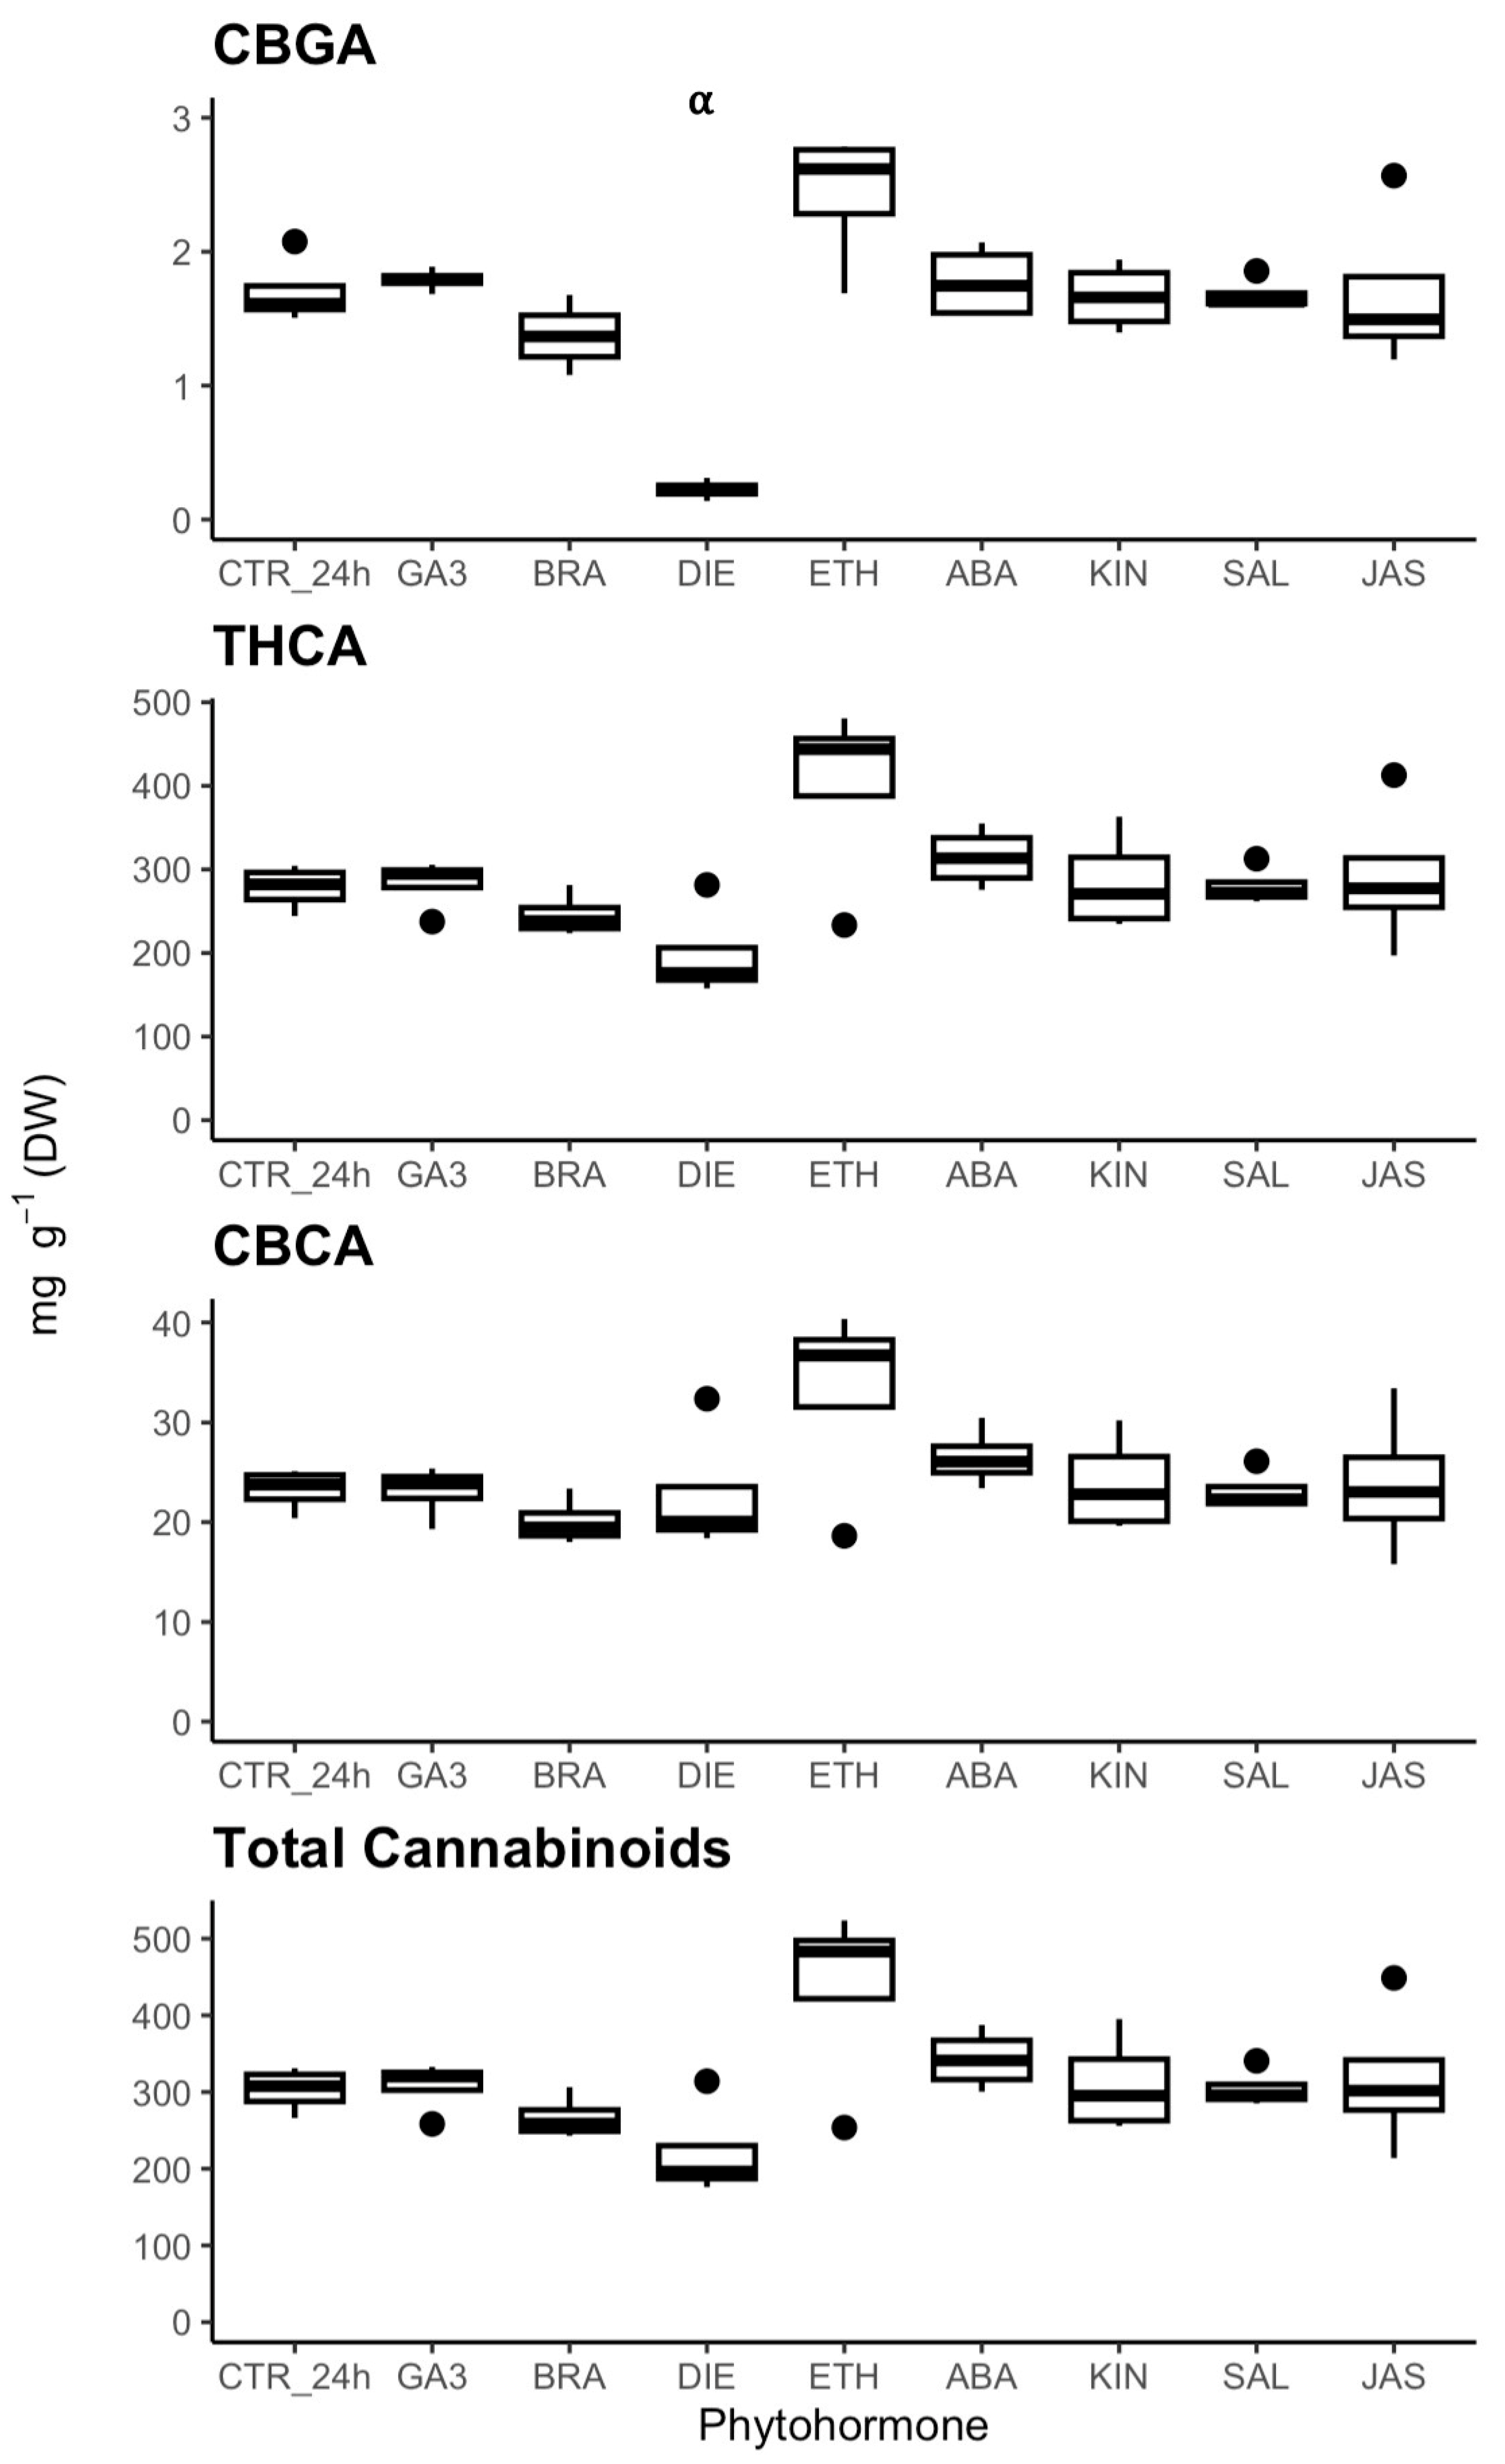
Disclaimer/Publisher’s Note: The statements, opinions and data contained in all publications are solely those of the individual author(s) and contributor(s) and not of MDPI and/or the editor(s). MDPI and/or the editor(s) disclaim responsibility for any injury to people or property resulting from any ideas, methods, instructions or products referred to in the content. |
© 2024 by the authors. Licensee MDPI, Basel, Switzerland. This article is an open access article distributed under the terms and conditions of the Creative Commons Attribution (CC BY) license (http://creativecommons.org/licenses/by/4.0/).
Copyright: This open access article is published under a Creative Commons CC BY 4.0 license, which permit the free download, distribution, and reuse, provided that the author and preprint are cited in any reuse.


