Submitted:
13 November 2024
Posted:
14 November 2024
You are already at the latest version
Abstract
In this study, the effect of nitrite in the short and long term on the anaerobic ammonium oxidation (ANAMMOX) was investigated using granules from a full-scale SBR reactor in operation. In the short term, maximum activity was achieved at 100 mg N-NO2-/L, with higher concentrations being inhibitory. It was determined that the biomass behavior is well interpreted (R2=0.955) by a non-competitive substrate inhibition model (Andrews model) with a KS of 55.6 mg N-NO2-/L and a KI of 116.7 mg N-NO2-/L, while well interpreted too by the Edwards model (R2=0.957) with a KS of 36 mg N-NO2-/L and a KI of 287 mg N-NO2-/L were achieved. In the long term, the biomass retained its Anammox activity at 15 mg N-NO2-/L over a 3 TRH horizon; however, at 30 mg N-NO2-/L, Anammox activity decreased by 50% at the end of the experiment. Finally, the effect of temperature on the activity of the Anammox granules of a different source was studied, revealing that the activity increases with temperature within the range of 25 - 35 °C.
Keywords:
Anammox
; nitrite
; inhibition
; temperature
; kinetic
1. Introduction
The removal of nitrogen in wastewater treatment plants (WWTPs) is crucial to prevent the adverse environmental impacts associated with excess nitrogen, such as eutrophication in aquatic ecosystems [1]. Traditionally, nitrogen removal has been achieved through a two-stage process. The first stage involves nitrification, where ammonia is converted to nitrite and then to nitrate. The second stage, known as denitrification, converts nitrate into gaseous nitrogen, allowing it to escape from the liquid phase into the atmosphere, thereby reducing the nitrogen load in wastewater.
In recent years, increasingly stringent nitrogen discharge regulations have necessitated advancements in nitrogen removal technology. These regulations aim to limit the release of harmful nitrogen compounds into the environment, promoting cleaner water systems. Conventional biological methods, such as nitrification and denitrification, have been widely used in both domestic and industrial wastewater treatment facilities to achieve these goals. However, these traditional processes can be energy-intensive due to the need for aeration and additional carbon sources for effective denitrification, leading to higher operational costs [2].
As a response to these challenges, alternative nitrogen removal methods have been explored. Autotrophic denitrification, performed by bacteria that can oxidize ammonia under anaerobic conditions using nitrite as the final electron acceptor, has emerged as a promising solution. This process, known as Anammox, was first identified in the Netherlands in 1990 and has since gained recognition for its high efficiency in removing nitrogen. Anammox-based processes offer significant advantages over traditional nitrification/denitrification (N/DN) processes, including a theoretical reduction in aeration requirements by 60%, the complete elimination of the need for added organic carbon, and a 90% reduction in sludge generation [2]. These benefits highlight the potential for Anammox technology to revolutionize nitrogen removal in wastewater treatment.
The Anammox process has been particularly used in WWTPs with anaerobic sludge digestion, where 10 - 15% of the nitrogen load is provided by the return line from the centrifuge [3]. Sludge digestion liquid is a common type of wastewater characterized by low C/N ratio. Sludge digestion liquid typically contains 500 – 2.000 mg N-NH4+/L and approximately 500 – 1.200 mg/L organic matter with limited biodegradability. With a pH range of 7.0 – 8.5 and temperatures typically between 30 – 37 ◦C, sludge liquid provides optimal growth conditions for anammox bacteria and Ammonia-Oxidizing Bacteria (AOB) due to its high alkalinity and temperature [4]. Since anammox bacteria require nitrite to carry out their metabolism, it is necessary for AOB to develop alongside them to produce the required nitrite from ammonia. Depending on the system configuration, the production of nitrite from ammonia can occur in the same reactor where the anammox bacteria are located or in a preceding stage [5]. When both AOB and Anammox are incorporated into the same reactor, it is referred to as a partial nitrification-Anammox reactor, which operates with aeration periods where AOB are active, followed by anoxic periods where Anammox bacteria are activated and consume residual ammonia and newly formed nitrite. The AOB activity generates protons, thus a high degree of alkalinity is desirable to prevent dramatic pH drops in the reactor, that could affect the performance of the Anammox, since their optimal pH is between 7 - 8 [6].
In contrast to its potential, Anammox bacteria are sensitive to multiple environmental conditions such as the C/N ratio and the presence of heavy metals [7]. Among the most critical parameters is the concentration of nitrite, one of its substrates, which can on the one hand prove limiting if its concentration is lower than the saturation constant for Anammox and on the other hand exert inhibitory effects both in the short and long term [8], sometimes becoming irreversible if its concentration is too high. All of this contributes to the instability of the process, which, combined with the slow duplication rate of Anammox (10 - 14 days), can lead to significant reductions in nitrogen removal as well as extensive recovery times for activity.
Literature review reveals a variety of studies on the inhibitory effect that nitrite may have on Anammox bacteria; however, these studies differ in methodology employed, as well as in the characteristics of the inoculum (intact granules, disaggregated granules, flocculent, or biofilm) and their origin (laboratory UASB, SBR, MBBR, etc). Likewise, different studies do not agree on the inhibitory nitrite concentration. It has been reported that a concentration of 100 mg N-NO2-/L is sufficient to inhibit Anammox activity in the short term [9]. However, other experiments have shown that Anammox activity increases up to 160 mg N-NO2-/L, with inhibition starting at 400 mg N-NO2-/L [6]. In another report, it is stated that inhibition begins at 103 mg N-NO2-/L, reaching IC50 at 185 mg N-NO2-/L [10]. In the same way, the published results on the saturation constant of Anammox bacteria for nitrite show strong divergences.
In addition to the above, there are other parameters that show a significant and rapid influence on the performance of biological systems such as pH and temperature. Regarding the latter, there are reports indicating that Anammox biomass increases its activity by around 30% for every 5 °C in the range of 25 - 35 °C [11]. Another study mentions that SAA increases by between 8.7% and 12.5% for each 1 °C increase in process temperature [12].
In the literature, there are different approaches to represent the kinetics of bacteria in relation to varying substrate concentrations. One of these approaches is the Andrews model [13], which is an empirical model that aims to interpret the behavior of microorganisms with respect to their limiting substrate. Like the Monod case, which has a close formal relationship with the Michaelis-Menten expression for enzymes, the Andrews model is based on the mathematical expression proposed by Haldane, which links enzyme activity to substrate concentration while accounting for the inhibitory effect of high substrate concentrations. Boon and Laudelot [14] were the first to successfully apply kinetic models originally proposed for enzymes to cases of microbial inhibition. Specifically, they demonstrated that Nitrobacter winogradskyi exhibits non-competitive inhibition kinetics in its rate of nitrite oxidation. Another interesting model is the Edwards model [15], a semi-empirical model that considers the effects of substrate-controlled diffusion (thus applicable in cases where diffusional constraints are presumed), as well as the impact of substrate limitation due to affinity and inhibition on the microorganism. The fitting of the Andrews and Edwards models has been previously applied to Anammox-based nitrogen removal systems by [12], yielding an R2 greater than 0.92 for both cases.
In this work, the inhibitory effects of nitrite on Specific Anammox Activity are studied in both the short and long term. Data generated from short-term experiments will be used as input for fitting the kinetic models of Andrews and Edwards. Additionally, the short-term effect of temperature on Specific Anammox Activity will also be investigated.
2. Materials and Methods
The Anammox granular biomass was provided by the Mapocho-Trebal Biofactory of Aguas Andinas in Santiago de Chile. The biomass comes from a partial nitritation-Anammox reactor that treats a secondary line with high levels of ammonia. Once collected, it was stored at 5°C until use. For the temperature study trials, granular anammox biomass from the La Farfana Biofactory of Aguas Andinas in Santiago, Chile, was used.
2.1. Specific Anammox Activity (SAA)
The activity assays were conducted based on a modified version of the method described by [16]. 120 mL vials with a liquid volume of 70 mL were used for the assays. Each vial was inoculated with granular sludge previously washed and resuspended in phosphate buffer (0.14 g/L KH2PO4 and 0.75 g/L K2HPO4). The vial was sealed with a stopper, and both the liquid phase and headspace of the vial were gassed with argon for 10 minutes. To activate the sludge, the vial was incubated for 45 minutes in a shaker at 200 rpm and 30°C. Then, a concentrated solution of N-NH4+ and N-NO2- with a defined concentration according to the specific experiment was injected. Ammonium chloride was used as the ammonium source, and sodium nitrite was used as the nitrite source. After substrate addition, the vial was incubated at 30 °C and 200 rpm, and the evolution of pressure in the vial headspace, an indirect measure of N2 production resulting from Anammox activity of the granules, was recorded. The duration of the assay depended on the sludge activity. The rate of gaseous N2 production was obtained assuming that the gas confined in the headspace of the vial behaves as an ideal gas. Thus, for constant volume and temperature, each recorded pressure value corresponds to a certain number of moles of N2 produced. SAA is calculated as described by [16], where SAA is equivalent to the maximum rate of N2 production (in mg/h) divided by the amount of biomass (gSSV) in the vial.
To evaluate the short-term effect of nitrite, batch assays were conducted with a constant initial ammonium concentration of 200 mg N/L and nitrite concentrations ranging from 5 to 250 mg N/L. Each assay was performed in duplicate.
2.2. Kinetic Model Fitting
The results obtained for SAA at different nitrite concentrations in the short-term experiment were fitted to two kinetic models: the Andrews model and the Edwards model. Equation (1) shows the mathematical expression corresponding to the Andrews model, which is a non-competitive substrate inhibition equation:
where corresponds to the theoretical maximum Anammox specific activity (mgN eliminated/gSSV*h), KS is the saturation constant (mg N-NO2-/L), KI is the inhibition constant (mg N-NO2-/L), and S is the nitrite concentration (mg N-NO2-/L).
The values of the parameters , KS, and KI were estimated using the GRG Nonlinear method provided by Solver (Microsoft Excel for Office 365 MCO), minimizing the error according to the least squares method.
Equation (2) shows the mathematical expression for the Edwards model.
where corresponds to the theoretical maximum Anammox specific activity (mgN eliminated/gSSV*h), KS is the saturation constant (mg N-NO2-/L), KI is the inhibition constant (mg N-NO2-/L), and S is the nitrite concentration (mg N-NO2-/L).
The parameter values in the Edwards model were estimated using the same method as for the Andrews model.
2.3. Extended Nitrite Exposure Experiments
The extended exposure experiments were carried out in a 2 L useful volume sequential batch reactor (SBR). The temperature was controlled at 30 ± 1 °C using a heat exchanger. The pH was manually adjusted to remain between 7.4 - 8 by adding a 2 M NaOH solution or a 1 M HCl solution, as needed. Complete mixing inside the reactor was achieved with a mechanical stirrer at a rotation speed of 200 rpm. Pump control and different operational cycles were managed by a PLC. The reactor operated in cycles of 8 hours, organized into 4 periods: feeding (10 min), mixing (420 min), settling (40 min), and discharge (10 min). The reactor was inoculated with sludge from nitritation-Anammox reactor of Aguas Andinas, reaching a concentration of 0.5 gSSV/L at the beginning of the experiment. The hydraulic retention time (HRT) used was constant and equal to 32 hours. The reactor startup took 3 weeks to reach a steady state.
Once steady state was reached in the reactor, the extended nitrite exposure experiments were initiated. These consisted of subjecting the sludge present in the reactor at the beginning of each cycle, for 3 HRTs, to a defined nitrite concentration. To ensure this condition, a sample was taken at the end of each cycle, and the feed concentration for the next cycle was adjusted if necessary. At the beginning and end of each experiment (at the beginning and after 3 HRTs), the SAA of the sludge was measured, and significant changes in its value were evaluated. If there were no changes at the initial nitrite concentration studied, that experiment was concluded, and a new one was initiated at a higher concentration. The initial nitrite values studied were 15 mg N-NO2-/L and 30 mg N-NO2-/L. To replicate the typical concentration to which the granules were exposed in the reactor from which they originated, the ammonium concentration in the feed was modified as necessary to achieve an N-NH4+ concentration in the reactor vicinity of 200 mg N-NH4+ /L.
2.4. Analytical Methods
Ammonium was quantified spectrophotometrically using the phenol-hypochlorite method [17]. Nitrite and nitrate were quantified spectrophotometrically according to standard methods. Biomass concentration was measured as volatile suspended solids (gSSV/L) in accordance with standard methods.
3. Results and Discussion
3.1. Short-Term Nitrite Effect
The results obtained from the assays aimed at characterizing the response of SAA to short-term nitrite exposure are presented in Figure 1.
The maximum Specific Anammox Activity within the studied range was achieved at 100 mg N-NO2-/L, yielding a value of 12.2 mg N eliminated/(gSSV*h). Higher concentrations had a detrimental effect on the SAA of the Anammox biomass, with an IC60 observed at 250 mg N-NO2-/L. Similar behavior is reported by [18], where activity tests were conducted with three types of biomasses: biofilm, granular, and flocculent from MMBR, UASB, and SBR reactors at laboratory scale, respectively. For biofilm biomass, the maximum SAA was obtained at 40 mg N-NO2-/L, while the IC50 was obtained at 85 mgN-NO2-/L, values significantly lower than those found in this study. For flocculent biomass, the maximum SAA was achieved at 81 mg N-NO2-/L and the IC50 at 98 mg N-NO2-/L, which, although approaching in terms of maximum SAA, still significantly differs from the IC50 found in this study. In the case of granular biomass from a UASB reactor, the maximum SAA was achieved at 83 mg N-NO2-/L and the IC50 at 240 mg N-NO2-/L, which is very similar to the values obtained. This is an interesting fact as it supports the idea that the biomass behavior is mainly influenced by its structure rather than the type of reactor and cultivation mode. Another case is presented by [10], where the SAA was evaluated for granular biomass and suspended biomass, resulting in the maximum activity obtained at 103 mg N-NO2-/L and the IC50 corresponding to 185 mg N-NO2-/L for the granular biomass. Additionally, the study by [16] reports a maximum SAA at 140 mg N-NO2-/L and an IC50 at 350 mg N-NO2-/L. Differences may arise from the different origin of the granules, as well as their varying diameters, as previously reported [19].
With regards to fitting the experimental data to the kinetic model of non-competitive substrate inhibition proposed by Andrews, it was found that the best fit (R2=0.955) was obtained for , KS, and KI values of 25 mg N/(gSSV·h), 55.6 mg N-NO2-/L, and 116.7 mg N-NO2-/L, respectively. As shown in Figure 1, overall, the model interprets the biomass behavior in response to nitrite concentration within the evaluated range, except for the value of 100 mg N-NO2-/L where the error is significant. According to the model, the maximum activity (dSAA/dS=0) is achieved at 80.6 mg N-NO2-/L, and half of this activity is obtained at 15.3 mg N-NO2-/L. Furthermore, extrapolating the data suggests that the IC50 is reached at approximately 423.8 mg N-NO2-/L.
Regarding the fit of the experimental data to the Edwards inhibition model, the best fit (R² = 0.957) was obtained with an of 17.2 mg N eliminated/(gSSV*h), a KS of 36 mg N-NO2-/L, and a KI of 287 mg N-NO2-/L. When calculating the maximum value of the Edwards model function, it is found to be 85 mg N-NO2-/L, while half of this activity is achieved at 17.5 mg N-NO2-/L. Similarly to the Andrews model, when extrapolating the data, it is found that the IC50 is reached at a nitrite concentration of 321 mg N-NO2-/L.
Both the Andrews and Edwards models presented a good fit to the experimental data. However, the values of the kinetic constants for both models differ significantly. Regarding the comparison of the values obtained in this study with those available in the literature, [12] conducted anammox activity assays at 25°C, obtaining a KS and KI for the Edwards model of 56.4 mg N-NO2-/L and 525 mg N-NO2-/L, respectively. Although both values are higher than those obtained in this study, the differences might be attributed to the temperature difference (30°C in our assays), as it is known that kinetic constants decrease in value with rising temperatures. On the other hand, [20]., applying the Andrews model, obtained a KS of 29 mg N-NO2-/L and a KI of 1779 mg N-NO2-/L at 35°C, where the Ks is about half and the Ki is more than 10 times what was obtained in this study. Closer values are reported in the publication by [21]., where using the Haldane (Andrews) model, a Ks of 15.36 mg N-NO2-/L and a Ki of 159.5 mg N-NO2-/L were obtained.
It is important to note that the calculated kinetic constants likely do not interpret the individual behavior of each Anammox cell but rather incorporate the effect of external and internal diffusional constraints within the granules. The impact of concentration gradients of the substrates and products involved in bacterial metabolism can be significant, as addressed by [22] in their review. The size of the granules, their composition in EPS and proteins, as well as the distribution of different bacterial groups along the granule diameter are factors that influence [23], and in this regard, the kinetic constants maximum SAA, KS, and KI determined in this study would be apparent kinetic constants.
3.2. Long-Term Nitrite Effect
Figure 2 shows the evolution of nitrogen species during the long-term nitrite exposure experiment. For all cycles, the duration was the same, regardless of whether they were initially loaded with 15 mg N-NO2-/L or 30 mg N-NO2-/L. As can be seen, in general, nitrite at the end of the cycles was not less than 3 mgN/L (except for cycles 7 and 13), which could be interpreted as the consumption rate drastically decreasing below this value, consistent with the short-term experiments presented earlier.
Table 1 presents the SAA values obtained during the execution of the extended exposure experiments. As can be observed, the biomass subjected to the regimen of 15 mg N-NO2-/L at the beginning of each cycle practically did not see its SAA affected (cycle 1 and cycle 12). After this, it was decided to increase the nitrite concentration at the beginning of the cycles to 30 mg N-NO2-/L. After 12 more cycles of operation under this new condition, the activity assay was repeated, resulting in a decrease of approximately 50%. This can also be observed in Figure 1, where the residual nitrite concentration begins to increase as the cycles progress after week 12. The nitrogen load supplied to the system also decreased throughout this second experiment (data not shown) to avoid nitrite overload.
The results obtained are consistent with those reported by [8] where it was observed that nitrite concentrations higher than 15 mg N-NO2-/L should be avoided to maintain stable Anammox system operation. Similarly, [24] using granular Anammox biomass in a UASB reactor, determined that at 1.5 µg/L of free nitrous acid, the system begins to destabilize, which under the operational conditions used (pH and temperature) is equivalent to around 15 mg N-NO2-/L as well. On the other hand, it should be noted that in this experiment, the feed consisted only of sodium nitrite and ammonium chloride, without the addition of micronutrients or inorganic carbon source. Regarding the latter, [25] showed that there could be a decrease of up to 40.5% in SAA between Anammox bacteria fed with and without bicarbonate in the long term. It is possible that a percentage of the activity loss in the assay at 30 mg N-NO2-/L is a combined effect of carbon starvation along with nitrite exposure.
3.3. Short-Term Effect of Temperature
The influence of temperature on SAA was evaluated. Figure 3 shows the results obtained, where a clear increase in SAA value with temperature increment within the studied range can be observed. Regarding the relationship between SAA and temperature, similar results have been reported in the literature previously [26]. [27] studied SAA variation in the temperature range of 10 – 45 °C using both granular biomass and biofilm, finding that for both cases, SAA at 25 °C is less than half of SAA at 35 °C, representing a more drastic effect than that obtained in this study (67.7%). An explanation could be that the biomass used by [27] came from a laboratory reactor operating at 30 °C, while the one in this study comes from a full-scale reactor with an average temperature of 27 °C, which could impact the present community and its tolerance to lower temperatures. On the other hand, [28] measured SAA in the range of 10 – 55 °C, obtaining that approximately 50% of the SAA obtained at 35 °C is preserved at 25 °C. Similar results were obtained by [29], where a profile of SAA with respect to the temperature of their enriched culture showed that 55% of SAA at 35 °C is maintained at 25 °C. According to the review conducted by the authors of this study, the SAA variation in the range of 25 – 35 °C is the lowest reported.
4. Conclusions
The short-term exposure to varying nitrite concentrations demonstrates that SAA increases, reaching a peak at 100 mg N-NO2-/L. Beyond this concentration, SAA starts to decline, indicating a possible inhibition effect at higher nitrite levels. The Andrews model, which accounts for non-competitive substrate inhibition, effectively represents this behavior, yielding a strong correlation (R² = 0.955). Similarly, the Edwards model, with a slightly better fit (R² = 0.957), also captures the trend, though the derived Ks and KI values differ considerably between these models and compared to previous studies. The inconsistency could be influenced by various factors, such as test temperature, the source of biomass, granule diameter, and its specific composition. Unfortunately, these variables are frequently underreported in scientific literature, leading to challenges in cross-study comparisons and a lack of context for the results.
The findings also suggest that for a period corresponding to three Hydraulic Retention Times (HRTs), exposure to nitrite concentrations above 30 mg N/L can cause an approximate 50% reduction in SAA within the sludge. This significant loss highlights the potential impact of high nitrite levels on Anammox activity. Further research is crucial to understand better the impact of inorganic carbon deficiency on SAA reduction, which may play a role in the observed loss of activity. Finally, we observed that within the temperature range of 25 – 35 °C, SAA follows an increasing trend, supporting earlier reports in the literature that indicate a temperature-dependent response in Anammox activity.
Author Contributions
B.I., R.C., Y.L. and C.C. conceived and planned the experiments. B.I., R.C., Y.L., C.G. and M.P. participated in the samples preparation, data analysis and interpretation of the results. B.I. and R.C. wrote the paper draft. R.C. and Y.L. supervised the research work, contributed to the discussion of the data, and revised the manuscript. All authors have read and agreed to the published version of the manuscript.
Funding
This research received no external funding.
Conflicts of Interest
The authors declare no conflicts of interest.
References
- Smith, V. H., Tilman, G. D., & Nekola, J. C. (1999). Eutrophication: impacts of excess nutrient inputs on freshwater, marine, and terrestrial ecosystems. Environmental pollution, 100(1-3), 179-196. [CrossRef]
- Lackner, S., Gilbert, E. M., Vlaeminck, S. E., Joss, A., Horn, H., & Van Loosdrecht, M. C. (2014). Full-scale partial nitritation/anammox experiences–an application survey. Water research, 55, 292-303. [CrossRef]
- Driessen, W., & Hendrickx, T. (2021). Two decades of experience with the granular sludge-based anammox® process treating municipal and industrial effluents. Processes, 9(7), 1207. [CrossRef]
- Ren, Z. Q., Wang, H., Zhang, L. G., Du, X. N., Huang, B. C., & Jin, R. C. (2022). A review of anammox-based nitrogen removal technology: From microbial diversity to engineering applications. Bioresource Technology, 363, 127896. [CrossRef]
- Bagchi, S., Biswas, R., & Nandy, T. (2012). Autotrophic ammonia removal processes: ecology to technology. Critical Reviews in Environmental Science and Technology, 42(13), 1353-1418. [CrossRef]
- Talan, A., Tyagi, R. D., & Drogui, P. (2021). Critical review on insight into the impacts of different inhibitors and performance inhibition of anammox process with control strategies. Environmental Technology & Innovation, 23, 101553. [CrossRef]
- Gutwiński, P., Cema, G., Ziembińska-Buczyńska, A., Wyszyńska, K., & Surmacz-Gorska, J. (2021). Long-term effect of heavy metals Cr (III), Zn (II), Cd (II), Cu (II), Ni (II), Pb (II) on the anammox process performance. Journal of Water Process Engineering, 39, 101668. [CrossRef]
- Fernández, I., Dosta, J., Fajardo, C., Campos, J. L., Mosquera-Corral, A., & Méndez, R. (2012). Short-and long-term effects of ammonium and nitrite on the Anammox process. Journal of Environmental Management, 95, S170-S174. [CrossRef]
- Strous, M., Kuenen, J. G., & Jetten, M. S. (1999). Key physiology of anaerobic ammonium oxidation. Applied and environmental microbiology, 65(7), 3248-3250. [CrossRef]
- Carvajal-Arroyo, J. M., Sun, W., Sierra-Alvarez, R., & Field, J. A. (2013). Inhibition of anaerobic ammonium oxidizing (anammox) enrichment cultures by substrates, metabolites and common wastewater constituents. Chemosphere, 91(1), 22-27. [CrossRef]
- Oshiki, M., Shimokawa, M., Fujii, N., Satoh, H., & Okabe, S. (2011). Physiological characteristics of the anaerobic ammonium-oxidizing bacterium ‘Candidatus Brocadia sinica’. Microbiology, 157(6), 1706-1713. [CrossRef]
- Marina, C., Kunz, A., Bortoli, M., Scussiato, L. A., Coldebella, A., Vanotti, M., & Soares, H. M. (2016). Kinetic models for nitrogen inhibition in ANAMMOX and nitrification process on deammonification system at room temperature. Bioresource technology, 202, 33-41. [CrossRef]
- Andrews, J. F. (1968). A mathematical model for the continuous culture of microorganisms utilizing inhibitory substrates. Biotechnology and bioengineering, 10(6), 707-723. [CrossRef]
- Boon, B., & Laudelout, H. (1962). Kinetics of nitrite oxidation by Nitrobacter winogradskyi. Biochemical Journal, 85(3), 440. [CrossRef]
- Edwards, V. H. (1970). The influence of high substrate concentrations on microbial kinetics. Biotechnology and bioengineering, 12(5), 679-712. [CrossRef]
- Dapena-Mora, A., Fernandez, I., Campos, J. L., Mosquera-Corral, A., Mendez, R., & Jetten, M. S. M. (2007). Evaluation of activity and inhibition effects on Anammox process by batch tests based on the nitrogen gas production. Enzyme and microbial technology, 40(4), 859-865. [CrossRef]
- Weatherburn, M. W. (1967). Phenol-hypochlorite reaction for determination of ammonia. Analytical chemistry, 39(8), 971-974.
- Raudkivi, M., Zekker, I., Rikmann, E., Vabamäe, P., Kroon, K., & Tenno, T. (2017). Nitrite inhibition and limitation–the effect of nitrite spiking on anammox biofilm, suspended and granular biomass. Water Science and Technology, 75(2), 313-321. [CrossRef]
- Cho, S., Takahashi, Y., Fujii, N., Yamada, Y., Satoh, H., & Okabe, S. (2010). Nitrogen removal performance and microbial community analysis of an anaerobic up-flow granular bed anammox reactor. Chemosphere, 78(9), 1129-1135. [CrossRef]
- Zu, B., Zhang, D. J., & Yan, Q. (2008). Effect of trace NO2 and kinetic characteristics for anaerobic ammonium oxidation of granular sludge. Huan Jing ke Xue= Huanjing Kexue, 29(3), 683-687.
- Baeten, J. E., Batstone, D. J., Schraa, O. J., van Loosdrecht, M. C., & Volcke, E. I. (2019). Modelling anaerobic, aerobic and partial nitritation-anammox granular sludge reactors-A review. Water research, 149, 322-341. [CrossRef]
- Ni, B. J., Hu, B. L., Fang, F., Xie, W. M., Kartal, B., Liu, X. W., ... & Yu, H. Q. (2010). Microbial and physicochemical characteristics of compact anaerobic ammonium-oxidizing granules in an upflow anaerobic sludge blanket reactor. Applied and Environmental Microbiology, 76(8), 2652-2656. [CrossRef]
- Zhang, Y., He, S., Niu, Q., Qi, W., & Li, Y. Y. (2016). Characterization of three types of inhibition and their recovery processes in an anammox UASB reactor. Biochemical Engineering Journal, 109, 212-221. [CrossRef]
- Puyol, D., Carvajal-Arroyo, J. M., Sierra-Alvarez, R., & Field, J. A. (2014). Nitrite (not free nitrous acid) is the main inhibitor of the anammox process at common pH conditions. Biotechnology letters, 36, 547-551. [CrossRef]
- Jin, R. C., Yu, J. J., Ma, C., Yang, G. F., Zhang, J., Chen, H., ... & Hu, B. L. (2014). Transient and long-term effects of bicarbonate on the ANAMMOX process. Applied microbiology and biotechnology, 98, 1377-1388. [CrossRef]
- Lotti, T., Kleerebezem, R., & Van Loosdrecht, M. C. M. (2015). Effect of temperature change on anammox activity. Biotechnology and bioengineering, 112(1), 98-103. [CrossRef]
- Dosta, J., Fernández, I., Vázquez-Padín, J. R., Mosquera-Corral, A., Campos, J. L., Mata-Alvarez, J., & Méndez, R. (2008). Short-and long-term effects of temperature on the Anammox process. Journal of hazardous materials, 154(1-3), 688-693. [CrossRef]
- Sobotka, D., Zhai, J., & Makinia, J. (2021). Generalized temperature dependence model for anammox process kinetics. Science of the Total Environment, 775, 145760. [CrossRef]
- Hu, Z., Lotti, T., de Kreuk, M., Kleerebezem, R., van Loosdrecht, M., Kruit, J., ... & Kartal, B. (2013). Nitrogen removal by a nitritation-anammox bioreactor at low temperature. Applied and environmental microbiology, 79(8), 2807-2812. [CrossRef]
Figure 1.
Effect of nitrite on SAA. The black circles represent the experimental results, the dashed line represents the prediction by the substrate inhibition Andrews model and the continues line represents the prediction by the substrate inhibition Edwards model.
Figure 1.
Effect of nitrite on SAA. The black circles represent the experimental results, the dashed line represents the prediction by the substrate inhibition Andrews model and the continues line represents the prediction by the substrate inhibition Edwards model.
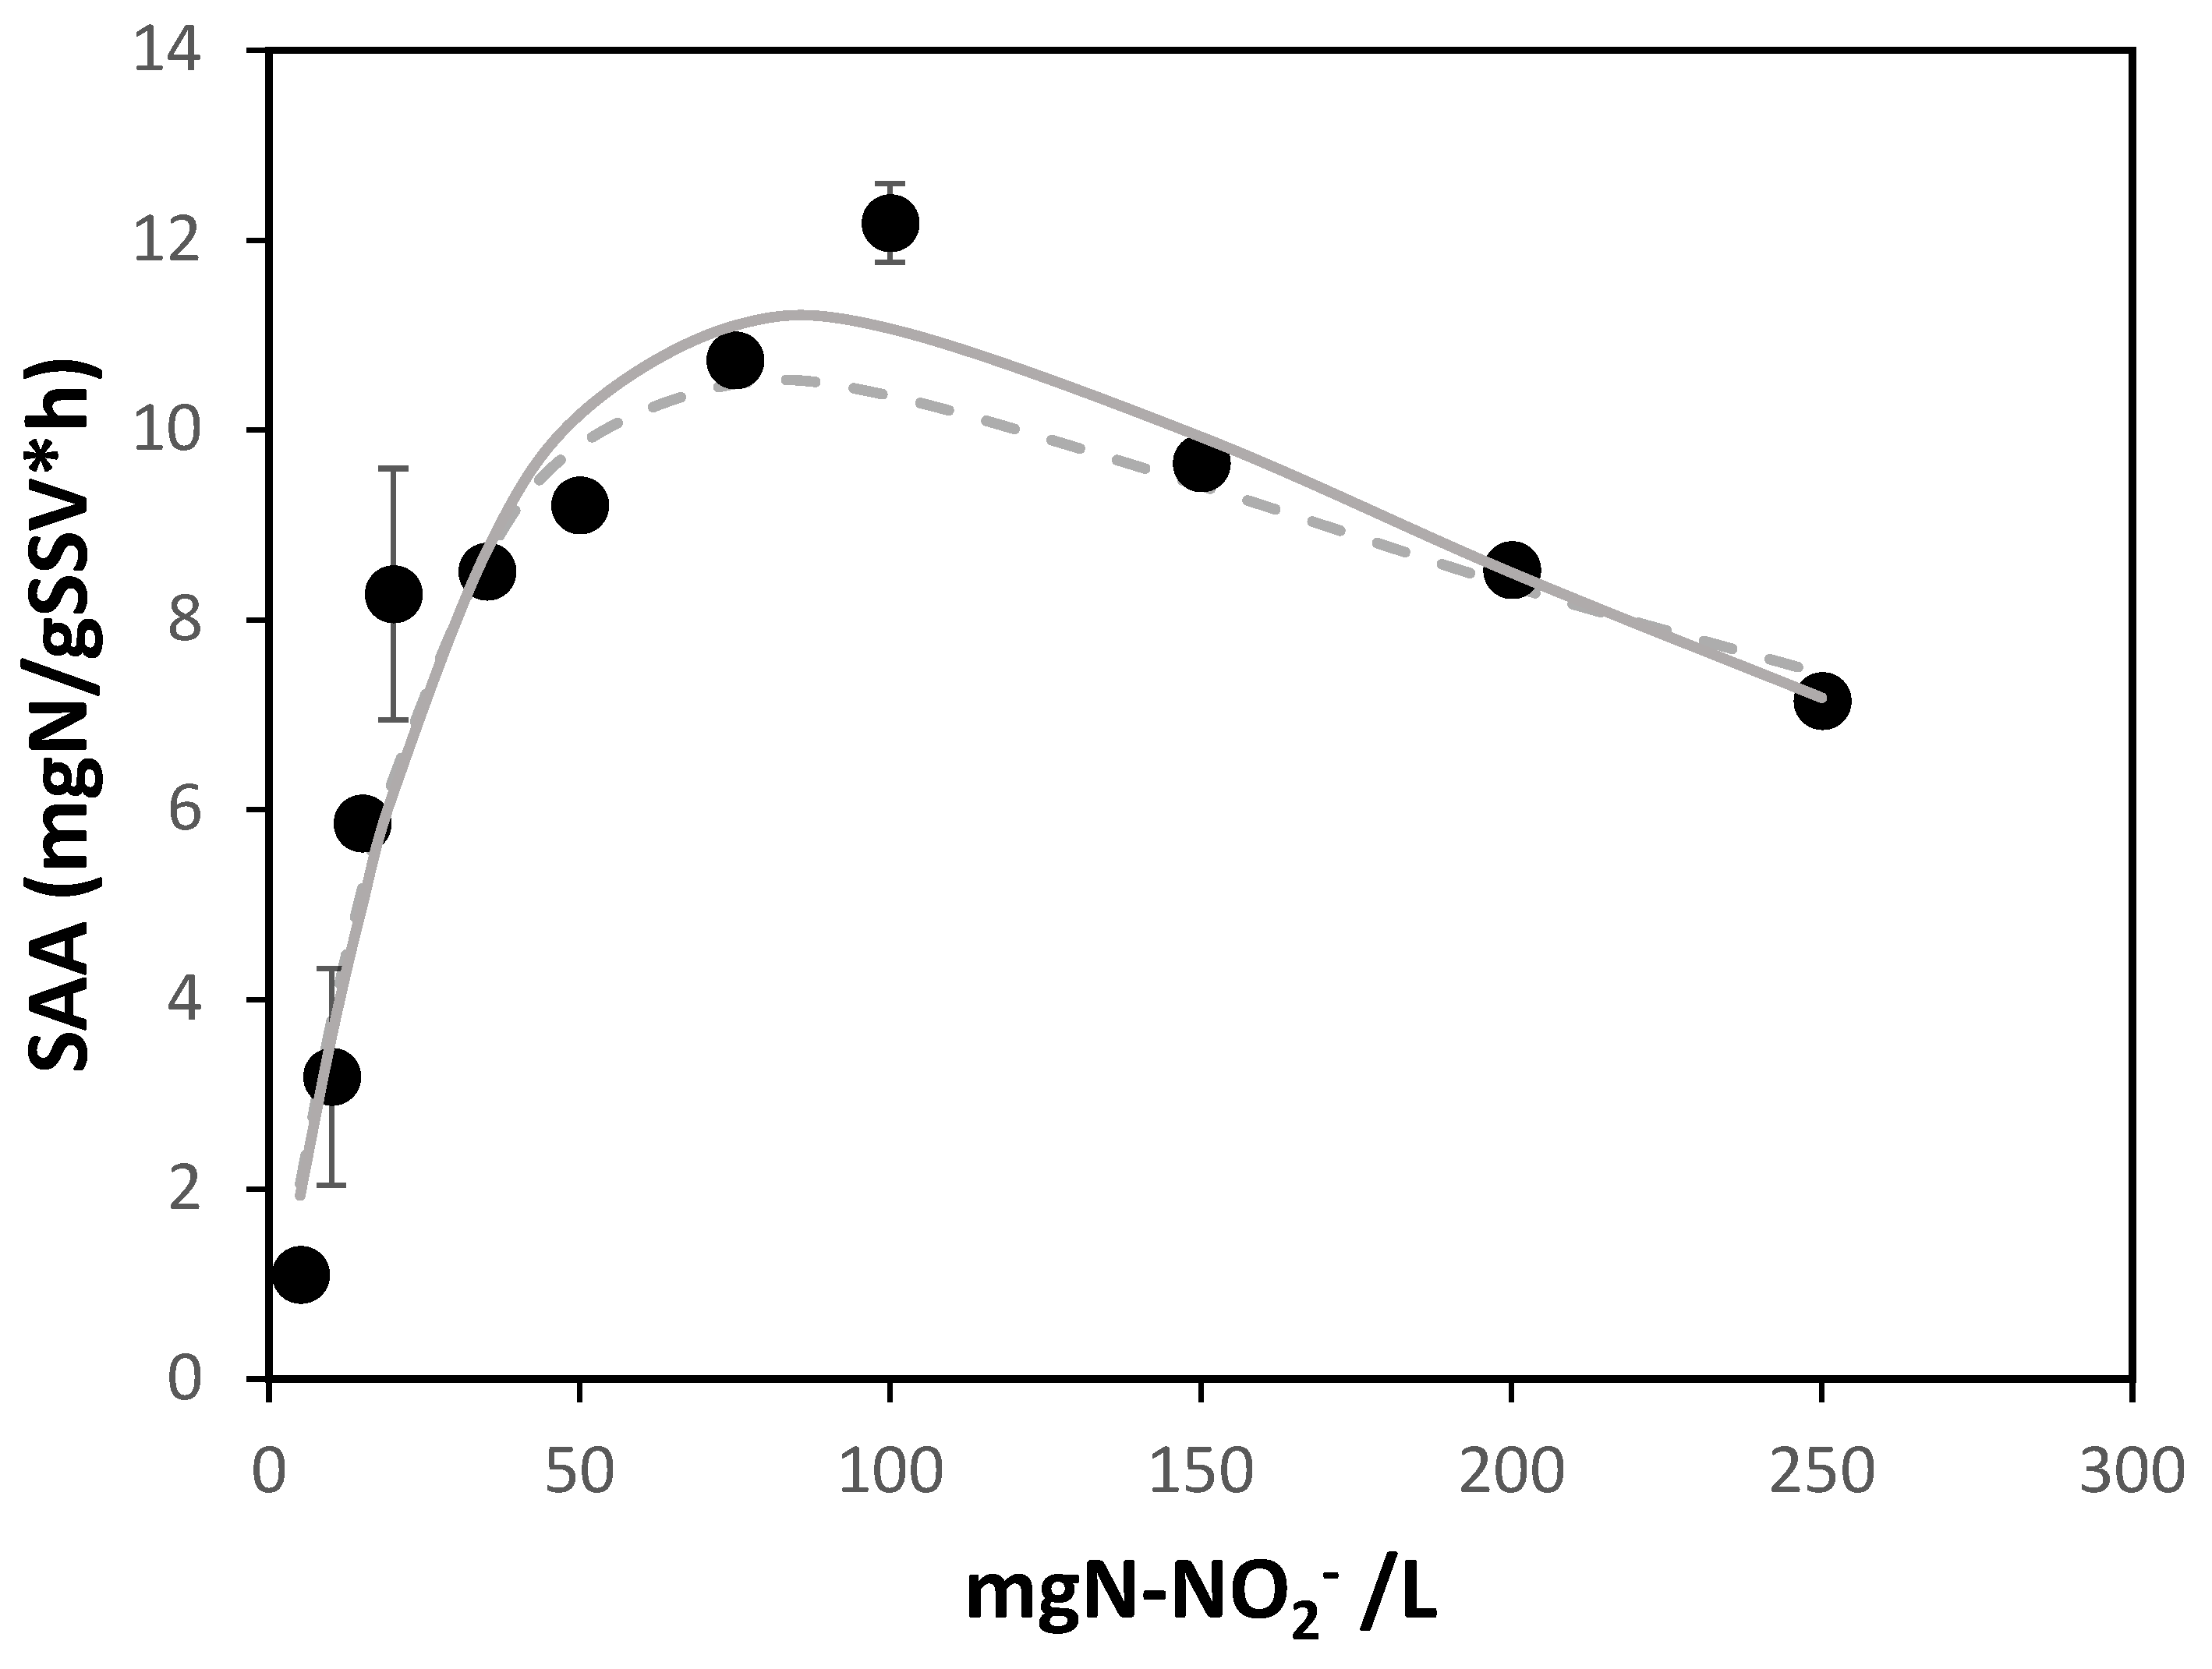
Figure 2.
Ammonium (black square), nitrate (black diamond), and nitrite (white circle) in discharge during cycles performed in the long-term experiment in the SBR reactor. The dashed line (- -) represents the change from the experiment with 15 mg N-NO2-/L at the beginning of the cycle to 30 mg N-NO2-/L.
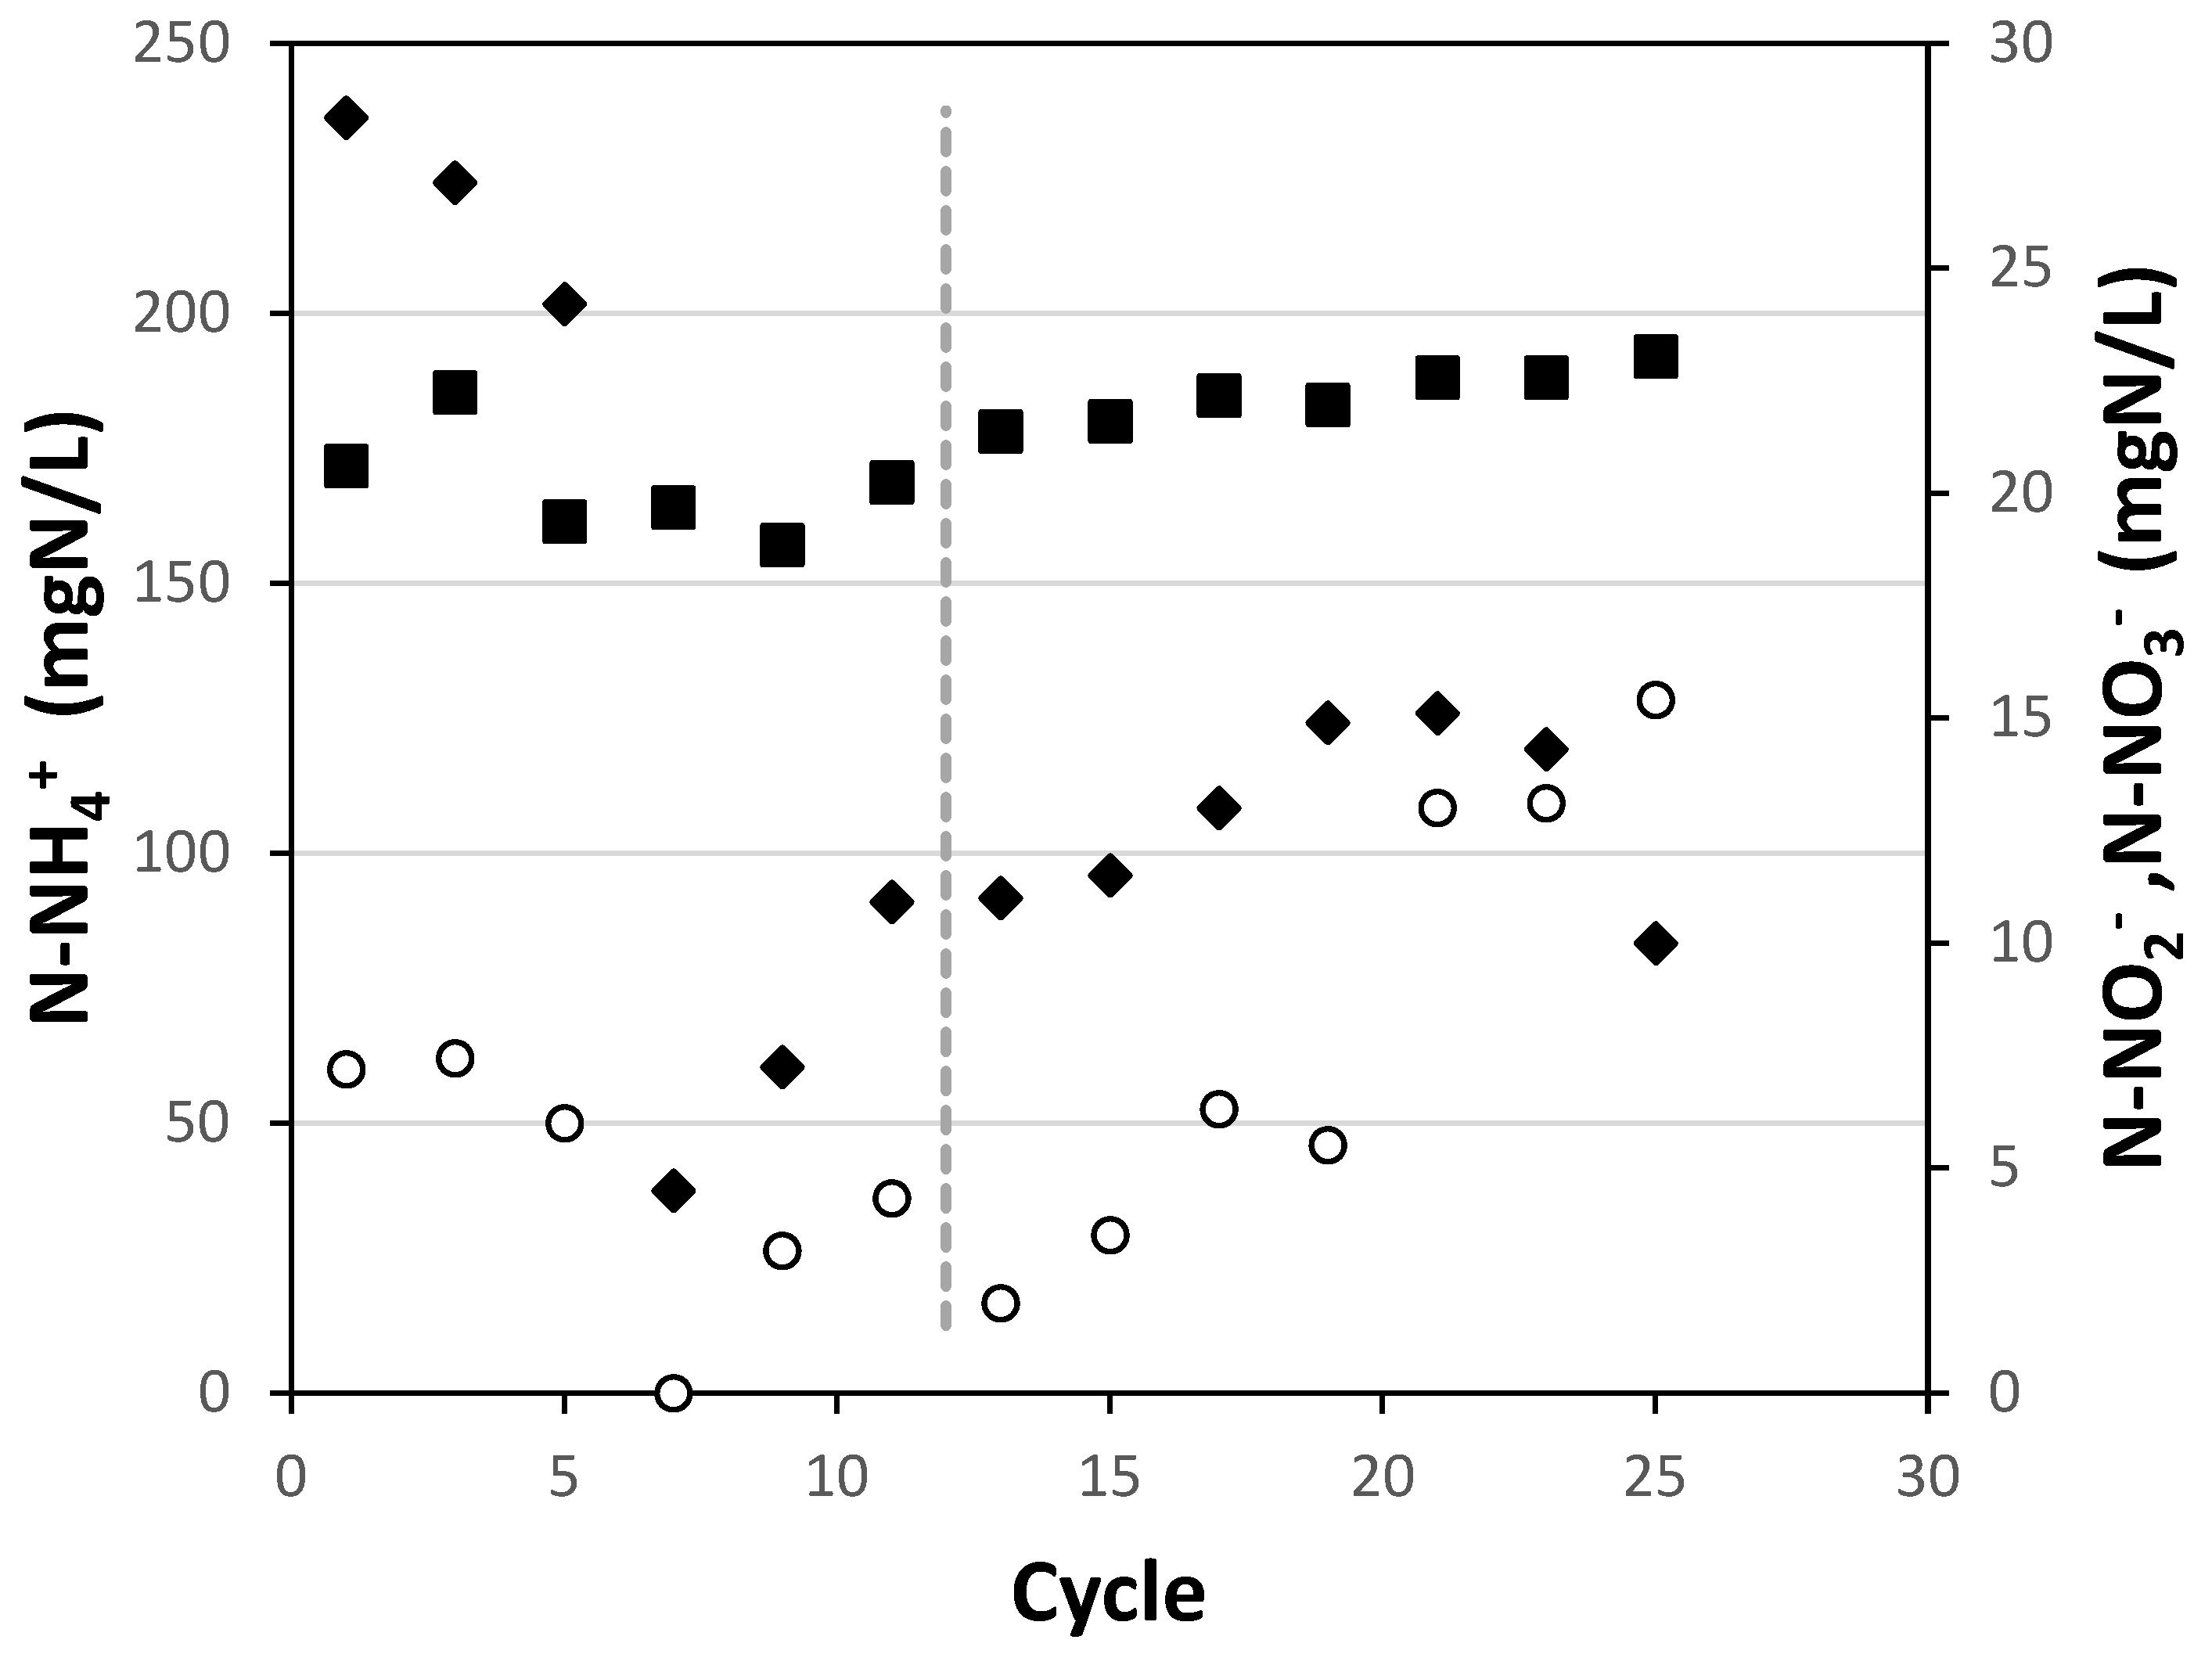
Figure 3.
SAA at 25, 30 and 35 °C.
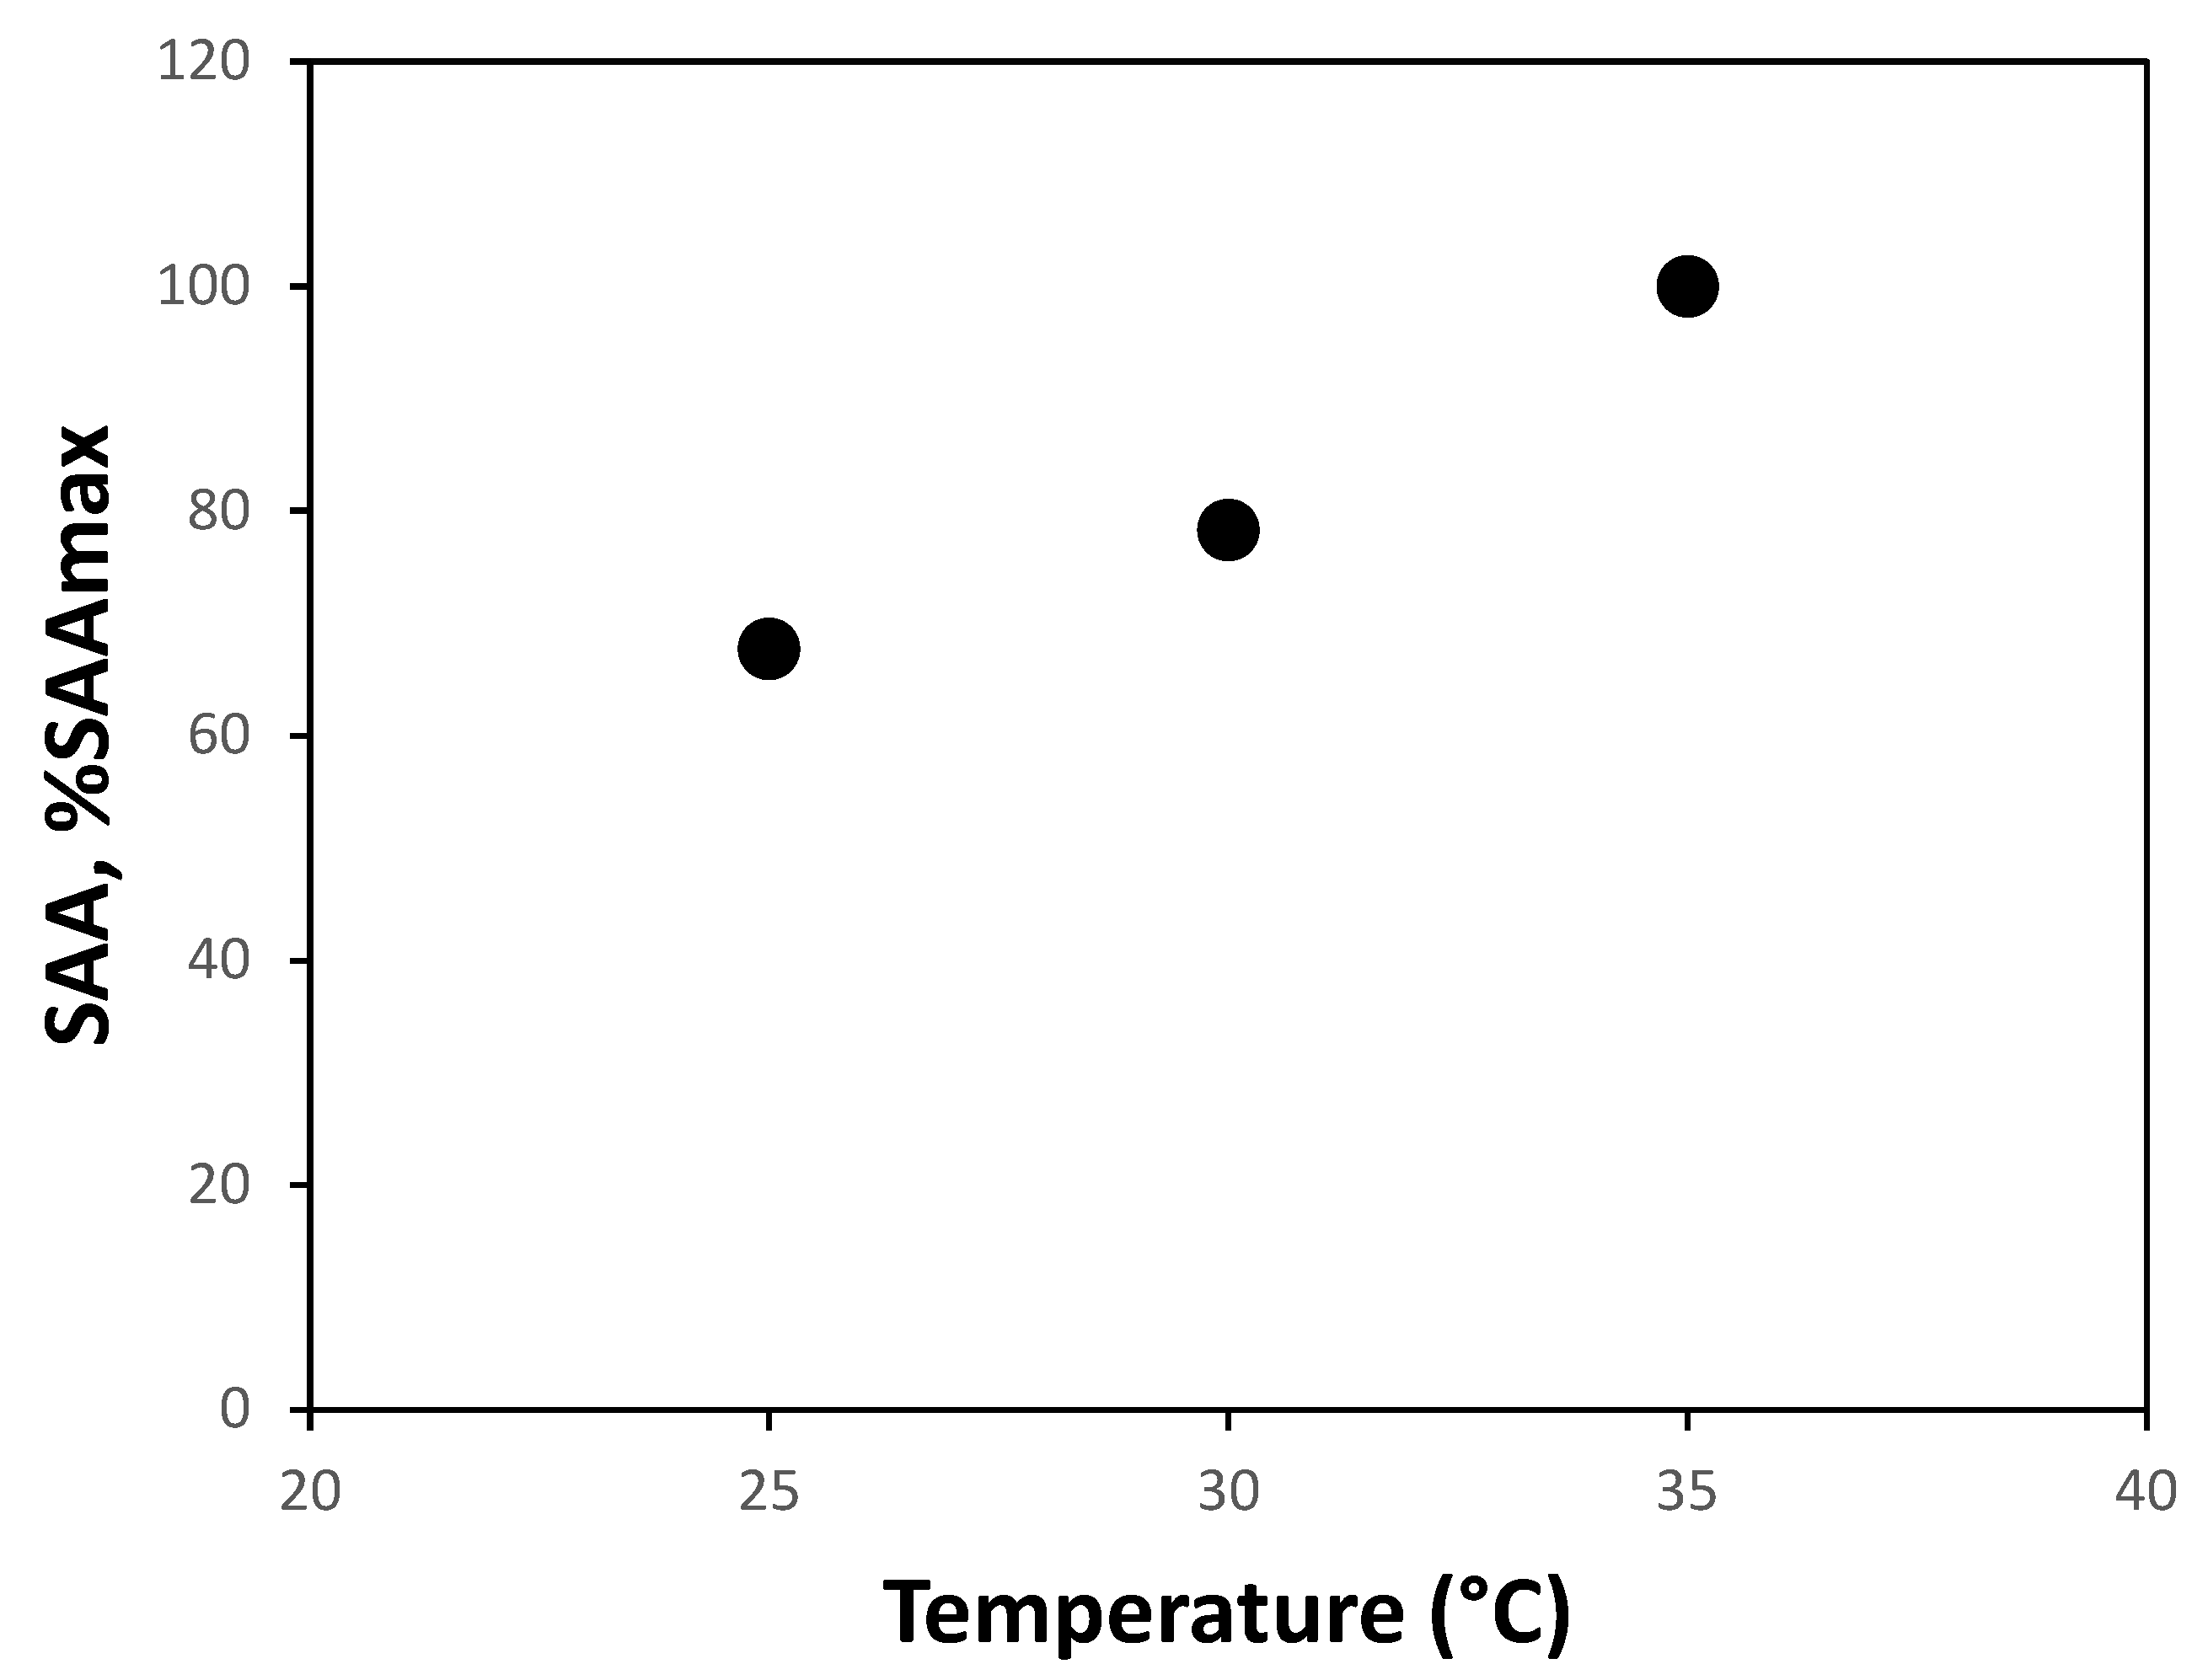

Table 1.
SAA values of sludge samples taken from the SBR reactor during the extended nitrite exposure experiments.
Table 1.
SAA values of sludge samples taken from the SBR reactor during the extended nitrite exposure experiments.
| Cycle | SAA (mgN/gSSV·h) |
| 1 | 5,43 |
| 12 | 5,32 |
| 25 | 2,67±0,3 |
Disclaimer/Publisher’s Note: The statements, opinions and data contained in all publications are solely those of the individual author(s) and contributor(s) and not of MDPI and/or the editor(s). MDPI and/or the editor(s) disclaim responsibility for any injury to people or property resulting from any ideas, methods, instructions or products referred to in the content. |
© 2024 by the authors. Licensee MDPI, Basel, Switzerland. This article is an open access article distributed under the terms and conditions of the Creative Commons Attribution (CC BY) license (http://creativecommons.org/licenses/by/4.0/).
Copyright: This open access article is published under a Creative Commons CC BY 4.0 license, which permit the free download, distribution, and reuse, provided that the author and preprint are cited in any reuse.


