
Submitted:
13 November 2024
Posted:
14 November 2024
You are already at the latest version
Abstract
Rice rhizosphere microbiota plays a crucial role in crop yield and abiotic stress tolerance. However, little is known about how the composition and function of rhizosphere soil microbial communities respond to soil salinity, alkalinity, and rice variety in rice paddy ecosystems. In this study, we analyzed the composition and function of rhizosphere soil microbial communities associated with two rice varieties (Jida177 and Tongxi933) cultivated in soils with different levels of salinity-alkalinity in Northeast China using a metagenomics approach. Our results indicate that the rhizospheres of Jida177 and Tongxi933 rice varieties harbor distinct microbial communities, and these microbial communities are differentiated based on both soil salinity-alkalinity and rice varieties. Furthermore, the observed differences in rice yield and grain quality between the Jida177 and Tongxi933 rice varieties suggest that these changes may be attributed to alterations in the rhizosphere microbiome under varying salinity conditions. These findings may pave the way for more efficient soil management and deeper understanding of the potential effects of soil salinization on the rice rhizosphere system.
Keywords:
1. Introduction
2. Results
2.1. Effect of Soil Saline-Alkali Stress on Rice Yield and Grain Quality
2.2. Effect of Rice Cultivation on Soil Physicochemical Properties
2.3. Effect of Rice Cultivation on Soil Physicochemical Properties
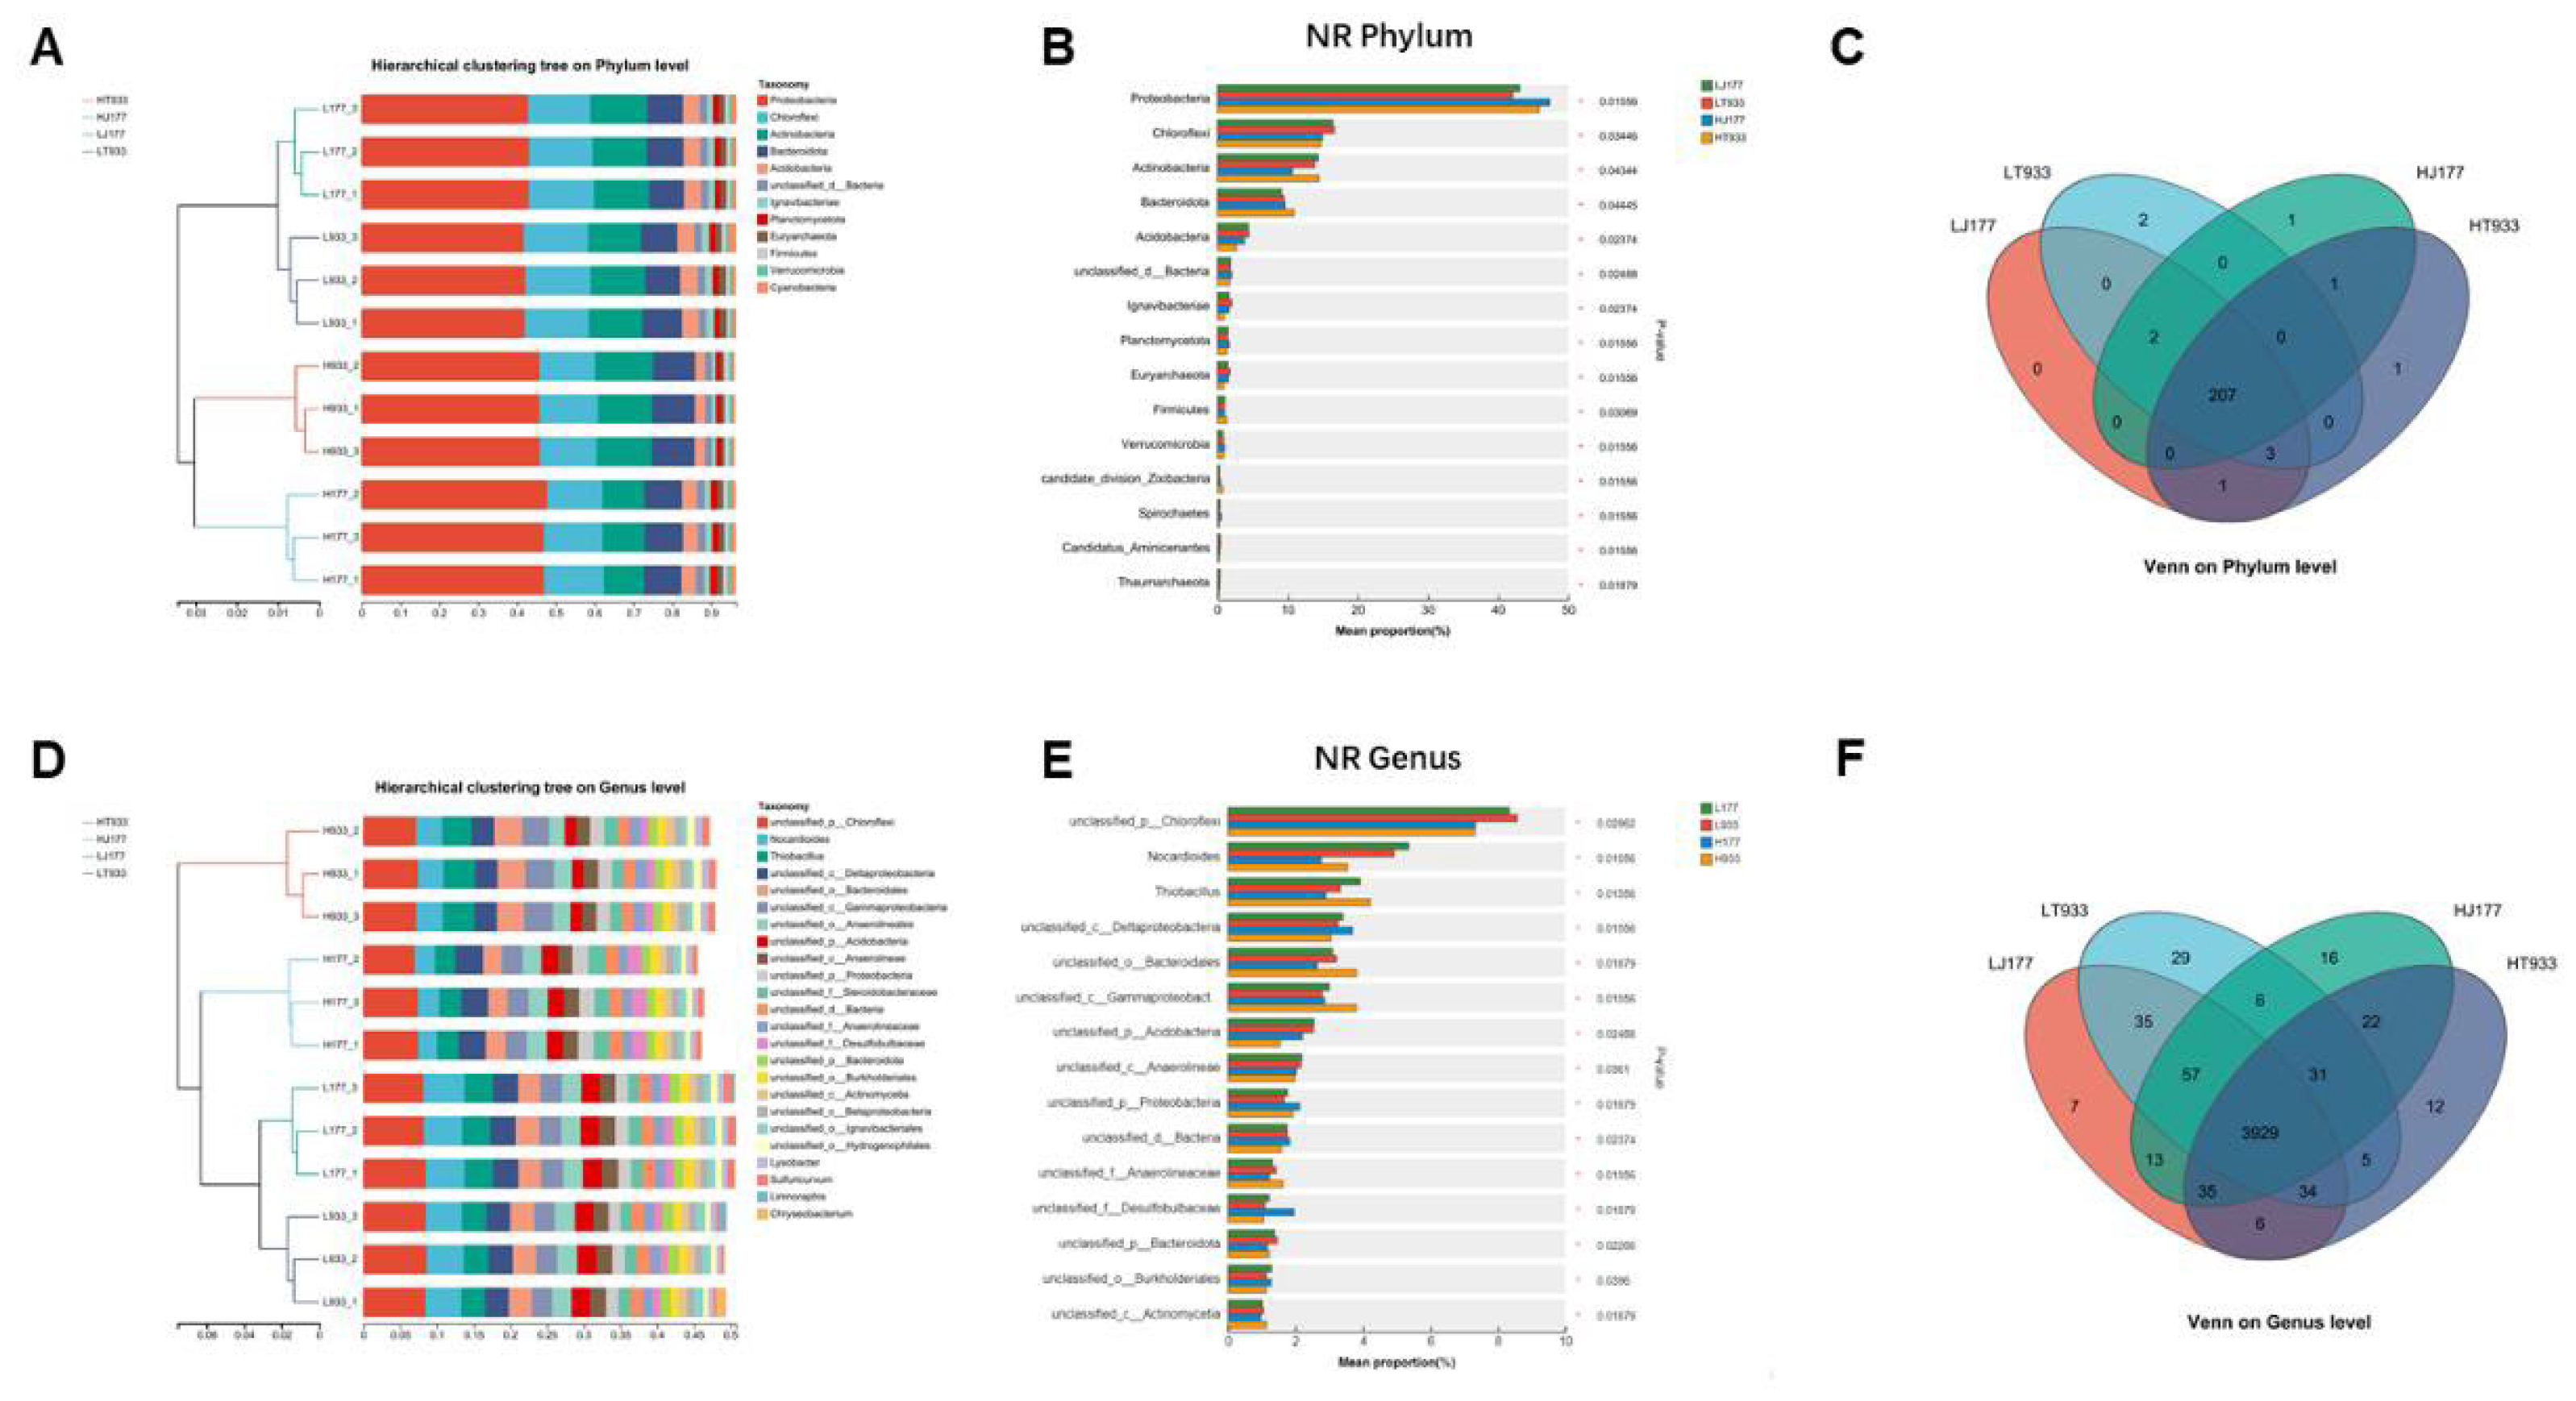
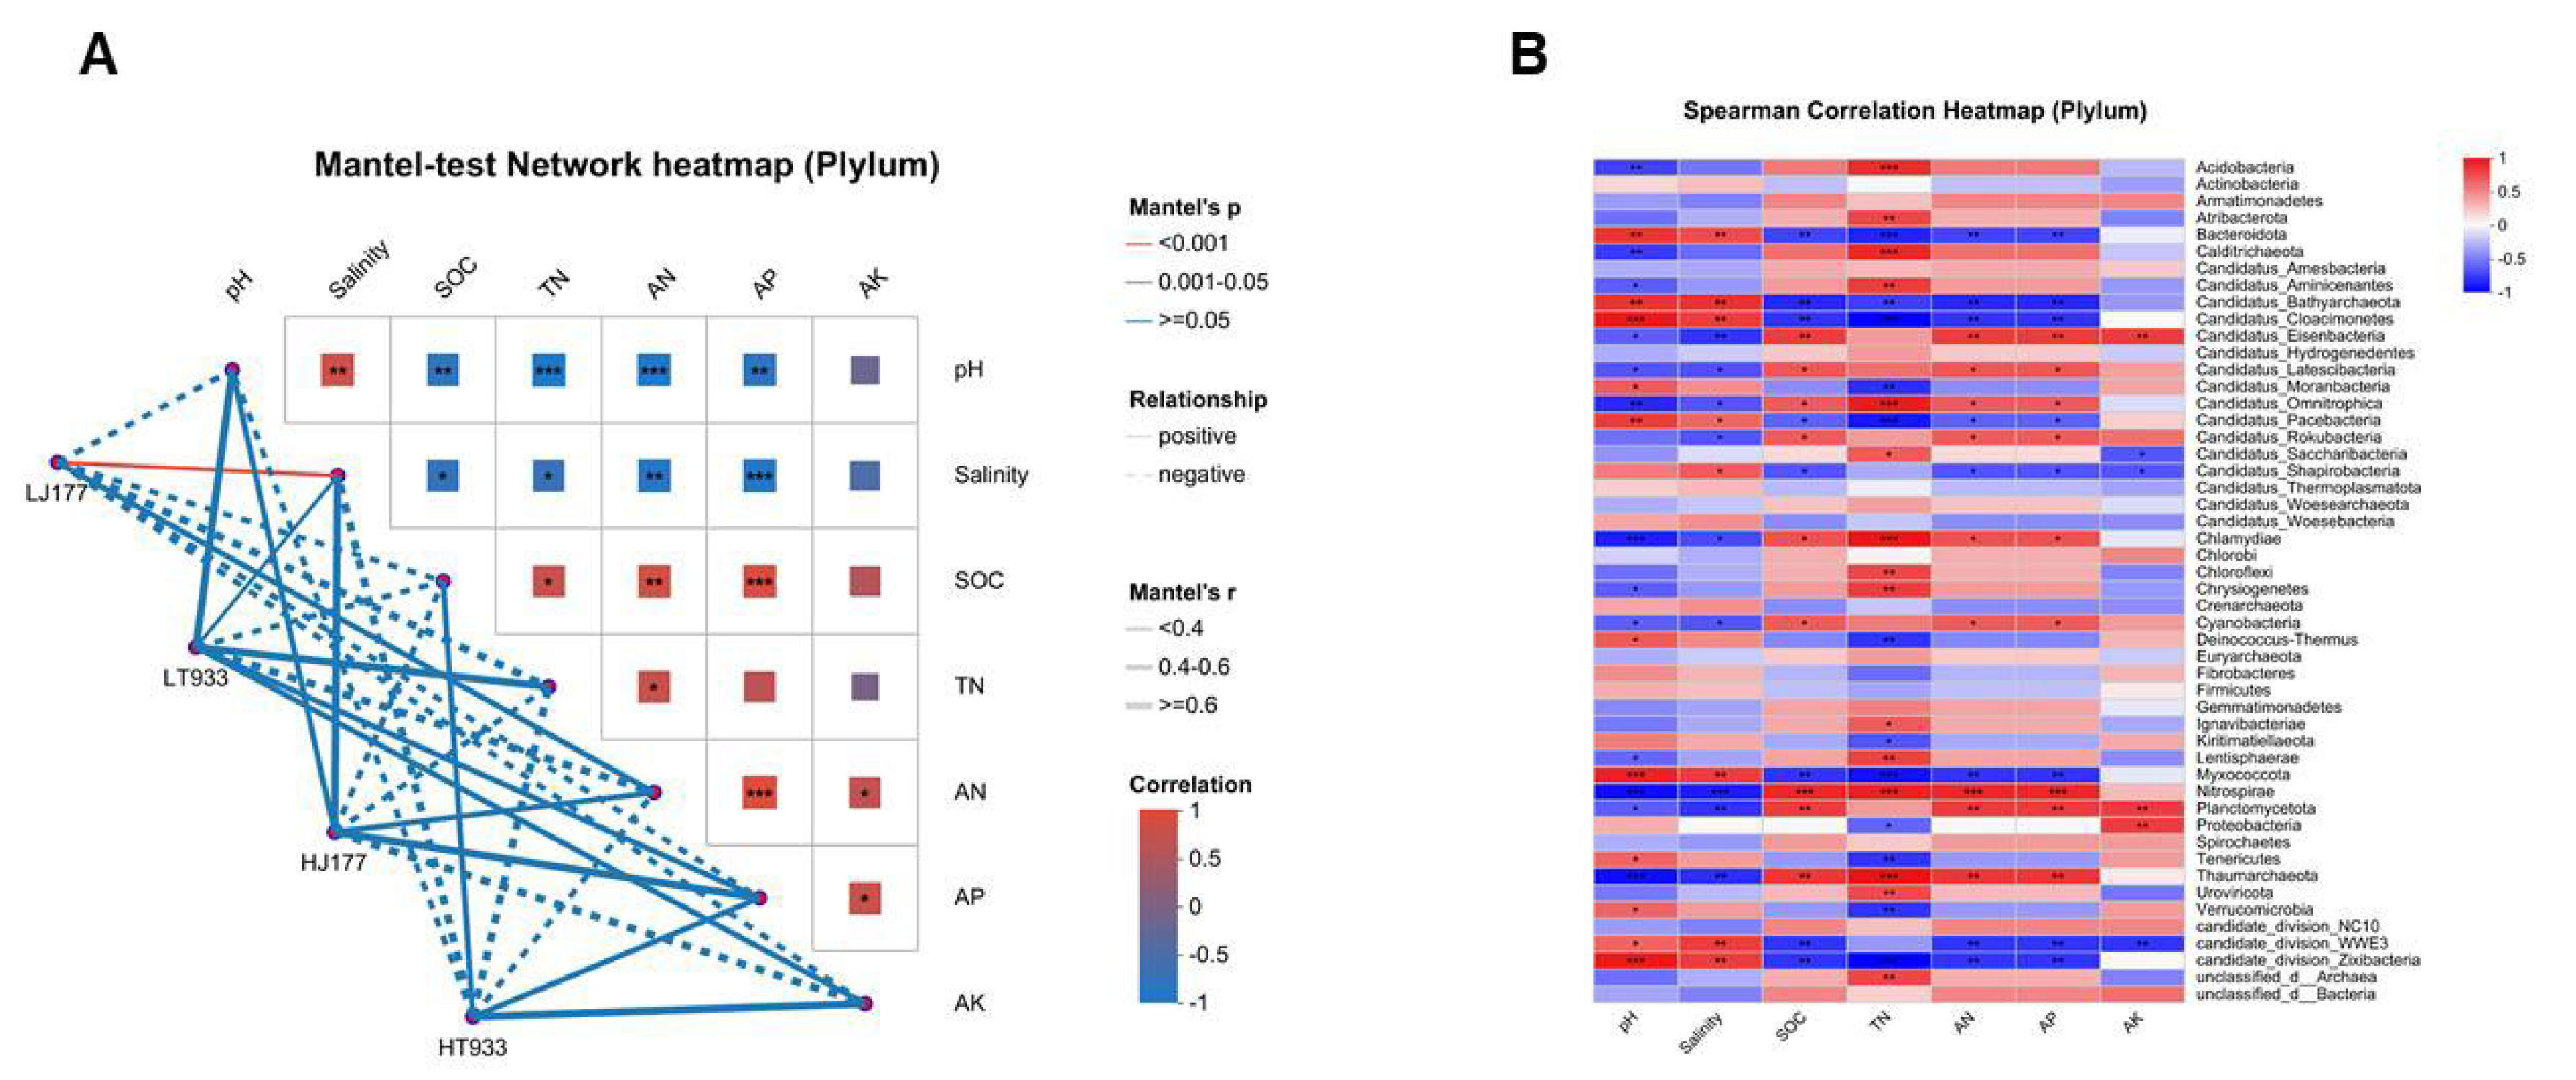
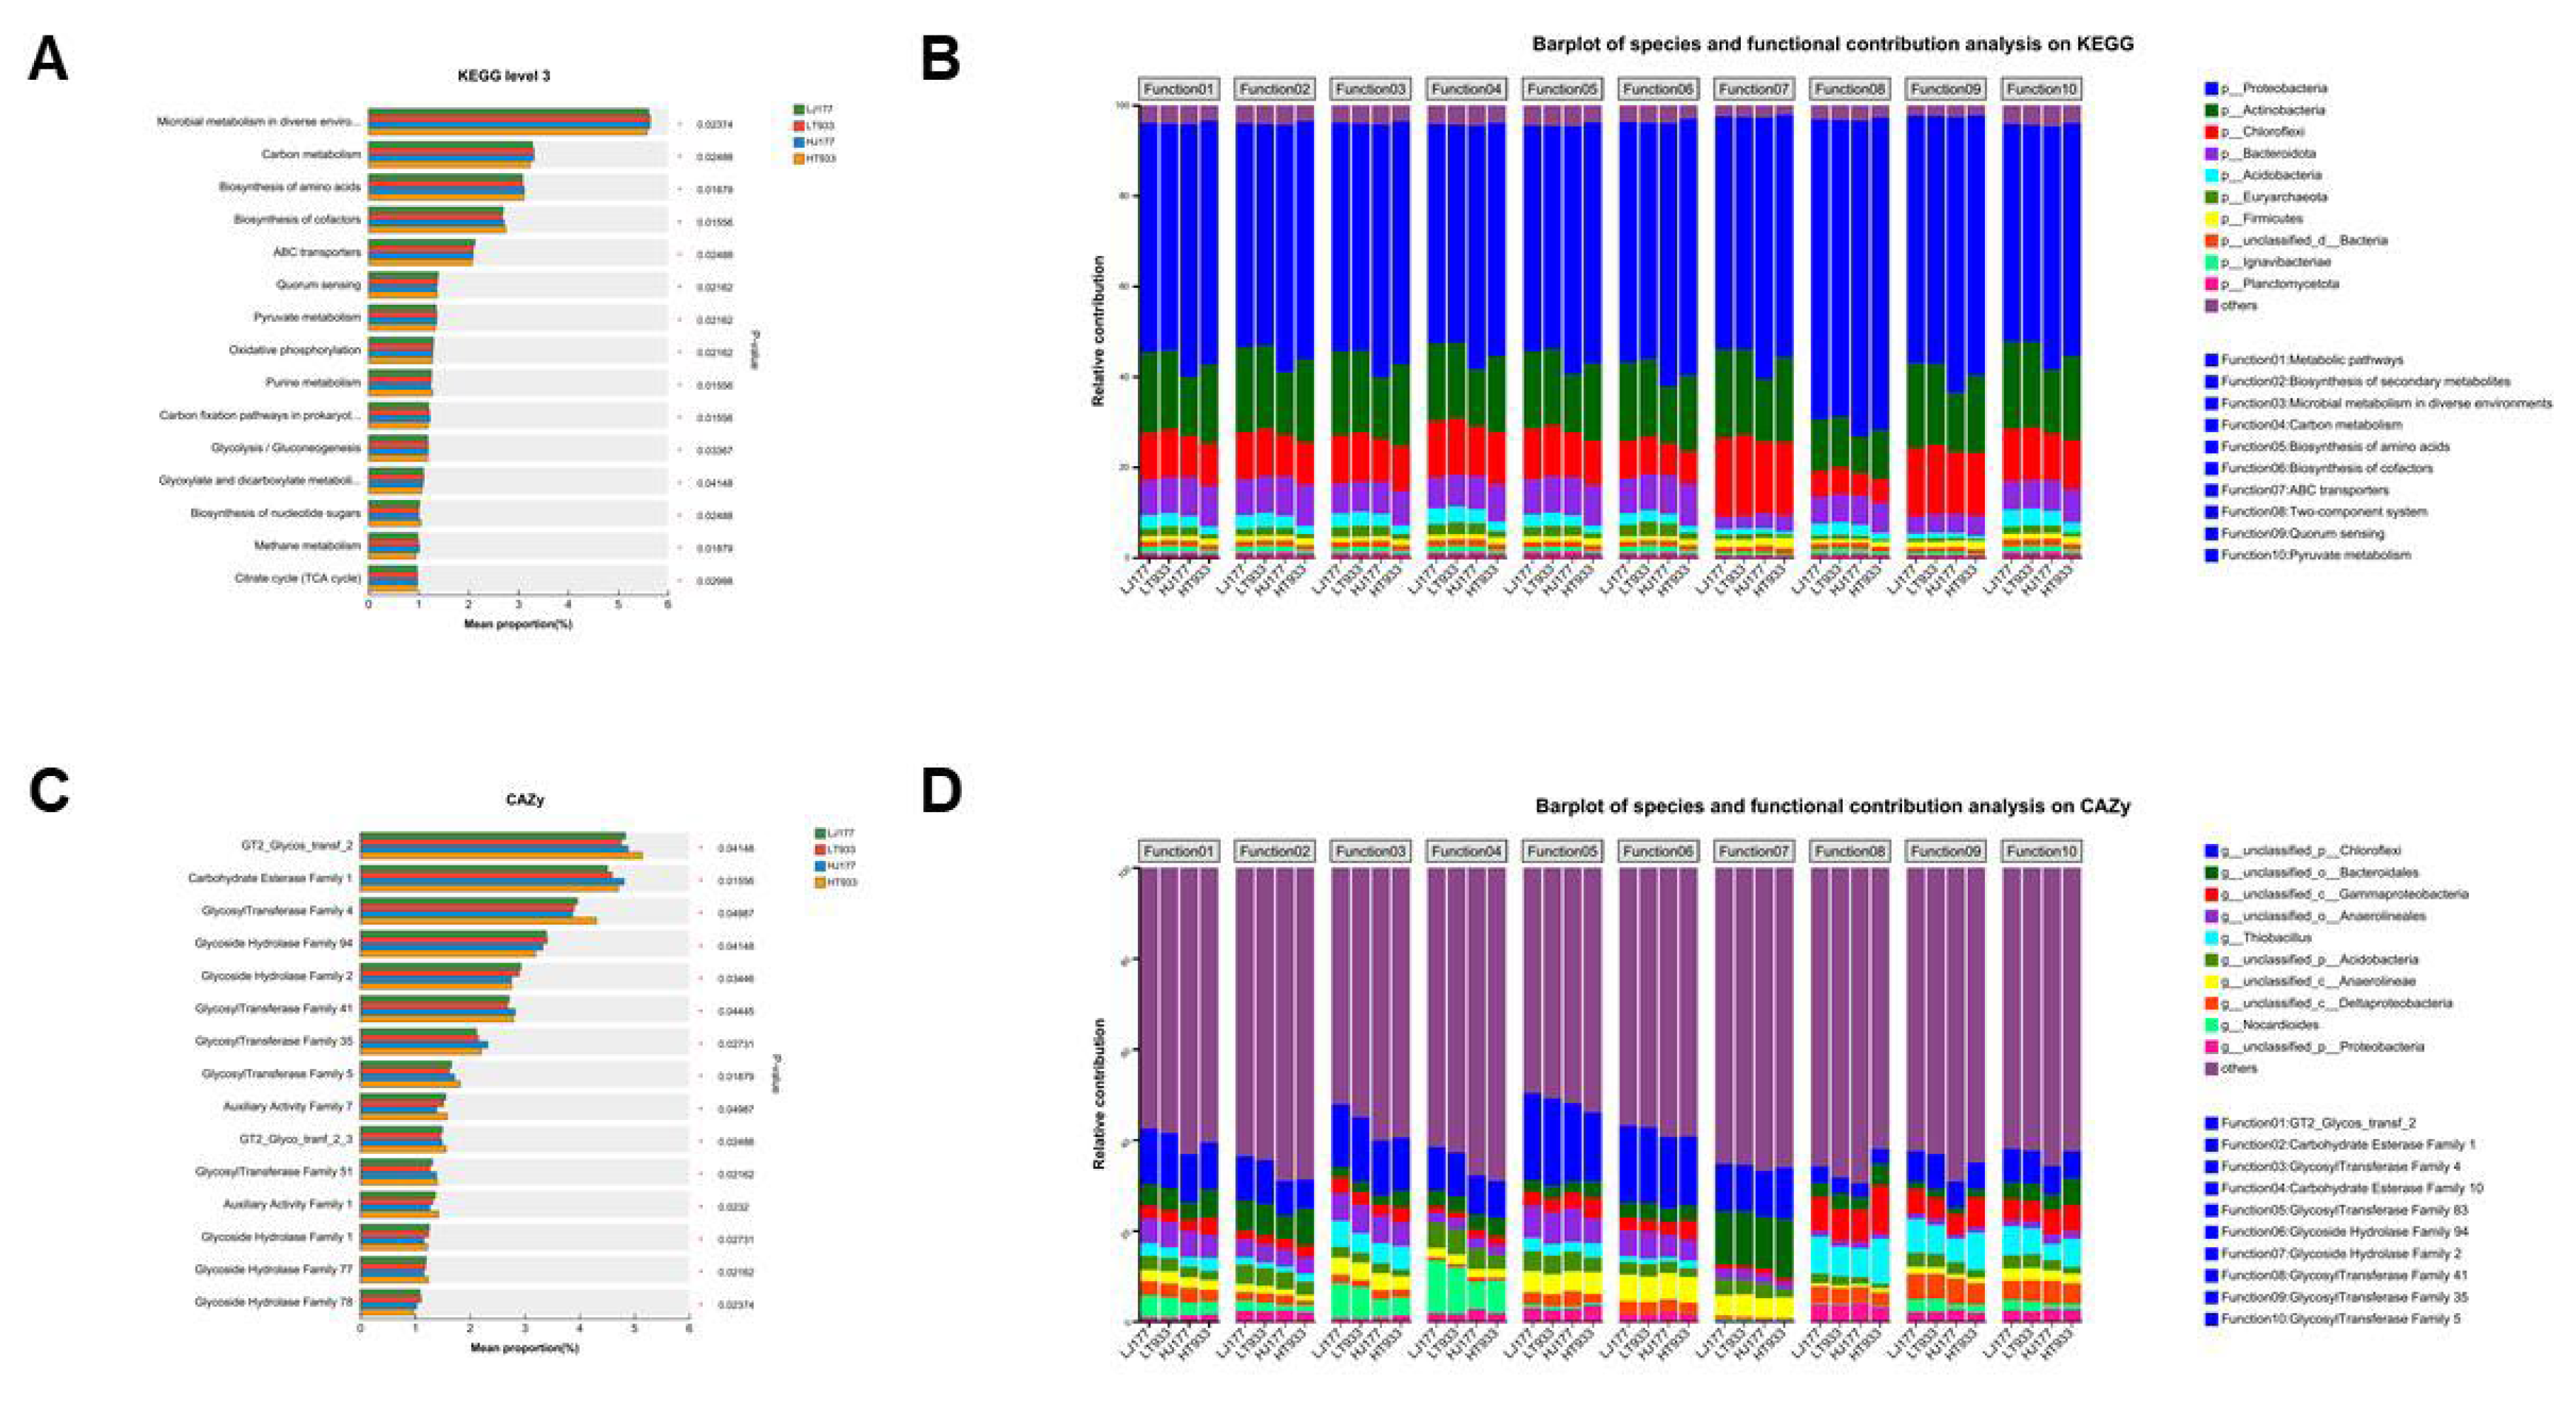
2.4. The Response of Microbial Community Composition and Functional Structure in Relation to Soil Saline-Alkali
3. Discussions
3.1. Effect of Soil Saline-Alkali Stress on Rice Yield and Grain Quality
3.2. Effect of Rice Cultivation on Soil Physicochemical Properties
3.3. Effect of Rice Cultivation on Soil Microbial Diversity
3.4. The Response of Microbial Community Composition and Functional Structure in Relation to Soil Saline-Alkali
4. Conclusions
5. Materials and Methods
5.1. Analysis of Rice Yield and Grain Quality
5.2. Soil Sampling Regime
5.3. Soil Physiochemical Analysis
5.4. DNA Extraction, Library Construction, and Metagenomic Sequencing
5.5. Sequence Quality Control and Genome Assembly
5.6. Gene Prediction, Taxonomy, and Functional Annotation
Supplementary Materials
Author Contributions
Funding
Institutional Review Board Statement
Informed Consent Statement
Data Availability Statement
Conflicts of Interest
References
- Wang, W. J.; He, H. S.; Zu, Y. G.; Guan, Y.; Liu, Z. G.; Zhang, Z.H.; Xu, H.N.; Yu, X.Y. Addition of HPMA affects seed germination, plant growth and properties of heavy saline-alkali soil in northeastern China: comparison with other agents and determination of the mechanism. Plant and soil 2011, 339, 177–191. [Google Scholar] [CrossRef]
- Nan, L.; Guo, Q.; Cao, S.; Zhan, Z. Diversity of bacterium communities in saline-alkali soil in arid regions of Northwest China. BMC Microbiol. 2022, 22, 11. [Google Scholar] [CrossRef] [PubMed]
- Depar, N.; Rajpar, I.; Memon, M.Y.; Imtiaz, M.; Zia-ul-hassan. Mineral nutrient densities in some domestic and exotic ricegenotypes. Pak. J. Agric. Agril. Eng. Vet. Sci. 2011, 27, 134–142. [Google Scholar]
- Huang, S.; Ma, Z.; Hu, L.; Huang, K.; Zhang, M.; Zhang, S.; Jiang, W.; Wu, T.; Du, X. Involvement of rice transcription factor OsERF19 in response to ABA and salt stress responses. Plant Physiol. Biochem. 2021, 167, 22–30. [Google Scholar] [CrossRef] [PubMed]
- Murtaza, G.; Ghafoor, A.; Owens, G.; Qadir, M.; Kahlon, U. Z. Environmental and economic benefits of saline-sodic soil reclamation using low-quality water and soil amendments in conjunction with a rice–wheat cropping system. Journal of Agronomy and Crop Science. 2009, 195, 124–136. [Google Scholar] [CrossRef]
- Ma, Z.; Hu, L. MicroRNA: A Dynamic Player from Signalling to Abiotic Tolerance in Plants. Int J Mol Sci. 2023, 24, 11364. [Google Scholar] [CrossRef]
- Ma, Z.; Hu, L.; Jiang, W. Understanding AP2/ERF Transcription Factor Responses and Tolerance to Various Abiotic Stresses in Plants: A Comprehensive Review. Int J Mol Sci. 2024, 25, 893. [Google Scholar] [CrossRef]
- Ma, Z.; Hu, L. WRKY Transcription Factor Responses and Tolerance to Abiotic Stresses in Plants. Int. J. Mol. Sci. 2024, 25, 6845. [Google Scholar] [CrossRef]
- Xue, P.P.; Carrillo, Y.; Pino, V.; Minasny, B.; McBratney, A.B. Soil Properties Drive Microbial Community Structure in a Large Scale Transect in South Eastern Australia. Sci Rep. 2018, 8, 11725. [Google Scholar] [CrossRef]
- Hou, J.; Wu, L.; Liu, W.; Ge, Y.; Mu, T.; Zhou, T.; Li, Z.; Zhou, J.; Sun, X.; Luo, Y.; Christie, P. Biogeography and diversity patterns of abundant and rare bacterial communities in rice paddy soils across China. Sci Total Environ. 2020, 730, 139116. [Google Scholar] [CrossRef]
- Breidenbach, B.; Pump, J.; Dumont, M.G. Microbial Community Structure in the Rhizosphere of Rice Plants. Front Microbiol. 2016, 6, 1537. [Google Scholar] [CrossRef] [PubMed]
- Ding, L.J.; Cui, H.L.; Nie, S.A.; Long, X.E.; Duan, G.L.; Zhu, Y.G. Microbiomes inhabiting rice roots and rhizosphere. FEMS Microbiol Ecol. 2019, 95, fiz040. [Google Scholar] [CrossRef] [PubMed]
- Toju, H.; Peay, K.G.; Yamamichi, M.; Narisawa, K.; Hiruma, K.; Naito, K.; Fukuda, S.; Ushio, M.; Nakaoka, S.; Onoda, Y.; Yoshida, K.; Schlaeppi, K.; Bai, Y.; Sugiura, R.; Ichihashi, Y.; Minamisawa, K.; Kiers, E.T. Core microbiomes for sustainable agroecosystems. Nat Plants. 2018, 4, 247–257. [Google Scholar] [CrossRef]
- Ling, N.; Wang, T.; Kuzyakov, Y. Rhizosphere bacteriome structure and functions. Nat Commun. 2022, 13, 836. [Google Scholar] [CrossRef]
- Bhattacharyya, P.; Roy, K.S.; Das, M.; Ray, S.; Balachandar, D.; Karthikeyan, S.; Nayak, A.K.; Mohapatra, T. Elucidation of rice rhizosphere metagenome in relation to methane and nitrogen metabolism under elevated carbon dioxide and temperature using whole genome metagenomic approach. Sci Total Environ. 2016, 542, 886–98. [Google Scholar] [CrossRef]
- Sessitsch, A.; Hardoim, P.; Döring, J.; Weilharter, A.; Krause, A.; Woyke, T.; Mitter, B.; Hauberg-Lotte, L.; Friedrich, F.; Rahalkar, M.; Hurek, T.; Sarkar, A.; Bodrossy, L.; van Overbeek, L.; Brar, D.; van Elsas, J.D.; Reinhold-Hurek, B. Functional characteristics of an endophyte community colonizing rice roots as revealed by metagenomic analysis. Mol Plant Microbe Interact. 2012, 25, 28–36. [Google Scholar] [CrossRef] [PubMed]
- Quince, C.; Walker, A.W.; Simpson, J.T.; Loman, N.J.; Segata, N. Shotgun metagenomics, from sampling to analysis. Nat Biotechnol. 2017, 35, 833–844. [Google Scholar] [CrossRef]
- Bhattacharyya, P.; Roy, K.S.; Nayak, A.K.; Shahid, M.; Lal, B.; Gautam, P.; Mohapatra, T. Metagenomic assessment of methane production-oxidation and nitrogen metabolism of long term manured systems in lowland rice paddy. Sci Total Environ. 2017, 586, 1245–1253. [Google Scholar] [CrossRef]
- Shereen, A.; Mumtaz, S.; Raza, S.; Khan, M. A.; Solangi, S. Salinity effects on seedling growth and yield components of different inbred rice lines. Pak J Bot. 2005, 37, 131–139. [Google Scholar]
- Turan, M. A.; Türkmen, N.; and Nilgun, T. Effect of NaCl on Stomatal Resistance and Proline, Chlorophyll, NaCl and K Concentrations of Lentil Plants. J. Agron. 2007, 6, 378–381. [Google Scholar] [CrossRef]
- Zeng, L.; Shannon, M. C. Effects of salinity on grain yield and yield components of rice at different seeding densities. Agronomy Journal. 2000, 92, 418–423. [Google Scholar] [CrossRef]
- Rao, P. S.; Mishra, B.; Gupta, S. R. Effects of soil salinity and alkalinity on grain quality of tolerant, semi-tolerant and sensitive rice genotypes. Rice Science. 2013, 20, 284–291. [Google Scholar] [CrossRef]
- Sangwongchai, W.; Krusong, K.; Thitisaksakul, M. Salt tolerance at vegetative stage is partially associated with changes in grain quality and starch physicochemical properties of rice exposed to salinity stress at reproductive stage. J Sci Food Agric. 2022, 102, 370–382. [Google Scholar] [CrossRef] [PubMed]
- Juliano, B. O. A simplified assay for milled-rice amylose. Cereal Sci. 1971, 16, 334–340. [Google Scholar]
- Chen, H.; Chen, D.; He, L.; Wang, T.; Lu, H.; Yang, F.; Deng, F.; Chen, Y.; Tao, Y.; Li, M.; Li, G.; Ren, W. Correlation of taste values with chemical compositions and Rapid Visco Analyser profiles of 36 indica rice (Oryza sativa L.) varieties. Food Chem 2021, 349–129176. [Google Scholar] [CrossRef]
- Zhou, G.Y.; Zhai, C.J.; Deng, A.L.; Zhang, Z. Z.; Dai, Q.J.; Cui, S.Y. Performance of Yield, Photosynthesis and Grain Quality of japonicaRice Cultivars UnderSalinity Stress in Micro-plots. Chinese Journal of Rice Science. 2018, 1, 146. [Google Scholar]
- Zhu, Y.; Guo, B.; Liu, C.; Lin, Y.; Fu, Q.; Li, N.; Li, H. Soil fertility, enzyme activity, and microbial community structure diversity among different soil textures under different land use types in coastal saline soil. Journal of Soils and Sediments. 2021, 21, 2240–2252. [Google Scholar] [CrossRef]
- Tan, J. L.; Kang, Y. H. Changes in soil properties under the influences of crop and drip irrigation during the reclamation of severe salt-affected soils. Agricultural Sciences in China. 2009, 8, 1228–1237. [Google Scholar] [CrossRef]
- Huang, L.; Bai, J.; Chen, B.; Zhang, K.; Huang, C.; Liu, P. Two-decade wetland cultivation and its effects on soil properties in salt marshes in the Yellow River Delta, China. Ecological Informatics. 2012, 10, 49–55. [Google Scholar] [CrossRef]
- Feng, H.; Wang, S.; Gao, Z.; Wang, Z.; Ren, X.; Hu, S.; Pan, H. Effect of land use on the composition of bacterial and fungal communities in saline–sodic soils. Land Degradation & Development 2019, 30, 1851–1860. [Google Scholar]
- Wong, V. N.; Greene, R. S. B.; Dalal, R. C.; Murphy, B. W. Soil carbon dynamics in saline and sodic soils: a review. Soil use and management. 2010, 26, 2–11. [Google Scholar] [CrossRef]
- Franklin, R. B.; Morrissey, E. M.; Morina, J. C. Changes in abundance and community structure of nitrate-reducing bacteria along a salinity gradient in tidal wetlands. Pedobiologia. 2017, 60, 21–26. [Google Scholar] [CrossRef]
- Xu, Z.; Shao, T.; Lv, Z.; Yue, Y.; Liu, A.; Long, X.; Zhou, Z.; Gao, X.; Rengel, Z. The mechanisms of improving coastal saline soils by planting rice. Sci Total Environ. 2020, 703, 135529. [Google Scholar] [CrossRef]
- Zhang, J.; Luo, S.; Ma, L.; Lin, X.; Zhang, J.; Zhang, J.; Li, X.; Wang, H.; Tian, C. Fungal community composition in sodic soils subjected to long-term rice cultivation. Archives of Agronomy and Soil Science. 2020, 66, 1410–1423. [Google Scholar] [CrossRef]
- Hussain, Q.; Pan, G. X.; Liu, Y. Z.; Zhang, A.; Li, L. Q.; Zhang, X. H.; Jin, Z. J. Microbial community dynamics and function associated with rhizosphere over periods of rice growth. Plant Soil Environ. 2012, 58, 55–61. [Google Scholar] [CrossRef]
- Imchen, M.; Kumavath, R.; Vaz, A.B.M.; Góes-Neto, A.; Barh, D.; Ghosh, P.; Kozyrovska, N.; Podolich, O.; Azevedo, V. 16S rRNA Gene Amplicon Based Metagenomic Signatures of Rhizobiome Community in Rice Field During Various Growth Stages. Front Microbiol. 2019, 10, 2103. [Google Scholar] [CrossRef]
- Okabe, A.; Toyota, K.; Kimura, M. Seasonal variations of phospholipid fatty acid composition in the floodwater of a Japanese paddy field under a long-term fertilizer trial. Soil science and plant nutrition. 2000, 46, 177–188. [Google Scholar] [CrossRef]
- Barreiros, L.; Manaia, C.M.; Nunes, O.C. Bacterial diversity and bioaugmentation in floodwater of a paddy field in the presence of the herbicide molinate. Biodegradation. 2011, 22, 445–61. [Google Scholar] [CrossRef]
- Janssen, P.H. Identifying the dominant soil bacterial taxa in libraries of 16S rRNA and 16S rRNA genes. Appl Environ Microbiol. 2006, 72, 1719–28. [Google Scholar] [CrossRef]
- Arjun, J. K.; Harikrishnan, K. Metagenomic analysis of bacterial diversity in the rice rhizosphere soil microbiome. Biotechnol Bioinf Bioeng. 2011, 1, 361–367. [Google Scholar]
- Chowdhury, S. P.; Schmid, M.; Hartmann, A.; Tripathi, A. K. Diversity of 16S-rRNA and nifH genes derived from rhizosphere soil and roots of an endemic drought tolerant grass, Lasiurus sindicus. European journal of soil biolog. 2009, 45, 114–122. [Google Scholar] [CrossRef]
- Philippot, L.; Raaijmakers, J.M.; Lemanceau, P.; van der Putten, W.H. Going back to the roots: the microbial ecology of the rhizosphere. Nat Rev Microbiol. 2013, 11, 789–99. [Google Scholar] [CrossRef] [PubMed]
- Edwards, J.; Johnson, C.; Santos-Medellín, C.; Lurie, E.; Podishetty, N.K.; Bhatnagar, S.; Eisen, J.A.; Sundaresan, V. Structure, variation, and assembly of the root-associated microbiomes of rice. Proc Natl Acad Sci U S A. 2015, 112, E911–20. [Google Scholar] [CrossRef] [PubMed]
- Wagner, M.R.; Lundberg, D.S.; Del Rio, T.G.; Tringe, S.G.; Dangl, J.L.; Mitchell-Olds, T. Host genotype and age shape the leaf and root microbiomes of a wild perennial plant. Nat Commun. 2016, 7, 12151. [Google Scholar] [CrossRef]
- Emmett, B.D.; Youngblut, N.D.; Buckley, D.H.; Drinkwater, L.E. Plant Phylogeny and Life History Shape Rhizosphere Bacterial Microbiome of Summer Annuals in an Agricultural Field. Front Microbiol. 2017, 8, 2414. [Google Scholar] [CrossRef]
- Li, Z.; Yu, J.; Peng, Y.; Huang, B. Metabolic pathways regulated by abscisic acid, salicylic acid and γ-aminobutyric acid in association with improved drought tolerance in creeping bentgrass (Agrostis stolonifera). Physiol Plant. 2017, 159, 42–58. [Google Scholar] [CrossRef]
- Carvalhais, L.C.; Dennis, P.G.; Badri, D.V.; Tyson, G.W.; Vivanco, J.M.; Schenk, P.M. Activation of the jasmonic acid plant defence pathway alters the composition of rhizosphere bacterial communities. PLoS One. 2013, 8, e56457. [Google Scholar] [CrossRef]
- Kniskern, J.M.; Traw, M.B.; Bergelson, J. Salicylic acid and jasmonic acid signaling defense pathways reduce natural bacterial diversity on Arabidopsis thaliana. Mol Plant Microbe Interact. 2007, 20, 1512–22. [Google Scholar] [CrossRef]
- Kuang, J.L.; Huang, L.N.; Chen, L.X.; Hua, Z.S.; Li, S.J.; Hu, M.; Li, J.T.; Shu, W.S. Contemporary environmental variation determines microbial diversity patterns in acid mine drainage. ISME J. 2013, 7, 1038–50. [Google Scholar] [CrossRef]
- Ahn, J.H.; Song, J.; Kim, B.Y.; Kim, M.S.; Joa, J.H.; Weon, H.Y. Characterization of the bacterial and archaeal communities in rice field soils subjected to long-term fertilization practices. J Microbiol. 2012, 50, 754–65. [Google Scholar] [CrossRef]
- Aguirre-von-Wobeser, E.; Rocha-Estrada, J.; Shapiro, L.R.; de la Torre, M. Enrichment of Verrucomicrobia, Actinobacteria and Burkholderiales drives selection of bacterial community from soil by maize roots in a traditional milpa agroecosystem. PLoS One. 2018, 13, e0208852. [Google Scholar] [CrossRef] [PubMed]
- Eichorst, S.A.; Trojan, D.; Roux, S.; Herbold, C.; Rattei, T.; Woebken, D. Genomic insights into the Acidobacteria reveal strategies for their success in terrestrial environments. Environ Microbiol. 2018, 20, 1041–1063. [Google Scholar] [CrossRef]
- Xu, R.; Sun, X.; Häggblom, M.M.; Dong, Y.; Zhang, M.; Yang, Z.; Xiao, E.; Xiao, T.; Gao, P.; Li, B.; Sun, W. Metabolic potentials of members of the class Acidobacteriia in metal-contaminated soils revealed by metagenomic analysis. Environ Microbiol. 2022, 24, 803–818. [Google Scholar] [CrossRef]
- Wang, C. Y.; Zhou, X.; Guo, D.; Zhao, J. H.; Yan, L.; Feng, G. Z.; Gao, Q.; Yu,H. ; Zhao, L. P. Soil pH is the primary factor driving the distribution and function of microorganisms in farmland soils in northeastern China. P. Soil pH is the primary factor driving the distribution and function of microorganisms in farmland soils in northeastern China. Annals of Microbiology. 2019, 69, 1461–1473. [Google Scholar]
- Nelson, M.B.; Martiny, A.C.; Martiny, J.B. Global biogeography of microbial nitrogen-cycling traits in soil. Proc Natl Acad Sci U S A. 2016, 113, 8033–40. [Google Scholar] [CrossRef] [PubMed]
- Gibbons, S.M. Microbial community ecology: Function over phylogeny. Nat Ecol Evol. 2017, 1, 32. [Google Scholar] [CrossRef]
- Louca, S.; Jacques, S.M.S.; Pires, A.P.F.; Leal, J.S.; González, A.L.; Doebeli, M.; Farjalla, V.F. Functional structure of the bromeliad tank microbiome is strongly shaped by local geochemical conditions. Environ Microbiol. 2017, 19, 3132–3151. [Google Scholar] [CrossRef]
- Delgado-Baquerizo, M.; Eldridge, D.J.; Ochoa, V.; Gozalo, B.; Singh, B.K.; Maestre, F.T. Soil microbial communities drive the resistance of ecosystem multifunctionality to global change in drylands across the globe. Ecol Lett. 2017, 20, 1295–1305. [Google Scholar] [CrossRef]
- Wu, T.; Shen, Y.; Zheng, M.; Yang, C.; Chen, Y.; Feng, Z.; Liu, X.; Liu, S.; Chen, Z.; Lei, C.; Wang, J.; Jiang, L.; Wan, J. Gene SGL, encoding a kinesin-like protein with transactivation activity, is involved in grain length and plant height in rice. Plant Cell Rep. 2014, 33, 235–44. [Google Scholar] [CrossRef]
- Guo, Y.; Song, B.; Li, A.; Wu, Q.; Huang, H.; Li, N.; Yang, Y.; Adams, J.M.; Yang, L. Higher pH is associated with enhanced co-occurrence network complexity, stability and nutrient cycling functions in the rice rhizosphere microbiome. Environ Microbiol. 2022, 24, 6200–6219. [Google Scholar] [CrossRef]
- Li, D.; Liu, C.M.; Luo, R.; Sadakane, K.; Lam, T.W. MEGAHIT: an ultra-fast single-node solution for large and complex metagenomics assembly via succinct de Bruijn graph. Bioinformatics. 2015, 31, 1674–6. [Google Scholar] [CrossRef] [PubMed]

| LJ177 | LT933 | HJ177 | HT933 | |
| Panicle number | 13.50±1.29b | 17.25±2.75a | 15.50±1.00ab | 18±1.41a |
| Grains per panicle | 180.42±1.49a | 136.58±7.07b | 192.03±20.59a | 148.75±14.56b |
| Seed setting rate | 0.92±0.01a | 0.94±0.04a | 0.93±0.02a | 0.93±0.02a |
| 1000-grain weight (g) | 25.05±1.70a | 20.18±0.37c | 22.59±0.56b | 21.39±0.39bc |
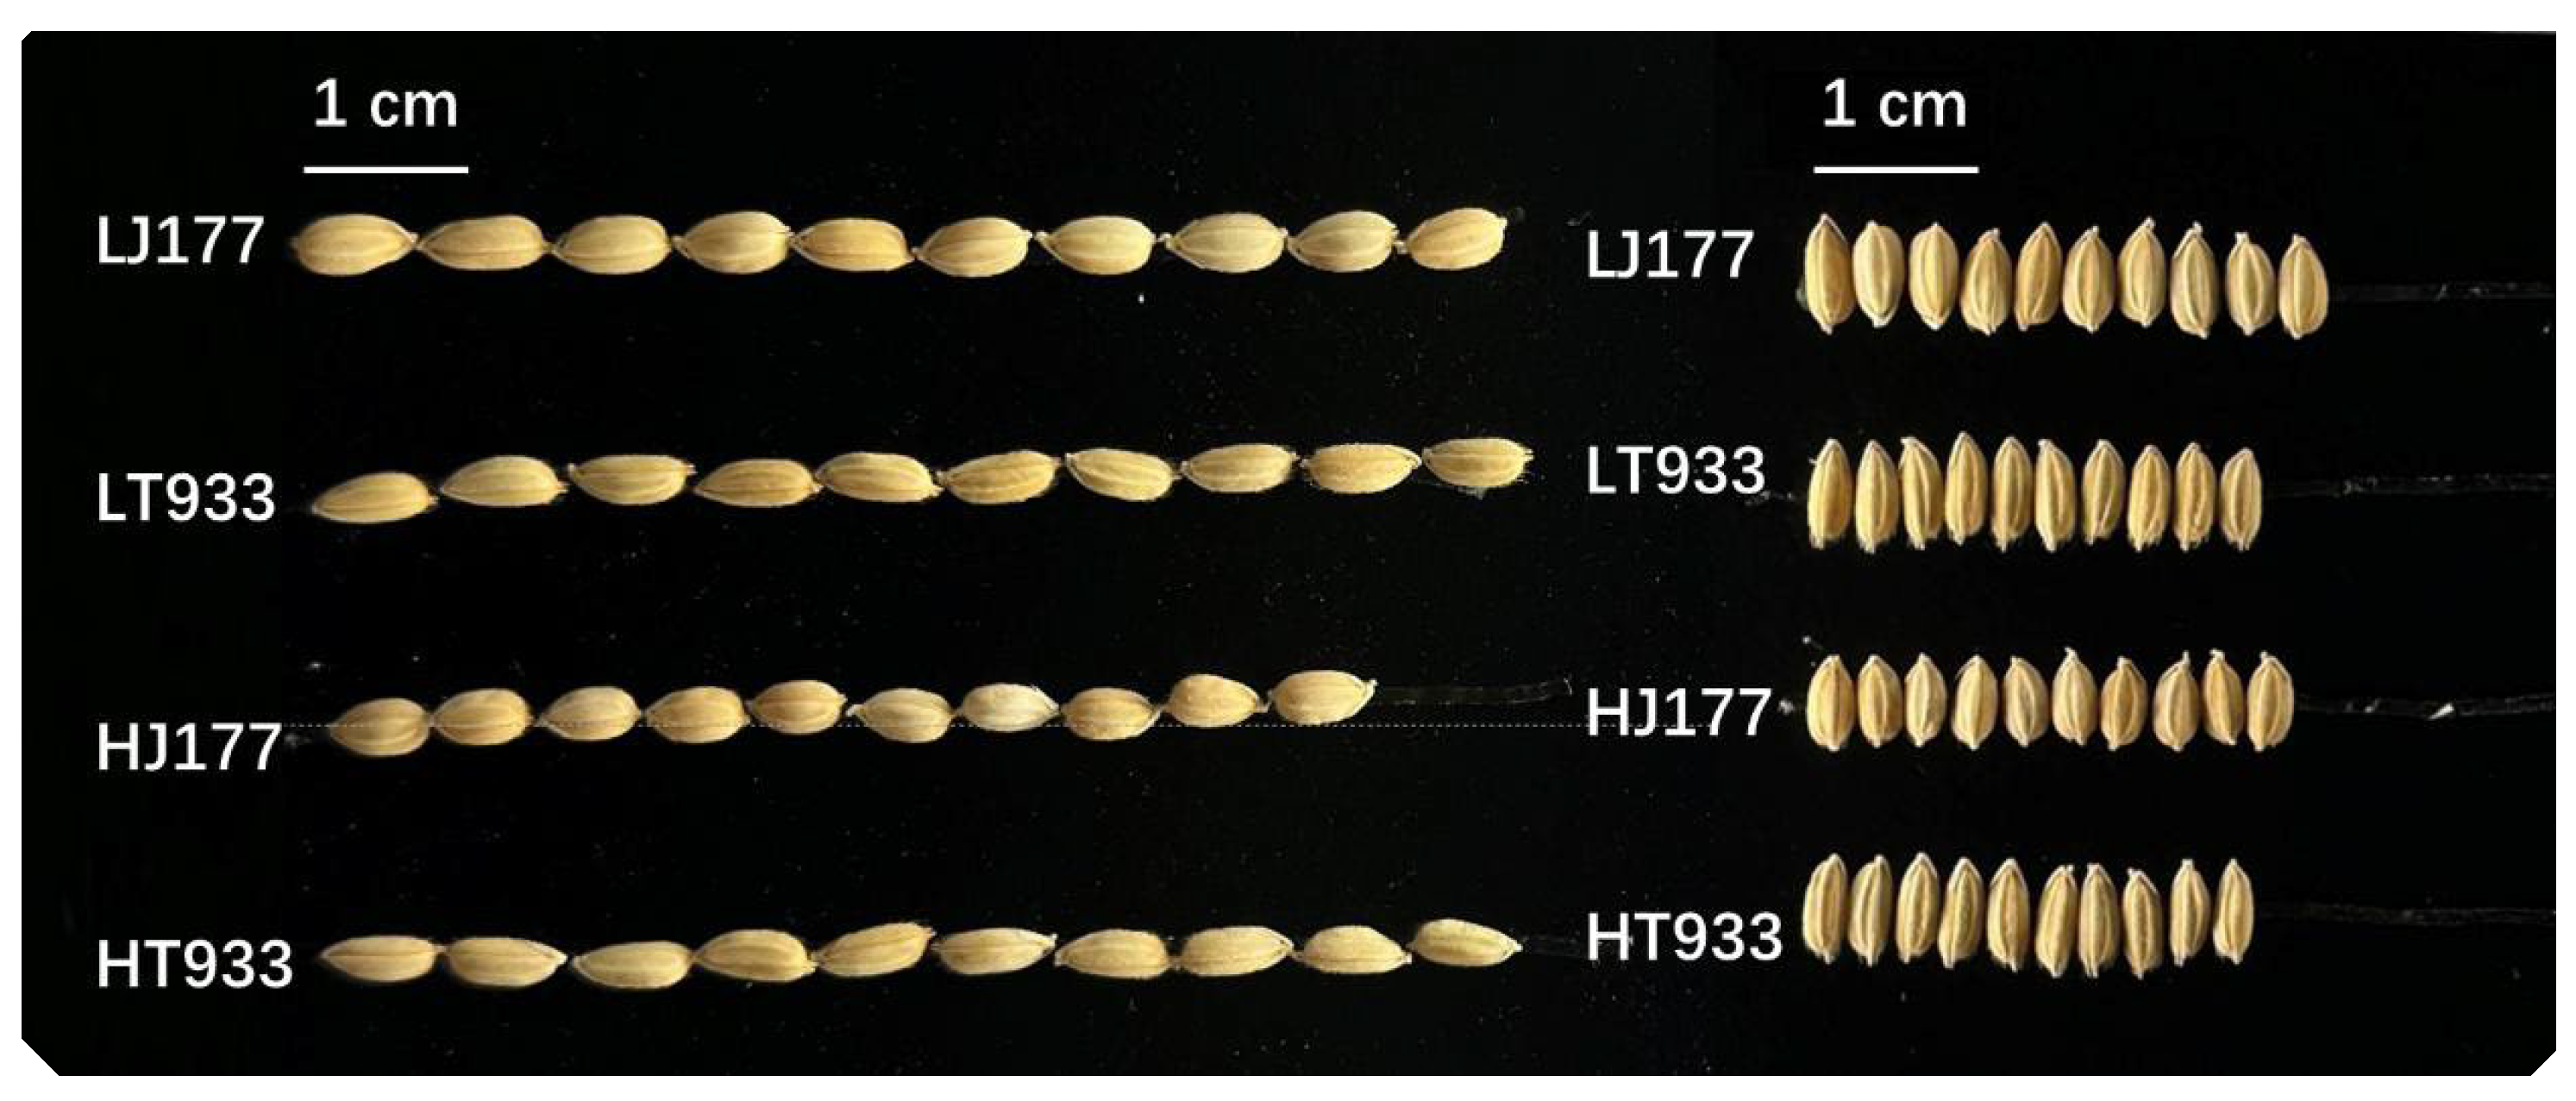
| Seed length (mm) | 7.21±0.05c | 7.37±0.06b | 6.55±0.03d | 7.56±0.03a |
| Seed width (mm) | 3.71±0.04a | 3.02±0.02c | 3.48±0.05b | 3.07±0.01c |
| Protein (%) | 6.81±0.65bc | 6.43±0.39c | 8.26±0.73a | 7.68±0.84ab |
| Fat (%) | 2.01±0.21a | 2.41±0.40a | 2.16±0.59a | 2.54±0.43a |
| Amylose (% total starch) | 18.04±0.05a | 17.99±0.18a | 17.79±0.13b | 18.11±0.16a |
| Properties | LCK | LJ177 | LT933 | HCK | HJ177 | HT933 |
| pH | 7.56±0.05b | 6.58±0.08e | 6.96±0.06d | 8.2±0.02a | 6.96±0.05d | 7.17±0.1c |
| Salinity (g kg-1) | 1.92±0.04b | 0.78±0.01d | 0.84±0.04d | 2.99±0.08a | 0.79±0.05d | 1.16±0.07c |
| SOC (g kg-1) | 17.58±0.75d | 29.63±0.97a | 28.23±1.31b | 14.2±0.57e | 28.34±1.04b | 22.14±0.77c |
| TN (g kg-1) | 0.75±0.02c | 0.92±0.01a | 0.89±0.01b | 0.56±0.02f | 0.63±0.01d | 0.6±0.01e |
| AN (mg kg-1) | 70.94±0.97d | 95.91±2.7a | 84.6±3.16c | 67.42±1.04e | 90.17±3.08b | 72.17±3.02d |
| AP (mg kg-1) | 41.33±0.49d | 54.92±1.84a | 48.76±0.96c | 37.25±0.94e | 51.63±1.38b | 43.55±1.71d |
| AK (mg kg-1) | 172.24±2.33d | 203.41±2.65b | 188.07±1.89c | 171.14±1.95d | 208.86±2.34a | 189.92±1.12c |
| LJ177 | LT933 | HJ177 | HT933 | |
|---|---|---|---|---|
| chao | 22800±99a | 22662±75a | 22673±102a | 22860±170a |
| shannon | 5.98±0.02b | 5.98±0.02b | 6.06±0.01a | 6.04±0.01a |
| simpon | 0.012±0.00a | 0.012±0.00a | 0.010±0.00b | 0.011±0.01b |
| coverage | 1 | 1 | 1 | 1 |
Disclaimer/Publisher’s Note: The statements, opinions and data contained in all publications are solely those of the individual author(s) and contributor(s) and not of MDPI and/or the editor(s). MDPI and/or the editor(s) disclaim responsibility for any injury to people or property resulting from any ideas, methods, instructions or products referred to in the content. |
© 2024 by the authors. Licensee MDPI, Basel, Switzerland. This article is an open access article distributed under the terms and conditions of the Creative Commons Attribution (CC BY) license (http://creativecommons.org/licenses/by/4.0/).


