
Submitted:
13 November 2024
Posted:
14 November 2024
You are already at the latest version
Abstract
Monoraphidium griffithii and Desmodesmus sp. microalgae cultures were exploited to examine the CO2 fixation efficiency in a bubble column photobioreactor (PBR). Two medium were used as the control groups to compare the effect of CO2 solubility in modified woods hole (MWH) medium and distilled water. Experiments were performed indoors using experimental apparatus consisting of 4 vertical bubble columns in total and injecting real biogas with 36% of CO2 and 56% of CH4 taken from wastewater treatment plant. As a result, system using Monoraphidium griffithii and Desmodesmus sp. cultures improved CO2 removal efficiency by 11.2% and 5.5% compared to MWH medium, respectively. In addition, 86.1% of the CO2 in the biogas could be captured by the Monoraphidium griffithii culture and 80.4% - by the Desmodesmus sp. culture. CH4 content in the effluent biogas increased from 56.1% to 66.4% using Monoraphidium griffithii culture. CH4 concentration in distilled water increased from 56.1% to 63.2% because CO2 is soluble in water, whereas CH4 has low solubility. Consequently, the volume of CH4 increased. After 32-36 hours, all media reached their saturation point, and the CO2 concentration returned to its starting value. The established microalgae culture system with intermittent operation could be efficiently used as a CO2 capture technology for biogas upgrading.
Keywords:
biogas purification
; microorganisms
; microalgae
; biological treatment
; photobioreactor
1. Introduction
Biogas production by anaerobic treatment of organic waste is one of the most effective ways to mitigate climate change. This kind of treatment of the waste releases biogas, which primarily consists of methane (CH4), carbon dioxide (CO2), oxygen (O2), nitrogen (N2), and hydrogen sulphide (H2S) [1]. The composition of biogas affects the operation of cogeneration engines and the energy value of biogas itself [1]. Reducing CO2 concentration can increase the energy value of biogas and thus satisfy the standards in a specific country for the injection of biogas into natural gas pipe network or the usage for vehicles [2].
Various methods are employed worldwide to enhance biogas purification processes: chemical, physical, vacuum swing adsorption, and the biological one [3,4,5,6,7]. In particular, the potential of biological methods is being extensively studied and assessed. Efforts have been made to use microalgae cultures for biogas purification more intensively due to two main reasons: production of highly purified biogas and generation of microalgae biomass [8,9]. Firstly, biologically purified biogas can be transformed into nearly pure CH4, allowing the upgraded biogas to be supplied to natural gas networks, effectively replacing them as a substitute. A higher concentration of CH₄ in biogas indicates greater energy efficiency and increased power generation potential in CH₄-based energy systems. In such case, clear economic benefits would be achieved [10,11,12]. Moreover, highly purified biogas can be used as a fuel for transport vehicles when quality and compliance requirements of these fuels, which differ from country to country, are met [13,14]. However, the presence of a high amount of non-combustible CO₂ reduces the calorific value of raw biogas [15]. As a result, biogas upgrading technologies are necessary to enhance its calorific value. Capturing CO2 from biogas can be named as effective biogas upgrading technology.
Different microalgae species have been used for biogas upgrading. Microalgae species used for CO2 mitigation include Chlorella vulgaris [16], Chlorella kessleri [17], Monoraphidium griffithii [18], Botryococcus braunii and Scenedesmus sp. [19]. An algae photobioreactor (PBR) with Chlorella vulgaris suspension can be used to produce and sustain big biomass production and the CO2 capture rate in a wide range of CO2 concentrations from 0.04% to 18% [16] when operated in continuous flow mode [20]. As it is known that CO2 content in the biogas can range from 30% to 50% [21], it is important to search for CO2 tolerant microalgae species, which could be used in the PBR. Some CO2 tolerant microalgae like, Desmodesmus sp., can grow at CO2 concentration of 50% or higher [22]. Choosing the right microalgal strains is crucial for biogas upgrading systems operating under high CO2 partial pressure.
Photosynthetic cultivation of microalgae can be performed in both open pond system or closed PBR. Different types of closed PBRs have been used for cultivation of green microalgae, including flat-plate, tubular and column type [23]. Column-type PBRs can be further categorized into stirred-tank PBRs and aerated columns, which include bubble columns or airlift systems. Vertical PBR consists of a transparent column most usually produced from high quality glass, and is encased in a water jacket. This jacket enables temperature control by circulating water while still allowing sufficient light to penetrate the system [24]. The benefits of bubble column PBRs include their mechanical simplicity, low initial cost, efficient heat and mass transfer capabilities, and the absence of moving parts.
A thorough understanding of various aspects of cell physiology and behavior is essential for the successful implementation of a PBR. Physicochemical parameters such as nutrient availability and pH have a significant influence on performance of PBR. Enhancing the nutrient medium for cultivating microalgae is done to improve the efficiency of CO₂ capture. Chemical composition of culture medium is vital for microalgae growth, therefore some studies have shown that addition of sodium bicarbonate (NaHCO3) significantly improved microalgae productivity, as well as CO2 utilization process [25]. Other study showed importance of nitrogen source (NO3-N) on green algae (Chlorella and Scenedesmus) growth prolongation and CO2 fixation improvement [26]. Magnesium (Mg) can act as central atom of chlorophyll and participate in photosynthesis, while calcium (Ca) can participate in many cellular metabolic activities [27].
Another factor important in PBR performance is pH. Optimum range of pH is important for the overall health of microalgae culture, which is involved in the uptake CO2 and other important nutrients. It has been reported that optimal medium pH range for the microalgae growth is 7-9 [28], however most of the species show a maximum activity at pH 7-8 [21]. If pH is not kept at the ideal value, there is a risk of biomass production decrease. pH is heavily affected by the concentration of dissolved carbon species [23]. CO2 in water can be found in different forms according to pH: in acidic pH (<5) dissolved carbon can be found in the form of CO2, in neutral system (7<pH<9) as HCO3- and in alkaline pH (>9) as CO32-. An alkaline pH is favorable for biogas upgrading because it increases the solubility of CO2 [21].
Besides physicochemical parameters, another factors affecting CO2 capture and microalgae growth are physical and operational such as light intensity and light wavelength. In general, the amount of light energy absorbed and stored by the cells is directly linked to their carbon fixation capacity, which in turn influences biomass productivity and the cell growth rate [29]. Thus, improving light utilization efficiency is crucial for achieving greater CO2 fixation capacity. It is known, that any photosynthetic system has its saturation point where further increasing of light intensity does not benefit CO2 fixation or productivity. One study [30] showed that the highest CO2 removal ratio (67%) by Scenedesmus obliquus strain WUST4 was achieved at 12,000-13,000 lx. However, CO2 removal rate declined at higher light levels (>13,000 lx) due to inhibition of algal photosynthesis. Light driven growth follows saturation kinetics as well, when maximum growth efficiency is achieved once a threshold of light intensity is exceeded [31]. As light intensity increases, a saturation point is reached, causing growth to stabilize. However, further increase of light intensity may kill the cells. For example, Ogbonna et al. [32] showed that optimal light intensity for Desmodesmus subspicatus biomass production was 5,000 lx. However, the increase of light intensity (from 5,000 lx to 10,000 lx) led to the destruction of microorganisms. As can be seen from the reviewed studies, the light intensity affects both CO2 fixation and biomass productivity, which may differ depending on the microalgae species, so the optimal light intensity should be selected taking into account the species under consideration. To sum up, nutrients, pH and light could be ascribed as most important factors for the growth of microalgae and CO2 fixation.
Moreover, the pigments in chloroplasts absorb light differently depending on the light’s wavelength (ranging from 400 nm to 700 nm), which in turn influences photosynthesis process in microalgae based on the light wavelength or color [27]. One of such pigment found in green algae is chlorophyll, which captures photosynthetic light. Studies have demonstrated that green algae exhibit better growth under blue and red light because they contain chlorophyll a and b, which are key pigments for capturing light and are particularly responsive to these wavelengths [33]. Improved green algae growth was observed in this region.
Among all the physical and chemical technologies used for biogas purification, water washing method is the closest technology to the biological biogas treatment in PBR. Water washing is a physical CO2 absorption method [34]. In comparison to the methods mentioned above, the water washing technique uses water as the absorbent and offers benefits such as lower cost, greater stability and safety, and a more environmentally friendly approach. It is still commonly used in European industries today, particularly for upgrading biogas. One study [35] showed that significant removal efficiency of 86% can be achieved using water wash concept for CO2 capture. Considering that biogas purification takes place in a closed PBR due to microalgae suspension (liquid medium), it is not difficult to see similarities between this technology and physical absorption process, where purification also takes place in a liquid medium, in that case, water. In both technologies, the components of biogas are physically absorbed, in first case by live organisms – microalgae suspension, in second case – by water [36,37].
This reasearch focused on the process of biogas upgrading mediated by microalgae species that have not been widely studied for this application. The study investigated two microalgae culture systems (Monoraphidium griffithi and Desmodesmus sp.) and two systems without microalgae cultures (mineral salt media and aqueous media) with the following objectives: 1) compare the efficiency of biogas purification using different microalgae cultures (Monoraphidium griffithi and Desmodesmus sp.) and absorbents (mineral salt solution and water); 2) determine Monoraphidium griffithi and Desmodesmus sp. capacities to capture CO2.
2. Materials and Methods
2.1. Microalgal Species and Cultivation Conditions
Monoraphidium griffithi and Desmodesmus sp. microalgae cultures were prepared by inoculating microalgal solids. The microalgae were selected from a microalgae collection housed at Nature Research Centre in Lithuania. Before the experiment, microalgae were inoculated for 14 days in MWH (Modified Woods Hole) medium. The composition of the nutrient-saturated MWH medium is given in Table 1. Water quality met the required elements for microalgae growth, and it contained more nitrogen (N), magnesium (Mg) and calcium (Ca). Macronutrients, such as N and phosphorus (P), are vital for the general growth and development of microalgae, while micronutrients, such as vitamins and trace metals, though needed in smaller amounts, are just as critical for their optimal growth and CO2 absorption [38].
The trace elements were mixed with distilled water in the appropriate ratio given in Table 1. Prior to studying the shape, size, and quantity of microalgal cells, they were cultivated in an algal culture reactor at the Nature Research Center for a period of 20-30 days. The algae cultivation occurred at room temperature of 22±2 °C under fluorescent lamps emitting approximately 250 μmol/m2/s of white light for about of 10 h per each day. Light intensity was measured using a LI190SA Quantum Data Logger (model LI-1400). Additionally, oxygen was introduced into the microalgae suspension during inoculation to enhance the growth rate and concentration of the cultures. The physical and chemical parameters of the suspensions are given in Table 2.
A total of 4 liters of microalgae suspension was required, since it corresponds to the volume of the columns in the experimental setup. The microalgae medium was diluted with the nutrient medium in a way that ensured uniform chlorophyll content across all microalgae suspensions. The initial chlorophyll concentration was 325±10 mg/L, while initial concentration of microalgae was 565±30×103 cells/m.
2.2. Experimental Apparatus
The experimental bench consisted of a bag for inlet biogas, compressor, PBR, and bag for outlet biogas. The PBR consisted of biogas inlet system, LED lighting system, four columns (each with a volume of 4 litres), and biogas outlet system. A scheme of the experimental apparatus can be seen in Figure 1.
The experimental apparatus consisted of four columns: two with different microalgae suspensions (Monoraphidium griffithii; Desmodesmus sp.) and the other two with MWH medium and distilled water used as a nutrient and water source for the cultivation of the microalgae in the PBR. Before filling the columns with microalgae suspensions, MWH medium, and distilled water, their physical and chemical parameters were measured: pH, electrical conductivity, redox potential, total dissolved solids (TDS) and chlorophyll concentration. To compare the effect of nutrient medium and water on CO2 purification from biogas, two columns were filled with these suspensions.
Biogas from the tank was supplied by a compressor through a distributor to four columns. Each column was 2.0 m in height and 0.05 m in diameter. The distributor was equipped with valves that allowed regulation of biogas flow to each column. To ensure uniform biogas distribution across the entire cross-sectional area of the columns, diffusers were installed at the bottoms of the columns, breaking down biogas into small air bubbles, which enhanced the absorption and decomposition of its components. The columns were side-lit with LED blue light source equipped with dimmers and adjustable wavelengths ranging from 450 to 480 nm (Figure 1). After purification, the biogas was collected in a 2 m3 tank.
To facilitate photosynthesis in the PBR columns, a white-light LED source was used for illumination. The LED source was positioned 20 cm away from the columns to ensure an even distribution of light across their entire surface area. The light intensity was adjusted to achieve illumination level of 5000 lx, while the temperature was maintained at 20.2±1 °C.
2.3. Biogas and Calculations of Biomedium Viscosity and Bubble Rise Velocity
In this study, biogas generated from anaerobic treatment of sewage sludge was utilized. The biogas for the experiments was sourced from the Vilnius wastewater treatment plant. Its composition consisted of 56.1% methane, 35.8% carbon dioxide, 2.5% oxygen and 2 ppm hydrogen sulphide. The biogas was supplied to the columns of the experimental setup at a flow rate of 0.2 L/min.
The biogas passed through columns for 36 hours under plug-flow operation. Using the Hadamard-Rybczynski equation [39], the average dynamic viscosity was determined to be 0.00127 Pa·s. At this viscosity, the biogas bubbles rose at an average speed of 0.6635 m/s. Having a column height of 200 cm and a width of 5 cm, the calculated retention time for biogas, based on bubble rise speed of 0.6635 m/s, was 3.01 seconds. The biogas was sampled and its composition was measured from each column every 2 hours, excluding a 12-hour period overnight from 10 p.m. to 10 a.m., with measurements repeated three times.
2.4. Estimation of the Microalgae Growth Rate
Prior to calculating the biomass growth rate, the biomass quantity was estimated. The estimation involved counting the microalgae cells and assessing their shape and size. The microalgae Monoraphidium griffithii had a spindle shape, and their volume was determined using Equation 1:
where VC is the volume of the spindle-shaped cell (μm3); d is the diameter of the cell (μm); l is the length of the cell (μm).
The volume of Desmodesmus sp. microalgae was determined using Equation 2:
where Velip denotes the volume of the spindle-shaped cell (μm3); d represents the diameter of the cell (μm); l indicates the length of the cell (μm).
The weight of algal biomass was determined using Equation 3:
where Kmic represents the weight of the wet algal biomass (μg); V is the volume of algal cell (μm3); CC is the cell count per 1 mL.
2.5. Analytical Methods and Statistical Analysis
The biogas composition was measured using the nondispersive infrared (NDIR) technique with the dual beam method. Biogas composition measurements were taken with an INCA 4000 biogas analyzer, which provides concentrations of methane (%), carbon dioxide (%), oxygen (%) and hydrogen sulfide (ppm). The analyzer’s measurement ranges and accuracy are as follows: oxygen – 0-25% (±1%), hydrogen sulphide – 0-100 ppm (±5%), methane – 0-100% (±1%), carbon dioxide – 0-100 (±1%).
For pH determination, the WTW ™ SenTix ™ 980 Digital IDS pH electrode pH meter was used, which measures pH of the solution within a range from 0 to 14 (±0.1 accuracy) and temperature from -5 °C to 60 °C (±0.5 °C accuracy). Redox potential, TDS and temperature were measured using the SenTix® ORP-T 900 ORP electrolyte, with measurement range of -1250 to 1250 mV for redox potential, 0-100 °C for temperature, and 0-2000 mg/l for TDS. Electrical conductivity was measured using the WTW TertraCon 925 sensor, which has a measurement range from 1µS/cm to 2 S/cm. Light intensity was measured using a Metrel Poly MI6401 luxmeter, which operates within a 0-10,000 lx range. Chlorophyll content was analyzed with an AlgaeLab Analyser chlorimeter. Studies on microalgal cell shape, size, and quantity were conducted using a Nikon ECLIPSE Ci-L optical microscope, which has a resolution of 1 µm and a magnification capability up to 600 times.
The data were analyzed and presented as mean ± standard deviation based on three independent assays. Calculated statistical indicators included arithmetic mean of measurements, arithmetic variance, and standard deviation of arithmetic mean. Microsoft Office Excel 2003 was used to perform these calculations.
3. Results
The physical and chemical parameters of the suspensions were measured prior to the experiment, after 12 hours of biogas purification, and again after 36 hours of biogas purification. The pH dynamics are shown in Figure 2a. The results show that in all media pH decreased slightly over time from 0 to 36 hours, which was expected, due to the higher concentration of CO2 concentration in the biogas. High biogas CO2 concentration increase the partial pressure of dissolved CO2 and the concentration of carbonic acid, this way reducing pH [40]. Therefore, constant pH drop in all tretaments could be explained by relatively stable gas-liquids CO2 dynamics. On the other hand, the electrical conductivity parameter increased almost for all media including Monoraphidium griffithii suspension, MWH medium and the distilled water, except for the Desmodesmus sp. suspension, where it dropped (Figure 2b). The sum of all inorganic salts is the TDS, which is almost the same as salinity [41]. According to Figure 2c, TDS for MWH medium that contained Desmodesmus sp. did not show significant changes from 0 to 36 hours and was similar to the values obtained from MWH medium itself. However, in the case of TDS for MWH medium that contained Monoraphidium griffithii, it was a more significant rise of TDS by 130 mg/l after 12 hours and by 99 mg/l after 36 hours compared to MWH medium. However, an observed decrease in TDS with time shows that Monoraphidium griffithii utilized dissolved solids for growth and metabolism through bioabsorption/adsorption. Many researchers have reported a reduction in TDS during water treatment using microalgae [42]. The chlorophyll concentration parameter is only relevant for microalgae suspensions, but in both cases the chlorophyll concentration increased, which means that the biomass of the microalgae grew during experiment (Figure 2d). Chlorophyll content reached its peak (341 mg/l) in Desmodesmus sp. group at the end of the experiment (after 36 hours), meanwhile in Monoraphidium griffithii group peak (355 mg/l) was reached at the beginning (after 12 hours) and even at the end was higher than in Desmodesmus sp. group. These results suggest that Monoraphidium griffithii system should be more beneficial for purifying biogas what was later proved by the CO2 fixation analysis. Redox potential can be used for monitoring oxidative stress, thus this parameter was recorded during this study as well. High redox potential was recorded in all suspensions during the entire study. After 36 hours, the redox potential increased in Monoraphidium griffithii microalgae suspension and reached 265 mV.
Figure 3 shows how the CO2 concentration in the biogas varied over time as it passed through different media. The CO2 removal results show that within the first 2 hours of the experiment, all media achieved a significant reduction in biogas CO2 concentration, with the largest decrease observed in Monoraphidium griffithii, where CO2 levels dropped from 35.8% to 5.0%, resulting in 86.0% removal efficiency. This high efficiency could be attributed to the high solubility of CO2 in water. In comparison, Desmodesmus sp. and distilled water achieved CO2 cleaning efficiencies of 80.4% and 67.9%, respectively, over the same period of time. The MWH medium reduced CO2 concentration from 35.8% to 9.0%, resulting in the lowest cleaning efficiency of 74.9% at that time point. Compared to other studies, different microalgae species have demonstrated similar CO2 removal efficiencies from biogas. Study performed by Kao et al. [39] using outdoor microalgae incroporating PBR showed that CO2 (20%) capture efficiency by the Chlorella sp. culture after desulfurized biogas (H2S < 50 ppm) aeration was 86% at a gas flow rate of 0.05 vvm.
Figure 4 shows how CH4 concentration in the biogas changed over time as it flowed through various media. Significant changes in CH4 concentration can be seen within first 2-4 hours of the experiment. Compared to CO2 the CH4 gas has significantly lower solubility in distilled water, therefore there was no loss of CH4 from biogas when its concentration increased from 56.1% to 63.2% within first 2 hours, so the quality of biogas improved, but not as much as with microalgae. The results showed that using Monoraphidium griffithii, in the beginning (during first 2 hours) CH4 concentration increased by 15.1% (to 66.1%), whereas when using Desmodesmus sp. – by 13.8% (to 65.1%). The highest CH4 concentration was reached with Monoraphidium griffithii 66.4% (increase of 15.4%) after 4 hours of experiment. At 97% methane, biogas can produce 9.67 kWh [43], with methane’s energy value at 37.78 MJ/Nm³ [44]. Using a photobioreactor, Monoraphidium griffithii and Desmodesmus sp. can generate 6.59 and 6.49 kWh/Nm³, with biogas energy values reaching 24.97 and 24.59 MJ/Nm³, respectively. Compared to other microalgae species, a higher methane increase can be achieved after biogas upgrading process. For example, one study showed that CH4 concentration in the biogas effluent from the Chlorella sp. culture increased from its original 70% to 85-90% [45]. The enrichment of CH4 in biogas was contributed to the removal of CO2.
The O2 results indicate that after 2 hours from the start of the experiment, the O2 concentration rose at different rates across all media (Figure 5). The highest O2 concentration in purified biogas was observed after 2 hours of treatment with Monoraphidium griffithii, reaching 8.7% (up from 2.6%), which indicates lower biogas quality and safety. At this time point, average O2 concentrations in Monoraphidium griffithii and Desmodesmus sp. were 8.7% and 7.5%, respectively. This rise of O2 can be attributed to the oxygen produced by microalgae through photosynthesis process. After 36 hours, the O2 concentration gradually declined, nearing its initial level measured before the experiment, suggesting the biogas reached an intermediate saturation point. However, final O2 concentration in the upgraded biogas did not meet international regulations for natural gas pipeline network (≤1%) and this technology should be optimized further [15]. It has also been noted that the presence of H₂S in biogas can lead to sulfur oxidation (formation of SO2- and H2O) when O₂ is present, what could also result in a decrease in the O₂ content of the upgraded biogas [46]. Although H2S was present in the purified biogas, its amount was probably insufficient (0.0002%) for mentioned reactions to occur.
The graphs above indicate that biogas purification using microalgae, distilled water, and MWH medium effectively reduces CO2 concentrations within a short period of time – 2 hours. However, after this initial phase, the cleaning efficiency of all media declines, and by 32-36 hours, when saturation point is reached, the biogas purification process stops. Thus, to maintain effective biogas purification process over time, the media must be periodically regenerated or replaced. Besides, combining such technologies like water washing and PBR may also be beneficial. However, it was demonstrated that Monoraphidium griffithii contribution to CO2 removal from biogas, excluding water absorption, was only 3.1%. While distilled water alone (representing water physical absorption process) showed strong CO2 removal, it also exhibited high CH4 solubility, leading to significant CH4 losses, which is inefficient for improving biogas quality.
The results of the biomass growth rate are presented in Table 3. Research revealed that the highest microalgae growth was obtained in the suspension containing Monoraphidium griffithi, reaching 1.10 g/l/h. During the experiments, a positive microalgae biomass growth rate was determined.
These results demonstrate that both cultures (Monoraphidium griffithi and Desmodesmus sp.) can grow well in an indoor PBR aerated directly with biogas. Additionally, microalgae weight growth with time agreeded well with biogas CO2 removal, suggesting that CO2 as a carbon source facilitated microalgae growth. A similar trend at relatively high CO2 level of 20% was observed in other study [47].
4. Discussion
Microalgae are diverse group of fast-growing microorganisms capable of photoautotrophic, heterotrophic, and mixotrophic growth. They can be cultivated on non-fertile land and have CO2 fixation capacity 10–50 times higher than that of terrestrial plants [48]. In this context, microalgae offer an efficient method for CO₂ fixation and the generation of valuable products, which can be used in different sectors, including pharmaceutical and cosmetics, wastewater treatment and biogas treatment [49]. To make microalgal CO2 fixation applicable to the treatment of actual biogas, some problems should be overcome. Firstly, since concentrations of CO2 in biogases are usually in the range of 30-50%, one of the step for efficient CO2 fixation would be increased tolerance of microalgal species to high CO2 concentrations (20-55%) [22]. This study results showed that both Monoraphidium griffithii and Desmodesmus sp. microalgae species can tolerate CO2 concentration of 36% and efficiently remove it from the real biogas stream. However, CO2 saturation point was reached pretty fast (after 32-36 hours), thus in order to prolong exponential phase of algal growth and CO2 fixation, spent medium should be periodically exchanged with fresh medium [26]. Usually nitrogen source (nitrate) is consumed more quickly than other medium components and becomes a limiting factor in the early stage of cultivation.
In this study different parameters affecting CO2 fixation have been analyzed. One of such parameter was redox potential which shows oxidative or reductive state of a system, indicating whether environment is more oxidizing or reducing. Redox potential gives insights into balance between light and dark reactions. High redox potential could indicate oxidative stress, which can be triggered by imbalance between the production of oxidant compounds and the activity of antioxidant defense systems [50]. Too positive (oxidized) redox potential can lead to the formation of reactive oxygen species (ROS), which damage cellular components, including those involved in photosynthesis and CO2 fixation. Study performed by Ferreira et al. [50] showed that B3 vitamins not only increased Chlorella vulgaris biomass, but also increased capacity for CO2 biofixation. It was also showed that B3 vitamins, regardless of the used source, reduced redox potential in the PBRs from around 400 mV to around 250 mV, therefore can be called as an antioxidant agent. In our study, a similar redox potential (265 mV) was recorded at the end of the study (after 36 hours), so it can be said that the studied PBR systems with different microalgae (e.g. Monoraphidium griffithii) did not experience oxidative stress, as was shown by the results of increased biomass.
Another important parameter in PBRs with microalgae suspension studies is TDS. TDS shows total dissolved substances (salts, minerals, organic compounds) in water, which can have high impact on microalgae growth, metabolism and CO2 fixation. When TDS is too low, essential nutrients may decrease microalgal growth. However, excessive TDS can imbalance certain ions, which could inhibit growth via osmotic/metabolic stress. Our study results showed that obtained TDS values were sufficient to sustain photosynthetic growth of Monoraphidium griffithii and Desmodesmus sp. within studied PBR. It can be concluded that MWH medium contained enough dissolved nutrients to support microalgae growth.
The CO2 gas concentration consistently increased until 18-20 hour of our experiment, at which point it stabilised and nearly matched pre-experimental concentration. This likely represents CO2 saturation point, beyond which the medium can no longer be purified effectively and requires regeneration or replacement in the columns. Comparing results of the 36-hour distilled water trial (representing water physical absorption) with microalgae trial (representing the PBR), it is possible to assess CO2 removal efficiency, excluding water’s impact. Distilled water achieved CO2 concentration of 35.0%, Monoraphidium griffithii reached 32.0% and Desmodesmus sp. also achieved 32.0%. The CO2 concentration after treatment with Monoraphidium griffithii was 0.7% lower than with distilled water, indicating Monoraphidium griffithii contributed only 3.1% to CO2 removal excluding impact of physical water absorption. On the other hand, CO2 levels after treatment with Desmodesmus sp. were 2.2% higher than with distilled water, meaning that Desmodesmus sp. was less effective in CO2 removal. Other study showed that Scenedesmus sp. could simultaneously assimilate biogas CO2 and organic carbon from digestate. When the digestate concentration was 5 g COD/L, it achieved the highest algal biomass concentration, COD removal, and bio-CO2 fixation efficiency with values of 1.79 g/L, 69.1% and 98.2%, respectively, over a 10-day cultivation period [51].
The concentrations of CO2 and CH4 in biogas are influenced by the biogas residence time within the PBR. During the experiments, it was observed that biogas remained in the PBR for 5.5 seconds. The increase in O2 concentration as biogas passed through the macroalgae columns demonstrated the microalgae’s activity. This effectiveness was further evidenced by pH measurements. When biogas passes through the water, it becomes saturated with CO2, necessitating water regeneration. Meanwhile, macroalgae absorb inorganic carbon from CO2, reducing the CO2 concentration in the biogas while increasing O2 levels. Our experiments confirmed this effect.
An increase in CH4 concentration was observed from 2 to 4 hours across all media. Basically, beyond this period and until the end of the experiment, the CH4 concentration gradually decreased across all media, returning to its nearly initial level by 32-36 hours. Since values remained steady between 32-36 hours, it can be assumed that the media reached methane’s solubility limits (saturation point). Similarly, as previously was shown in Figure 3, the CO2 saturation point was also reached after 32-36 hours. For CO2, the the process kinetics limit the process until all carbonate reactants are enganged, along with the flow of the water volume [52].
5. Conclusions
Biogas purification results revealed that all media could significantly lower CO2 concentrations within 2 hours, with Monoraphidium griffithii achieving the highest CO2 removal efficiency of 86.0%. Desmodesmus sp. and MWH medium achieved CO2 removal efficiencies of 86.0% and 80.4%, respectively, while distilled water reached 67.9%. According to the experimental results, CH4 was more soluble in distilled water, resulting in high methane losses in biogas (from 56.1% to 47.8%), making it of poorer quality than purified with other media. CO2 removal from biogas using microalgae suspensions and distilled water showed that Monoraphidium griffithii contributed only 3.1% beyond water’s effect. Based on changes in CO2, CH4 and O2 concentrations over time, their saturation points in various media were identified at 32-36 hours from the beginning of the experiment. Specifically, saturation points in distilled water and microalgae suspensions marks the point when CO2 is no longer soluble, indicating that media regeneration or replacement is necessary for continued efficient biogas purification.
Author Contributions
Conceptualization, L.D. and A.Z.; methodology, L.D. and A.Z.; validation, A.Z.; formal analysis, S.V.; investigation, L.D.; resources, L.D. and A.Z.; data curation, A.Z.; writing—original draft preparation, L.D.; writing—review and editing, A.Z. and S.V.; visualization, L.D.; supervision, A.Z.; All authors have read and agreed to the published version of the manuscript.
Funding
This research received no external funding.
Data Availability Statement
Data sharing is not applicable to this article.
Acknowledgments
We thank SC “Vilniaus Waters” (Vilnius, Lithuania) wastewater treatment plant for the biogas production and the staff of the Laboratory of Algology and Microbial Ecology of the Nature Research Center (NRC, Vilnius, Lithuania) for the microalgae cultures, support and consulting.
Conflicts of Interest
The authors declare no conflict of interest.
References
- Zabed, H.M.; Akter, S.; Yun, J.; Zhang, G.; Zhang, Y.; Qi, X. Biogas from microalgae: Technologies, challenges and opportunities. Renewable and Sustainable Energy Reviews 2020, 117, 109503. [Google Scholar] [CrossRef]
- Da Silva Neto, J.V.; Gallo, W.L.; Nour, E.A. Production and use of biogas from vinasse: implications for the energy balance and GHG emissions of sugar cane ethanol in the brazilian context. Environmental Progress & Sustainable Energy 2020, 39, 13226. [Google Scholar]
- Abdeen, F.R.; Mel, M.; Jami, M.S.; Ihsan, S.I.; Ismail, A.F. A review of chemical absorption of carbon dioxide for biogas upgrading. Chinese Journal of Chemical Engineering 2016, 24, 693–702. [Google Scholar] [CrossRef]
- Awe, O.W.; Zhao, Y.; Nzihou, A.; Minh, D.P.; Lyczko, N. A review of biogas utilisation, purification and upgrading technologies. Waste and Biomass Valorization 2017, 8, 267–283. [Google Scholar] [CrossRef]
- Tabatabaei, M.; Aghbashlo, M.; Valijanian, E.; Panahi, H.K.S.; Nizami, A.S.; Ghanavati, H.; Sulaiman, A.; Mirmohamadsadeghi, S.; Karimi, K. A comprehensive review on recent biological innovations to improve biogas production, Part 2: Mainstream and downstream strategies. Renewable Energy 2020, 146, 1392–1407. [Google Scholar] [CrossRef]
- Luo, J.; Lu, X.; Liu, J.; Qian, G.; Lu, Y. Biogas recirculation for simultaneous calcium removal and biogas purification within an expanded granular sludge bed system treating leachate. Bioresource technology 2014, 173, 317–323. [Google Scholar] [CrossRef]
- Sarker, S.; Lamb, J.J.; Hjelme, D.R.; Lien, K.M. Overview of recent progress towards in-situ biogas upgradation techniques. Fuel 2018, 226, 686–697. [Google Scholar] [CrossRef]
- Bose, A.; Lin, R.; Rajendran, K.; O'Shea, R.; Xia, A.; Murphy, J.D. How to optimise photosynthetic biogas upgrading: a perspective on system design and microalgae selection. Biotechnology Advances 2019, 37, 107444. [Google Scholar] [CrossRef]
- Cea-Barcia, G.; López-Caamal, F.; Torres-Zúñiga, I.; Hernández-Escoto, H. Biogas purification via optimal microalgae growth: A literature review. Biotechnology Progress 2018, 34, 1513–1532. [Google Scholar] [CrossRef]
- Angelidaki, I.; Treu, L.; Tsapekos, P.; Luo, G.; Campanaro, S.; Wenzel, H.; Kougias, P.G. Biogas upgrading and utilization: Current status and perspectives. Biotechnology advances 2018, 36, 452–466. [Google Scholar] [CrossRef]
- Rodero, M.R.; Ángeles, R.; Marín, D.; Díaz, I.; Colzi, A.; Posadas, E.; Lebrero, R.; Muñoz, R. Biogas purification and upgrading technologies. In Biogas. Biofuel and Biorefinery Technologies; Tabatabaei, M., Ghanavati, H., Eds.; Publisher: Springer, Cham, 2018; Volume 6, pp. 239–276. [Google Scholar]
- Barbera, E.; Menegon, S.; Banzato, D.; D'Alpaos, C.; Bertucco, A. From biogas to biomethane: A process simulation-based techno-economic comparison of different upgrading technologies in the Italian context. Renewable Energy 2019, 135, 663–673. [Google Scholar] [CrossRef]
- Korberg, A.D.; Skov, I.R.; Mathiesen, B.V. The role of biogas and biogas-derived fuels in a 100% renewable energy system in Denmark. Energy 2020, 199, 117426. [Google Scholar] [CrossRef]
- Gomiero, T. Are biofuels an effective and viable energy strategy for industrialized societies? A reasoned overview of potentials and limits. Sustainability 2015, 7, 8491–8521. [Google Scholar] [CrossRef]
- Yang, W.; Li, S.; Qv, M.; Dai, D.; Liu, D.; Wang, W.; Tang, C.; Zhu, L. Microalgal cultivation for the upgraded biogas by removing CO2, coupled with the treatment of slurry from anaerobic digestion: a review. Bioresource Technology 2022, 364, 128118. [Google Scholar] [CrossRef]
- Sadeghizadeh, A.; Farhad dad, F.; Moghaddasi, L.; Rahimi, R. CO2 capture from air by Chlorella vulgaris microalgae in an airlift photobioreactor. Bioresource Technology 2017, 243, 441–447. [Google Scholar] [CrossRef]
- De Morais, M. G.; Costa, J. A. V. Carbon dioxide fixation by Chlorella kessleri, C. vulgaris, Scenedesmus obliquus and Spirulina sp. cultivated in flasks and vertical tubular photobioreactors. Biotechnology Letters 2007, 29, 1349–1352. [Google Scholar] [CrossRef]
- Bingelytė, Ž.; Zagorskis, A. Research of biogas purification using microalgae Monoraphidium griffithii suspension. Mokslas – Lietuvos Ateitis / Science – Future of Lithuania 2017, 9, 349356. [Google Scholar] [CrossRef]
- Rodas-Zuluaga, L. I.; Castaneda-Hernandez, L.; Castillo-Vacas, E. I.; Gradiz-Menjivar, A.; Lopez-Pacheco, I. Y.; Castillo-Zacarias, C.; Boully, L.; Iqbal, H. M. N.; Parra-Saldivar, R. Bio-capture and influence of CO2 on the growth and biomass composition of the microalgae Botryococcus braunii and Scenedesmus sp. Journal of CO2 Utilization 2021, 43, 101371. [Google Scholar] [CrossRef]
- Kong, B.; Vigil, R.D. Light-limited continuous culture of Chlorella vulgaris in a Taylor vortex reactor. Environmental Progress & Sustainable Energy 2013, 32, 884–890. [Google Scholar]
- Severi, C. A.; Lebrero, R.; Munoz, R. Chapter 8 – Biogas upgrading using microalgae. Sustainable Industrial Processes Based on Microalgae 2024, 157–184. [Google Scholar]
- Venkiteshwaran, K.; Xie, T.; Seib, M.; Tale, V. P.; Zitomer, D. Anaerobic digester biogas upgrading using microalgae. Integrated Wastewater Management and Valorization Using Algal Cultures 2022, 183–214. [Google Scholar]
- Assuncao, J.; Malcata, F. X. Enclosed “non-conventional” photobioreactors for microalga production: a review. Algal Research 2020, 52, 102107. [Google Scholar] [CrossRef]
- Khetkorn, W.; Rastogi, R. P.; Incharoensakdi, A.; Lindblad, P.; Madamwar, D.; Pandey, A.; Larroche, C. Microalgal hydrogen production – A review. Bioresource Technology 2017, 243, 1194–1206. [Google Scholar] [CrossRef] [PubMed]
- Ratomski, P.; Hawrot-Paw, M.; Koniuszy, A. Utilisation of CO2 from sodium bicarbonate to produce Chlorella vulgaris biomass in tubular photobioreactors for biofuel purposes. Sustainability 2021, 13, 9118. [Google Scholar] [CrossRef]
- Jin, H.-F.; Lim, B.-R.; Lee, K. Influence of nitrate feeding on carbon dioxide fixation by microalgae. Journal of Environmental Science and Health, Part A 2006, 41, 2813–2824. [Google Scholar] [CrossRef]
- Xu, P.; Li, J.; Qian, J.; Wang, B.; Liu, J.; Xu, R.; Chen, P.; Zhou, W. Recent advances in CO2 fixation by microalgae and its potential contribution to carbon neutrality. Chemosphere 2023, 319, 137987. [Google Scholar] [CrossRef]
- Pataro, I. M L.; Gil, J. D.; Guzman, J. L.; Berenguel, M.; Lemos, J. M. A learning-based model predictive strategy for pH control in raceway photobioreactors with freshwater and wastewater cultivation media. Control Engineering Practice 2023, 138, 105619. [Google Scholar] [CrossRef]
- Ho, S.-H.; Chen, C.-Y.; Lee, D.-J.; Chang, J.-S. Perspectives on microalgal CO2 emission mitigation systems – a review. Biotechnology Advances 2011, 29, 189–198. [Google Scholar] [CrossRef]
- Li, F.-F.; Yang, Z.-H.; Zeng, R.; Yang, G.; Chang, X.; Yan, J.-B.; Hou, Y.-L. Microalgae capture of CO2 from actual flue gas discharged from a combustion chamber. Industrial and Engineering Chemistry Research 2011, 50, 6496–6502. [Google Scholar] [CrossRef]
- Razzak, S. A.; Bahar, K.; Islam, K. M.; Haniffa, A. K.; Faruque, M. O.; Hossain, S. M. Z.; Hossain, M. M. Microalgae cultivation in photobioreactors: sustainable solutions for a greener future. Green Chemical Engineering 2024, 5, 418–439. [Google Scholar] [CrossRef]
- Ogbonna, I. O.; Ikwebe, J.; Ogbonna, J. C.; Eze, C. N.; Ndrimbula, J. B. Effects of light intensity and photoperiod on growth, lipid accumulation and fatty acid composition of Desmodesmus subspicatus LC172266 under photoautotrophic cultivation. Nigerian Journal of Biotechnology 2021, 38, 1–13. [Google Scholar] [CrossRef]
- Singh, S. P.; Sing, P. Effect of temperature and light on the growth of algae species: a review. Renewable and Sustainable Energy Reviews 2015, 50, 431–444. [Google Scholar] [CrossRef]
- Xiao, Y.; Yuan, H.; Pang, Y.; Chen, S.; Zhu, B.; Zou, D.; Ma, J.; Yu, L.; Li, X. CO2 removal from biogas by water washing system. Chinese Journal of Chemical Engineering 2014, 22, 950–953. [Google Scholar] [CrossRef]
- Suomalainen, M.; Arasto, A. Optimisation of partial oxygen combustion. Deliverable D229, carbon capture and storage program (CCSP). VTT customer report VTT-CR-03629-13 2013.
- Kapoor, R.; Subbarao, P.M.V.; Vijay, V.K.; Shah, G.; Sahota, S.; Singh, D.; Verma, M. Factors affecting methane loss from a water scrubbing based biogas upgrading system. Applied Energy 2017, 208, 1379–1388. [Google Scholar] [CrossRef]
- Heubeck, S.; Craggs, R.J.; Shilton, A. Influence of CO2 scrubbing from biogas on the treatment performance of a high rate algal pond. Water Science and Technology 2007, 55, 193–200. [Google Scholar] [CrossRef]
- Ashour, M.; Mansour, A. T.; Alkhamis, Y. A.; Elshobary, M. Usage of Chlorella and diverse microalgae for CO2 capture – towards a bioenergy revolution. Frontiers in Bioengineering and Biotechnology 2024, 12, 1387519. [Google Scholar] [CrossRef]
- Juskaite, L.; Zagorskis, A. Biodujų koncentracijos pokyčio fotobioabsorberyje matematinis modeliavimas. Proceedings of the 23rd conference for junior researchers “Science – Future of Lithuania” 2020, 8085.
- Hullat, C. H.; Thomas, D. N. Productivity, carbon dioxide uptake and net energy return of microalgal bubble column photobioreactors. Bioresource Technology 2011, 102, 5775–5787. [Google Scholar] [CrossRef]
- Kim, H. W.; Vannela, R.; Rittmann, B.E. Responses of Synechocystis sp. PCC 6803 to total dissolved solids in long-term continuous operation of a photobioreactor. Bioresource Technology 2013, 128, 378–384. [Google Scholar] [CrossRef]
- Bhuyar, P.; Hong, D. D.; Mandia, E.; Rahim, M. H. A.; Maniam, G. P.; Govindan, N. Salinity reduction from poly-chem-industrial wastewater by using microalgae (Chlorella sp.) colllected from coastal region of Peninsular Malaysia. The Yale journal of biology and medicine 2020, 1, 1–14. [Google Scholar]
- Montingelli, M. E. , Benyounis, K. Y., Stokes, J., & Olabi, A. G. Pretreatment of macroalgal biomass for biogas production. Energy conversion and management 2016, 108, 202–209. [Google Scholar]
- Murphy, J. D. CH4-enriched biogas utilized as a transport fuel: The case for the utilization of biogas as a transport fuel. Engineers J. 2005, 59, 571–576. [Google Scholar]
- Kao, C.-Y.; Chiu, S.-Y.; Huang, T.-T.; Dai, L.; Hsu, L.-K.; Lin, C.-S. Ability of a mutant strain of the microalga Chlorella sp. to capture carbon dioxide for biogas upgrading. Applied Energy 2012, 93, 176–183. [Google Scholar] [CrossRef]
- Mendez, L.; Garcia, D.; Perez, E.; Blanco, S.; Munoz, R. Photosynthetic upgrading of biogas from anaerobic digestion of mixed sludge in an outdoors algal-bacterial photobioreactor at pilot scale. Journal of Water Process Engineering 2022, 48, 102891. [Google Scholar] [CrossRef]
- Solovchenko, A.; Gorelova, O.; Selyakh, I.; Pogosyan, S.; Baulina, O.; Semenova, L.; Chivkunova, O.; Voronova, E.; Konyukhov, I.; Scherbakov, P.; Lobakova, E. A novel CO2-tolerant symbiotic Desmodesmus (Chlorophyceae, Desmodesmaceae): acclimation to and performance at a high dioxide level. Algal Research 2015, 11, 399–410. [Google Scholar] [CrossRef]
- Zhou, W.; Wang, J.; Chen, P.; Ji, C.; Kang, Q.; Lu, B.; Li, K.; Liu, J.; Ruan, R. Bio-mitigation of carbon dioxide using microalgal systems: advances and perspectives. Renewable and Sustainable Energy Reviews 2017, 76, 1163–1175. [Google Scholar] [CrossRef]
- Cordoba-Perez, M.; de Lasa, H. CO2-derived carbon capture and photon absorption efficiency by microalgae in novel PhotoBioCREC. Industrial and Engineering Chemistry Research 2020, 59, 14710–14716. [Google Scholar] [CrossRef]
- Ferreira, E. S.; Binotti, F. F. da S.; Costa, E.; Vendruscolo, E. P.; Binotti, E. D. C.; Salles, J. S.; Salles, J. S. Vitamin B3 with action on biological oxide/reduction reactions and growth biostimulant in Chlorella vulgaris cultivation. Algal Research 2023, 76, 103306. [Google Scholar] [CrossRef]
- Nguyen, M.L.T.; Lin, C.Y.; Lay, C.H. Microalgae cultivation using biogas and digestate carbon sources. Biomass and Bioenergy 2019, 122, 426–432. [Google Scholar] [CrossRef]
- Sakowski, B.A.; Kaiser, M.; Mollekopf, N. ACEME: Reducing of CO2 and H2S for biogas upgrading using accelerated mineralization. Environmental Progress & Sustainable Energy 2019, 38, e13144. [Google Scholar]
- Wellinger, A.; Lindberg, A. Biogas Upgrading and Utilization. Task 24: Energy From Biological Conversion of Organic Waste. IEA Bioenergy Task 2000. [Google Scholar]
Figure 1.
Scheme of the experimental apparatus.
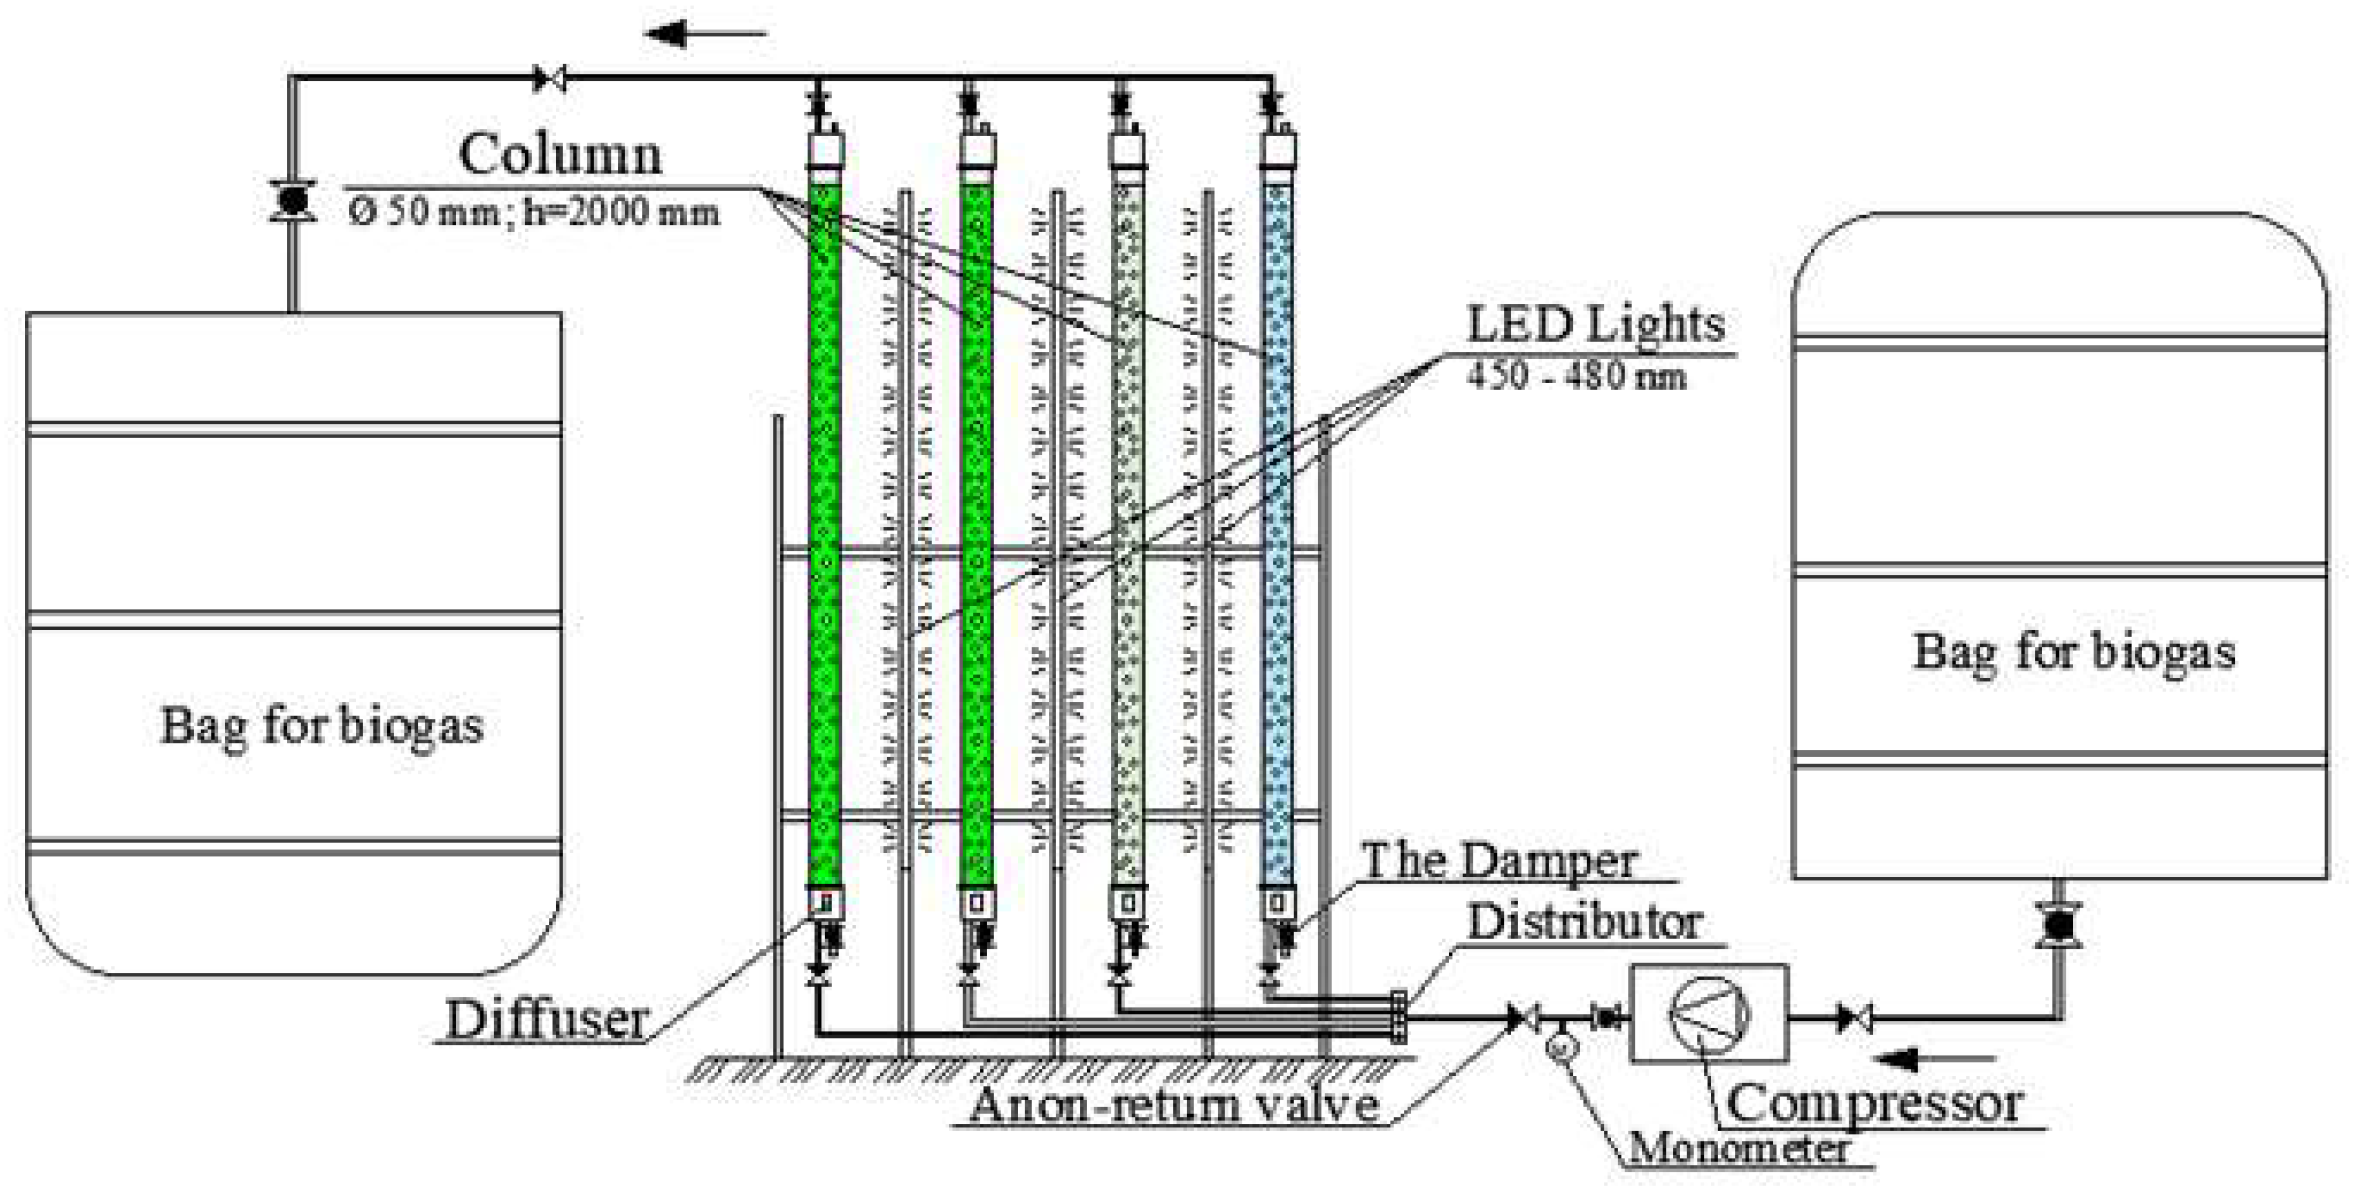
Figure 2.
Physical and chemical parameters of suspensions: (a) Dependence of pH on the suspension; (b) Dependence of electrical conductivity on the suspension; (c) Dependence of total dissolved solids on the suspension; (d) Dependence of chlorophyll concentration on the suspension. The average value is represented for each point, and error bars indicate the standard deviation, n=3.
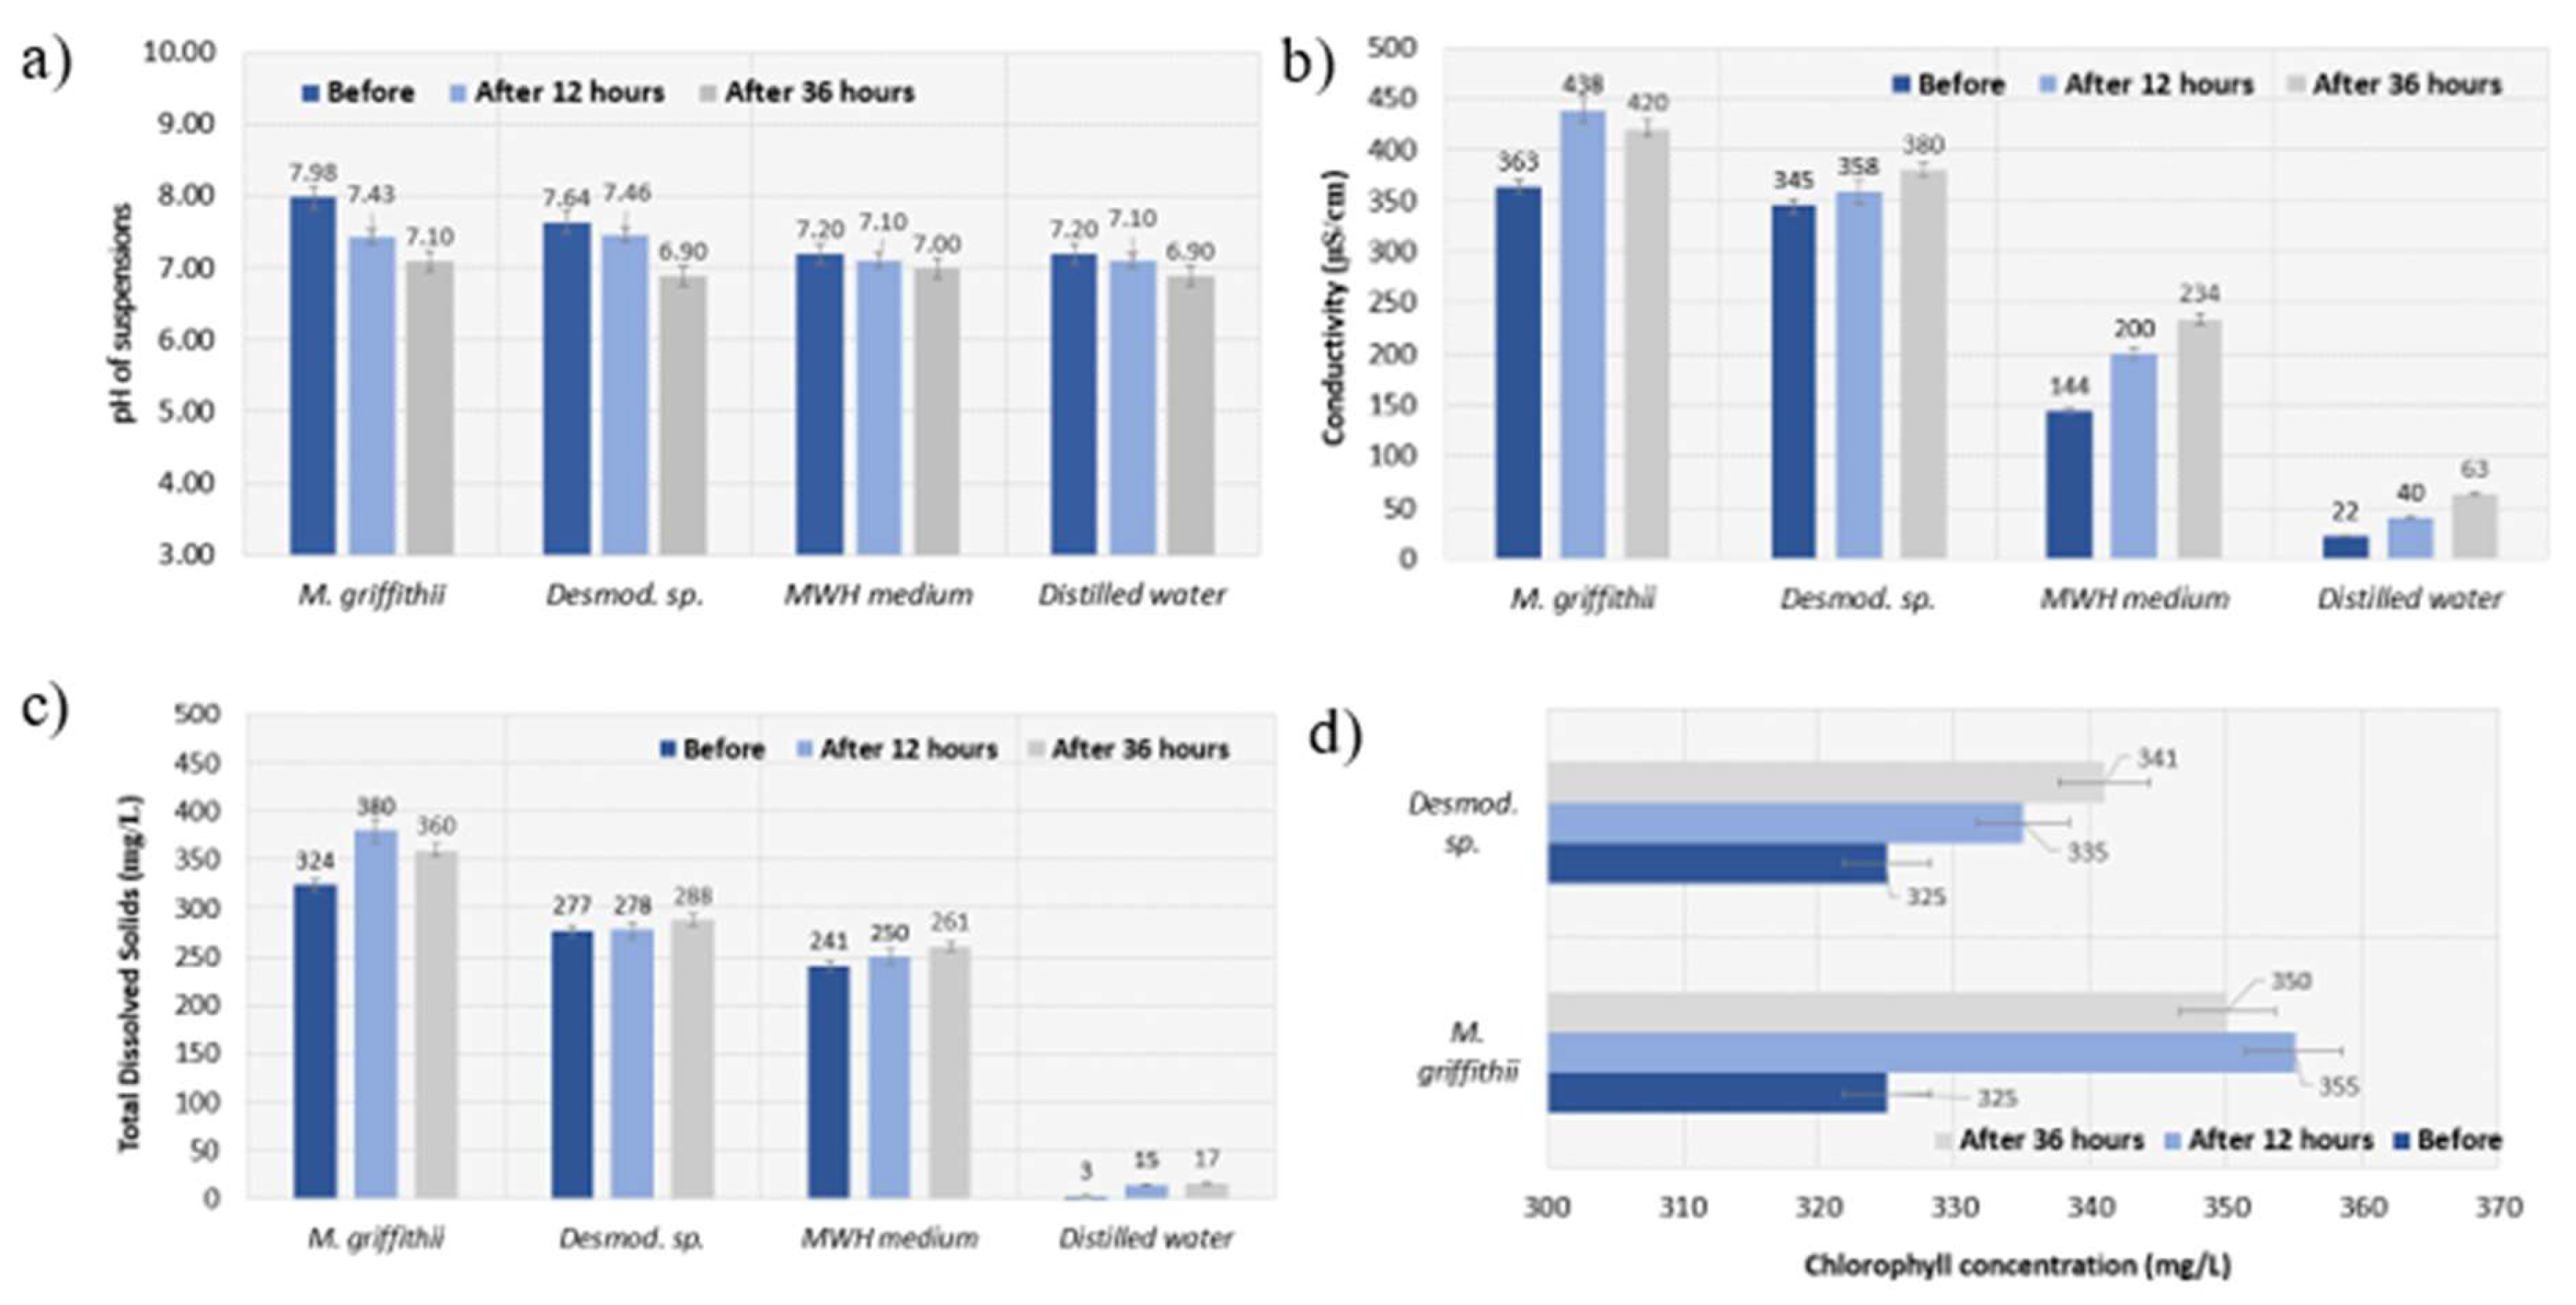
Figure 3.
Variation of carbon dioxide concentration in biogas over time as it passes through different media, n=3.
Figure 3.
Variation of carbon dioxide concentration in biogas over time as it passes through different media, n=3.
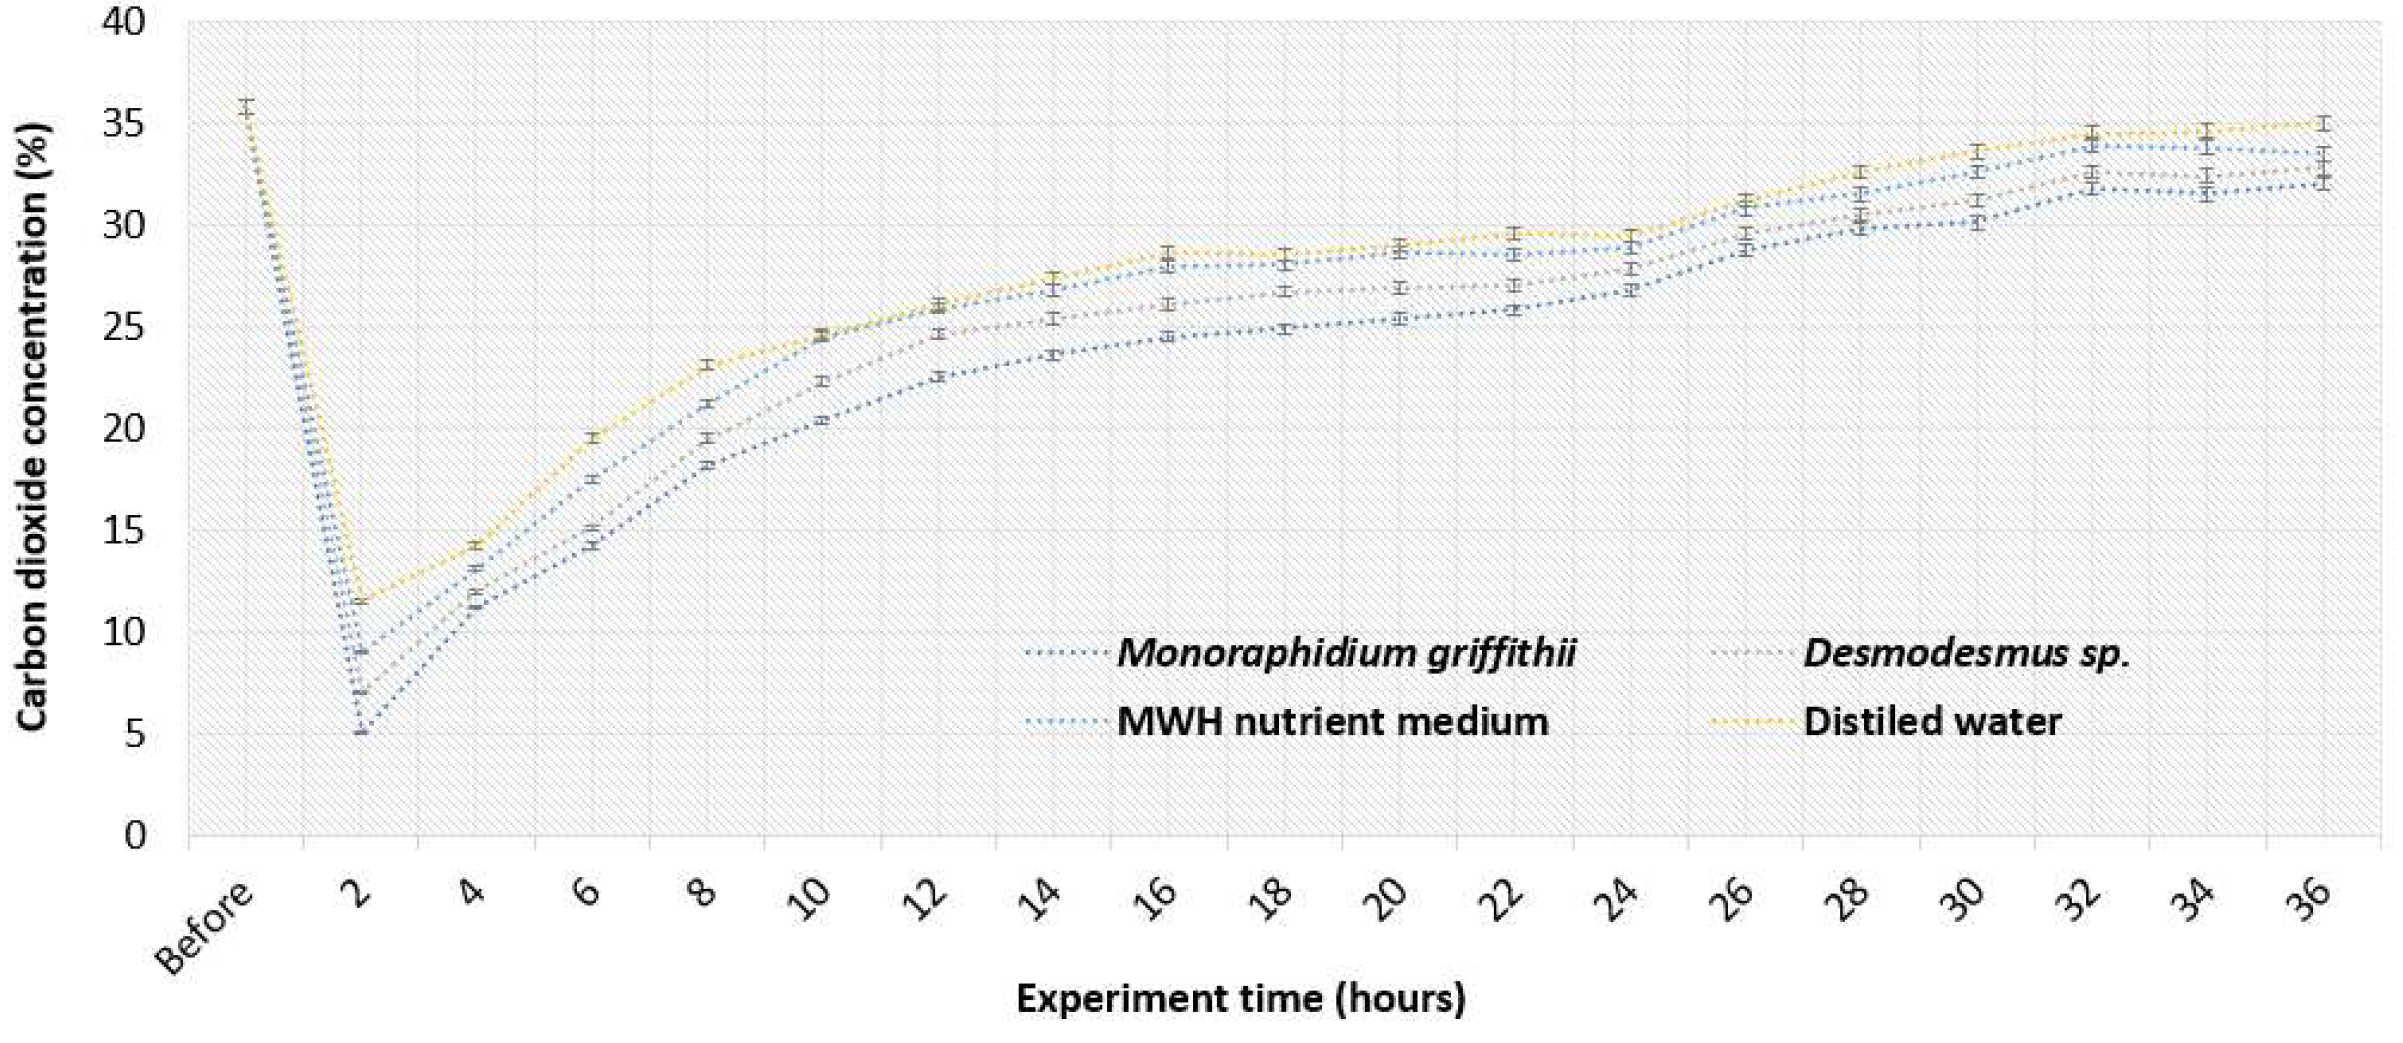
Figure 4.
Variation of methane concentration in biogas over time as it passes through different media, n=3.
Figure 4.
Variation of methane concentration in biogas over time as it passes through different media, n=3.
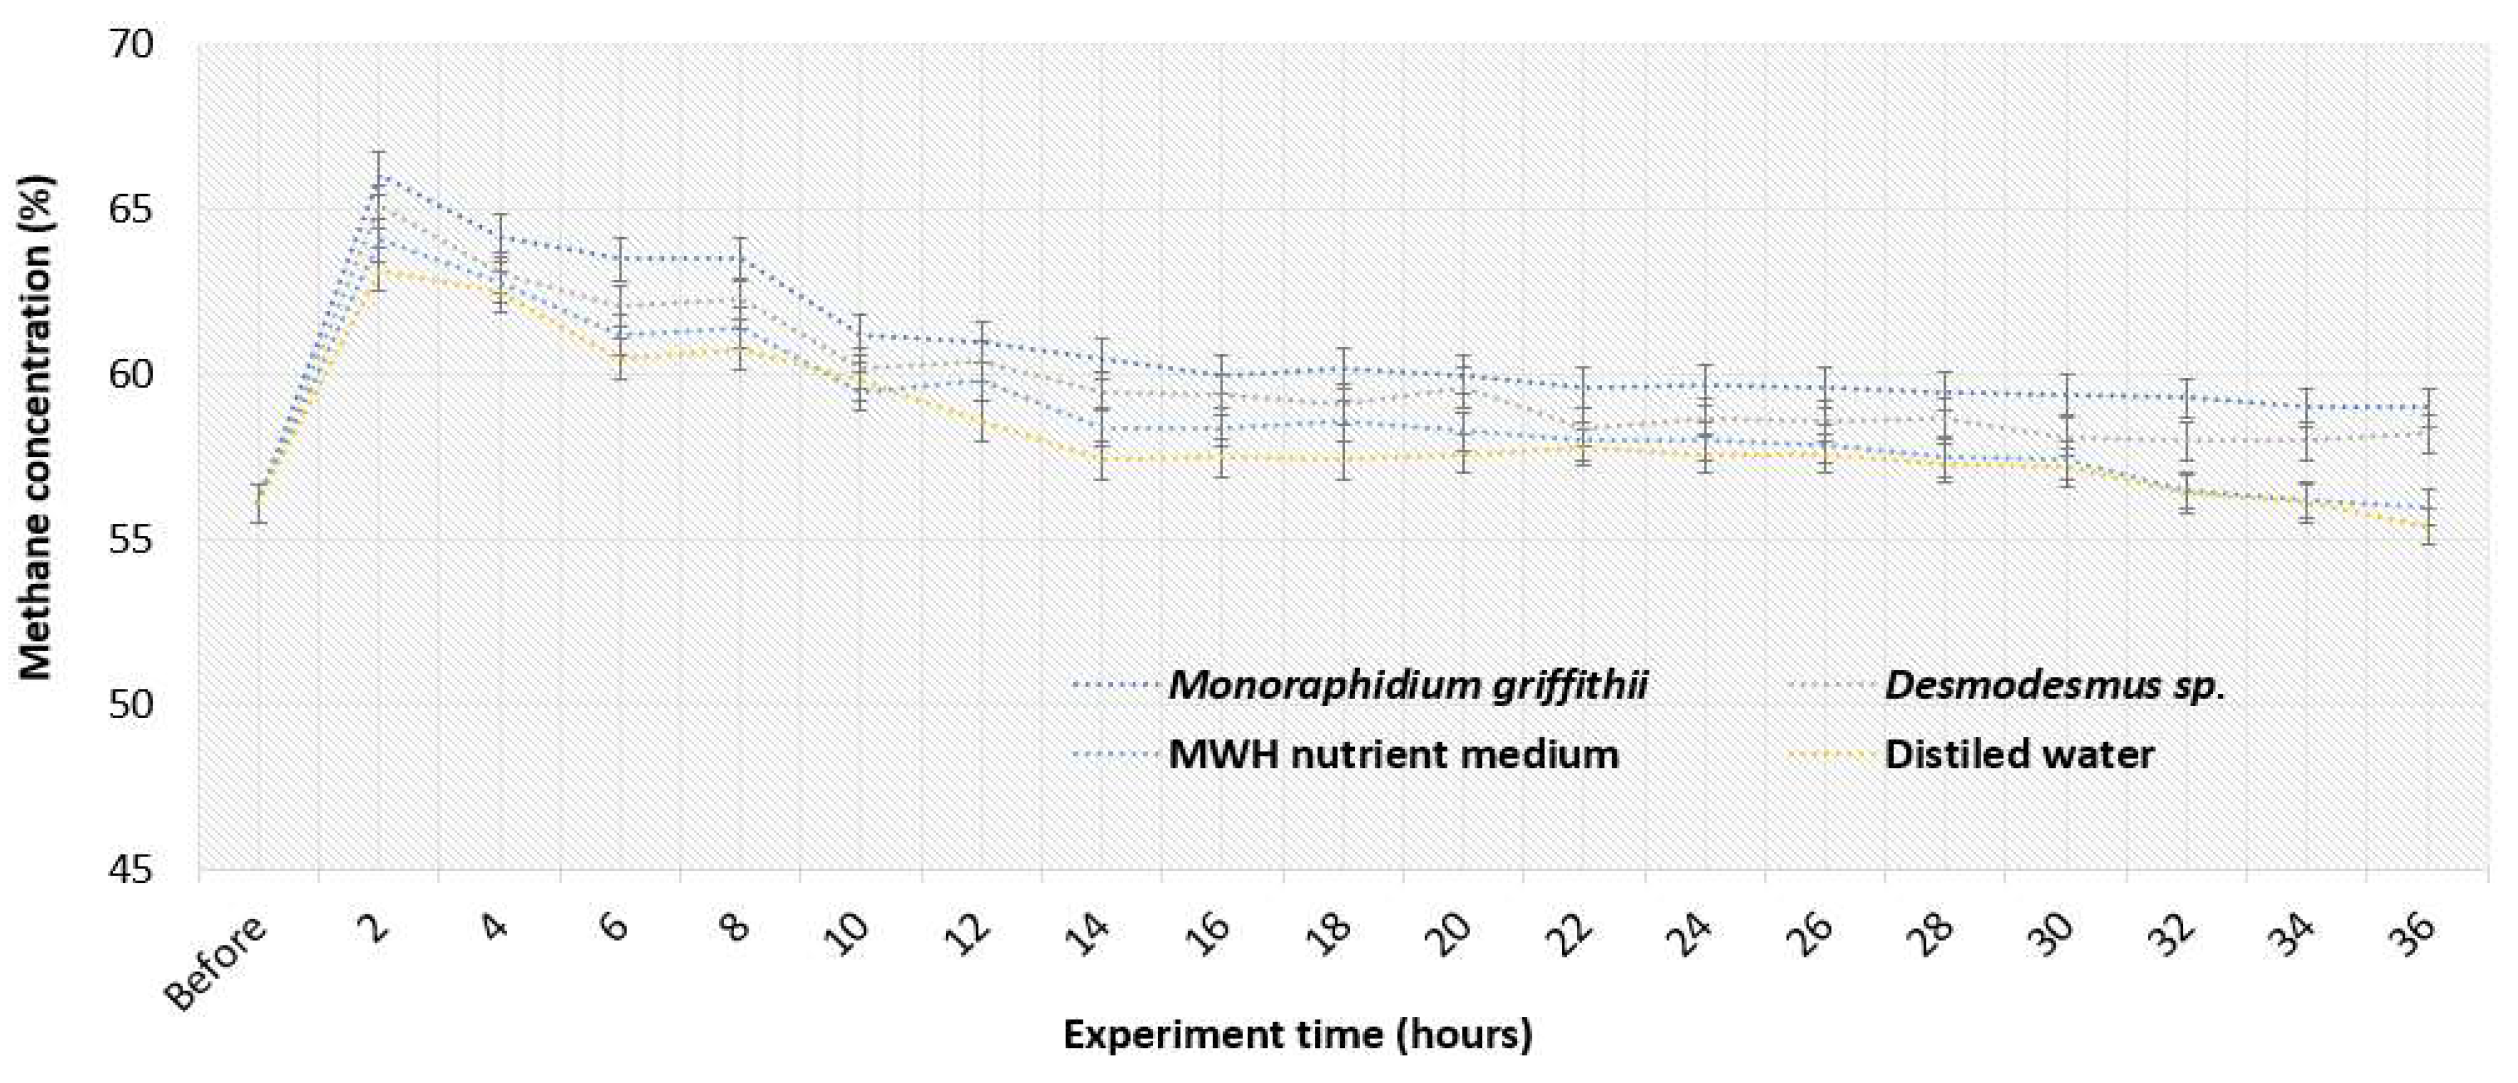
Figure 5.
Variation of oxygen concentration in biogas over time as it passes through different media, n=3.
Figure 5.
Variation of oxygen concentration in biogas over time as it passes through different media, n=3.
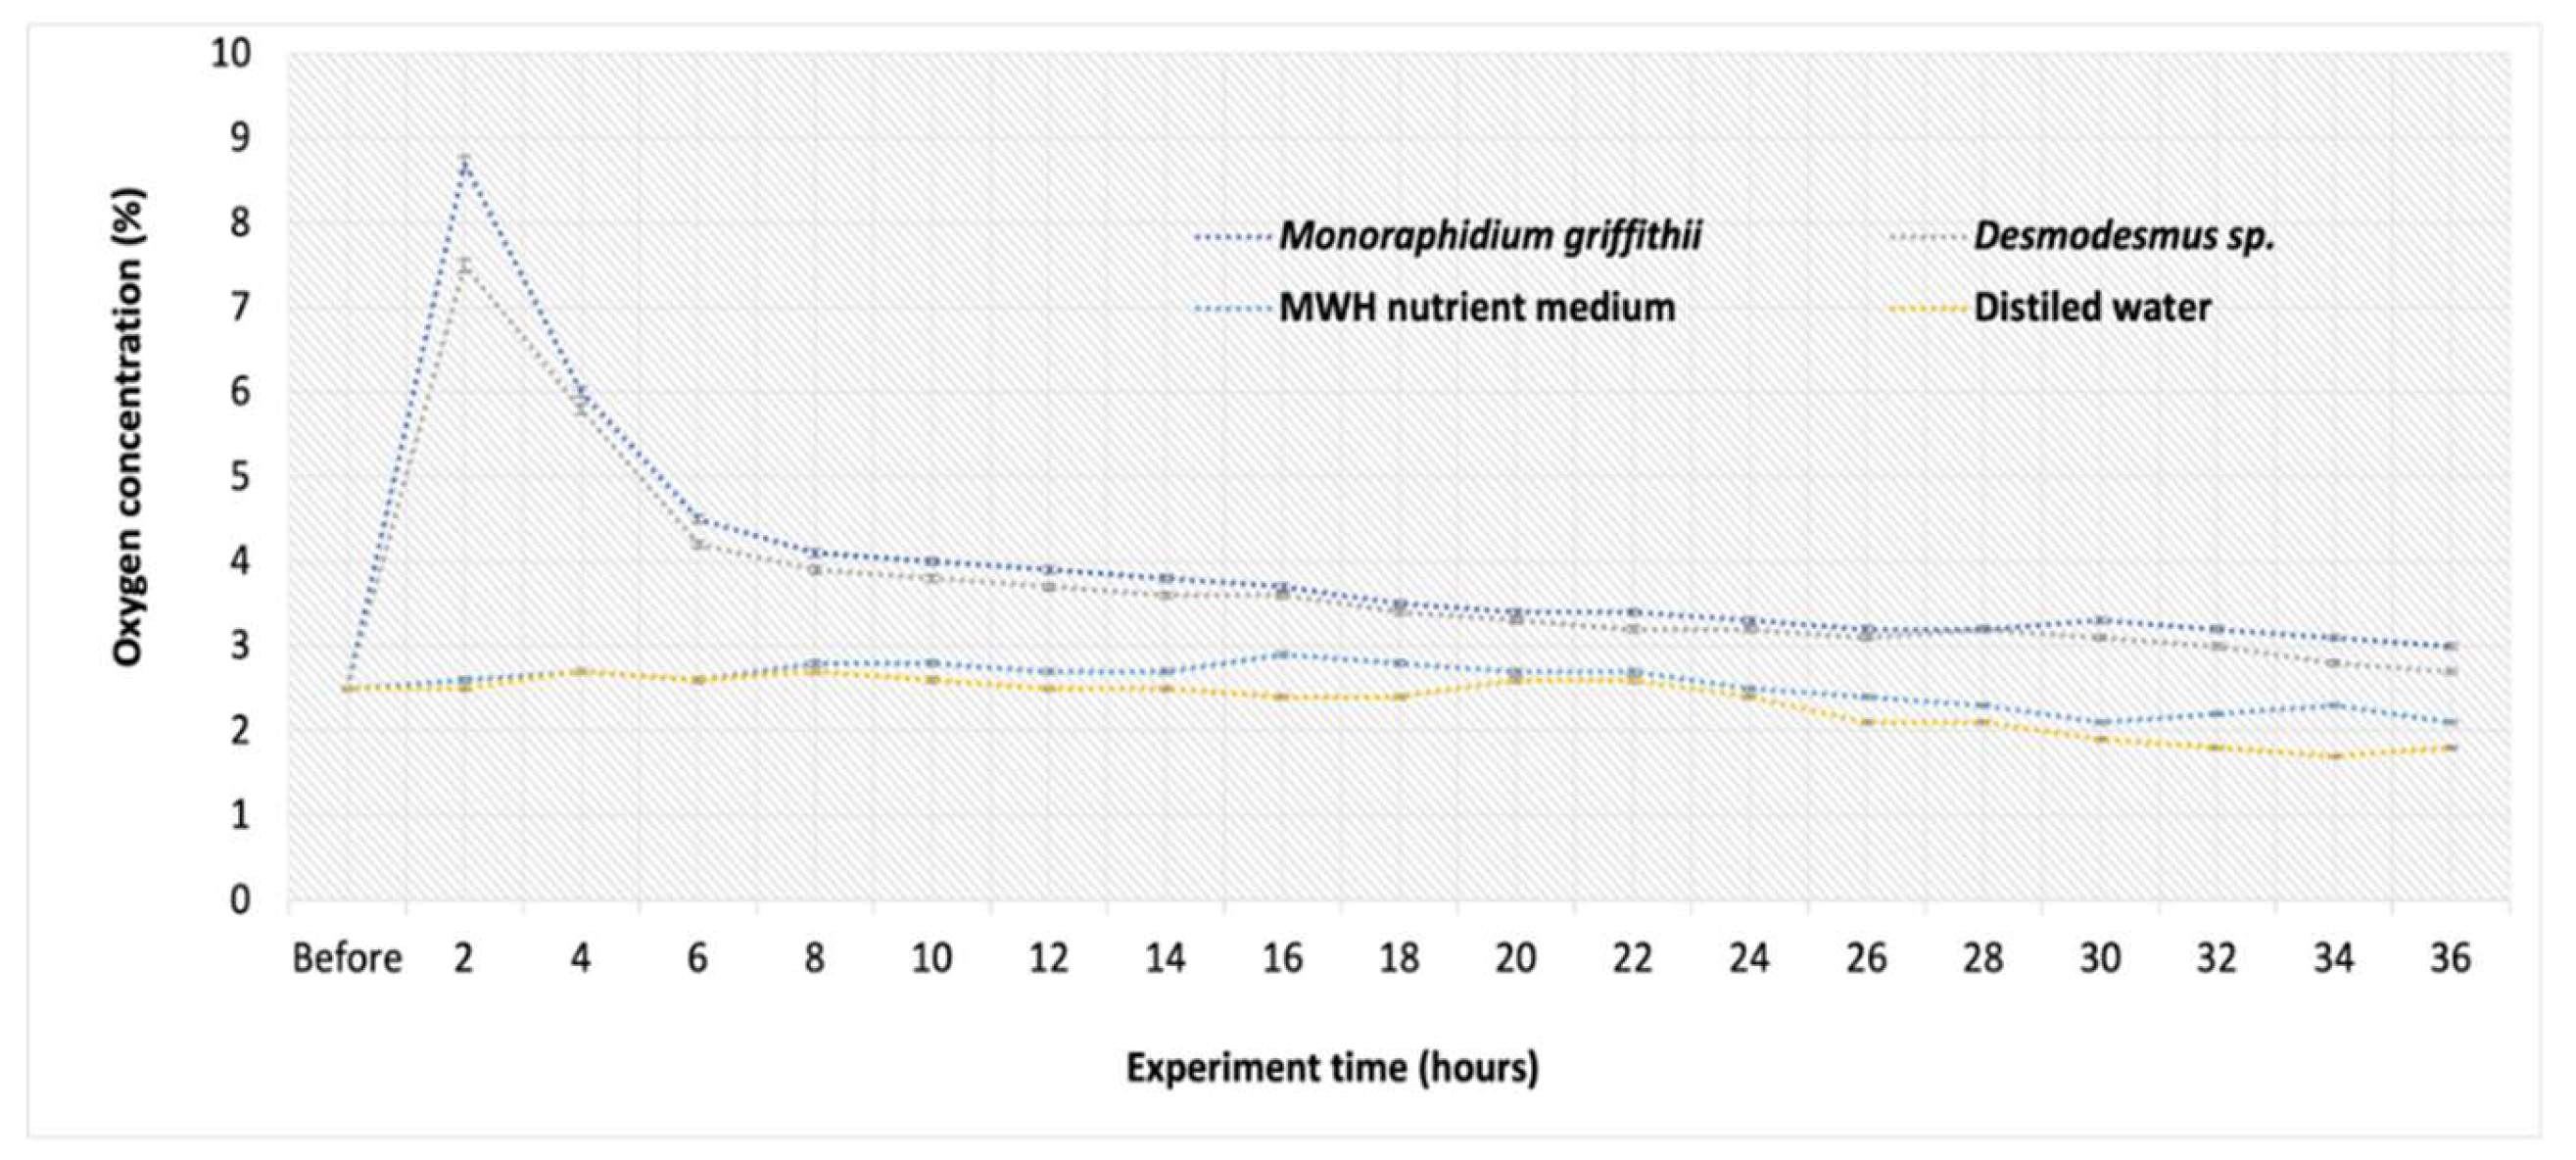

Table 1.
The composition of the MWH medium.
| Material | Quantity |
|---|---|
| CaCl2 × 2H2O | 3.68 g/100 mL |
| MgSO4 × 7H2O | 3.70 g/100 mL |
| NaHCO3 | 1.26 g/100 mL |
| K2HPO4 × 3H2O | 1.14 g/100 mL |
| NaNO3 | 8.50 g/100 mL |
| Na2O3Si × 9H2O | 2.39 g/100 mL |
Table 2.
Physical and chemical parameters of suspensions.
| Parameters | pH | Chlorophyll concentration, mg/L | Electrical conductivity, µS/cm |
Total Dissolved Solids, mg/L |
|---|---|---|---|---|
|
Monoraphidium griffithii |
7.98 | 325 | 363 | 324 |
| Desmodesmus sp. | 7.64 | 325 | 345 | 277 |
| MWH medium | 7.20 | – | 144 | 241 |
| Distilled water | 7.20 | – | 322 | 3 |
Table 3.
Biomass growth rate.
| Experiment time (hours) |
Cell volume, µm3 | Cell count/mL | Biomass weight, µg | Biomass gain, g/l/h |
|---|---|---|---|---|
| Monoraphidium griffithii | ||||
| Before | 275 | 564340 | 155193500 | – |
| 12 | 275 | 573530 | 157720750 | 1.02 |
| 36 | 281 | 621330 | 174593730 | 1.10 |
| Desmodesmus sp. | ||||
| Before | 610 | 532250 | 324672500 | – |
| 12 | 610 | 543350 | 331443500 | 1.02 |
| 36 | 612 | 557130 | 340963560 | 1.03 |
Disclaimer/Publisher’s Note: The statements, opinions and data contained in all publications are solely those of the individual author(s) and contributor(s) and not of MDPI and/or the editor(s). MDPI and/or the editor(s) disclaim responsibility for any injury to people or property resulting from any ideas, methods, instructions or products referred to in the content. |
© 2024 by the authors. Licensee MDPI, Basel, Switzerland. This article is an open access article distributed under the terms and conditions of the Creative Commons Attribution (CC BY) license (http://creativecommons.org/licenses/by/4.0/).
Copyright: This open access article is published under a Creative Commons CC BY 4.0 license, which permit the free download, distribution, and reuse, provided that the author and preprint are cited in any reuse.


