
Submitted:
31 July 2024
Posted:
02 August 2024
You are already at the latest version
Abstract
Microalgae are photosynthetic microorganism able to receive light from sunlight and external light sources for their growth. Despite the simplicity of cultivation and their widespread presence, the growth of microalgae is affected by several factors, light intensity being a crucial one as it is linked to external environmental conditions. On the other hand, microalgae cultivation in wastewater with high nitrogen content has become a promising alternative as a low cost nutrients substrate method. However, effluents may contain many compounds, making therefore difficult the assessment of light intensity on cells growth profile and especially on nutrients assimilation rate. The aim of this study was the examination of the effect of intensity of light source on the growth and nutrient uptake rates by a freshwater microalgae, Chlorella sorokiniana in the effluent from an anaerobic digestion plant, with nitrogen content reaching up to 5 g/L. Microalgae were cultivated using three light intensities (1,500, 5,000 and 12,000 lx) in 10% digestate mixtures in water. Samples were collected and analyzed for the presence of microalgae cells, while aqueous phase samples were subjected to the analysis of nitrogen and phosphorous content. Biomass productivity followed the light intensity pattern: the highest the light the highest the cells growth. A similar pattern was observed in the reduction rate of nitrogen and phosphorous concentrations; however, nutrients reduction rate per gram of microalgae were mainly associated to biomass growth rate, indicating that the effect of light intensity was significant for biomass growth, without however changing the main nutrients assimilation pathway. In addition, results indicated that under high light intensity, microalgae might change their metabolism towards formation of lipids against nitrogenous compounds.
Keywords:
light intensity
; lipids
; microalgae
; digestate
; macronutrients
; Chlorella sorokiniana
1. Introduction
Microalgae represent an untapped natural resource with more than 25,000 species of which only 15 are used in various commercial applications [1]. They are microscopic organisms found in both seawater and freshwater and are classified as either eukaryotic microorganisms or prokaryotic [2]. Different microalgal species have distinct characteristics and are cultivated in a wide range of environmental factors [3], with the ability to adapt to particularly harsh conditions [4]. They can use one or more of three metabolic growth modes, photoautotrophy, heterotrophy, and mixotrophy, depending on the availability of light and carbon sources. In each metabolic growth pathway, microalgae can accumulate high amounts of nutrients assimilated from the growth medium [2], providing an abundance of different products [5], where lipids, carbohydrates, and proteins represent the main components [6]. Microalgae are referred to as the green gold of nature [7], as they can provide significant amounts of high value compounds [8,9]. Depending on the species, the available nutrients and the growth conditions, it is possible to produce different types of bioactive molecules with various properties, including compounds with antioxidant, anti-inflammatory, antimicrobial, antiviral, anticancer and antiallergic properties [4]. Furthermore, microalgae are gaining interest as a feedstock for biodiesel production as several species combine high biomass productivity and the ability to accumulate large amounts of lipids [10].
Despite their simplicity and wide distribution, microalgae require favourable conditions to grow and provide the desired compounds: certain ecological factors such as temperature, carbon dioxide (CO2), dissolved oxygen concentration, light intensity, pH, salinity and the availability of nutrients might become limiting factors affecting the growth rate of microalgae as well as the chemical composition of the biomass [6,11,12]. Light is the main source of energy for these photosynthetic microorganisms while representing the most important environmental factor that affects the rate of photosynthesis and can improve microalgae cell growth and metabolic activity [6,10]. Even under adverse conditions, such as nutrient deprivation, microalgae are still able to photosynthesize and accumulate triacylglycerols as a survival strategy to withstand extreme environment [13].
The importance of light illumination relevant to microalgae is reflected by two parameters: intensity and wavelength of light [14]. In terms of wavelength, only photosynthetically active radiation, ranging from 400 to 700 nm, is used by microalgae for photosynthesis, regardless of the light source [6]. On the other hand, the light intensity (LI) required for optimal growth and composition differs between species [3]. Insufficient light availability is an important limitation of microalgal growth [15], while excess light, namely above the light saturation intensity, may damage the species and reduce the biomass growth rate due to photoinhibition [6,10,16]. Ghosh et al. [17] noted that natural sunlight often exceeds the optimal light intensity. For most microalgae, photosynthesis is saturated at light intensities from 6,800 to 34,000 lx, although maximum biomass productivity is often obtained at almost constant irradiance values in the range of 3,400 to 6,800 lx [6]. In a previous study, Chlorellaceae has been shown to grow optimally at high light intensity [3], but for Chlorella vulgaris, Daliry et al. [14] found a decrease in biomass productivity by switching from 4,600 lux to 7,400 lx. However, Metsoviti et al. [18] reached a different conclusion, since for the same species an increase in LI from 5,180 lx to 10,360 lx resulted in a simultaneous increase in growth rate. Higher light intensities for optimal biomass productivity are reported for the microalgae Desmodesmus sp. and Scenedesmus obliquus, ranging between 10,000 to 20,000 lx [19]. Ghosh et al. [17] on the other hand studied the effect of light intensity (10,000, 12,000 and 14,000 lx) on growth rate of Chlorella sorokiniana and found that light increasing above 10,000 lx led to a decrease in growth rate, with the lowest biomass productivity observed at 14,000 lx. In a similar study, the researchers examined the effect of LI on biomass productivity over a wide range, from 2,220 to 14,800 lx, and observed the optimum growth rate at 7,700 lx, while higher values resulted to a decrease in productivity [20]. These controversial results justified that light intensity may have different effect on microalgal species and a study to reveal the optimum light parameters has to be carried out under clearly defined conditions, including species and nutrients type in order to specify the exact effect [10].
In addition to cell growth, the chemical composition of microalgae is also affected by light intensity [6,19,21,22]. However, there is no clear consensus on the effect of light on species lipid and other macronutrient content [16]. The increase in LI may promote or have no effect on lipids production in some species while it may reduce lipid content in others [6]. Therefore, each microalgal species responds in a different way to variable light intensity [10,21]. Binnal and Badu [16] concluded that the effect of LI on the lipid content of microalgae depends on the ability of individual species to capture carbon under high intensity [16]. In their efforts to survive under the adverse conditions of high light intensity, species change their metabolism by accumulating excess energy into energy-rich products such as lipids or carbohydrates [10]. The primary hypothesis was that the lipid and carbohydrate pathways compete for a common carbon precursor and therefore, it has been suggested that blocking starch synthesis could increase lipids production [19]. However, recent results showed that higher lipid content is associated with biomass with lower protein content [6], suggesting that lipid synthesis is mainly based on protein degradation or inhibition of protein synthesis [19].
The mixotrophic mode of cultivation, combining both inorganic and organic modes of carbon accumulation, has been found to exhibit maximum productivity of species. Common mixotrophic culture modes include the use of organic acetic acid, glycerol and glucose as organic carbon sources and urea, and ammonium chloride, as inorganic nitrogen sources. Nevertheless, in the effort to reduce the production costs, alternative nutrient media are studied, and towards that direction wastewater with high nitrogen content represents a promising source [17]. The cultivation of microalgae in wastewater may bring additional benefits: the needs of microalgae for carbon and other minerals can be satisfied by the effluents’ nutrients [6,23,24,25] reducing simultaneously the concentration of organic and inorganic compounds in wastewater [6,23,25]. Therefore, utilization of microalgae in wastewater treatment has become an environmentally friendly decontamination process [1]. Nevertheless, effluents may contain a large number of compounds, that might affect microalgae growth pattern and composition profile, making the prediction of the effect of light intensity on the species a complicated and difficult task.
The aim of this work was the examination of the effect of light intensity on the growth rate and the main compositional compounds of C. sorokiniana, using anaerobic digestion effluent as nutrients substrate. The objectives of the work included the investigation of the behavior of the certain species under different light intensities, the determination of the optimum algae production rate, the examination of nutrients assimilation rate, and the study of proteins, lipids and carbohydrates concentration in biomass as a function of light intensity, to identify those conditions providing species with tailored composition.
2. Materials and Methods
2.1. Algae Strains Cultivation
Species of green microalgae C. sorokiniana were obtained from the algae culture of the International Hellenic University in Sindos, Greece [26]. Cells were grown within 2 L Erlenmeyer flasks with a final liquid volume of 1.5 L, maintaining a constant incubation temperature (25 ± 1°C). A nutrient substrate of BG-11 medium was used containing (in g/L): NaNO3 1.5, K2HPO4·3H2O 0.04, MgSO4·7H2O 0.075, CaCl2·2H2O 0.036, citric acid 0.006, ammonium ferric citrate 0.006, Na2EDTA 0.001, Na2CO3 0.02, and trace elements (in mg/L): H3BO3 2.86, MnCl2 ·4H2O 1.81, ZnCl2 0.222, Na2MoO4·2H2O 0.391, CoCl·6H2O 0.05 and CuSO4·5H2O 0.079. All nutrients that compose BG-11 as well as the Erlenmeyer flasks were sterilized at 121⁰C for 20 min to prevent contamination. Ammonium ferric citrate and trace elements were sterilized using a filter (Whatman PTFE syringe filters, pore size 0.2 m). Aeration of the Erlenmeyer flasks was performed using compressed air at a flow rate of 1 LPM. Before introducing air into the culture, the air was filtered in Whatman PTFE syringe filters (pore size 0.2 m). The incubation room lighting was uniform on both sides of the flasks delivered from LED lamps (6.000 K, 7.2 W/m) producing cool white light of 1,500 lx intensity, with a light:dark cycle of 16:8 h, respectively. Intensity was determined using a luxmeter (SP 200K, Sauter Co. Ltd. Beijing, China). The mother cultures were recultured every 15 days in new flasks by inoculating pre-cultivation in BG-11 nutrient substrate at a volume ratio of approximately 1/10. Maintaining and reculturing the mother cultures at a specific frequency ensured inoculation of all main cultures with cell populations in approximately the same state of physiology and metabolic activity.
2.2. Anaerobic Digestion Effluent Collection and Processing
The anaerobic digestion effluent (ADE) used in this study was collected from the effluent of an 1 MWel biogas plant treating the wastes and the residues from local animal husbandries, located in Thessaloniki, Greece. In order to remove suspended particles and reduce turbidity, the ADE was first centrifuged at 5,000 rpm for 15 min followed by filtration of the supernatant (Whatman Inc.,150 mm, Grade 1, pore size 11 m). The filtrate was hyperfiltrated with a hydrophilic flat sheet A4 microfiltration membrane, with 0.4 um pore diameter, type H-203 (Kubota, Osaka, Japan) to remove viruses and pathogenic bacteria that may be present in the raw effluent and may negatively affect microalgal growth. Finally, digestate stock sample was stored at -18°C to avoid potential changes in its composition.
2.3. Species Cultivation
The microalgal species were cultured in ADE after dilution using sterile water at a volume ratio of approximately 1/10, in order to reduce the high ammonia nitrogen concentration of the sample to non-toxic for the cells [27,28]. Potassium dihygrogen phosphate (KH2PO4) was added, to receive a N/P ratio of about 10/1, representing an appropriate nitrogen/phosphorus ratio for microalgae growth [29,30]. Microalge cultivation experiment was conducted in 2 L Erlenmeyer flasks. An inoculum (8% of seed flask culture) of exponentially growing cells was used for inoculation, to a total volume providing an initial optical density (OD600nm) of approximately 0.35. Each flask was supplied with 1 LPM of ambient air and 0.033 LMP of CO2 (99.99% purity), passed through 0.2 µm Whatman PTFE syringe filters. Air and CO2 flowrates were adjusted using precision flowmeters (EK-2LR, Kytola Instruments, Lahti, Finland, and 3845G -HVR, Omega Engineering, Norwalk, CT, USA).The flasks were placed in a temperature-controlled room (25 ± 1⁰C), under uniform illumination with cool white LED strips (6000 K, 7.2 W/m) and a light: dark cycle of 16:8 hours. Light intensity was adjusted to 1,500, 5,000 and 12,000 lx using a LED trimmer. Duplicate samples were tested in each condition. Addition of diluted substrate containing KH2PO4 at the predetermined N/P ratios took place, each time aqueous phase N-NH4 concentration reduced below 40 mg/L, a threshold below which the ability of microalgae to effectively remove phosphorus from the effluent and thus its accumulation in the microalgal biomass appears to be significantly reduced [31].
2.4. Microalgae Pre-treatment for Composition Analysis
Microalgal biomass samples obtained from cultivation flasks were centrifuged at 5,000 rpm (Hermle Z326K, Hermle Labortechnik, Wehingen, Germany) for 10 min and the supernatant liquid was decanted to concentrate the biomass. The raw microalgal biomass paste was frozen and introduced directly into a lyophilizer (GAMMA 1-20 LMC, Martin Christ GmbH, Osterode am Harz Germany). Freeze drying of cells carried out at 0.010 bar, and -78°C for 48 hours and the dried biomass was then stored at -18°C.
2.5. Analytical Measurements
2.5.1. Growth Determination and Nutrient Analysis
Growth of microalgae was obtained by measuring the sample optical density (OD) at 600 nm [26,32], using a UV-vis spectrophotometer (DR 3900, HACH, Loveland, CO, USA) as an indirect method to estimate the cell number of the liquid suspension. In addition, direct determination of biomass concentration took place, measured as dry cell weight (DCW), by filtering 15 mL of culture sample through a pre-weighted glass microfiber filter (Whatman 934-AH, pore size 1. 2 m), dried at 60°C for 24 h and weighted at a high precision micro-balance (XP 105, Mettler Toledo, Greifensee, Switzerland) [26,33].
2.5.2. Lipids Determination
Approximately 0.2 g of lyophilized microalgal biomass was used for the lipid extraction process following the extraction protocol of Bligh and Dyer [34]. Briefly, 2 mL of methanol, 1 mL of chloroform and 0.8 mL distilled water (2:1:0.8 v/v) were added in the dried biomass sample and the mixture was subjected to sonication (Sonopuls UW 3400, Bandelin, Berlin, Germany) for 30 min. Subsequently, the solution was centrifuged at 5,000 rpm for 10 min and the solvent was collected. The procedure was repeated two more times to ensure complete lipid extraction [26,35]. Volumes of 3 mL of chloroform and 3 mL of distilled water (2:2:1.8 v/v) were added to the recovered solvent followed by centrifugation under the same conditions to ensure formation of two phases. After complete separation of the two phases, the upper phase was removed and the lower phase containing the extracted lipids was collected. This phase was dried overnight at 60°C and weighted at a high precision micro-balance (XP 105, Mettler Toledo, Greifensee, Switzerland).
2.5.3. Proteins Determination
Proteins were extracted from approximately 0.2 g of lyophilized microalgal biomass, after being re-dispersed in 100 mL distilled water. Cell disruption was performed by sonication for 30 min followed by centrifugation at 10,000 rpm for 10 min at room temperature and the supernatant was analysed for proteins content using the Lowry method [36]. Specifically, 5 mL of Lowry’s modified reagent were added to 1 mL of sample and the mixture was stirred and incubated for 10 min. After incubation, 0.5 mL of Folin-Ciocalteu reagent (1N) was added, followed by immediate stirring and incubation for 30 min. The blue color solution formed, was measured at 750 nm using a UV-vis spectrophotometer (DR 3900, HACH, Loveland, CO, USA). A calibration curve was prepared using standard bovine albumin aqueous solution, in a concentration range from 0 to 1,500 μg/mL.
2.5.4. Carbohydrates Determination
Samples obtained after centrifugation of dried biomass-water mixtures, obtained using the method applied for proteins determination, were also used for the analysis of carbohydrates by the phenol-sulfate method. Specifically, the content of neutral monomers was quantified as glucose equivalents by the treatment of the unknown samples with 1 mL of 1% (w/v) phenol solution and 5 mL of 96% (w/w) H2SO4 and measurement of the absorbance at 483 nm with a UV-vis spectrophotometer [37]. D-glucose solutions of known concentrations were used as reference standards for the development of the glucose concentration-absorbance calibration curve.
3. Results
3.1. Effect of Light Intensity on Chlorella sorokiniana Growth
Light represents the main energy source for photosynthetic organisms and the most important environmental factor that influences the photosynthetic rate directly affecting microalgal cell growth and the corresponding biochemical composition [6,10,22]. Therefore, light is a key parameter to be optimized for the achievement of maximum biomass productivity [6]. However, optimal light requirements vary depending on the microalgae species [21] and several additional parameters should be considered simultaneously when selecting the appropriate light intensity, such as temperature or nutrients supply type [3,6]. Several researchers have studied a wide range of light intensities, from about 300 lx to about 250,000 lx, and the corresponding growth patterns of various species [38] and it seems that, excess light above a certain saturation point, can alter the photosynthetic process due to photoinhibition, leading to reduced biomass production [6,10,16].
A range of three light intensities was applied in a 30-day experiment in this work, corresponding to different light conditions in real environment, aiming to examine the effect on the growth rate of C. sorokiniana culture. The lowest LI value, 1,500 lx, corresponds to light experienced on a cloudy day (1,500 lx), while higher values, 5,000 and 12,000 lx corresponded to light intensities within the range of ambient daylight. Under these conditions, the results of C. sorokiniana cell growth are presented in Figure 1a and Figure 1b respectively, as a function of OD600 and DCW.
As shown, biomass concentration increased with light intensity almost linearly: at the end of the 30th day of cultivation, the highest biomass content measured for the sample subjected to the highest LI, 12,000 lx, corresponding to an OD600= 11.7 and DCW=3.5 g/L, while the repsective values for sample at 5,000 lx were about 25% lower (OD600= 9.5, DCW=2.9 g/L). At the lowest light intensity, biomass content was significantly lower (OD600= 2.31, DCW=0.7 g/L), corresponding to about 5 times lower concentration compared to the optimal condition. Nevertheless, biomass growth rate followed a similar trend: average biomass productivity per day was equal to 23, 94 and 123 mg/L/day, at low, medium and high light intensity, respectively; however, an almost constant growth rate was observed for all cases, almost at the second day of cultivation.
In a similar work, C. sorokiniana exhibited a higher growth rate at light intensities of 4,810 lx, that were 1.5 and 3 times higher than at 2,886 lx and 962 lx, while no photoinhibition effects were observed at the particular light range [35]. A similar optimum LI of about 4,250 lx was also observed in another study examining the productivity of C. sorokiniana at light intensities from 1,500 lx to 7,000 lx [39]; however, there researchers highlighted a decline in the biomass productivity above the optimum light intensity. During the examination of C. sorokiniana growth at a wide LI range, from 2,220 to 14,800 lx, Gao et al. found that the optimum value for the achievement of high biomass productivity was 7,400 lx, representing a saturation point, above which excess light resulted to a decrease in biomass productivity [20]. It is noteworthy in this work, that an increase in intensity to 14,800 lx resulted in a decrease in biomass productivity below the light intensity equal to 2,200 lx. In a similar range of light intensity, from 6,000 lx to 14,000 lx, productivity of microalgal biomass presented a peak at 10,000 lx, above which reduction in biomass production took palce [17]. Chlorella protothecoides showed a similar behaviour to C. sorokiniana, with an increase in light intensity from 1,000 to 10,000 lx leading to more than double the biomass content [16]. The increase in light intensity from 3,700 to 11,100 lx had beneficial effect on biomass productivity of microalgae species C. vulgaris, Ettlia pseudoalveolaris, Desmodesmus sp. as well as S. obliquus, although, a similar significant increase was not observed in C. vulgaris and S. obliquus cultures in the range of 11,100 to 22,000 lx [19].
3.2. Effect of Light Intensity in the Macronutrient Concentration of Biomass
Microalgae cultivated under different light conditions show remarkable changes in their chemical composition [20,21,22]. Lipids are the primary group of macronutrients with great concentration changes in response to environmental conditions. Nevertheless, in addition to lipids, microalgal contain carbohydrates and proteins and any change of one fraction is associated to a change in the other fractions [19]. Current results show that under increasing light intensity, lipid accumulation in biomass intensifies [10,16]; it seems that in their effort to survive under the adverse conditions of high light intensity, cells change their metabolism, accumulating excess energy in energy-rich products such as fatty acids [6,10]. However, there a clear consensus is not achieved on the effect of irradiation to lipids formation, and light may have different effects in microalgal species [16]. In recent studies, high light intensity reduced lipid contents in several microalgae, including marine strains of Chlorella, despite biomass increase, possibly due to the utilization of excess light for cell division rather than being stored as lipids [19].
The composition of C sorokiniana cells in the different macronutrients fractions, under various light intensities, is presented in Figure 2 as a function of cultivation time. Lipid content of inoculated biomass at the start-up of the experiment was 29.7%, and increased after 30 days to about 33% and 34% at 5,000 and 12,000 lx respectively, while a slight decrease was observed at the low light irradiation to about 28%.
Lipids content changes were followed by a corresponding change of proteins content in a reverse order: at the high light intensity conditions proteins decreased from 30.9% to 27.3% and 26.1%, respectively, while at low irradiation, proteins increased to 33.9%. Nevertheless, carbohydrates content remained almost contact by the time, varying from 27 to 29% during the whole cultivation run. Similar results were observed for Desmodesmus sp. and S. obliquus, with an increase in lipid content and a corresponding reduction in proteins, while carbohydrate content was almost stable [19]. These results can be attributed to microalgal lipid synthesis mainly based on protein degradation or inhibition of protein synthesis [6]. Moreover, the increase in lipid content without a concomitant increase in carbohydrate content suggests that these macronutrients are probably competing for a common carbon precursor, precluding starch synthesis for lipid production [19]. A similar increase in lipid permeability has been reported by switching light intensity from low to high values for several species such as Mychonastes homosphaera, Raphidocelis subcapitata, Scenedesmus sp. [21], Botryococcus braunii, E. pseudoalveolaris, Desmodesmus sp. [10], S. obliquus [22] and C. vulgaris [40]. Nevertheless, inconsistent results have been reported for C sorokiniana since low light levels may lead to lipids accumulation, while by increasing light irradiation a significant decrease has been observed in lipid content [35]. However, in another study, at a wide range of light intensities, from 2,220 lx to 14,800 lx, lipid content presented a statistically significant increase from 25.10% to 29.04% [20].
3.3. Effect of Light Intensity the Nutrients Removal
Microalgae have shown a challenging potential for bioremediation of effluents, making microalgae cultivation in wastewater a promising alternative for energy conservation, environmental sustainability and carbon neutrality as well as resource recovery [1]. High removal rates of phosphorus and nitrogen can be achieved in a microalgae wastewater treatment, reaching up to 75% efficiency [7,41,42]. Microalgae show considerable preference towards ammonium nitrogen assimilation, as less energy is required for its uptake [43]. Other nitrogen sources must be converted to ammonium inside the cells before being assimilated into biomass, requiring however additional energy [20].
The reduction of N-NH4 content from ADE through binding by C. sorokiniana cells is shown in Figure 3 as a function of cultivation time, under the three conditions of light irradiation. Cultivation took place using a certain volume of diluted digestate. As soon as nitrogen content in the aqueous phase was reduced below a certain concentration, addition of new substrate volume tool place to reach initial nitrogen concentrations, aiming to extend the cultivation time and receive reliable results. The correlation of ammonium nitrogen concentration by the time was significantly affected by light intensity. At the low light irradiation, a continuous reduction in nitrogen content was measured, that was however never below the lowest nitrogen value set for new substrate addition, with a final nitrogen concentration of 33.9 mg/L after 30 days. At the higher light intensity however, ammonia assimilation was high resulting in nitrogen depletion after almost 7 days of cultivation: ammonia nitrogen reached to about 4.6 mg/L after one week, corresponding to 94.2% reduction, while similar results were observed at the medium light intensity, resulting however to a nitrogen reduction of about 77.1%. A similar pattern was revealed after the addition of new substrate volume, and nitrogen content reduced by 49.7 and 91.9% at 5,000 lx and 12,000 lx respectively after 8 days of cultivation, as well as in the third recharge period, resulting to a final aqueous phase with 38.9 and 6.34 mg/L nitrogen content. Similar results calculated by the ammonia nitrogen removal rate, estimated from the slope of the corresponding curves: average ammonia nitrogen removal was equal to 2.1, 5.6 and 8.5 mg/L/d, at low, medium and high light intensity, respectively.
The importance of light intensity in nitrogen uptake has been justified by several studies. The cultivation of C. sorokiniana was examined using agricultural wastewater and the effect of LI and photoperiod studied on N-NH4 and P-PO4 removal rate, showing that only light intensity had a significant effect [44]. Low removal rate, 77%, measured at 4,440 lx light intensity significantly lower than the complete removal achieved at 14,800 lx. In another study investigating a wide range of light intensities (2,220 lx to 14,800 lx) and the relationship with N-NH4 assimilation, it was found that although there was higher N-NH4 and total nitrogen removal at certain high light intensities, the difference did not appear to be statistically significant. Surprisingly, a threshold was observed, above which the rate of N-NH4 and total nitrogen fixation decreased [20].
The reduction of P-PO4 from ADE is shown in Figure 4 as a function of time. Efficient P-PO4 removal was observed at medium and high light intensities (5,000 lx and 12,000 lx), following an almost similar profile, indicating that phosphorous assimilation was not really affected by light irradiation. Phosphorous content was completely removed after 7 days of cultivation, and a similar trend observed after the addition of new substrate- KH2PO4, in the following periods. However, phosphorous reduction followed a different pattern at the low light irradiation level, corresponding to about 34.9% removal over the entire cultivation period of 30 days, resulting to an effluent with 3.13 mg/L phosphorous. Average phosphorus removal rate was estimated to 0.3, 0.9 and 1.1 mg/L/d, at low, medium and high light intensity, respectively. It has to be underlined that the highest rates of phosphorus assimilation, via active transport, were observed during periods of phosphorus abundance. This is a known phenomenon, phosphorous luxury uptake, i.e., the uptake and storage of phosphorus at levels higher than those required for cell growth; it represents a specific condition stimulated at phosphorus concentrations above 5 mg/L, where excess phosphorous is adsorbed and stored by the cells for subsequent use when the external concentration of phosphorus is becoming limited for their growth [6,31].
Light intensity has been proved an important factor in phosphorus uptake in other studies. An increase in phosphorus removal from 23% at 4,440 lx to 100% at 14,800 lx was measured within four days [44] while similar results were obtained in a study investigating the relationship between light intensity and P-PO4 assimilation over a wide range of light intensities [20]. It was concluded by this study that light is beneficial for phosphorous assimilation by biomass, improving the culture conditions of C. sorokiniana. A similar relationship between LI and phosphorous assimilation was found for C. vulgaris, Desmodesmus sp. and S. obliquus, showing a higher rate of assimilation by increasing light intensity from 3,700 lx to 11,100 lx, although a similar observation was not made for E. pseudoalveolaris [19].
Phosphorus uptake is an energy-intensive process and microalgae receive the required energy from the light source; therefore, a higher phosphorous uptake rate is expected at increased light intensity conditions [31]. Nevertheless, since higher LI favour biomass growth, rapid phosphorus accumulation is simultaneously associated to increased consumption by the biomass. At low LI, phosphorous accumulation is still low, but biomass growth is even lower than at high LI and therefore, is it expected that cells retain more phosphorus at low irradiation [45].
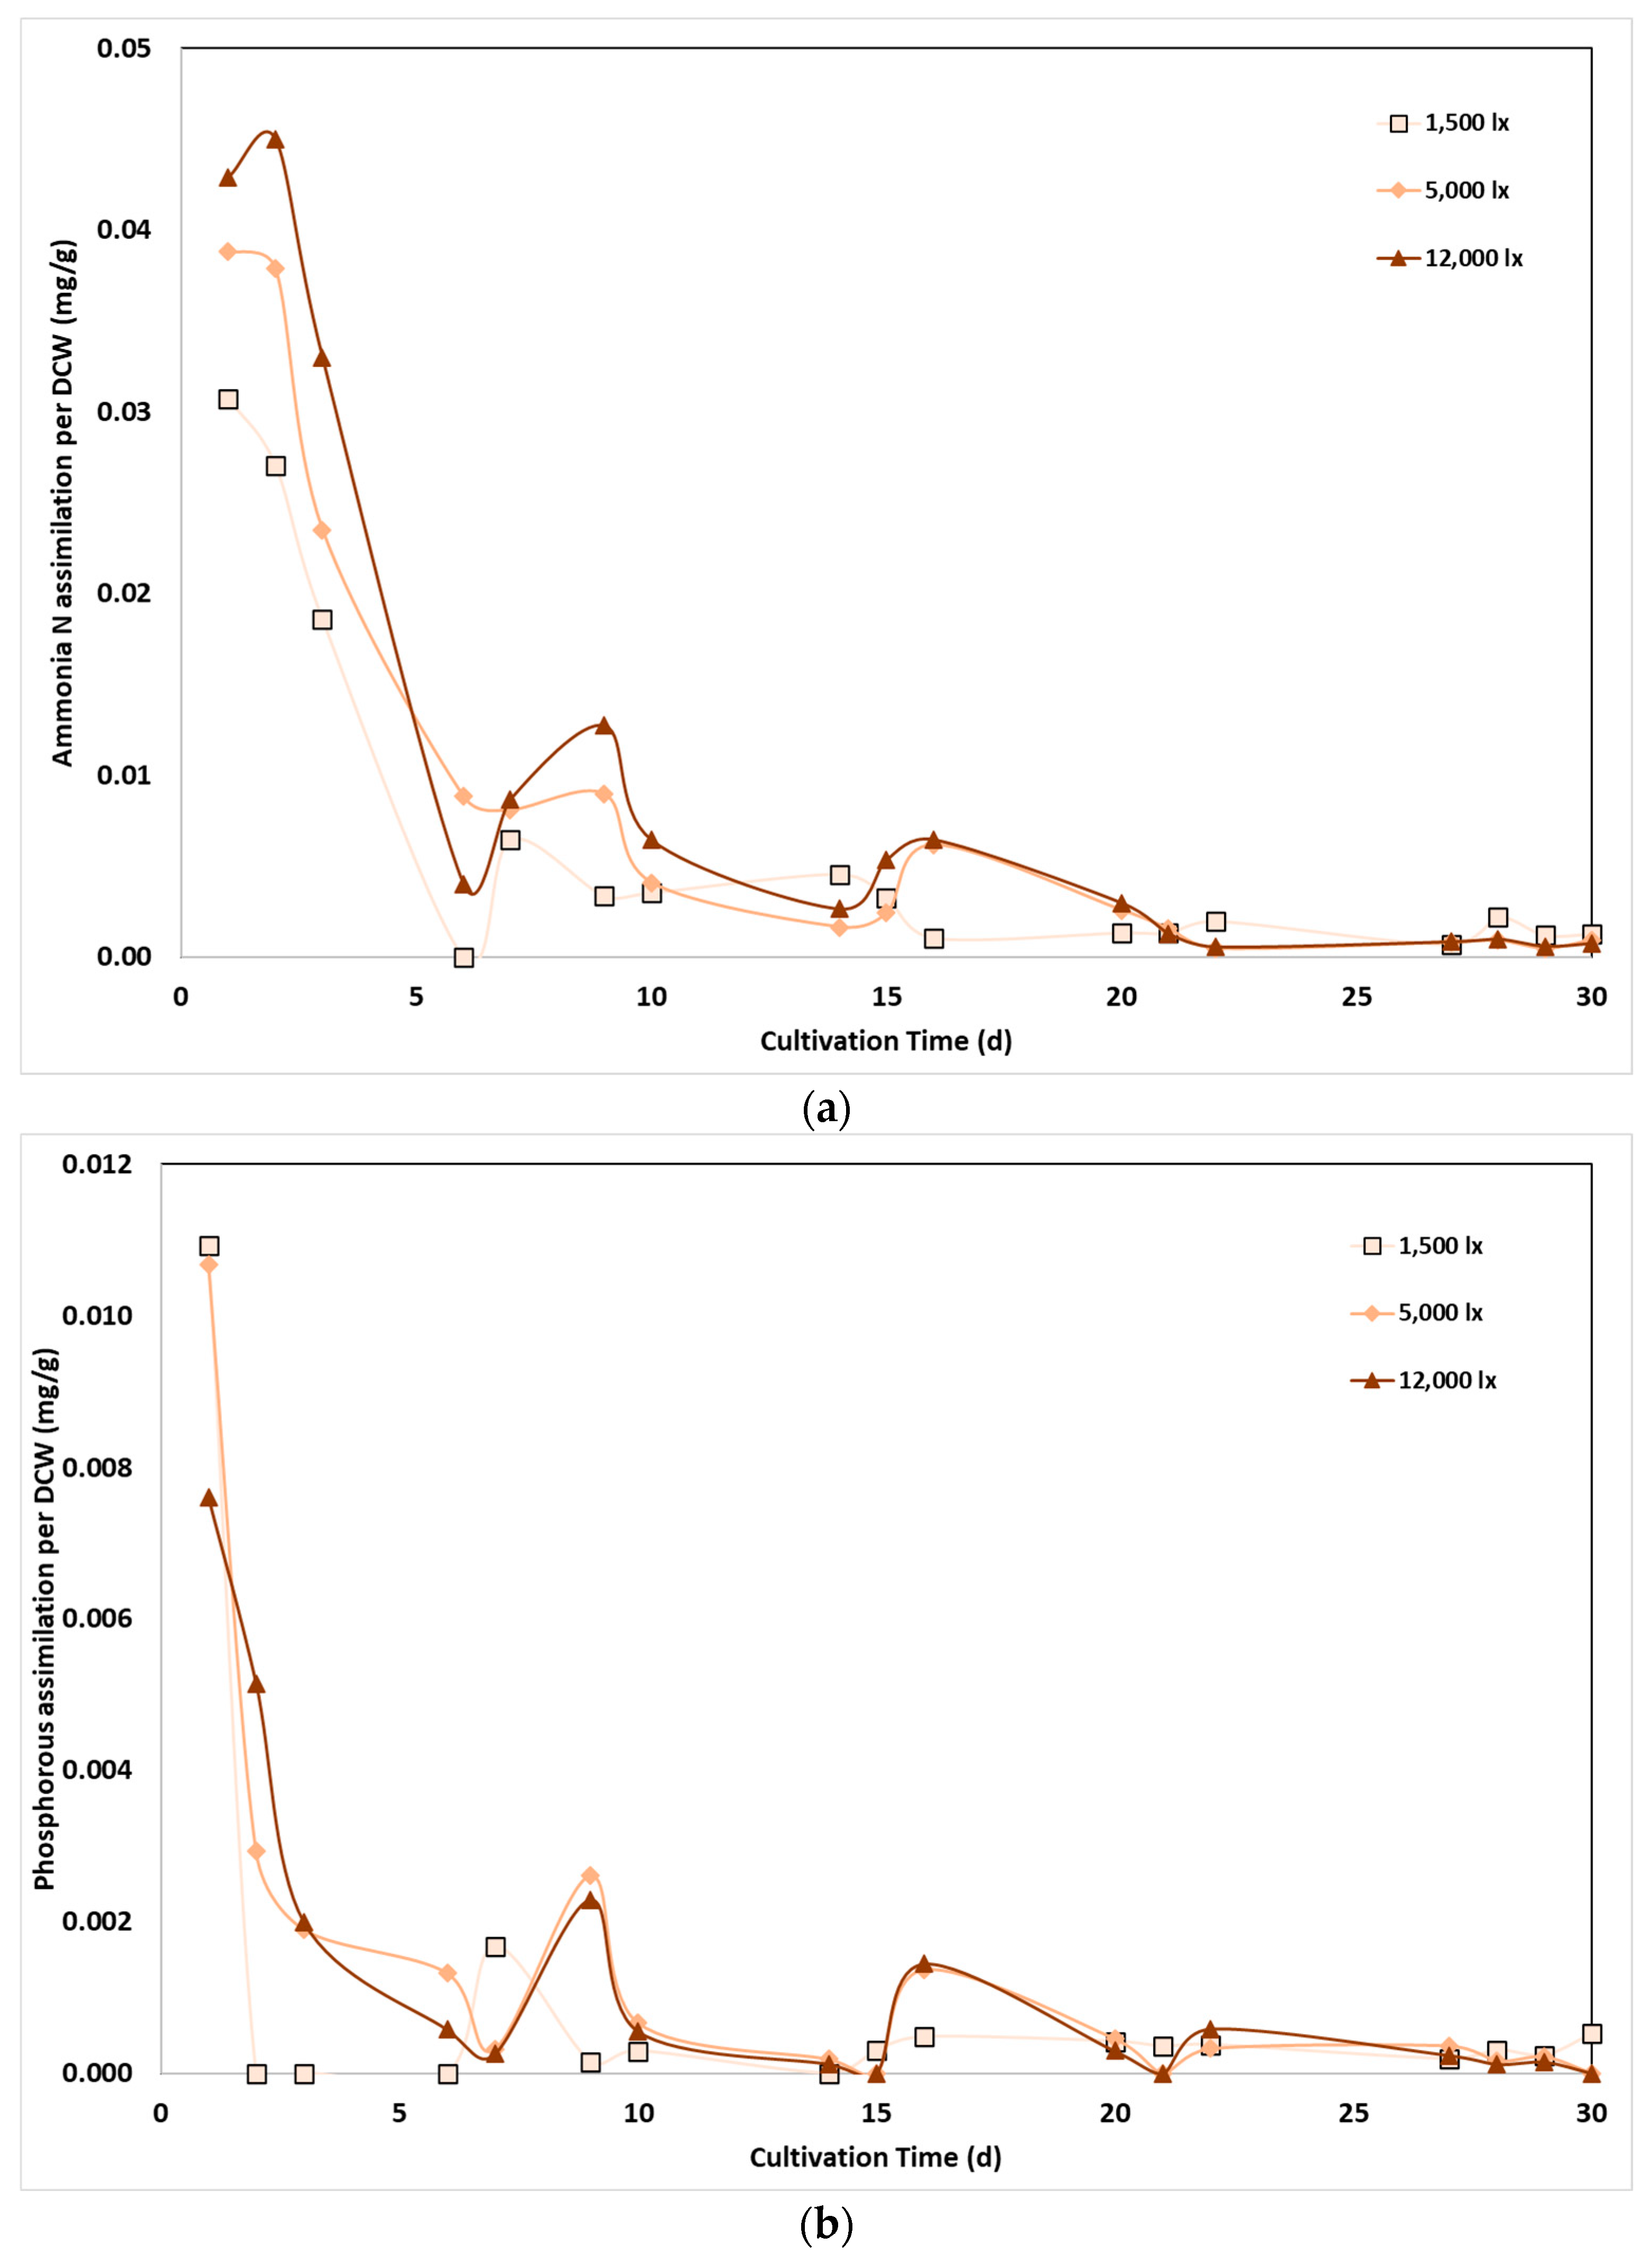
As it has been observed in Figure 1, light intensity affects biomass growth, and therefore, a more consistent conclusion can be obtained by taking into account the corresponding biomass concentration in nutrients assimilation rate [44]. Τhe assimilation rate of N-NH4 and P-PO4 per biomass weight in mg of nutrients assimilated per g of cells is presented in Figure 4 respectively, as a function of time. Increased assimilation rates, about 30 to 40 mg/L N-NH4 and 8 to 11 /L P-PO4, per gram of biomass, were observed at the first days of experiments, due to excess nutrients substrates content and low biomass content. However, upon biomass increase, a large number of cells was produced and the assimilation rate per weight unit ceased by the time, demonstrating that the relationship between light intensity and nutrient assimilation was mainly attributed rather to the effect of light on biomass productivity than to a change in the cell metabolism. A similar conclusion was reached by Delgadillo-Mirquez et al., reporting that the effect on nutrient assimilation by microalgae was primarily related to biomass productivity than to light availability [43]. Nevertheless, as shown in Figure 4, nutrients assimilation per biomass weight followed almost similar values at the three lighting conditions, revealing therefore, that light intensity did not significantly change the pathway of nutrients bonding by the cells.
4. Conclusions
The primary aim of this study was to examine the effect of light intensity on C. sorokinianana microalgae species, cultivated in anaerobic digestate effluent, as an effort to identify the optimum conditions for the achievement of high biomass growth, maximum nutrients removal from the aqueous phase and cells with a specified composition. Based on the results, the following conclusions were drawn. (1) The optimum light intensity was 12,000 lx, for high growth and production of C. sorokiniana biomass, followed by that of 5,000 lx. It was also found that insufficient light availability is a major limitation to microalgal growth. Finally, a point worth noting is that under the high light intensity used in this study photoinhibition was not observed, that could reduce biomass growth rate; (2) The chemical composition of C. sorokiniana microalgae biomass changed with variations in light conditions; and thus, a desirable chemical composition could be improved by regulating the light conditions. Specifically, there was an increase in lipids content over time at high light intensities, with higher light intensity leading to higher lipids content, with a corresponding decrease in proteins. Reverse effects were observed at low light intensity, i.e., biomass showed low lipids content and high protein composition. The effect on carbohydrate concentration was not considered significant; (3) Light intensity affected the rate of nutrient assimilation of ADE, depending on the intensity levels. More efficient ammonium nitrogen removal was observed at higher light intensities, with a direct relationship between removal rate and light intensity. Similarly, the removal of phosphorous was more efficient at higher light intensities, without difference between the two high intensity conditions; (4) The effect of light intensity on the assimilation of ADE nutrients was due to the relationship between light conditions and biomass productivity. These results provided data support for enhanced biomass production in large-scale microalgal culture using ADE of appropriate chemical composition as nutrients substrate.
References
- Martinez-Porchas, M.; Martinez-Cordova, L.R.; Lopez-Elias, J.A.; Porchas-Cornejo, M.A. Bioremediation of aquaculture effluents. In Microbial biodegradation and bioremediation: Techniques and Case Studies for Environmental Pollution, 2nd ed.; Das, S., Dash, H.R. Eds.; Elsevier: Amsterdam, Netherlands, 2021; pp. 539-553.
- Vale, A.M.; Ferreira, A.; Pires, C.M.J.; Goncalves, LA. (2020). CO2 Capture Using Microalge. In: Advances in Carbon Capture: Methods, Technology and Applications, Rahimpour, M.R., Farsi, Μ., Makarem, Μ.A. Eds.; Woodhead Publishing: Cambridge, United Kingdom, 2020; pp. 308-405.
- Yun, H.S.; Kim, Y.S.; Yoon, H.S. Characterization of Chlorella sorokiniana and Chlorella vulgaris fatty acid components under a wide range of light intensity and growth temperature for their use as biological resources. Heliyon 2020, 6, e04447. [CrossRef]
- Khavari, F.; Saidijam, M.; Taheri, M.; Nouri, F. (2021). Microalgae: Therapeutic potentials and applications. Mol. Biol. Rep. 2021, 48, 4757-4765. [CrossRef]
- Sun, X.M.; Ren, L.J.; Zhao, Q.Y.; Ji, X.J.; Huang, H. Microalgae for the production of lipid and carotenoids: a review with focus on stress regulation and adaptation. Biotechnol Biofuels 2018, 11, 1-16. [CrossRef]
- Chowdury, K.H.; Nahar, N.; Deb, U.K. (2020). The growth factors involved in microalgae cultivation for biofuel production: a review. CWEEE 2020, 9, 185-215. [CrossRef]
- Goh, P.S.; Ahmad, N.A.; Lim, J.W.; Liang, Y.Y.; Kang, H.S.; Ismail, A.F.; Arthanareeswaran, G. Microalgae-Enabled Wastewater Remediation and Nutrient Recovery through Membrane Photobioreactors: Recent Achievements and Future Perspective. Membranes 2022, 12, 1094. [CrossRef]
- Obaideen, K.; Shehata, N.; Sayed, E.T.; Abdelkareem, M.A.; Mahmoud, M.S.; Olabi, A.G. The role of wastewater treatment in achieving sustainable development goals (SDGs) and sustainability guideline. Energy Nexus 2022, 7, 100112. [CrossRef]
- Abdel-Karim, O.H.; Gheda, S.F.; Ismail, G.A.; Abo-Shady, A.M. Phytochemical Screening and antioxidant activity of Chlorella vulgaris. DJS 2020, 41, 79-91. [CrossRef]
- Krzemińska, I.; Piasecka, A.; Nosalewicz, A.; Simionato, D.; Wawrzykowski, J. Alterations of the lipid content and fatty acid profile of Chlorella protothecoides under different light intensities. Bioresour. Τechnol. 2015, 196, 72-77. [CrossRef]
- Matabanchoy-Mesias, Y.; Rodríguez-Caicedo, Y.A.; Imués-Figueroa, M.A. Population growth of Chlorella sp. in three types of tubular photobioreactors, under laboratory conditions. AACL 2020, 13, 2094-2106.
- Kuo, C.M.; Sun, Y.L.; Lin, C.H.; Lin, C.H.; Wu, H.T.; Lin, C.S. Cultivation and biorefinery of microalgae (Chlorella sp.) for producing biofuels and other byproducts: A review. Sustainability 2021, 13, 13480. [CrossRef]
- Narala, R.R.; Garg, S.; Sharma, K.K.; Thomas-Hall, S.R.; Deme, M.; Li, Y.; Schenk, P.M. Comparison of microalgae cultivation in photobioreactor, open raceway pond, and a two-stage hybrid system. Front. Energy Res. 2016, 4, 29. [CrossRef]
- Daliry, S.; Hallajisani, A.; Mohammadi Roshandeh, J.; Nouri, H.; Golzary, A. Investigation of optimal condition for Chlorella vulgaris microalgae growth. Global J. Environ. Sci. Mnage. 2017, 3, 217-230. [CrossRef]
- Lakaniemi, A.M.; Tuovinen, O.H.; Puhakka, J.A. Anaerobic conversion of microalgal biomass to sustainable energy carriers–a review. Bioresour. Τechnol. 2013, 135, 222-231. [CrossRef]
- Binnal, P.; Babu, P.N. Statistical optimization of parameters affecting lipid productivity of microalga Chlorella protothecoides cultivated in photobioreactor under nitrogen starvation. S. Afr. J. Chem. Eng. 2017, 23, 26-37. [CrossRef]
- Ghosh, G.; Daile, S.B.; Chakraborty, S.; Atta, A. Influence of super-optimal light intensity on the acetic acid uptake and microalgal growth in mixotrophic culture of Chlorella sorokiniana in bubble-column photobioreactors. Bioresour. Technol. 2024, 393, 130152. [CrossRef]
- Metsoviti, M.N.; Papapolymerou, G.; Karapanagiotidis, I.T.; Katsoulas, N. Effect of light intensity and quality on growth rate and composition of Chlorella vulgaris. Plants, 2020, 9, 31. [CrossRef]
- Nzayisenga, J.C.; Farge, X.; Groll, S.L; Sellstedt, A. Effects of light intensity on growth and lipid production in microalgae grown in wastewater. Biotechnol Biofuels 2020, 13, 1-8. [CrossRef]
- Gao, K.; Xue, C.; Yang, M.; Li, L.; Qian, P.; Gao, Z.; Gao, Z.; Deng, X. Optimization of light intensity and photoperiod for growing Chlorella sorokiniana on cooking cocoon wastewater in a bubble-column bioreactor. Algal Research 2022, 62, 102612. [CrossRef]
- Minhas, A.K.; Hodgson, P.; Barrow, C.J.; Adholeya, A. A review on the assessment of stress conditions for simultaneous production of microalgal lipids and carotenoids. Front. Μicrobiol. 2016, 7, 183978. [CrossRef]
- Cheng, D.; He, Q. Assessment of environmental stresses for enhanced microalgal biofuel production–an overview. Front. Energy Res. 2014, 2, 26. [CrossRef]
- Ummalyma, S.B.; Sirohi, R.; Udayan, A.; Yadav, P.; Raj, A.; Sim, S.J.; Pandey, A. Sustainable microalgal biomass production in food industry wastewater for low-cost biorefinery products: a review. Phytochem. Rev. 2023, 22, 969-991. [CrossRef]
- Gururani, P.; Bhatnagar, P.; Kumar, V.; Vlaskin, M.S.; Grigorenko, A.V. Algal Consortiums: A Novel and Integrated Approach for Wastewater Treatment. Water 2022, 14, 3784. [CrossRef]
- Dębowski, M.; Zieliński, M.; Kazimierowicz, J.; Kujawska, N.; Talbierz, S. Microalgae cultivation technologies as an opportunity for bioenergetic system development advantages and limitations. Sustainability, 2020, 12, 9980. [CrossRef]
- Psachoulia, P.; Schortsianiti, S.N.; Lortou, U.; Gkelis, S.; Chatzidoukas, C. Samaras, P. Assessment of nutrients recovery capacity and biomass growth of four microalgae species in anaerobic digestion effluent. Water, 2022, 14, 221. [CrossRef]
- Nguyen, L.N.; Aditya, L.; Vu, H.P.; Johir, A.H.; Bennar, L.; Ralph, P.; Nghiem, L. D. Nutrient removal by algae-based wastewater treatment. Curr. Pollut. Rep. 2022, 8, 369-383. [CrossRef]
- Acién Fernández, F.G.; Gómez-Serrano, C.; Fernández-Sevilla, J.M. Recovery of nutrients from wastewaters using microalgae. Front. Sustain. Food Syst. 2018, 2, 59. [CrossRef]
- Qian, W.; Yang, Y.; Chou, S.; Ge, S.; Li, P.; Wang, X.; Zhung, L.; Zhang, J. Effect of N/P ratio on attached microalgae growth and the differentiated metabolism along the depth of biofilm. Environ. Res. 2024, 240, 117428. [CrossRef]
- Ummalyma Choi, H.J.; Lee, S.M. Effect of the N/P ratio on biomass productivity and nutrient removal from municipal wastewater. Bioprocess Biosyst. Eng. 2015, 38, 761-766. [CrossRef]
- Brown, N.; Shilton, A. Luxury uptake of phosphorus by microalgae in waste stabilisation ponds: current understanding and future direction. Rev. Environ. Sci. And Biotechnol. 2014, 13, 321-328.
- Kamyab, H.; Chelliapan, S.; Lee, C.T.; Khademi, T.; Kumar, A.; Yadav, K.K.; Ebrahimi, S. S. Improved production of lipid contents by cultivating Chlorella pyrenoidosa in heterogeneous organic substrates. CLEAN TECHNOL. ENVIR. 2019, 21, 1969-1978. [CrossRef]
- Al-Ameri, M.; Al-Zuhair, S. Using switchable solvents for enhanced, simultaneous microalgae oil extraction-reaction for biodiesel production. Biochem. Eng. J. 2019, 141, 217-224. [CrossRef]
- Bligh, E. G.; Dyer, W. J. A rapid method of total lipid extraction and purification. Can. J. Biochem. Physiol. 1959, 37, 911-917. [CrossRef]
- Montoya-Vallejo, C.; Guzmán Duque, F.L.; Quintero Díaz, J.C. Biomass and lipid production by the native green microalgae Chlorella sorokiniana in response to nutrients, light intensity, and carbon dioxide: experimental and modeling approach. Front. Bioeng. Biotechnol. 2023, 11, 1149762. [CrossRef]
- Lowry, O.H.; Rosebrough, N.J.; Farr, A.L.; Randall, R. J. Protein measurement with the Folin phenol reagent. J. Biol. Chem. 1951, 193, 265-275. [CrossRef]
- DuBois, M.; Gilles, K.A.; Hamilton, J.K.; Rebers, P.T.; Smith, F. Colorimetricmethod for determination of sugars and related substances. Anal. Chem. 1956, 28, 350-356. [CrossRef]
- Maltsev, Y.; Maltseva, K.; Kulikovskiy, M.; Maltseva, S. Influence of light conditions on microalgae growth and content of lipids, carotenoids, and fatty acid composition. Biology, 2021, 10, 1060. [CrossRef]
- Safaee, M.; Abdolalian, S.; Moghaddam, S. Y. Optimization of chlorella sorokiniana growth via response surface methodology. In Proceedings of the third international conference on new research and achievements in science, engineering and technologies, Berlin, Germany, 6 January 2024.
- Ali H.E.A.; El-fayoumy, E.A.; Rasmy, W.E.; Soliman R.M.; Abdullah M.A. Two-stage cultivation of Chlorella vulgaris using light and salt stress conditions for simultaneous production of lipid, carotenoids, and antioxidants. J. Appl. Phyc. 2021, 33, 227-239. [CrossRef]
- Li, S.; Zhao, S.; Yan, S.; Qiu, Y.; Song, C.; Li, Y.; Kitamura, Y. Food processing wastewater purification by microalgae cultivation associated with high value-added compounds production-A review. Chin. J. Chem. Eng. 2019, 27, 2845-2856. [CrossRef]
- Wu, Q.; Guo, L.; Li, X.; Wang, Y. Effect of phosphorus concentration and light/dark condition on phosphorus uptake and distribution with microalgae. Bioresour. Technol., 2021, 340, 125745. [CrossRef]
- Delgadillo-Mirquez, L.; Lopes, F.; Taidi, B.; Pareau, D. Nitrogen and phosphate removal from wastewater with a mixed microalgae and bacteria culture. Biotechnol. Rep. 2016, 11, 18-26. [CrossRef]
- Khalid, A.A.H.; Yaakob, Z.; Abdullah, S.R.S.; Takriff, M.S. Analysis of the elemental composition and uptake mechanism of Chlorella sorokiniana for nutrient removal in agricultural wastewater under optimized response surface methodology (RSM) conditions. J. Clean. Prod. 2019, 210, 673-686. [CrossRef]
- Powell, N.; Shilton, A.; Chisti, Y.; Pratt, S. Towards luxury uptake process via microalgae: defining the polyphosphate dynamics. Water Res. 2009, 43, 4207–4213. [CrossRef]
Figure 1.
Effect of light intensity: (a) on the optical density (OD600 nm); (b) on the dry cell weight (DCW) of C. sorokiniana as a function of cultivation time.
Figure 1.
Effect of light intensity: (a) on the optical density (OD600 nm); (b) on the dry cell weight (DCW) of C. sorokiniana as a function of cultivation time.
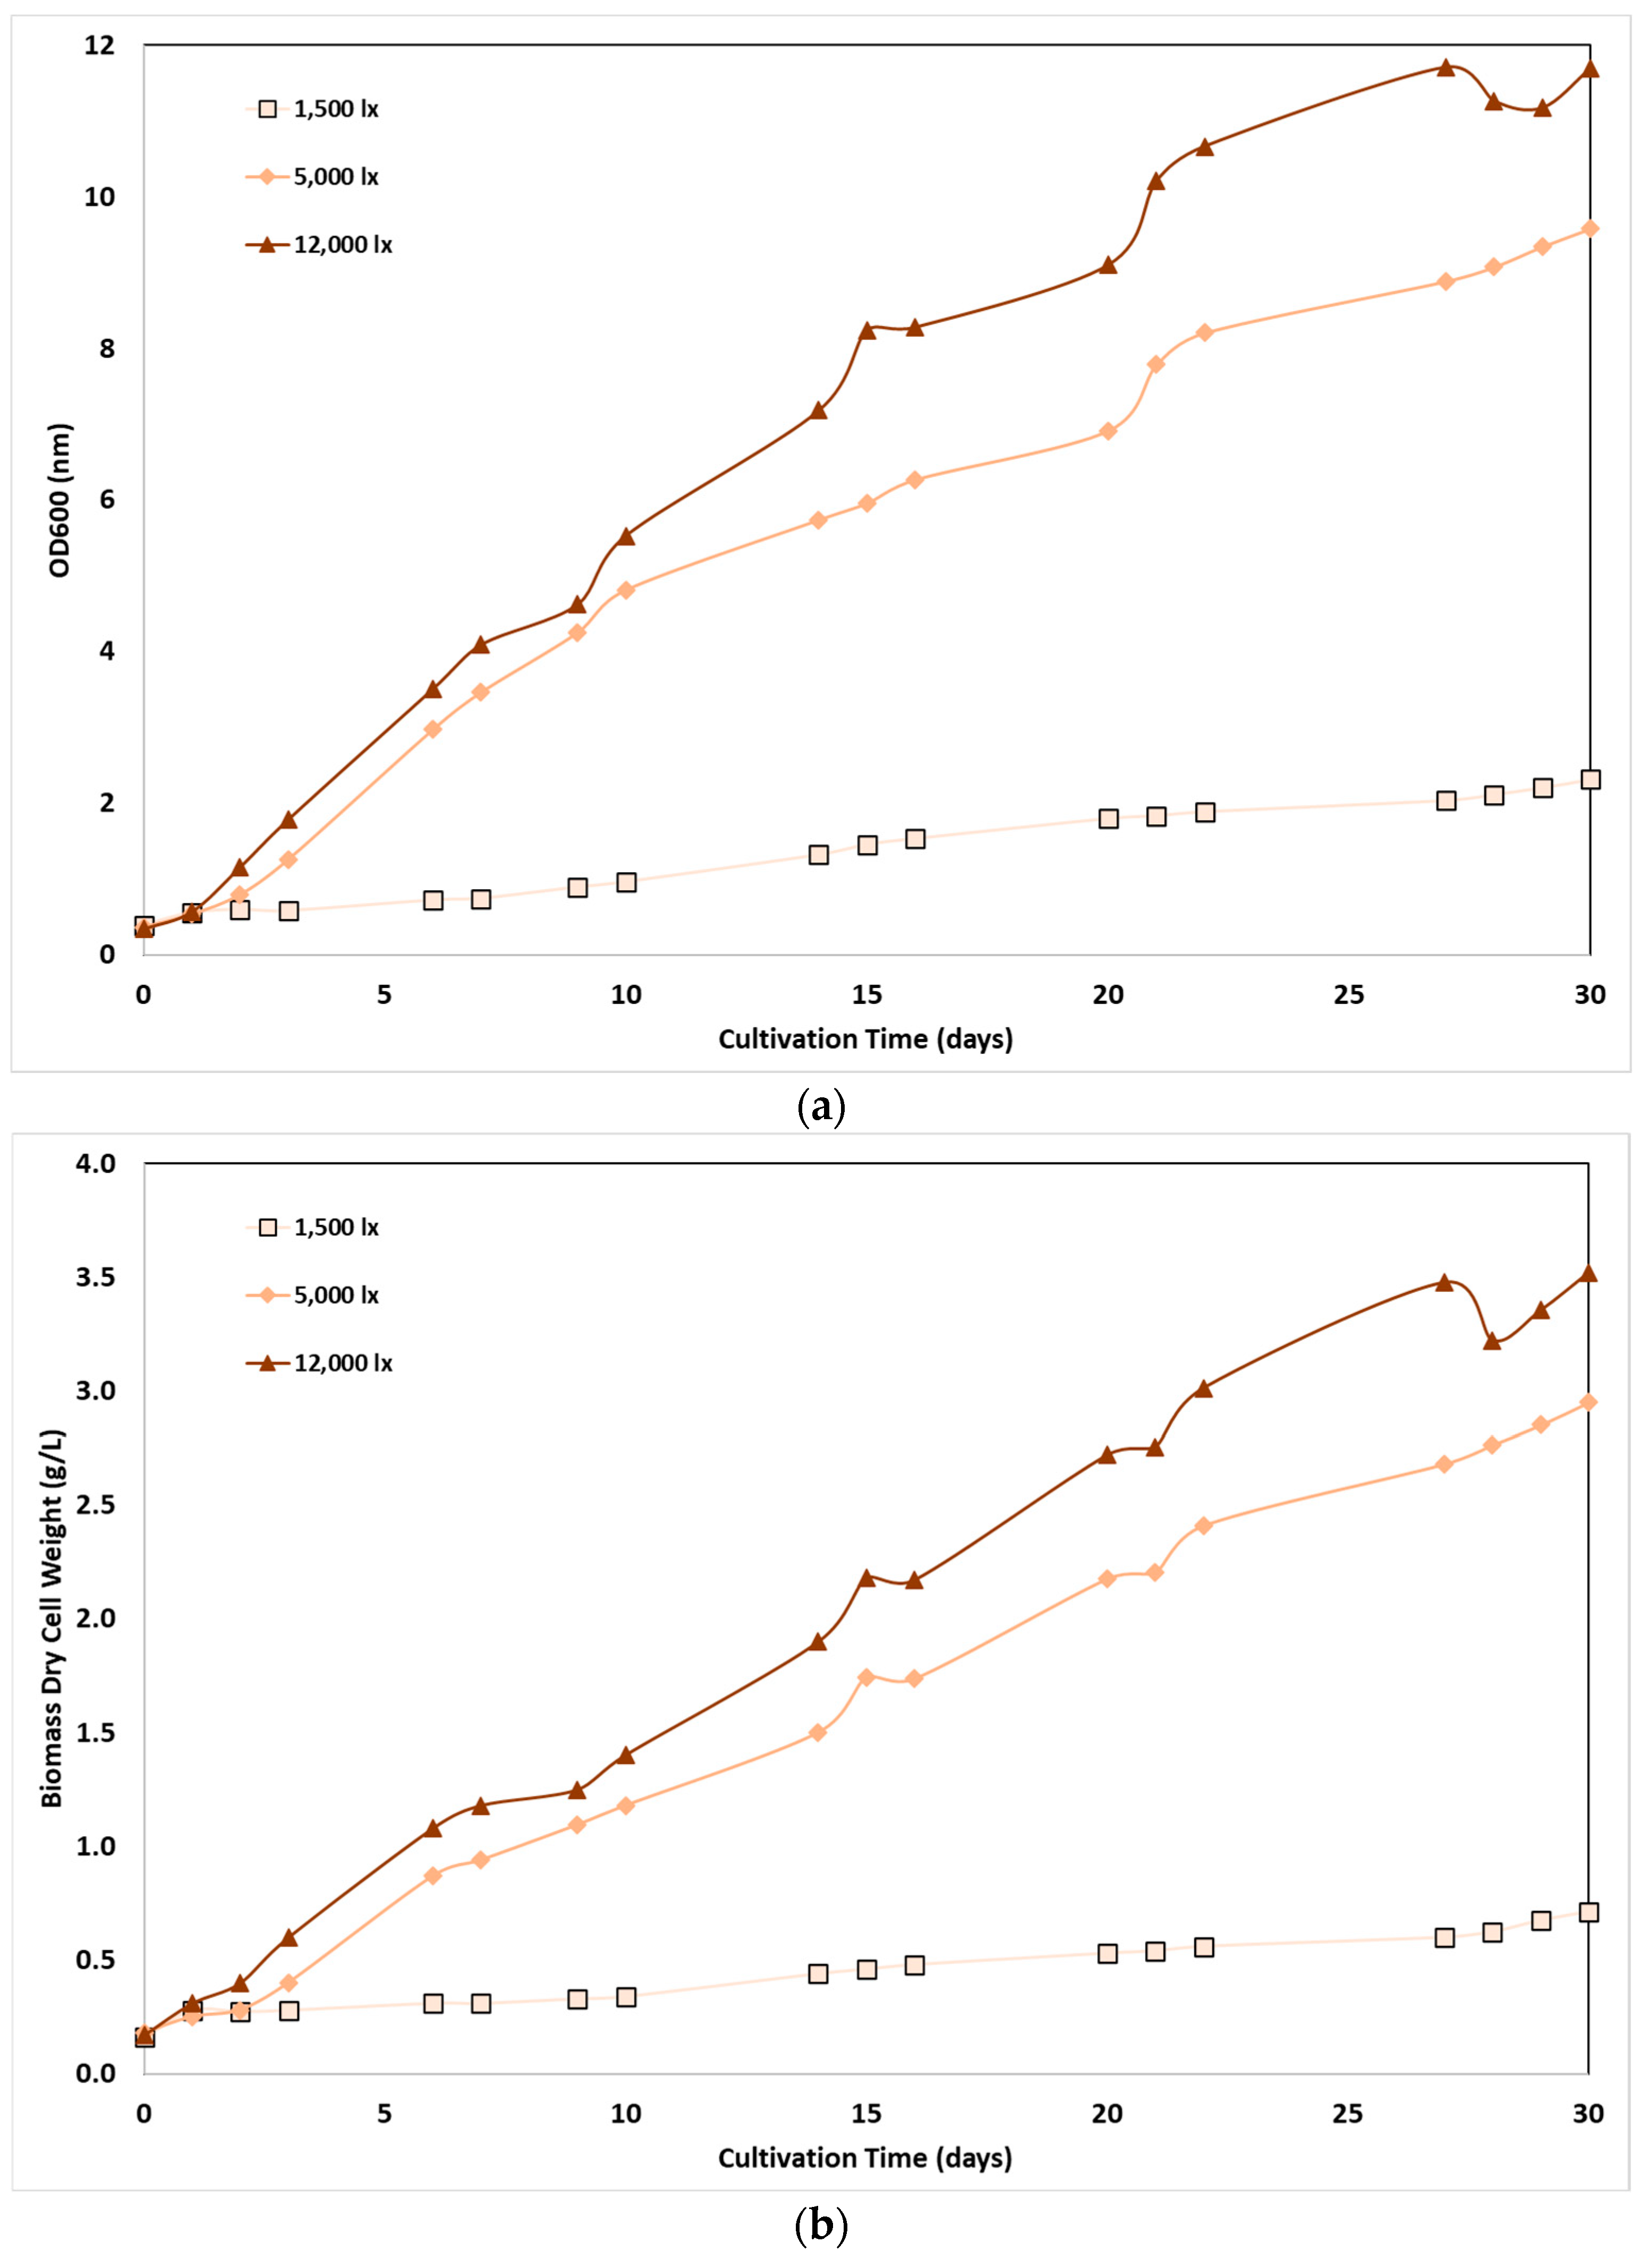
Figure 2.
Effect of light intensity on macronutrient content of C. sorokiniana culture as a function of cultivation time, under three light irradiation conditions: (a) 1,500 lx, (b) 5,000 lx, (c) 12,000 lx.
Figure 2.
Effect of light intensity on macronutrient content of C. sorokiniana culture as a function of cultivation time, under three light irradiation conditions: (a) 1,500 lx, (b) 5,000 lx, (c) 12,000 lx.

Figure 3.
Effect of light intensity on ammonia nitrogen removal by C. sorokiniana as a function of cultivation time and light intensity.
Figure 3.
Effect of light intensity on ammonia nitrogen removal by C. sorokiniana as a function of cultivation time and light intensity.
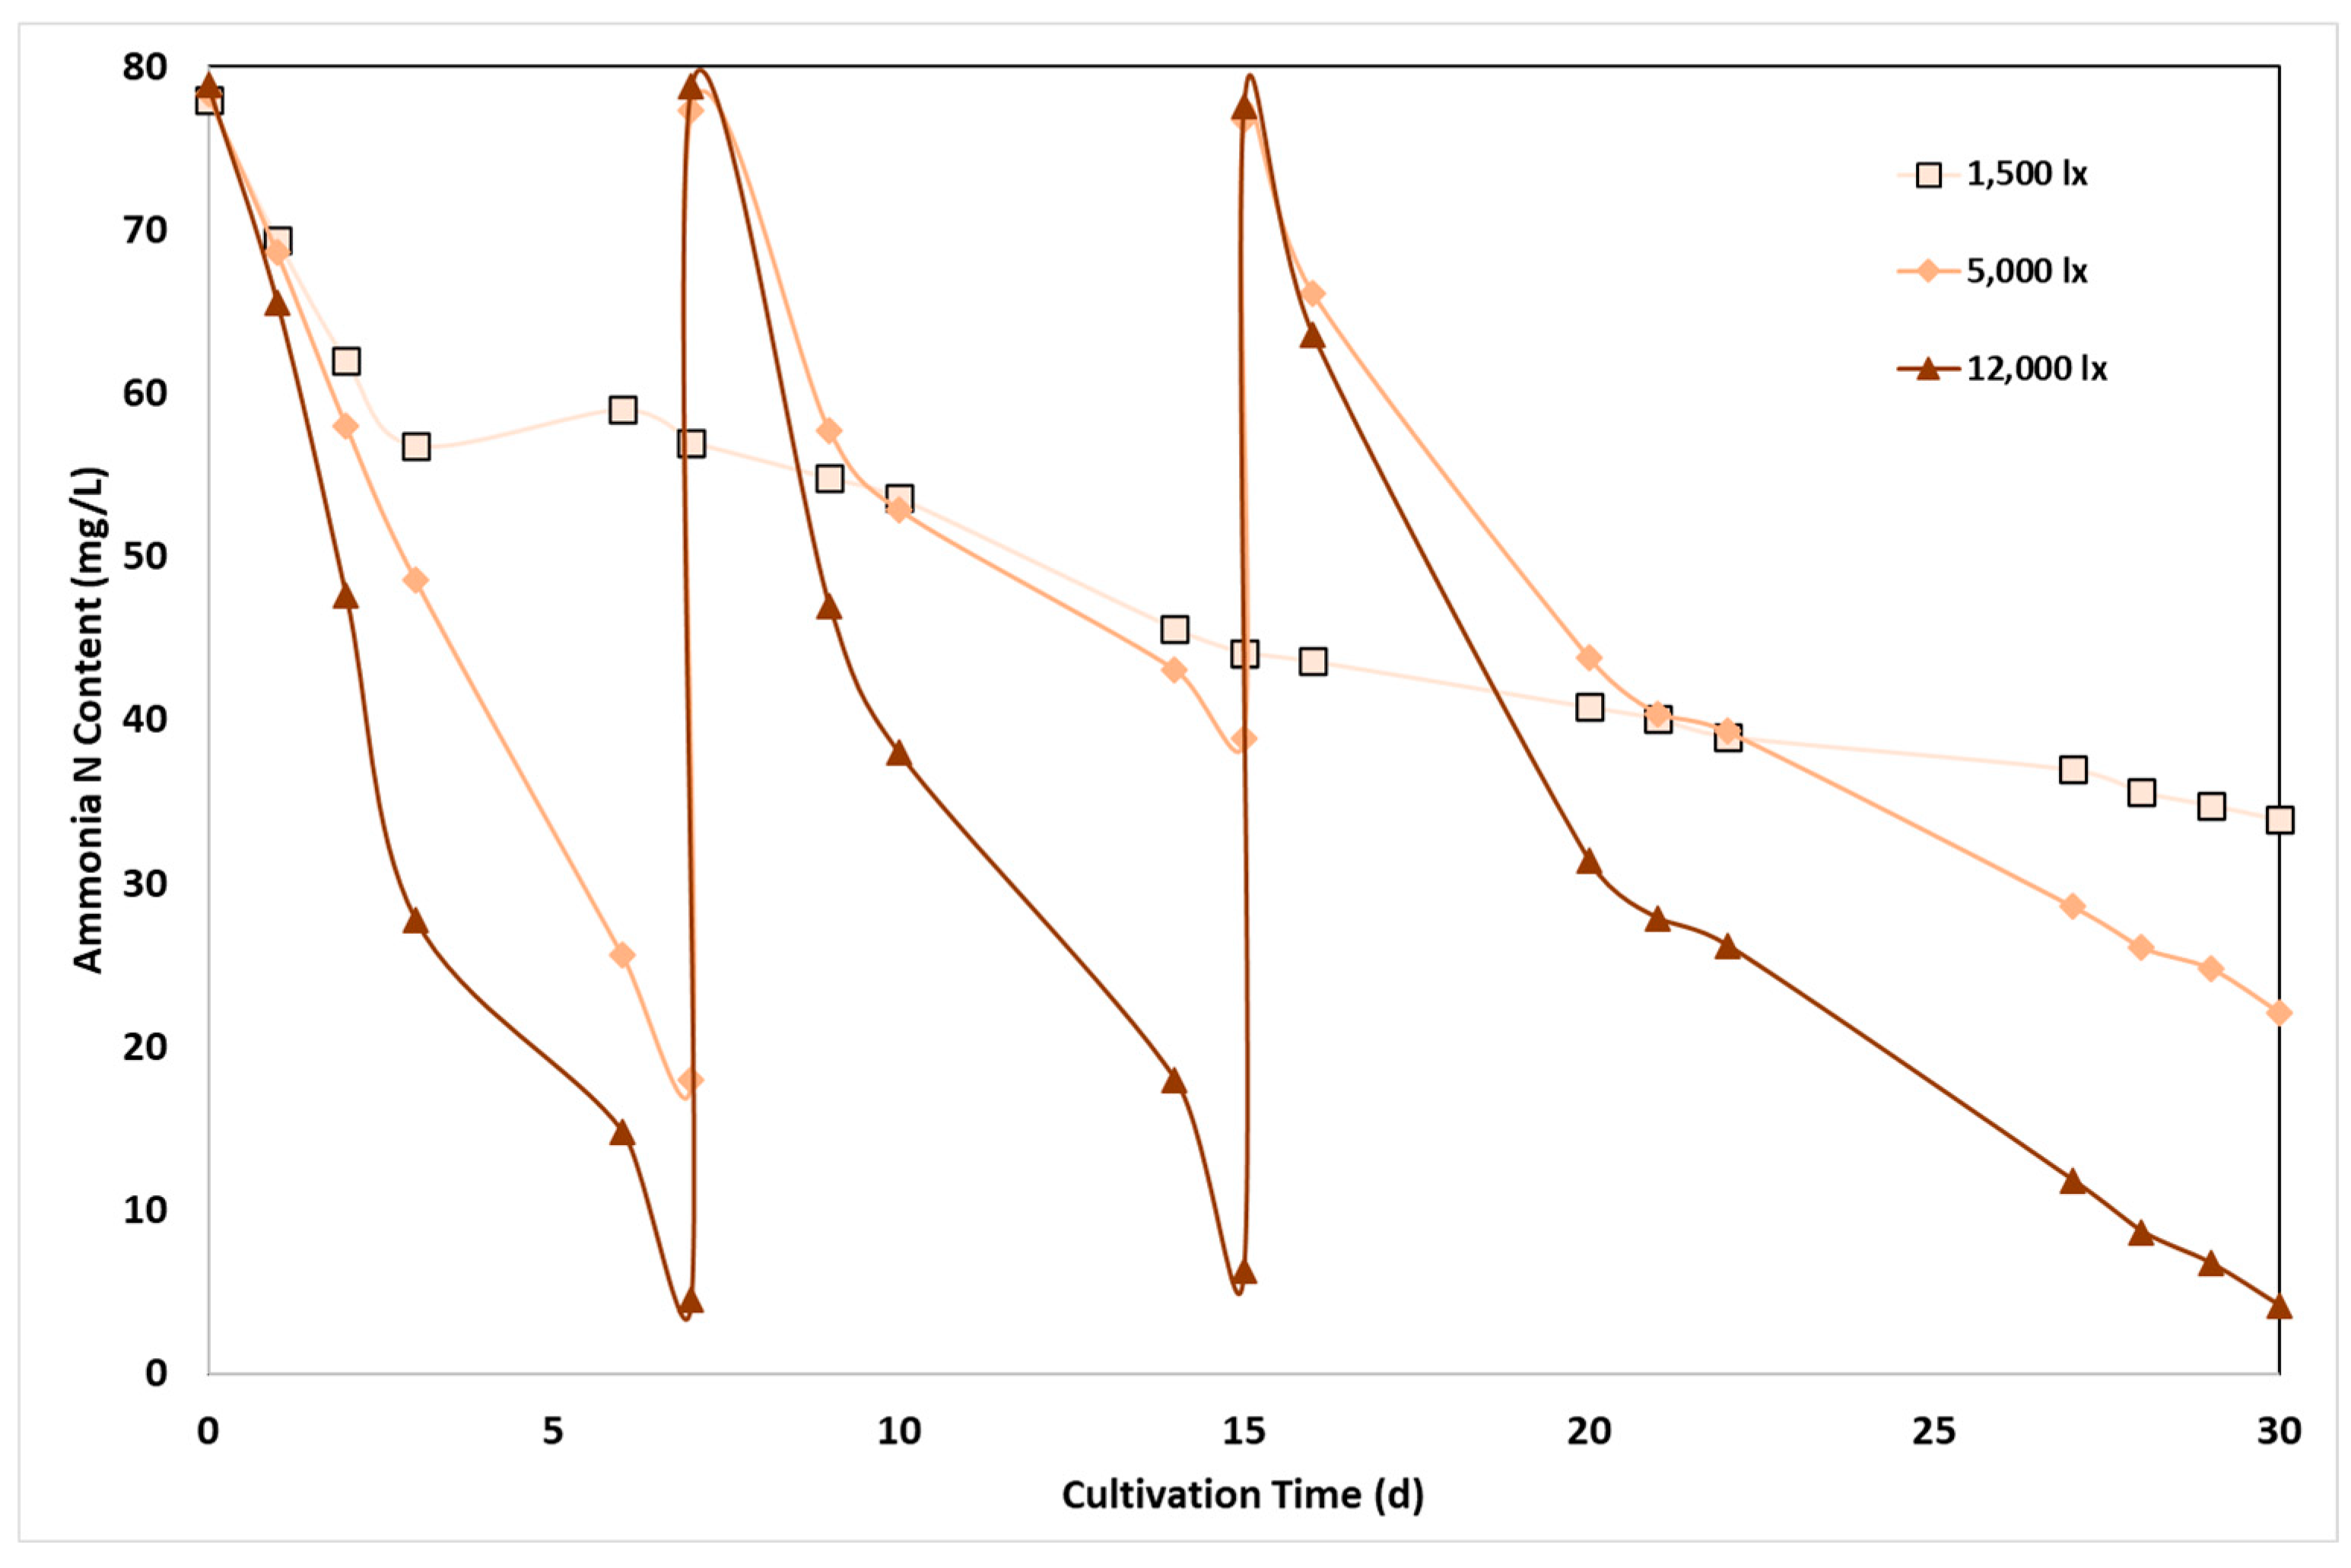
Figure 4.
Effect of light intensity on phosphorus removal by C. sorokiniana as a function of cultivation time and light intensity.
Figure 4.
Effect of light intensity on phosphorus removal by C. sorokiniana as a function of cultivation time and light intensity.
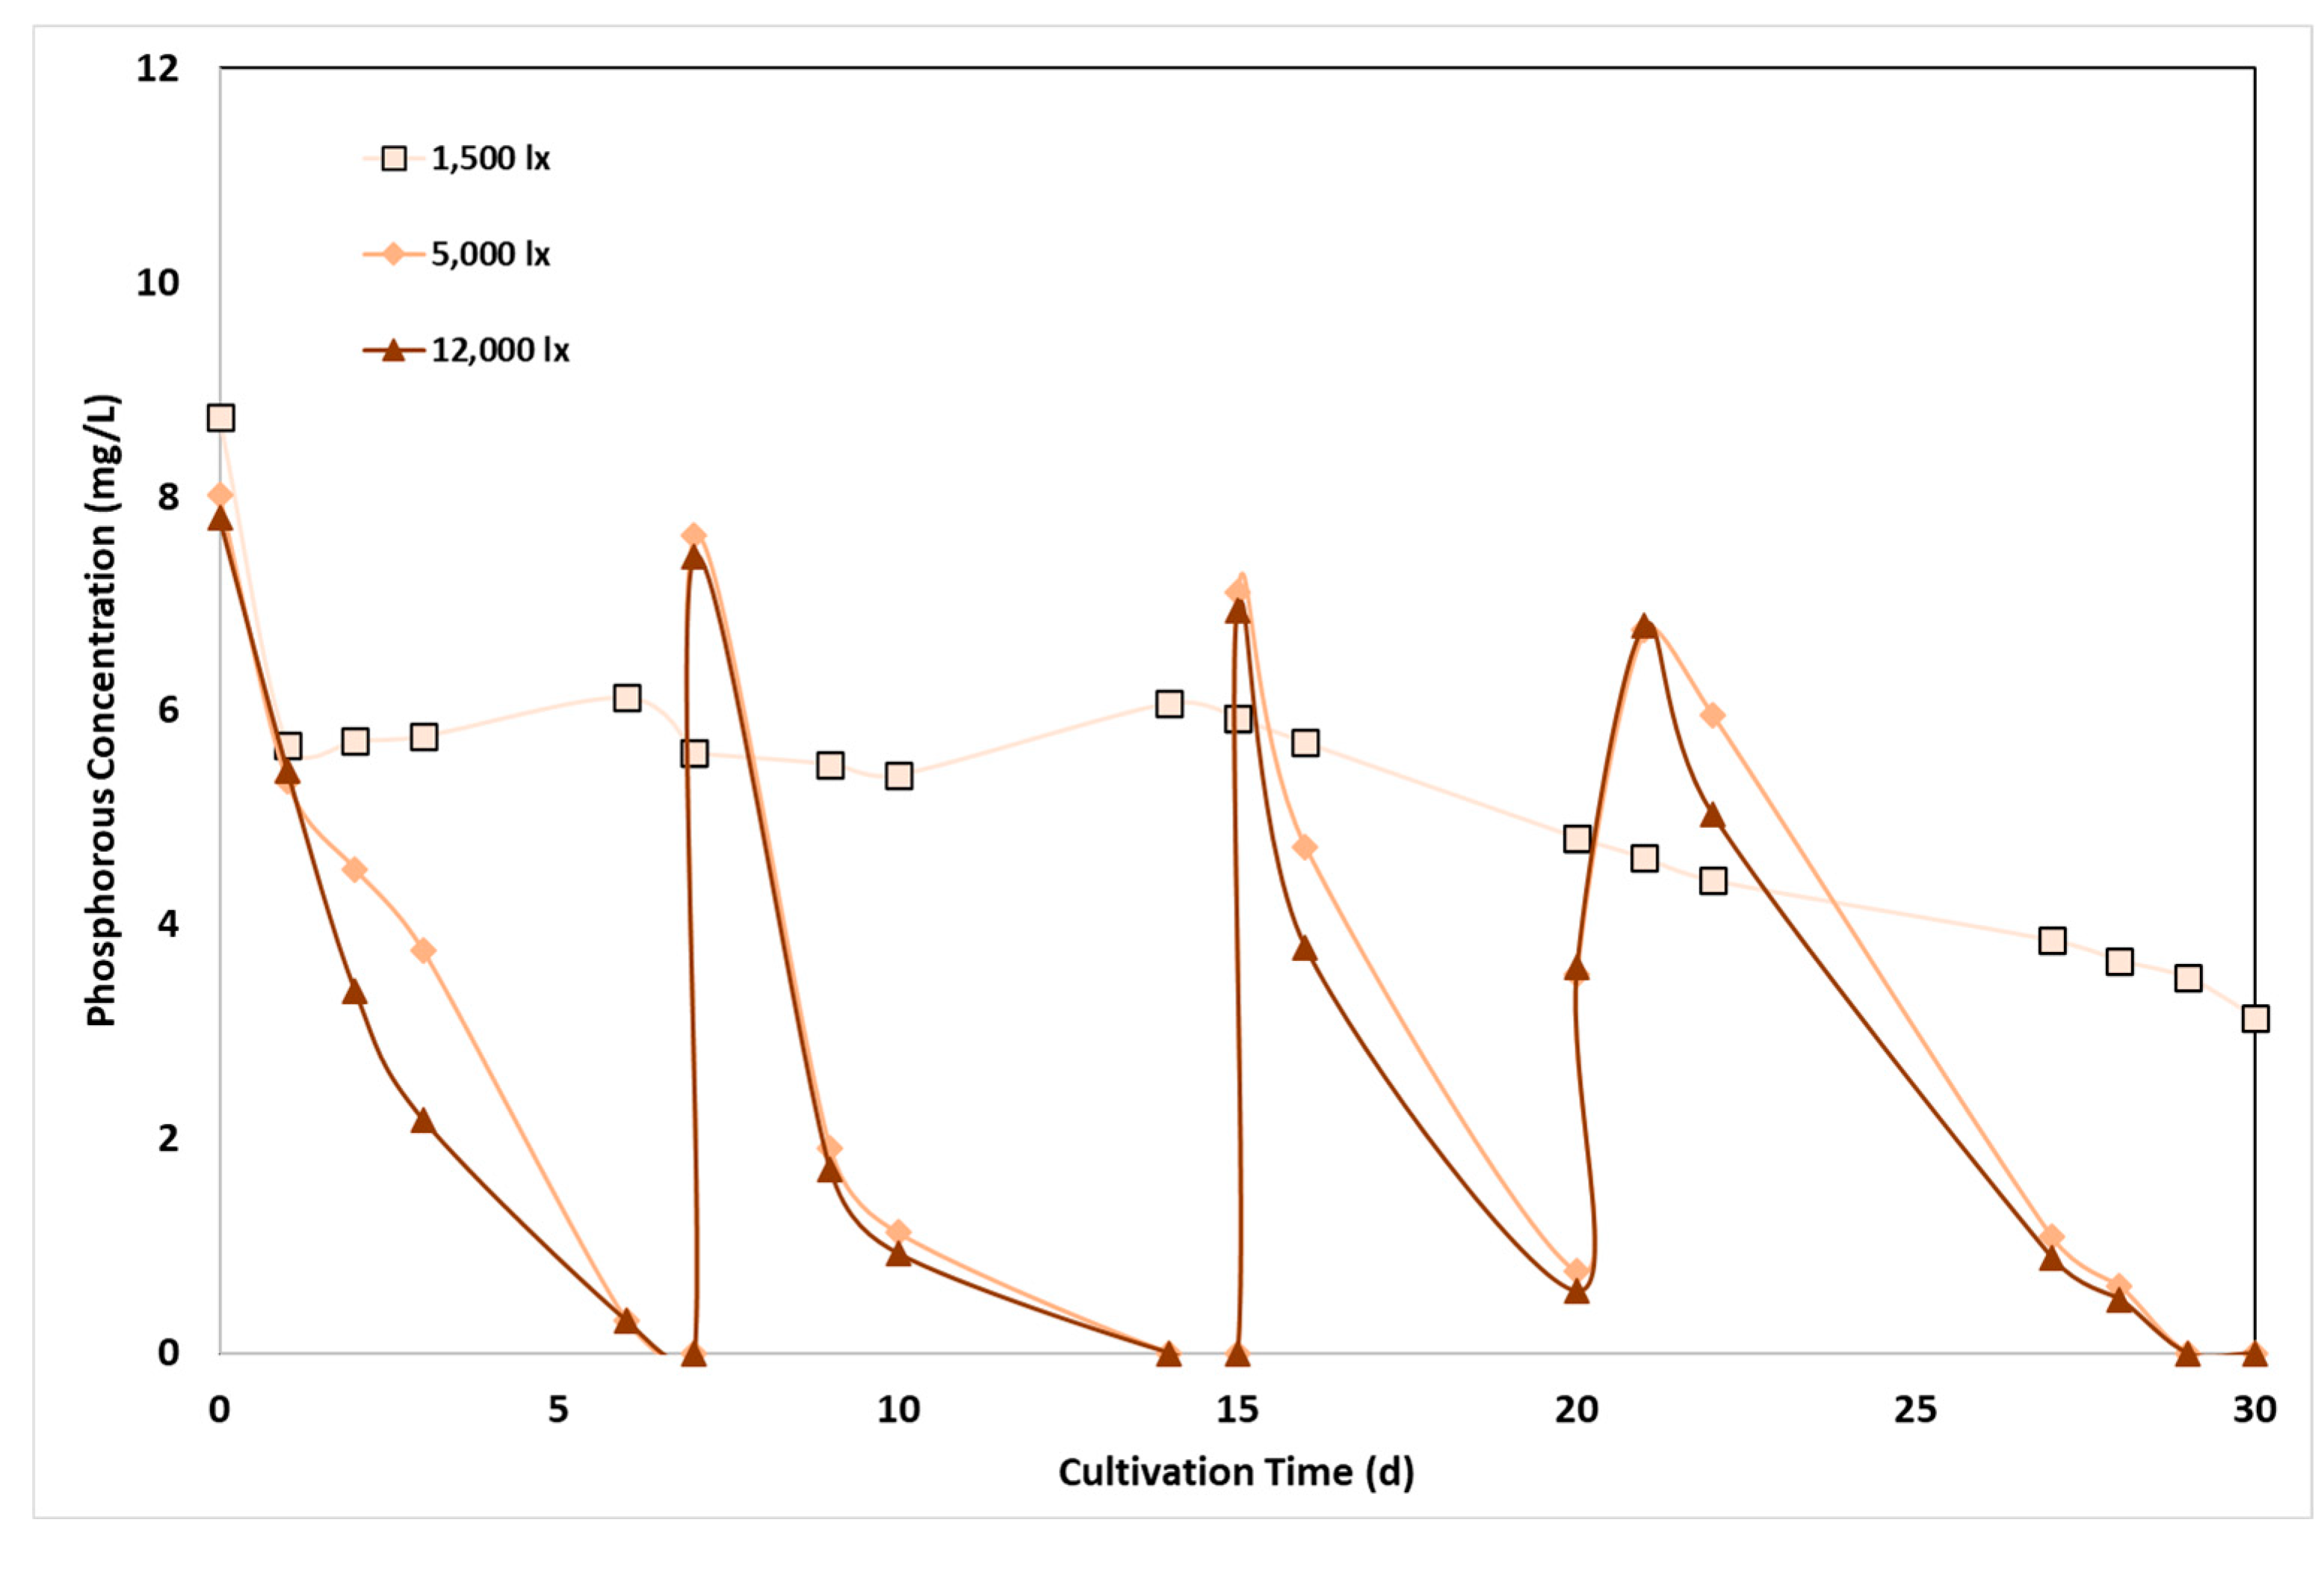
Figure 4.
Effect of light intensity on: (a) N-NH4; and (b) P-PO4 removal per DCW mass as a function of cultivation time and light intensity.
Figure 4.
Effect of light intensity on: (a) N-NH4; and (b) P-PO4 removal per DCW mass as a function of cultivation time and light intensity.
Disclaimer/Publisher’s Note: The statements, opinions and data contained in all publications are solely those of the individual author(s) and contributor(s) and not of MDPI and/or the editor(s). MDPI and/or the editor(s) disclaim responsibility for any injury to people or property resulting from any ideas, methods, instructions or products referred to in the content. |
© 2024 by the authors. Licensee MDPI, Basel, Switzerland. This article is an open access article distributed under the terms and conditions of the Creative Commons Attribution (CC BY) license (http://creativecommons.org/licenses/by/4.0/).
Copyright: This open access article is published under a Creative Commons CC BY 4.0 license, which permit the free download, distribution, and reuse, provided that the author and preprint are cited in any reuse.


