
Submitted:
11 November 2024
Posted:
14 November 2024
You are already at the latest version
Abstract
Vat Photopolymerization (VPP) is an additive manufacturing method that requires the design of photocurable resins to act as feedstock and binder for the printing of parts, both monolithic or composite. The design of a suitable photoresin is costly and time-consuming. The development of one formulation requires the consumption of kilograms of costly materials, weeks of printing and performance testing, as well as the need to have developers with the expertise and knowledge of the materials used, making the development process cost thousands. This paper presents a new characterization methodology for acrylates that allows for the computerization of the photoresin formulation development process, reducing the timescale to less than a week. Okoruwa Maximum Saturation Potential (OMSP) is a methodology that uses Attenuated Total Reflection (ATR-FTIR) to study the functional group of acrylates, assigning numerical outputs to characterize monomers, oligomers and formulations, allowing for more precise distinguishment between materials. It utilizes the principles of Gaussian normal distribution for the storage, recall and computerization of acrylate data and formulation design without the need to database numerous files of spectral data to an average coefficient of determination (R² ) of 0.97. The same characterization method can be used to define the potential reactivity of acrylate formulations without knowing the formulation components, something not possible when using properties such as functionality. This allows for modifications to be made to unknown formulations without prior knowledge of their contents. Validation studies were performed to define the boundaries of the operation of OMSP and assess the methodology’s reliability as a characterization tool. OMSP can confidently detect changes caused by the presence of various acrylates made to the photoresin system and distinguish between acrylates of the same viscosity and functionality. OMSP can compare digitally mixed formulations to physically mixed formulations and provides a high degree of accuracy (R² of 0.9406 to 0.9964), highlighting the future potential for building foundations for artificial intelligence in VPP, the streamlining of photoresin formulation design and transforming the way acrylates are characterized, selected and used.
Keywords:
Vat Photopolymerization
; Acrylates
; binder development
; photoresin
; computerization
; digitalization
; mixing model
; OMSP
1. Introduction
VPP is an additive manufacturing method that produces the highest surface quality and can create intricate designs and complex geometries [1]. VPP requires a photocurable resin that can be cured layer by layer to produce the desired geometry [2]. It is also possible to use VPP to produce composite materials, where solid particles are loaded into the photoresin binder and entrapped in the crosslinked matrix when the binder cures [3]. In many instances, the photocurable resin is developed specifically for the application [4], whilst in other studies, a commercially available resin with minimal knowledge of the properties is used [5]. Some studies have been conducted to develop photocurable photoresins and study the impact of particular resin components on resulting application properties. In a study by Qian et al. [6], a photoresin study was performed to analyze the volume shrinkage and conversion for alumina composite applications using Ethoxylated Pentaerythritol Tetraacrylate (PPTTA), 1,6-Hexanediol Diacrylate (HDDA) and commercial photocurable resin. Real-time Fourier Transform Infrared Spectroscopy (FTIR) was used to measure the conversion of C=C to C-C, and the photoresin was exposed to UV light. This study's concentration of acrylate bonds, resin viscosity, and formulation conversion rates impacted the volume shrinkage. Another study by Ozkan et al. [7] conducted a binder study using an Aliphatic urethane acrylate oligomer and a series of diluents and crosslinking agents. The rheology, cure depth, and mechanical and thermal properties of the formulations were then tested. When testing the impact of increasing oligomer content, there was an observation of high polymerization leading to embrittlement of the part, working against the objective of printing. Once the oligomer amount was optimized, the second stage of the study involved the use of N-Vinyl-2-Pyrrolidone (NVP) and HDDA to drop viscosity and improve molecule mobility for conversion, which was found to be true from the study’s findings. The authors also concluded that a drop in the abundance of high-functionality components has a negative impact on polymerization, an observation made in a number of other studies [8,9,10,11].
Developing and carrying out binder studies is very time-consuming and sometimes expensive to do. In many instances, a variety of acrylates must be obtained and mixed in a number of various quantities. Large enough samples of each binder, often >100g samples for each formulation, must be made to meet the minimum vat tray volume to 3D print test specimens for formulation performance analysis. The analysis stage often requires a number of expensive equipment and expertise to carry out experimentation properly. Performing tests involves the purchase/ subscription of software and standards to ensure that the tests are being carried out and analyzed correctly. Various monomers and oligomers are available for purchase from suppliers and distributors. They come with technical data sheets to allow for more informed decisions to be made for formulation component selection. Characterizing properties often include viscosity, an indicator of diluent properties [12]; loading potential [13] and polymerization potential [7]; Acid value, molecular weight, an indicator of the complexity and size of each molecule [14]; Transition glass temperature, which shows the temperature application potential of material [15]; and lastly, functionality which shows the number of acrylates on the molecule of interest. Functionality is a useful parameter, showing the crosslinking potential and, to some degree, the mechanical properties that can be achieved when a particular monomer or oligomer is added to a formulation [16]. However, this value does not factor in key unique characteristics in each molecule that significantly contribute to their performance, allowing for minimal differentiation between molecules with the same functionality.
Additionally, when it comes to oligomers and bespoke reactive diluents, many photoresin manufacturers do not disclose other characteristics, such as molecular weight, as a way to protect their stoichiometric designs. Therefore, some assessments vital to oligomer suitability for a formulation cannot be made. Such as determining whether an oligomer has a high viscosity due to high-density intermolecular forces developing due to additional polar functional groups that can lead to higher mechanical properties when used in a photoresin formulation or whether the high functionality is due to the bulkiness of the branching chains of the carbon backbone. There is currently no unique data characteristic that can provide such information.
Attenuated Total Reflection (ATR) is an analytical tool looking into compounds' bond vibrations [17]. It is used as a tool to identify functional groups and characterize materials. The energy state of the functional group being analyzed is influenced by the bond type, its vibration type, and the atoms' being covalently bonded to each other. The functional group will absorb a specific wavelength of light within the infrared spectrum, allowing it to reach an energized state. This wavenumber that it absorbs is where the peak appears on the ATR spectrum [18]. The convenience of ATR is that there is no need for special sample preparation methods for traditional methods of FTIR [19]. The peak at 810 cm-1 is used to identify the alkene bond situated on an acrylate. It has been used in the literature previously to obtain information on the reaction behavior of photoresins [20,21].
In this study, a code was developed to analyze the peak found at 810 cm-1 directly from the output data of an ATR instrument. The outputs were designed to assign a set of characteristics that were believed to be more informative than functionality. While functionality is limited to acrylate monomers and oligomers, the developed characterization methodology and outputs can also be applied to acrylate formulation, providing further differentiation between similar acrylate molecules and place as a tool to aid the streamlining of binder formulation studies without photoresin developers having to divulge sensitive information about their bespoke acrylates. In this study, the bounds of operation for this code were determined, and a series of validation tests were performed to assess and present the potential of this new tool. Along with the code outputs, rheology, tensile properties, cure depth/thickness, polymerization conversion and hardness were measured and reported for green body specimens.
2. Materials and Methods
Photoresin formulations were created using acrylate materials Table 1. The formulations created can be seen in Table 10. The formulation components were mixed in a DAC 150FVZ-K speed mixer (Hauschild, Hamm, Germany) at 2000 rpm for 5 minutes. In formulations intended for curing, Phenylbis(2,4,6-trimethyl benzoyl)phosphine oxide (BAPO) photoinitiator (Rahn AG, Zurich) was added to the speedmixed acrylate formulation and sonicated in a Clifton SW6H sonicator (Nickel-Electro, Weston-super-Mare, UK) for 30 minutes to encourage the dissolution of the photoinitiator [22]. Following this, the photoresin was speed mixed at 2000 rpm for an additional 5 minutes to ensure the homogenous distribution of the dissolved photoinitiator. The formulations were placed in a Photocentric Cure L2, using the convection oven functionality to set the photoresin temperature to 25 ˚C.

Table 1.
Table Of (Meth) Acrylates Used In This Study.
| Material Sourced From Rahn | Identifier | Functionality | Viscosity (mPa.s) |
Molecular weight (g/mol) |
|---|---|---|---|---|
| Dipentaerythritol Hexaacrylate | DPHA | 6 | 7000 | 578 |
| Trimethylolpropane triacrylate | TMPTA | 3 | 110 | 296 |
| Trimethylolpropane trimethacrylate | TMPTMA | 3 | 55 | 338 |
| Aliphatic Urethane Acrylate | G-4259 | 2 | 11000 | - |
| Aliphatic Urethane Acrylate | G-4293 | 2 | 25000 | - |
| Amine Acrylate | G-5271 | 2 | 1200 | - |
| Epoxy Acrylate | G-2263 | 2 | 30000 | - |
| Aliphatic Urethane Methacrylate | Primary | 2 | 10000 | - |
| Dipropylene Glycol Diacrylate | DPGDA | 2 | 15 | 242 |
| 1,6-Hexanediol diacrylate | HDDA | 2 | 10 | 226 |
| Neopentyl Glycol Propoxylate Diacrylate | NPG(PO)2DA | 2 | 15 | 328 |
| Polyethylene Glycol(200) Diacrylate | PEG(200)DA | 2 | 25 | 308 |
| Polyethylene Glycol(300) Diacrylate | PEG(300)DA | 2 | 50 | 408 |
| Isobornyl Methacrylate | IBOMA | 1 | 8 | 222 |
| Isobornyl acrylate | IBOA | 1 | 8 | 208 |
| 4-Acryloylmorpholine | ACMO | 1 | 12 | 141 |
| Cyclic Trimethylolpropane Formal Acrylate | CTFA | 1 | 15 | 200 |
Rheology
Rheology studies were performed on the formulations of photoresins and slurries. The viscosity of samples was measured on a Brookfield RST-CPS-P rheometer (Ametek, Braunstone Town, UK). Approximately 0.2 g of photoresin was deposited on the plate of the rheometer, and the rheology study was performed at 25 ˚C at a constant shear rate of 800 s-1. The viscosity was averaged across 120 data points. For slurries, the tests were also run at 25 ˚C, but the shear rate was increased from stationary to 200 s-1, collecting 60 data points for the upwards shear and downwards shear behavior for the suspension.
Ultraviolet Light (UV) Exposure
An Anycubic photon mono 4K printer (Shenzhen, China) was used to carry out UV exposure-related operations. Cure disks of 10 mm diameter and 100 µm thickness were designed using computer-aided design (CAD) software. Each formulation was poured into a vat tray and exposed to 4,000 μw/cm2 of 405 nm UV energy for 10 seconds. The disks were removed from the vat tray's base and cleaned with Isopropyl Alcohol (IPA). A micrometer was used to measure the cure thickness. The same methodology was used to prepare cure disks for ATR-FTIR to measure the polymerization conversion.
Mechanical Testing
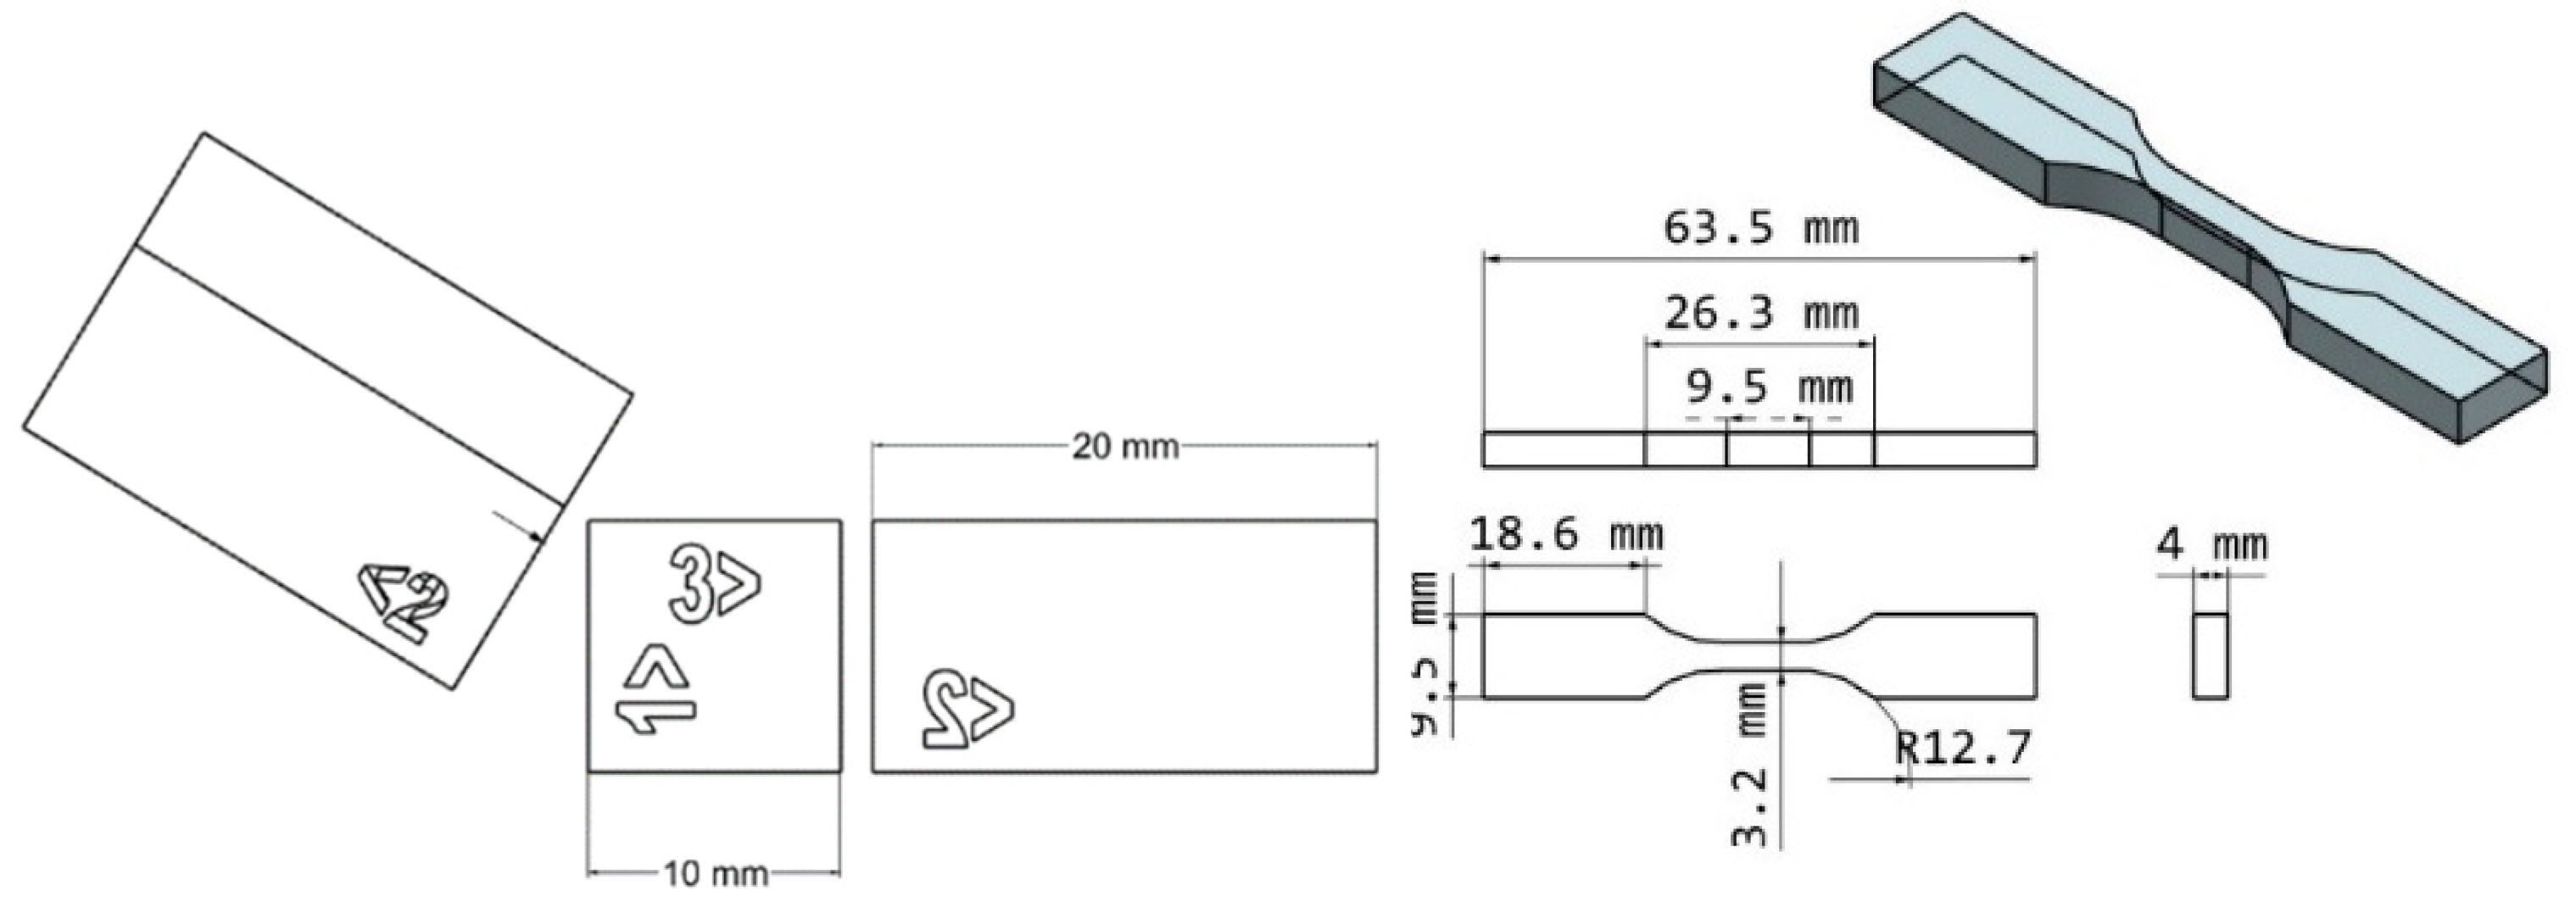
ASTM D638 Type V dogbones were printed for tensile testing [23], and a Multitest- dV(u) (Mechmesin, West Sussex, UK) was used to perform tensile tests at 1 mm/min in line with ASTM D638 instruction [23]. Shore D hardness testing was performed on specimens following dimension guidelines in ASTM D2240 [24]. An average of the center point measurements were taken from seven samples.
Figure 1.
Geometry of test specimens. Left, hardness bars; Right, type V tensile bars.
ATR- FTIR
A Bruker Alpha Platinum-ATR (Bruker, MA, USA) was used to perform ATR-FTIR analysis on uncured and cured samples of photoresin with 40 scans at a resolution of 2 cm-1. Before the testing commenced, the ATR crystal was cleaned with IPA and allowed to dry fully. A background measurement of the atmosphere was taken to minimize the corruption of results. Once the background test was completed, <50mg samples (1 drop) of material were deposited onto the surface of the ATR crystal for uncured samples. For cured samples, the cured disk was placed on the surface of the ATR crystal using cleaned tweezers to prevent sample contamination. The anvil was then lowered unto the red interactor and centered in its window, indicating ideal sample contact with the crystal. The test was run on OPUS, allowing for the preview of the ATR-FTIR spectrum. This preview was then used to assess the level of noise and anticipate the quality of the test. When the quality was visually ideal for analysis, the ATR-FTIR run was commenced, and the test was conducted without interference.
For conversion () calculations, the peak area (A) of the C=C (alkene stretching) appearing at 1635 cm-1 on the spectrum was compared before (U) and after (P) exposure to UV light. The carbonyl vibration appearing at 1720 cm-1 was used as a baseline to account for variations in sample size [25].
OMSP Code Development
The code was designed to allow the upload of multiple files in a single run in the file formats of .dpt, .xls, .xlsx, and .txt. The alkene 810 cm-1 and the carbonyl 1720 cm-1 peaks are then identified. Independent linear baseline subtractions are performed for both peaks, and then Gaussian, Lorentzian, and Linear Combination Pseudo Voigt methods [26] are run on the peak to find the best fit. The best fit for each peak was determined using the Alkaline Information Criterion (AIC) [27] and Root Mean Square Error (RMSE) [28,29], with AIC being the main deciding parameter for the best fit type. Peak integration was then used to find the areas under the peaks. Peak normalization was performed using the carbonyl peak to correct the peak data, accounting for variations in sample size and intensities that may skew the results [30].
The table below shows the output when the OMSP code is run for individual acrylates and formulations.
Table 2.
Defined OMSP Code Outputs.
| Parameter | Definition |
|---|---|
| File Name | The same name given to the imported file is stored and displayed to assign results to a specific dataset. |
| Fit Type | Displays whether Gaussian, Lorentzian, or Linear Combination Pseudo Voigt's method was found to be the best fit. |
| AIC | The Alkaline Information Criterion output for the selected fit type. A larger negative number indicates a better fit. |
| RMSE | The Root Mean Square Error is determined for the selected fit type. The smaller the value, the better the fit. |
| Peak Position | Shows where the sample’s maximum amplitude is located on the spectrum. This can indicate the reactivity of the sample. A higher degree of red spectral shift is an indication of increased reactivity due to changes in the molecular structure/ intermolecular forces influencing the energy level of the alkene bond of interest. |
| OMSP Area | The normalized peak area of the sample indicates the density of alkene bonds in a particular sample. |
| Pseudo Functionality | A functionality that is given to photoresin formulations based on their peak position despite being a multifunctionality mixture. |
| ΨOMSP Area | The peak area is determined by using the pseudo functionality home position to calculate the density of alkene bonds in a sample available for photopolymerization. |
| Aspect Ratio | An insightful parameter that displays information on whether the OMSP output is of a tall or narrow shape, indicating many acrylates in the system vibrating at the same energy level or a shorter, broader peak, suggesting that there is a wide spread of acrylates. |
For the development of the code for individual acrylate formulations, a “home” wavenumber was determined through the assessment of the simplest molecular form of different functionality acrylates. The area of the alkene peaks was corrected and limited to the density of alkene bonds that absorb wavenumbers equal to or greater than the home for the functionality it belongs. This adjusted area was then normalized with the C=O peak to provide an acrylate OMSP value.
3. Results and Discussion
Boundaries Of Operation For OMSP.
The first stage of the study was to establish the operational boundaries of OMSP. Given that ATR-FTIR was used for analysis, focusing on a specific peak, the compatibility of this method with the broad range of reactive materials used for VPP needed to be established before its uses and benefits could be clearly defined.
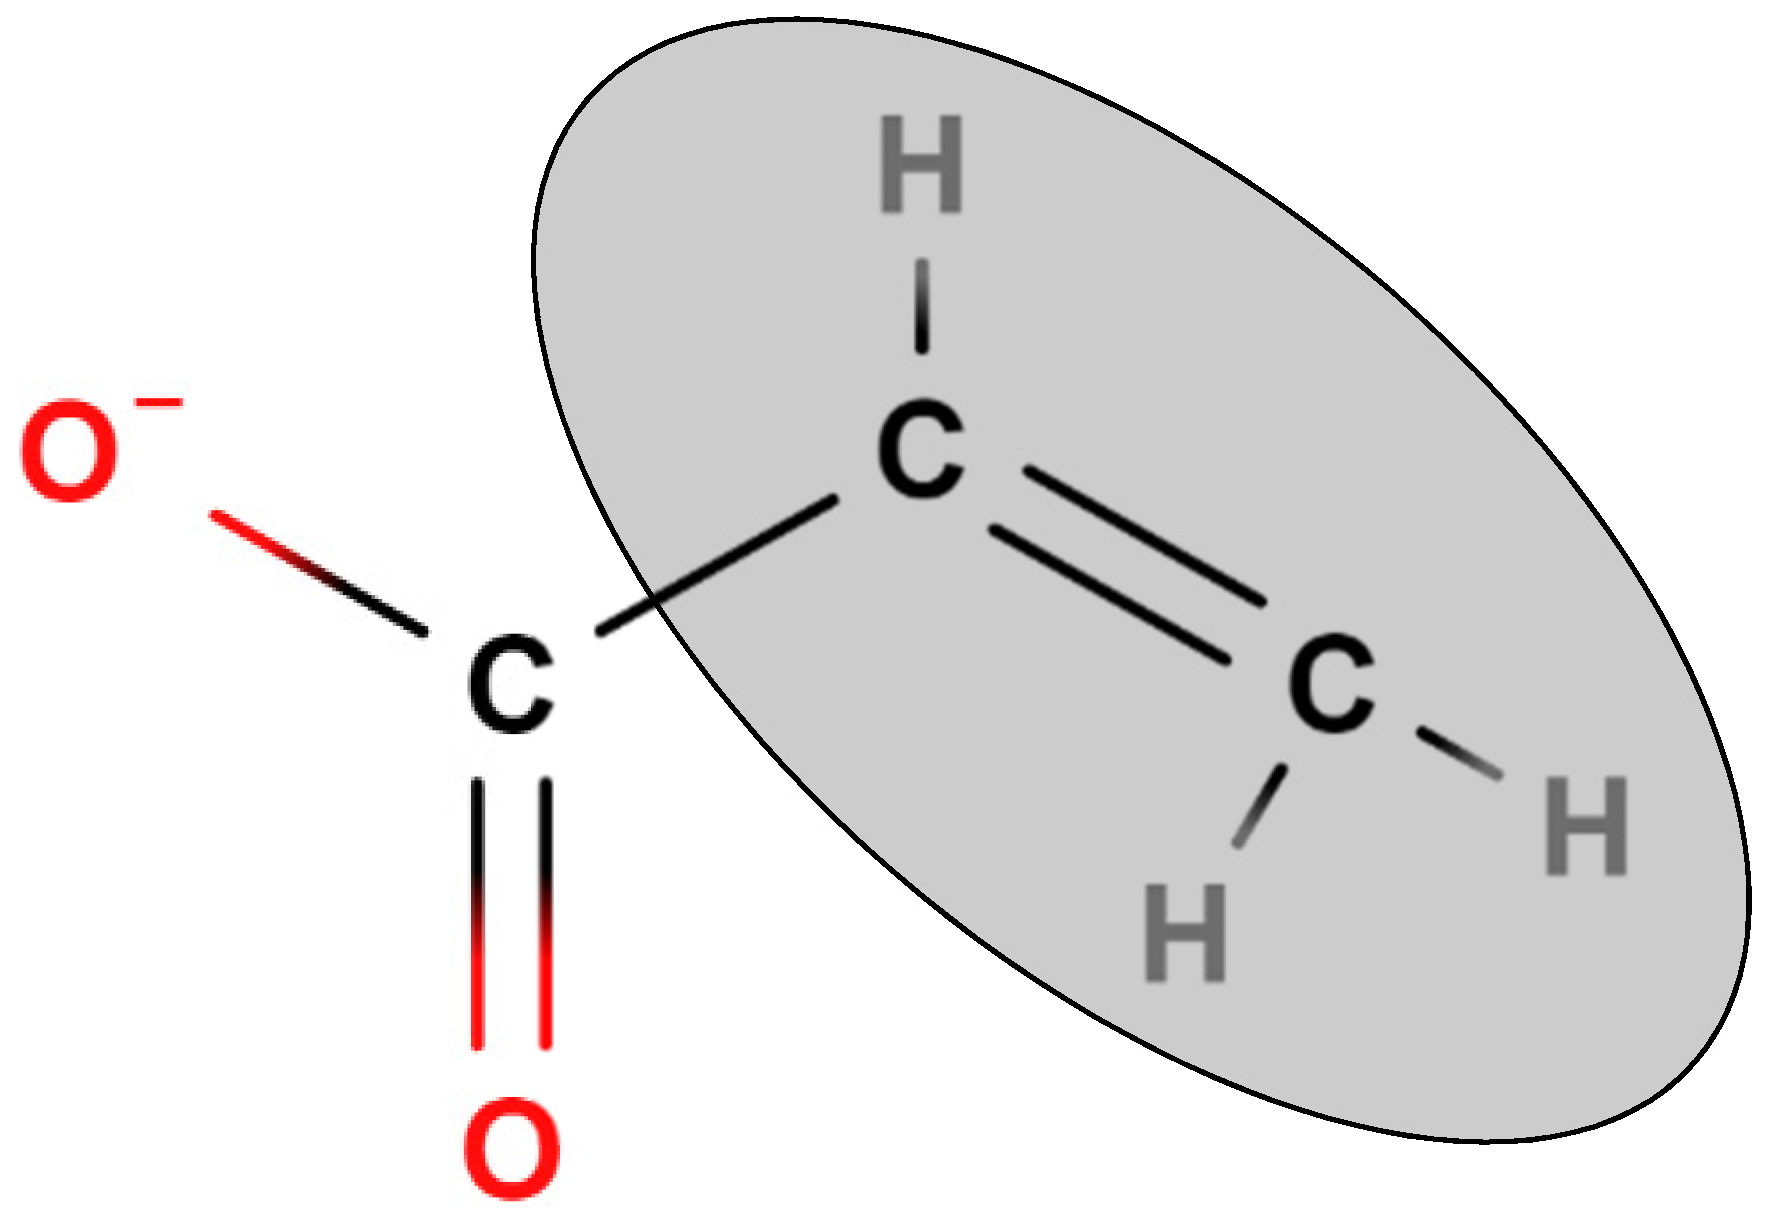
The 810 cm-1 peak is specific to the bending out-of-plane vibration of the vinyl groups situated adjacent to the double bond of an acrylate functional group Figure 2. This peak can be found in the unique fingerprint region of ATR-FTIR spectral data [31], meaning it can be easily influenced by surrounding electron density from nearby functional groups such as α-methyl groups on methacrylates. As a result, the modified acrylates, such as methacrylates and other non-acrylate photopolymerizable materials, vibrate at a different wavenumber to a standard acrylate, creating their own OMSP scales. As a result, when methacrylates are included in OMSP characterization alongside acrylates, the materials appear more reactive than they truly are, providing a false OMSP result (Figure 3). Photopolymerizable non-acrylate materials such as NVP appear as voids as they are not acrylates that vibrate in the spectral point OMSP uses.
However, when OMSP is used for acrylate materials, OMSP is able to distinguish between acrylate materials with high accuracy, which is not possible with the use of functionality and viscosity, meaning they would have to have been physically tested to distinguish their differences in the absence of OMSP. The outputs obtained for the distinguishment made between similar monomers agreed with mechanical results and degree of cure results. Additionally, the outputs of OMSP were able to be used to create a database of acrylates, allowing for formulations to be mixed computationally and showed high similarity to the result of physically mixed systems with an average R2 of 0.9685, showing the precise accuracy of OMSP and the potential for OMSP to be used to streamline the photoresin design process and reduce the need to acquiring numerous acrylates to mix and test numerous formulation.
Figure 2.
Displayed Formula of An Acrylate Functional Group, Highlighting the Bond Used To Characterize Acrylates In OMSP
Figure 2.
Displayed Formula of An Acrylate Functional Group, Highlighting the Bond Used To Characterize Acrylates In OMSP
Determination Of Functionality Home.
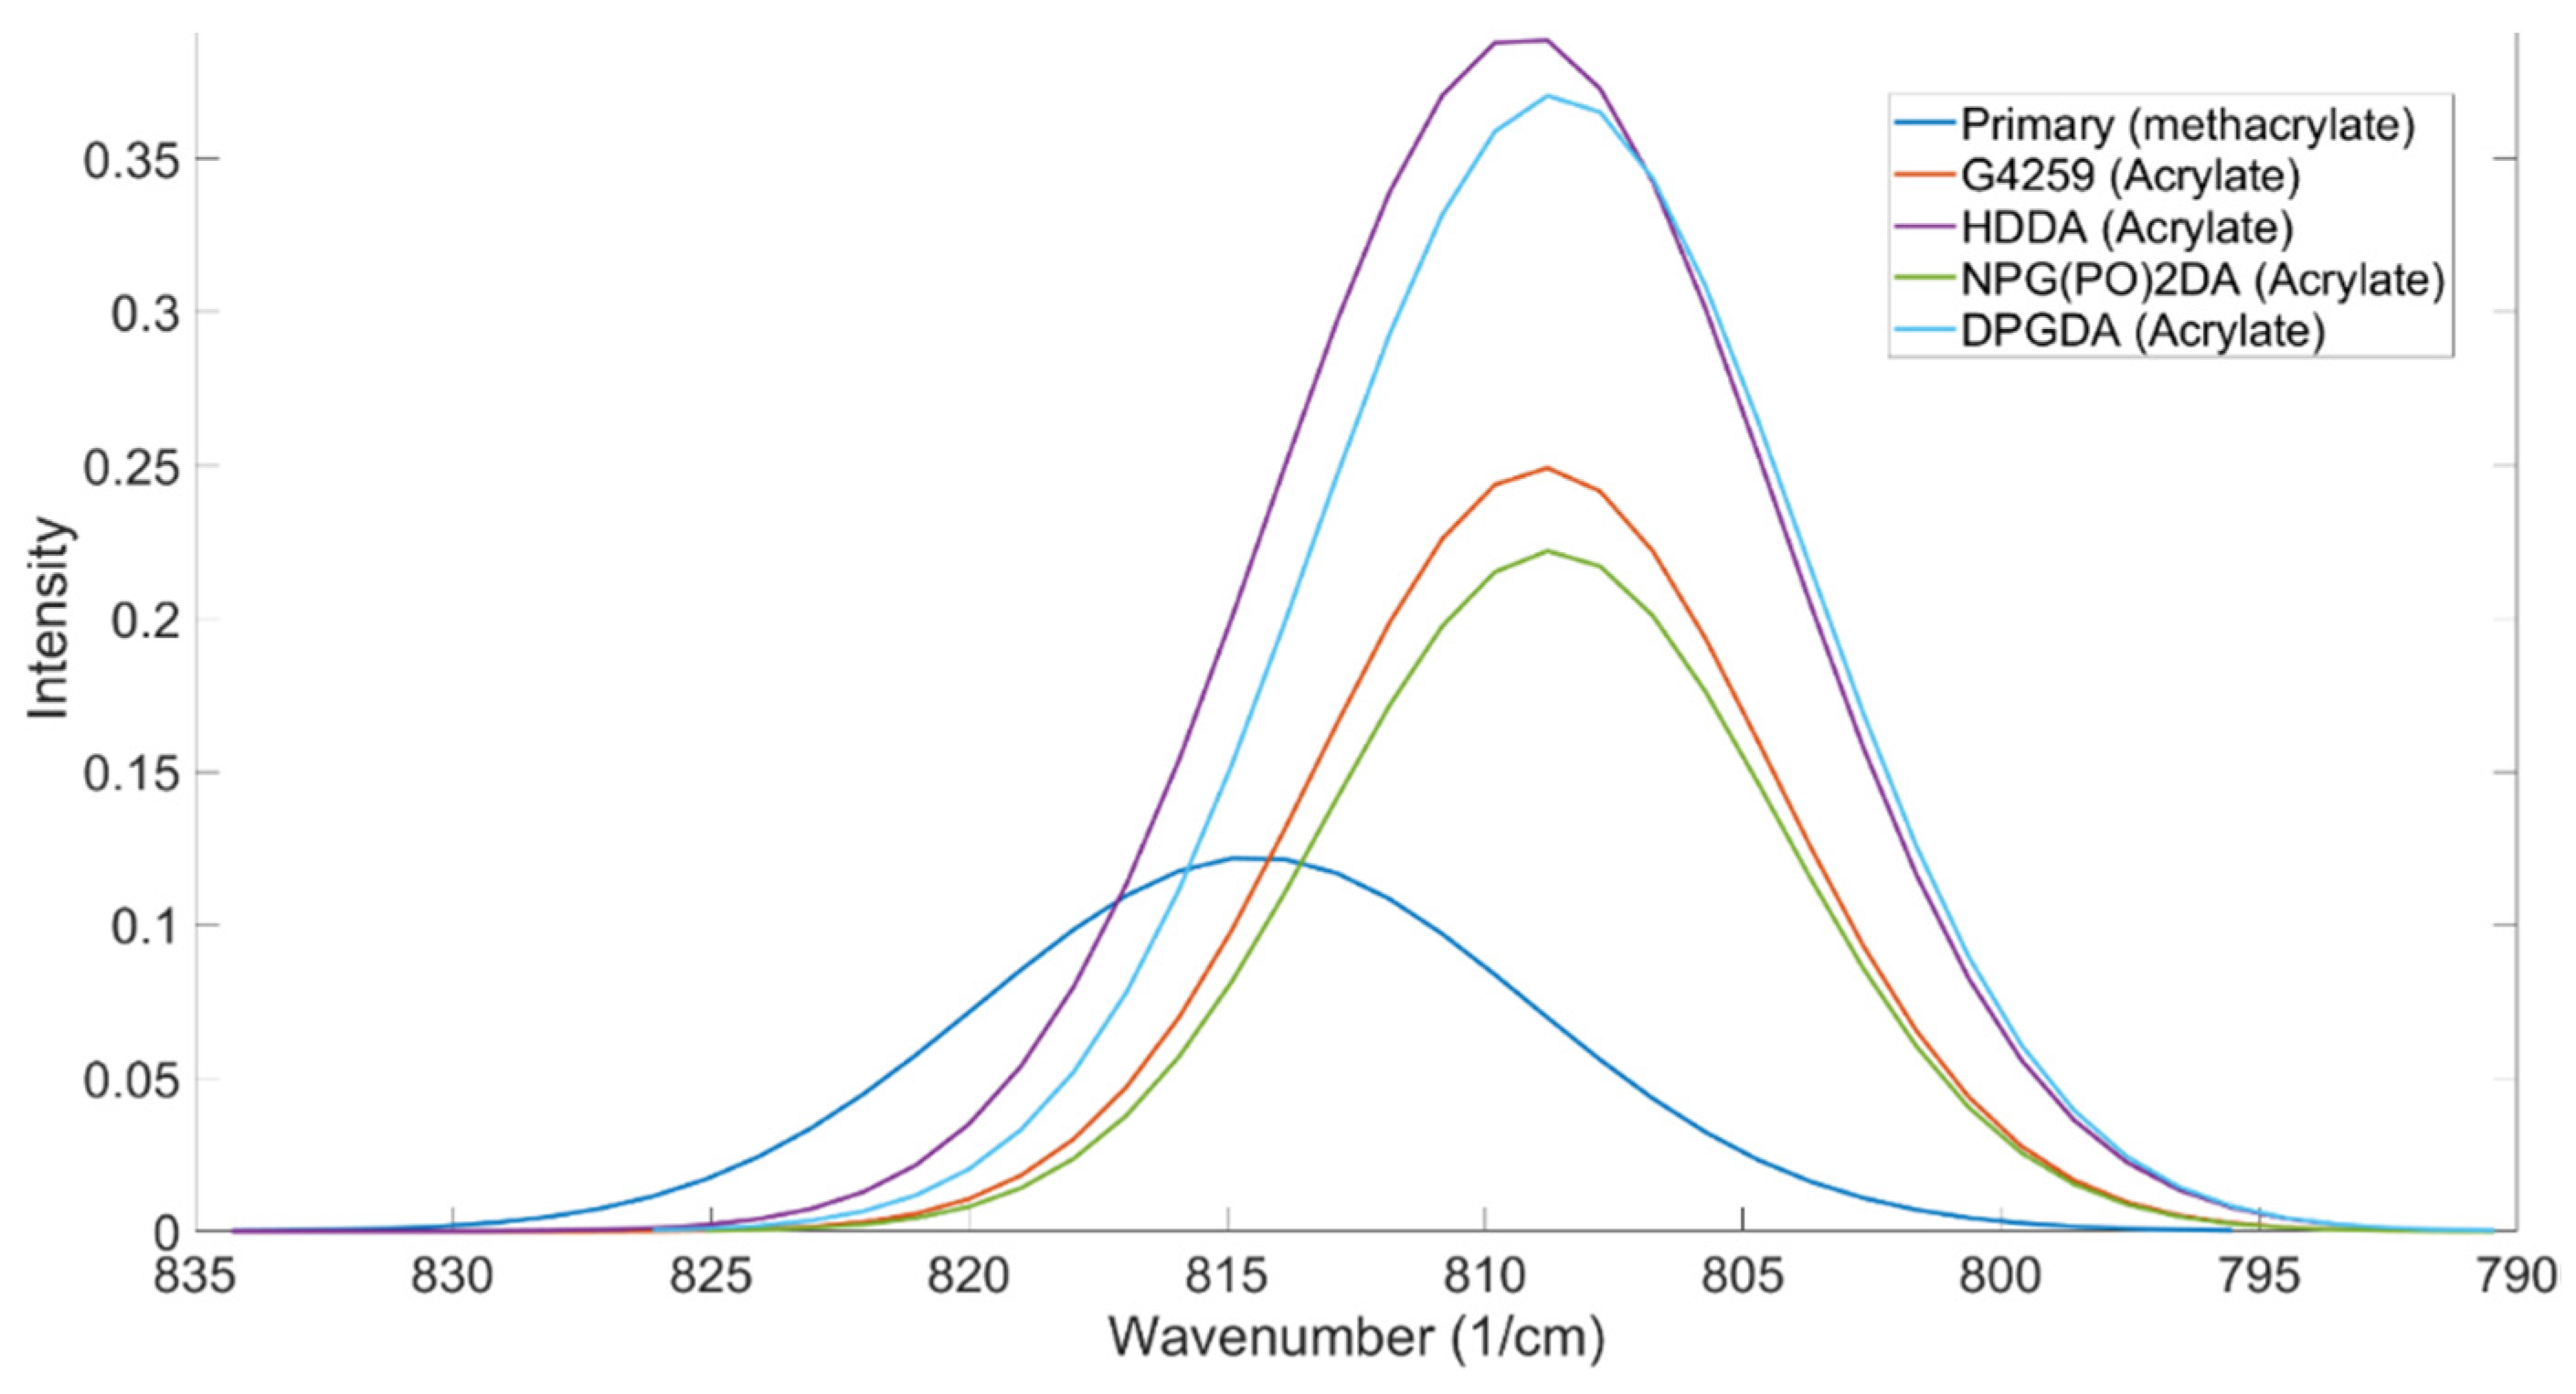
A series of difunctional acrylates were tested to observe where their peak positions resided (Figure 3). With the same functionality and additional branching groups on the carbon backbone, it was expected to see little to no spectral shift, confirming a key parameter in this method: functionality home. For the oligomers included in this test (G-4259 and Primary), any change in the peak position was to be an indication of additional functional groups in close proximity to the acrylate alkene, influencing the energy state of the alkene bond, altering its reactivity [32]. As seen from the results, each of the difunctional reactive diluents peaked at the same wavenumber as well as G-4259, making 808.789 cm-1 the home wavenumber for difunctional acrylates. However, the oligomer, Primary, experienced a spectral shift from the home position of 808.789 cm-1 to 814.908 cm-1, suggesting Primary to be a more reactive oligomer; however, this is not the case as Primary is a methacrylate.
In other studies using ATR-FTIR to assess various chemical mixtures, authors have found intermolecular forces to influence their systems in certain mix ratios, leading to peaks shifting to a higher wavenumber [33].
Figure 3.
OMSP Output For A Selection Of Difunctional Oligomers And Monomers
The findings of this led to the addition of “Functionality Home” to the analysis method of OMSP, the foundation to the analysis of formulation and the assignment of “pseudo functionality” to mixtures of acrylate material, which was not previously possible. Functionality Home takes the simplest structure of each functionality acrylate and uses it as a benchmark of the expected reactivity of that functionality. For instance, HDDA was taken as the functionality home molecule for difunctional acrylates as it has no stereoregularity or additional functional groups that could alter the reactive state of the acrylate group’s alkene bond. Additionally, the two functional groups of HDDA are situated on the extremities of the chain, assuming to have minimal influence on either acrylate group.
Figure 4.
Displayed Diagram Of HDDA.
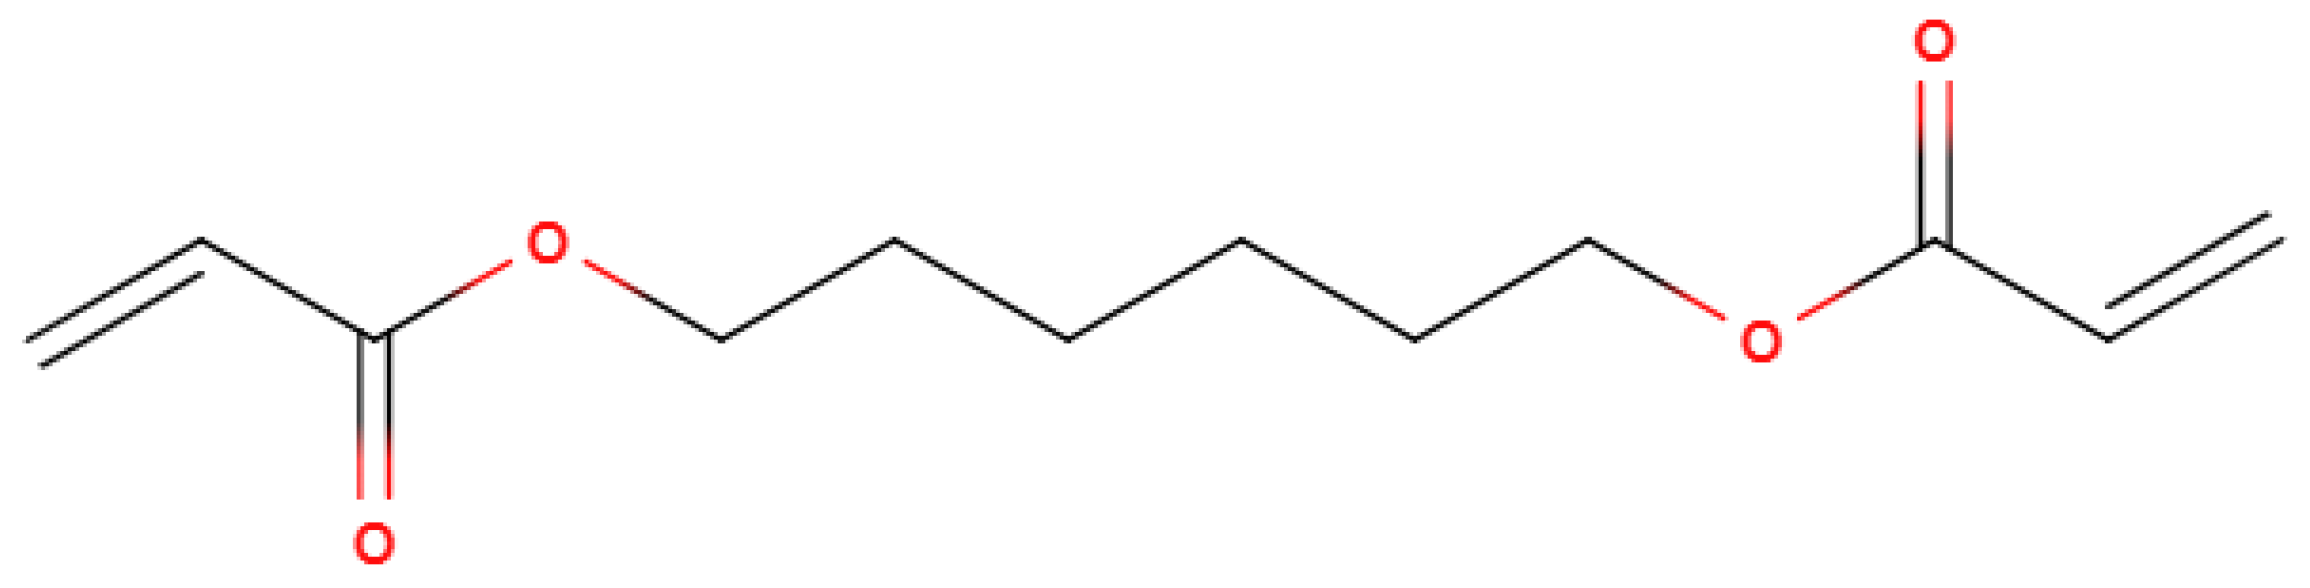
Table 3 shows the molecules selected as the functionality home for each functionality. Pentaerythritol Tetraacrylate and Dipentaerythritol Pentaacrylate were unavailable for physical testing, and therefore, interpolation was used to determine their peak positions.
Table 3.
Acrylate Molecules Selected To Represent The Eman Energy State For Each Functionality Acrylate.
Table 3.
Acrylate Molecules Selected To Represent The Eman Energy State For Each Functionality Acrylate.
| Functionality | Chemical Name | Displayed structure |
|---|---|---|
| 1 | Iso-Decyl acrylate (IDA) |
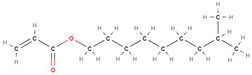 |
| 2 | 1,6-Hexanediol Diacrylate (HDDA) |
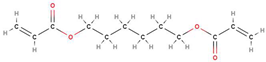 |
| 3 | Trimethylolpropane Triacrylate (TMPTA) | 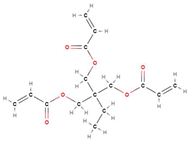 |
| 4 |
Pentaerythritol Tetraacrylate (PETA) |
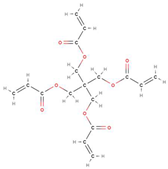 |
| 5 | Dipentaerythritol Pentaacrylate (DPPA) |
 |
| 6 | Dipentaerythritol Hexaacrylate (DPHA) |
 |
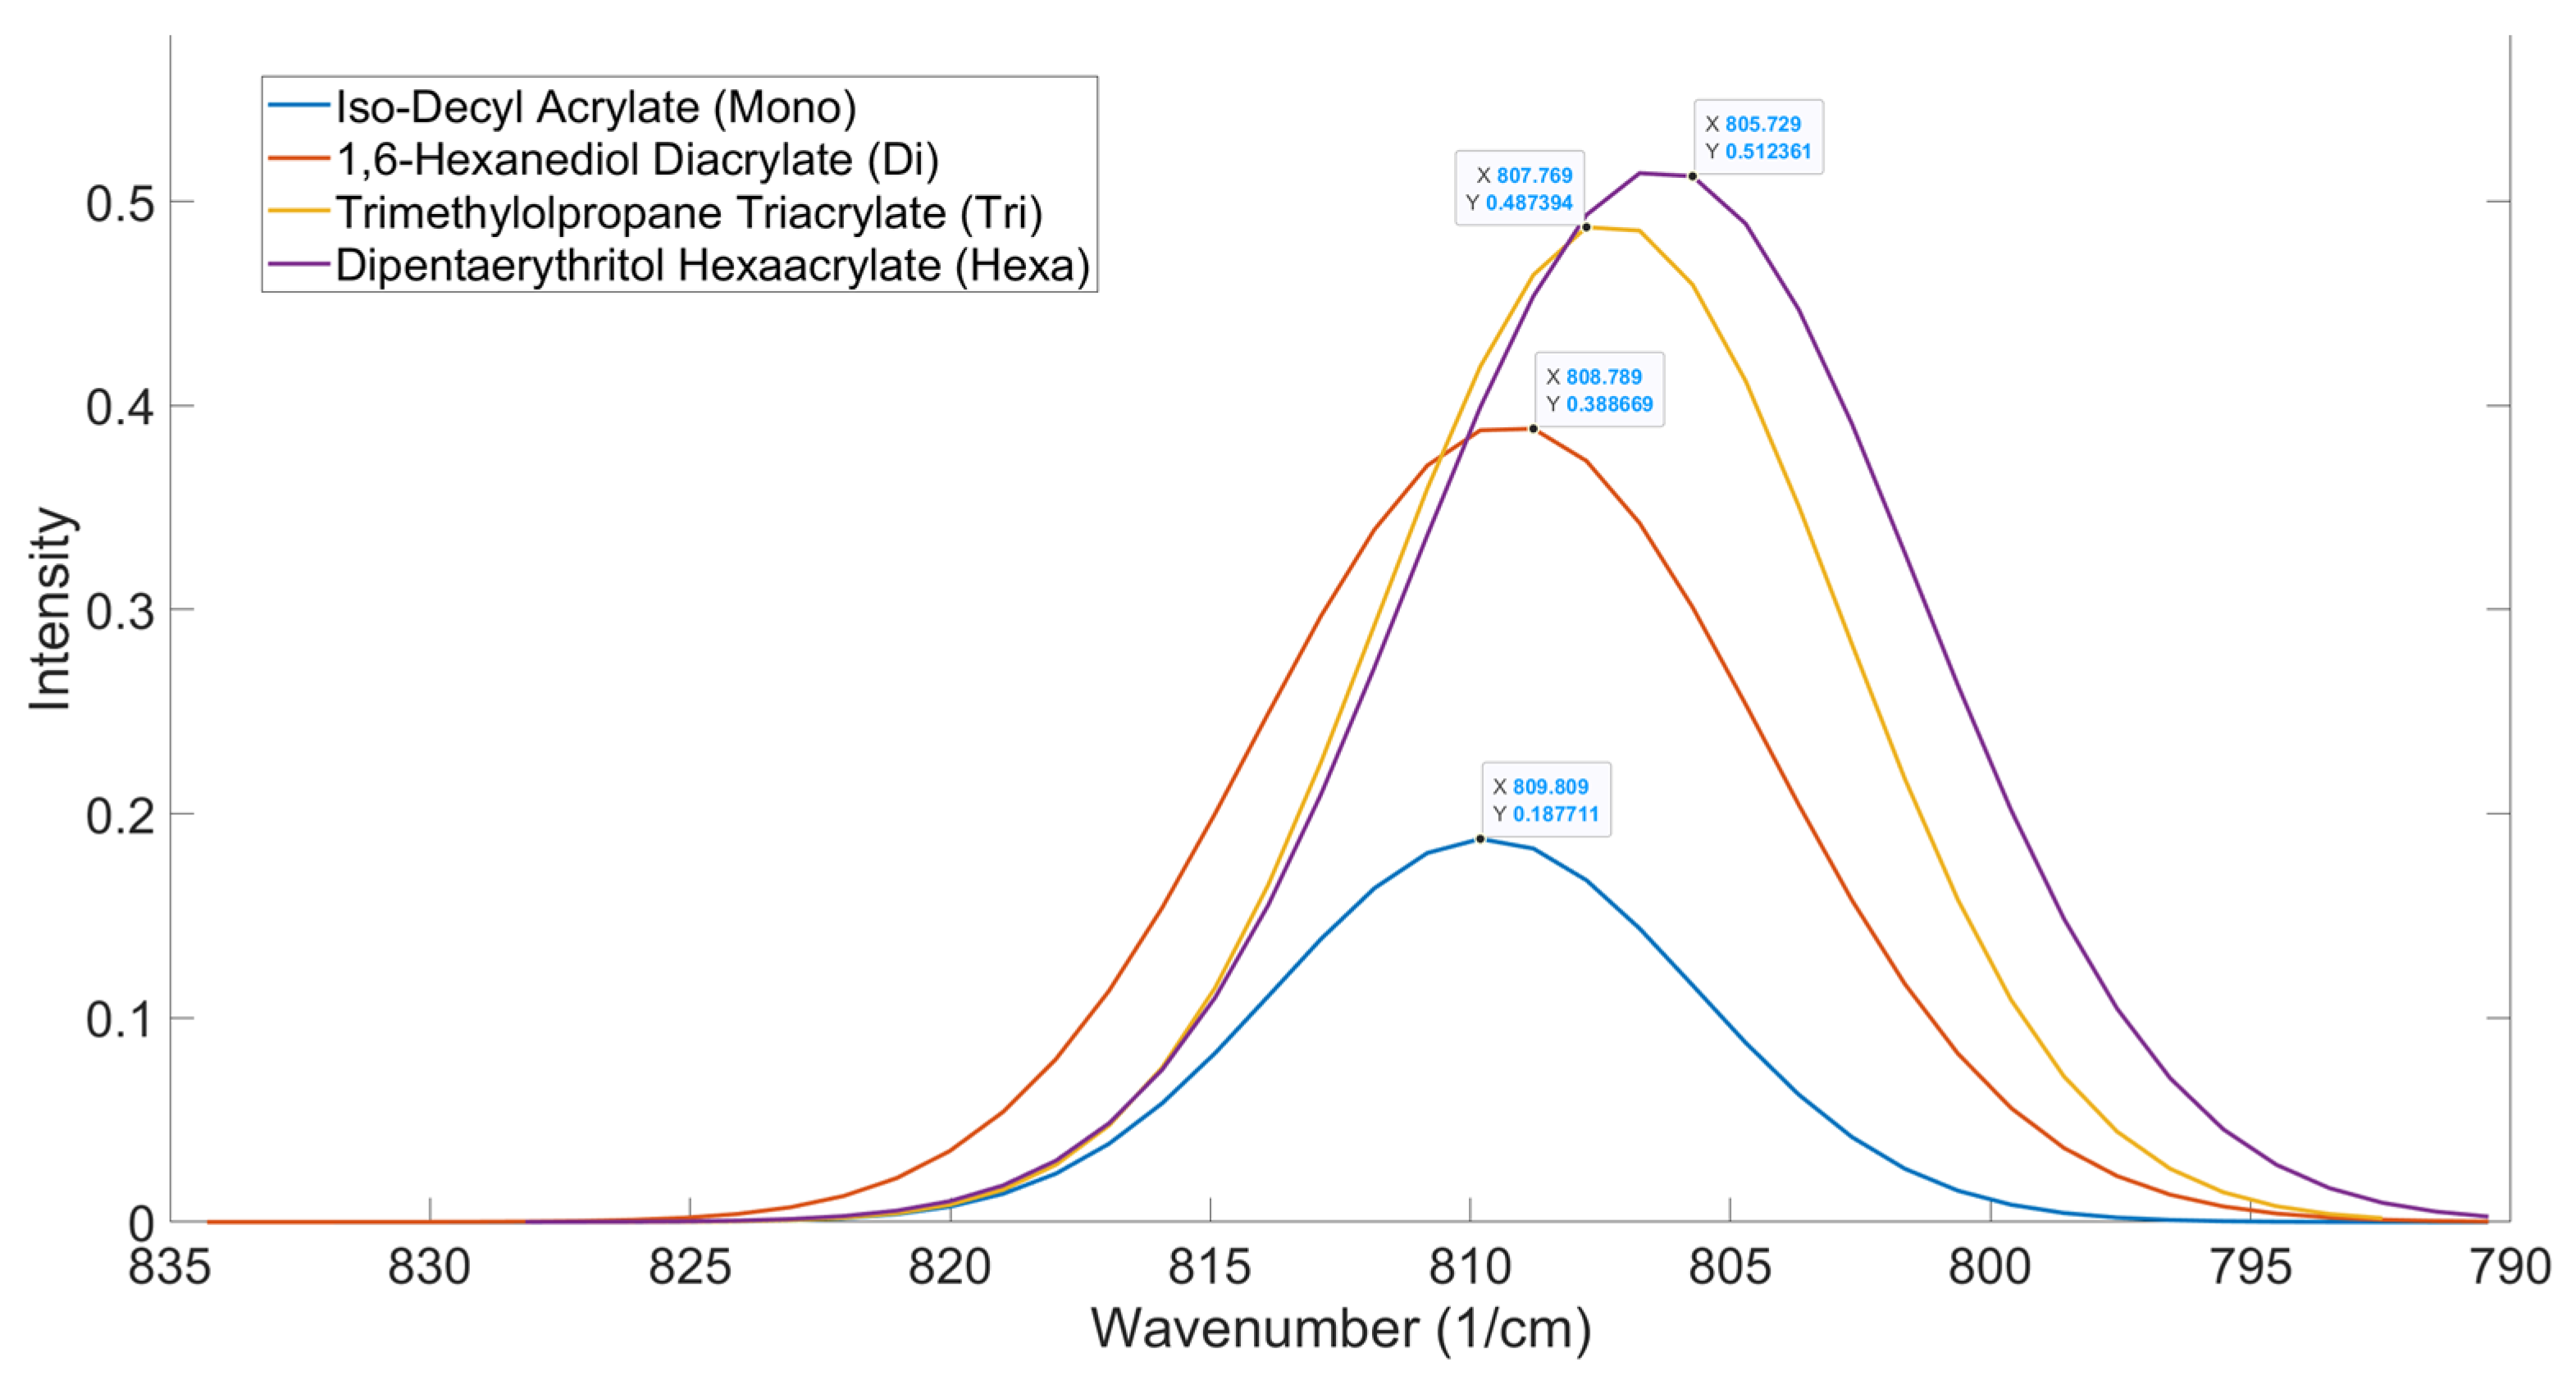
When the peak positions of each functionality home were plotted on an axis, the trend seen in Figure 5 was expected. There is a steady decrease in the reactive state of the acrylate as the functionality increases, fitting a second-order polynomial fit. The significance of this finding is that it completely changes the way in which reactivity is described in photopolymerization and additionally allows for any acrylate mixture to be assessed on its overall reactive state and linked to proximity to a functionality home, pseudo functionality, regardless of whether there are additives such as dispersants of solid fillers.
Figure 5.
Output Peak Positions And Interpolated Positions For Tetra And Penta Functional Acrylates Based On The Code Using The Original Curve Identification Method
Figure 5.
Output Peak Positions And Interpolated Positions For Tetra And Penta Functional Acrylates Based On The Code Using The Original Curve Identification Method
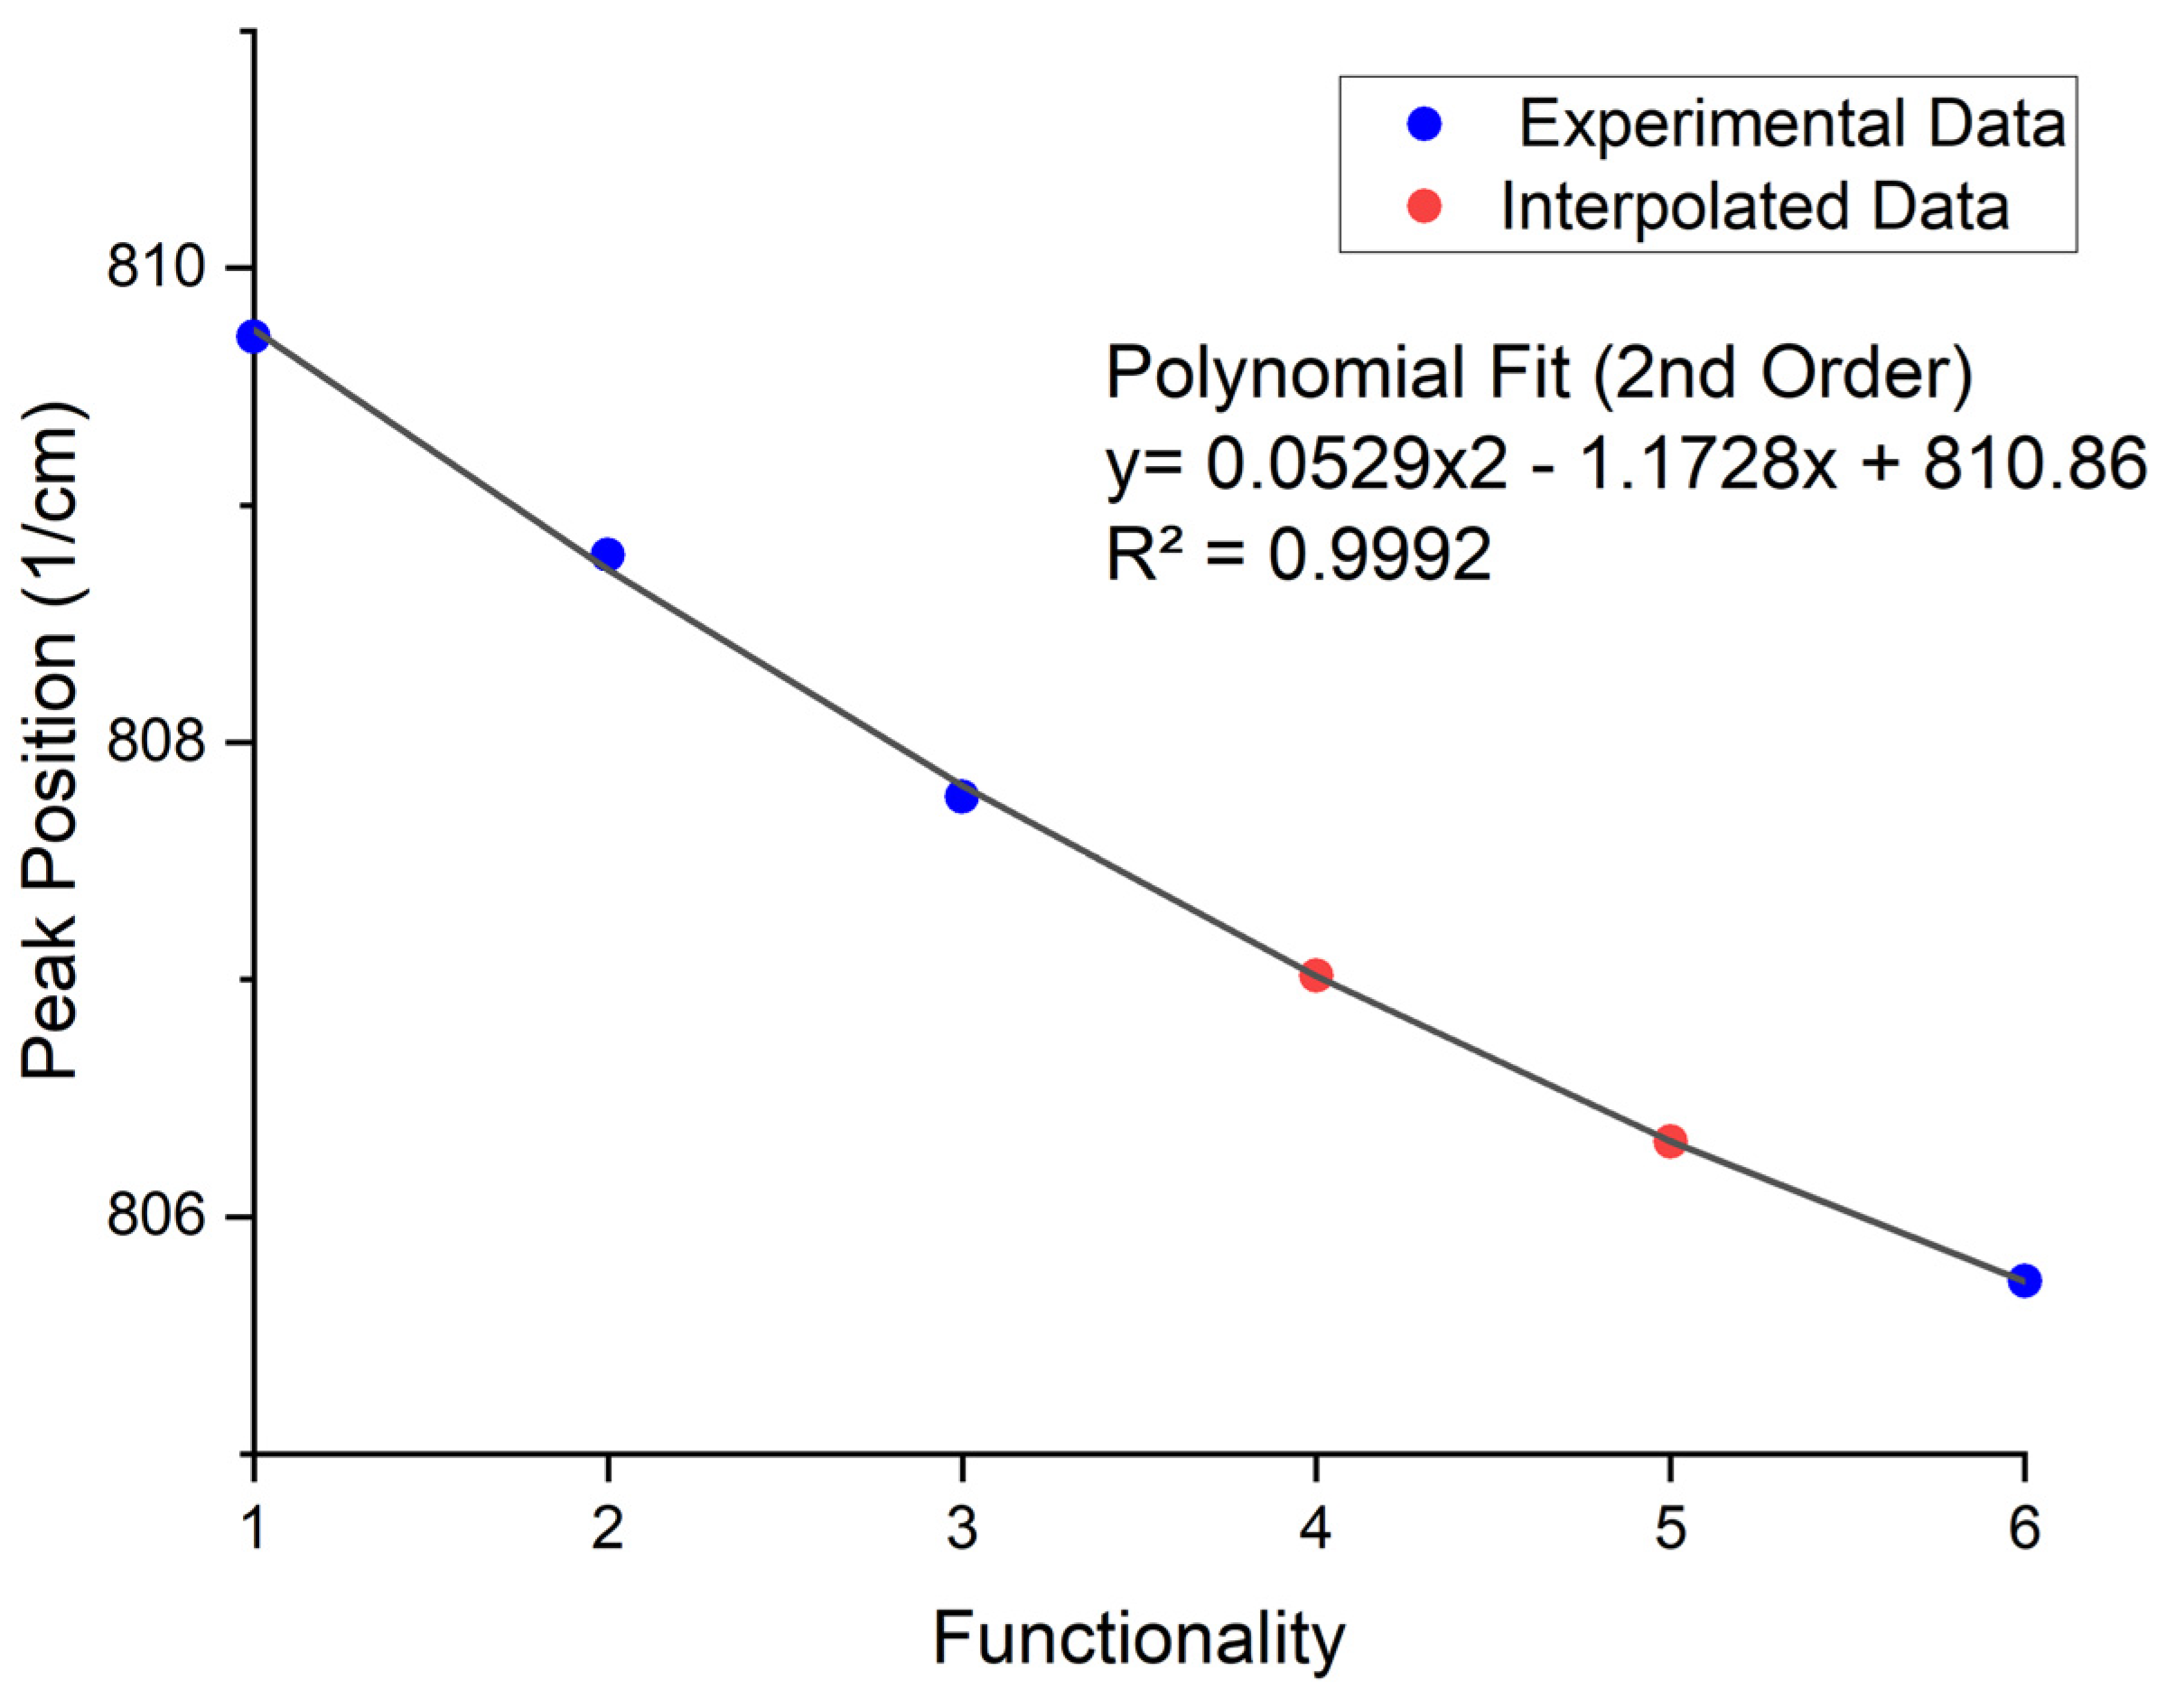
Figure 7 shows the functionality home for the mono, di, tri and hexafunctional home molecules. As seen from the results, there is a gradual shift of the peak to a lower wavenumber as the functionality of the acrylate increases. As the functionality of the structure increases, there is an observed spectral shift. This shift to a lower wavenumber is an indicator of increased stability [34]. This stability is due to conjugated π bond systems being created between the carbonyl and alkene bonds within the acrylate, leading to delocalization [35,36]. The increase in functionality leads to an increase in proximity between zones of electron delocalization, allowing for delocalization to spread across the entire molecule, stabilizing it [36].
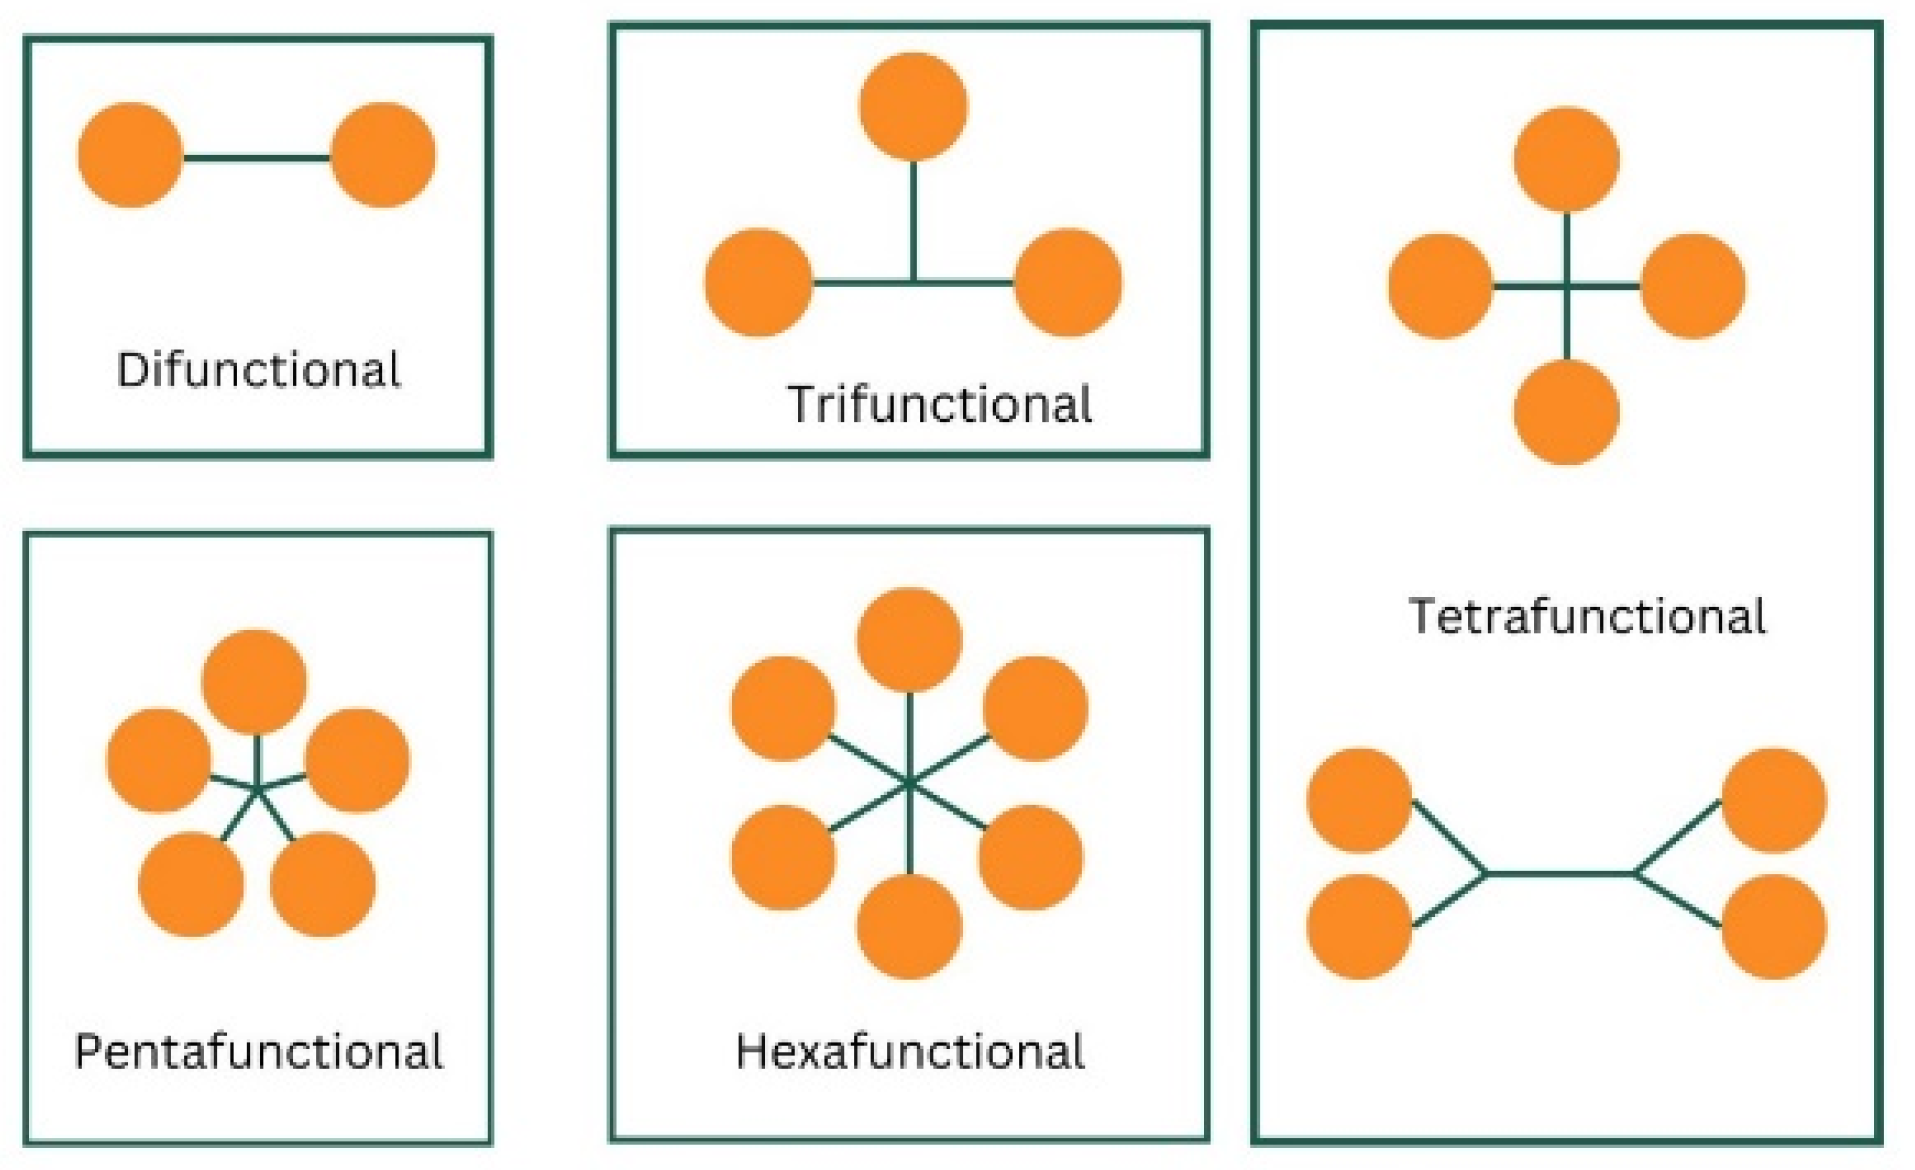
Before the development of functionality home, the functionality itself was used as a measure of an acrylate’s reactivity. In the development of formulation, higher functionality was associated with the development of a higher degree of crosslinking but never distinguished from the reactive state of the high functionality acrylate. A study by Van der Voorde [37] concluded that the functionality of an acrylate material could not be correlated to its reactive state; however, this study assumed that there was no difference in the reactive state of an acrylate functional group situated on a difunctional acrylate and an acrylate on a tetrafunctional acrylate, as illustrated in Figure 6.
Figure 6.
Ball And Stick Illustration Of Different Functionality Acrylates, Showing The Positioning Proximity Of Functional Groups To Each Other On A Molecule
Figure 6.
Ball And Stick Illustration Of Different Functionality Acrylates, Showing The Positioning Proximity Of Functional Groups To Each Other On A Molecule
Additionally, with increasing functionality, there appears to be a decrease in the aspect ratio of the peak (Table 4). A study by Torii et al. [38] looked into the impact of electron delocalization on the peak intensity of infrared spectroscopy. Their study linked the delocalization of the electron to the charge flux, showing that with greater electron delocalization, there is a large change in the dipole moment, causing a more intense peak in the infrared spectrum, as seen in the OMSP peaks, with increasing functionality.
Table 4.
OMSP Functionality Home Acrylate Parameters
| Functionality | Peak Position | Aspect Ratio |
|---|---|---|
| 1 | 809.81 | 203.15 |
| 2 | 808.79 | 39.927 |
| 3 | 807.77 | 23.254 |
| 6 | 805.73 | 4.3711 |
Figure 7.
OMSP Outputs For The Selected Acrylate Monomers Used To Determine The Functionality Home Peak Positions For The OMSP Code.
Figure 7.
OMSP Outputs For The Selected Acrylate Monomers Used To Determine The Functionality Home Peak Positions For The OMSP Code.
Trends in Peak Positions When Different Functionalities Are Mixed
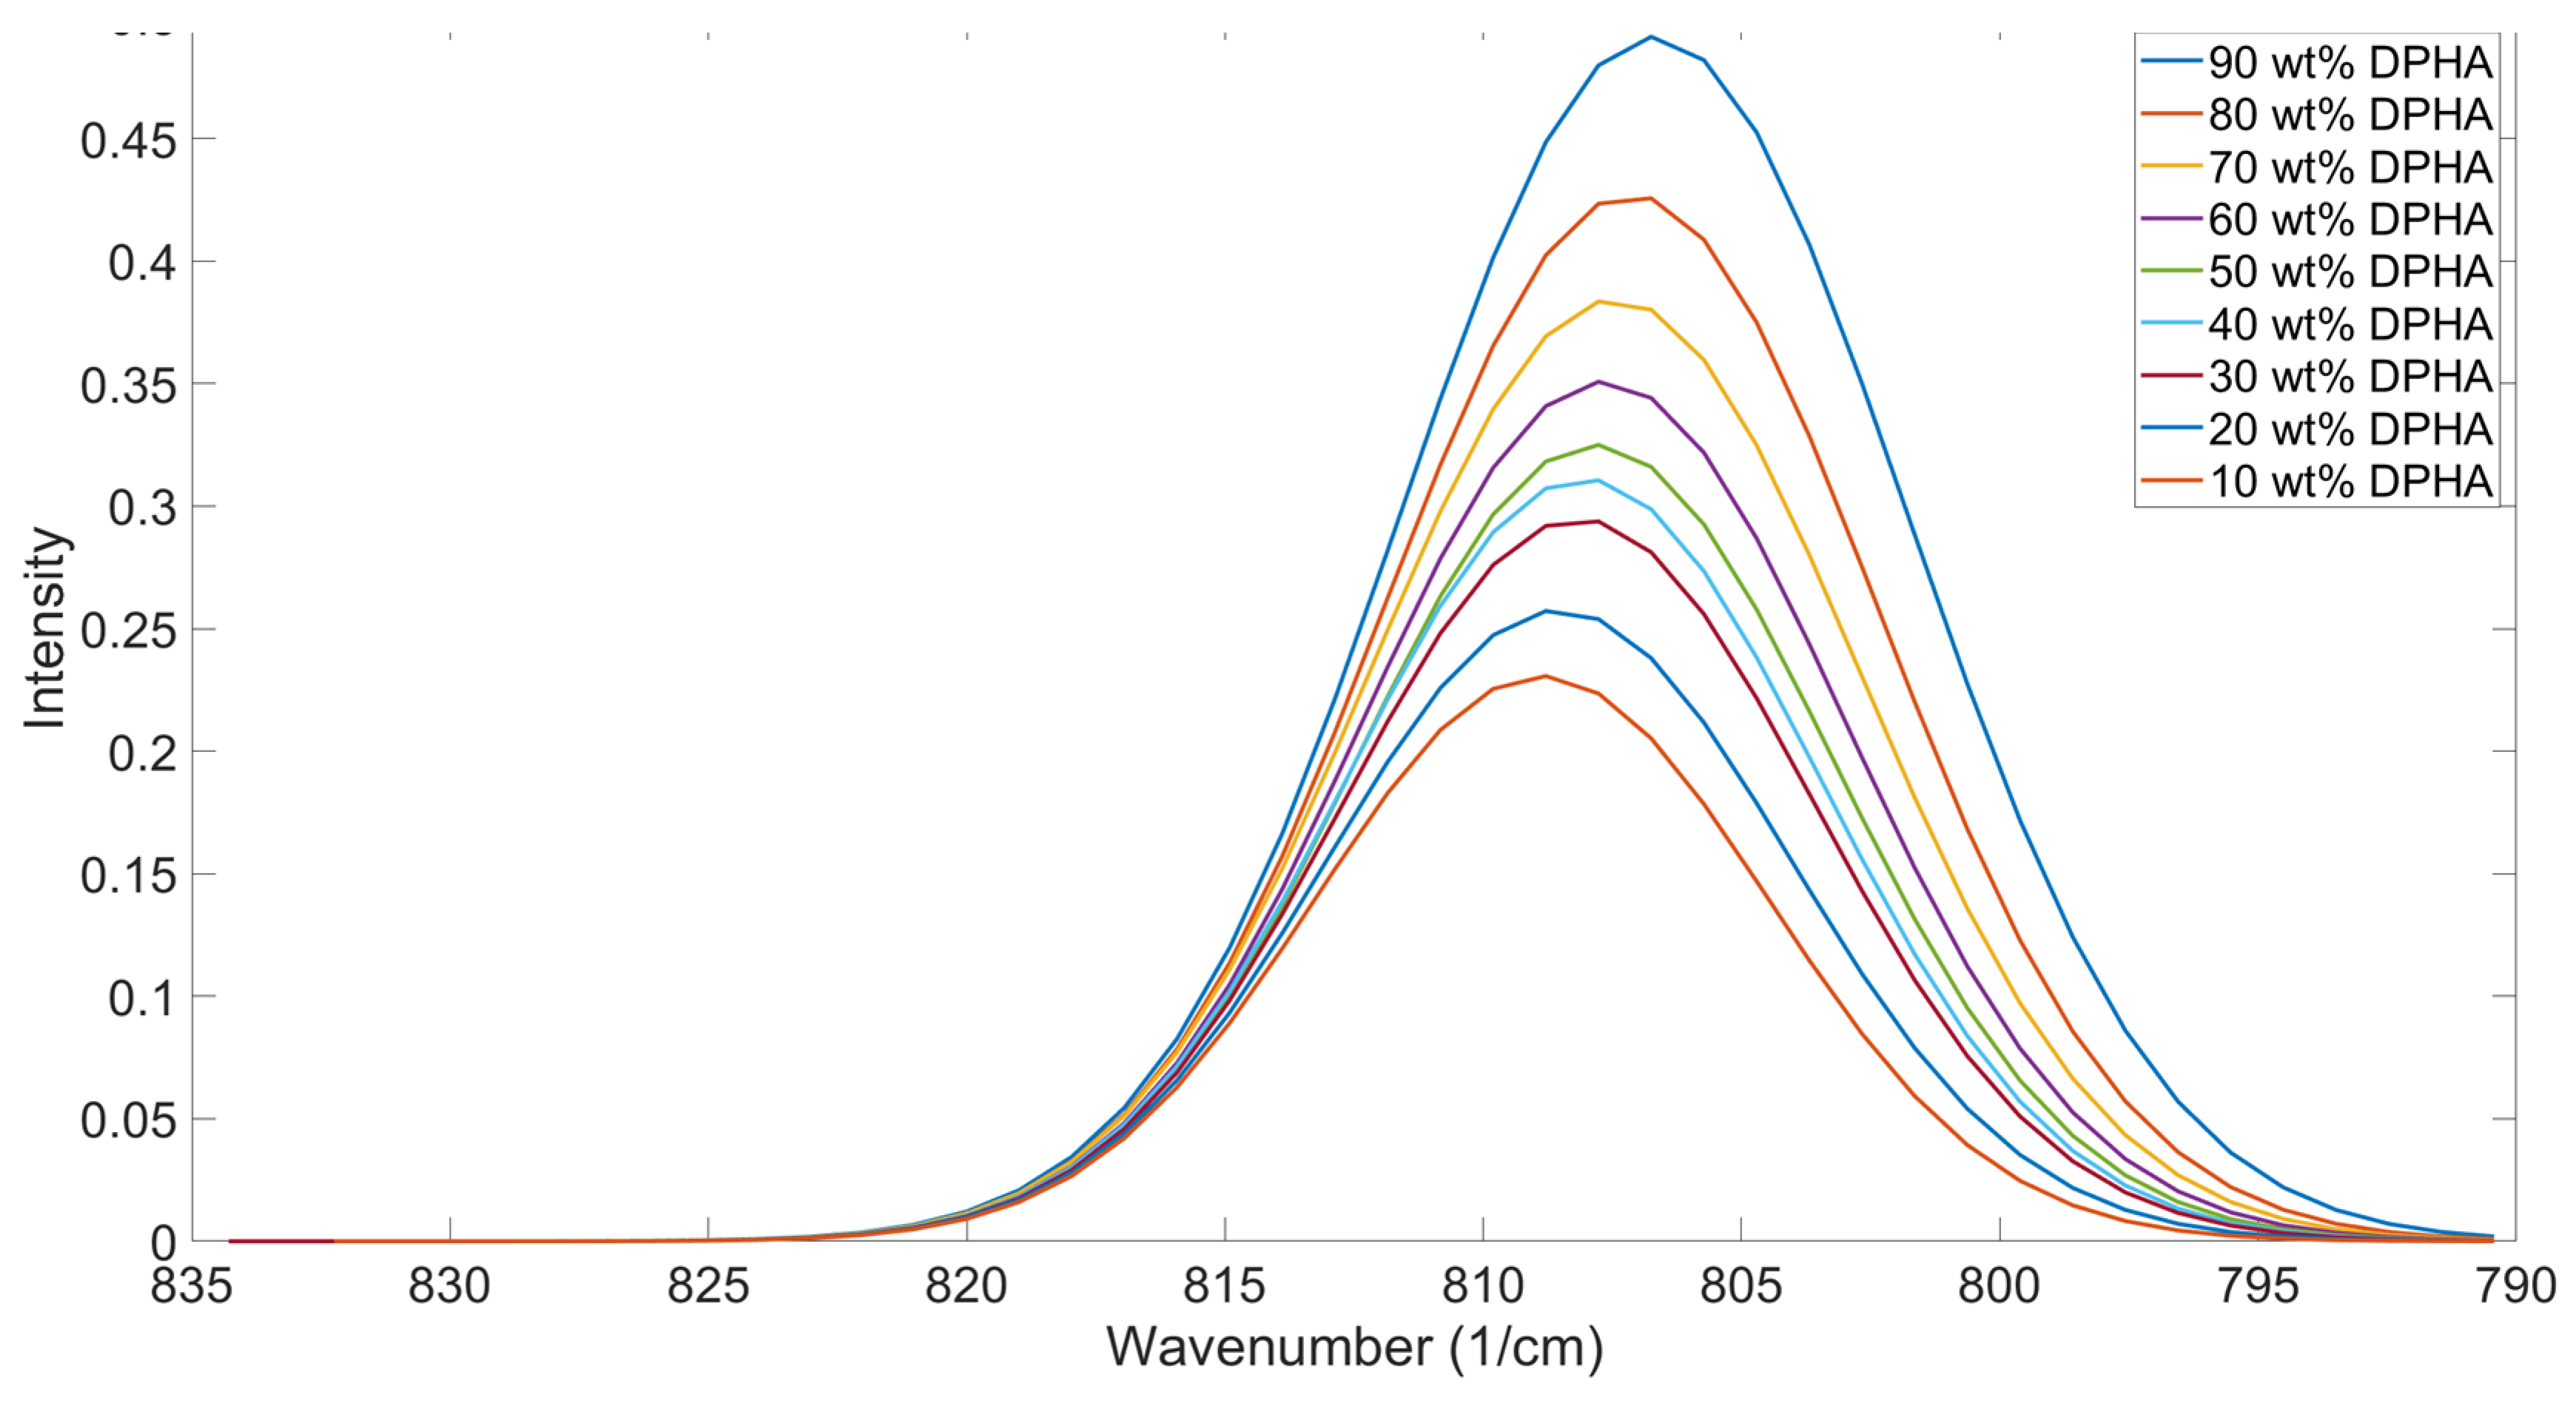
Variations in reactivity with acrylate functionality have been observed in the literature [39,40]. IDA and DPHA were mixed at varying concentrations to study the impact of mixing different functionality components on the OMSP area and peak position (Figure 8). The results showed a gradual increase in the peak position with increasing amounts of IDA, supporting the trend seen in Figure 7.
Figure 8.
Graphical OMSP Output for varying balances of IDA (monofunctional) and DPHA (hexafunctional)
Figure 8.
Graphical OMSP Output for varying balances of IDA (monofunctional) and DPHA (hexafunctional)
Comparison between Acrylates and Methacrylates
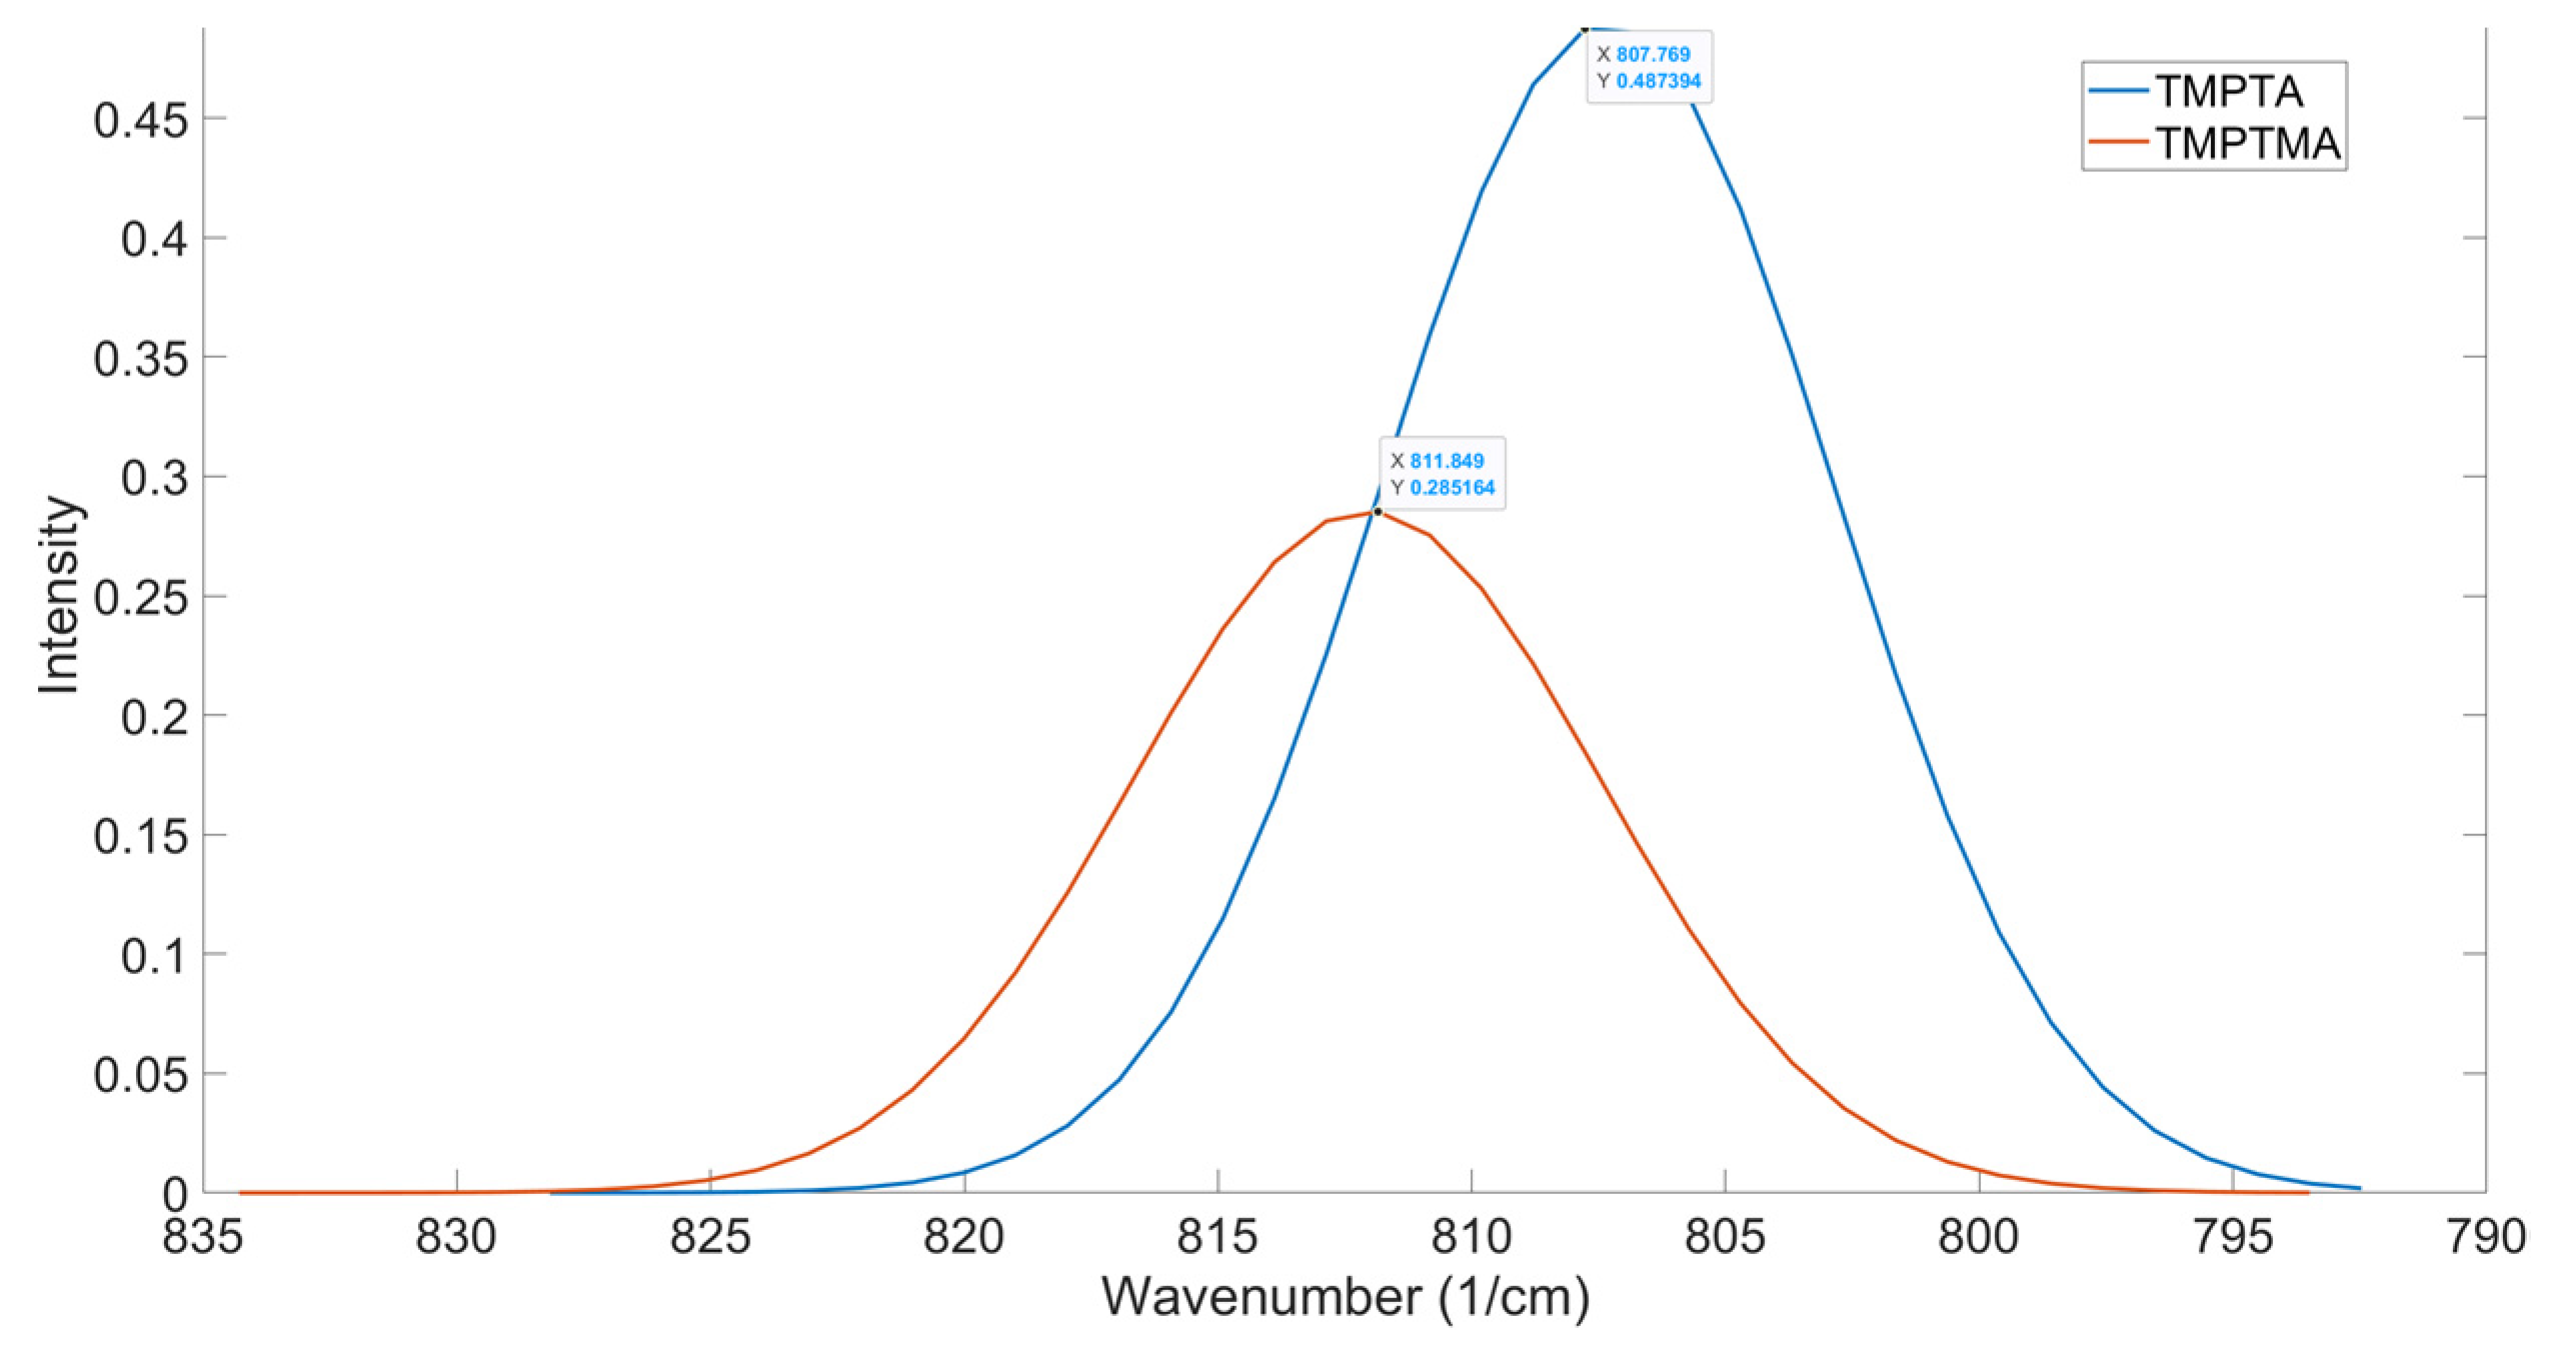
The spectral shift observed by the aliphatic urethane difunctional methacrylate oligomer indicated that the oligomer was significantly more reactive compared to the other tested difunctional oligomer, G4259, an aliphatic urethane acrylate. In the literature, methacrylates and acrylates are interchangeably used in formulation development and, in many cases, mixed to form formulations for photoresins [41]. However, the methyl group situated on the acrylate functional groups causes physical obstruction to the photoinitiator during the polymerization process, often referring to them as less reactive than their acrylate counterpart [42]. In a study by Maruo et al. [43], TMPTA and TMPTMA were compared (Figure 9). The conversion achieved for both acrylates was analyzed at 20 wt% and 40 wt%, showing the TMPTMA to show a lower conversion to TMPTA. When analyzing these two structures using OMSP, the output showed a spectral shift to a higher wavenumber, as seen by the difunctional methacrylate oligomer. Based on this shift, the code determined the pseudo functionality of TMPTMA to be monofunctional, making it appear to be a highly reactive trifunctional acrylate, which is not the case seen in Maruo’s study.
Figure 9.
Comparison Of OMSP Between TMPTA And TMPTMA
Formulations M.1 and M.2 were made to compare the mechanical properties of TMPTA and TMPTMA to the results seen in OMSP output and Maruo’s study. The OMSP output for TMPTMA had a higher OMSP area of 0.1792, compared to the TMPTA formulation, with a lower OMSP of 0.1663, showing TMPTA to have a high potential for saturation with its increased density of polymerizable alkenes. The peak positions showed the TMPTA formulation to peak at a lower wavenumber of 807.54 cm-1, whilst TMPTMA peaked at 807.68 cm-1. Although similar in peak position, the 20 wt% abundance was enough to show a resultant shift in the peak position of the formulations. However, the conversion measurement for TMPTA showed 49.04%, whilst TMPTMA had a conversion of only 29.7%. This lower reactivity has been reported in previous literature [44]. The mechanical properties also showed TMPTA to be the stronger material, with a UTS of 44.18 MPa and Young’s Modulus of 462.8, whilst TMPTMA was 31.25 MPa and 336.71, respectively. Similar outcomes were seen when IBOA was compared to IBOMA.
A notable difference in the results found for acrylates and their methacrylate counterpart is the aspect ratio. Acrylates appear to have a lower aspect ratio compared to the methacrylate alternative. Not only does the methacrylate shift to a higher wavenumber, but the spread of reactivity also appears greater. Despite the tests showing that methacrylates appear to vibrate at a higher wavenumber than their acrylate counterpart, the relationship between functionality and peak position IBOA and TMPTA can also be seen in IBOMA and TMPTMA (Figure 10). Therefore, OMSP at this stage excluded methacrylate components from the formulations tested.
Figure 10.
Similarities In OMSP Peaks Seen In Acrylates Monomers, Also Seen In Methacrylate Monomers. Similarities In OMSP Peaks Seen In Acrylates Monomers, Also Seen In Methacrylate Monomers.
Figure 10.
Similarities In OMSP Peaks Seen In Acrylates Monomers, Also Seen In Methacrylate Monomers. Similarities In OMSP Peaks Seen In Acrylates Monomers, Also Seen In Methacrylate Monomers.
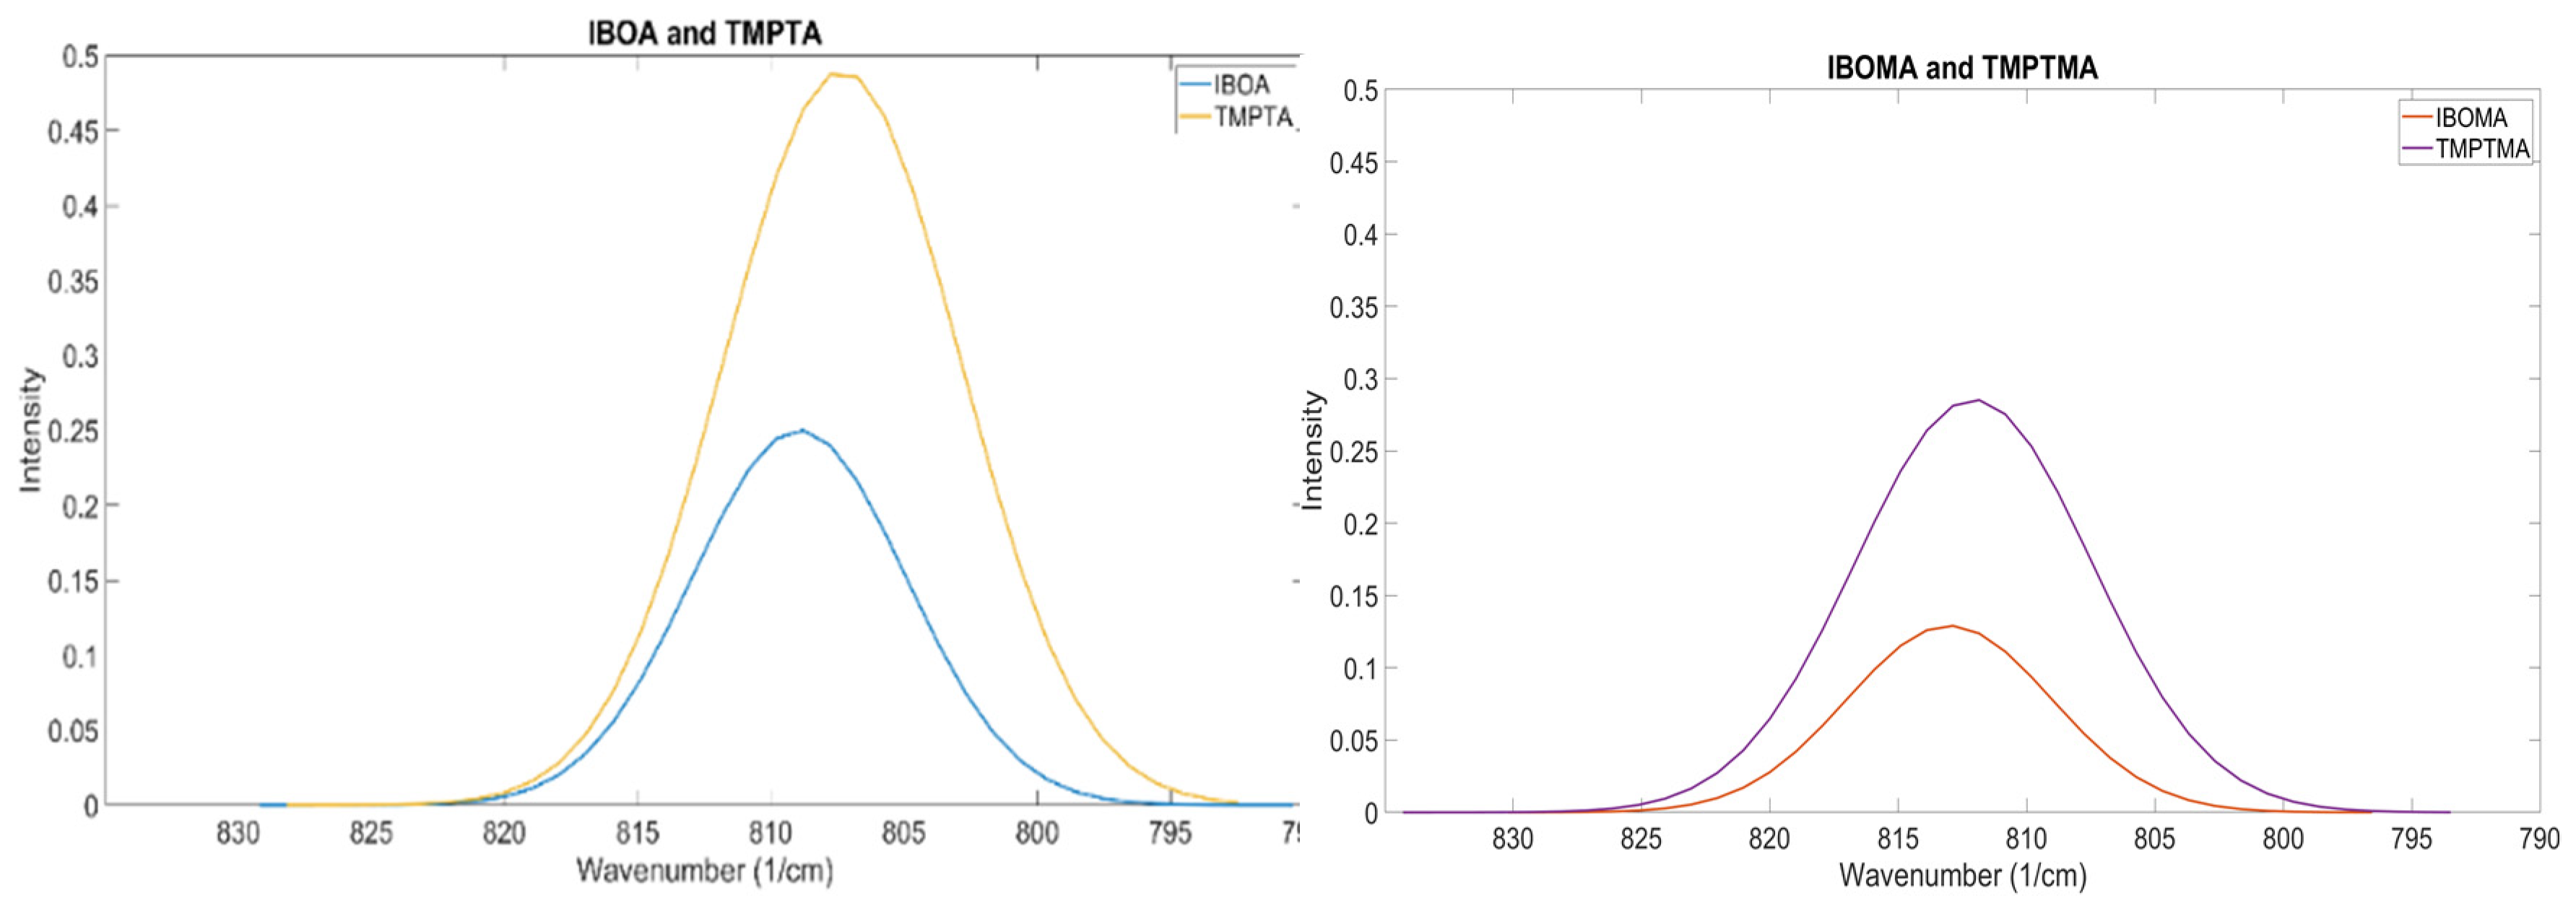
Table 5.
Printed Specimen Results Of Methacrylate Monomers Compared To Acrylate Monomers
| ID | Viscosity (mPa.s) |
Conversion (%) |
σ | UTS (MPa) |
σ | E | σ | Elongation (%) |
σ | Hardness | σ |
|---|---|---|---|---|---|---|---|---|---|---|---|
| M.1 | 88 | 47.10 | 1.14 | 40.71 | 1.04 | 408.24 | 8.48 | 17.12 | 0.89 | 83.80 | 1.25 |
| M.2 | 173 | 37.13 | 3.48 | 36.46 | 1.11 | 393.65 | 16.99 | 17.07 | 0.58 | 81.54 | 0.75 |
| M.3 | 46 | 24.17 | 0.67 | 284.83 | 13.52 | 20.86 | 2.90 | 74.88 | 0.85 | 24.17 | 0.67 |
| M.4 | 133 | 22.17 | 1.76 | 222.92 | 24.98 | 22.14 | 0.63 | 70.70 | 2.54 | 22.17 | 1.76 |
Detection of Non-Acrylates
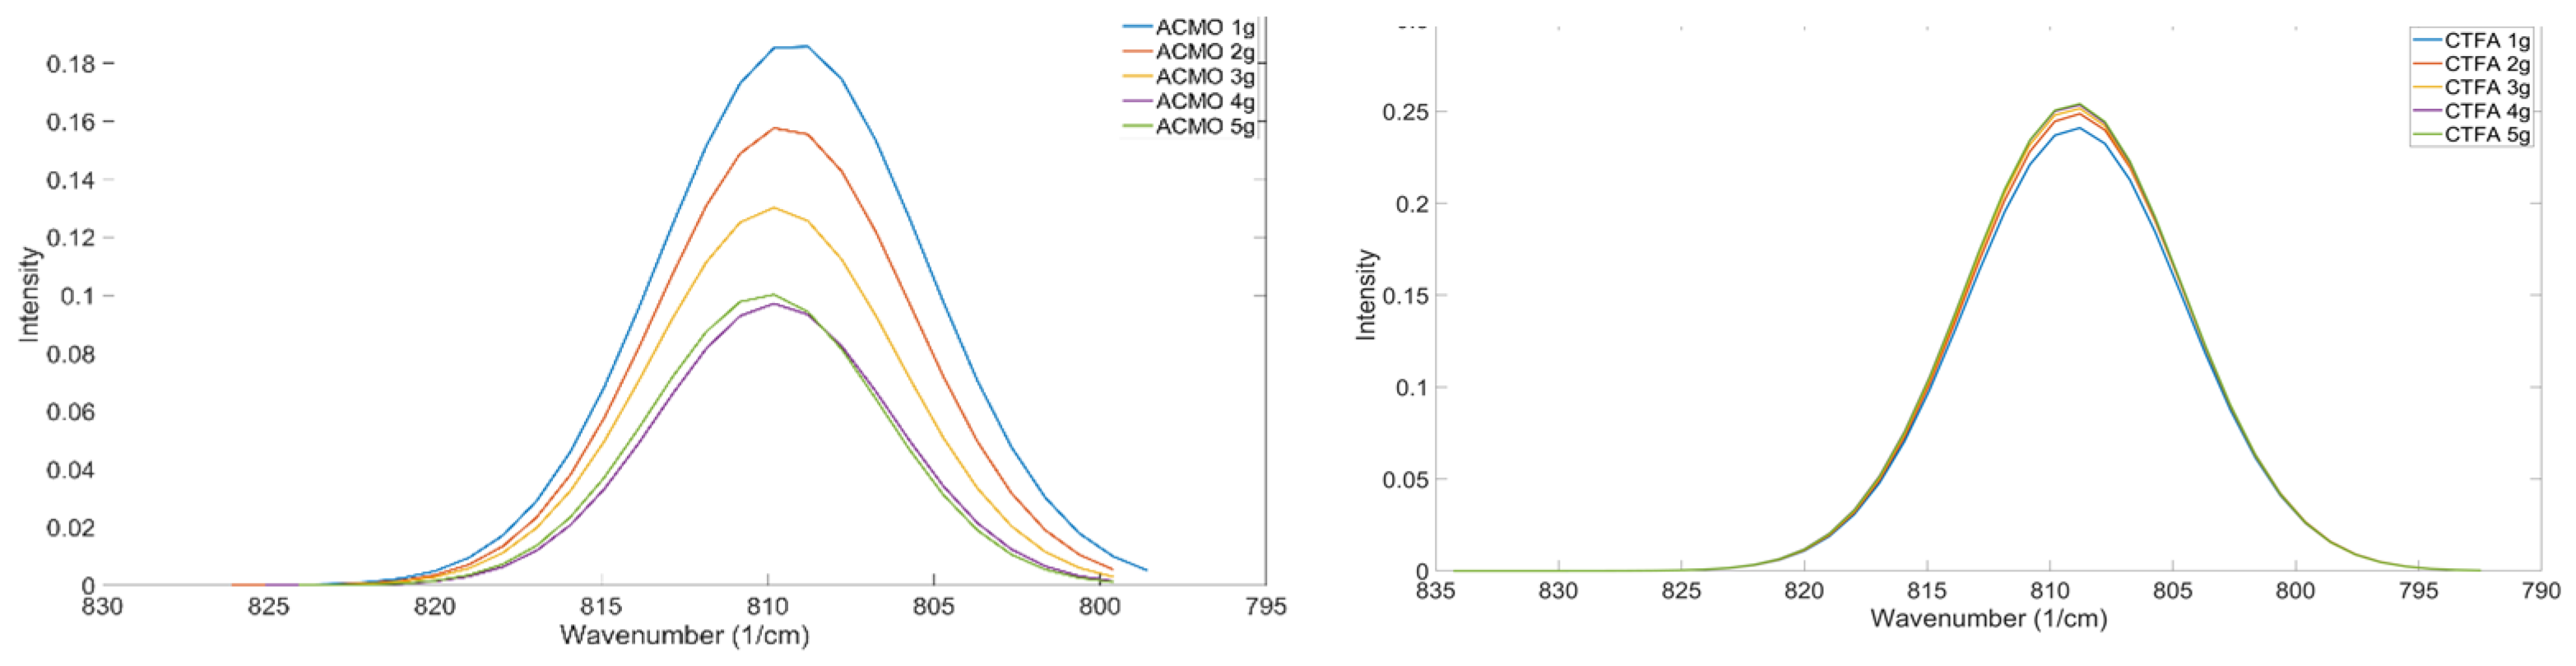
ACMO is a reactive diluent used in formulations to provide stiffness and lower the viscosity of formulations [45]. As seen in Figure 11, the OMSP area generated for ACMO shows a negative region of absorbance intensity despite the peak still appearing within the acrylate region. Based on the appearance of the peak in the figure, it is believed that the presence of ACMO would present as a void in formulation OMSP, making formulations appear to have lower conversion potential than they truly do. The void in the OMSP area was studied and compared to a monofunctional acrylate reactive diluent, CTFA, when both diluents were added to G-4259. The increase in the abundance of ACMO resulted in the appearance of increased voids in the acrylate sample, leading to a decrease in the OMSP area.
However, CTFA shows different results, where the OMSP area increased with increasing monofunctional acrylate abundance. Although ACMO is photo-polymerizable, the structure causes shifts in the OMSP area due to the morpholine group [46], making it undetectable under OMSP analysis. The significantly smaller molecular structure of CTFA to G-4259, whose molecular weight is primarily linked to the complexity of intermediate branching of the molecule as the component is only difunctional [47]. The peak position was also influenced by the increasing presence of monofunctional diluent in both ACMO and CTFA samples. Therefore, OMSP was able to detect the presence of ACMO in the system due to the monofunctional diluent’s peak shift influence, as seen in CFTA. However, the OMSP outputs of ACMO-containing formulations could not be linked to their potential for crosslinking.
Figure 11.
OMSP Outputs Of CTFA And ACMO. Display Of AMCO And OMSP Code Incompatibility.
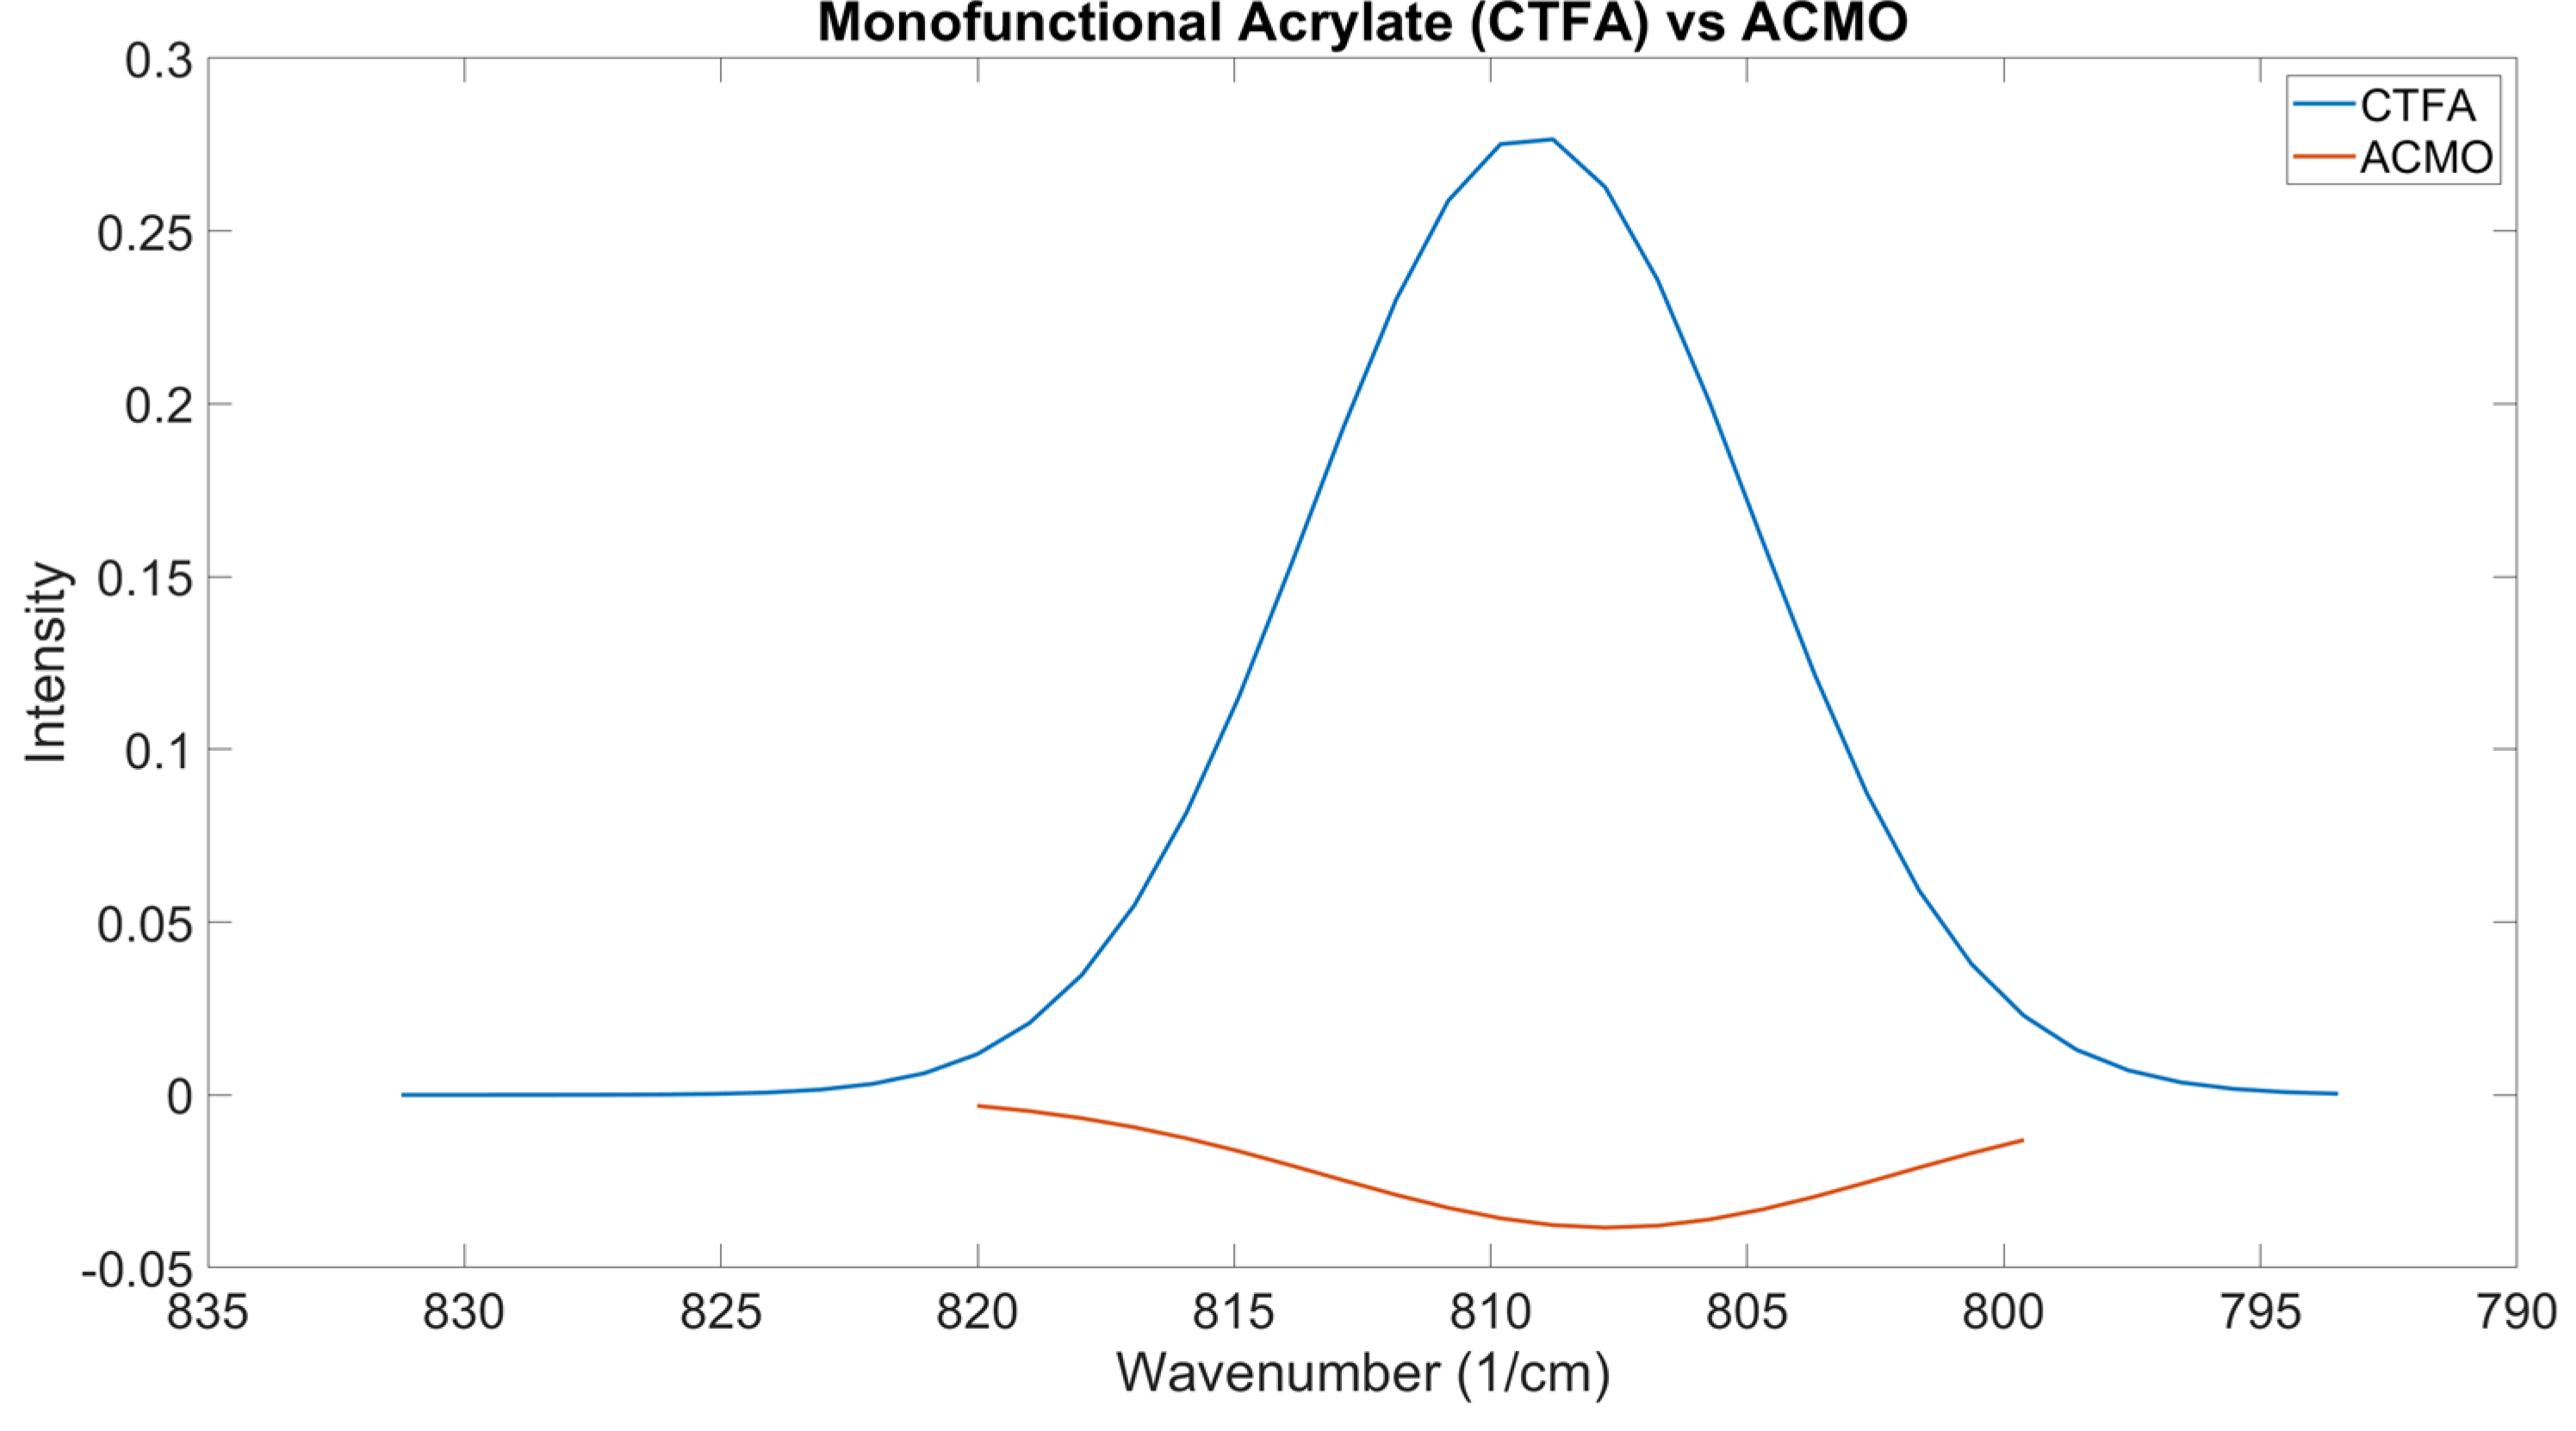
Figure 12.
Comparison Of How Various Amounts Of Monofunctional Diluent Impact The Characteristics Of The Mixture's OMSP Curve. Left, ACMO; Right, CTFA.
Figure 12.
Comparison Of How Various Amounts Of Monofunctional Diluent Impact The Characteristics Of The Mixture's OMSP Curve. Left, ACMO; Right, CTFA.
Application Of OMSP On Acrylate Systems
From this stage of the study, OMSP was used on various acrylate monomers and oligomers to demonstrate the efficacy of the characterization method. A series of tests were conducted to show how OMSP could be used to obtain acrylate properties and compare the observed trends found in the results of OMSP outputs to experimental findings via conversion testing and, in some cases, tensile testing.
OMSP being able to characterize acrylates by their potential reactivity and create unique Gaussian curves for them allows formulations to be directly compared in the same way as their components, meaning easier adjustments can be made to the formulation. The graphical presentation of the acrylate, for instance, in Figure 8, allows the effects of the addition of acrylate components on the shift in reactivity for the formulation mixture through changes in the position and aspect ratio of the curve. The numerical outputs, such as OMSP areas, allow you to compare potential reactivity to each other directly, whilst the aspect ratio indicates the spread of reactivity. Therefore, the simple outputs of OMSP can provide more information about an acrylate system to a much higher degree of detail than is currently available without the need for acrylate manufacturers to divulge sensitive information about the molecular composition, allowing the user to make comparisons and decisions in a quicker, less subjective and confident way, whilst the manufacturers can protect their intellectual property.
Differentiating Between Similar Reactive Diluents
Both DPGDA and NPG(PO)2DA are difunctional glycol diacrylates with a viscosity of 15 mPa.s [48,49]. The difference between the groups is the connections in the carbon backbone, where NPG(PO)2DA contains an additional propane chain in the center of the backbone, whilst DPGDA connects the two acrylate functional groups with an oxygen atom (Figure 13).
Figure 13.
Displayed Diagrams Of The Molecular Structure Of NPG(PO)2DA And DPGDA
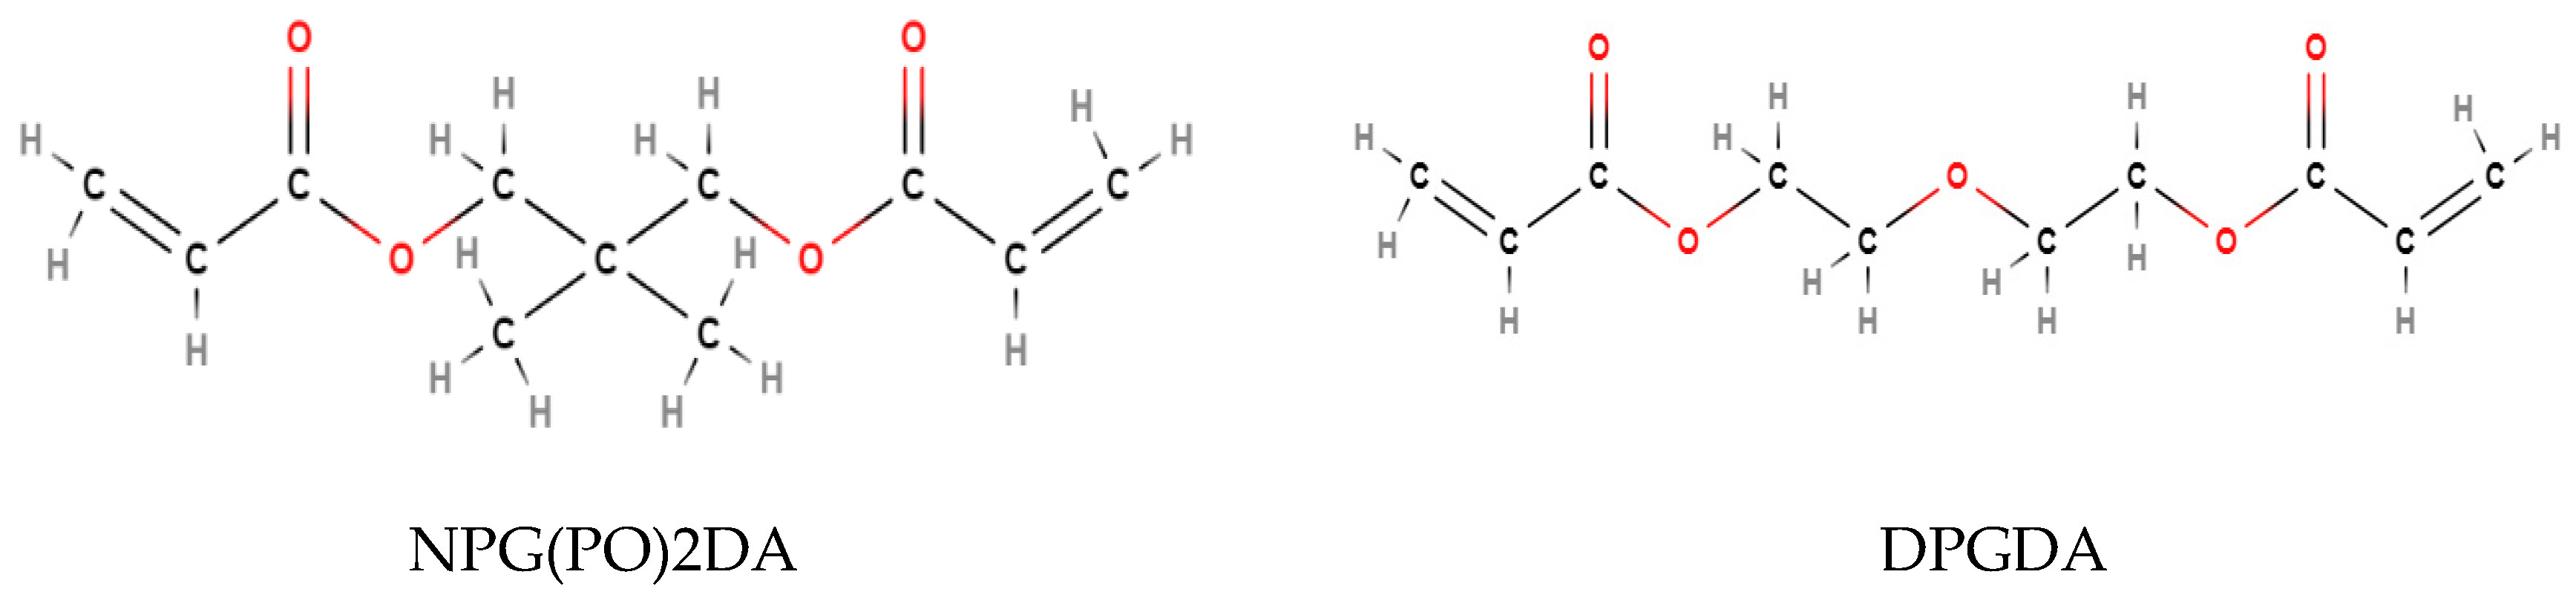
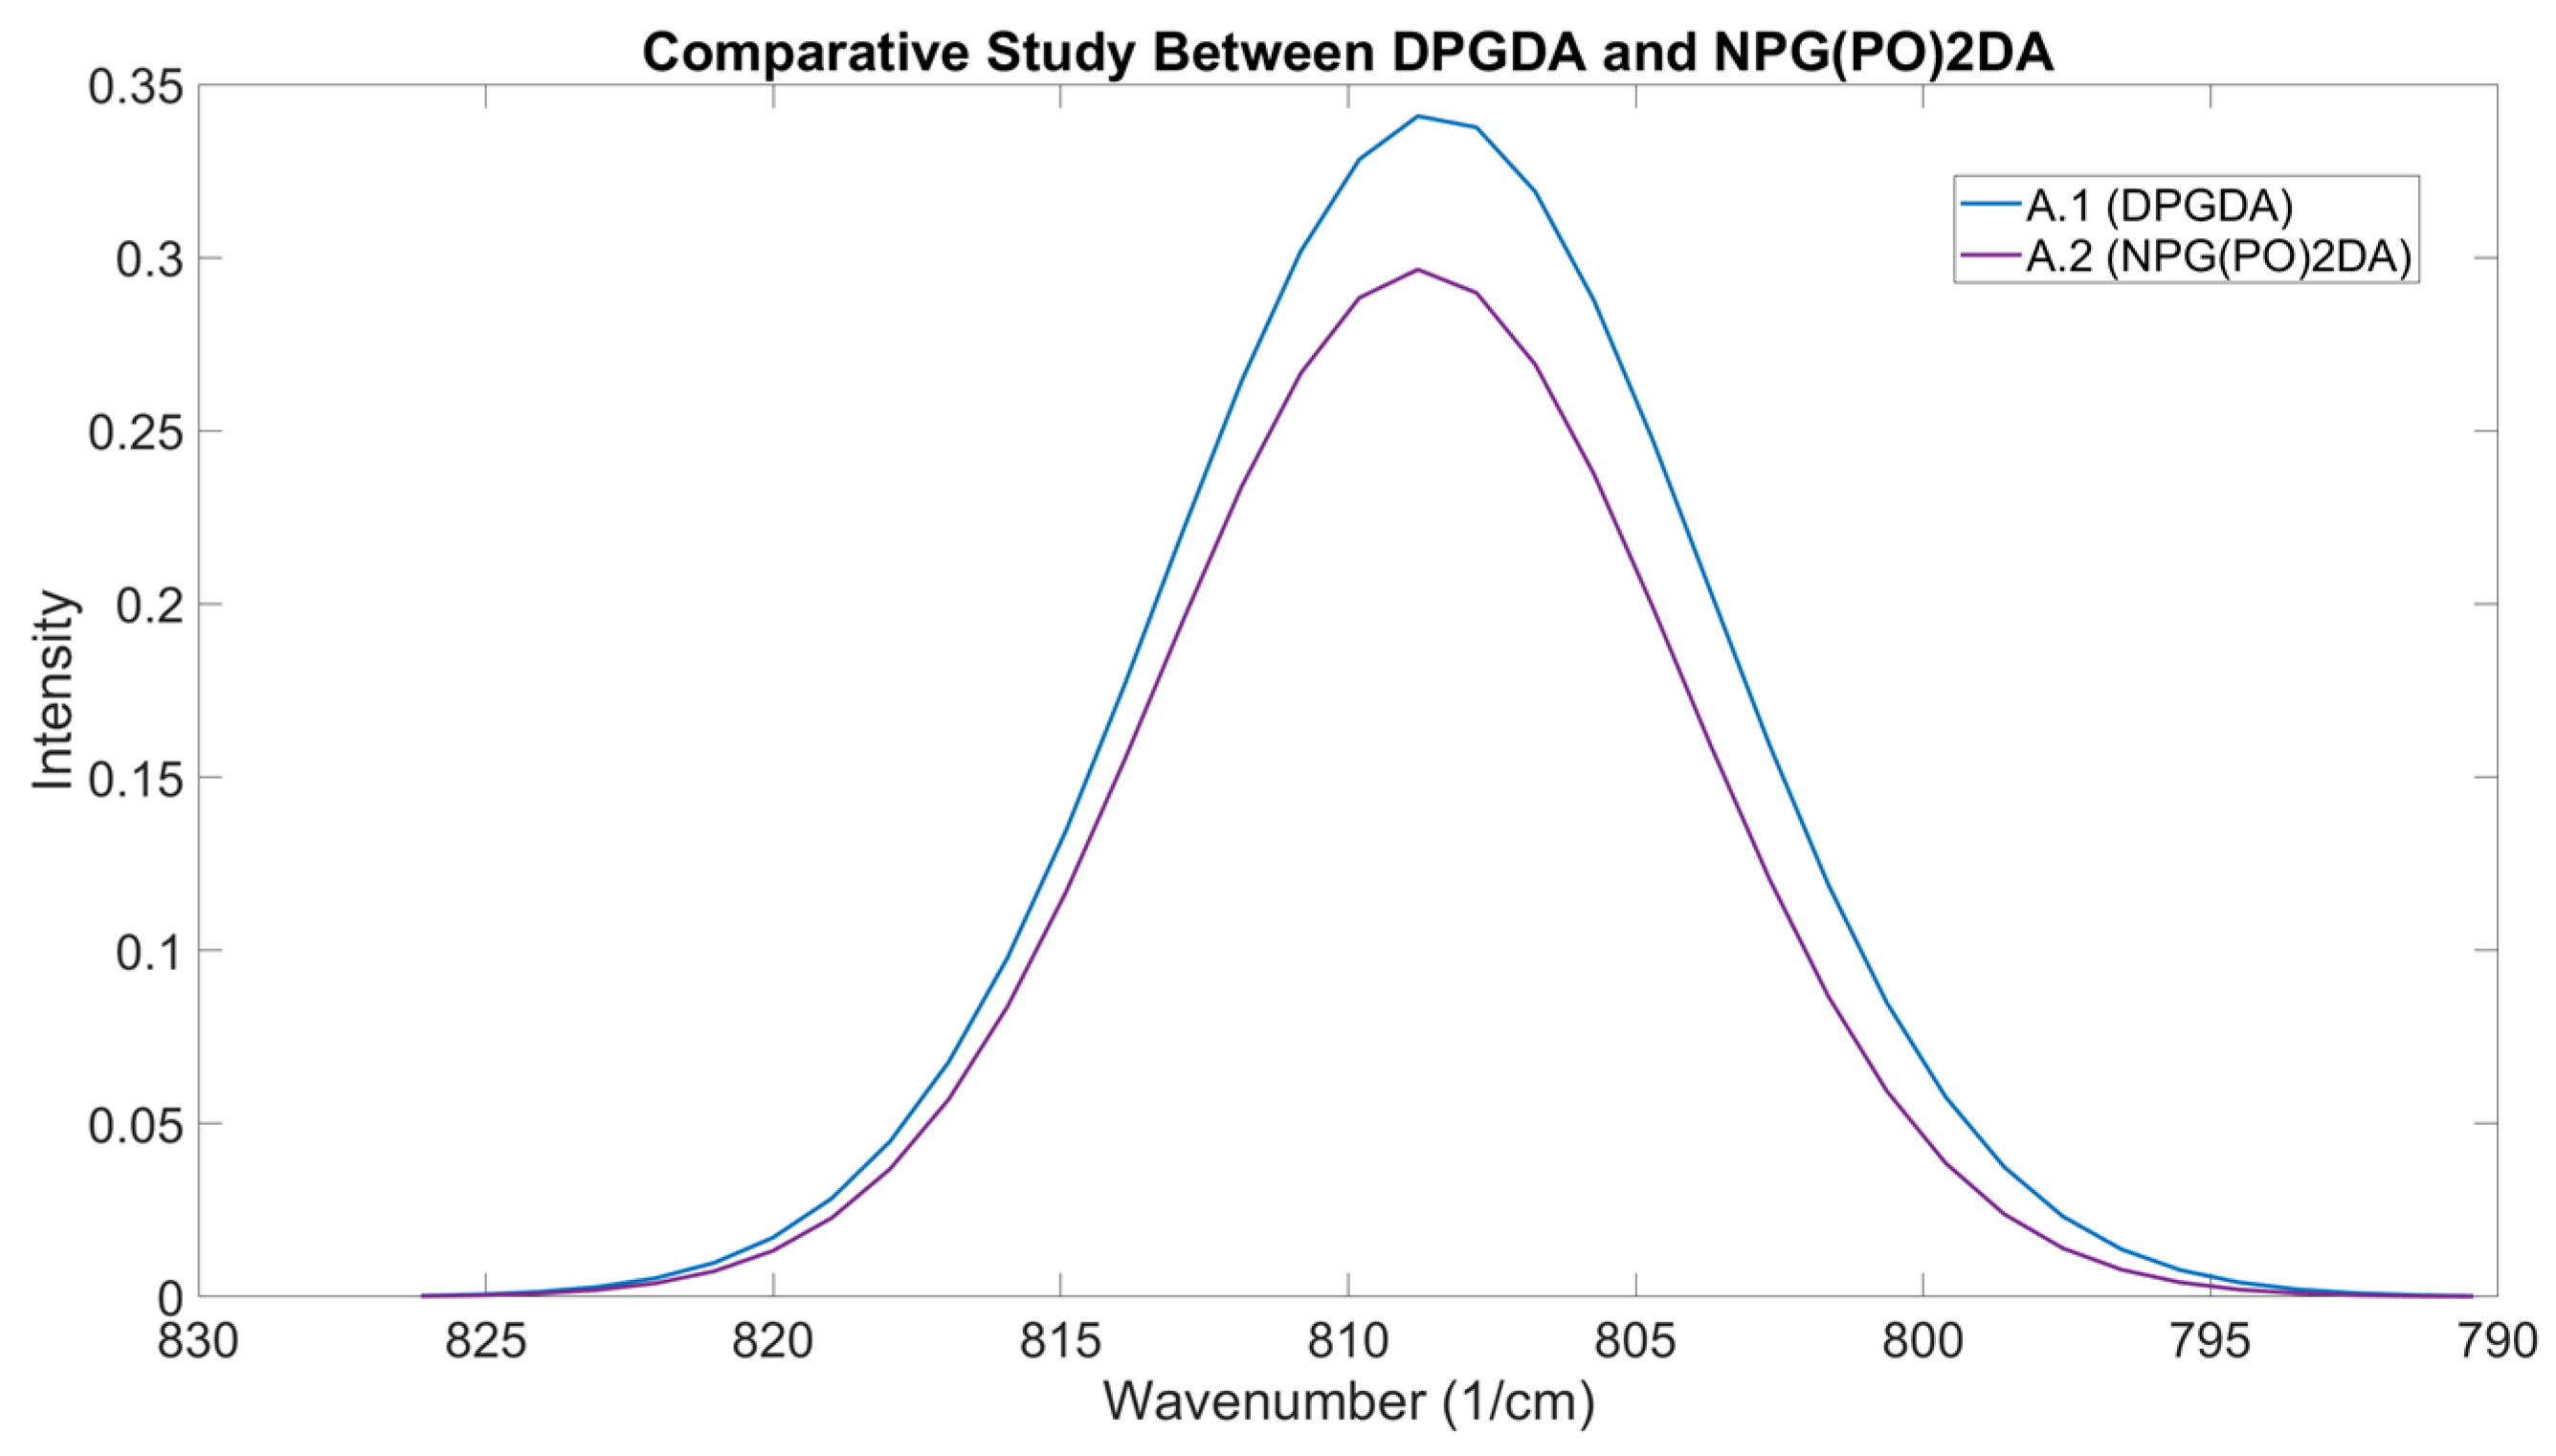
Figure 14 shows the OMSP output for the DPGDA, NPG(PO)2DA, formulation A.1, and formulation A.2. Figure 10 shows the formulation viscosity, conversion, tensile properties and hardness results of the two formulations. As seen from the results, both DPGDA and NPG(PO)2DA have very similar peak positions, which has translated to the formulations made from them. The formulation containing DPGDA had an OMSP area of 0.1435, whilst the NPG(PO)2DA formulation had a lower OMSP area of 0.1354. The additional branching of NPG(PO)2DA was detected as the cause of the drop in as the branching methyl groups increased the bulkiness of the acrylate, lowering the space available for the polymerizable alkene bonds [50]. Additionally, the conversion results support this, as the DPGDA formulation showed a conversion of 21.08% greater than the NPG(PO)2DA substituted formulation.
Although both difunctional diluents had the same theoretical viscosity, the rheology results showed the formulation containing NPG(PO)2DA to have a viscosity 97% greater than the one with DPGDA. As the peak positions for both formulations show minimal difference, the increase in viscosity for A.2 is linked to the branching of the NPG(PO)2DA methyl groups, adding to flow resistance [51]. The larger molecular weight of NPG(PO)2DA leads to a higher hydrodynamic volume [52,53]. These observations made due to the difference in molecular bulkiness are also reflected in the cure depth, with DPGDA having a cure depth 4.42% greater than NPG(PO)2DA. These differences identified by the OMSP code were present in the mechanical properties, as A.1 had a higher UTS (11.66% increase). The stiffness due to additional crosslinking seen in the conversion data is also shown in Youngs’ Modulus (3.71% increase) and a 2.77% increase in the shore D hardness [54]. The strain at break, however, is similar between both formulations, with the difference in strain at break between the two only being 0.05%.
Table 6.
Printed Specimen Results For DPGDA And NPG(PO)2DA Differentiation
| ID | Viscosity (mPa.s) |
Conversion (%) |
σ | UTS (MPa) |
σ | E | σ | Elongation (%) |
σ | Hardness | σ |
|---|---|---|---|---|---|---|---|---|---|---|---|
| A.1 | 88.00 | 47.10 | 1.14 | 40.71 | 1.04 | 408.24 | 8.48 | 17.12 | 0.89 | 83.80 | 1.25 |
| A.2 | 173.00 | 37.13 | 3.48 | 36.46 | 1.11 | 393.65 | 16.99 | 17.07 | 0.58 | 81.54 | 0.75 |
Figure 14.
OMSP Output Of Formulation Containing DPGDA (A.1) Compared To The Output Containing NPG(PO)2DA (A.2).
Figure 14.
OMSP Output Of Formulation Containing DPGDA (A.1) Compared To The Output Containing NPG(PO)2DA (A.2).
Differentiation Between Oligomer Types
Oligomers are typically high complexity and high molecular weight acrylates directly associated with the resultant mechanical characteristics the final photoresin would possess [55]. Due to their high viscosities, they are often not printable unless mixed with formulations with low viscous diluent materials [56]. The details of the oligomer beyond their anchor type are often not disclosed by the manufacturer, including the molecular weight. Therefore, the performance data provided by the manufacturer and the featured details on the technical datasheet are relied upon during the selection process. As the OMSP area gives a good indication of the bulkiness of the components, as seen in the differences between NPG(PO)2DA and DPGDA and the peak position can be used to understand how the functionality of the acrylate and additional functional groups impact the energy state of the formulation, OMSP was tested as a tool to understand and predict the mechanical performance of various oligomers. Therefore, four difunctional oligomers of varying structures and degrees of flexibility were compared. G-4259, the aliphatic urethane acrylate, was described by the manufacturer as low flexibility (1/4) [57]; G-2263, an epoxy acrylate with a flexibility score of 2/4 [58]; and G-5271, a highly flexible (4/4) amine acrylate [59] were tested and mechanical properties compared to their OMSP outputs (Figure 15).
Figure 15.
OMSP Outputs Comparison Photoresins Of The Same Reactive Diluents But Different Flexibility Oligomers
Figure 15.
OMSP Outputs Comparison Photoresins Of The Same Reactive Diluents But Different Flexibility Oligomers
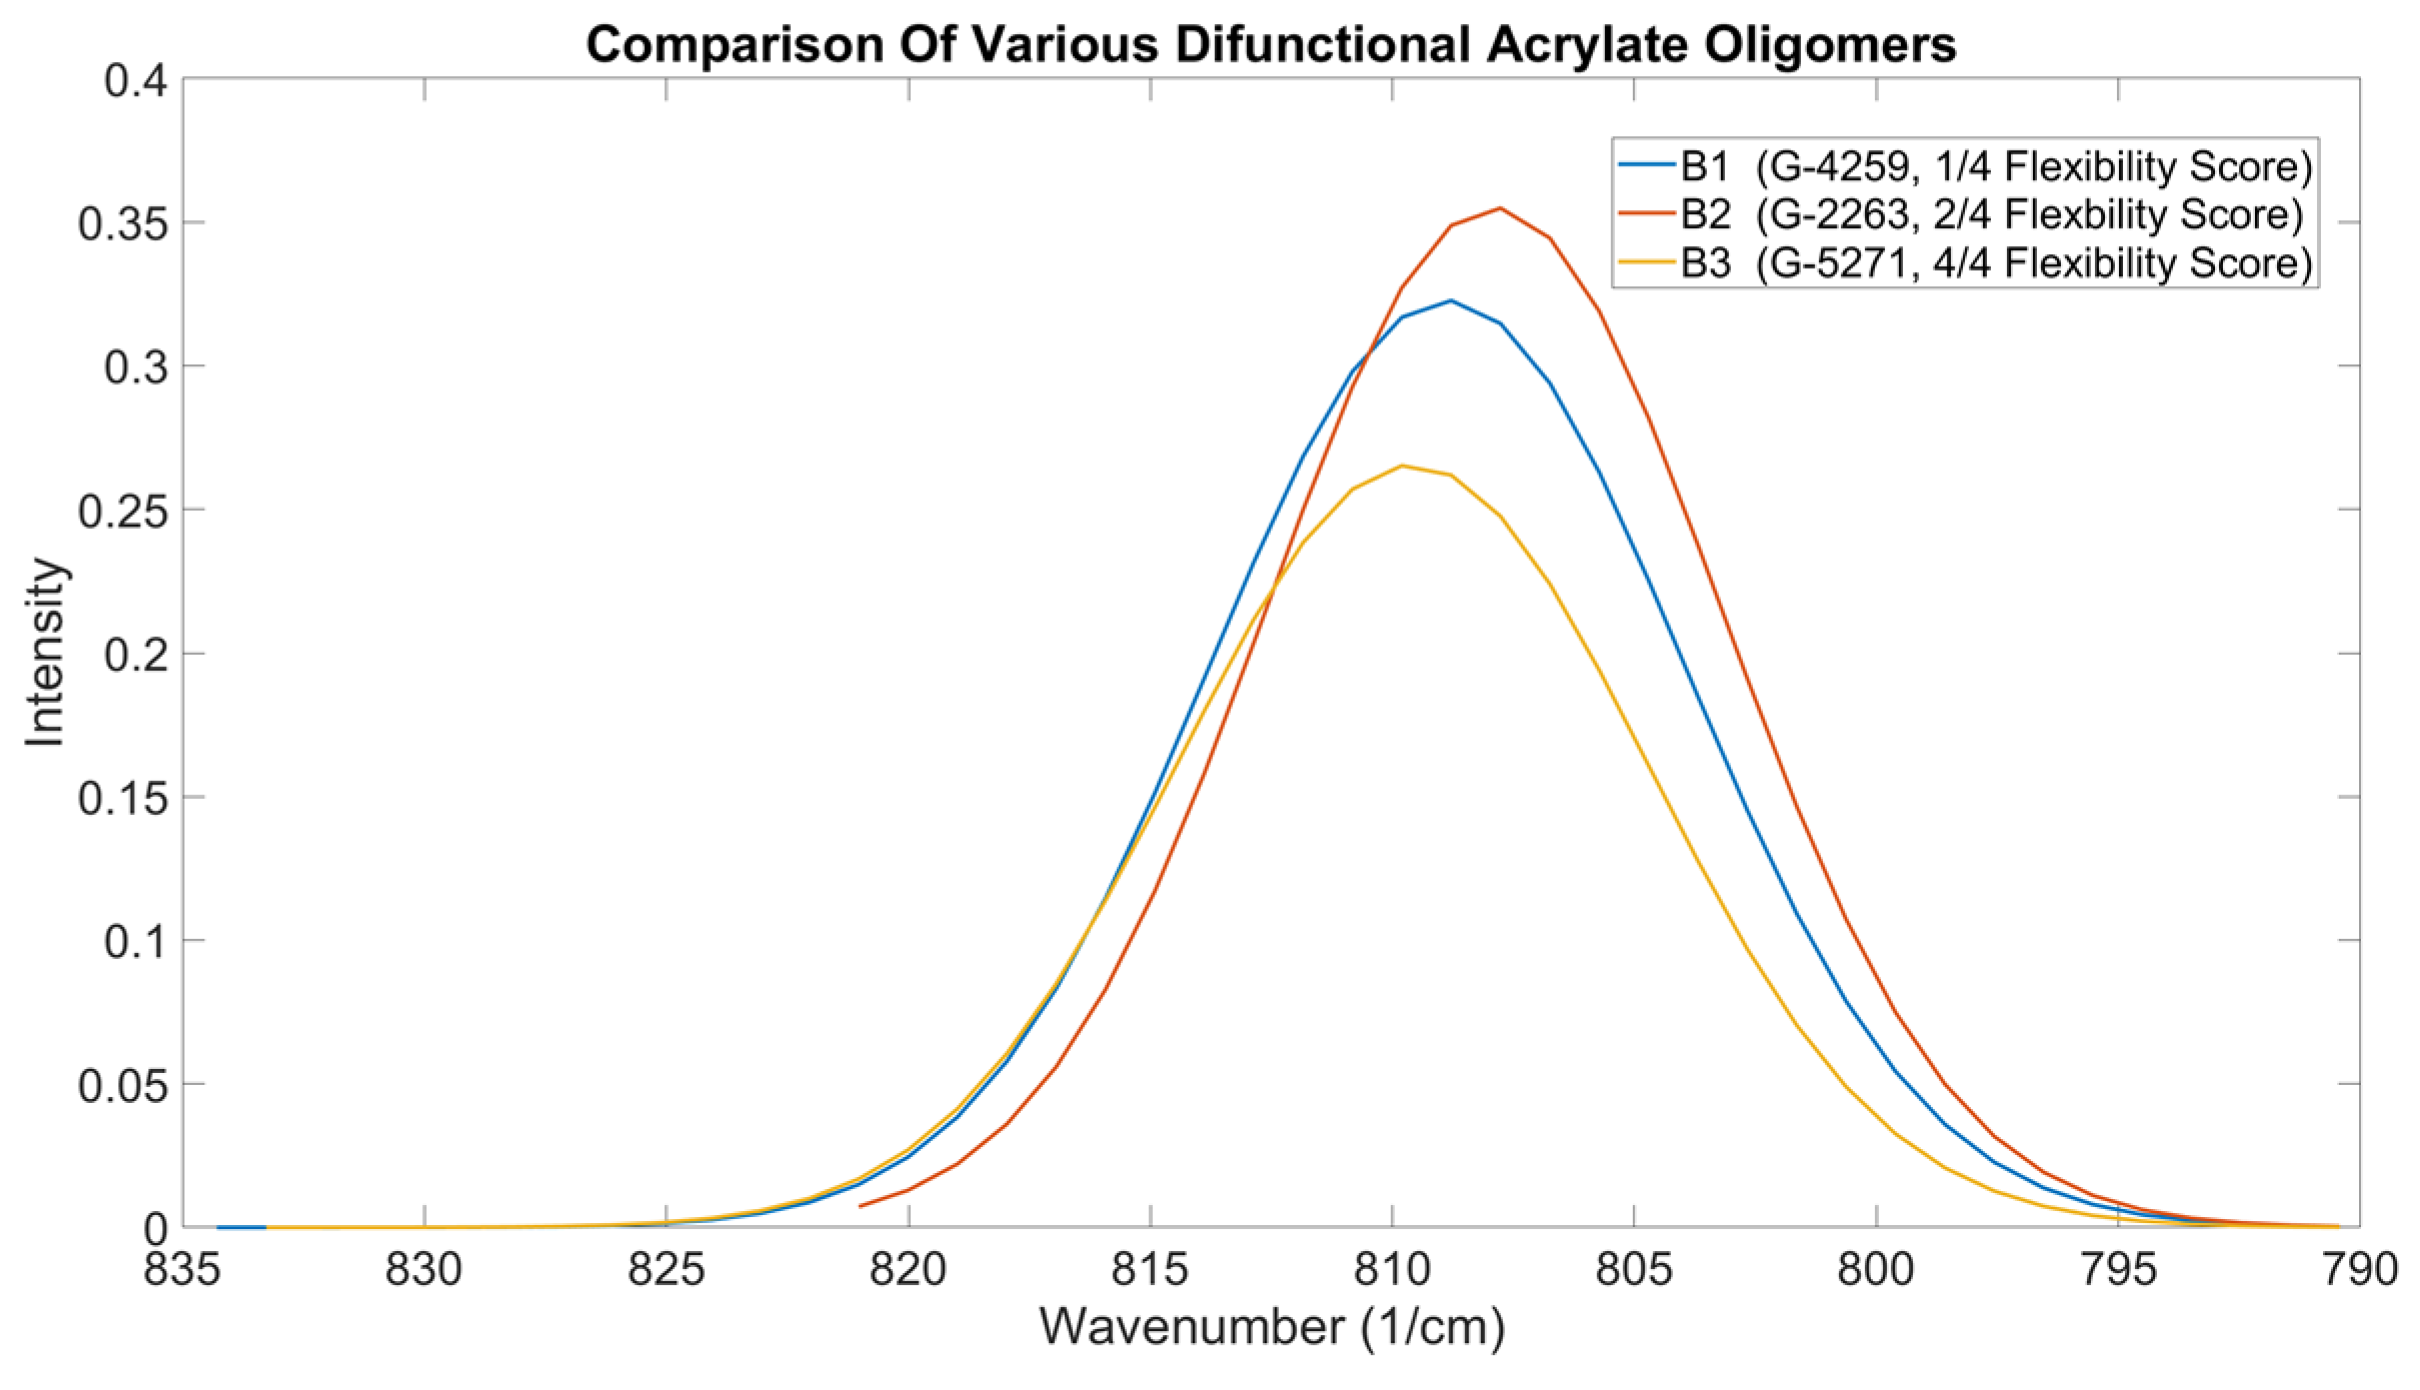
G-2263, having the highest OMSP area, also presented the highest conversion; however, G-5271 was expected to have the second highest conversion based on the OMSP area, but the conversion was significantly lower. When assessing the mechanical properties of the various formulations, the mechanical properties of G-2263 were the highest, correlating with the high OMSP area and conversion [60]. However, G-5271 showed significantly low mechanical strength and Youngs’ Modulus. When analyzing the stiff oligomers, the OMSP was again able to correlate to the conversion and mechanical properties, but when assessing flexible components, the subsequent mechanical properties were not detectable. Amine acrylates utilize hydrogen bonding and their low conversion nature for flexibility [61]. Amine functional groups are not considered in the OMSP analysis, and therefore, variations in mechanical behavior could not be preempted. The aspect ratio of the various formulations, however, correlated with the properties, showing the broader B.3 curve to have inferior mechanical strength compared to narrower peak formulations.
Table 7.
Printed Specimen Results Of Formulations Containing Oligomers Of Different Flexibilities
| ID | Viscosity (mPa.s) |
Conversion (%) |
σ | UTS (MPa) |
σ | E | σ | Elongation (%) |
σ | Hardness | σ |
|---|---|---|---|---|---|---|---|---|---|---|---|
| B.1 | 103.00 | 22.55 | 4.57 | 35.92 | 4.85 | 342.59 | 41.67 | 15.20 | 0.81 | 78.64 | 3.02 |
| B.2 | 267.00 | 59.32 | 4.75 | 37.51 | 2.44 | 391.49 | 12.29 | 13.92 | 1.99 | 82.20 | 4.97 |
| B.3 | 113.00 | 16.11 | 2.04 | 3.56 | 0.52 | 56.20 | 7.31 | 8.69 | 0.88 | 54.84 | 1.99 |
Detection of Excess Diluent
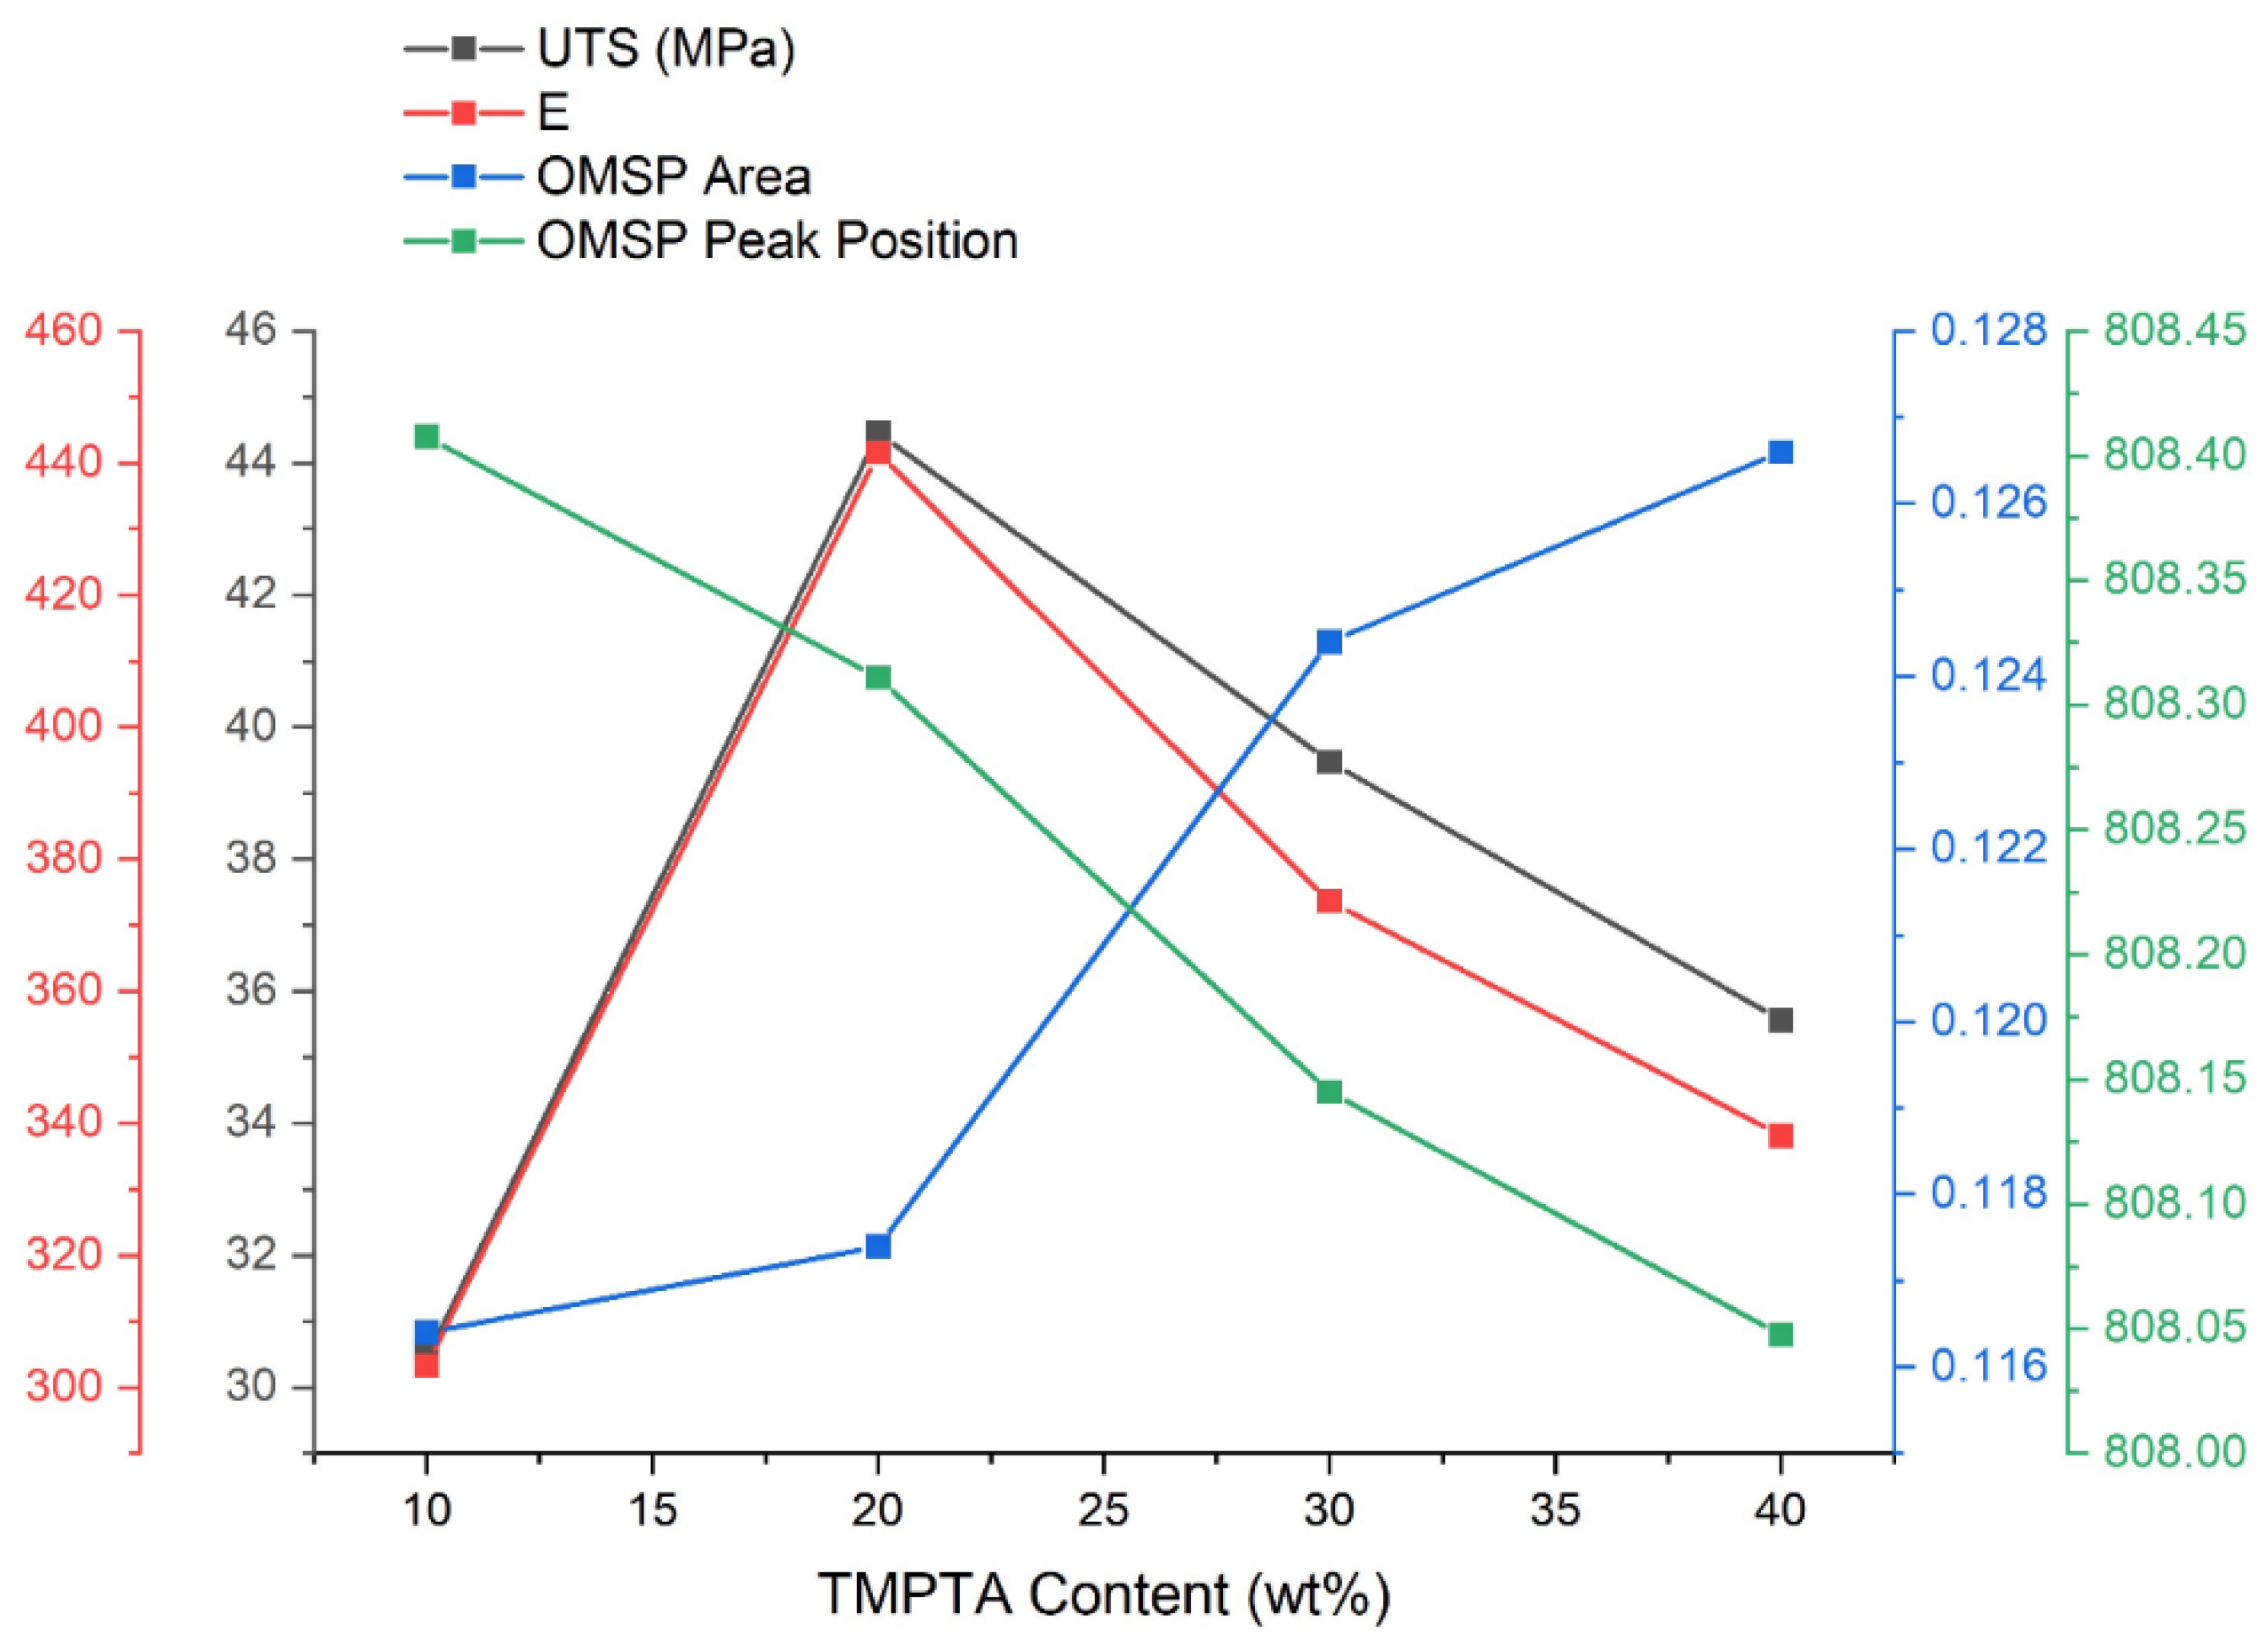
A challenge of photoresin formulation is the identification of excess materials [7]. A series of acrylate formulations were developed and tested with incrementally increasing amounts of TMPTA. The OMSP outputs were compared to the resultant formulation properties. With the increasing amounts of TMPTA, there was an observation of a gradual change in the peak position, resulting in the change of the formulation’s pseudo functionality from a difunctional energy state to a trifunctional energy state. TMPTA has a higher functionality and lower molecular weight than PEG200DA, making it a component that provides a higher density of acrylate functional groups [37]. The OMSP also reflects this with the OMSP area with increasing TMPTA content. The decrease in aspect ratio with an increase in functionality, seen when comparing various functionality home acrylates, can also be seen in this study, where increasing TMPTA content lowered the aspect ratio of the system.
The mechanical properties did not follow the same trends seen in the OMSP (Figure 16). The tensile results suggest the formulations were negatively impacted by excessive acrylate functional groups, resulting in a reduction of tensile performance in concentrations exceeding 20 wt%. Despite the decline in mechanical properties, the lowest mechanical performance was still observed in the lowest TMPTA content. In a study by Pongwisuthiruchte et al. [62], the same observation was made, where an improvement of polymer properties was initially observed with the introduction of poly(ethylene glycol) dimethacrylate as a reactive diluent in their photocurable study. The authors reported a decline in performance when the diluent was in excess, believed to be as a resin of excessive crosslinking causing embrittlement of the polymer. The same effect can be seen in other studies [7,63,64].
Table 8.
Printed Specimen Results Of Comparing Formulations Of Different TMPTA Concentrations
| ID | Viscosity (mPa.s) |
UTS (MPa) |
σ | E | σ | Elongation (%) |
σ | Hardness | σ |
|---|---|---|---|---|---|---|---|---|---|
| D.1 | 428 | 35.56 | 1.90 | 338.12 | 18.76 | 16.36 | 1.67 | 82.60 | 0.89 |
| D.2 | 303 | 39.47 | 3.19 | 373.61 | 32.72 | 18.57 | 0.68 | 79.80 | 1.64 |
| D.3 | 248 | 44.45 | 2.84 | 441.59 | 30.13 | 18.23 | 1.33 | 80.70 | 2.13 |
| D.4 | 171 | 30.45 | 0.82 | 303.29 | 9.56 | 17.36 | 0.70 | 81.80 | 0.45 |
Figure 16.
The Effect Of Changing TMPTA Content On The Tensile UTS and Youngs’ Modulus Of The Green Body
Figure 16.
The Effect Of Changing TMPTA Content On The Tensile UTS and Youngs’ Modulus Of The Green Body
Detection of Non-reactive Additives
In addition to acrylates and photoinitiator that make up photoresin formulations [65], additional materials can be added to provide additional functionality to the printed composites [66]. Particle agglomeration is a challenge encountered when heterogenous photoresin systems [67]. Dispersants have been used in the literature to help better disperse solids in the formulation [5,68,69]. In dispersant studies, dimensional accuracy has been one of the characterization methods that aid in the optimization of the slurry formulation [70]. Although dimensional accuracy has been linked to shrinkage as a result of polymerization [71], there has not been a study into how the dispersant added to the photoresin impacts the reactive state of the photoresin phase. Different dispersants have varying acid values [72]. With the increase in system acidity, the reactivity of the photoresin system was expected to increase [73].
DISPERBYK-111 (BYK-Chemie GmbH, Wesel, Germany) is a polymeric wetting and dispersing additive used in additive manufacturing applications [74]. This dispersant was added to the photoresin formulation in different quantities. The void caused by the dispersant was studied using the OMSP area, and changes in reactivity were studied with the peak position and validated with ATR conversion. The results of this study show that despite the dispersant reducing the abundance of acrylate functional groups, there was a shift in the peak position to a more reactive energy state with increasing dispersant content, along with a gradual increase in the conversion of the formulation. The presence of dispersant causes this increase in reactivity and plays a contributing factor to dimensional accuracy challenges in VPP [75].
Table 9.
Impact of dispersant amount on the peak position and conversion of the photoresin
| Dispersant amount | Peak Position | Conversion |
|---|---|---|
| 1 | 808.91 | 40.18 |
| 3 | 808.93 | 52.71 |
| 5 | 809.70 | 57.896 |
Simulation Of Photoresin Formulations
In the development of the OMSP principle code, datasets of acrylate formulations and components were fitted to Gaussian and Lorentzian models and the Akaike Information Criterion was used to compare the peak shape. It was found that the curve of interest for OMSP adopted a Gaussian fit type, allowing for the development of the computerized mixing model. The Gaussian mixing model is a methodology that combines a series of Gaussian plots through a summation methodology [76].
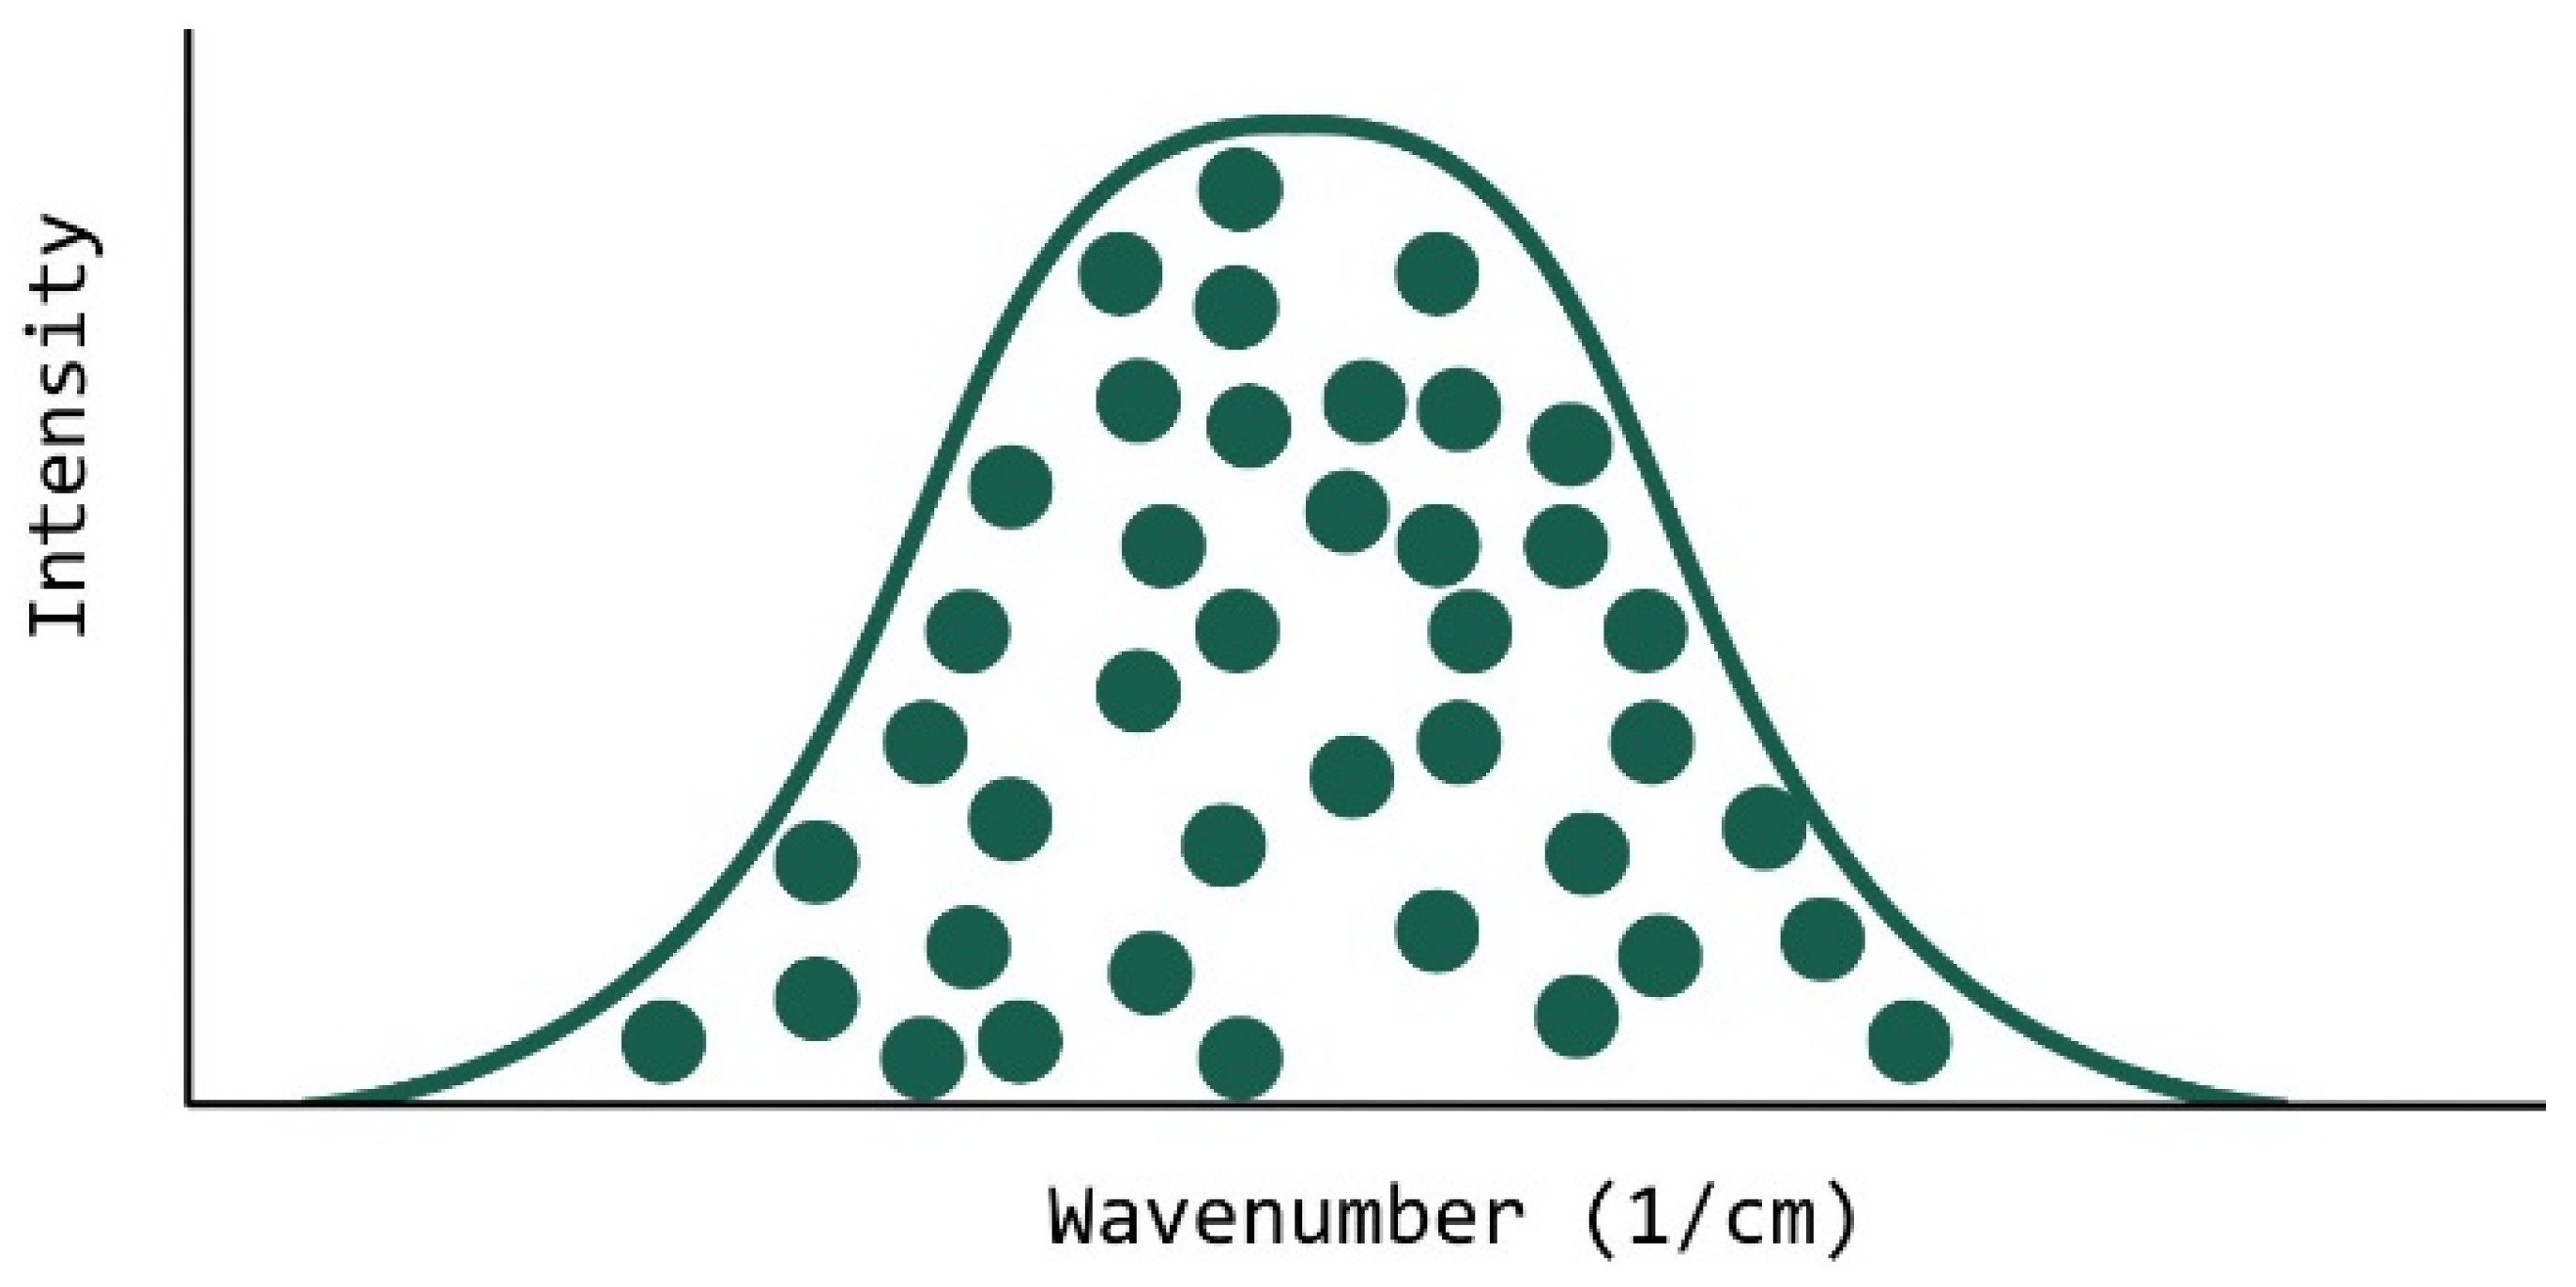
The idea behind the use of the Gaussian mixing model was based on the hypothesis that an acrylate system can be statistically seen as a general population of acrylate molecules vibrating at their frequency (within the typical range for the ATR-FTIR peak of interest). Naturally, the population distributes across the ATR-FTIR peak position range in a normal distribution (Figure 17). This is true as all results run on the OMSP code showed a likeness to Gaussian fit.
Figure 17.
Illustration Of How OMSP Analyses Formulations. Each Ball Represents An Alkene Bond Vibrating At Its Energy State, Taking Up The Shape Of A Normal Distribution (Gaussian Curve).
Figure 17.
Illustration Of How OMSP Analyses Formulations. Each Ball Represents An Alkene Bond Vibrating At Its Energy State, Taking Up The Shape Of A Normal Distribution (Gaussian Curve).
However, when applying the Gaussian mixing model to this case, the formulation being analyzed by the OMSP code is, in fact, a series of clusters, where each cluster is an acrylate component used to make up the formulation. As each component has its Gaussian distribution as a result of how the OMSP code sorts the raw data, therefore, the Gaussian mixing model is heavily simplified because the model no longer needs to identify clusters and sort them into Gaussian distributions.
Figure 18.
Two Approaches Of Looking At A Formulation OMSP Curve. (Left) Looks At The System As Clusters Of Energy States Belonging To A Particular Component. (Right) Looks At Each Component As An Individual Gaussian Curve Contained Within The Overall Formulation Gaussian Curve.
Figure 18.
Two Approaches Of Looking At A Formulation OMSP Curve. (Left) Looks At The System As Clusters Of Energy States Belonging To A Particular Component. (Right) Looks At Each Component As An Individual Gaussian Curve Contained Within The Overall Formulation Gaussian Curve.
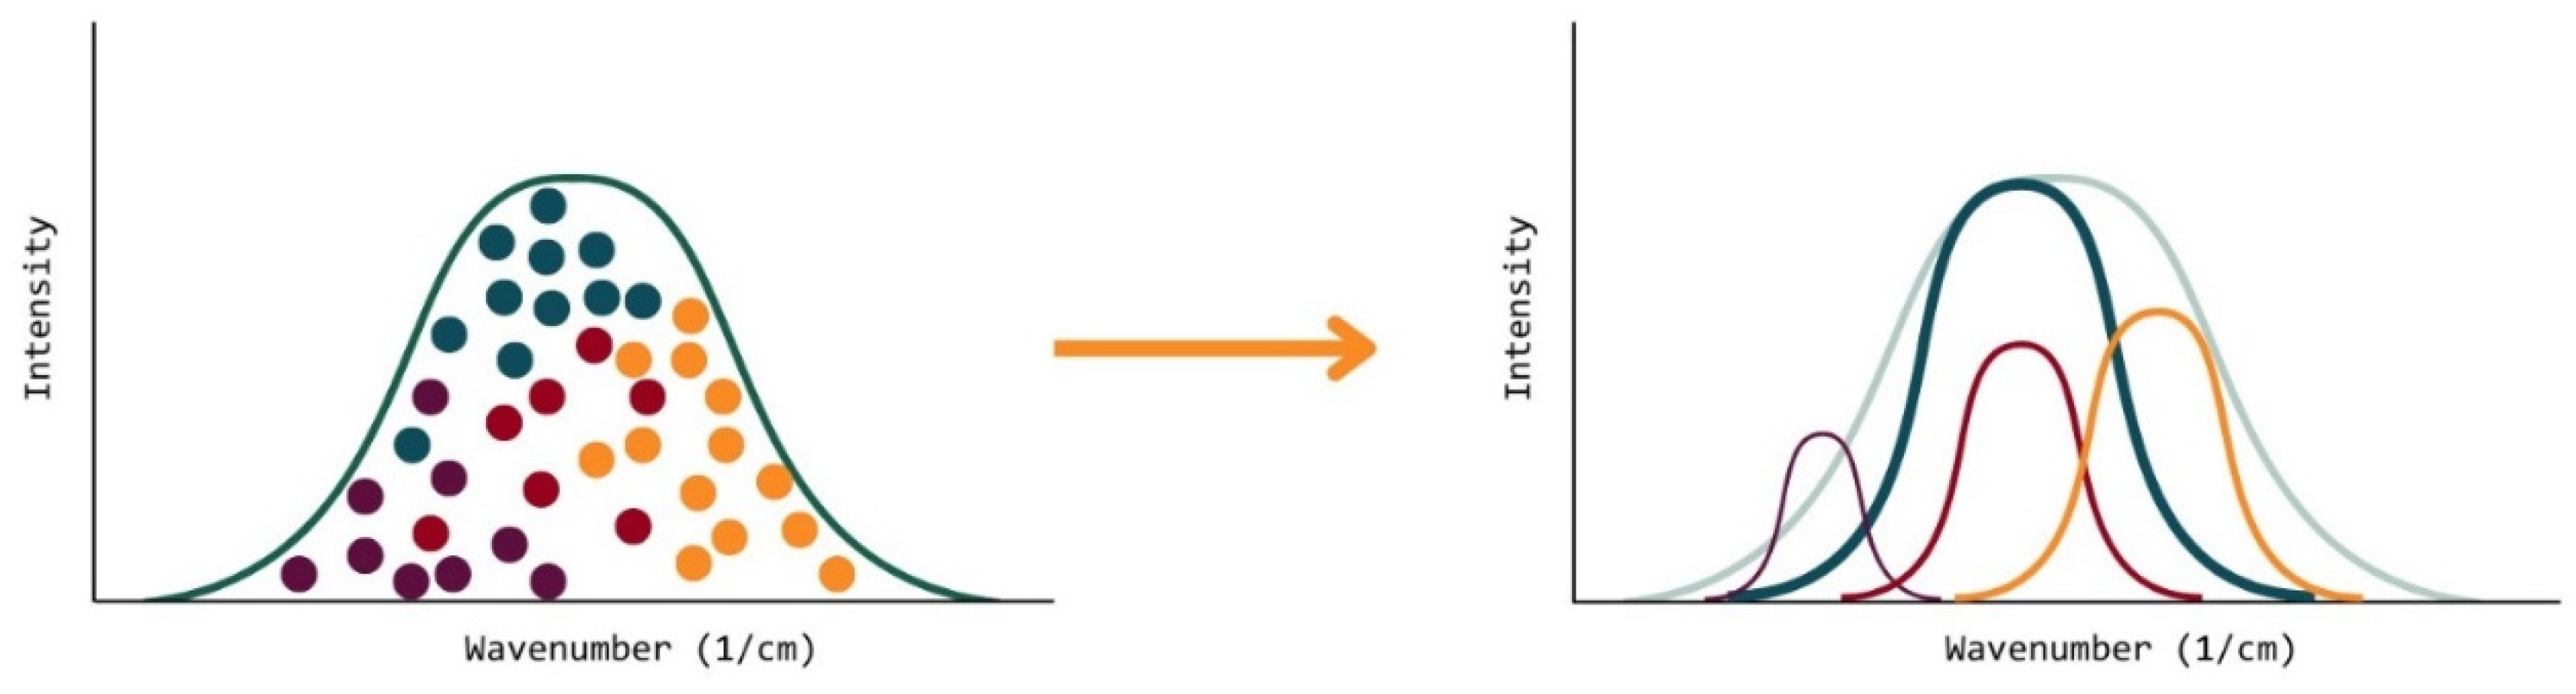
As each acrylate used to make up a photoresin formulation can be viewed as a cluster within a population of monomers [77], the individual Gaussian can be combined following a summation methodology [26]. The OMSP code can be made to represent the formulation as a wt% of each component, as the addition of each component OMSP at different wt% causes a modification to the shape of the Gaussian fit until it adopts the desired formulation shape. Therefore, formulation mixing can be computerized, reducing the need for the physical mixing of materials and saving time and resources.
In doing so, the influence of different components could be studied and decisions made for rigid formulation development without the need to physically develop formulations. As a result, a mathematical model was developed, databasing the OMSP peaks for various oligomers and monomer acrylates and used to perform Gaussian mixing.
Various formulations were made experimentally, and the OMSP was taken for each one. The coefficient of determination (R2) was used to analyze the Gaussian mixed samples to the formulation made to judge how well the fit was to the experimental data (Table 11, “Gaussian Mix R2”). The same formulations were created through the code, and the peaks were compared through the criteria of determination (R2). The results shown in Table 11 are a very close fit to the experimental results for every formulation considered. The R2 error found between the experimental data and the Gaussian mixed data ranged from 0.8433- 0.9964. The worst fits in the dataset came from the methacrylate-containing formulations, where inaccuracies in OMSP were already identified with this functional group type. With the exclusion of the methacrylate-containing data, the R2 ranged from 0.9406-0.9964 amongst the remaining 20 formulations. The results of this study presented the potential for the computerization of formulation development and the potential to be a key parameter in the use of Artificial intelligence in VPP.
Summary of OMSP’s Capabilities
OMSP is a characterization tool that uses ATR-FTIR to analyze the 810 cm-1 peak and provide unique quantitative characteristics to acrylates to describe their potential reactivity. OMSP uses a simple graphical and tabular output to summarize the complex chemistry behind various acrylate systems. Due to the fact that each acrylate material has a Gaussian curve that defines its reactive state, it is possible to store the Gaussian curves in a database, allowing for the data to be recalled and used to simulate the mixing of acrylates with high similarity to real-life results. This innovation has provided more clarity in the design and decision-making process surrounding VPP and photoresin design, providing the following benefits and opportunities for advancement for researchers, developers and manufacturers of acrylate-related works:
Researchers: A clear evaluation of formulations can be made in the literature to indicate how the changes to the acrylate system being studied are really influencing the results, allowing for the development of photoresin formulations with more confidence. The availability of quantitative data will allow researchers to directly compare their formulations across literature in a less subjective way. Simulation of formulations can be made in comparison to time consuming manual mixing, allowing for more variations to be added to literature via simulation, combined with physical experimentation to provide more information and data in ways not previously feasible. Researchers and developers can also benefit from the high precision of OMSP for use as input parameters for artificial intelligence.
Manufacturers: OMSP data can be released with acrylate manufacturer product lines, providing the detail customers desire without having to divulge photoresin compositions, protecting the manufacturer’s intellectual property yet satisfying the needs of the customers. OMSP can be used to evaluate existing product lines and assess gaps in performance for the potential to develop novel acrylates and tailor product lines to better suit application and performance requirements.
OMSP changes the way in which monomers are consumed and polymers are produced, providing a waste minimization route to formulation design in line with the World Health Organization’s sustainable development goal 12: responsible consumption and production [78].
Future Developments
OMSP has shown its capabilities and value in the development and characterization of photoresin components and formulations. OMSP currently being limited solely to the crosslinking capabilities of acrylate materials, but this can be expanded with future studies, including the development of a methacrylate system and the identification of additional functional groups that present other material behavior, such as amines groups causing flexibility.
With further research, OMSP can become an extensive database of UV-curable material reactivity data, allowing for the full digitalization of photoresin development. Its place in innovative technologies can make it possible for OMSP to be used as a parameter to aid the prediction of ideal formulation performance with the use of artificial intelligence. Additionally, with the use of algorithms such as the Levenberg-Marquardt algorithm and additional parameters, OMSP can be used to break down photoresin formulations into their components, aiding researchers in understanding and identifying photoresin systems as well as component substitutions that yield the same formulation results
5. Conclusions
OMSP is an exciting, novel analysis tool for acrylate characterization, which provides valuable information on the influence components have on the formulation, hence helping scientists and engineers to design the right photoresin for their specific applications and needs. OMSP is based on the analysis of the 810 cm-1 peak to determine the peak position and assign it to acrylate functionality to both monomers and mixed acrylate formulations (pseudo functionality); aspect ratio to assign the distribution of reactivity within an acrylate sample; and peak area to determine the density of alkene bonds in the sample.
This method is currently limited to acrylates, but with further research, the possibilities of OMSP can be expanded. The experiments undertaken in this study have shown a consistent trend in OMSP’s ability to characterize various acrylate monomers, oligomers and photoresin formulations. The scope of OMSP is currently limited to acrylates; however, there is potential for the further development of OMSP to be applicable to a range of photo-polymerizable photoresin components. The following conclusions were drawn from the study:
- Acrylate functionality can be linked to unique wavenumbers: The study of various functionality monomers showed that not all acrylates have the same reactivity. The higher the functionality of the acrylates, the lower the vibrational energy attributed to ϖ bond delocalization. In doing so, a peak position could be assigned to different functionalities, making it possible for photoresin formulations to be assigned a pseudo functionality.
- The abundance of alkenes for polymerization: Through the assessment of the peak area under the spectral peak used to identify alkene bonds specific to acrylate functional groups, the concentration of alkene bonds available for polymerization could be identified. The method could detect the impact of molecular complexity and voids caused by non-acrylate components, giving insight when studying the impact of filler on the conversion capabilities of a mixture.
- Shift in reactivity: The study was able to show how the addition of additives, such as dispersants of high acid value, impacted the reactivity of the photoresin through the shift in peak position and the subsequent increase in polymerization, validated through a conversion study.
- Computerized Mixing: The application of Gaussian mixing to this area of study was successful, allowing for the computerized mixing of acrylate formulations, showing a good likeness to experimentally mixed formulations with an average R2 of 0.9673 standard deviations of 0.04342), for all formulations, including ones containing Methacrylates and non-acrylate reactive monomers.
6. Patents
This section is not mandatory but may be added if there are patents resulting from the work reported in this manuscript.
Table 10.
Table of Formulations
| ID | UA | Primary | AA | EA | UA | DPHA | HDDA | DPGDA | NPG(PO)2DA | IBOMA | IBOA | CTFA | ACMO | IDA | PEG200DA | PEG300DA | TMPTA | TMPTMA | BYK 111 |
|---|---|---|---|---|---|---|---|---|---|---|---|---|---|---|---|---|---|---|---|
| M.1 | 0.5 | 0.3 | 0.2 | ||||||||||||||||
| M.2 | 0.5 | 0.3 | 0.2 | ||||||||||||||||
| M.3 | 0.4 | 0.1 | 0.5 | ||||||||||||||||
| M.4 | 0.4 | 0.1 | 0.5 | ||||||||||||||||
| C.1 | 0.8 | 0.2 | |||||||||||||||||
| C.2 | 0.7 | 0.3 | |||||||||||||||||
| C.3 | 0.6 | 0.4 | |||||||||||||||||
| C.4 | 0.6 | 0.4 | |||||||||||||||||
| C.5 | 0.5 | 0.5 | |||||||||||||||||
| C.6 | 0.8 | 0.2 | |||||||||||||||||
| C.7 | 0.7 | 0.3 | |||||||||||||||||
| C.8 | 0.6 | 0.4 | |||||||||||||||||
| C.9 | 0.6 | 0.4 | |||||||||||||||||
| C.10 | 0.5 | 0.5 | |||||||||||||||||
| A.1 | 0.4 | 0.1 | 0.5 | ||||||||||||||||
| A.2 | 0.4 | 0.1 | 0.5 | ||||||||||||||||
| B.1 | 0.5 | 0.1 | 0.4 | ||||||||||||||||
| B.2 | 0.5 | 0.1 | 0.4 | ||||||||||||||||
| B.3 | 0.5 | 0.1 | 0.4 | ||||||||||||||||
| D.1 | 0.5 | 0.1 | 0.4 | ||||||||||||||||
| D.2 | 0.5 | 0.2 | 0.3 | ||||||||||||||||
| D.3 | 0.5 | 0.3 | 0.2 | ||||||||||||||||
| D.4 | 0.5 | 0.4 | 0.1 | ||||||||||||||||
| E.1 | 0.5 | 0.1 | 0.4 | 1 | |||||||||||||||
| E.2 | 0.5 | 0.1 | 0.4 | 3 | |||||||||||||||
| E.3 | 0.5 | 0.1 | 0.4 | 5 | |||||||||||||||
| F.1 | 0.9 | 0.1 | |||||||||||||||||
| F.2 | 0.8 | 0.2 | |||||||||||||||||
| F.3 | 0.64 | 0.36 | |||||||||||||||||
| F.4 | 0.56 | 0.44 | |||||||||||||||||
| F.5 | 0.50 | 0.50 | |||||||||||||||||
| F.6 | 0.45 | 0.55 | |||||||||||||||||
| F.7 | 0.41 | 0.59 | |||||||||||||||||
| F.8 | 0.29 | 0.71 | |||||||||||||||||
| F.9 | 0.20 | 0.80 |
Table 11.
Average OMSP Output Of Formulations In This Study
| ID | Gaussian Mix R2 | OMSP Area | σ | Peak Position | σ | Aspect Ratio | σ | Pseudo Functionality | Pseudo Area | σ |
| A.1 | 0.9882 | 0.1435 | 0.0028 | 808.4785 | 0.0263 | 74.5632 | 0.9766 | 2.0 | 0.0776 | 0.0012 |
| A.2 | 0.9406 | 0.1354 | 0.0001 | 808.7328 | 0.0066 | 77.7593 | 0.1531 | 2.0 | 0.0737 | 0.0002 |
| B.1 | 0.9933 | 0.1408 | 0.0045 | 808.9115 | 0.0793 | 41.9378 | 0.6693 | 2.0 | 0.0811 | 0.0022 |
| B.2 | 0.9901 | 0.1796 | 0.0007 | 807.9112 | 0.0153 | 26.1247 | 0.0376 | 3.0 | 0.1355 | 0.0006 |
| B.3 | 0.9848 | 0.1616 | 0.0001 | 809.5891 | 0.0002 | 85.8764 | 0.0564 | 1.0 | 0.0992 | 0.0001 |
| C.1 | 0.9926 | 0.0853 | 0.0001 | 808.9715 | 0.0040 | 19.0611 | 0.0426 | 2.0 | 0.0474 | 0.0001 |
| C.2 | 0.9932 | 0.0944 | 0.0002 | 808.9818 | 0.0066 | 55.4130 | 0.1660 | 2.0 | 0.0524 | 0.0001 |
| C.3 | 0.9943 | 0.1048 | 0.0002 | 809.0262 | 0.0061 | 100.2605 | 0.8498 | 2.0 | 0.0584 | 0.0001 |
| C.4 | 0.9955 | 0.1119 | 0.0002 | 809.0477 | 0.0077 | 140.3469 | 6.1436 | 2.0 | 0.0626 | 0.0001 |
| C.5 | 0.9963 | 0.1206 | 0.0002 | 809.0362 | 0.0081 | 94.6027 | 121.0432 | 2.0 | 0.0674 | 0.0002 |
| C.6 | 0.9750 | 0.0712 | 0.0001 | 809.2512 | 0.0100 | 112.4926 | 123.6563 | 2.0 | 0.0391 | 0.0001 |
| C.7 | 0.9538 | 0.0690 | 0.0002 | 809.5008 | 0.0016 | 148.9019 | 126.0531 | 1.0 | 0.0386 | 0.0002 |
| C.8 | 0.9152 | 0.0683 | 0.0001 | 809.7751 | 0.0097 | 236.3868 | 24.9293 | 1.0 | 0.0393 | 0.0000 |
| C.9 | 0.8231 | 0.0827 | 0.0006 | 809.7850 | 0.0100 | 110.0589 | 16.7545 | 1.0 | 0.0470 | 0.0004 |
| C.10 | 0.8803 | 0.0647 | 0.0002 | 810.0170 | 0.0071 | 248.5165 | 317.9802 | 1.0 | 0.0381 | 0.0002 |
| D.1 | 0.9963 | 0.1266 | 0.0024 | 808.0475 | 0.0238 | 43.3092 | 45.8575 | 3.0 | 0.0955 | 0.0017 |
| D.2 | 0.9964 | 0.1244 | 0.0042 | 808.1450 | 0.0231 | 48.5235 | 25.9756 | 3.0 | 0.0946 | 0.0033 |
| D.3 | 0.9933 | 0.1174 | 0.0012 | 808.3110 | 0.0379 | 75.0845 | 16.1846 | 2.5 | 0.0761 | 0.0154 |
| D.4 | 0.9943 | 0.1164 | 0.0002 | 808.4077 | 0.0975 | 91.6005 | 4.6589 | 2.0 | 0.0683 | 0.0055 |
| E.1 | 0.1349 | 0.0004 | 808.9072 | 0.0086 | 43.4779 | 0.0296 | 2.0 | 0.0777 | 0.0004 | |
| E.2 | 0.1337 | 0.0001 | 808.9324 | 0.0023 | 43.9323 | 0.0099 | 2.0 | 0.0771 | 0.0001 | |
| E.3 | 0.0945 | 0.0019 | 809.6979 | 0.0151 | 30.0811 | 14.6260 | 1.0 | 0.0579 | 0.0011 | |
| F.1 | 0.99133 | 0.1698 | 0.0002 | 806.5943 | 0.0028 | 4.6328 | 0.5158 | 5.0 | 0.1451 | 0.0003 |
| F.2 | 0.97242 | 0.1812 | 0.0004 | 807.1414 | 0.0025 | 18.5927 | 18.7931 | 4.0 | 0.1318 | 0.0003 |
| F.3 | 0.97845 | 0.1860 | 0.0001 | 807.4527 | 0.0002 | 20.7377 | 12.5333 | 3.0 | 0.1371 | 0.0002 |
| F.4 | 0.97376 | 0.1893 | 0.0003 | 807.6646 | 0.0016 | 32.6495 | 0.0931 | 3.0 | 0.1407 | 0.0001 |
| F.5 | 0.96759 | 0.1933 | 0.0011 | 807.8435 | 0.0037 | 35.2491 | 0.0228 | 3.0 | 0.1447 | 0.0007 |
| F.6 | 0.96651 | 0.1943 | 0.0001 | 808.0486 | 0.0165 | 55.0680 | 26.1248 | 3.0 | 0.1470 | 0.0001 |
| F.7 | 0.96648 | 0.1955 | 0.0012 | 808.1543 | 0.0023 | 15.4292 | 0.1092 | 3.0 | 0.1486 | 0.0009 |
| F.8 | 0.96725 | 0.1973 | 0.0002 | 808.5364 | 0.0049 | 35.6670 | 25.1628 | 2.0 | 0.1043 | 0.0000 |
| F.9 | 0.97403 | 0.1990 | 0.0004 | 808.8632 | 0.0069 | 49.4474 | 41.8887 | 2.0 | 0.1084 | 0.0002 |
| M.1 | 0.9958 | 0.1663 | 0.0002 | 807.2729 | 0.0022 | 28.0230 | 0.0205 | 3.0 | 0.1202 | 0.0001 |
| M.2 | 0.9682 | 0.1784 | 0.0033 | 807.6898 | 0.0436 | 113.8961 | 18.4272 | 3.0 | 0.1321 | 0.0021 |
| M.3 | 0.9931 | 0.1248 | 0.0008 | 808.7009 | 0.0028 | 87.9753 | 4.2273 | 2.0 | 0.0674 | 0.0004 |
| M.4 | 0.8433 | 0.1244 | 0.0004 | 809.1787 | 0.0079 | 128.7159 | 7.0550 | 2.0 | 0.0720 | 0.0003 |
Supplementary Materials
The following supporting information can be downloaded at the website of this paper posted on Preprints.org.
Author Contributions
Conceptualization, L.O. .; methodology, L.O.; validation, L.O. and FT; formal analysis, L.O.; investigation, L.O, and FT resources, L.O.; data curation, L.O. and F.T; writing—original draft preparation, L.O.; writing—review and editing, F.T, F.S and E.S.; visualization, L.O.; supervision, E.S.; project administration, L.O. All authors have read and agreed to the published version of the manuscript.
Funding
This research received no external funding.
Institutional Review Board Statement
Not applicable.
Data Availability Statement
The research data can be made available upon request from the corresponding author.
Acknowledgements
The authors thankfully acknowledge the support received from the AdditiveManufacturing Centre of Excellence, Derby, UK.
Conflicts of Interest
The authors declare no conflict of interest. The funders had no role in the design of the study; in the collection, analyses, or interpretation of data; in the writing of the manuscript; or in the decision to publish the results.
References
- Lakkala P, Munnangi SR, Bandari S, Repka M (2023) Additive manufacturing technologies with emphasis on stereolithography 3D printing in pharmaceutical and medical applications: A review. Int J Pharm X 5:100159. [CrossRef]
- Melentiev R, Melentieva M, Yu N (2024) Top 10 directions in lithography 3D printing. Bioprinting 40:e00343. [CrossRef]
- Konov GA, Mazeeva AK, Masaylo D V., et al (2024) Exploring 3D printing with magnetic materials:Types, applications, progress, and challenges. Izvestiya Vuzov. Poroshkovaya Metallurgiya i Funktsional’nye Pokrytiya 18:6–19.
- Ozkan B, Sameni F, Bianchi F, et al (2022) 3D printing ceramic cores for investment casting of turbine blades, using LCD screen printers: The mixture design and characterization. J Eur Ceram Soc 42:658–671. [CrossRef]
- Zhang K, Xie C, Wang G, et al (2019) High solid loading, low viscosity photosensitive Al2O3 slurry for stereolithography based additive manufacturing. Ceram Int 45:203–208. [CrossRef]
- Qian C, Hu K, Lu Z, Li P (2021) Volume shrinkage and conversion rate of Al2O3 ceramic stereolithography suspension polymerized by ultraviolet light. Volume 267 267:. [CrossRef]
- Basar O, Veliyath VP, Tarak F, Sabet E (2023) A Systematic Study on Impact of Binder Formulation on Green Body Strength of Vat-Photopolymerisation 3D Printed Silica Ceramics Used in Investment Casting. Polymers (Basel) 15:3141. [CrossRef]
- Okoruwa L, Sameni F, Borisov P, Sabet E (2023) 3D Printing Soft Magnet: Binder Study for Vat Photopolymerization of Ferrosilicon Magnetic Composites. Polymers 2023, Vol 15, Page 3482 15:3482. [CrossRef]
- Kim HJ, Czech Z, Bartkowiak M, et al (2022) Study of UV-initiated polymerization and UV crosslinking of acrylic monomers mixture for the production of solvent-free pressure-sensitive adhesive films. Polym Test 105:107424. [CrossRef]
- Pathania A, Arya RK, Ahuja S (2017) Crosslinked polymeric coatings: Preparation, characterization, and diffusion studies. Prog Org Coat 105:149–162. [CrossRef]
- Hasa E, Stansbury JW, Guymon CA (2020) Manipulation of crosslinking in photo-induced phase separated polymers to control morphology and thermo-mechanical properties. Polymer (Guildf) 202:122699. [CrossRef]
- Choi WC, Lee WK, Ha CS (2019) Low-viscosity UV-curable polyurethane acrylates containing dendritic acrylates for coating metal sheets. J Coat Technol Res 16:377–385. [CrossRef]
- Feng X, Zhang R, Ren G, et al (2024) Vat photopolymerization-engaged fabrication of high-performance, complex Si3N4 implants under rapid debinding efficiency. Ceram Int 50:17646–17656. [CrossRef]
- Pirman T, Ocepek M, Likozar B (2021) Radical Polymerization of Acrylates, Methacrylates, and Styrene: Biobased Approaches, Mechanism, Kinetics, Secondary Reactions, and Modeling. Ind Eng Chem Res 60:9347–9367. [CrossRef]
- Vidakis N, Petousis M, Michailidis N, et al (2022) High-performance medical-grade resin radically reinforced with cellulose nanofibers for 3D printing. J Mech Behav Biomed Mater 134:105408. [CrossRef]
- Kaewpirom S, Kunwong D (2012) Curing behavior and cured film performance of easy-to-clean UV-curable coatings based on hybrid urethane acrylate oligomers. Journal of Polymer Research 19:1–12. [CrossRef]
- Daéid NN (2005) FORENSIC SCIENCES | Systematic Drug Identification. Encyclopedia of Analytical Science: Second Edition 471–480. [CrossRef]
- Binish MB, Binu P, Gopikrishna VG, Mohan M (2022) Potential of anaerobic bacteria in bioremediation of metal-contaminated marine and estuarine environment. Microbial Biodegradation and Bioremediation: Techniques and Case Studies for Environmental Pollution 305–326. [CrossRef]
- Chen Y, Zou C, Mastalerz M, et al (2015) Applications of Micro-Fourier Transform Infrared Spectroscopy (FTIR) in the Geological Sciences—A Review. International Journal of Molecular Sciences 2015, Vol 16, Pages 30223-30250 16:30223–30250. [CrossRef]
- De Aragão BJG, Messaddeq Y (2008) Peak separation by derivative spectroscopy applied to ftir analysis of hydrolized silica. J Braz Chem Soc 19:1582–1594. [CrossRef]
- Sadat A, Joye IJ (2020) Peak Fitting Applied to Fourier Transform Infrared and Raman Spectroscopic Analysis of Proteins. Applied Sciences 2020, Vol 10, Page 5918 10:5918. [CrossRef]
- Pereira SV, Colombo FB, De Freitas LAP (2016) Ultrasound influence on the solubility of solid dispersions prepared for a poorly soluble drug. Ultrason Sonochem 29:461–469. [CrossRef]
- ASTM (2022) Standard Test Method for Tensile Properties of Plastics 1. West Conshohocken.
- ASTM (2021) Standard Test Method for Rubber Property-Durometer Hardness 1. West Conshohocken.
- Sameni F, Ozkan B, Zarezadeh H, et al (2022) Hot Lithography Vat Photopolymerization 3D Printing: Vat Temperature vs. Mixture Design. Polymers 2022, Vol 14, Page 2988 14:2988. [CrossRef]
- Jain V, Biesinger MC, Linford MR (2018) The Gaussian-Lorentzian Sum, Product, and Convolution (Voigt) functions in the context of peak fitting X-ray photoelectron spectroscopy (XPS) narrow scans. Appl Surf Sci 447:548–553. [CrossRef]
- Ciris P (2023) Information theoretic evaluation of Lorentzian, Gaussian, Voigt, and symmetric alpha-stable models of reversible transverse relaxation in cervical cancer in vivo at 3 T. Magnetic Resonance Materials in Physics, Biology and Medicine 36:119–133. [CrossRef]
- Chai T, Draxler RR (2014) Root mean square error (RMSE) or mean absolute error (MAE)? -Arguments against avoiding RMSE in the literature. Geosci Model Dev 7:1247–1250. [CrossRef]
- Farooq MT, Jiarasuksakun T, Kaemawichanurat P (2023) Entropy analysis of nickel(II) porphyrins network via curve fitting techniques. Scientific Reports 2023 13:1 13:1–23. [CrossRef]
- Delgadoi ANHS, Young AM (2021) Methacrylate peak determination and selection recommendations using ATR-FTIR to investigate polymerization of dental methacrylate mixtures. PLoS One 16:. [CrossRef]
- Noor P, Khanmohammadi M, Roozbehani B, Bagheri Garmarudi A (2018) Evaluation of ATR-FTIR spectrometry in the fingerprint region combined with chemometrics for simultaneous determination of benzene, toluene, and xylenes in complex hydrocarbon mixtures. Monatsh Chem 149:1341–1347. [CrossRef]
- Ibnaouf KH, Elzupir AO, AlSalhi MS, Alaamer AS (2018) Influence of functional groups on the photophysical properties of dimethylamino chalcones as laser dyes. Opt Mater (Amst) 76:216–221. [CrossRef]
- Kannan PP, Karthick NK, Mahendraprabu A, et al (2017) Red/blue shifting hydrogen bonds in acetonitrile-dimethyl sulphoxide solutions: FTIR and theoretical studies. J Mol Struct 1139:196–201. [CrossRef]
- Edwards HGM, Vandenabeele P, Colomban P (2023) Theory of Raman Spectroscopy and Raman Instrumentation. 19–41. [CrossRef]
- Schlotter NE (1989) Raman Spectroscopy. Comprehensive Polymer Science and Supplements 469–497. [CrossRef]
- Dimitrova M, Sundholm D (2021) Current density, current-density pathways, and molecular aromaticity. Aromaticity: Modern Computational Methods and Applications 155–194. [CrossRef]
- Van de Voorde KM, Kozawa SK, Mack JA, Thompson CB (2024) Influence of Cross-Linker Functionality and Photoinitiator Loading on Network Connectivity and Actuation in 3D-Printed Model Thermosets. ACS Appl Polym Mater 6:3918–3929. [CrossRef]
- Torii H (2014) Delocalized electrons in infrared intensities. J Mol Struct 1056–1057:84–96. [CrossRef]
- Elliott JE, Lovell LG, Bowman CN (2001) Primary cyclization in the polymerization of bis-GMA and TEGDMA: a modeling approach to understanding the cure of dental resins. Dental Materials 17:221–229. [CrossRef]
- Lovell LG, Berchtold KA, Elliott JE, et al (2001) Understanding the kinetics and network formation of dimethacrylate dental resins. Polym Adv Technol 12:335–345. [CrossRef]
- Fei J, Rong Y, Du X, et al (2024) Vat photopolymerization printing of strong tear-resistance and stretchable polyurethane elastomer for highly sensitive strain sensors. Polym Compos 45:2615–2628. [CrossRef]
- Fugolin AP, Dobson A, Mbiya W, et al (2019) Use of (meth)acrylamides as alternative monomers in dental adhesive systems. Dent Mater 35:686. [CrossRef]
- Maruo Y, Yoshihara K, Irie M, et al (2022) Does Multifunctional Acrylate’s Addition to Methacrylate Improve Its Flexural Properties and Bond Ability to CAD/CAM PMMA Block? Materials 15:. [CrossRef]
- Drobny JG (2013) Electron Beam Processing of Commercial Polymers, Monomers, and Oligomers. Ionizing Radiation and Polymers 101–147. [CrossRef]
- Camargo IL de, Morais MM, Fortulan CA, Branciforti MC (2021) A review on the rheological behavior and formulations of ceramic suspensions for vat photopolymerization. Ceram Int 47:11906–11921. [CrossRef]
- Arici K, Altınoz DE, Cavusoglu M, Diken S (2023) Crystal structure, IR and NMR spectra of (E)-2 methoxy-4-(2-morpholinovinyl)phenol molecule and its DFT calculations. J Mol Struct 1275:134669. [CrossRef]
- Naka K (2014) Monomers, Oligomers, Polymers, and Macromolecules (Overview). Encyclopedia of Polymeric Nanomaterials 1–6. [CrossRef]
- RAHN GmbH RAHN USA Corp RAHN Trading RA (2023) MIRAMER M216 Technical Data Sheet Diluents. Zürich.
- RAHN GmbH RAHN USA Corp RAHN Trading RA (2023) MIRAMER M222 Technical Data Sheet Diluents. Zürich.
- Mauriello J, Maury R, Guillaneuf Y, Gigmes D (2023) 3D/4D Printing of Polyurethanes by Vat Photopolymerization. Adv Mater Technol 8:2300366. [CrossRef]
- Kobayashi M, Saitoh M, Ishida K, Yachi H (2005) Viscosity Properties and Molecular Structure of Lube Base Oil Prepared from Fischer-Tropsch Waxes. Journal of the Japan Petroleum Institute 48:365–372. [CrossRef]
- Hedrick JL, Trollsås M (2001) Hybrid Dendrimer Star-like Polymers. Encyclopedia of Materials: Science and Technology 3849–3859. [CrossRef]
- Cowman MK (2017) Hyaluronan and Hyaluronan Fragments. Adv Carbohydr Chem Biochem 74:1–59. [CrossRef]
- Chaikumpollert O, Yamamoto Y, Suchiva K, Kawahara S (2012) Mechanical properties and cross-linking structure of cross-linked natural rubber. Polymer Journal 2012 44:8 44:772–777. [CrossRef]
- Medellin A, Du W, Miao G, et al (2019) Vat photopolymerization 3d printing of nanocomposites: A literature review. J Micro Nanomanuf 7:. [CrossRef]
- Ballester-Bayarri L, Pascal A, Ayestaran J, et al (2024) 3D Printing of Vinylogous Urethane-Based Methacrylic Covalent Adaptable Networks by Vat Photopolymerization. ACS Appl Polym Mater 6:2594–2603. [CrossRef]
- RAHN GmbH RAHN USA Corp RAHN Trading RA (2019) GENOMER* 4259 Technical Data Sheet Urethane Acrylate. Zürich.
- RAHN GmbH RAHN USA Corp RAHN Trading RA (2019) GENOMER* 2263 Technical Data Sheet Epoxy Acrylate. Zürich.
- RAHN GmbH RAHN USA Corp RAHN Trading RA (2020) GENOMER* 5271 Technical Data Sheet Oligoamine. Zürich.
- Huang J, Fu P, Li W, et al (2022) Influence of crosslinking density on the mechanical and thermal properties of plant oil-based epoxy resin. RSC Adv 12:23048–23056. [CrossRef]
- Zou W, Lin X, Terentjev EM, et al (2021) Amine-Acrylate Liquid Single Crystal Elastomers Reinforced by Hydrogen Bonding. Advanced Materials 33:2101955. [CrossRef]
- Pongwisuthiruchte A, Aumnate C, Potiyaraj P (2024) Tailoring of Silicone Urethane Methacrylate Resin for Vat Photopolymerization-Based 3D Printing of Shape Memory Polymers. ACS Omega 9:2884–2895. [CrossRef]
- Pfaffinger M (2018) Hot Lithography – New Possibilities in Polymer 3D Printing. Optik & Photonik 13:99–101. [CrossRef]
- Mamba’udin A, Handayani M, Triawan F, et al (2023) Excellent Characteristics of Environmentally Friendly 3D-Printed Nasopharyngeal Swabs for Medical Sample Collection. Polymers 2023, Vol 15, Page 3363 15:3363. [CrossRef]
- Pagac M, Hajnys J, Ma QP, et al (2021) A Review of Vat Photopolymerization Technology: Materials, Applications, Challenges, and Future Trends of 3D Printing. Polymers 2021, Vol 13, Page 598 13:598. [CrossRef]
- Zhang K, Meng Q, Qu Z, He R (2024) A review of defects in vat photopolymerization additive-manufactured ceramics: Characterization, control, and challenges. J Eur Ceram Soc 44:1361–1384. [CrossRef]
- Liu DM (2000) Influence of dispersant on powders dispersion and properties of zirconia green compacts. Ceram Int 26:279–287. [CrossRef]
- Shen M, Fu R, Liu H, et al (2023) Photosensitive Si3N4 slurry with combined benefits of low viscosity and large cured depth for digital light processing 3D printing. J Eur Ceram Soc 43:881–888. [CrossRef]
- Sokola P, Kalina M, Smilek J, et al (2023) Kinetic stability and rheological properties of photosensitive zirconia suspensions for DLP printing. Ceram Int 49:18502–18509. [CrossRef]
- De Lisi M, Shu C, Attia UM, Essa K (2023) DLP of Translucent Alumina: In-Depth Investigation on Slurry Development and Debinding Regimes. Machines 11:321. [CrossRef]
- Li X, Su H, Dong D, et al (2024) New approach to preparing near zero shrinkage alumina ceramic cores with excellent properties by vat photopolymerization. J Mater Sci Technol 193:61–72. [CrossRef]
- Asada M, Tanaka H, Suwa Y, et al (2024) Improved pigment dispersibility in thick inks based on increased molecular dispersion of poorly water-soluble block copolymers. Dyes and Pigments 226:112140. [CrossRef]
- Yusa S ichi (2022) Development and application of pH-responsive polymers. Polymer Journal 2022 54:3 54:235–242. [CrossRef]
- Wang C, Gong H, Wei W, et al (2022) Vat photopolymerization of low-titanium lunar regolith simulant for optimal mechanical performance. Ceram Int 48:29752–29762. [CrossRef]
- Guven E, Karpat Y, Cakmakci M (2022) Improving the dimensional accuracy of micro parts 3D printed with projection-based continuous vat photopolymerization using a model-based grayscale optimization method. Addit Manuf 57:102954. [CrossRef]
- Wang Y, Chen W, Zhang J, et al (2011) Efficient volume exploration using the gaussian mixture model. IEEE Trans Vis Comput Graph 17:1560–1573. [CrossRef]
- Bilmes JA (1998) A Gentle Tutorial of the EM Algorithm and its Application to Parameter Estimation for Gaussian Mixture and Hidden Markov Models.
- World Health Organisation (2015) Sustainable Development Goals. In: WorldHealthOrganisation. https://www.who.int/europe/about-us/our-work/sustainable-development-goals. Accessed 23 Sep 2024.
Disclaimer/Publisher’s Note: The statements, opinions and data contained in all publications are solely those of the individual author(s) and contributor(s) and not of MDPI and/or the editor(s). MDPI and/or the editor(s) disclaim responsibility for any injury to people or property resulting from any ideas, methods, instructions or products referred to in the content. |
© 2024 by the authors. Licensee MDPI, Basel, Switzerland. This article is an open access article distributed under the terms and conditions of the Creative Commons Attribution (CC BY) license (http://creativecommons.org/licenses/by/4.0/).
Copyright: This open access article is published under a Creative Commons CC BY 4.0 license, which permit the free download, distribution, and reuse, provided that the author and preprint are cited in any reuse.


