
Submitted:
13 November 2024
Posted:
14 November 2024
You are already at the latest version
Abstract
The negative effect of the operating temperature over the functioning of photovoltaic panels has become a significant issue in actual energetic context, being studied intensively during last decade. The very high operating temperatures of the photovoltaic panels, even for lower levels of solar radiation, determines a drop of the open circuit voltage, with consequences over the electrical power generated and photovoltaic conversion efficiency. The aim of the study is to investigate experimentally the temperature effect over the efficiency of monocrystalline and polycrystalline photovoltaic panels by using a double climatic chamber and a solar simulation device. Within the experimental program were analyzed two photovoltaic panels, one monocrystalline and another polycrystalline, with the same nominal power of 30 Wp. The double climatic chamber used is composed of two separate rooms, the cold and hot one, while the PV panel is placed as a barrier between them. The study is focused on establishing the effect of raising the temperature of PV panel over electrical parameters: voltage, current and power produced and for efficiency and fill factor. The operating temperature is controlled by the flowing of air on the backside of the PV panel inside the cold room. The simulation of solar radiation was performed by using an equipment compatible with the dimensions and characteristics of the climatic chamber. The level of radiation studied corresponds to a vertical integration of PV panels in building facades. The coefficient of the mean variation of the efficiency with photovoltaic panels’ temperature was -0.52 %/°C, for voltage -0.48 %/°C and for current +0.10 %/°C.
Keywords:
photovoltaic panel
; climatic chamber
; efficiency improvement
; temperature effect
; solar radiation
1. Introduction
Photovoltaic (PV) conversion has important advantages, considering that the energy source is renewable and free, the production of electricity is clean and does not have a negative impact on the environment (CO2 and NOx emissions, waste, noise etc.). The generation of electricity is done without moving parts, determining reduced costs of maintenance. When the systems are serving buildings, the energy produced is consumed locally, which results in reduced power losses [1].
Generating electricity with low CO2 emissions represents an important energetic target, presenting a large European and worldwide interest.
The Building Integrated Photovoltaics (BIPV) concept consists in placing PV panels on the roof or facades of buildings [2]. The integration is justified if there are analyzed the main advantages: the local production and consumption of electricity, which imply reduced energy losses and the possibility of complex use of electricity and thermal energy. By increasing energy generation and reducing consumer losses, a reduction in CO2 and NOx emissions and environmental protection are achieved, maintaining the same comfort conditions for occupants. The implementation of high efficiency PV systems integrated into buildings and the reduced distance between the source and the consumption point, could determine a decrease in environmental pollution and CO2 emissions [3,4].
One of the main problems concerning the operation of photovoltaic panels is the significant increase in their operating temperature which causes an important drop in conversion efficiency [5,6,7]. The decrease of the conversion efficiency related to the increase of the temperature for solar radiation of 1000 W/m2 have values around -0.50%/°C [8].
The performance characteristics of photovoltaic panels: voltage (V), current intensity (I), electric power generated (P), efficiency (η) and fill factor (FF) depend on operating temperature (Tmed) and intensity of solar radiation (G) [9]. It is estimated that around 80% of the solar radiation incident on the photovoltaic panel is converted into heat [10], at operating temperatures in the interval of 65…80 °C, depending on solar radiation intensity [11].
As the power of a photovoltaic cell is influenced by the temperature and radiation levels, the standard test conditions (STC) parameters are defined: Tmed = 25 °C, G = 1000 W/m2, AM1.5, when PV panels generate the nominal power measured in Watt-peak [Wp] [12]. A real concern is that in regular operation, at solar radiation levels of 500…1000 W/m2 and low air velocities, the photovoltaic panels can reach temperatures of 80 °C [13], leading to a significant decrease of the efficiency [14].
The literature provides examples, procedures and relationships for determining the influence of operating temperature over the efficiency of PV panels, but most of them are related to the STC or NOCT conditions only [12].
A feasible method to increase efficiency of PV panels consists in using cooling solutions [15,16]. Most of the studies on the cooling of photovoltaic panels are also focused on the usage of the thermal energy extracted because of this process, so that the recovery time of the investment is less than of the stand-alone photovoltaic systems [17]. The simultaneous conversion of solar energy into electric and thermal energy using photovoltaic-thermal panels is known in the literature as PVT (Photovoltaic-Thermal System) [18]. A particular feature of this solution is the BIPVT concept, which implies the integration of PVT into buildings [3,4].
Detailed studies on the air cooling of photovoltaic panels are carried out in the following works [19,20]. The integration of photovoltaic panels in the building envelope, as the exterior glazing of the double-glazed facades, is also considered a viable solution [21,22]. In this case, the ventilation of the channel can be realized naturally (due to the thermal draft or wind) or mechanically [23].
The use of water as a cooling agent for photovoltaic panels is a solution analyzed in different studies [24,25,26]. The hybrid photovoltaic panels studied in literature have attached a water coil with the role of both cooling the PV panel and solar collector [27]. Most water-cooling techniques are placed in the category of active cooling solutions and are superior to air cooling, but more expensive [28].
The present study presents an experimental evaluation of the influence of the operating temperature over the most relevant parameters of two silicon PV panels at constant levels of radiation. The study is suitable for building integrated photovoltaics in vertical positions, when solar radiation levels are around 500 W/m2, but still an important heating is recorded [39].
2. Experimental Setup
Comparative tests were performed for two types of photovoltaic panels: monocrystalline and polycrystalline, with approximately equal dimensions and of the same nominal power, respectively 30 Wp, with slightly different electric characteristics – Table 1. Within the experimental program, carried out by using a double climatic chamber (DCC) [29], the performance of the photovoltaic panels was analyzed under various conditions by modifying the air temperature. The measured values were the electric Voc, Isc, Pmp, Vmp, Imp and thermal ones, Tmed, Gmed. Also, the influence of external parameters on photovoltaic conversion efficiency, η, was determined.
The radiation was provided by a solar radiation simulation device, Figure 1, composed of 6 light bulbs, type OSRAM Ultra-Vitalux, of 300 W each [30]. The radiation produced by the simulation device does not cover the entire solar radiation spectrum but has satisfactory wavelengths necessary for evaluating PV panels heating and conversion [31]. The radiation produced is nearly uniform on the surface of the PV panel and it is inversely proportional with distance.
The advantage of using a double-climatic chamber consists in its compartmentation into two spaces, the hot room and the cold one, in which different conditions of temperature and humidity can be created. The air temperature can be adjusted within a range of +5 to +100 ºC in the hot room and –45 to +100 ºC in the cold room. The relative humidity values can be adjusted between 10...95% for the hot room and 15...95% for the cold room [32].
For the experimental evaluation of the effect of temperature on the photovoltaic panels, the analysis of thermal phenomena was performed in steady state regime.
The experimental setup and the equipment used for the analysis of photovoltaic panels in the double climatic chamber is shown in Figure 2.
The photovoltaic panels were positioned in the DCC between the two chambers and the cooling is assured by the air from the cold room. The small size of the photovoltaic panels and the solar radiation simulation device were imposed for easy handling and integration in the climatic chamber.
To control the operating temperature of PV panel exposed to radiation, the solar radiation simulator was placed in the hot room, while the back of the photovoltaic panel in the cold room – Figure 3. The connections for the measurement of the temperature and the electric parameters were made through a sealed orifice of the climate chamber.
Where: 1 – PV panel; 2 – extruded polystyrene insulation; 3 – solar radiation simulation device; 4 – solar lamps; 5 – hot room; 6 – cold room; 7 – conductors from thermocouples; 8 – double climatic chamber; 9 – digital multimeter; 10 – control panel of DCC; 11 – data acquisition station; 12 – uninterruptible power supply (UPS); 13 – computer; (+/-) – conductors of PV panels.
The temperature measurement and recording were performed using the data acquisition system (Data Logger MS6 with 16 inputs for PT1000 [33] and temperature sensors – PT1000 thermocouples, while the electrical measurements were achieved by using Fluke multimeters and clamp-meters [34]. The distribution of the temperatures was determined using both the thermal imaging camera Testo 871 [35] and thermocouples values.
The measurement of the radiation distribution on the surface of the photovoltaic panels was done using specific equipment Pyranometer Model Voltcraft PL-110SM [36] and Solarimeter Model P.A. Hilton LTD RE550 [37].
During the measurements the following parameters were monitored: the temperature of the photovoltaic panels for the monocrystalline and polycrystalline panels and their electrical parameters: the open circuit voltage (Voc), the short-circuit current intensity (Isc) and of the maximum power produced under the tested conditions (Pmp).
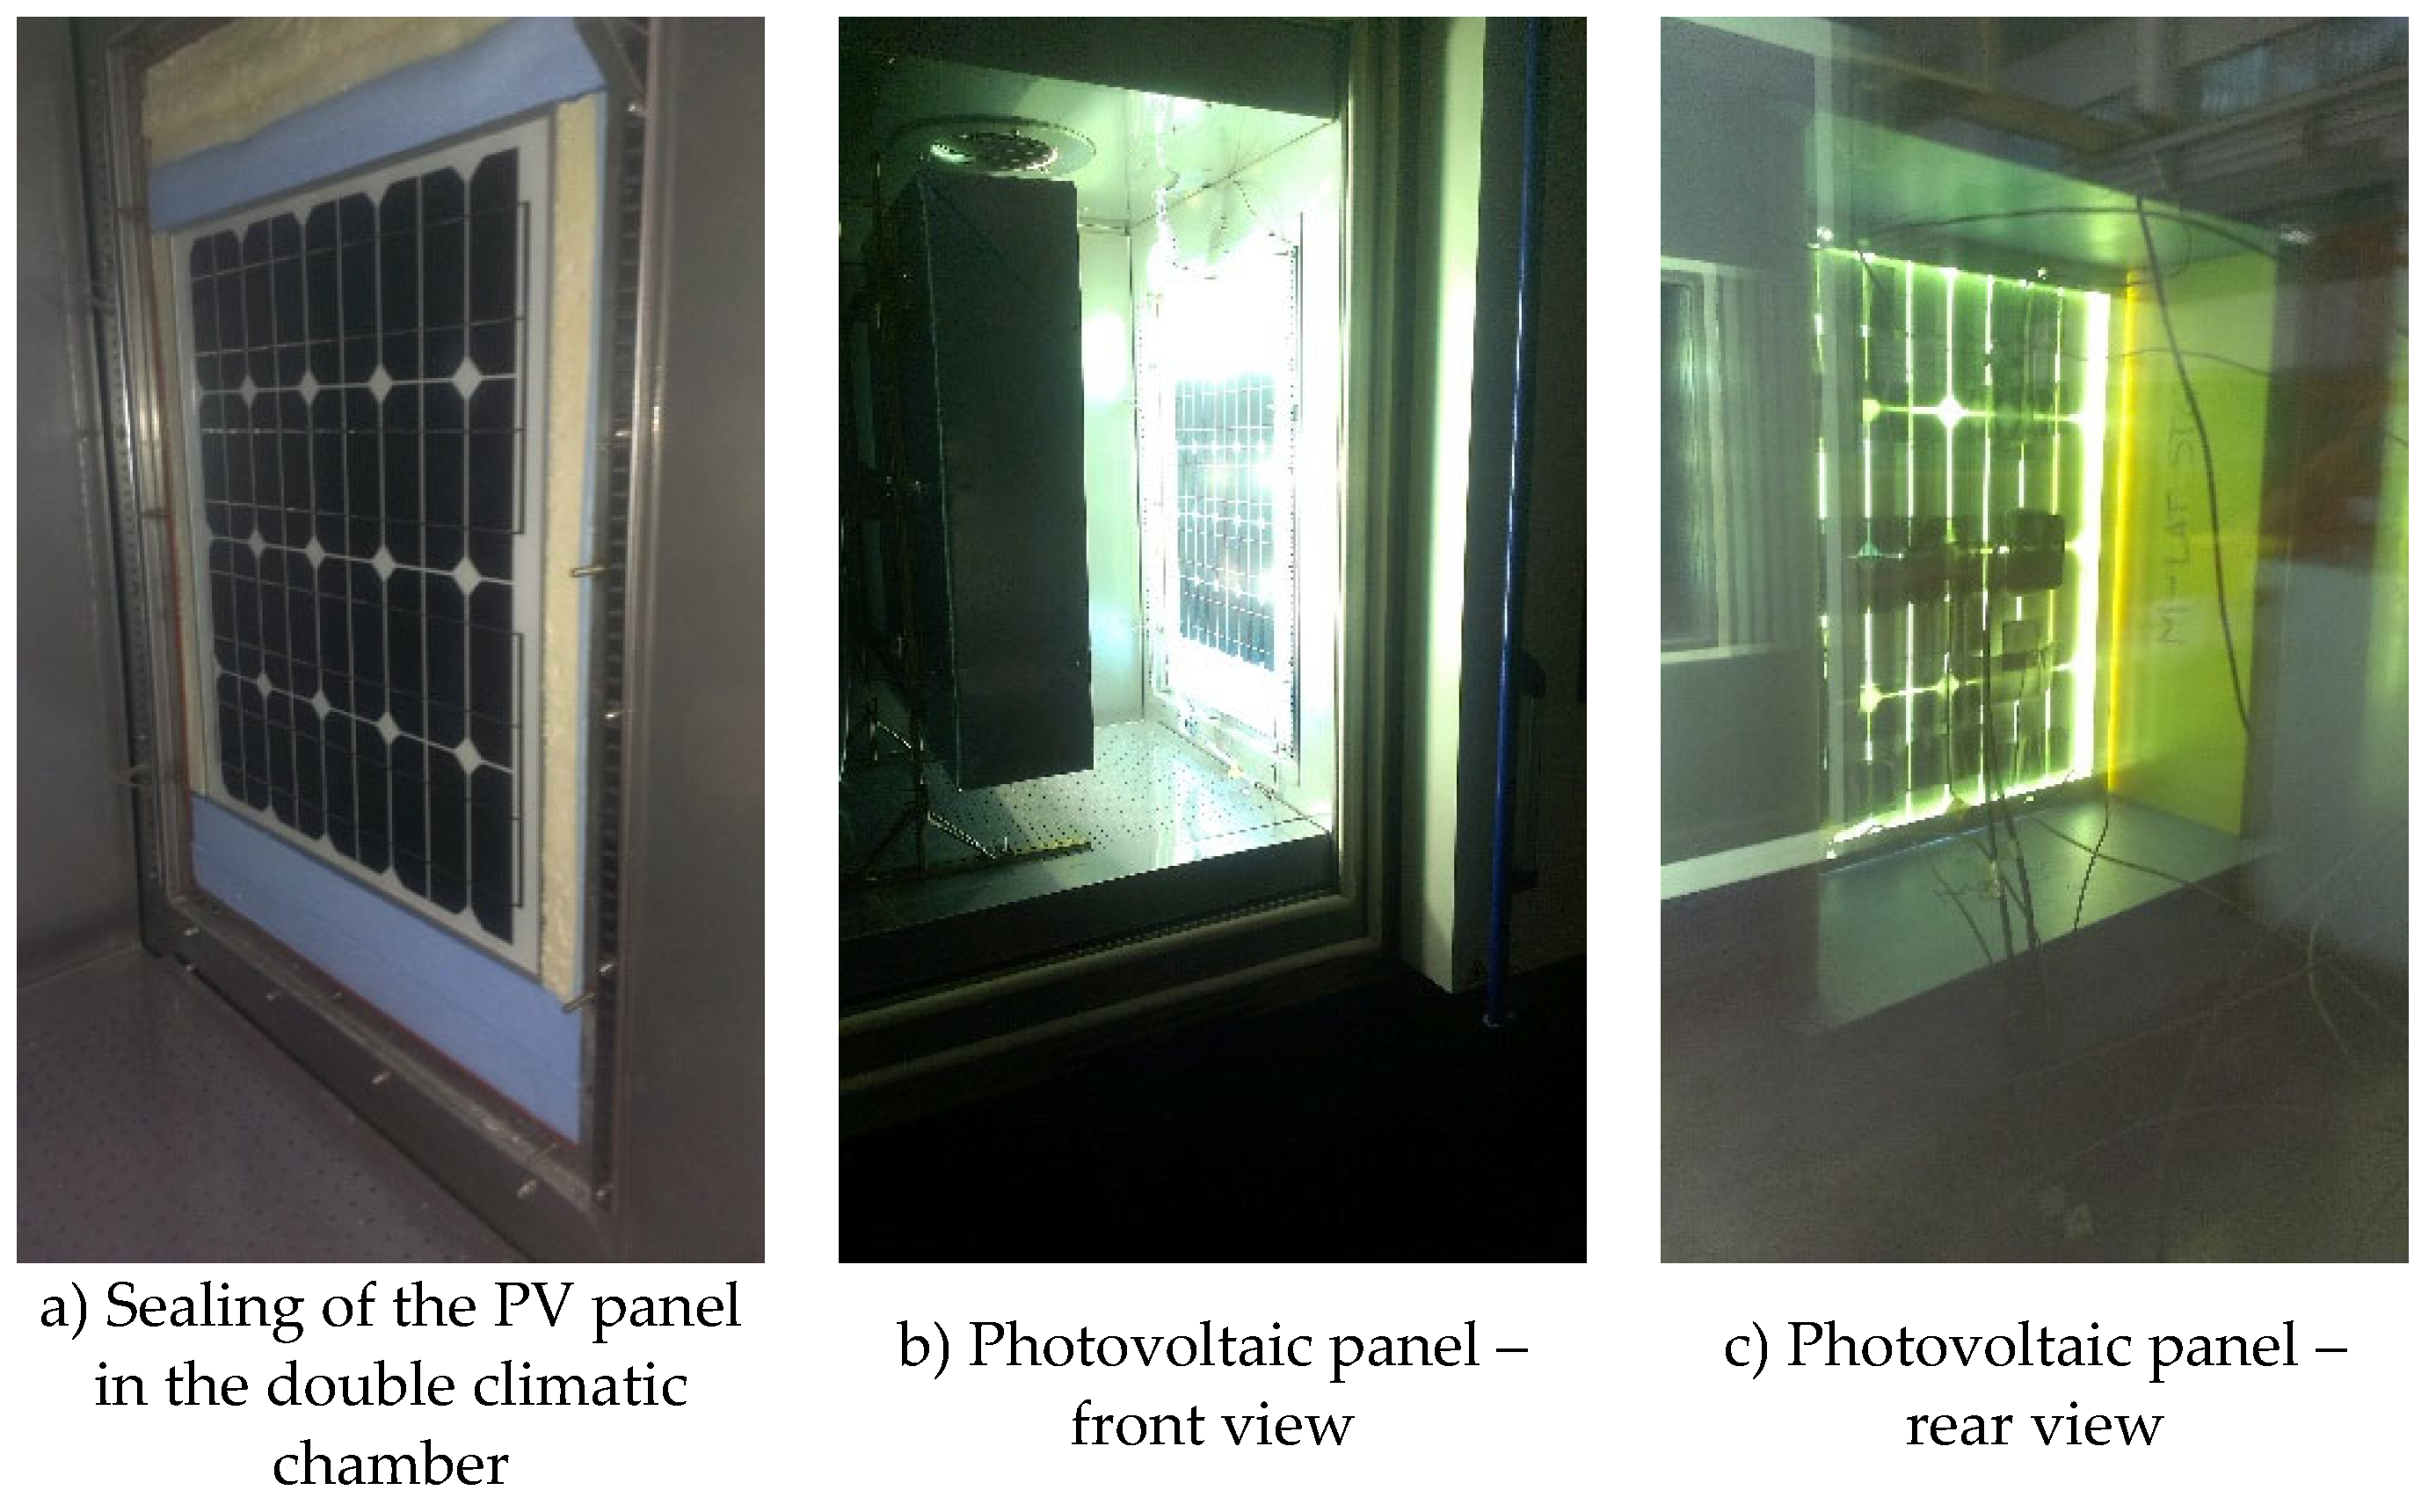
The photovoltaic panels were mounted in the boundary area between the two sections of the double climatic chamber. They were positioned facing the solar radiation simulation device in the hot room, Figure 5.b, and the back is in contact with the air in the cold room, Figure 5.c. To ensure control of the temperature with the help of the cold room, it is isolated from the hot room by sealing the space around the photovoltaic panel with extruded polystyrene, Figure 5.a.
On the rear area of the photovoltaic panel are attached the 6 contact thermocouples, type PT1000, fixed by means of an adhesive tape, resistant to high temperatures.
Figure 4.
Mounting and testing photovoltaic panels.
A total of 10 measurement setups were conducted for each photovoltaic panel, with different operating temperatures achieved by adjusting the air temperature in the cold room. During this work, the data is presented for measurements in steady-state operation (when radiation level and PV panel temperature were stabilized). Each case required an entire day to obtain these conditions and to remove the influence of the previous scenario.
Radiation Emitted Inside the Climatic Chamber
The results of the average radiation measurements for the positioning of solar radiation simulation device inside the climatic chamber at 15 cm distance to the PV panels surface are presented in Table 2. The data was obtained by multiple measurements in each point, both with solarimeter and pyranometer. The measured values show minor differences compared to the flux emitted when no obstacle is present - Figure 1. These differences are influenced by the reflections that appeared when the simulator was introduced into the climatic chamber, characterized by shiny and highly reflective metal surfaces.
Due to the small differences between the dimensions of the two photovoltaic panels (Monocrystalline and Polycrystalline) and the limitations introduced by the size of the climate chamber and the solar radiation simulator, the average radiation recorded on their surfaces presents some differences for the same distances, presented in Table 2.
3. Results
3.1. Experimental Results - Monocrystalline Photovoltaic Panel
3.1.1. Distribution of Incident Radiation on the Monocrystalline Photovoltaic Panel
In Figure 5 is presented the distribution curves of the radiation levels on the surface of the monocrystalline photovoltaic panel, for 15 cm imposed on the solar simulator. Radiation intensity measurements had the following points identification:
- -
- the delimiting area between the two rooms of the DCC: 1, 3, 5, 8, 11, 13, 15, 18;
- -
- photovoltaic panel frame: 21, 22, 23, 28, 33, 38, 43, 42, 41, 36, 31, 26;
- -
- the inner surface of the photovoltaic panel: 24, 25, 27, 29, 30, 32, 34, 35, 37, 39, 40.
Figure 5.
Distribution of radiation on monocrystalline PV for the distance of d = 15 cm / Gmed = 560 W/m2.
Figure 5.
Distribution of radiation on monocrystalline PV for the distance of d = 15 cm / Gmed = 560 W/m2.
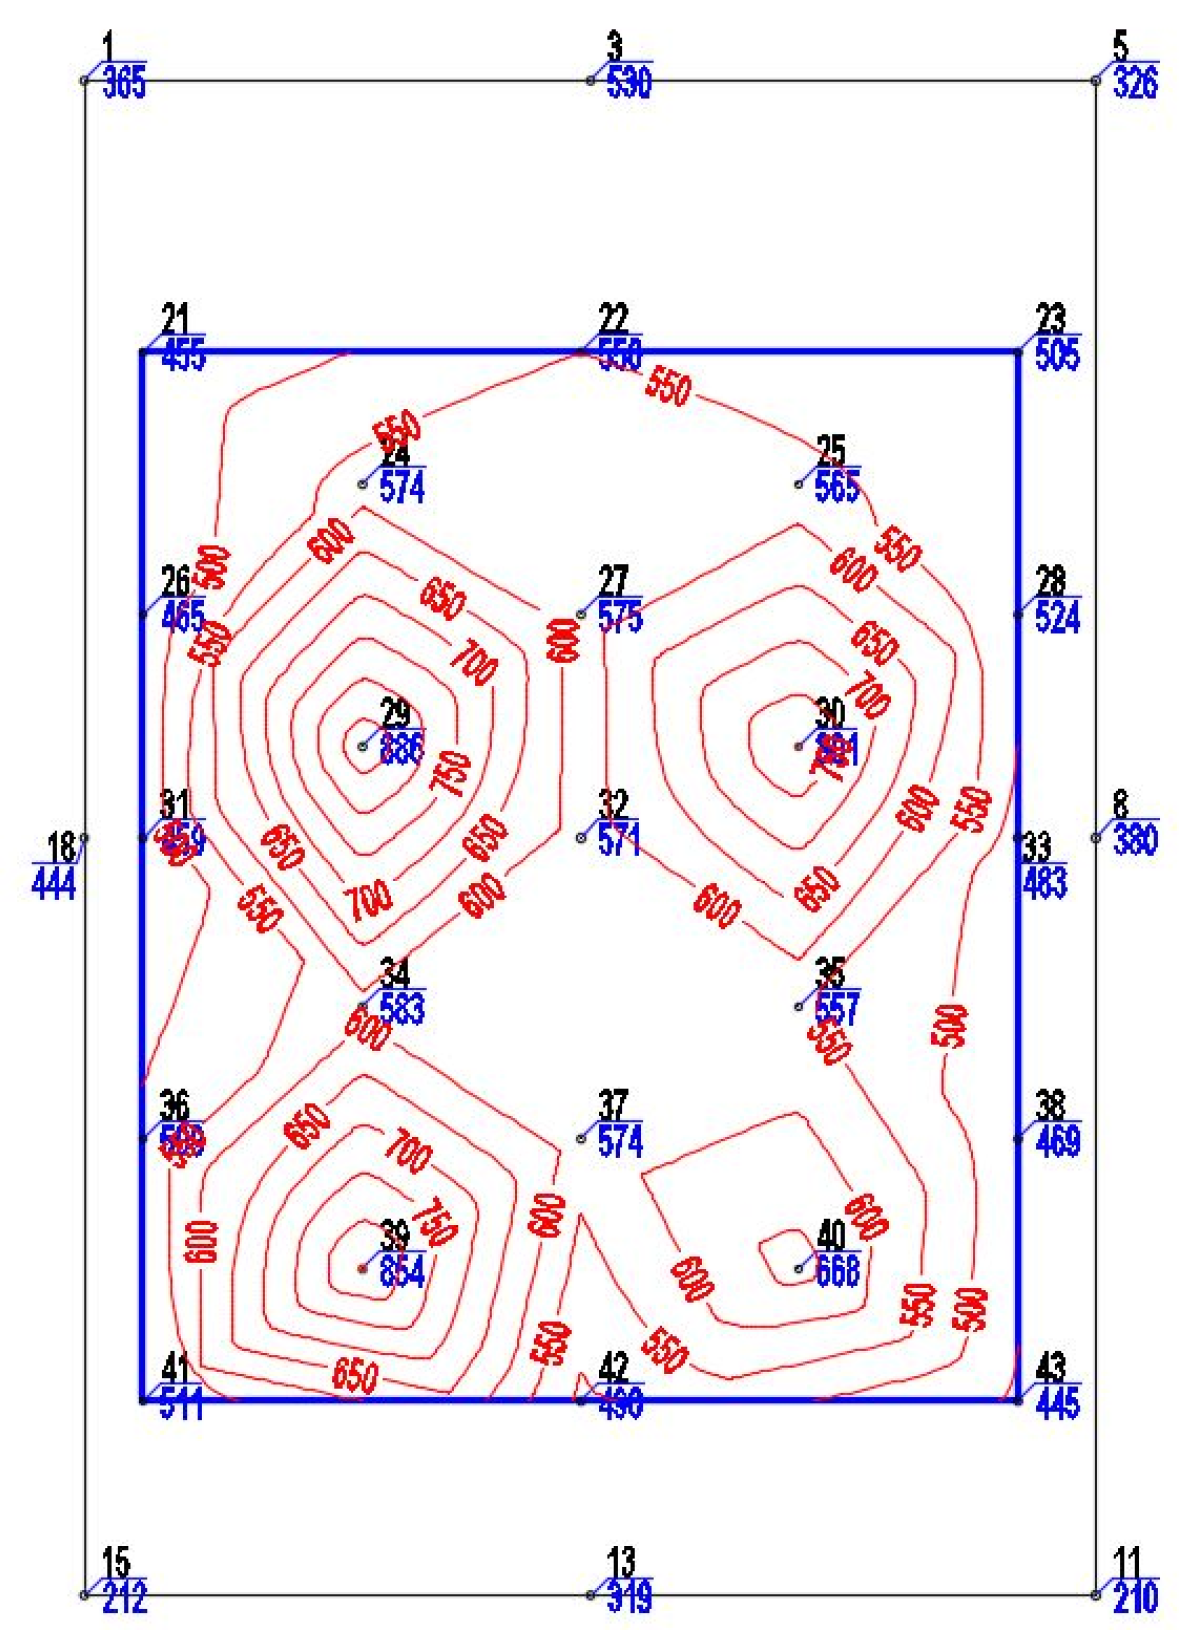
Figure 5 shows some areas where the maximum incident radiation values are recorded. These coincide with the position of the solar lamps, and the effect of non-uniformity generated is inversely proportional to the distance. Also, a radiation gradient is observed, with higher values in points 29 and 34, and lower in points 30 and 35. This phenomenon is determined by the reflective effect of the climate chamber wall in that area. The minimum values of the measured radiation were at least 80% of the average value, and the maximum at 130%.
3.1.2. Temperature Distribution on the Monocrystalline Photovoltaic Panel
The distribution of the average temperatures measured on the surface of the photovoltaic panel are presented in Figures 10–13. The average temperatures of the PV were calculated as an arithmetic mean of the 6 thermocouples (TC), positioned two by two in the upper, middle and lower area, behind it.
Regarding the temperature of PV on its two faces, one exposed to radiation and the other in contact with cold air, it was found that the temperatures vary practically instantaneously and the differences between them fall in smaller intervals of degree 1 °C.
Figure 6.
Distribution of temperatures on monocrystalline panel at Tmed: a) 20 °C; b) 25 °C; c) 30 °C; d) 35 °C; e) 40 °C; f) 45 °C.
Figure 6.
Distribution of temperatures on monocrystalline panel at Tmed: a) 20 °C; b) 25 °C; c) 30 °C; d) 35 °C; e) 40 °C; f) 45 °C.
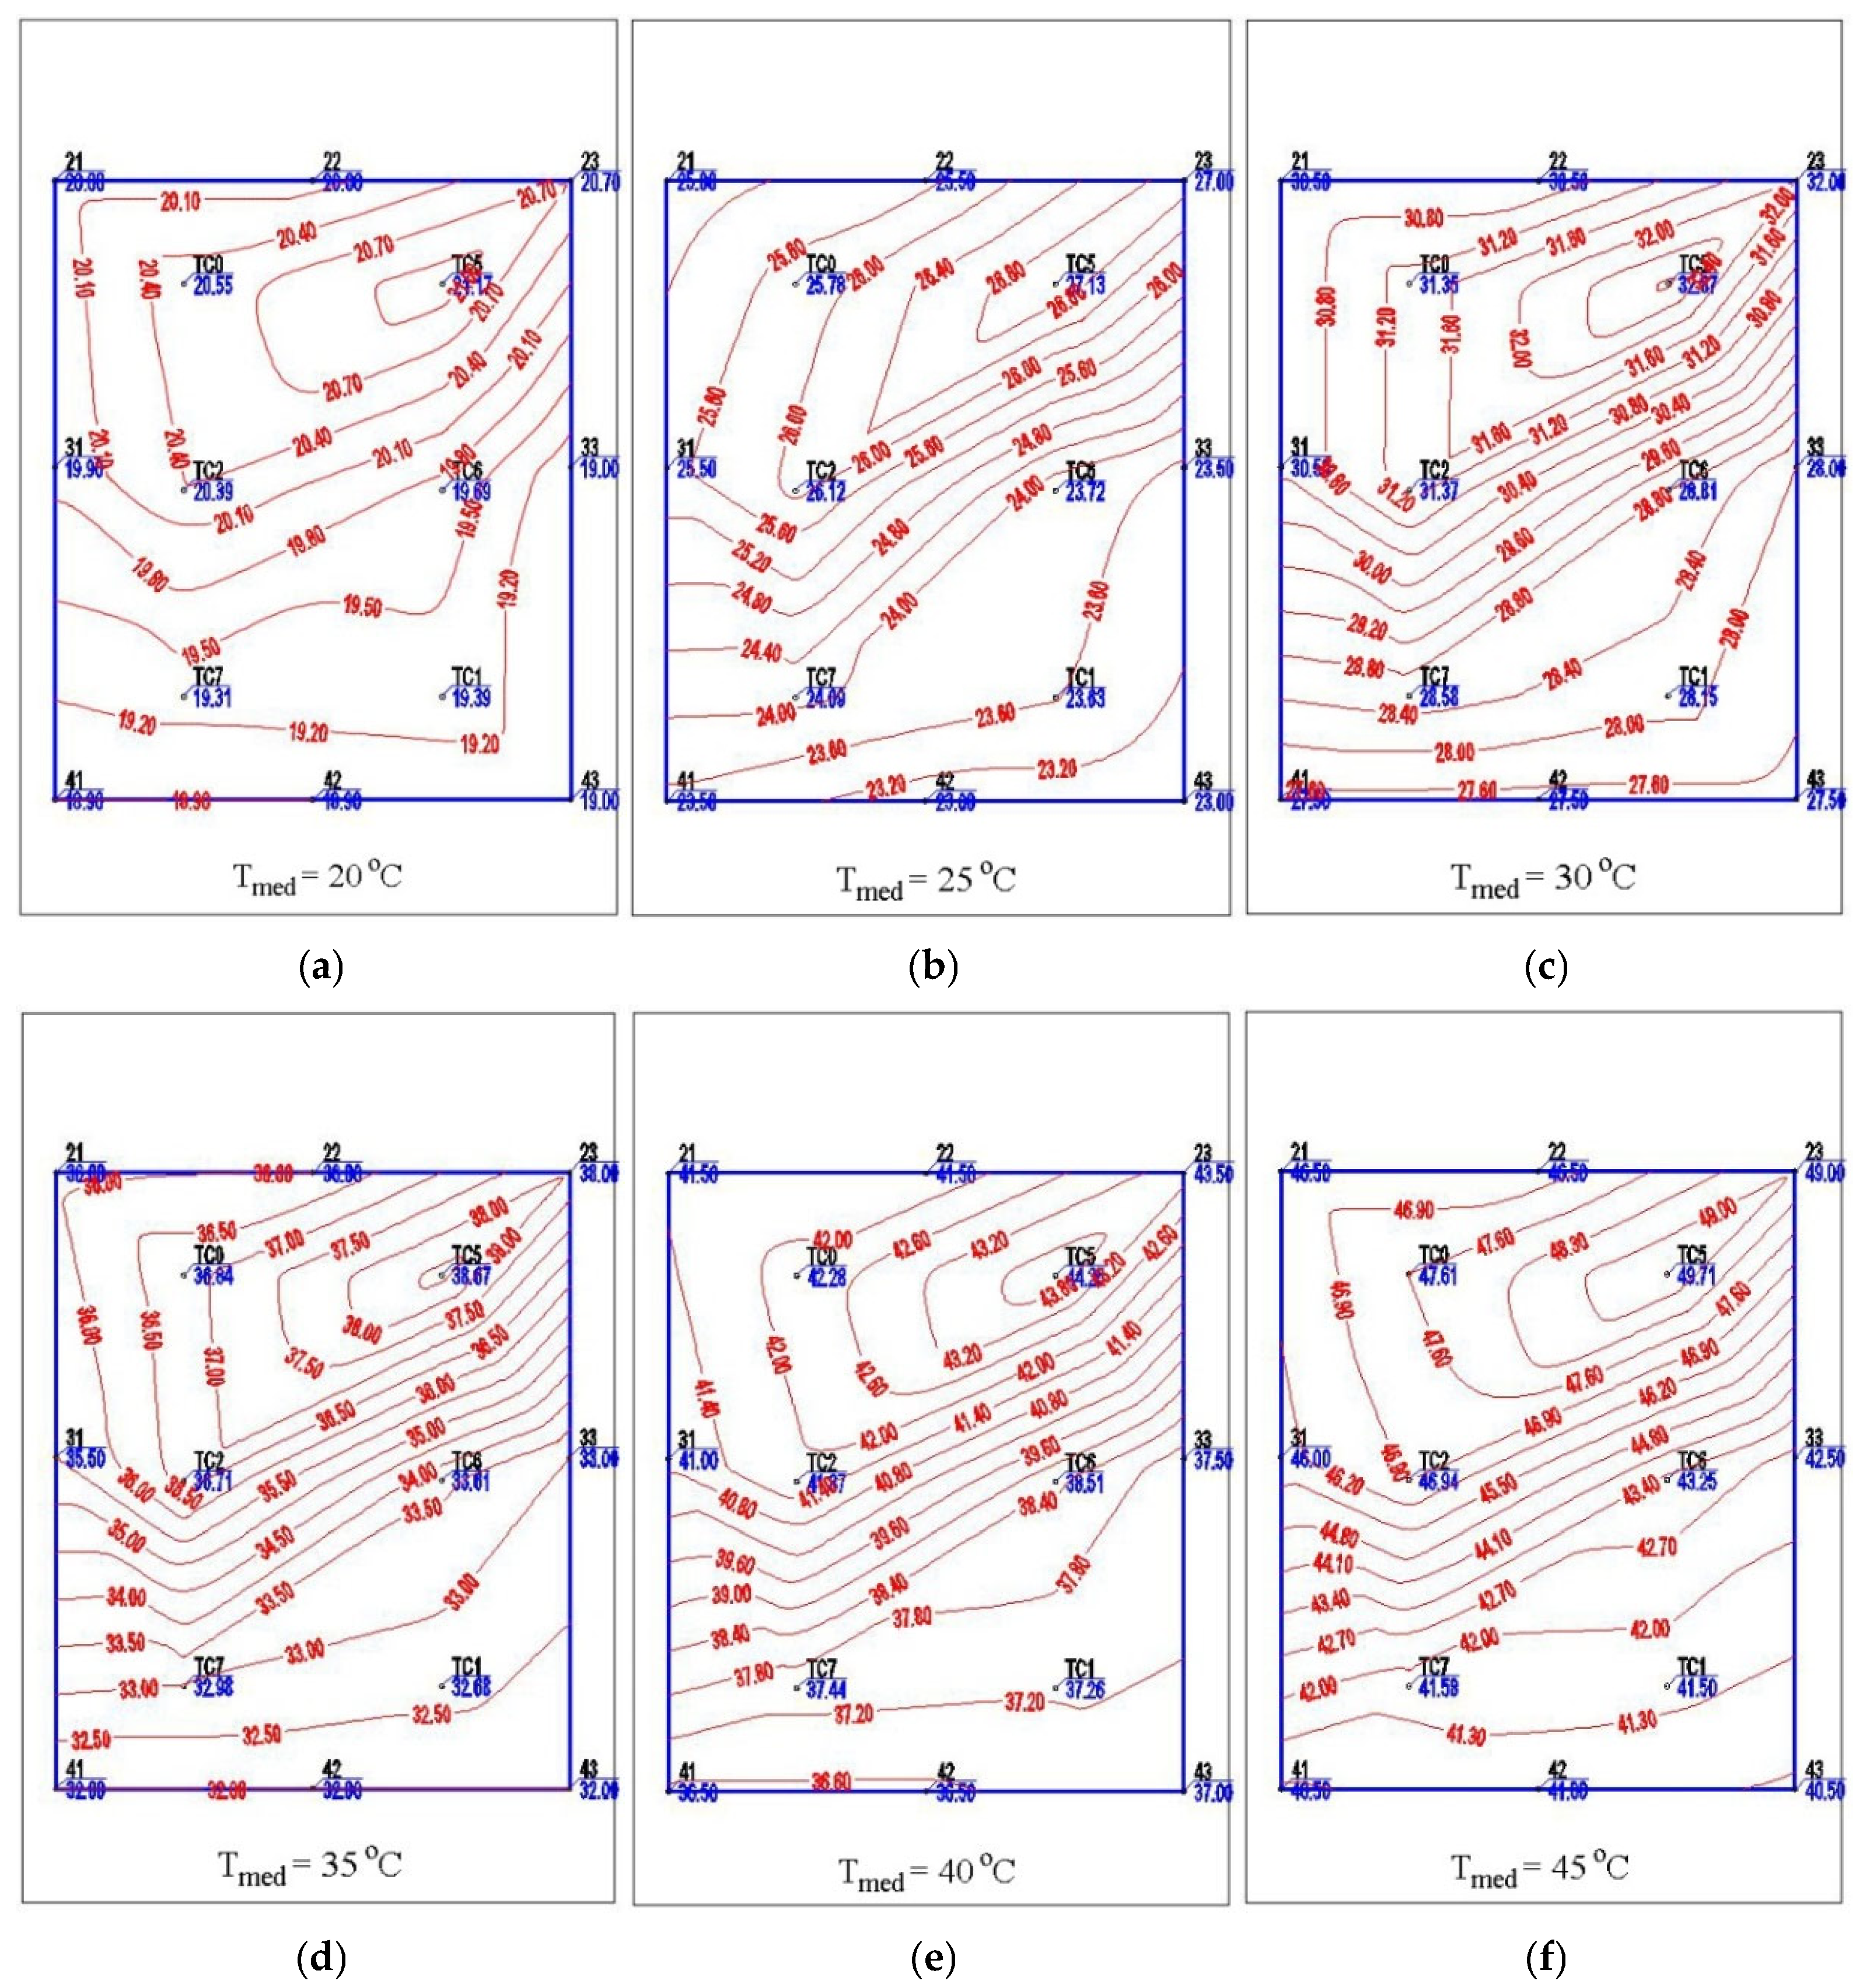
The measurements revealed the appearance of two temperature gradients, one vertically, with higher temperatures in the upper area and one on the horizontal, with the higher temperatures near the stainless-steel wall, which has high reflective characteristics, Figure 6 and Figure 7. The vertical temperature gradient is determined by the thermal stratification of the air in the immediate vicinity of the photovoltaic panel, while the horizontal differences are determined by the higher levels of radiation in these areas.
The images captured using the thermal imaging camera led to a better qualitative and quantitative analysis of the results, confirming the temperature distribution on the photovoltaic panels in Figure 8 and Figure 9. Validation of the temperature distribution obtained using thermocouples was performed, for the average panel temperature of 40 °C, Figure 9.
Figure 9 shows the phenomenon of overheating of the photovoltaic panel around its connection box. It can be observed that at an average temperature of 40 °C in the vicinity of the points, while this portion records values about 10 °C higher. This phenomenon is determined by the thermal insulation effect produced by the presence of the box, causing the low cooling in that area. The heating of the photovoltaic cells in the respective areas of the panel has a negative effect on overall efficiency, when all the cells are interconnected in series.
3.1.3. Variation of the Parameters of the Monocrystalline Photovoltaic Panel with the Operating Temperature
The maximum power produced, Pmp, by the photovoltaic panels was determined by testing the power dissipated by them on linear resistors with variable resistance, using the characteristic resistance method, Rch [38]. For each value of the radiation intensity, three values of the electrical resistance were tested, thus resulting in the maximum power point. Figure 10 shows the variation of the power generated by the monocrystalline photovoltaic panel for the 3 values of the resistance and various temperatures, at the radiation intensity of 560 W/m2. There is a reduction in the power produced when the operating temperature is increased, for each value of the electrical resistance.
The variation of two of the most important parameters of the photovoltaic panel, the open circuit voltage, Voc, and the short-circuit current, Isc, for the radiation level of 560 W/m2 is shown in Figure 11. The increase in temperature can be observed to have a significantly greater impact on Voc than on Isc.
Figure 12 illustrates how the open circuit voltage and the operating temperature of the photovoltaic panel change over time, while the radiation remains constant. It is found that the maximum values of the voltage are recorded at minimum temperatures and the reverse effect. Also, it is important to note the very short reaction time of the PV panel operation related to the temperature change. This behavior is advantageous, as significant efficiency gains can be achieved instantly by cooling, when a temperature rise is noticed.
The effect of the operating temperature of the photovoltaic panel is also observed on the efficiency variation curves, Figure 13. A significant influence of the increase in operating temperature at a constant radiation level can be observed.
3.1.4. Coefficients of Variation of the Parameters of the Monocrystalline Photovoltaic Panel with the Operating Temperature
The detailed analysis of the experimental results is presented as coefficients of influence of the operating temperature on the parameters of the photovoltaic panel, cT. The coefficients are calculated by comparing the PV panel parameters, X, for temperature intervals of ΔT = 5 °C starting with 25 °C:
The results are determined for constant level of radiation of 560 W/m2 in Figure 14, Figure 15 and Figure 16.
Figure 14 shows the coefficients of variation of efficiency, open circuit voltage and short-circuit current as a function of operating temperature. The results in Figure 20 are presented for average values over analysis intervals of 5 °C. The negative influence of the panel temperature on the efficiency and the open circuit voltage is registered for all study intervals. Also, the short-circuit current has positive coefficients of variation on the analogous intervals.
Figure 15 shows the results for the maximum power output and the percentage values of efficiency and the filling factor. These are presented for the constant radiation intensity of 560 W/m2, for temperature in the range 25...80 °C. It can be observed that all three parameters are negatively influenced by temperature rise.
The total variation of the open circuit voltage, short-circuit current and efficiency, at intervals between 25 °C and 75 °C is shown in Figure 16.a. It is observed that there is a constant decrease in efficiency and the open circuit voltage and the increase of the short-circuit current, compared to the temperature of 25 °C. For temperatures around 75 °C, the total efficiency decrease is -27.4% and for the open circuit voltage is -24.0%.
Figure 16.b shows the effect of temperature as coefficients of variation mediated per interval. Using these charts, for any temperature chosen, the coefficients of variation with temperature [%/°C] can be determined.
The coefficients of the influence (β) of the operating temperature on efficiency (-0.52...-0.55%/°C), voltage (-0.48...-0.50%/°C) and current intensity (+0.14…+0.16%/°C) can be approximated with satisfactory accuracy according to Table 3.
3.2. Experimental Results - Polycrystalline Photovoltaic Panel
3.2.1. Distribution of Incident Radiation on the Polycrystalline Photovoltaic Panel
Like the case of the monocrystalline PV panel, in Figure 17 is presented the distribution of the radiation for d = 15 cm imposed on the polycrystalline photovoltaic panel. A slightly lower average level of radiation is obtained for the polycrystalline (520 W/m2), compared to the monocrystalline one (560 W/m2), determined by the elongated shape and the larger surface. The analysis was implemented at this level of radiation, because the quantitative increase of radiation would be obtained by an important decrease of the uniformity of radiation on surface of PV panel.
3.2.2. Temperature Distribution on the Polycrystalline Photovoltaic Panel
The distribution of the operating temperatures measured on the surface of the polycrystalline photovoltaic panel for the reference mean temperature values is shown in Figure 18 and Figure 19. The average temperature of the PV panel was calculated as the arithmetic mean of the values from six thermocouples (TC), positioned in pairs in the upper, middle, and lower sections on the back of the panel, as shown in Figure 18 and Figure 19.
3.2.3. Variation of the Parameters of the Polycrystalline Photovoltaic Panel with the Operating Temperature
During the present study, the focus was on determining the trends of variation of the parameters of the photovoltaic panels on temperature and radiation intervals and less on punctual values. Figure 20, Figure 21 and Figure 22 show the variation of the Pmp, Voc, Isc of the polycrystalline photovoltaic panel for the 3 values of the resistance and various temperatures, at the radiation intensity of 520 W/m2.
3.2.4. Coefficients of Variation of the Parameters of the Polycrystalline Photovoltaic Panel with the Operating Temperature
Figure 23 shows the variation of the efficiency of the polycrystalline photovoltaic panel with the temperature for the radiation level of 520 W/m2. When operating temperature increases, the efficiency of the photovoltaic panel is reduced almost linearly.
In Figure 24, Figure 25 and Figure 26 are represented the coefficients of variation of PV panel parameters with temperature.
Table 4 presents the coefficients of dependence of the parameters of the photovoltaic panels with the operating temperature. According to these data, the decrease in efficiency with temperature has average values of about -0.50%/°C
4. Conclusions and Discussion
During the experiment, a series of important insights were gained regarding the behavior of two different photovoltaic panels under various operating temperature conditions. The coefficients of influence of operating temperature on power, efficiency, voltage, current intensity, and fill factor were determined. In all studied cases, the coefficients were quantified both as general average values and over specific study intervals.
The results of the experimental tests revealed a series of differences regarding the behavior of the monocrystalline and polycrystalline photovoltaic panels, as well as certain similar general trends under varying operating temperature and radiation conditions. In terms of power and efficiency, the results show significant differences, Table 5, determined by the incidence surfaces and the different spectral response of the two panels to the radiation emitted by the solar simulator.
However, regarding the general trend, there have been some results with important similarities. The variation of the parameters of the two photovoltaic panels with the temperature is presented in Table 6.
According to Table 6, the decrease of the efficiency of the photovoltaic panel with the operating temperature had values of -0.46...- 0.50%/°C, and of the power produced by it with -0.47...-0.50%/°C, for both types of panels.
The dependence of the power produced by the photovoltaic panel with the operating temperature is largely influenced by the variation of the voltage generated by the photovoltaic panel and less by the current produced. The coefficients of variation of the open circuit voltage have values in the range -0.43...- 0.45%/°C, very close to those corresponding to efficiency, Table 6.
Author Contributions
Conceptualization, S.V.H., F.E.Ț. and N.-C.C.; methodology, S.V.H., F.E.Ț. and N.-C.C.; software, S.V.H. and F.E.Ț.; validation, S.V.H., F.E.Ț., N.-C.C. and I.H.; formal analysis, S.V.H. and I.H.; investigation, S.V.H., R.C., N.-C.C. and I.H.; resources, S.V.H., F.E.Ț.; data curation, S.V.H., F.E.Ț. and I.H.; writing—original draft preparation, S.V.H., F.E.Ț., N.-C.C. and I.H.; writing—review and editing, S.V.H., R.C., N.-C.C. and I.H.; visualization, S.V.H. and I.H.; supervision, S.V.H.; project administration, S.V.H.; funding acquisition, S.V.H. All authors have read and agreed to the published version of the manuscript.
Funding
Not applicable.
Institutional Review Board Statement
Not applicable.
Informed Consent Statement
Not applicable.
Data Availability Statement
Not applicable.
Acknowledgments
Not applicable.
Conflicts of Interest
The authors declare no conflict of interest.
Nomenclature
| STC | Standard test conditions |
| NOCT | Nominal operating cell temperature |
| AM | Air mass |
| cT | Coefficient of variation with temperature |
| ΔT | Difference between the tSTC and Tmed [°C] |
| ΔX | PV panel parameters |
| Tmed | Operating cell temperature [°C] |
| d | Distance between solar simulator and PV [cm] |
| Gmed | Average radiation on PV panel surface [W/m2] |
| Rch | Characteristic resistance [Ω] |
| tNOCT | Cell temperature in NOCT conditions [°C] |
| tSTC | Cell temperature in STC conditions [°C] |
| Pmp | Maximum power produced [Wp] |
| Vmp | Voltage at Pmp [V] |
| Imp | Current at Pmp [A] |
| Voc | Open circuit voltage [V] |
| Isc | Short-circuit current [A] |
| η | PV panel efficiency [%] |
| FF | Fill Factor |
| β | PV panel temperature coefficients [%/°C] |
| L | Length of PV panel [mm] |
| l | Width of PV panel [mm] |
| H | Height of the PV panel [mm] |
References
- Zaite, A.; Belouaggadia, N.; Abid, C.; Kaiss, A.; Imghoure, O. Performance Enhancement of a Photovoltaic-Thermal Thermoelectric Collector Using Night Radiative Cooling. Appl Energy 2024, 364. [Google Scholar] [CrossRef]
- Hudișteanu, S.V.; Țurcanu, F.E.; Cherecheș, N.-C.; Popovici, C.-G.; Verdeș, M.; Ancaș, D.-A.; Hudișteanu, I. Effect of Wind Direction and Velocity on PV Panels Cooling with Perforated Heat Sinks. Appl. Sci. 2022, 12, 9665. [Google Scholar] [CrossRef]
- Ma, X. , Ghosh, A., Cuce, E., & Saboor, S. Building integrated photovoltaic-thermal systems (BIPVT) and spectral splitting technology: A critical review. Next Sustainability 2024, 4, 100056. [Google Scholar] [CrossRef]
- Ren, H., Quan, Z., Wang, Z., Wang, L., Jing, H., & Zhao, Y. Performance simulation and analysis of a multi-energy complementary energy supply system for a novel BIPVT nearly zero energy building. Energy Conversion and Management 2023, 282. [Google Scholar] [CrossRef]
- Solanki, R.; Singh, V.; Varshney, L.; Kumar, K. Advanced Cooling Technique to Improve Efficiency of Solar Panel. In Proceedings of the 2023 International Conference on IoT, Communication and Automation Technology, 2023., ICICAT 2023; Institute of Electrical and Electronics Engineers Inc. [Google Scholar]
- Beldjani, C.; Belghar, N.; Aoues, K.; Saleh, M.S.M.; Boutera, Y.; Kethiri, M.A. Efficiency Improvement of Air-Cooled Photovoltaic Modules Utilizing Copper Heat Dissipators. Desalination Water Treat 2022, 279, 140–146. [Google Scholar] [CrossRef]
- Rousseau, P.; Nouri, H. ANSYS Investigation of Solar Photovoltaic Temperature Distribution for Improved Efficiency. International Journal of Advances in Applied Sciences 2023, 12, 293–300. [Google Scholar] [CrossRef]
- Hudișteanu, S.V.; Țurcanu, F.E.; Cherecheș, N.C.; Popovici, C.G.; Verdeș, M.; Hudisteanu, I. Enhancement of PV Panel Power Production by Passive Cooling Using Heat Sinks with Perforated Fins. Appl. Sci. 2021, 11, 11323. [Google Scholar] [CrossRef]
- Basem A, Mukhtar A, Salem Elbarbary ZM, Atamurotov F, Benti NE. Experimental study on the various varieties of photovoltaic panels (PVs) cooling systems to increase their electrical efficiency. PLoS ONE 2024, 19, e0307616. [Google Scholar] [CrossRef]
- Alzgool, M. Performance Enhancement by Cooling the PV Panels Using Phase Change Material (RT35): ANSYS Simulation and Experimental Investigation. International Journal of Energy Production and Management 2024, 9, 73–81. [Google Scholar] [CrossRef]
- Rousseau, P.; Nouri, H. ANSYS Investigation of Solar Photovoltaic Temperature Distribution for Improved Efficiency. International Journal of Advances in Applied Sciences 2023, 12, 293–300. [Google Scholar] [CrossRef]
- Photovoltaic (PV) module performance testing and energy rating—Part 1: Irradiance and temperature performance measurements and power rating. In International Standard; IEC 61853-1; Geneva, Switzerland, 2011.
- Popovici, C. G. , Hudişteanu, S. V., Mateescu, T. D., & Cherecheş, N.-C. (2016). Efficiency Improvement of Photovoltaic Panels by Using Air Cooled Heat Sinks. ( 85, 425–432. [CrossRef]
- Hudișteanu, S. v, Cherecheș, N. C., Popovici, C. G., Verdeș, M., Ciocan, V., Balan, M. C., Țurcanu, F. E., & Scurtu, I. C. Effect of cooling on power generated by photovoltaic panels. IOP Conference Series: Materials Science and Engineering, 2021, 1141, 012008. [Google Scholar] [CrossRef]
- Ahmed, Y.E.; Maghami, M.R.; Pasupuleti, J.; Danook, S.H.; Basim Ismail, F. Overview of Recent Solar Photovoltaic Cooling System Approach. Technologies 2024, 12, 171. [Google Scholar] [CrossRef]
- Ma, S.; Jin, Y.; Alam, F. Heat Pipe-Based Cooling Enhancement for Photovoltaic Modules: Experimental and Numerical Investigation. Energies 2024, 17, 4272. [Google Scholar] [CrossRef]
- Kazemian, A., Khatibi, M., Entezari, S., Ma, T., & Yang, H. Efficient energy generation and thermal storage in a photovoltaic thermal system partially covered by solar cells and integrated with organic phase change materials. Renewable and Sustainable Energy Reviews 2023, 188. [Google Scholar] [CrossRef]
- Grigore, R.; Vernica, S.G.; Popa, S.E.; Banu, I.V. Simulation and Experimental Results for Energy Production Using Hybrid Photovoltaic Thermal Technology. Energies 2024, 17, 1422. [Google Scholar] [CrossRef]
- Hudisteanu, S. V. , & Popovici, C. G. Experimental investigation of the wind direction influence on the cooling of photovoltaic panels integrated in double skin facades. E3S Web of Conferences 2019, 111. [Google Scholar] [CrossRef]
- Bilen, K.; Erdoğan, İ. Effects of Cooling on Performance of Photovoltaic/Thermal (PV/T) Solar Panels: A Comprehensive Review. Solar Energy 2023, 262. [Google Scholar] [CrossRef]
- Abdallah, R.; Haddad, T.; Zayed, M.; Juaidi, A.; Salameh, T. An Evaluation of the Use of Air Cooling to Enhance Photovoltaic Performance. Thermal Science and Engineering Progress 2024, 47. [Google Scholar] [CrossRef]
- Al-Azawiey, S.S.; Mohamed, M.M.; Arifin, A.B. Effectiveness of PV/T Passive Natural Air Cooling by Backside Attached Fins. International Journal of Energy Production and Management 2023, 8, 55–62. [Google Scholar] [CrossRef]
- Homa, M.; Sornek, K.; Goryl, W. Experimental and Numerical Study on Air Cooling System Dedicated to Photovoltaic Panels. Energies 2024, 17, 3949. [Google Scholar] [CrossRef]
- Maatallah, T.; Houcine, A.; Saeed, F.; Khan, S.; Ali, S. Simulated Performance Analysis of a Hybrid Water-Cooled Photovoltaic/Parabolic Dish Concentrator Coupled with Conical Cavity Receiver. Sustainability 2024, 16, 544. [Google Scholar] [CrossRef]
- Hudisteanu, V. S.g, Chereches, N. C., Verdes, M., Ciocan, V., Popovici, C. G., Turcanu, F. E., & Balan, M. C. Analysis of an innovative water-cooling solution for photovoltaic-thermal systems. IOP Conference Series: Earth and Environmental Science 2021, 664(1). [CrossRef]
- El Fouas, C.; Cherecheș, N.C.; Hudișteanu, S.V.; Hajji, B.; Țurcanu, E.F.; Cherecheș, M.L. Numerical and Parametric Analysis for Enhancing Performances of Water Photovoltaic/Thermal System. Appl. Sci. 2022, 12, 646. [Google Scholar] [CrossRef]
- Khosravi, K., Mohammed, H. I., Mahdi, J. M., Silakhori, M., Ebrahimnataj Tiji, M., Kazemian, A., Ma, T., & Talebizadehsardari, P. Optimizing performance of water-cooled photovoltaic-thermal modules: A 3D numerical approach. Solar Energy 2023., 264. [CrossRef]
- Ibrahim, T.; Abou Akrouch, M.; Hachem, F.; Ramadan, M.; Ramadan, H.S.; Khaled, M. Cooling Techniques for Enhanced Efficiency of Photovoltaic Panels—Comparative Analysis with Environmental and Economic Insights. Energies 2024, 17, 713. [Google Scholar] [CrossRef]
- Hudisteanu, S. V. , Pruteanu, M., Mateescu, T. D., & Vasilache, M. Experimental investigation of temperature effects on the parameters of photovoltaic panels. Environmental Engineering and Management Journal 2017, 16(7), 1643–1648. [Google Scholar]
- Hudisteanu, S. V. , Chereches, C. N., Turcanu, F. E., Taranu, N., Verdes, M., Ancas, A. D., Hudisteanu, I., Ungureanu, D., & Polcovnicu, R. A. Solar radiation simulation device for investigation of thermal and photovoltaic panels. International Journal of Modern Manufacturing Technologies 2022, 14(3), 76–85. [Google Scholar] [CrossRef]
- Available online:. Available online: https://www.osram.com/ecat/ULTRA-VITALUX%20UV-A-UV-A-Ultraviolet%20lamps-Industry-Specialty%20Lighting/com/en/GPS01_1028569/ZMP_60829 (accessed on 7 November 2024).
- Available online:. Available online: https://www.feutron.de/en/double-climate-test-chamber (accessed on 7 November 2024).
- Available online:. Available online: https://www.cometsystem.com/products/sixteen-channel-data-logger-with-alarms/reg-ms6d (accessed on 7 November 2024).
- Available online:. Available online: https://www.tme.eu/ro/details/flk-355/contoare-si-adaptoare-cu-clema-ac-dc/fluke/fluke-355 (accessed on 7 November 2024).
- Available online:. Available online: https://www.testo.com/en/testo-871/p/0560-8712 (accessed on 7 November 2024).
- Available online:. Available online: https://www.soselectronic.com/ro-ro/products/voltcraft/pl-110sm-152318 (accessed on 7 November 2024).
- Available online:. Available online: https://bestech.com.au/wp-content/uploads/RE550_V71.pdf (accessed on 07.11.2024).
- Durán, E., Galán, J., Andujar, J. M., & Sidrach-de-Cardona, M. A New Method to Obtain I-V Characteristics Curves of Photovoltaic Modules Based on SEPIC and Cuk Converters. EPE Journal 2008, 18, 5–15. [CrossRef]
- Hudisteanu, S. V. , & Popovici, C. G. Numerical analysis of the efficiency and energy production of the building integrated photovoltaics for various configurations. E3S Web of Conferences 2019, 111. [Google Scholar] [CrossRef]
Figure 1.
The radiation produced by the simulation device depending on the distance to PV panel – average (Gmed), minimum (min) and maximum (Max) values.
Figure 1.
The radiation produced by the simulation device depending on the distance to PV panel – average (Gmed), minimum (min) and maximum (Max) values.
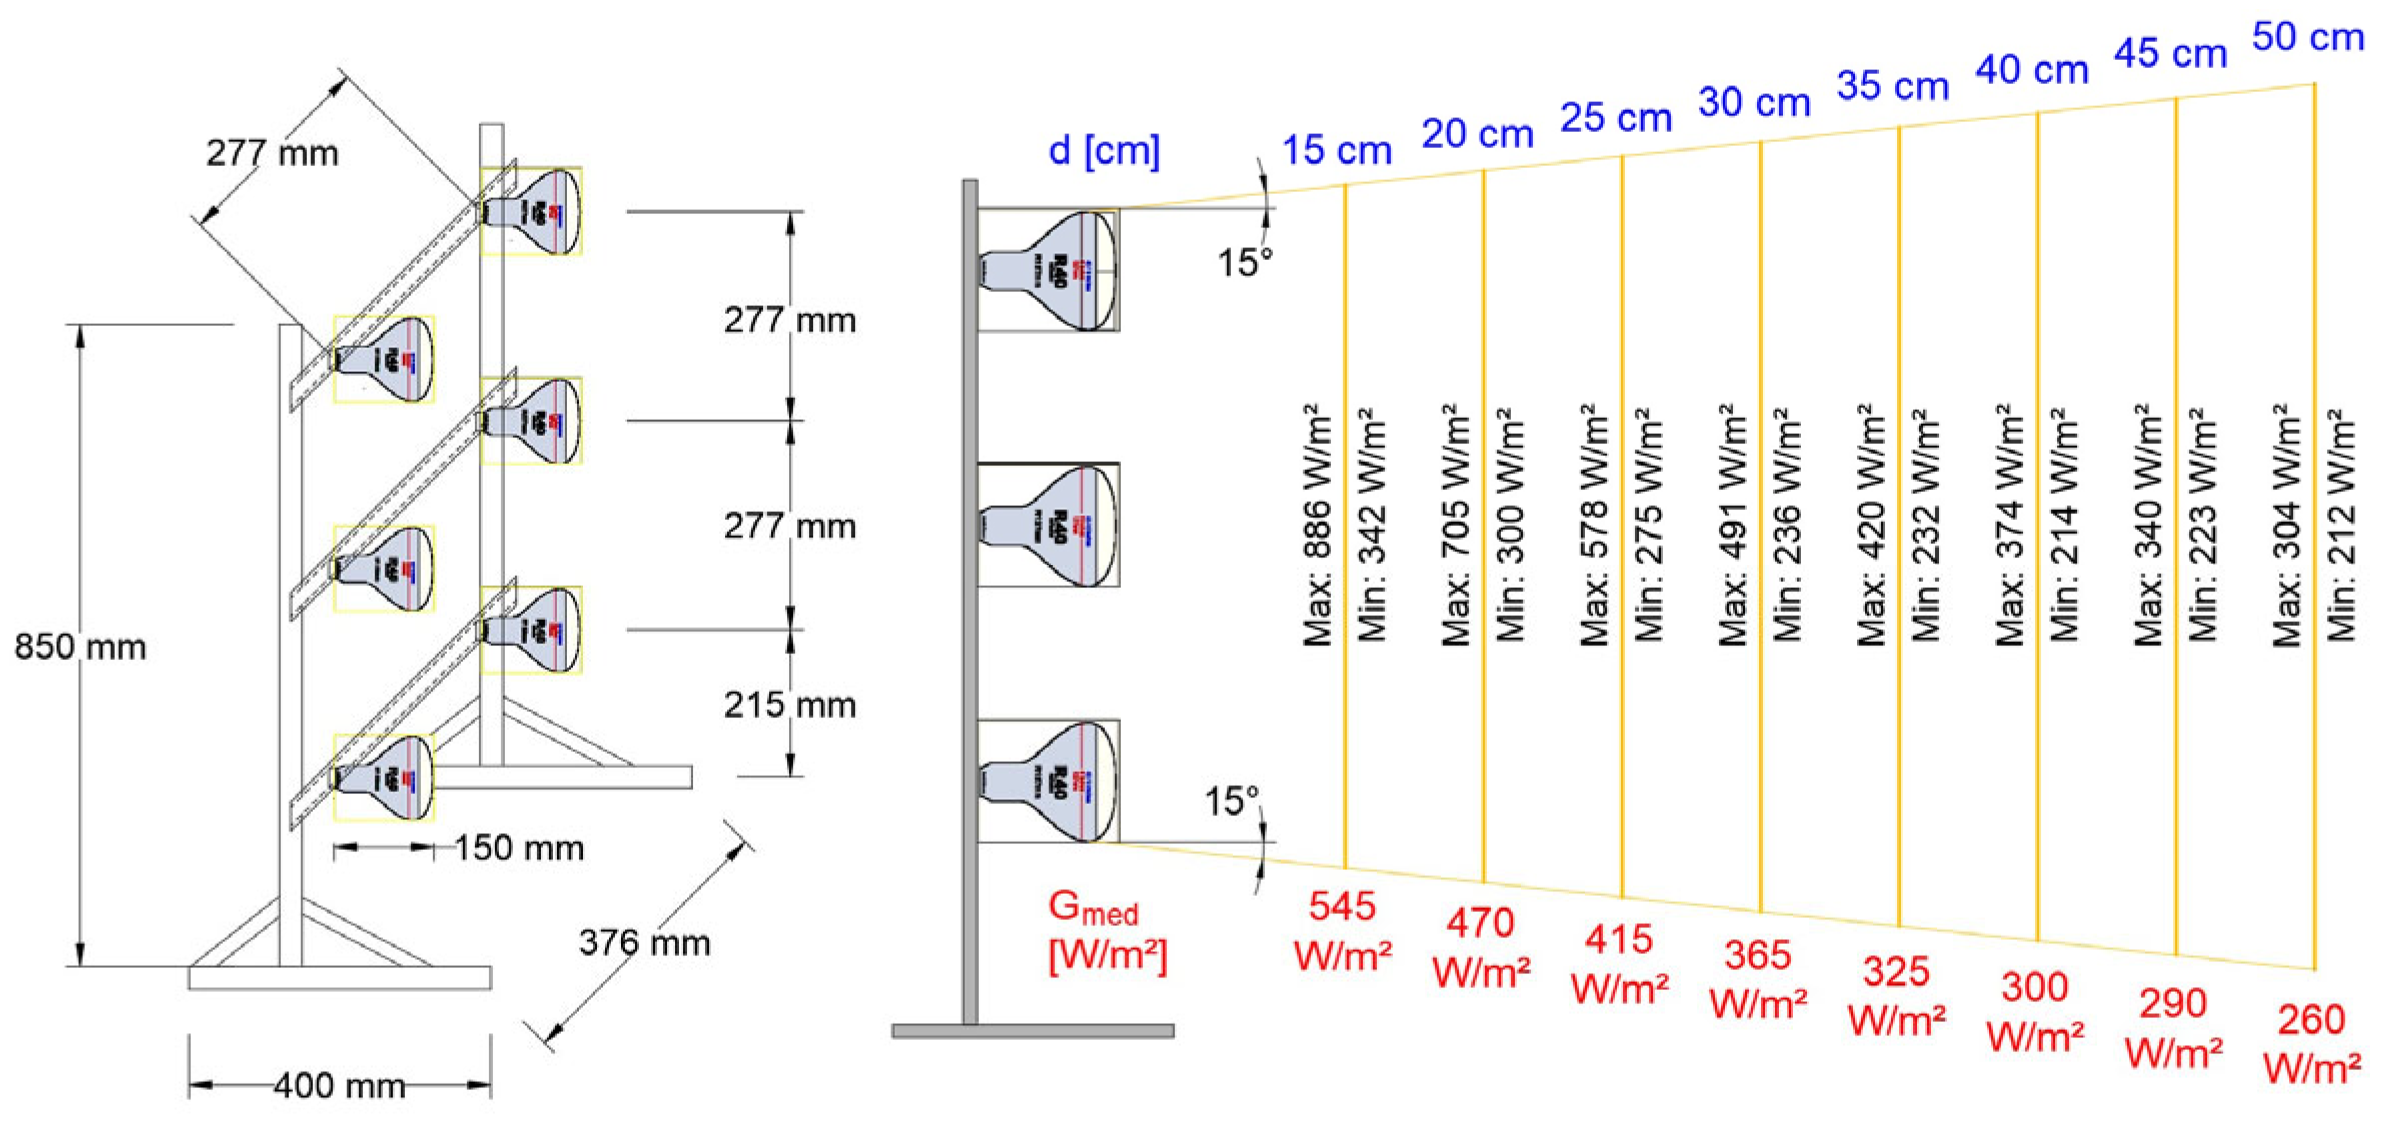
Figure 2.
Experimental setup for testing the photovoltaic panels in the double climatic chamber.
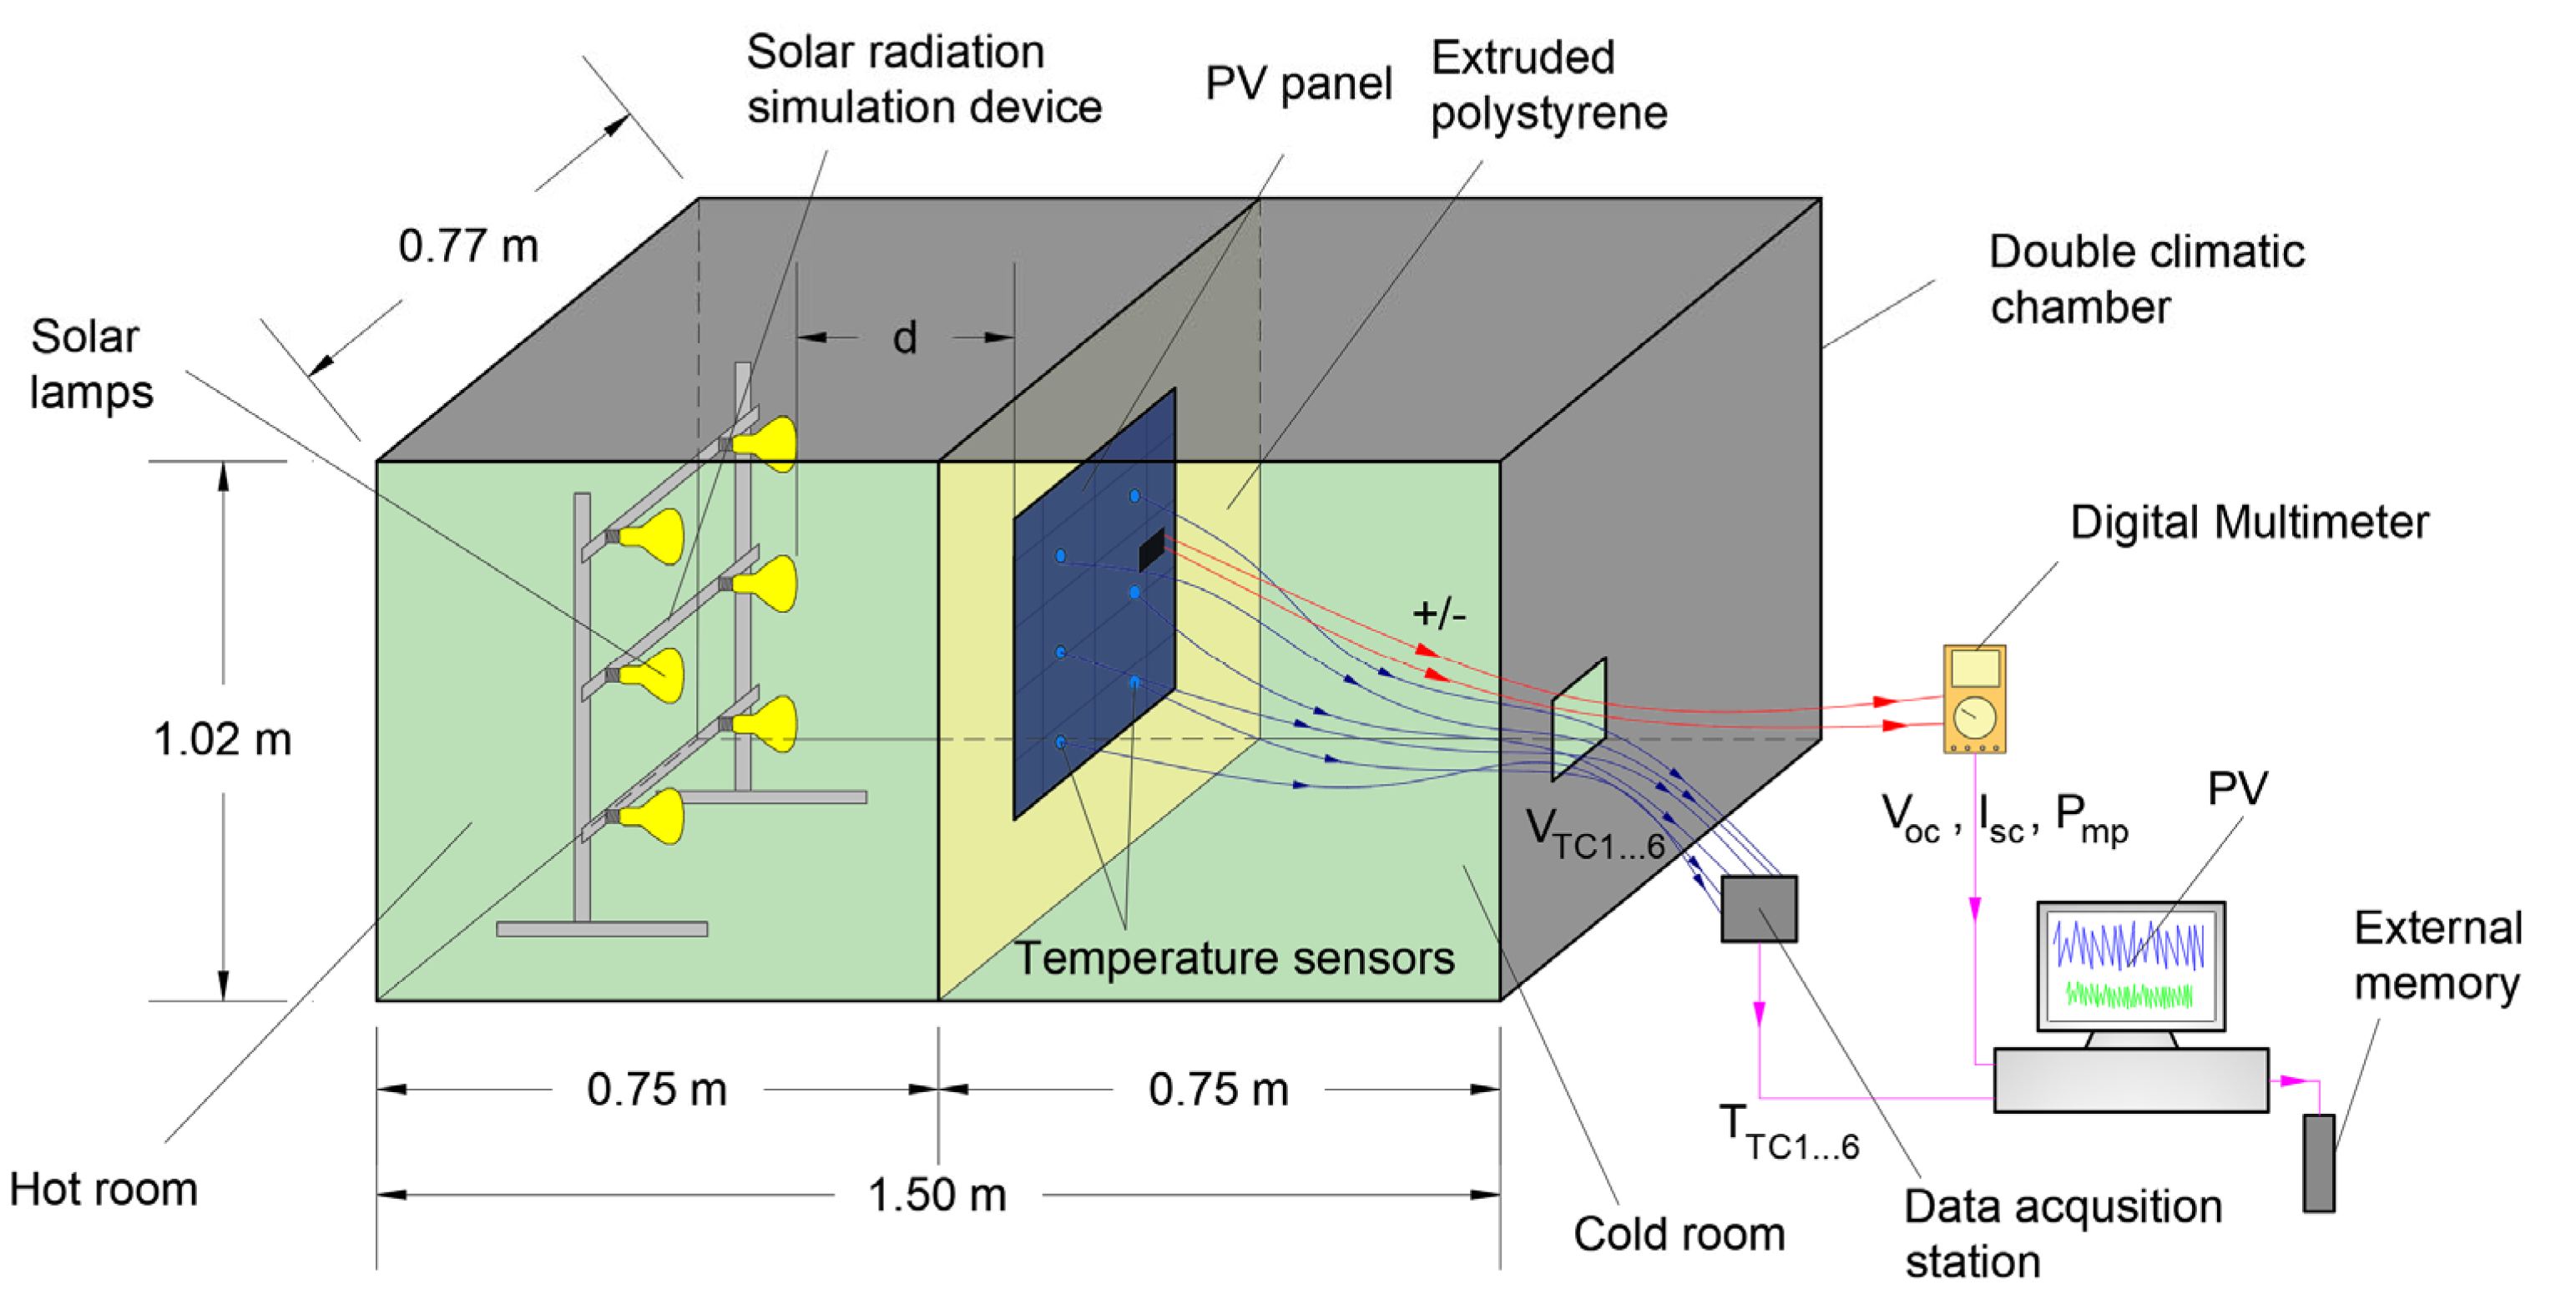
Figure 3.
Elements of the experimental stand a) cold room opened (conductors and thermocouples); b) cold room closed (data acquisition devices).
Figure 3.
Elements of the experimental stand a) cold room opened (conductors and thermocouples); b) cold room closed (data acquisition devices).
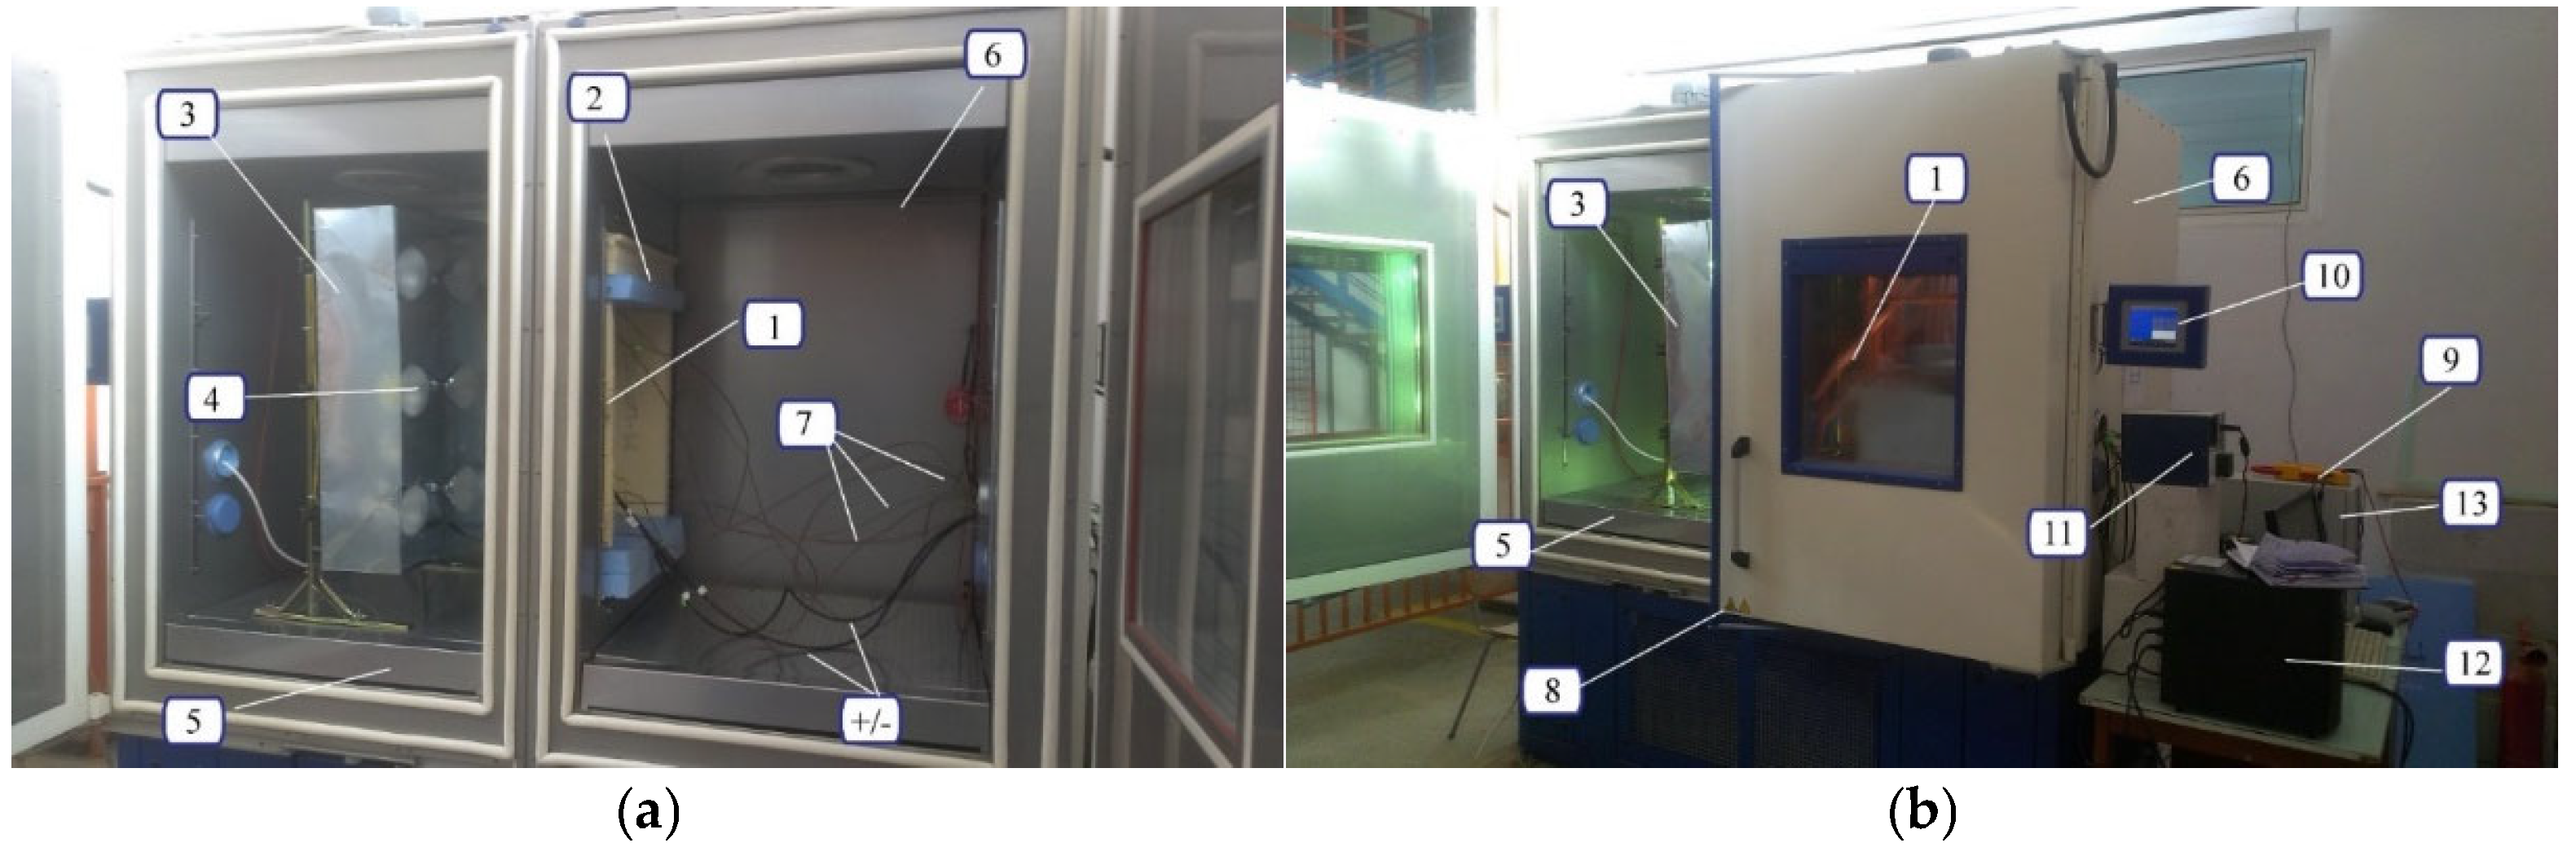
Figure 7.
Distribution of temperatures on monocrystalline panel at Tmed: a) 50 °C; b) 55 °C; c) 60 °C; d) 65 °C; e) 70 °C; f) 75 °C.
Figure 7.
Distribution of temperatures on monocrystalline panel at Tmed: a) 50 °C; b) 55 °C; c) 60 °C; d) 65 °C; e) 70 °C; f) 75 °C.
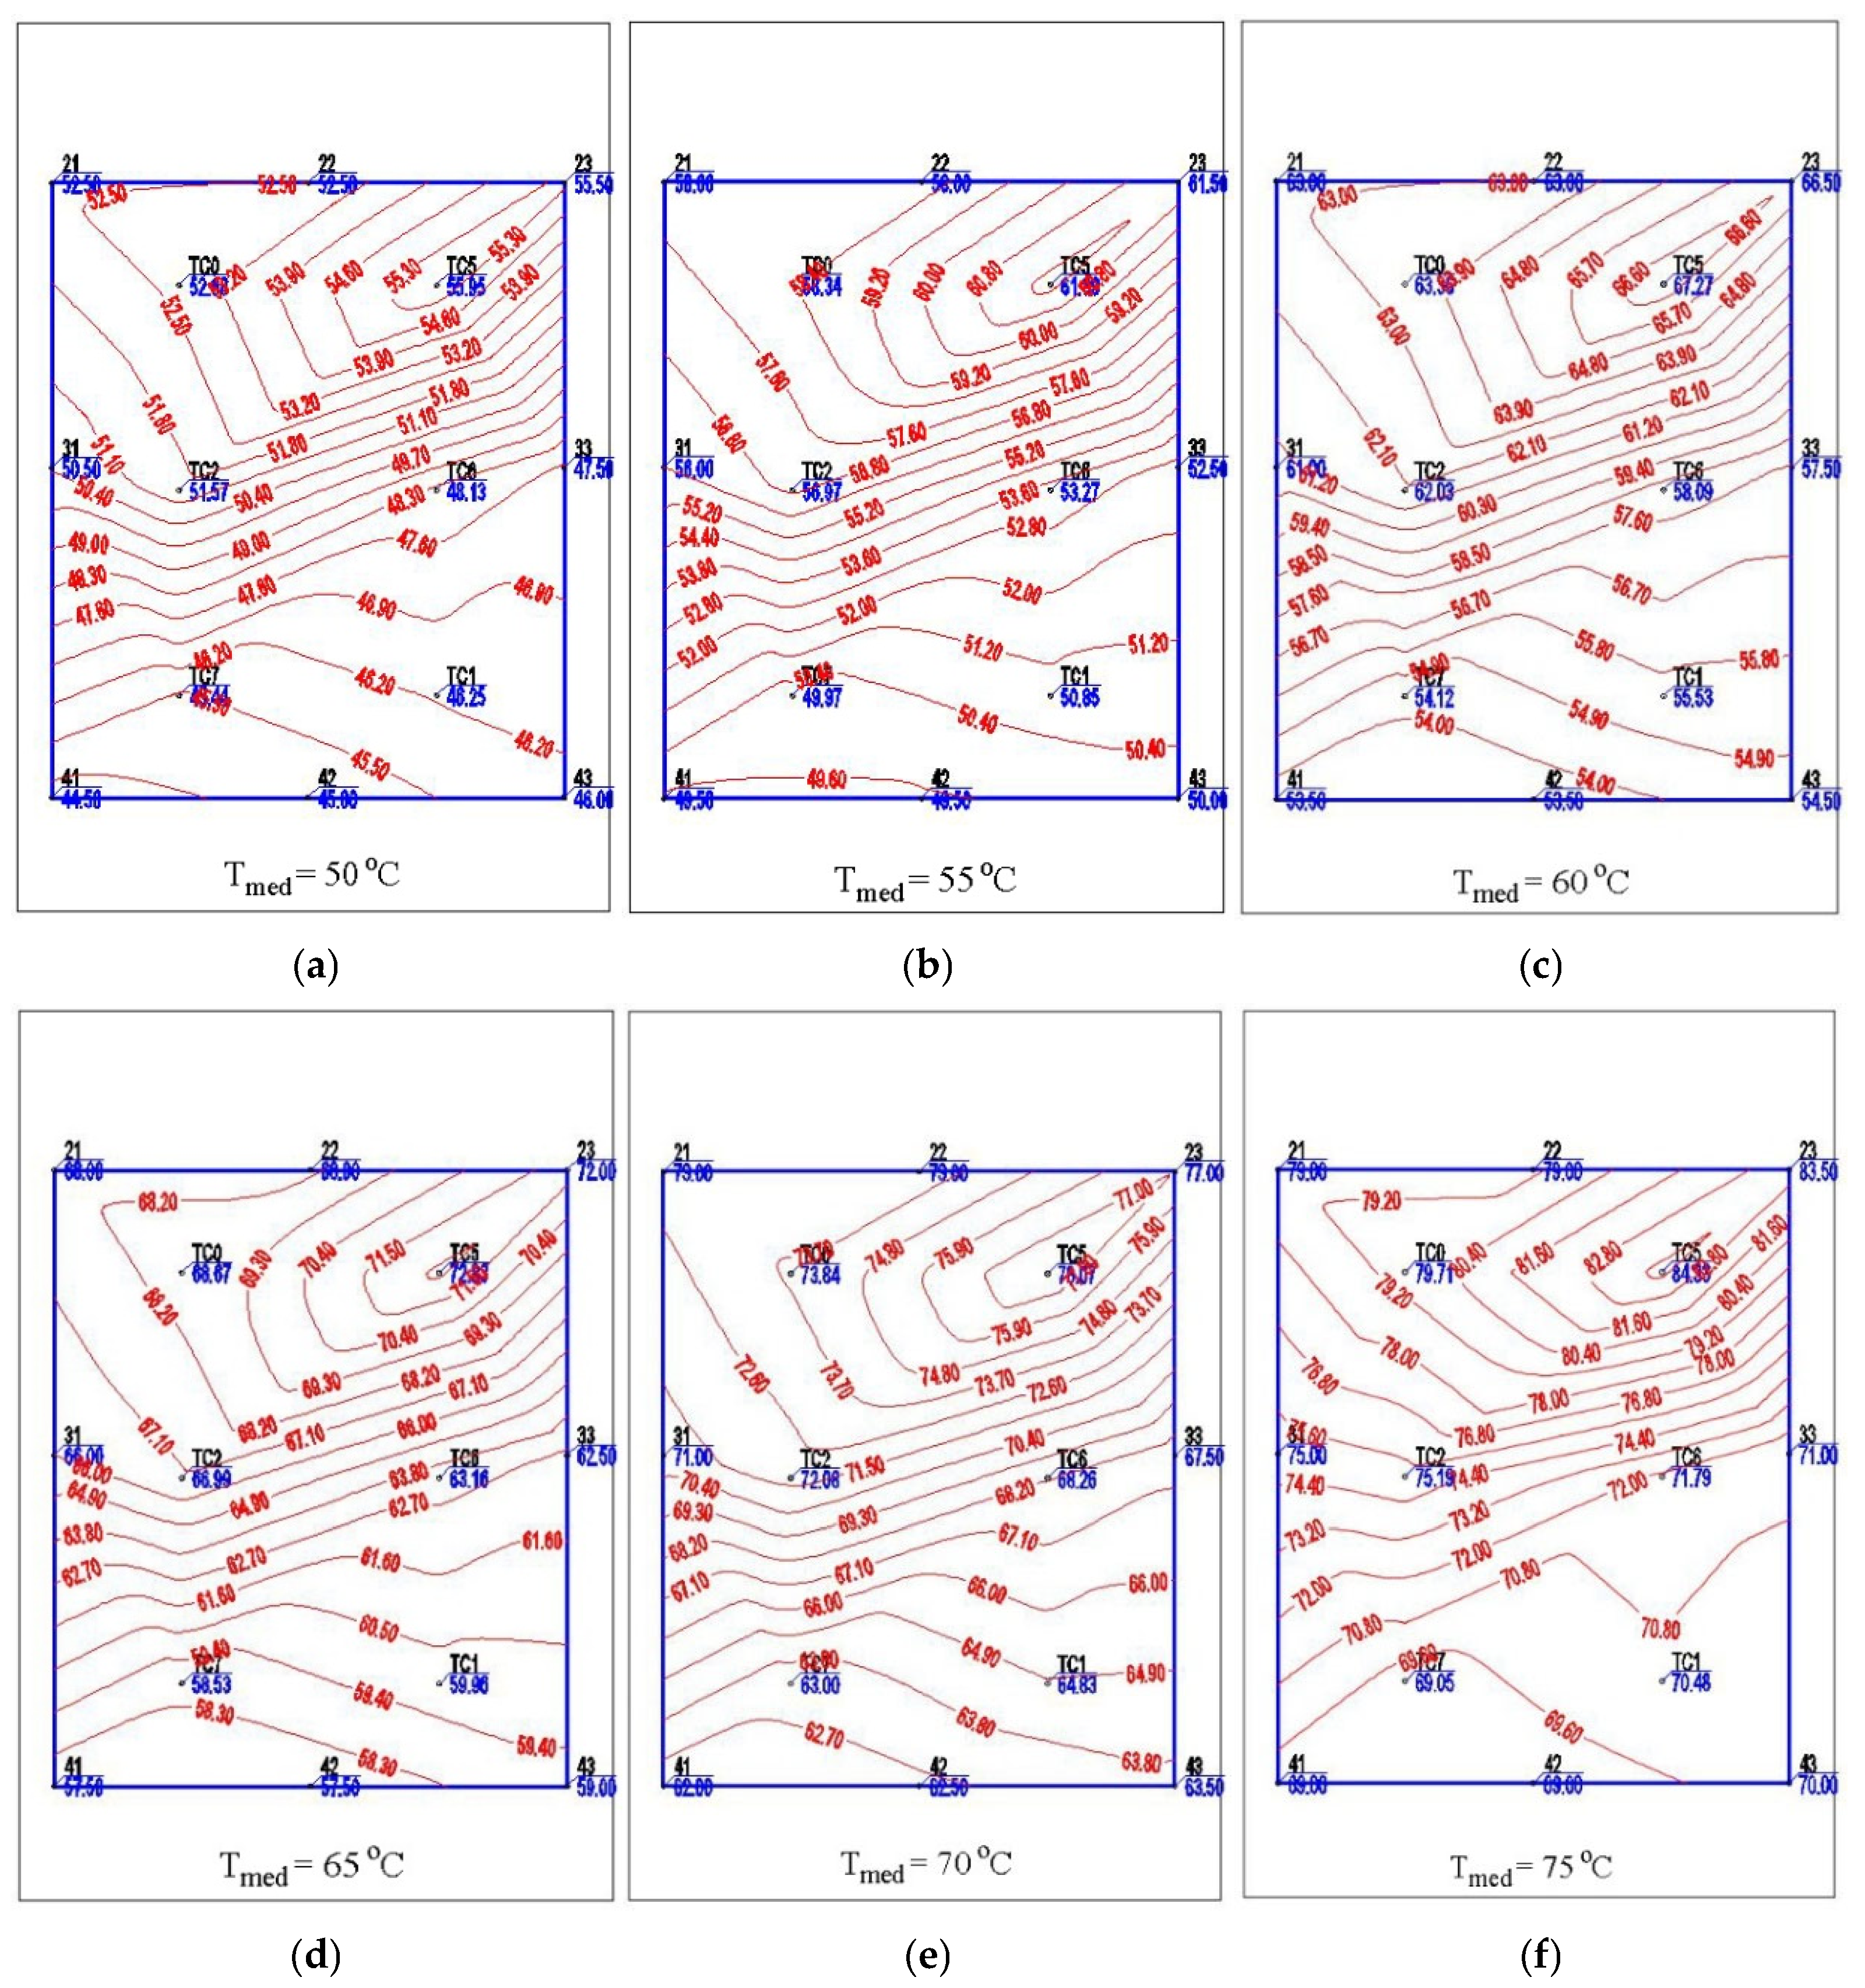
Figure 8.
Confirmation of the temperature distribution at Tmed = 40 °C: a) based on the measurements with thermocouples on the back of PV; b) captures thermal imaging camera.
Figure 8.
Confirmation of the temperature distribution at Tmed = 40 °C: a) based on the measurements with thermocouples on the back of PV; b) captures thermal imaging camera.
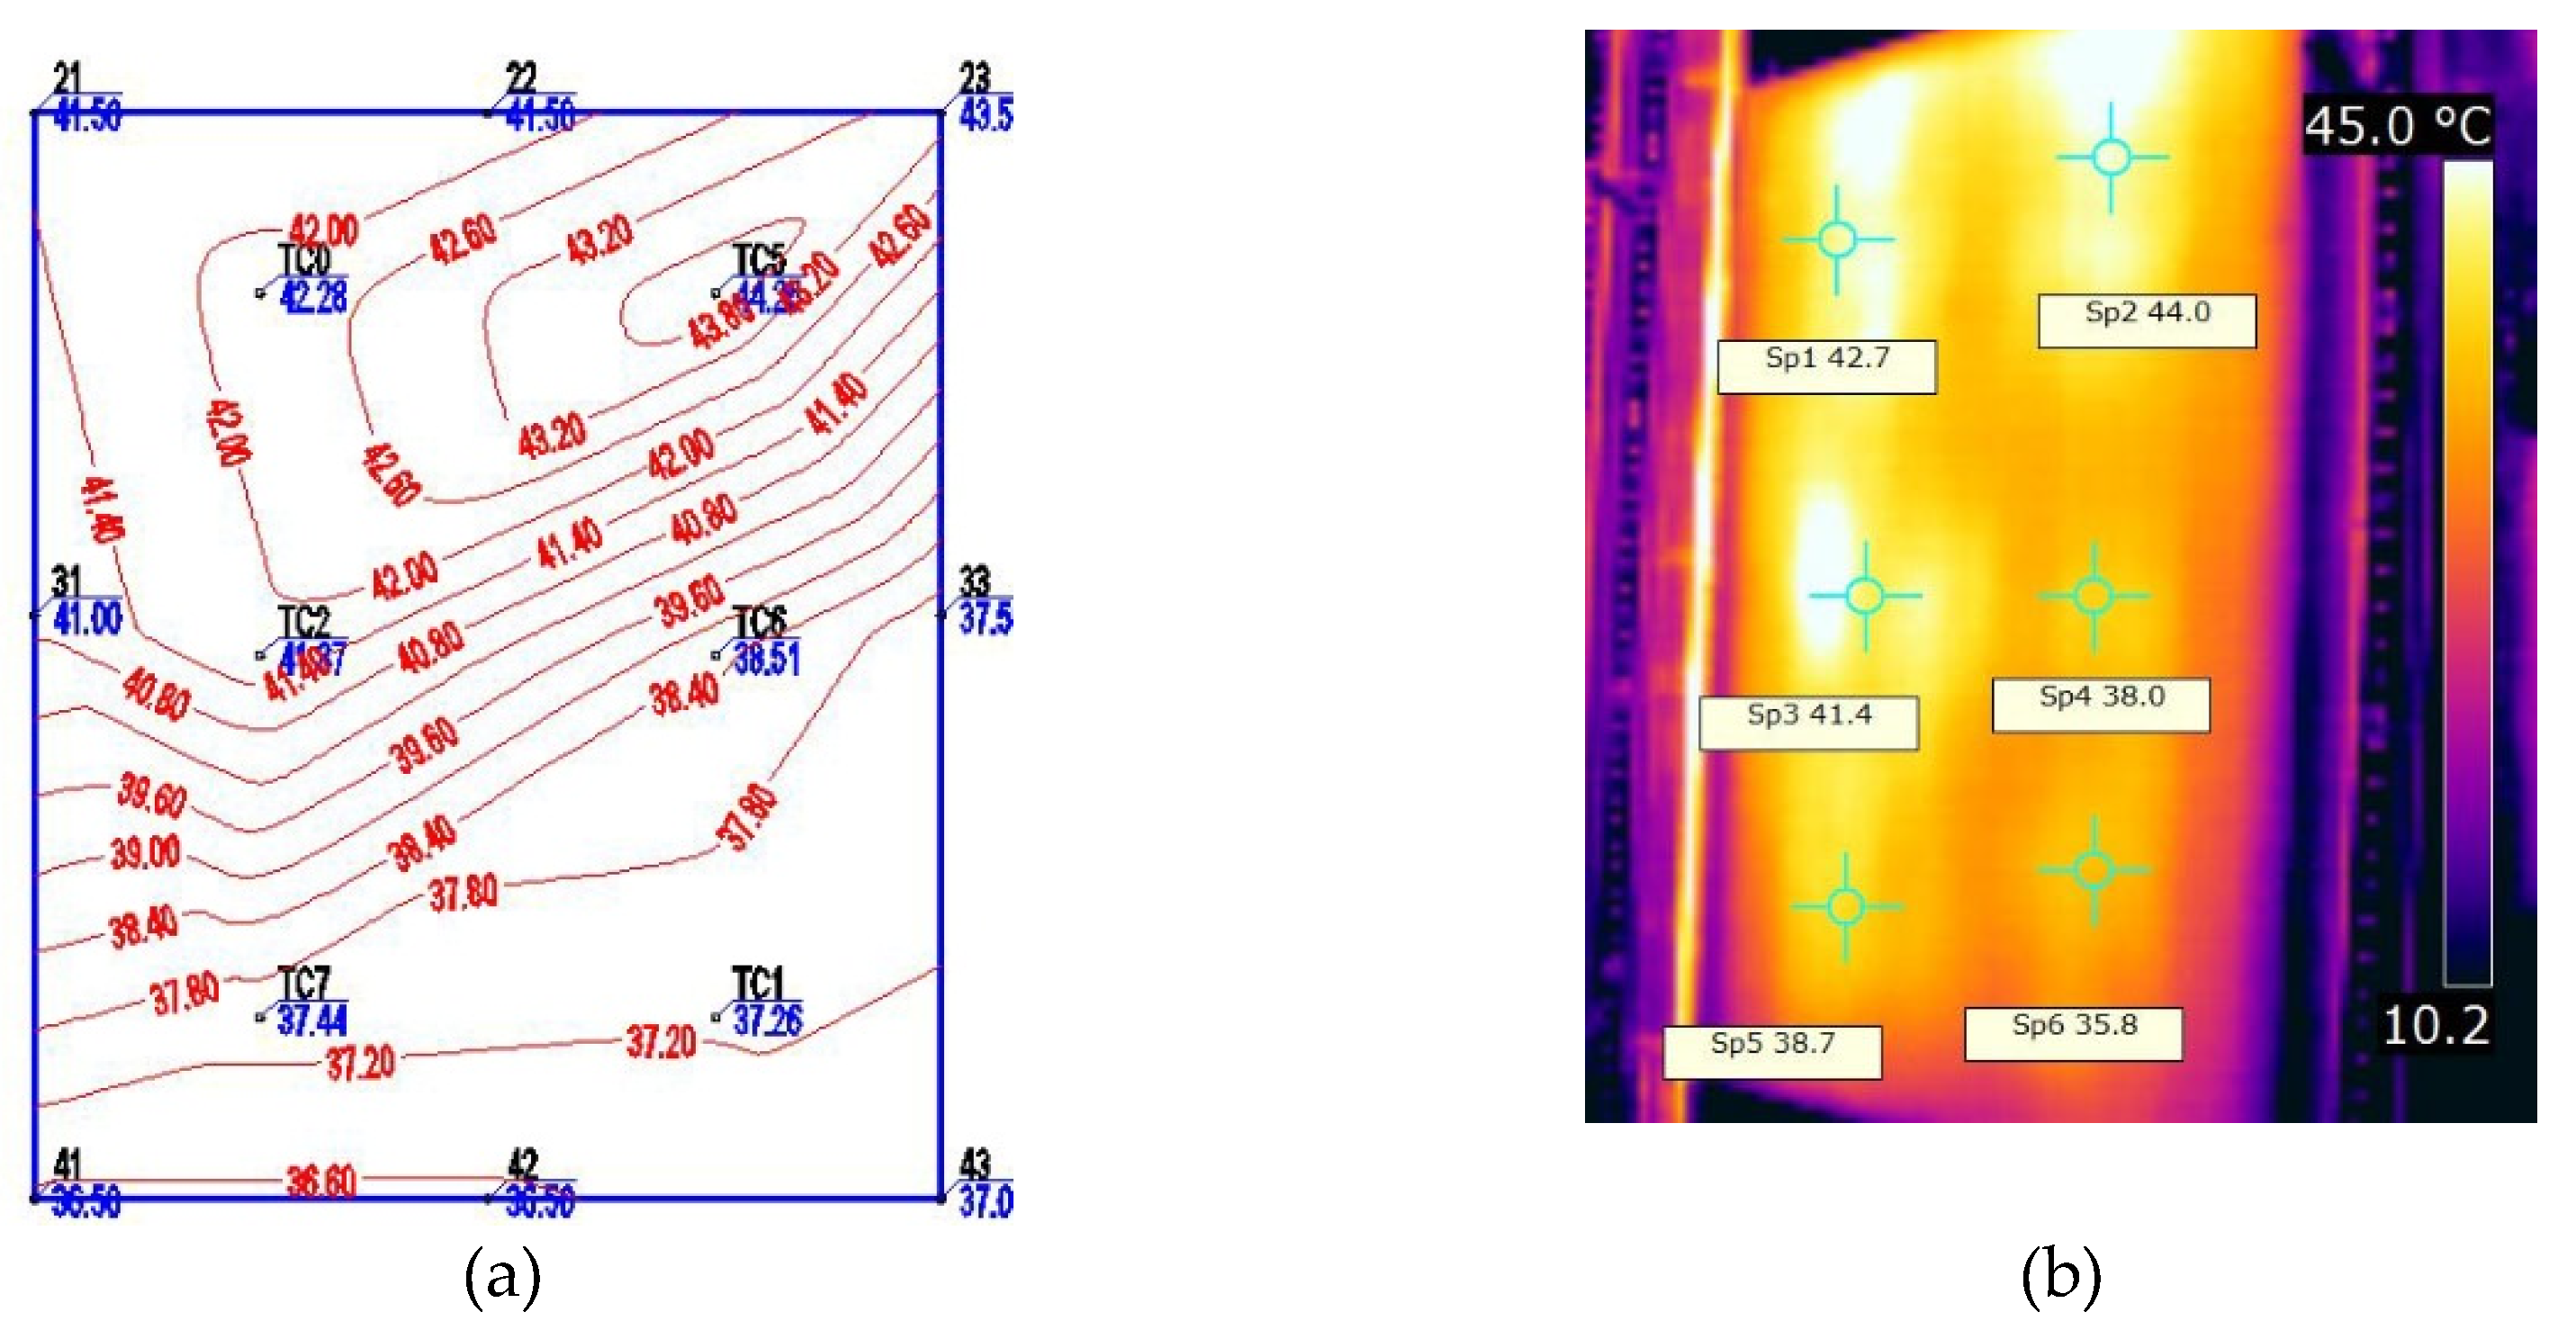
Figure 9.
Overheating of photovoltaic cells in the connection box area: a) front view; b) rear view.
Figure 9.
Overheating of photovoltaic cells in the connection box area: a) front view; b) rear view.
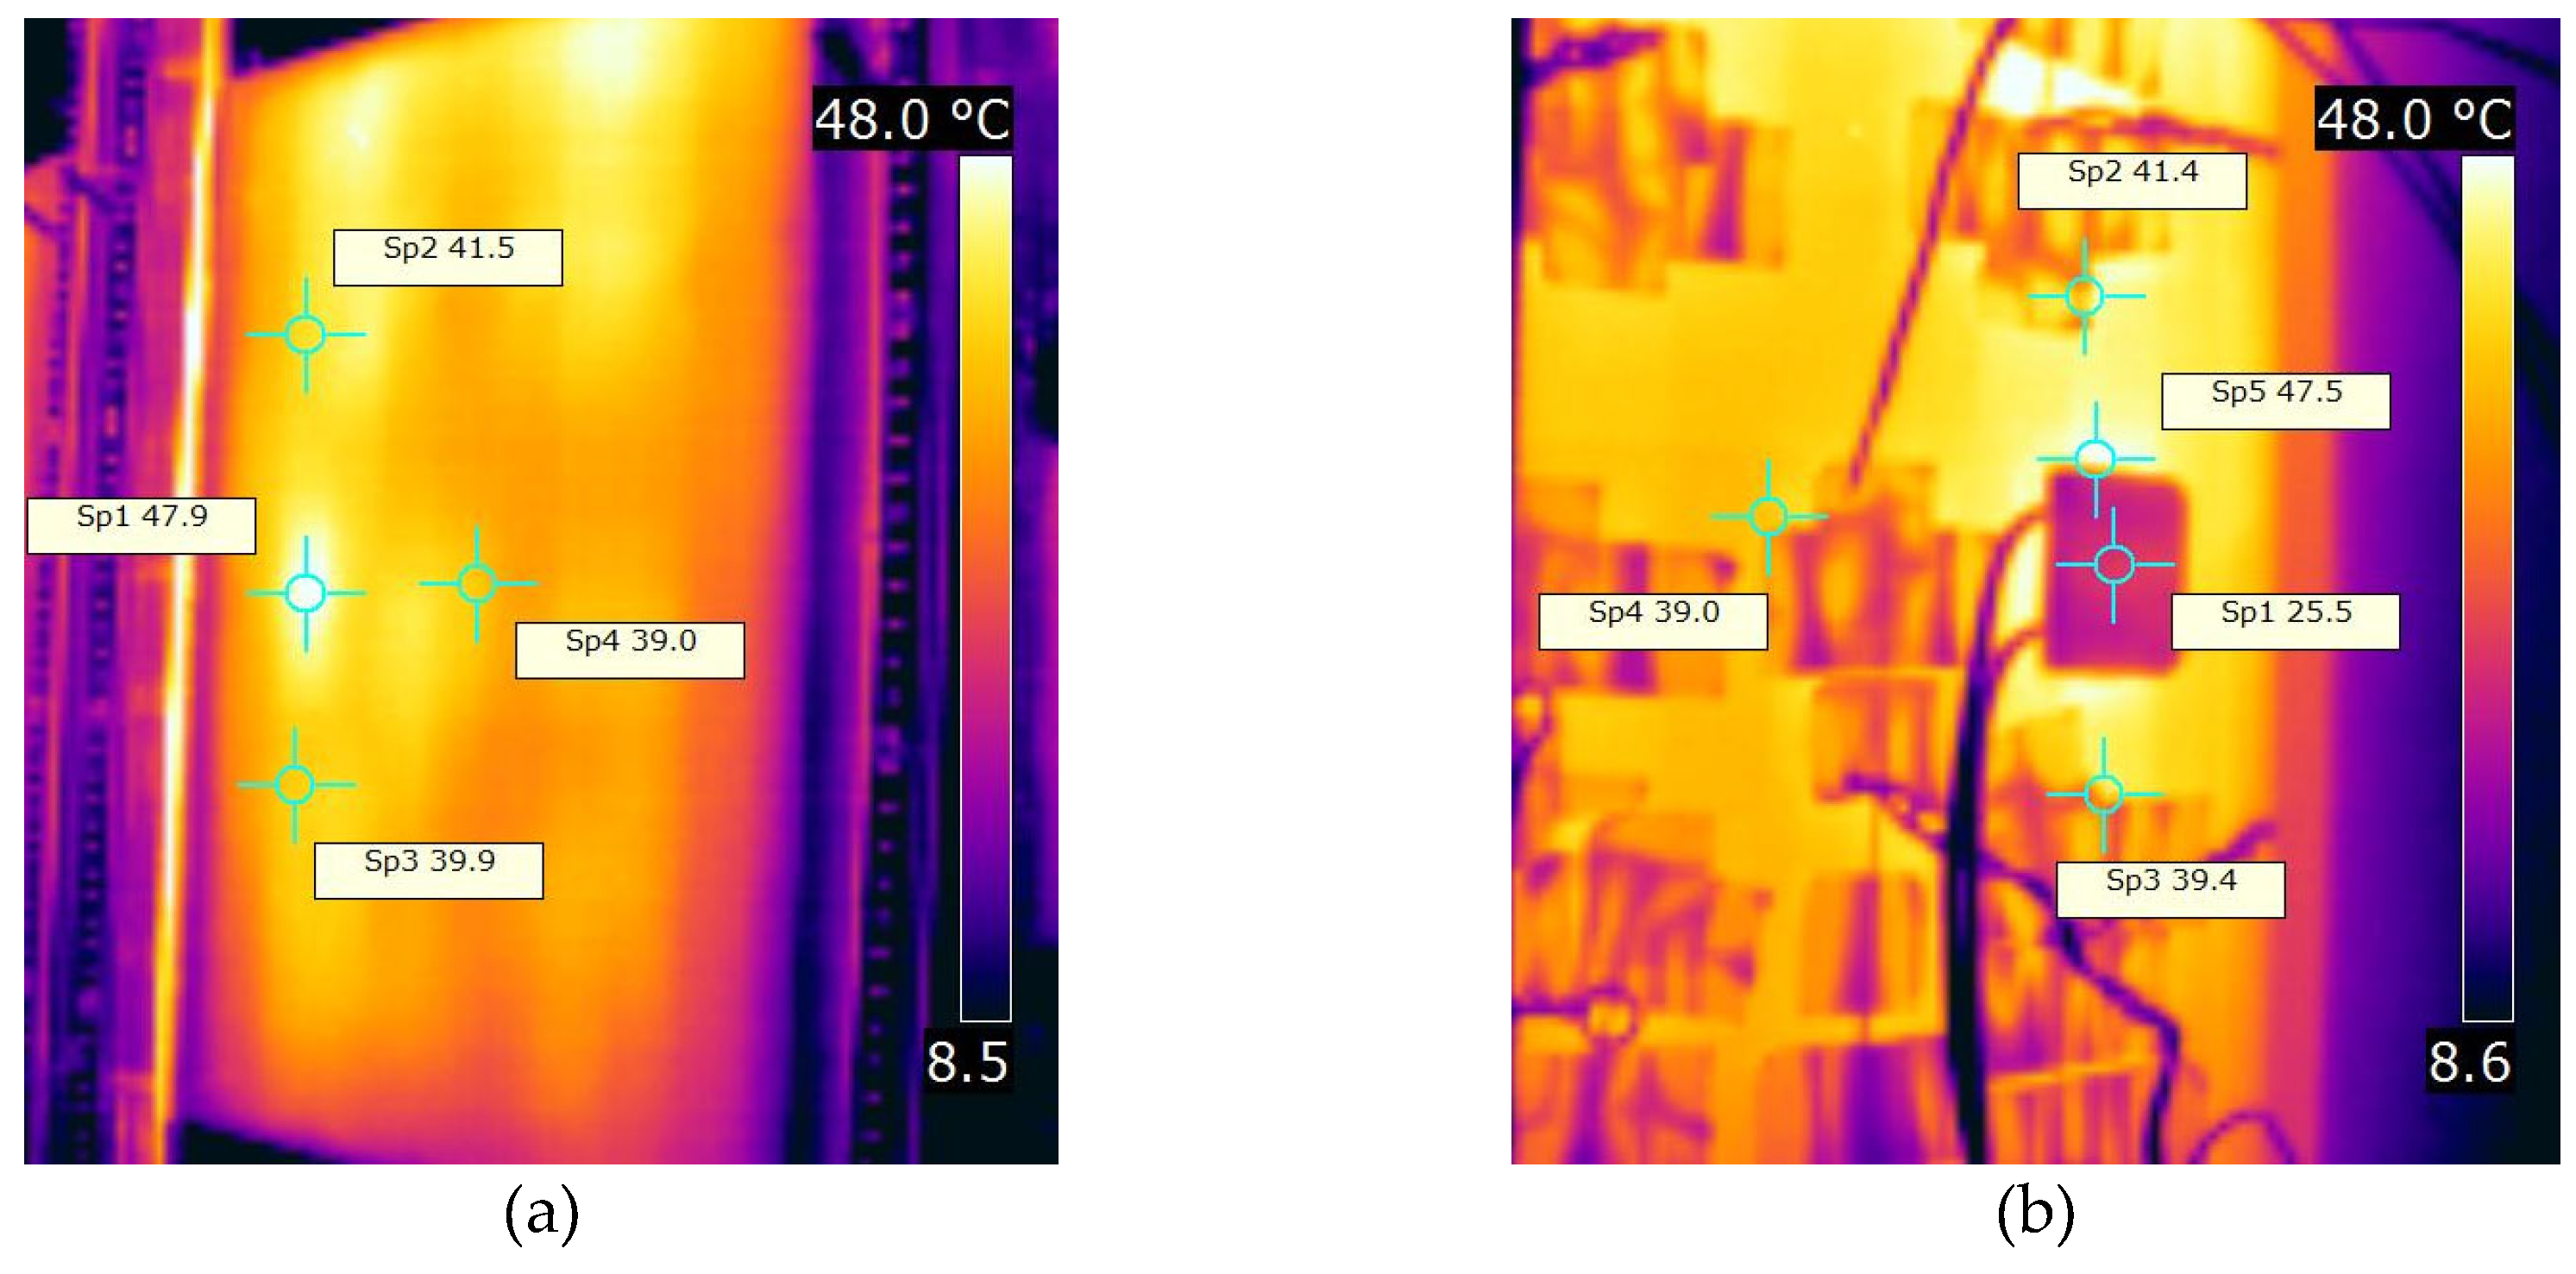
Figure 10.
Maximum power output depending on the monocrystalline PV panel temperature and resistive load for Gmed = 560 W/m2.
Figure 10.
Maximum power output depending on the monocrystalline PV panel temperature and resistive load for Gmed = 560 W/m2.
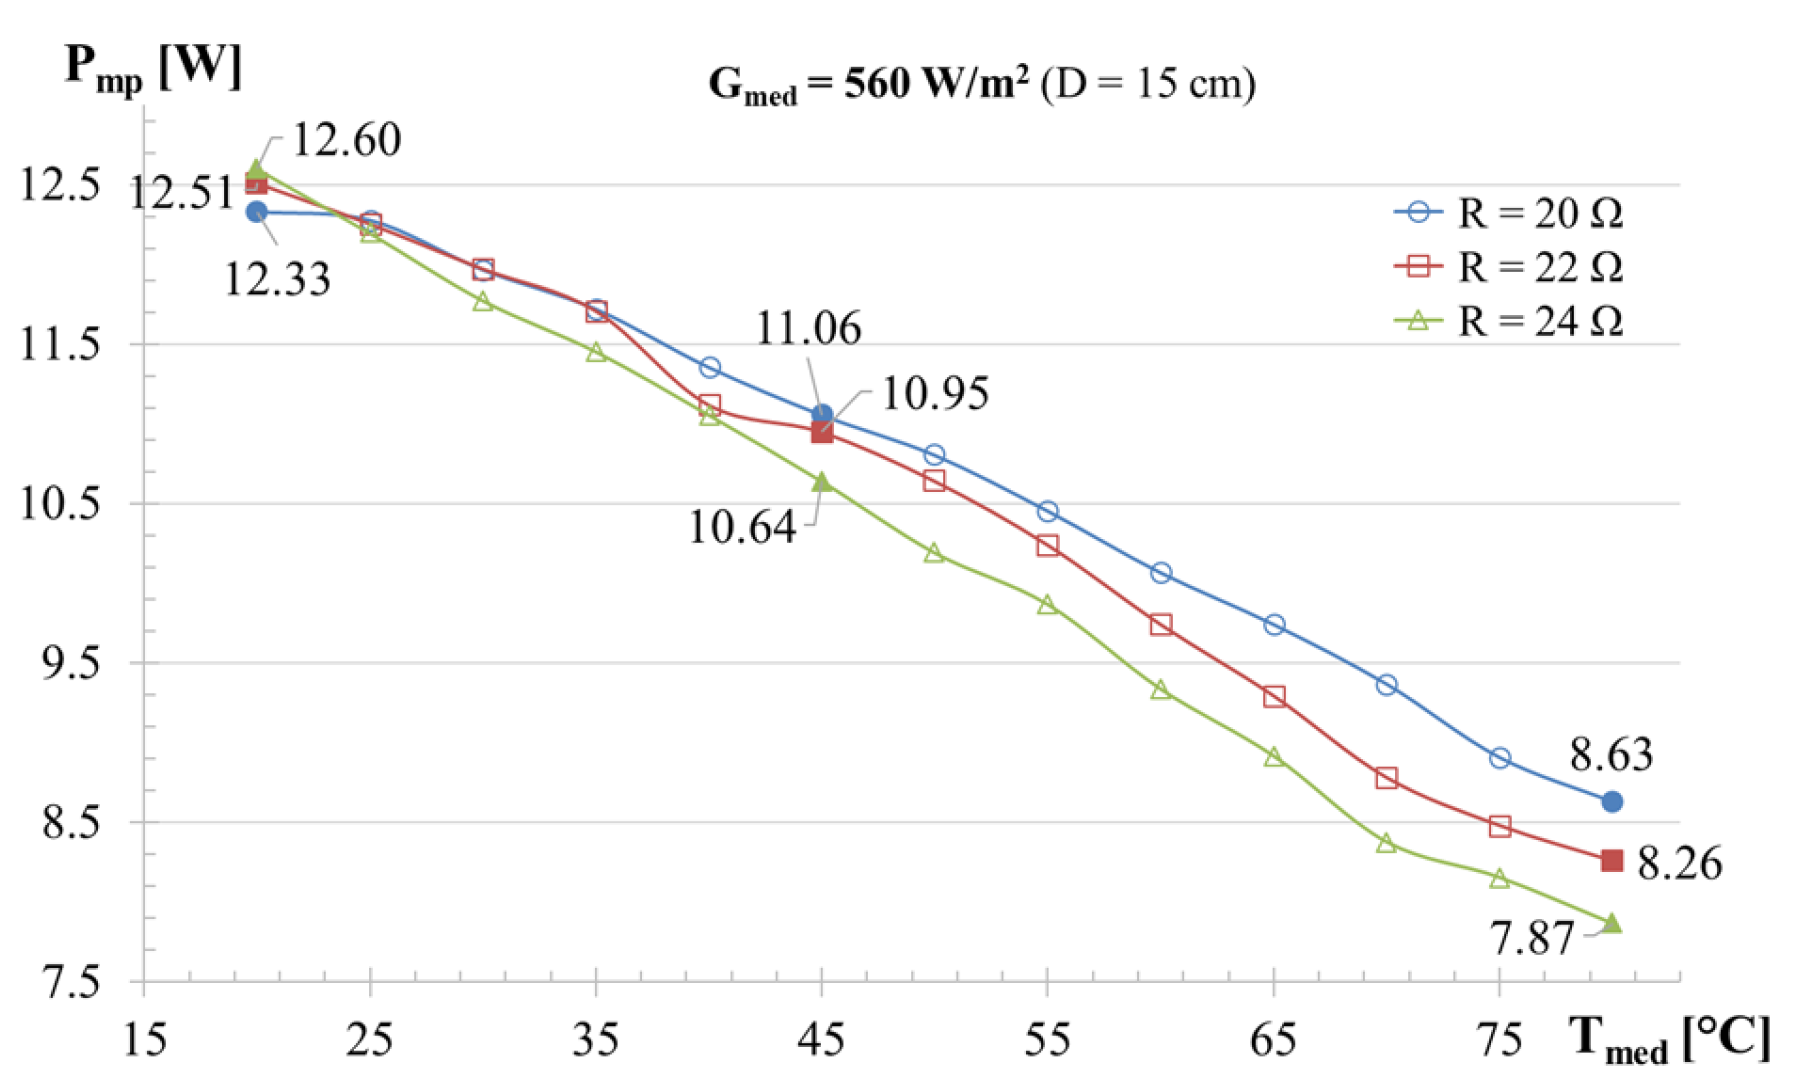
Figure 11.
Variation of open circuit voltage and short-circuit current of monocrystalline PV panel with temperature for Gmed = 560 W/m2.
Figure 11.
Variation of open circuit voltage and short-circuit current of monocrystalline PV panel with temperature for Gmed = 560 W/m2.
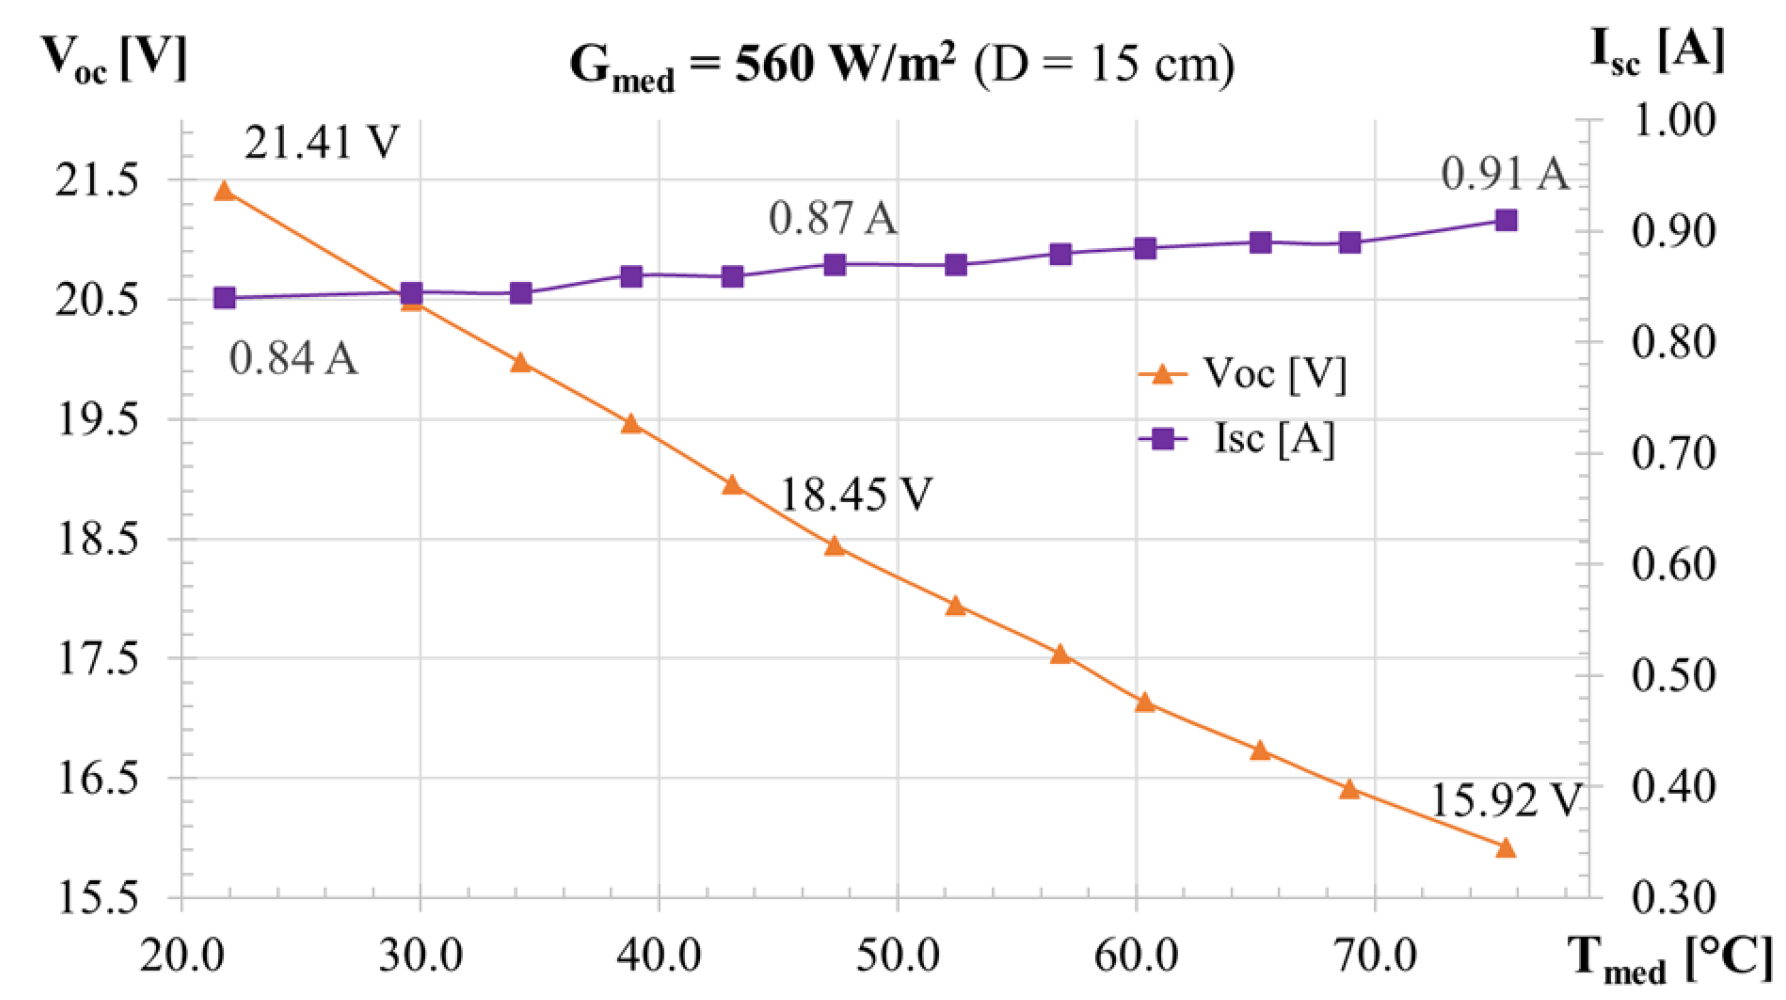
Figure 12.
Instantaneous effect of PV panel cooling on the open circuit voltage for Gmed = 560 W/m2.
Figure 12.
Instantaneous effect of PV panel cooling on the open circuit voltage for Gmed = 560 W/m2.
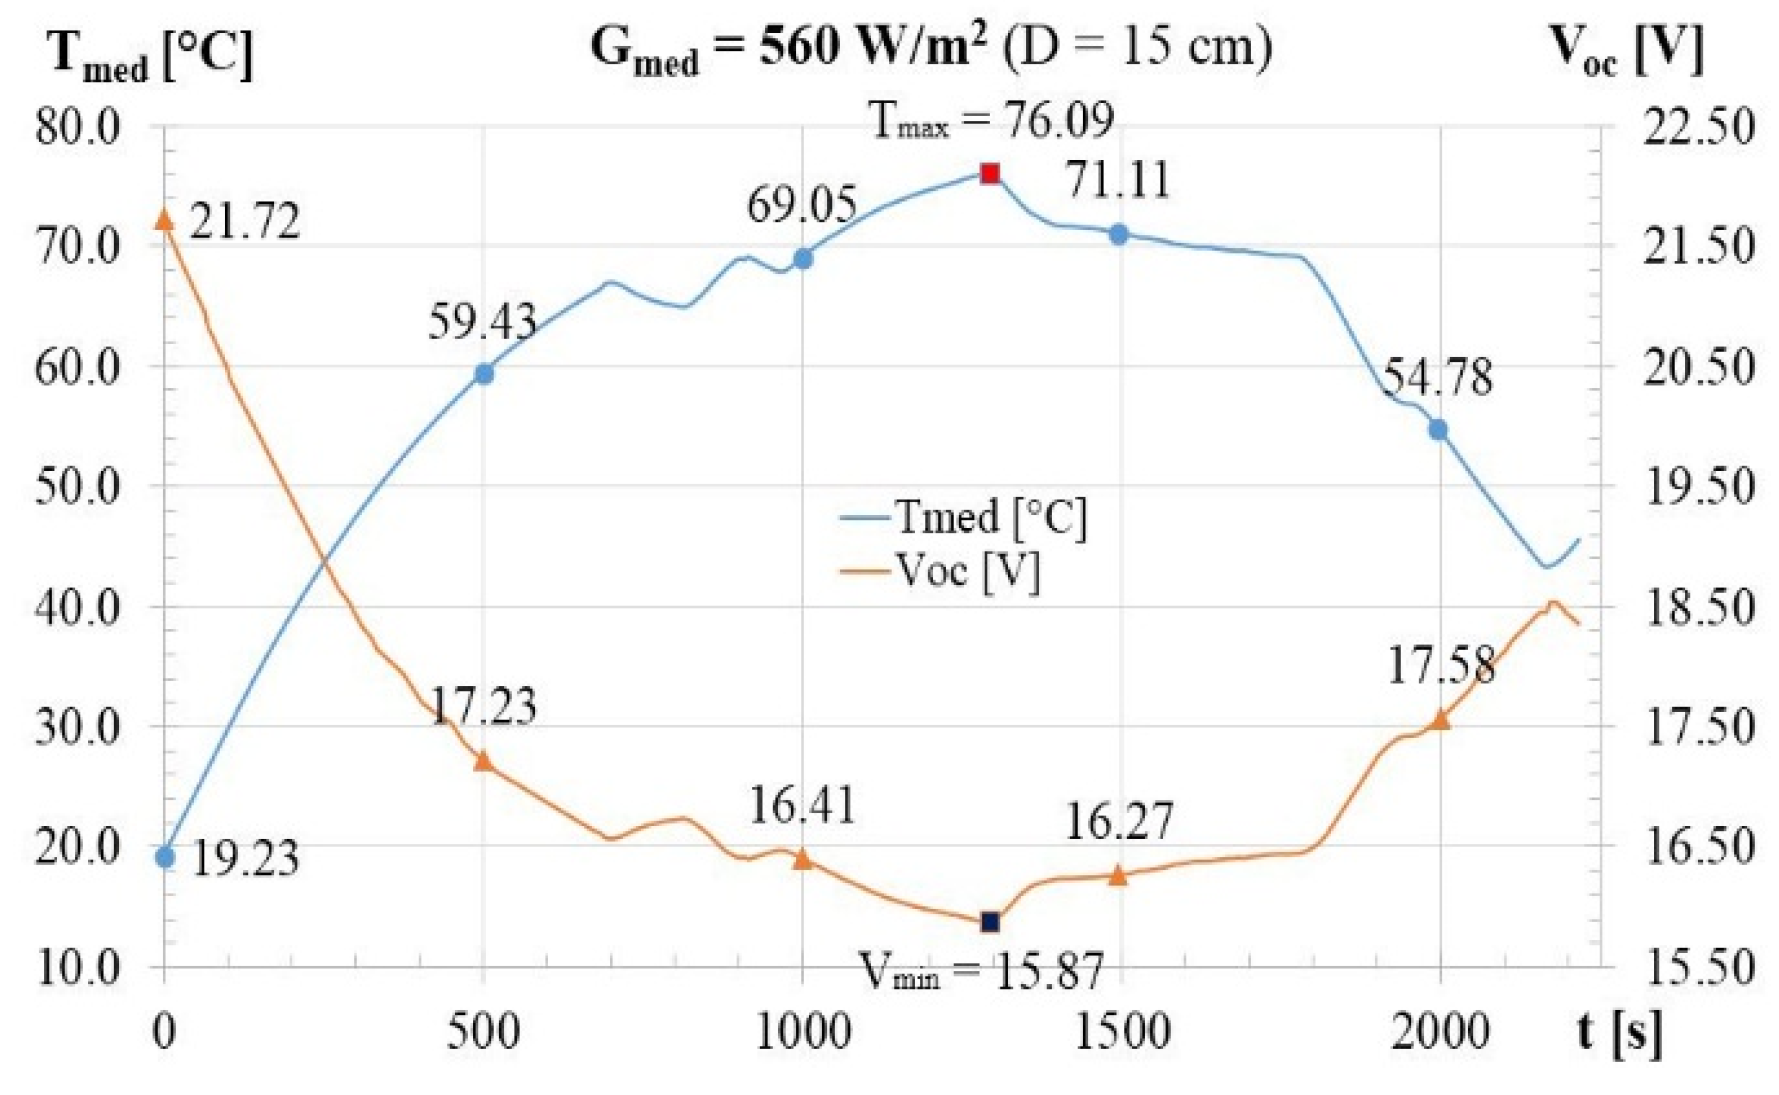
Figure 13.
Variation of the efficiency of the PV panel with the operating temperature for Gmed = 560 W/m2.
Figure 13.
Variation of the efficiency of the PV panel with the operating temperature for Gmed = 560 W/m2.
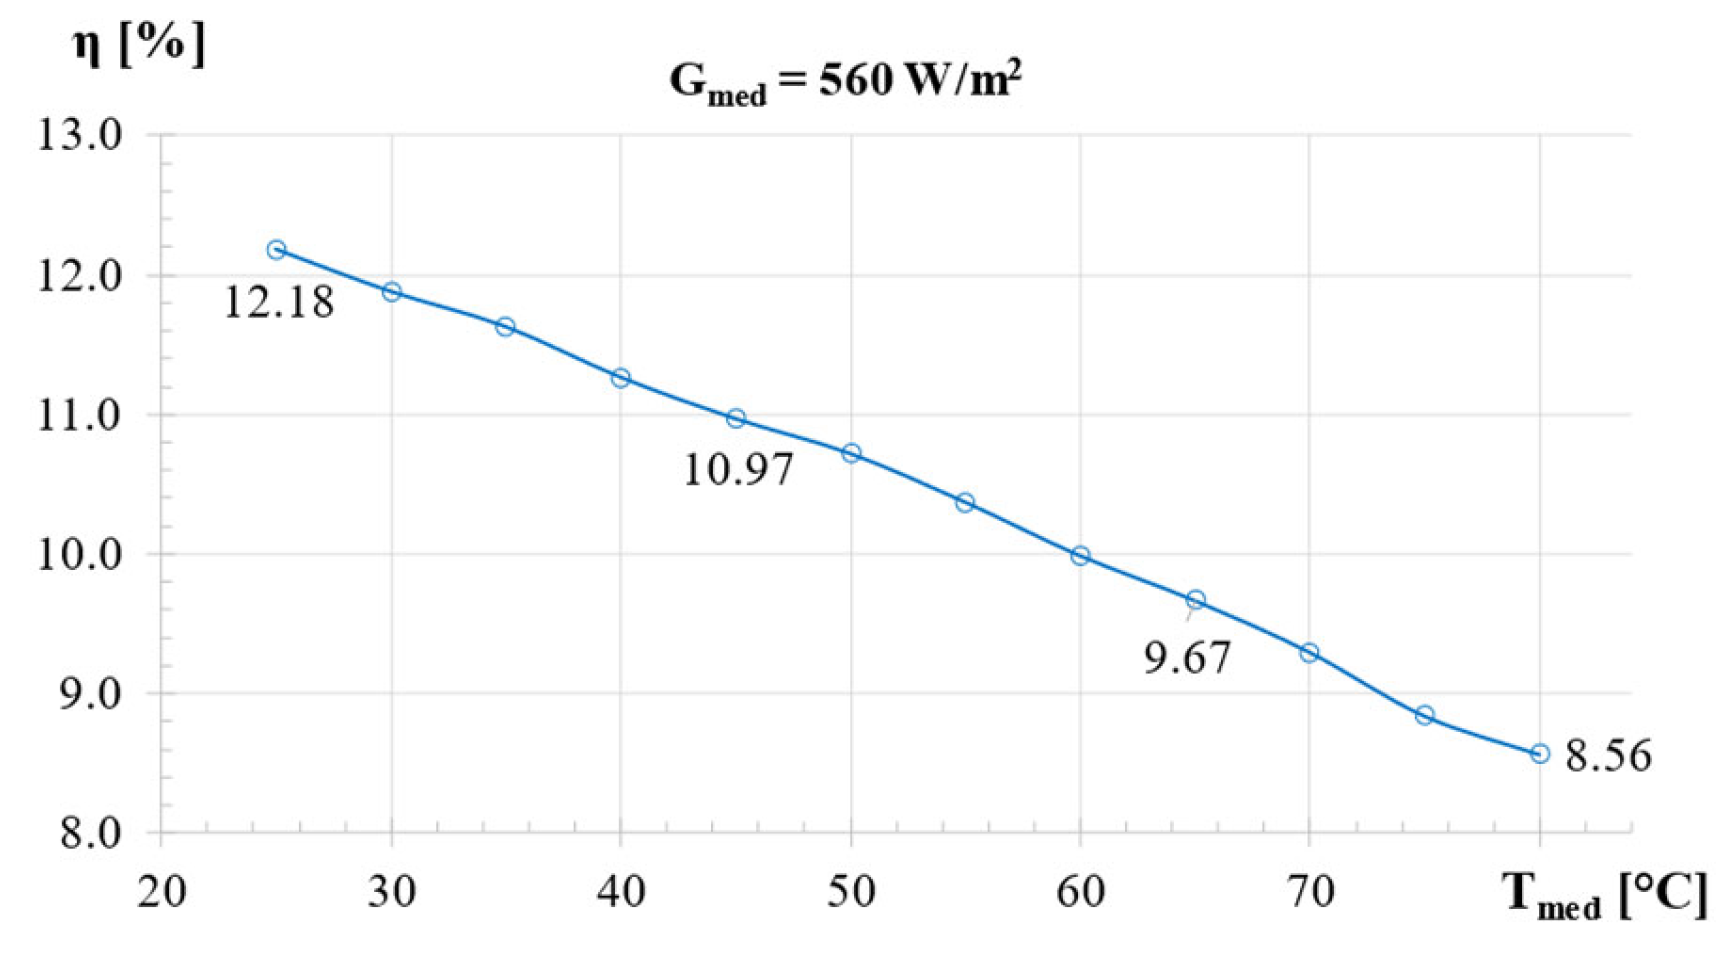
Figure 14.
Coefficients of variation on temperature intervals at Gmed = 560 W/m2 for: a) efficiency and open circuit voltage; b) short-circuit current and open circuit voltage.
Figure 14.
Coefficients of variation on temperature intervals at Gmed = 560 W/m2 for: a) efficiency and open circuit voltage; b) short-circuit current and open circuit voltage.
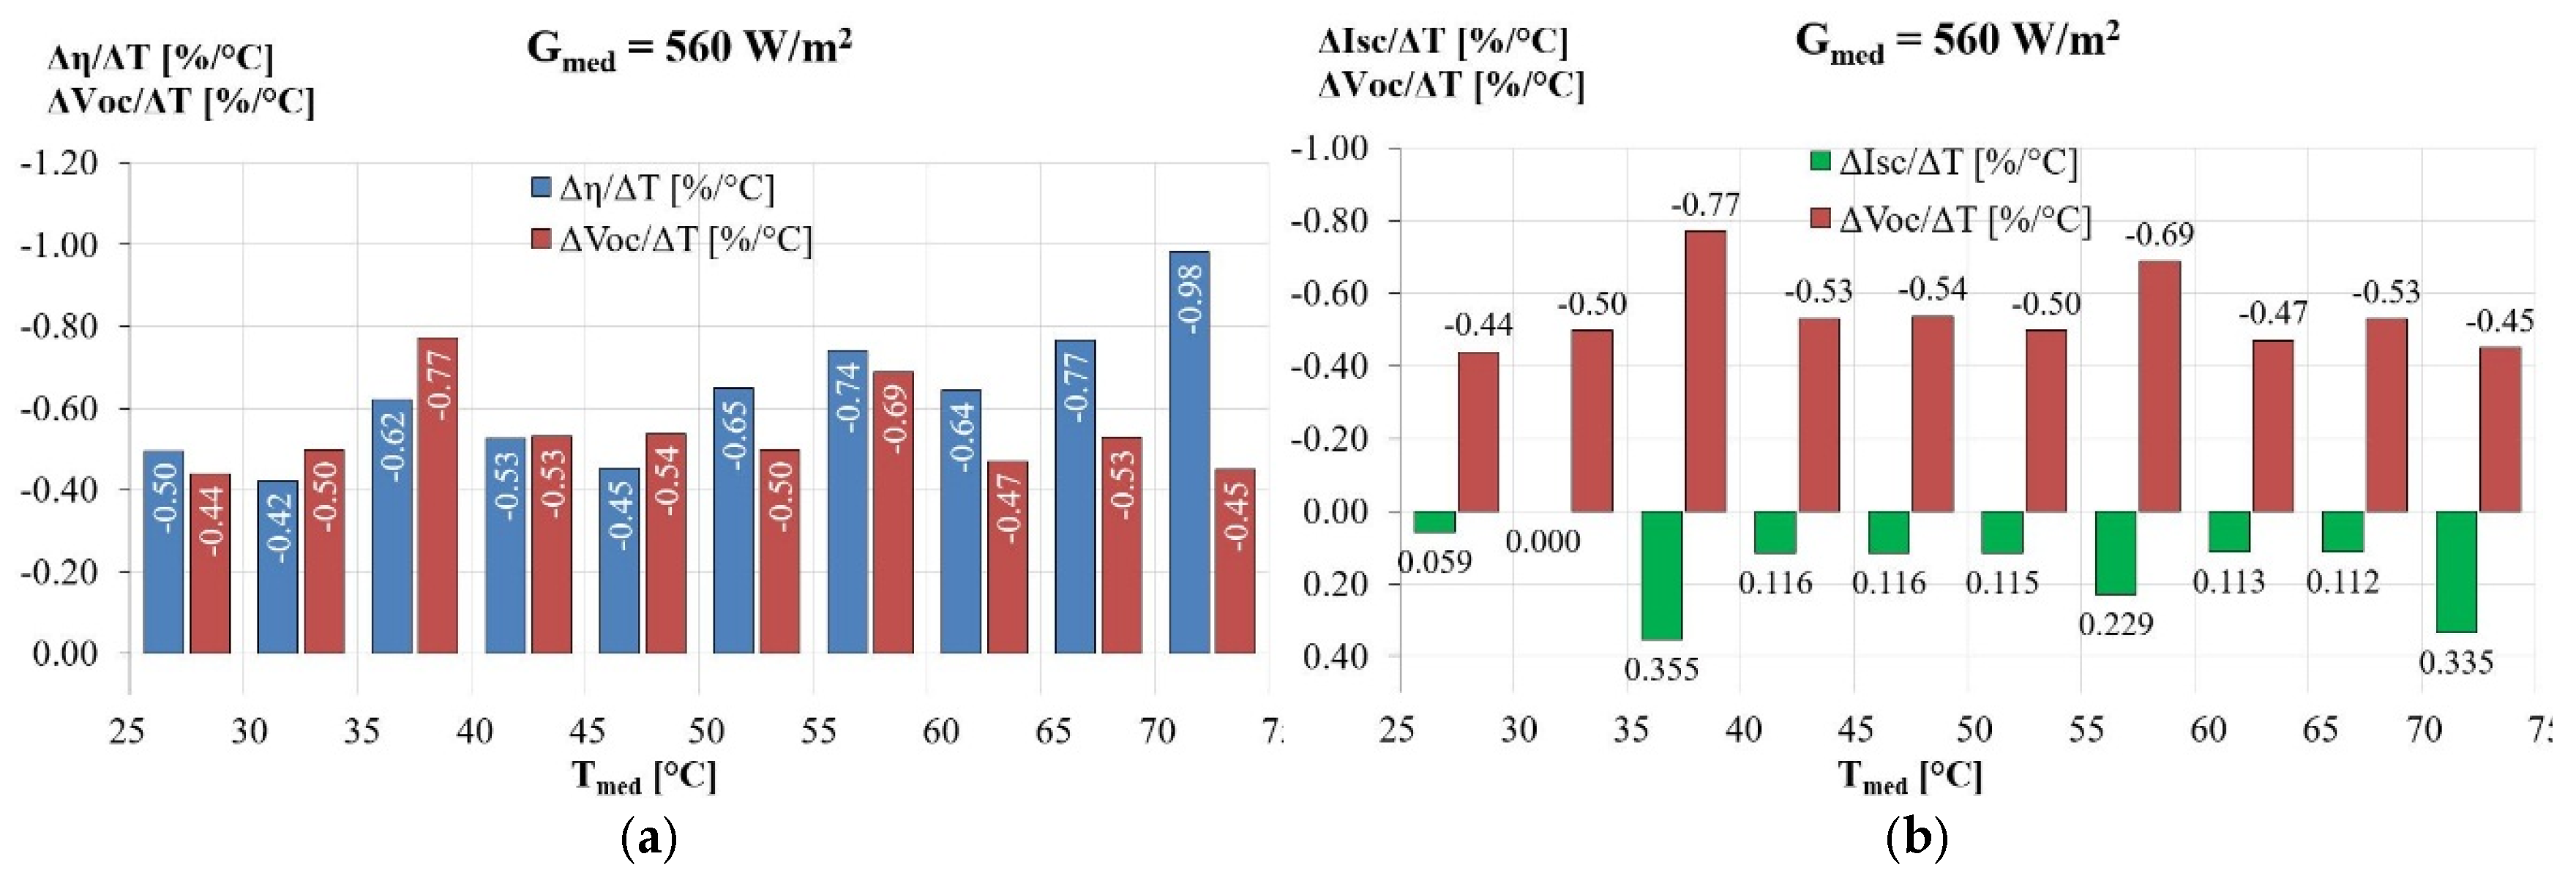
Figure 15.
Influence of the temperature variation at Gmed = 560 W/m2 over: a) efficiency and fill factor; b) power generated and efficiency.
Figure 15.
Influence of the temperature variation at Gmed = 560 W/m2 over: a) efficiency and fill factor; b) power generated and efficiency.
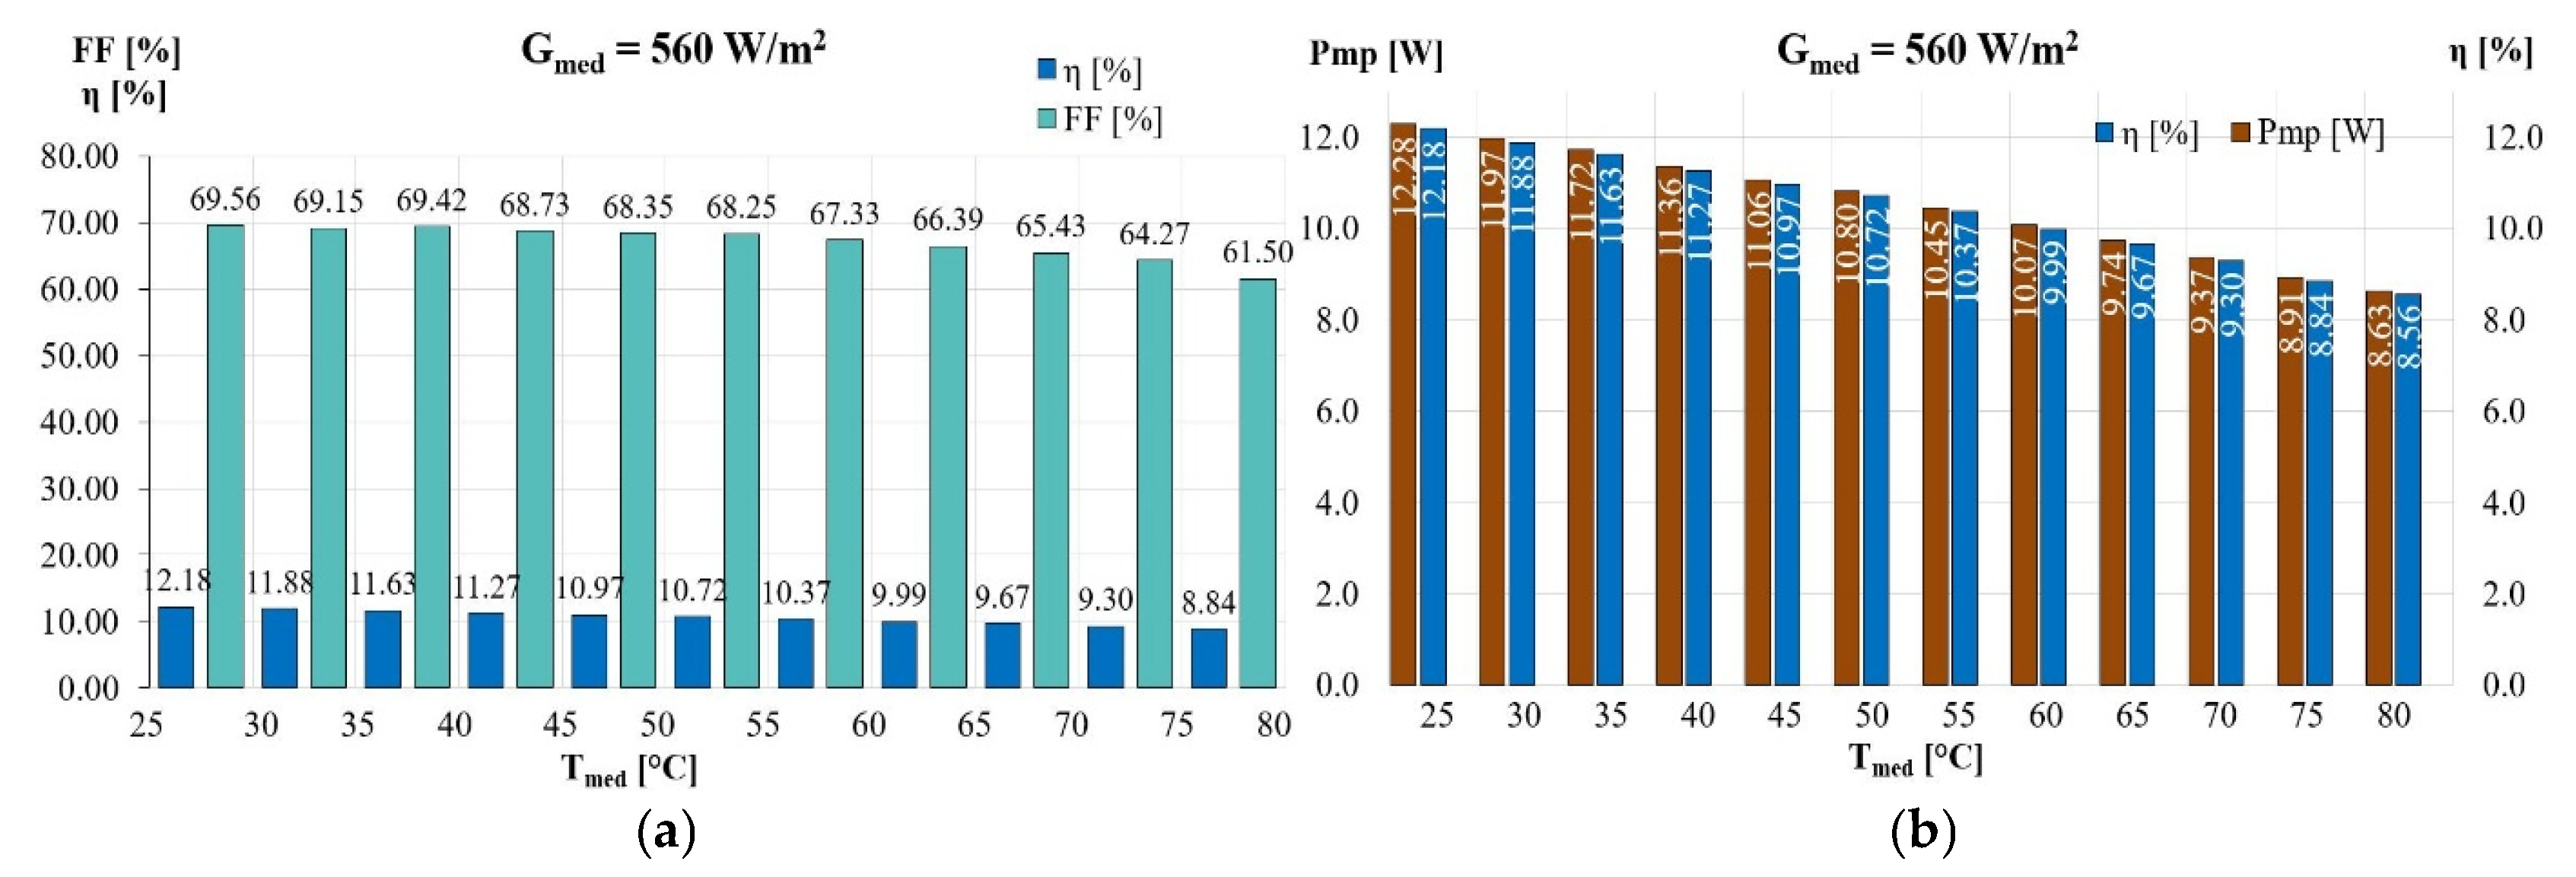
Figure 16.
Influence of the temperature variation at Gmed = 560 W/m2 over short-circuit current, open circuit voltage and PV panel efficiency: a) total values; b) average values.
Figure 16.
Influence of the temperature variation at Gmed = 560 W/m2 over short-circuit current, open circuit voltage and PV panel efficiency: a) total values; b) average values.
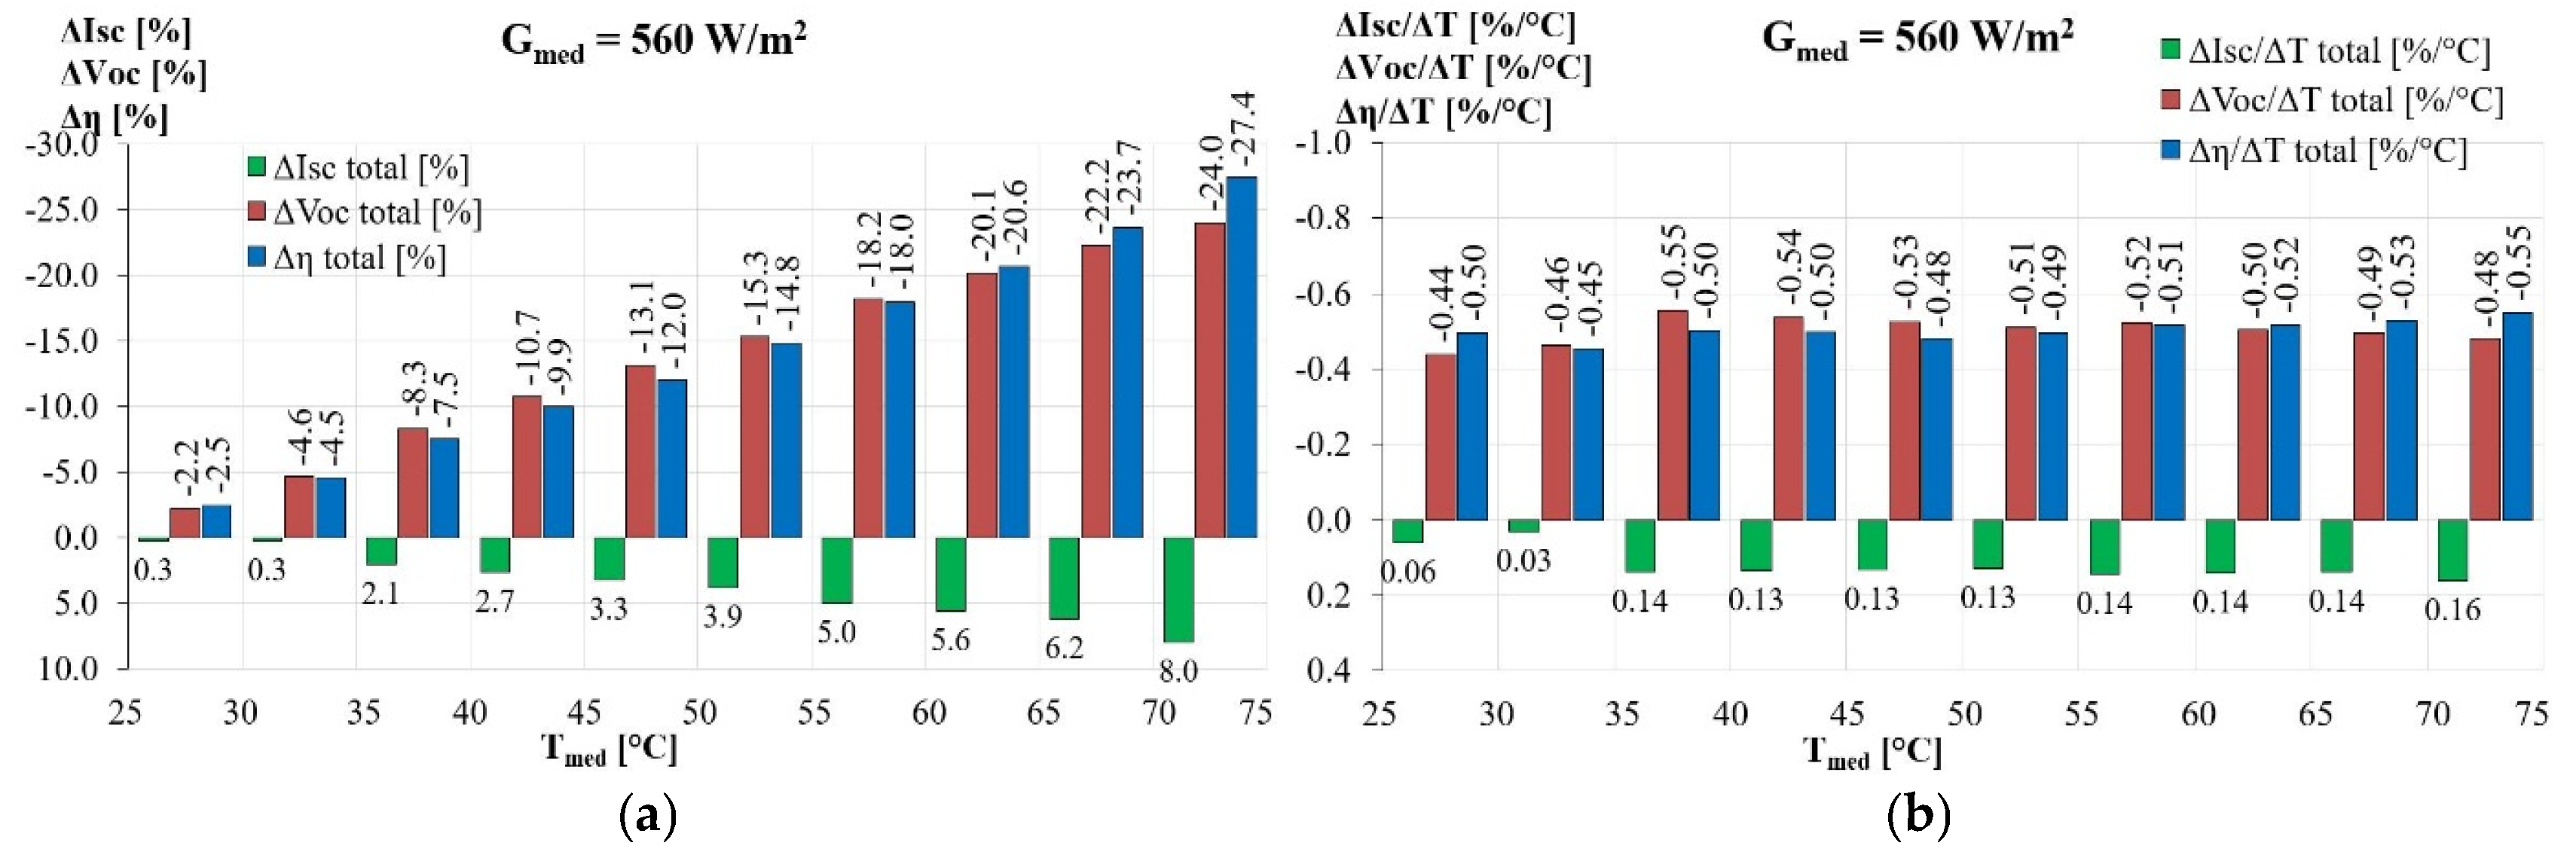
Figure 17.
Distribution of radiation on polycrystalline PV for the distance Gmed = 520 W/m2.
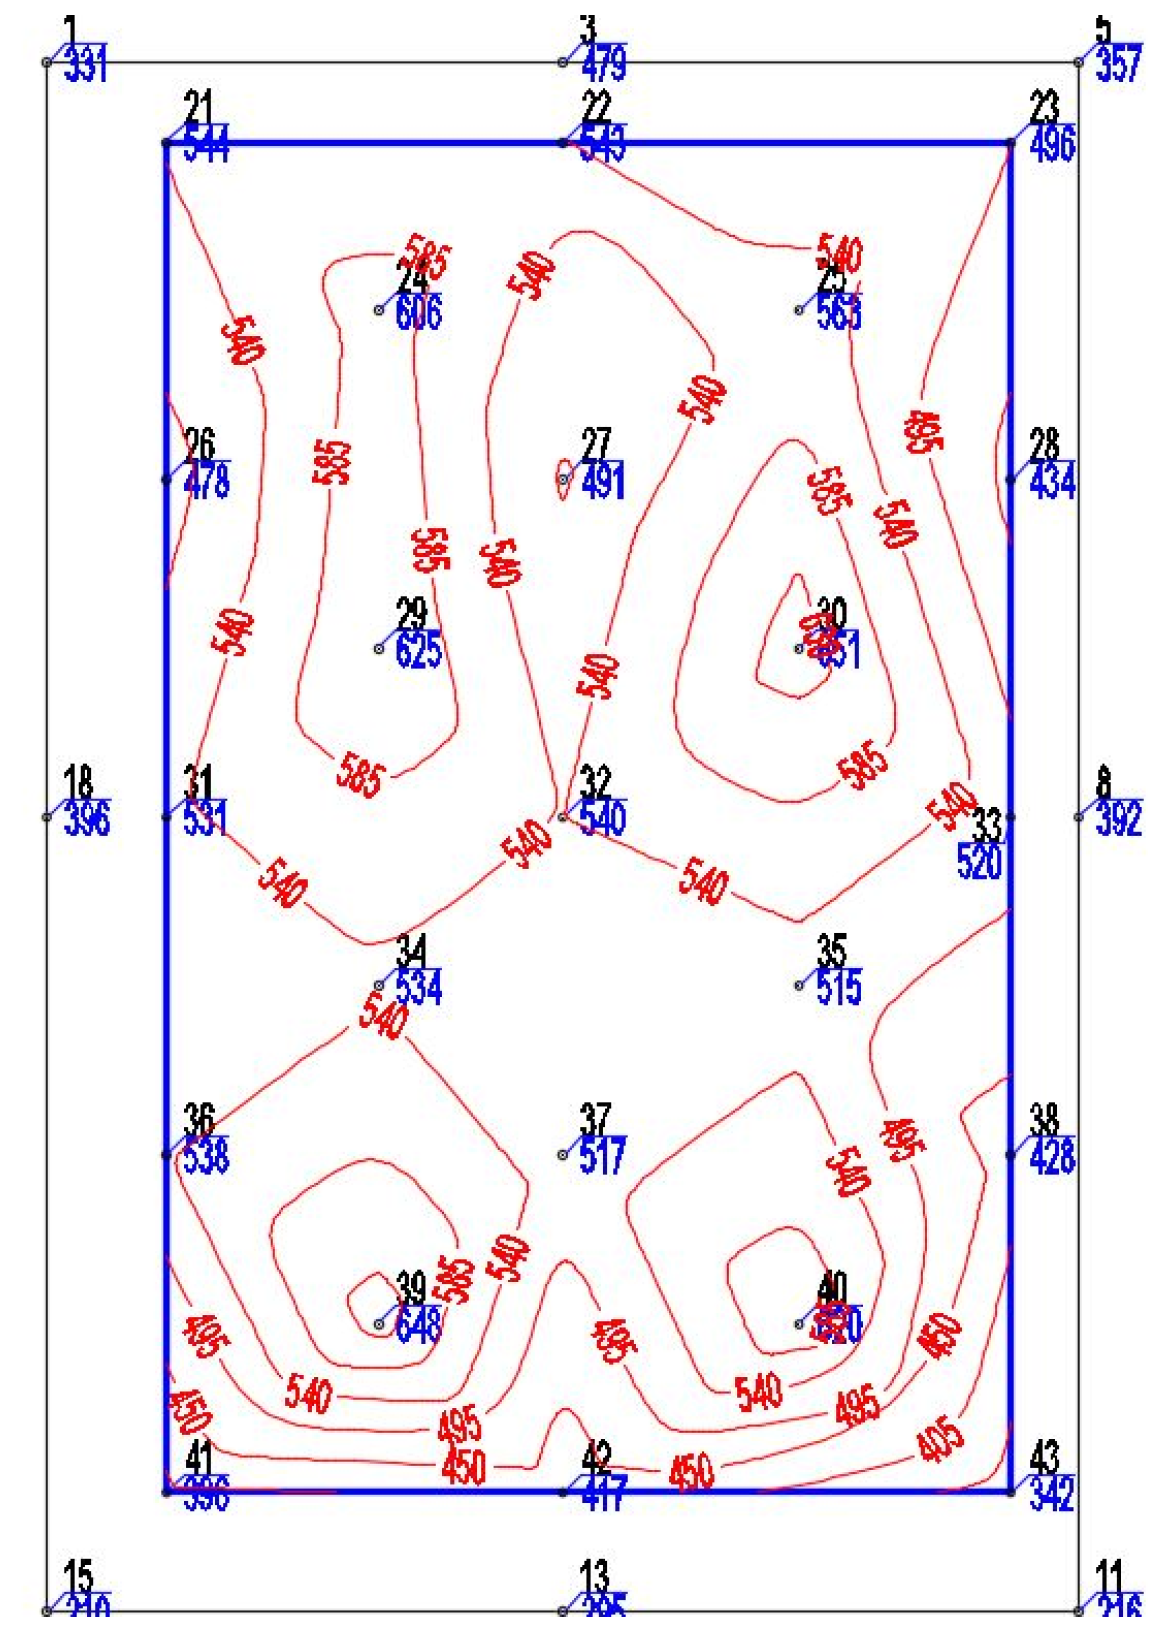
Figure 18.
Distribution of temperatures on polycrystalline panel at Tmed: a) 20 °C; b) 25 °C; c) 30 °C; d) 35 °C; e) 40 °C; f) 45 °C.
Figure 18.
Distribution of temperatures on polycrystalline panel at Tmed: a) 20 °C; b) 25 °C; c) 30 °C; d) 35 °C; e) 40 °C; f) 45 °C.
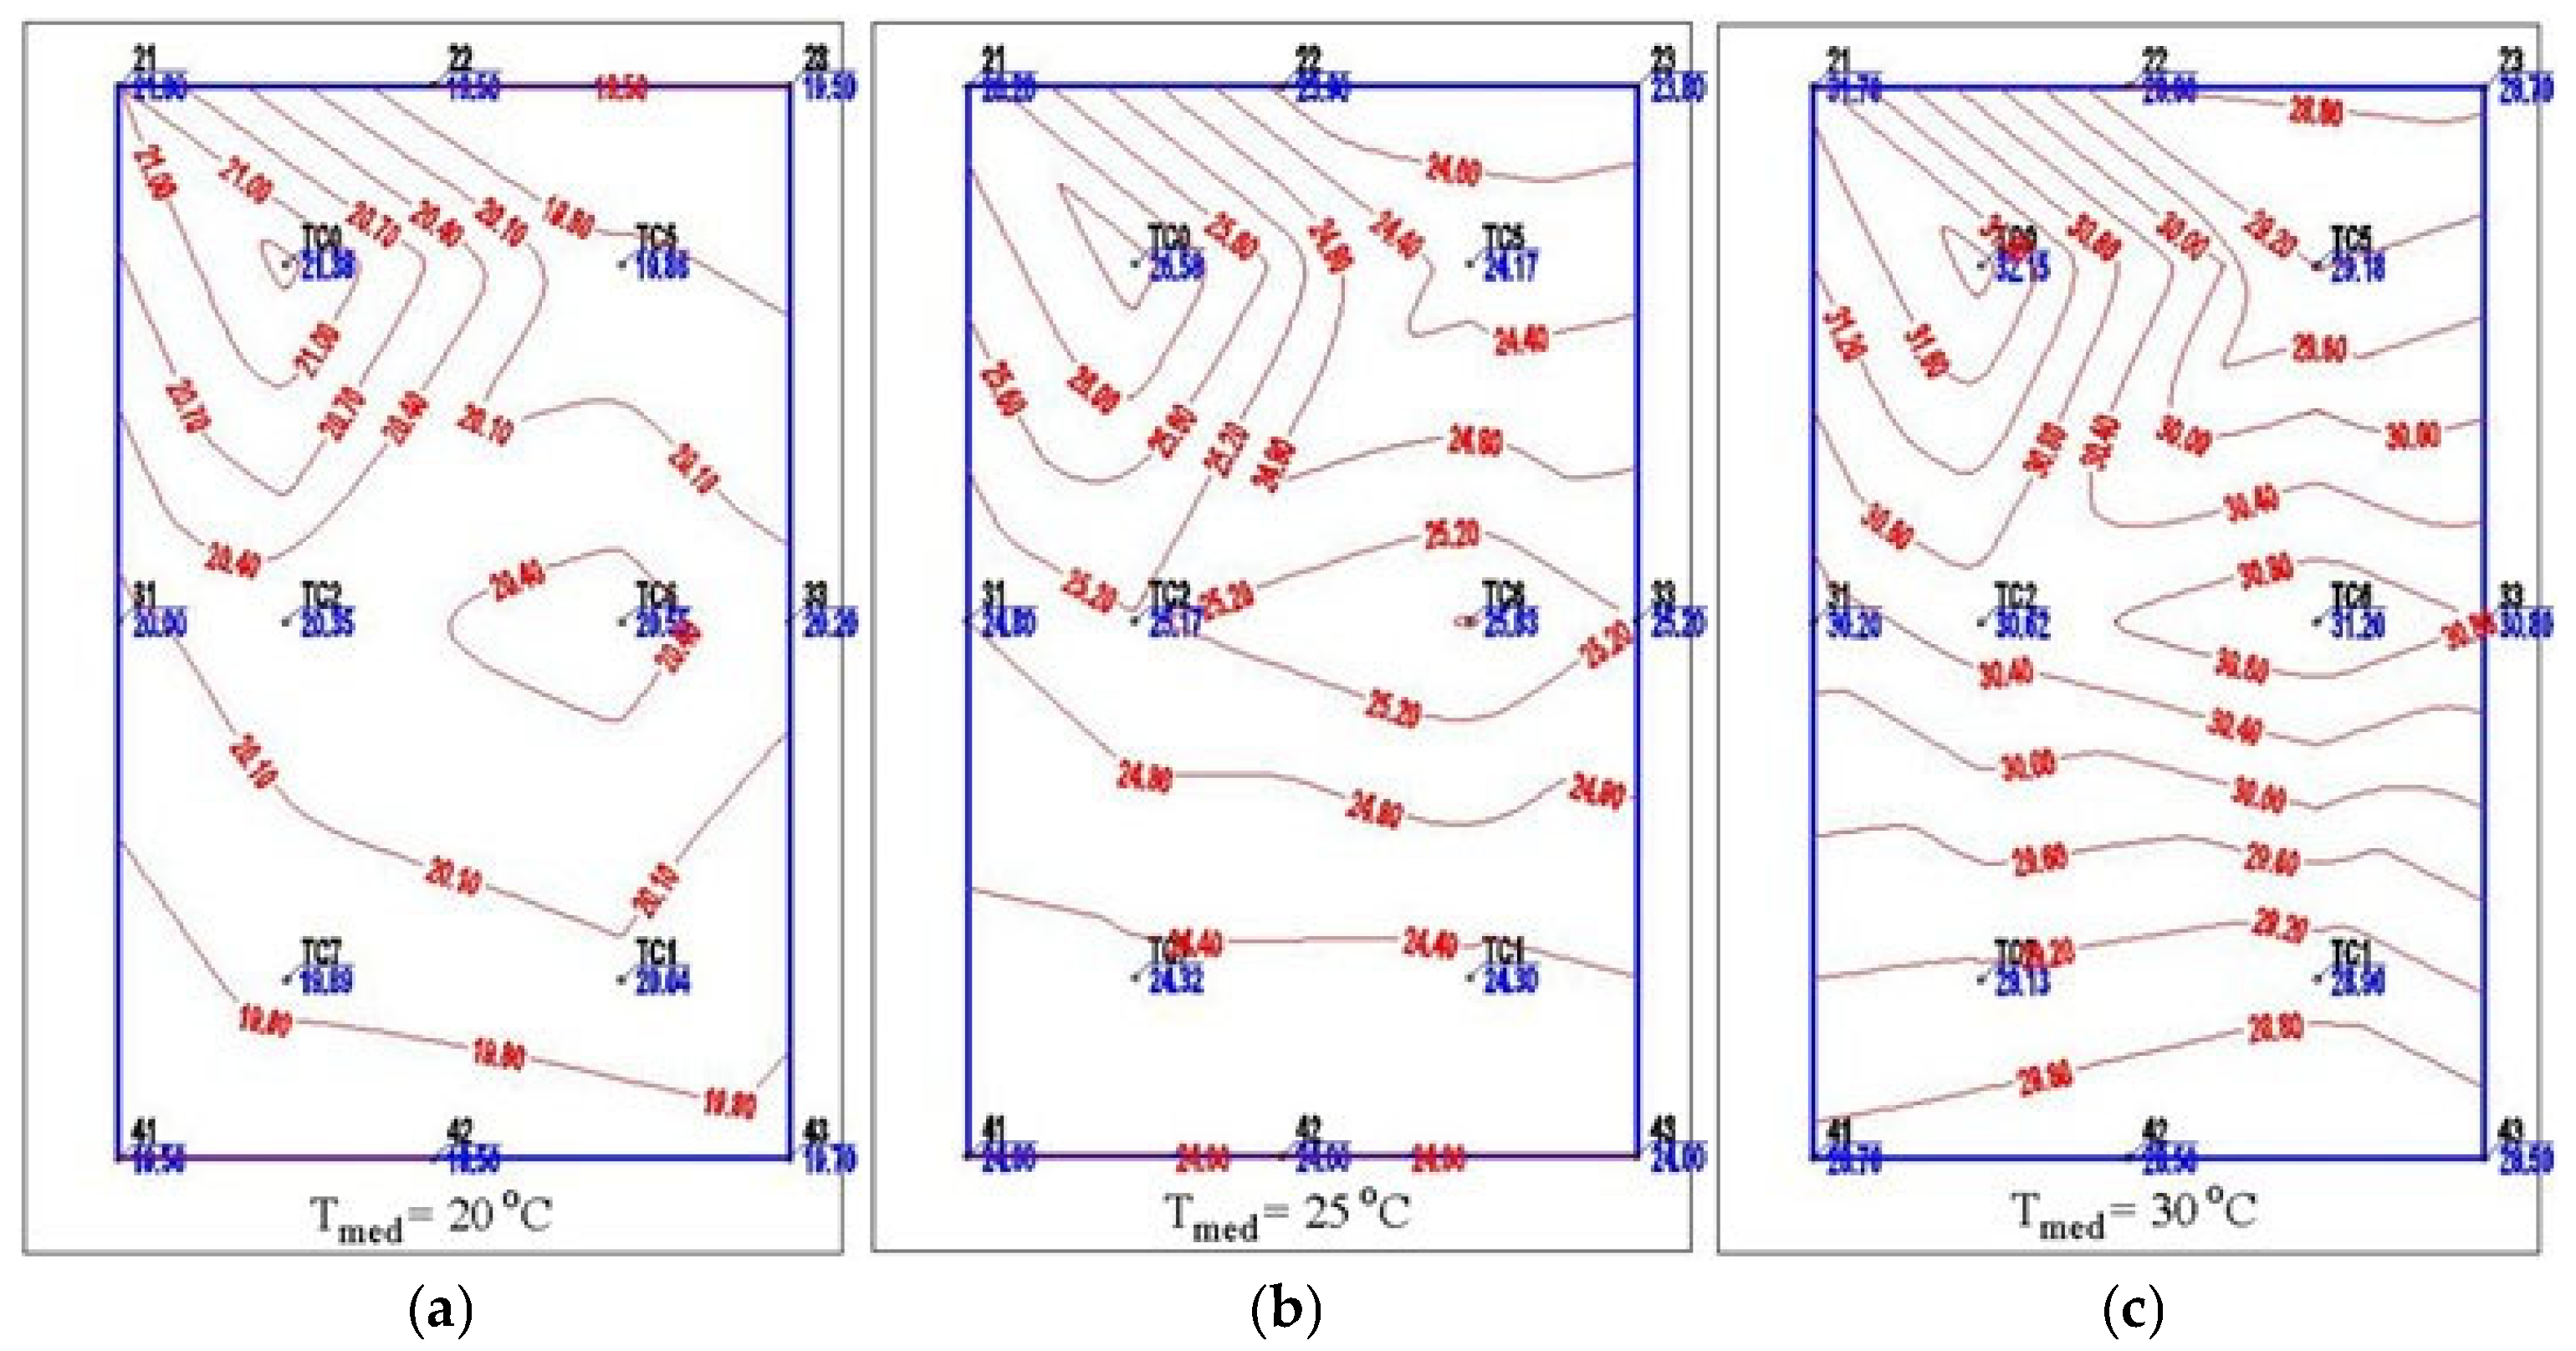
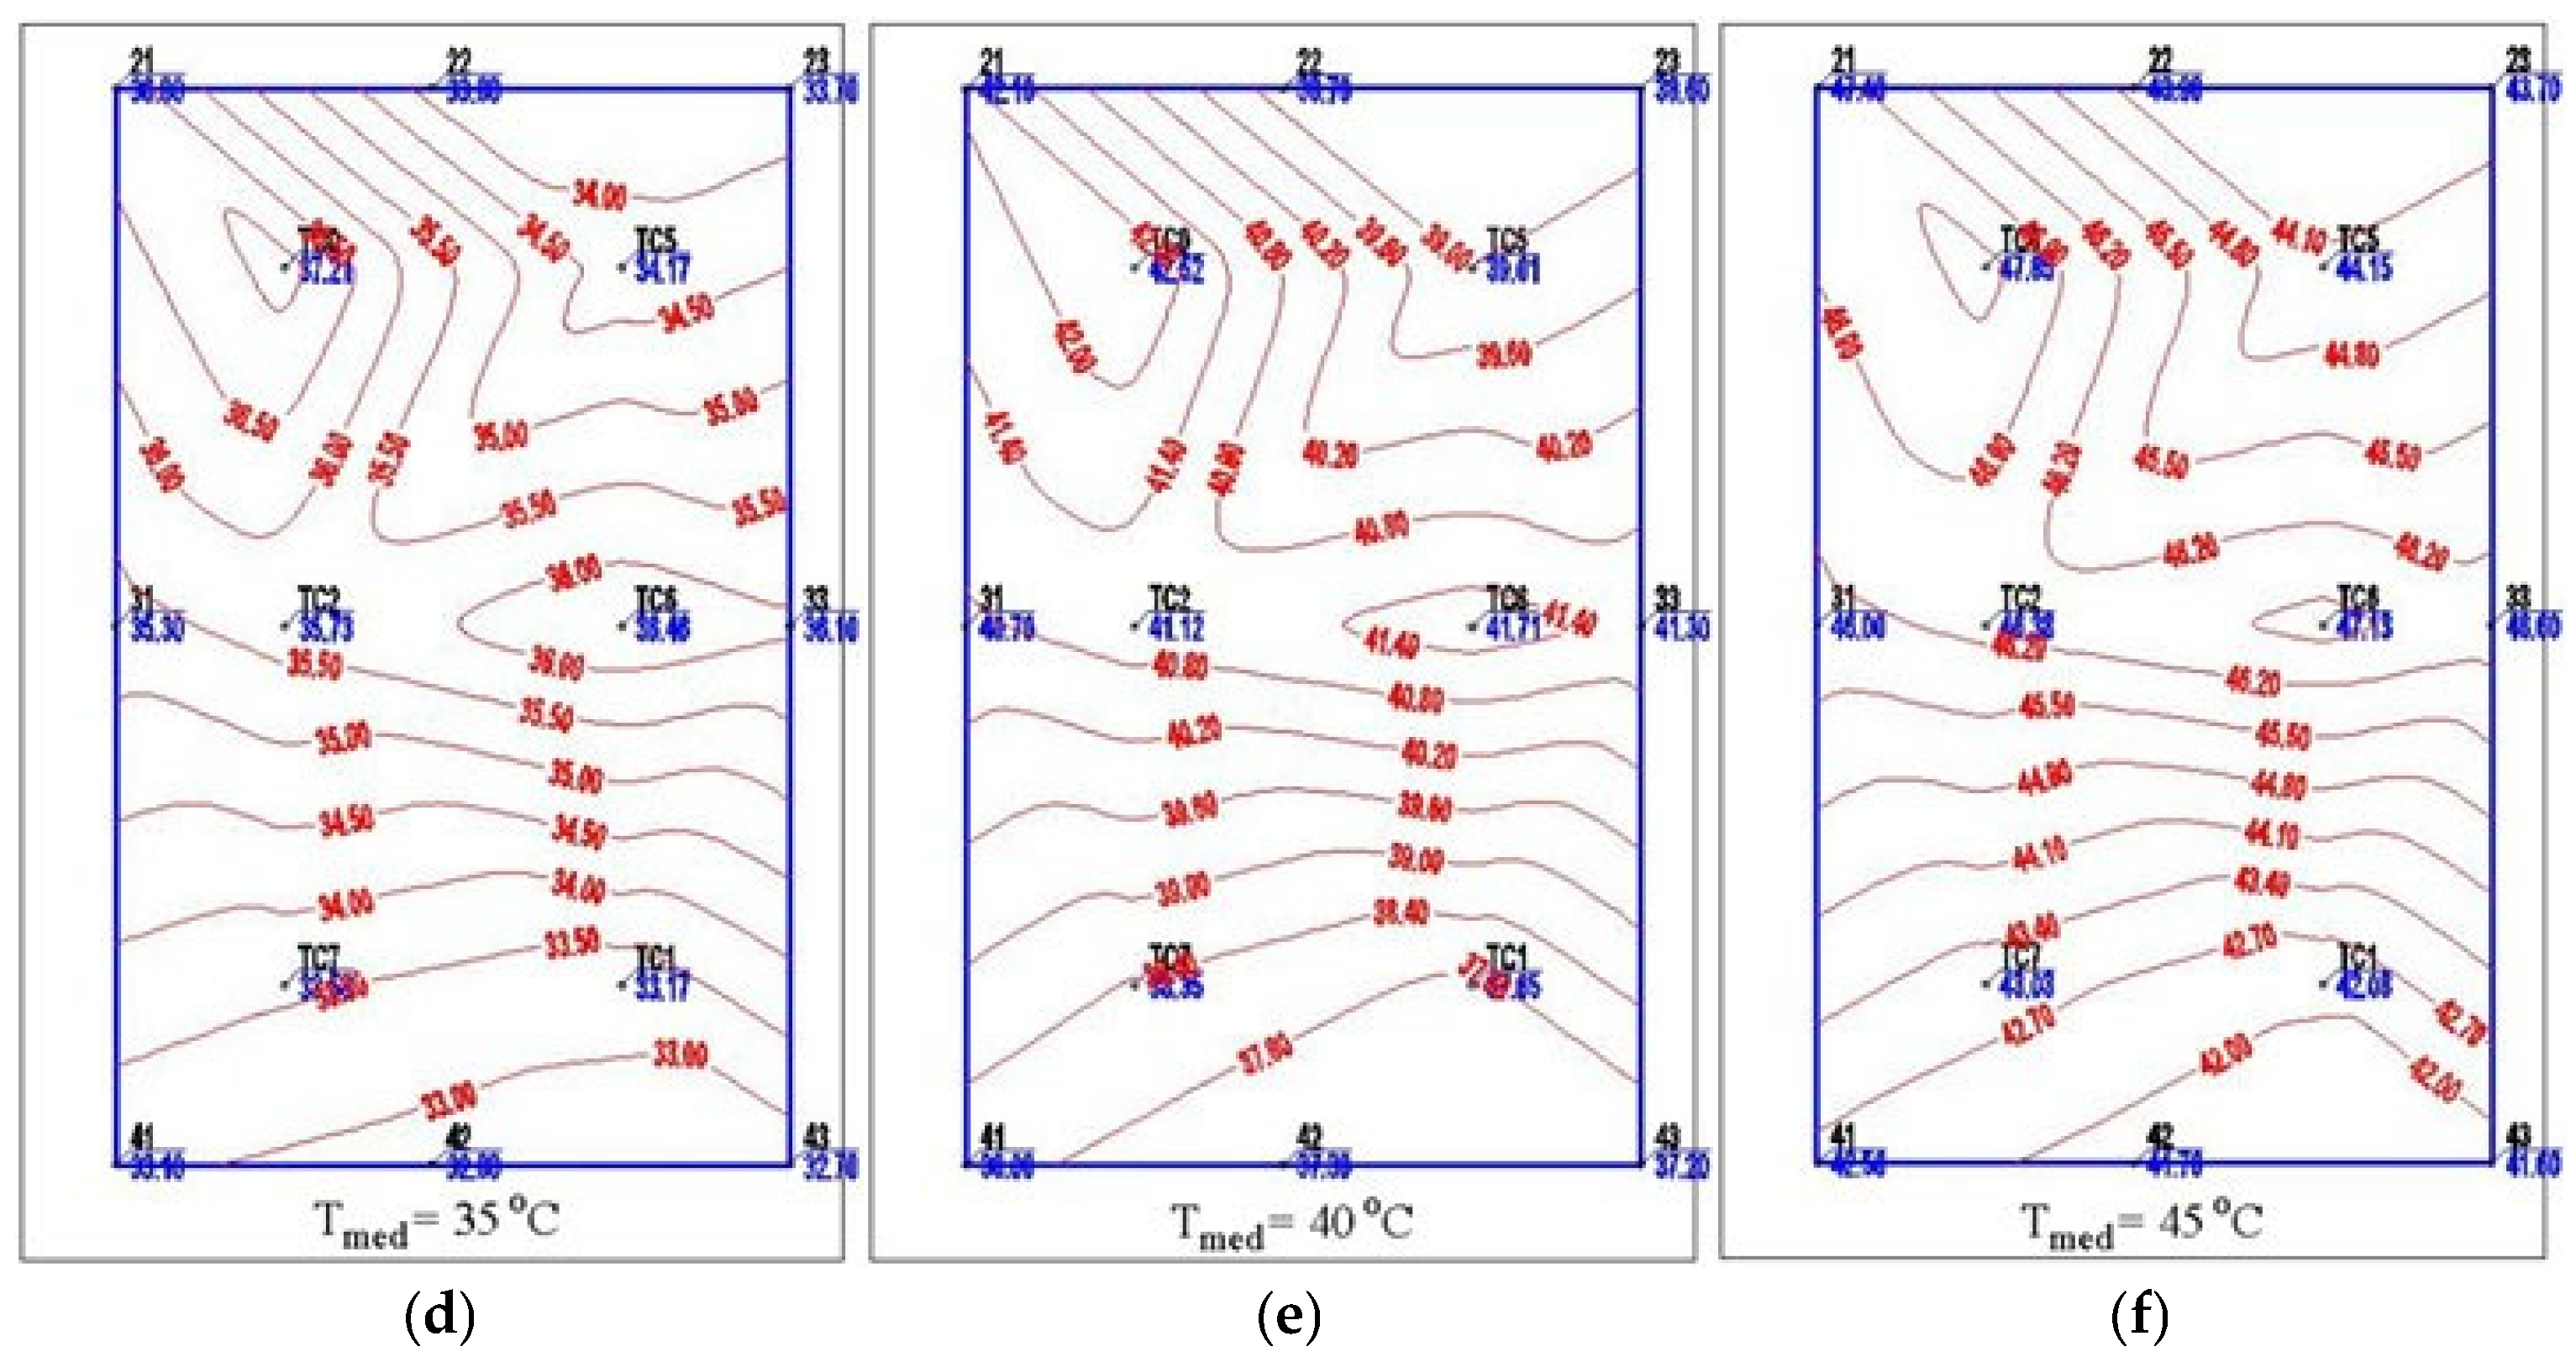
Figure 19.
Distribution of temperatures on polycrystalline panel at Tmed: a) 50 °C; b) 55 °C; c) 60 °C; d) 65 °C; e) 70 °C; f) 75 °C.
Figure 19.
Distribution of temperatures on polycrystalline panel at Tmed: a) 50 °C; b) 55 °C; c) 60 °C; d) 65 °C; e) 70 °C; f) 75 °C.
Figure 20.
Maximum power output depending on the polycrystalline PV panel temperature and resistive load for Gmed = 520 W/m2.
Figure 20.
Maximum power output depending on the polycrystalline PV panel temperature and resistive load for Gmed = 520 W/m2.
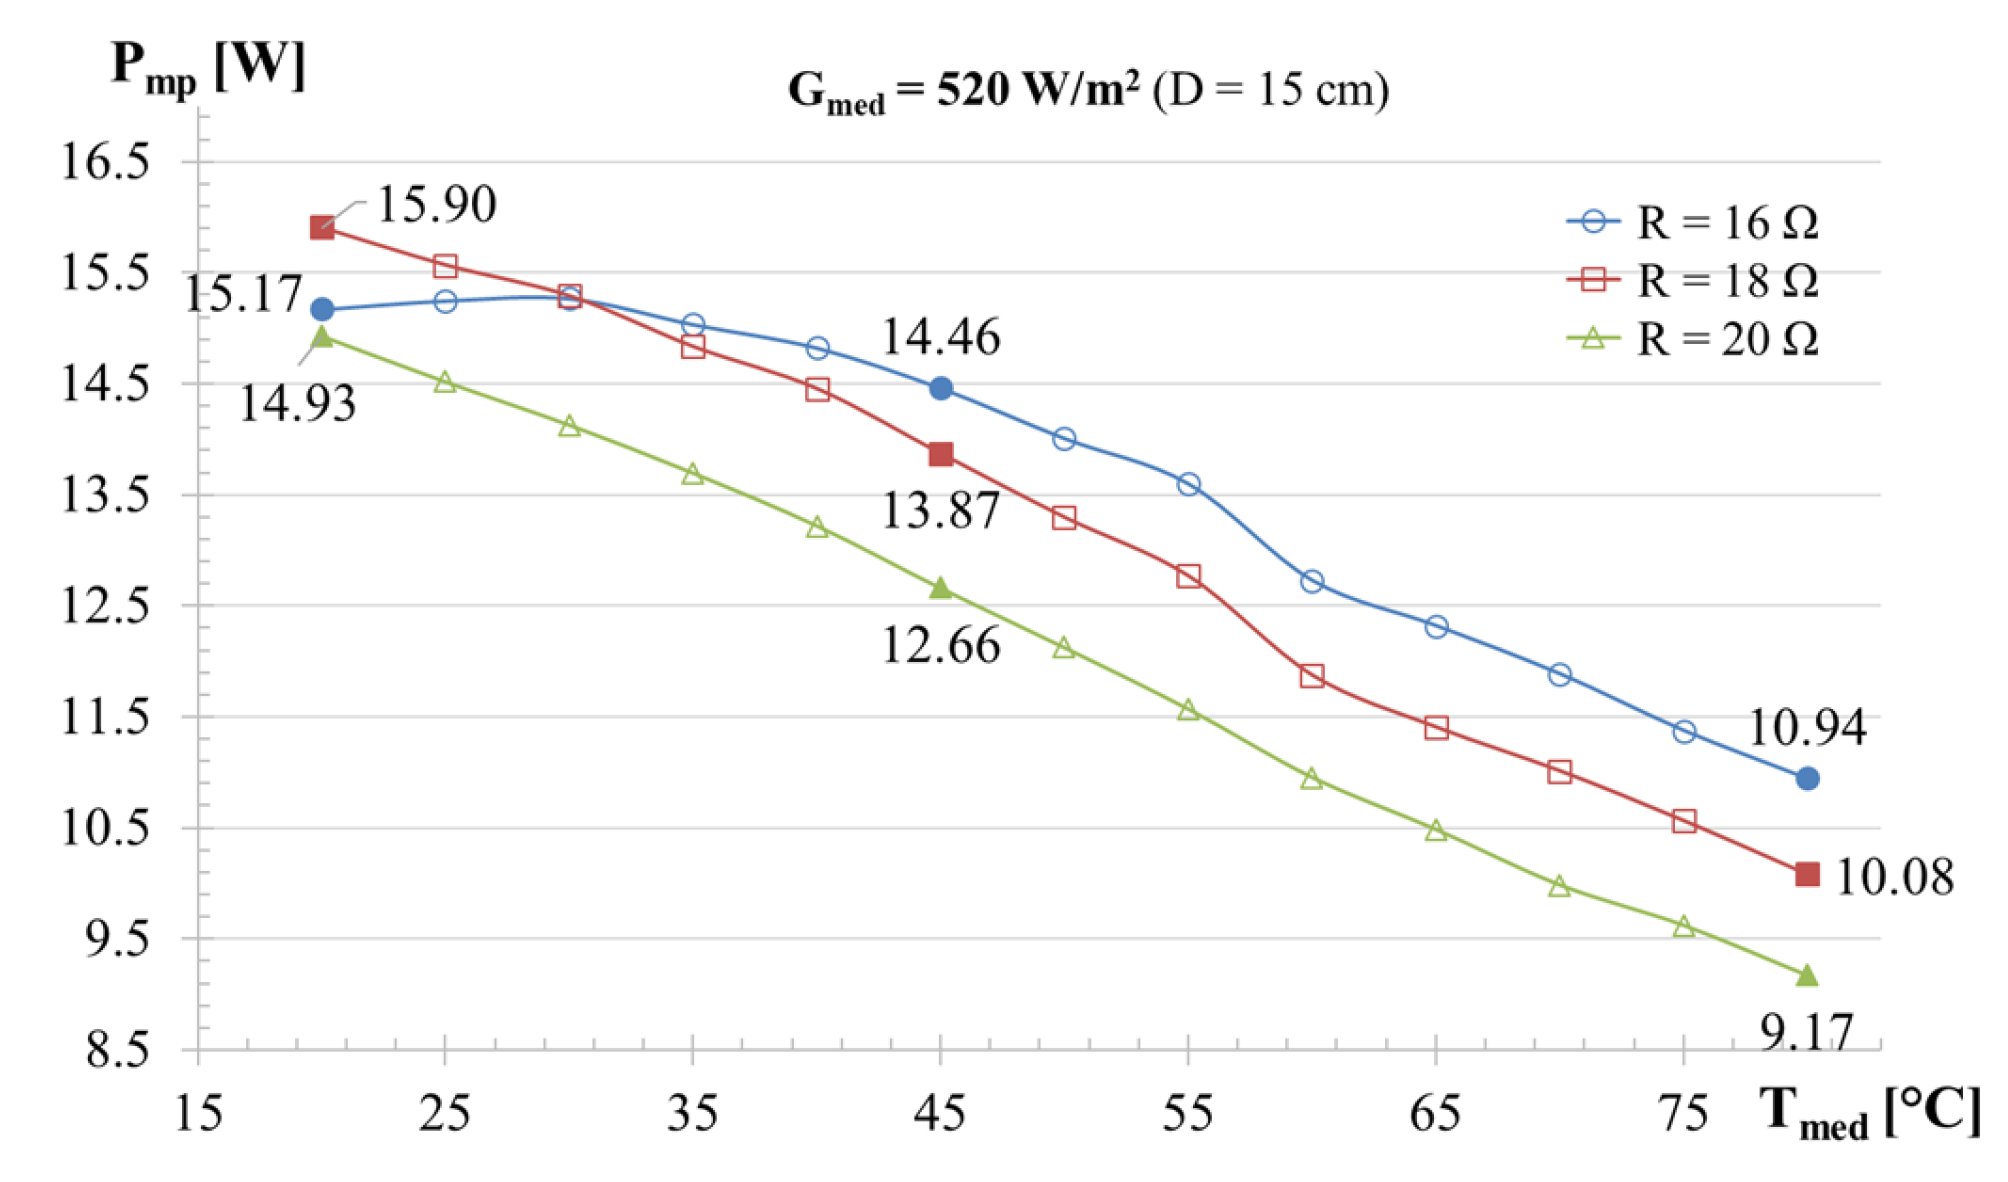
Figure 21.
Variation of open circuit voltage and short-circuit current of polycrystalline PV panel with temperature for Gmed = 520 W/m2.
Figure 21.
Variation of open circuit voltage and short-circuit current of polycrystalline PV panel with temperature for Gmed = 520 W/m2.
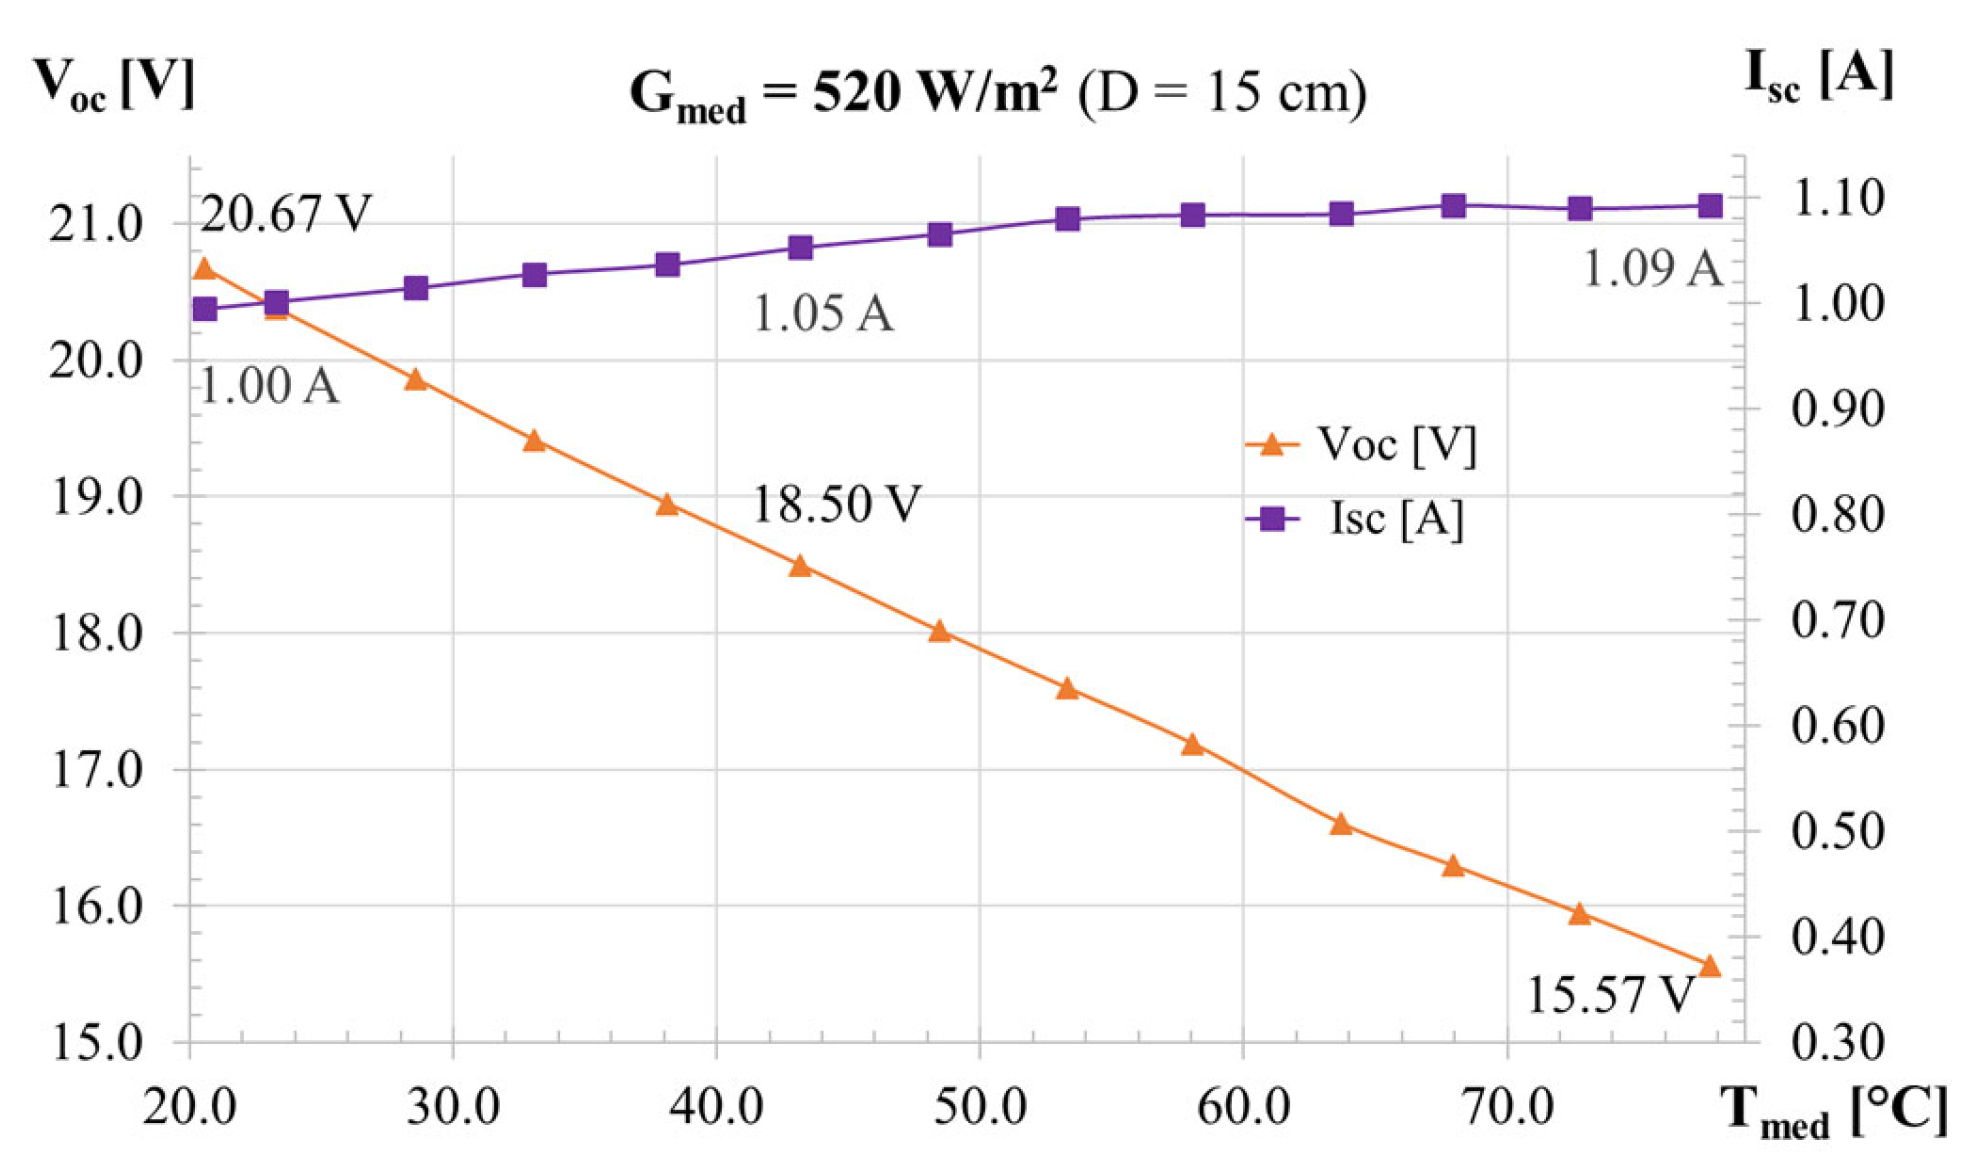
Figure 22.
Instantaneous effect of polycrystalline PV panel cooling on the open circuit voltage for Gmed = 520 W/m2.
Figure 22.
Instantaneous effect of polycrystalline PV panel cooling on the open circuit voltage for Gmed = 520 W/m2.
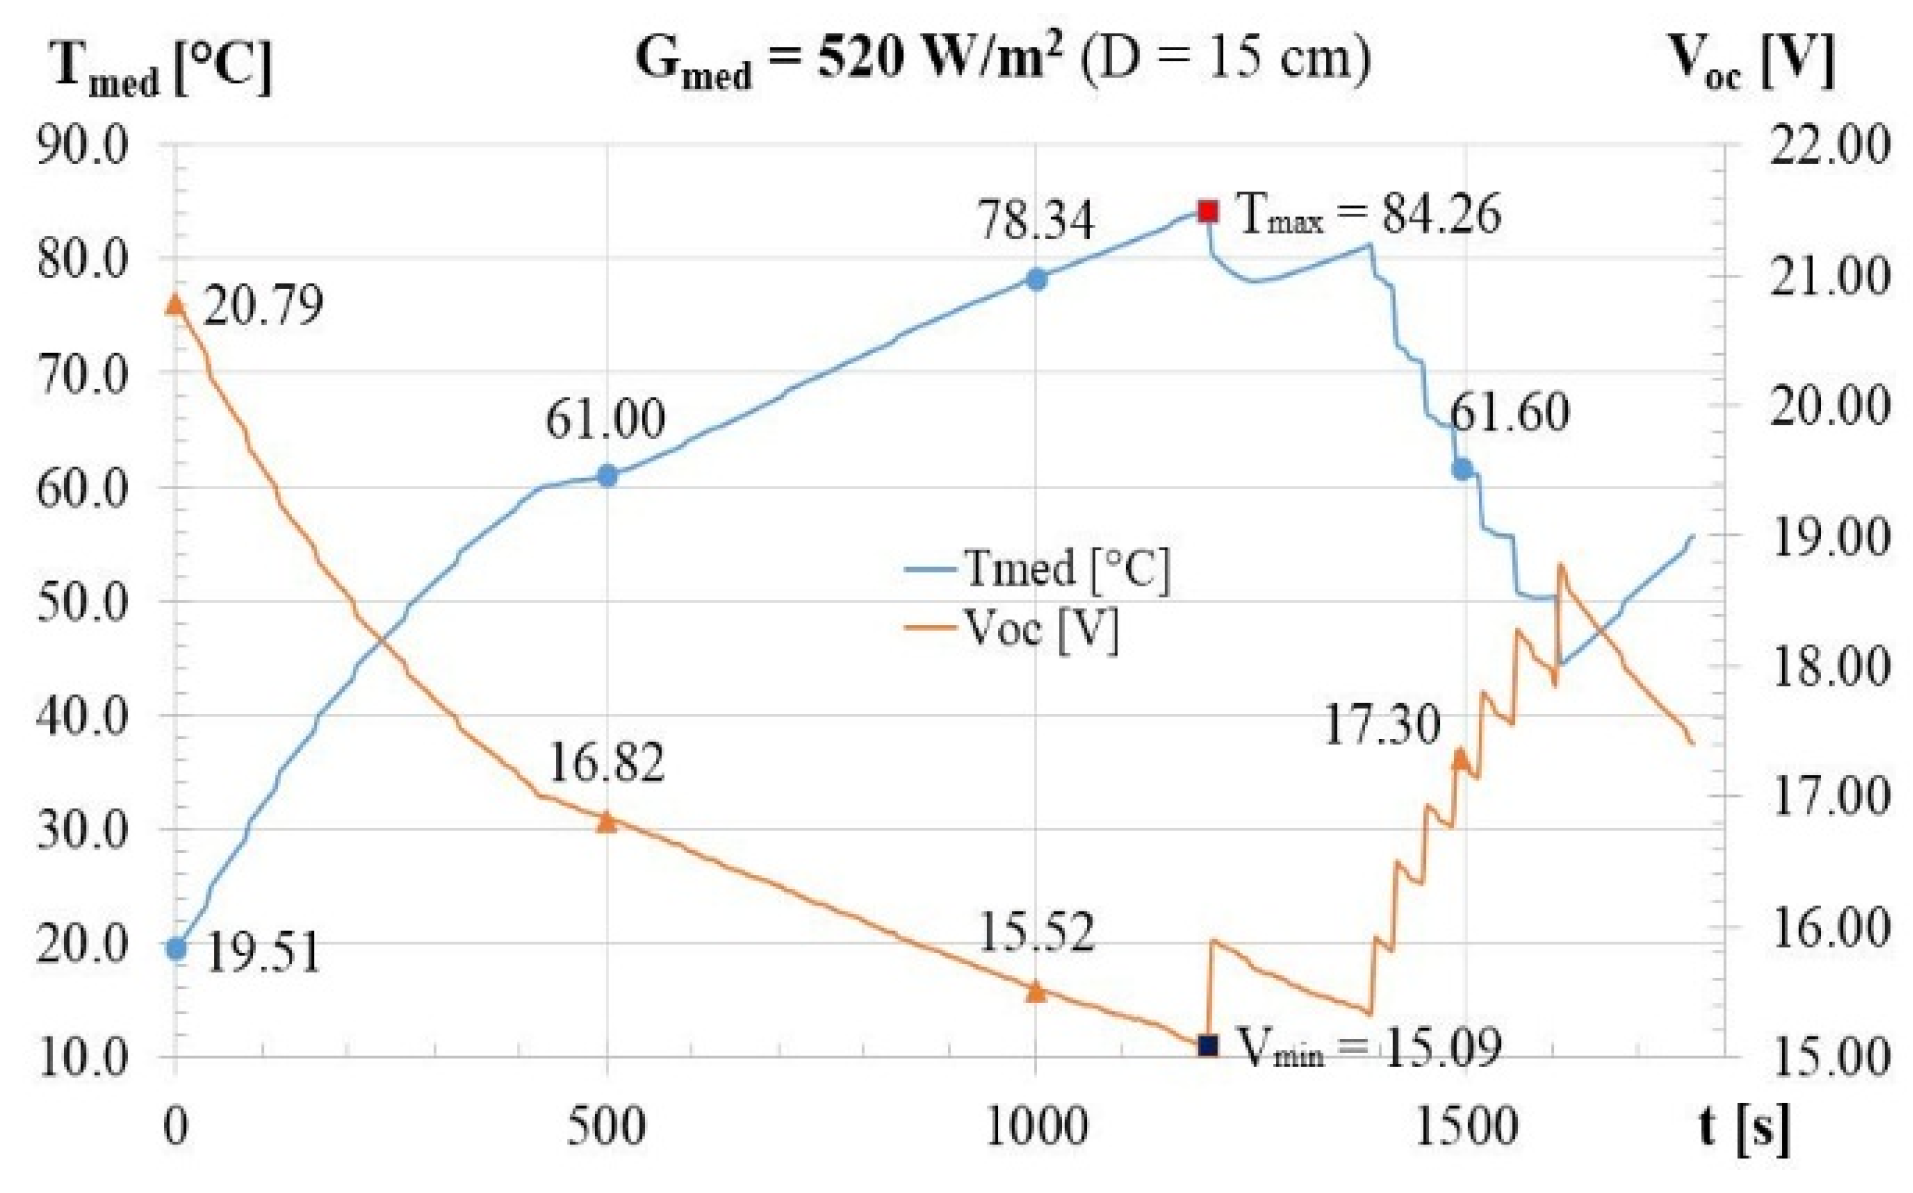
Figure 23.
Variation of the efficiency of the PV panel with the operating temperature for Gmed = 520 W/m2.
Figure 23.
Variation of the efficiency of the PV panel with the operating temperature for Gmed = 520 W/m2.
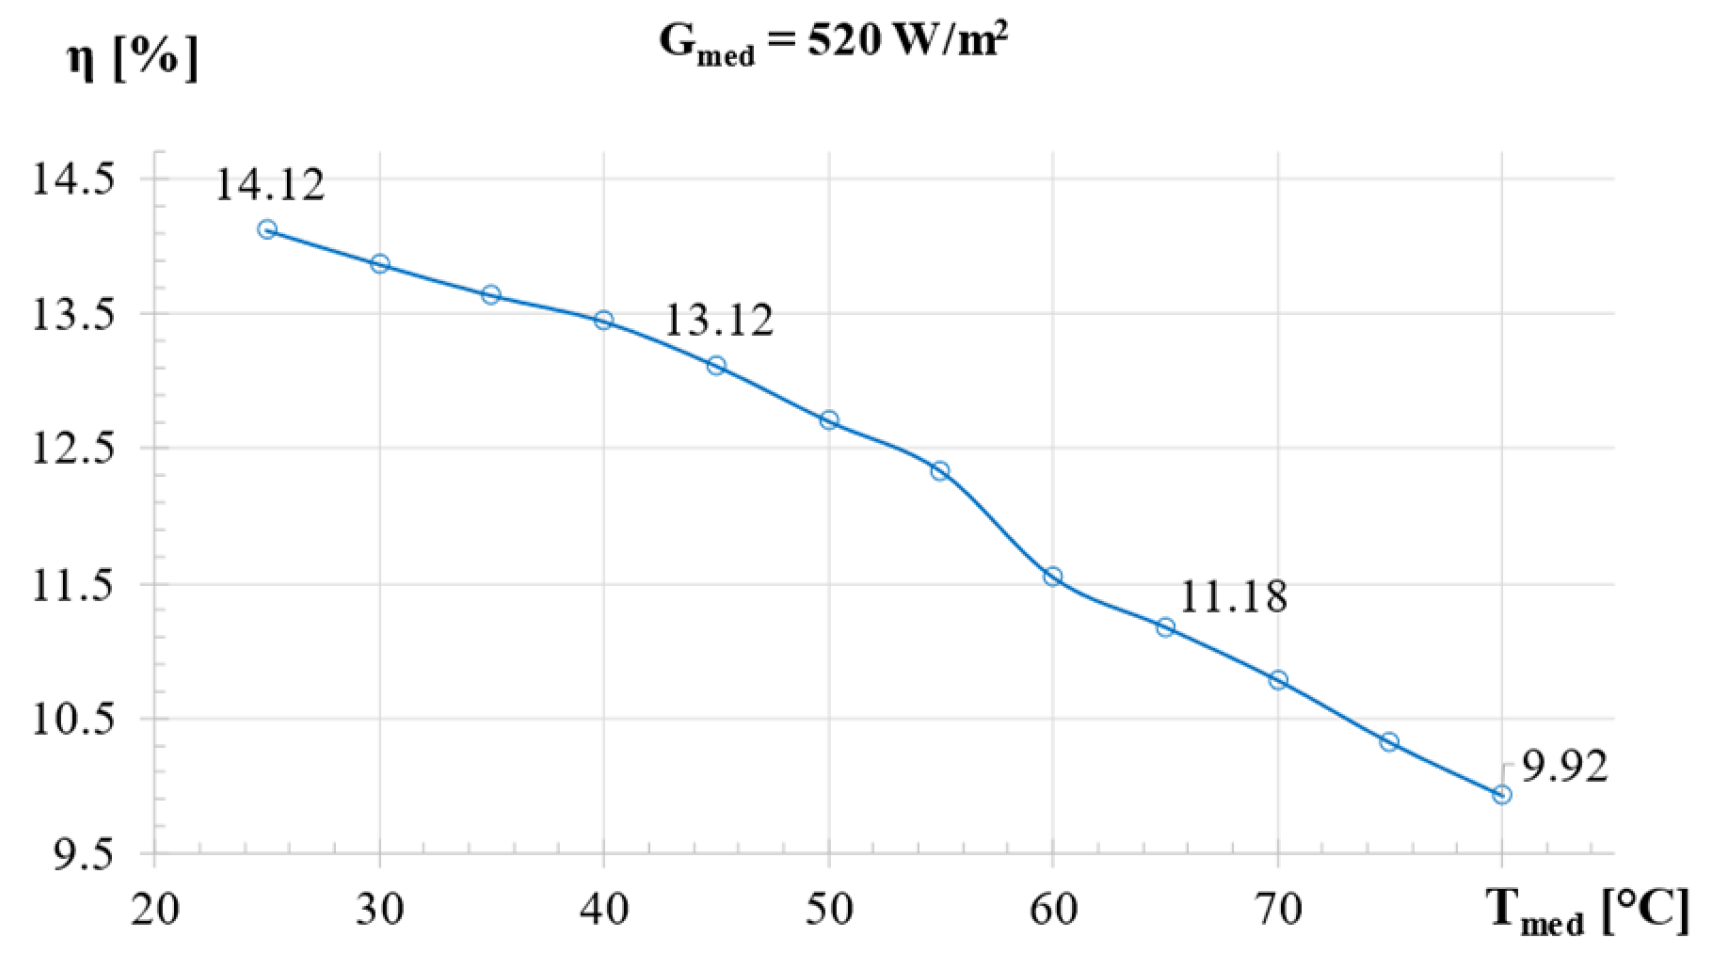
Figure 24.
Coefficients of variation on temperature intervals at Gmed = 520 W/m2 for: a) efficiency and open circuit voltage; b) short-circuit current and open circuit voltage.
Figure 24.
Coefficients of variation on temperature intervals at Gmed = 520 W/m2 for: a) efficiency and open circuit voltage; b) short-circuit current and open circuit voltage.
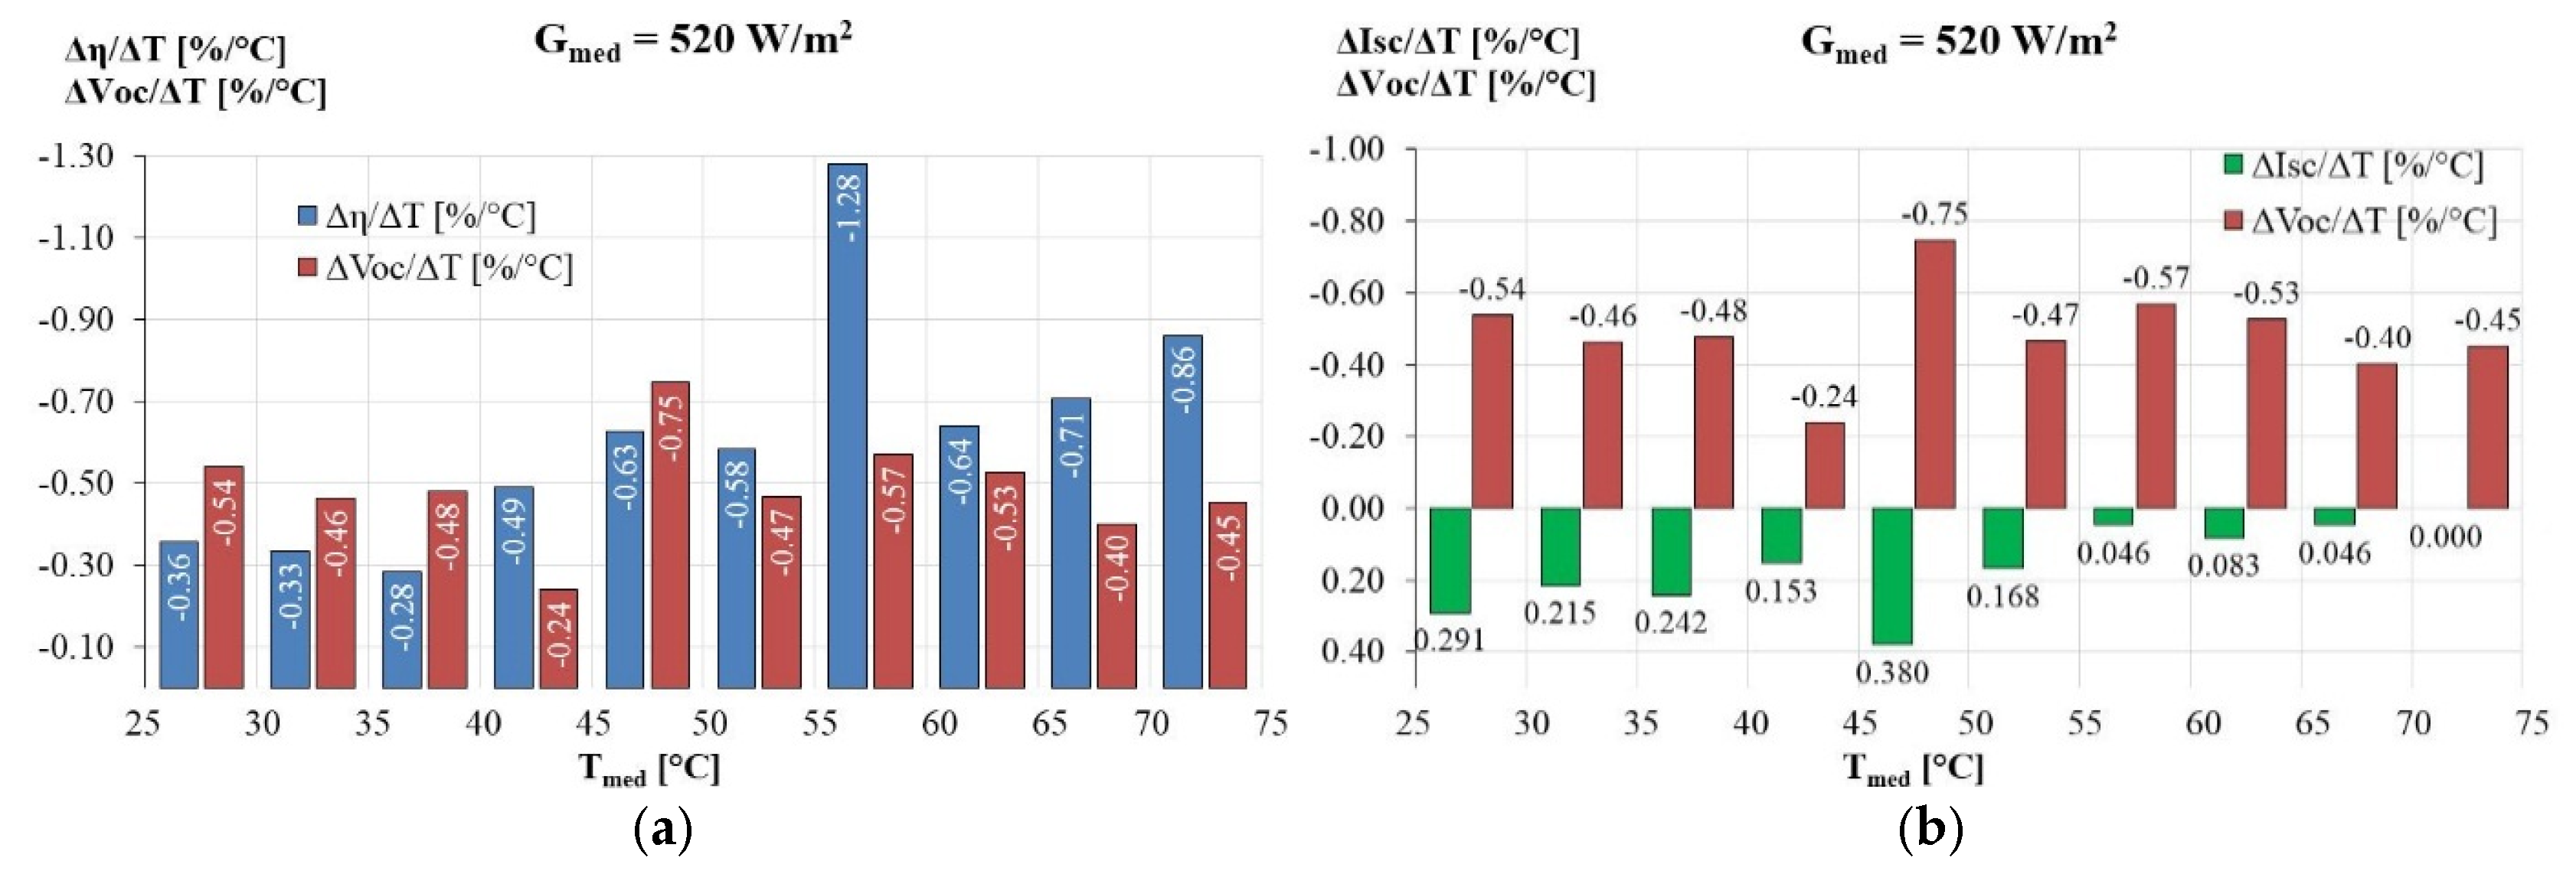
Figure 25.
Influence of the temperature variation at Gmed = 520 W/m2 over: a) efficiency and fill factor; b) power generated and efficiency.
Figure 25.
Influence of the temperature variation at Gmed = 520 W/m2 over: a) efficiency and fill factor; b) power generated and efficiency.
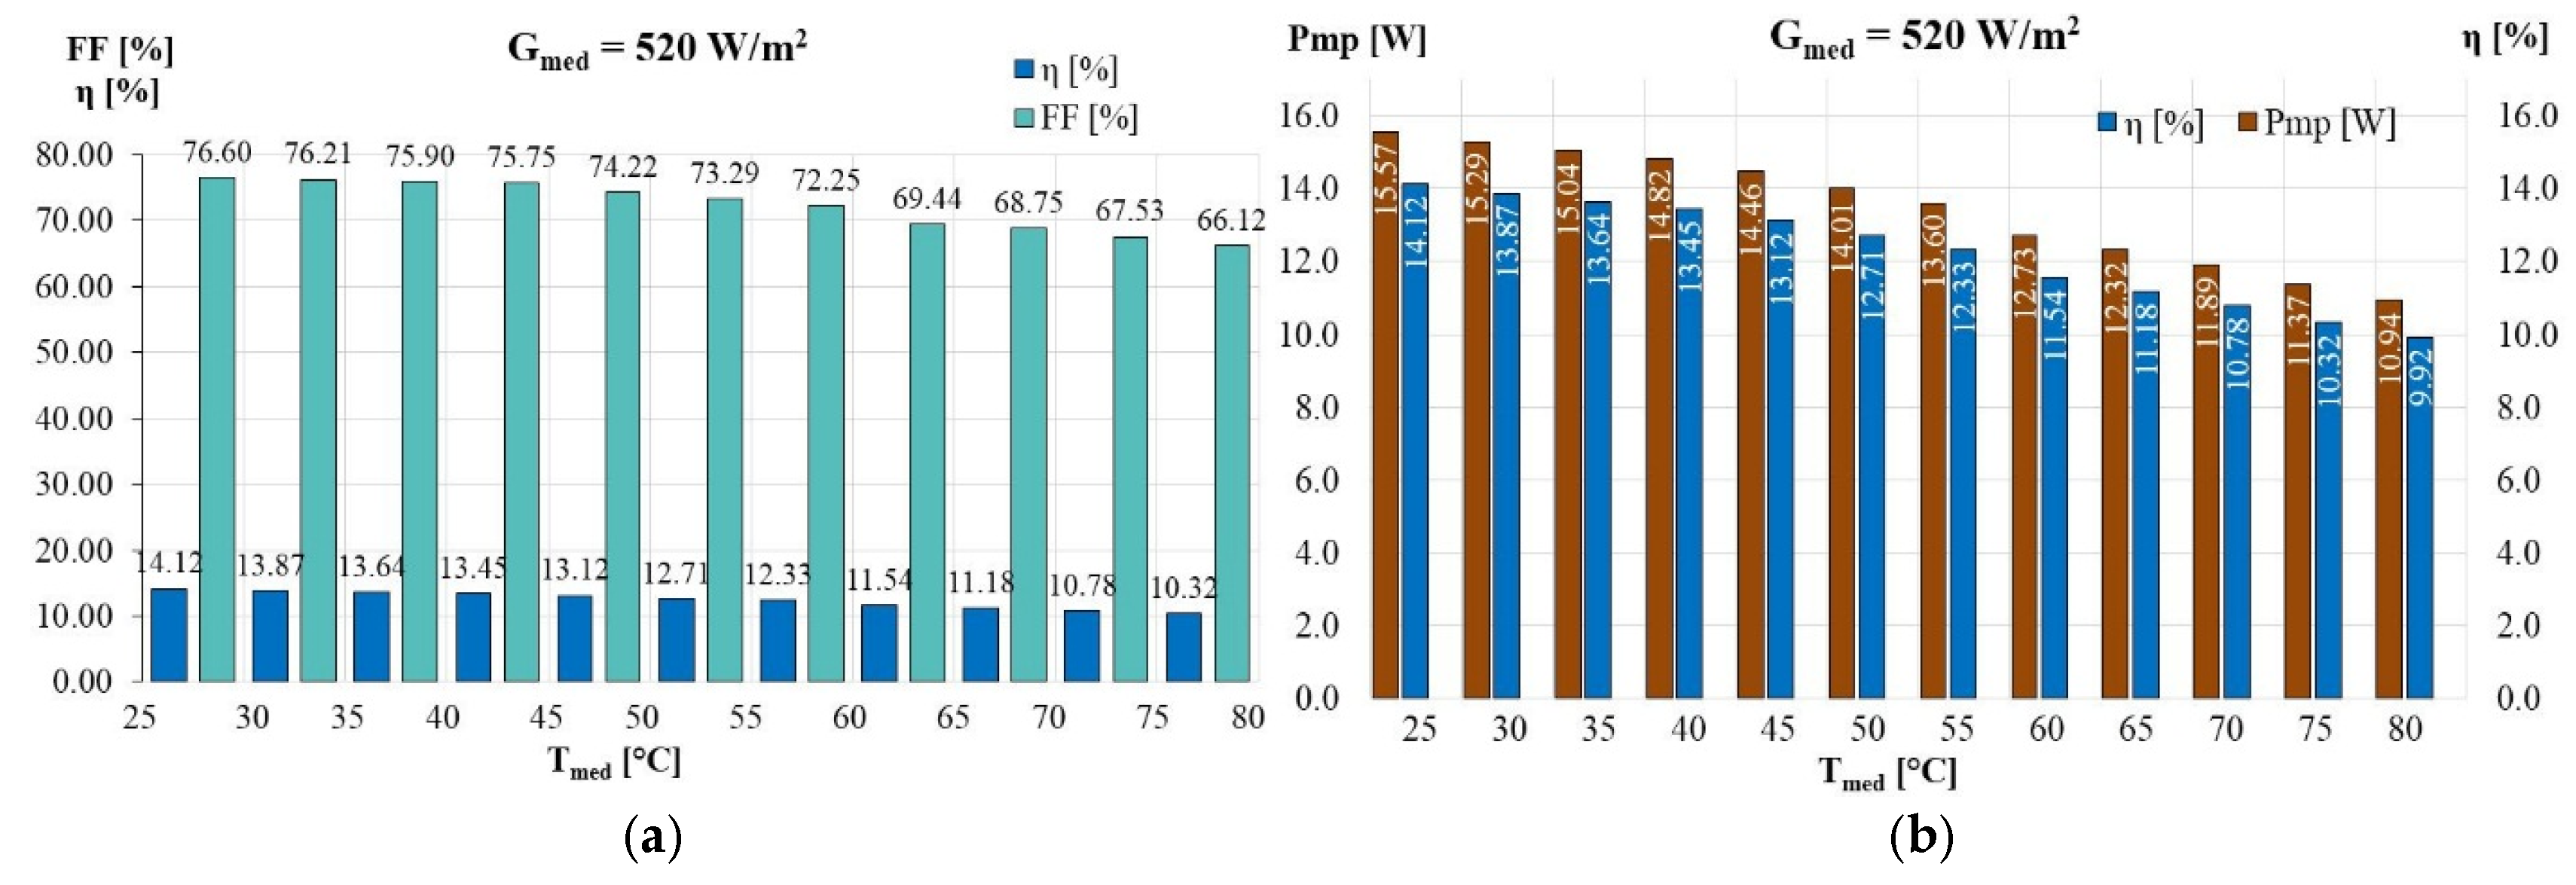
Figure 26.
Influence of the temperature variation at Gmed = 520 W/m2 over short-circuit current, open circuit voltage and PV panel efficiency: a) total values; b) average values.
Figure 26.
Influence of the temperature variation at Gmed = 520 W/m2 over short-circuit current, open circuit voltage and PV panel efficiency: a) total values; b) average values.
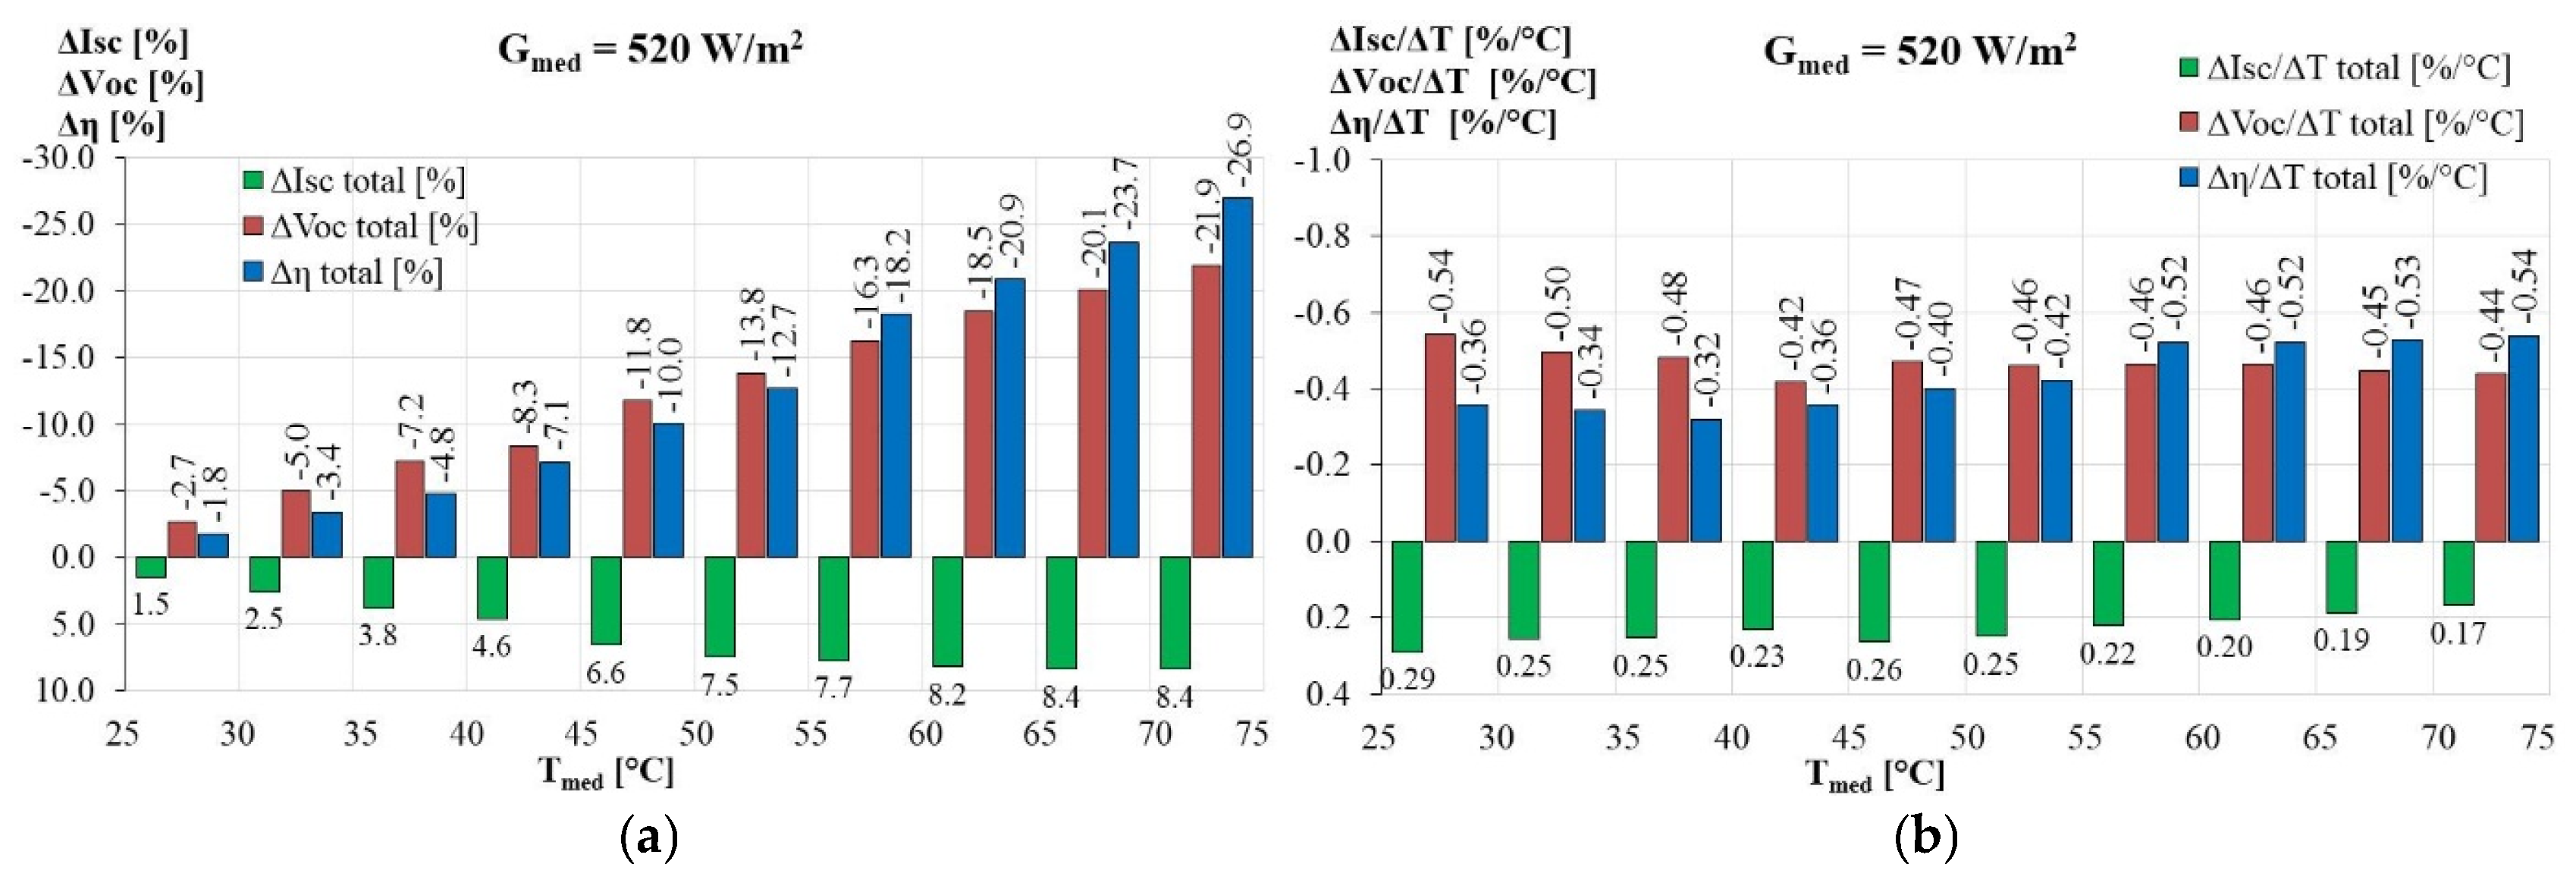

Table 1.
Characteristics of photovoltaic panels.
| Type of PV panel | Real image | Parameters |
|---|---|---|
| Monocrystalline photovoltaic panel (Victron Energy) |  |
Pmp = 30 Wp Vmp = 18.0 V Imp = 1.67 A Voc = 22.5 V Isc = 2.00 A Dimensions (L x W x H): 450mm x 540mm x 25mm |
| Polycrystalline photovoltaic panel (Suntech) | 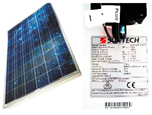 |
Pmp = 30 Wp Vmp = 17.2 V Imp = 1.74 A Voc = 21.6 V Isc = 1.94 A Dimensions (L x W x H): 426mm x 680mm x 15mm |
Table 2.
The average radiation intensity incident on the PV panels surface mounted in DCC.
| d [cm] | Gmed [W/m2] | |
|---|---|---|
| Monocrystalline | Polycrystalline | |
| 15 | 560 | 520 |
Table 3.
Coefficients of dependence of Voc, Isc, Pmp, η and FF with temperature.
| Gmed = 560 W/m2 | |
|---|---|
| ΔVoc/ΔT [%/°C] | -0.48 |
| ΔIsc/ΔT [%/°C] | 0.16 |
| ΔPmp/ΔT [%/°C] | -0.52 |
| Δη/ΔT [%/°C] | -0.55 |
| ΔFF/ΔT [%/°C] | -0.15 |
Table 4.
The values of the dependence coefficients of Voc, Isc, Pmp, η and FF with temperature.
| Gmed | 520 |
|---|---|
| ΔVoc/ΔT [%/°C] | -0.44 |
| ΔIsc/ΔT [%/°C] | 0.17 |
| ΔPmp/ΔT [%/°C] | -0.52 |
| Δη/ΔT [%/°C] | -0.54 |
| ΔFF/ΔT [%/°C] | -0.27 |
Table 5.
Comparison between the parameters of the two photovoltaic panels.
| Panel | Pmp [W] | ηSTC [%] | Pmax [W] | ηmax [%] |
|---|---|---|---|---|
| Mono | 30 | 16.66 | 12.6 | 12.70 |
| Poly | 30 | 15.15 | 15.9 | 14.42 |
Table 6.
Variation of PV panel parameters with operating temperature.
| Panel | ΔPmp/ΔT [%/°C] | Δη/ΔT [%/°C] | ΔVoc/ΔT [%/°C] | ΔIsc/ΔT [%/°C] |
|---|---|---|---|---|
| Mono | -0.47 | -0.46 | -0.45 | 0.14 |
| Poly | -0.50 | -0.50 | -0.43 | 0.16 |
Disclaimer/Publisher’s Note: The statements, opinions and data contained in all publications are solely those of the individual author(s) and contributor(s) and not of MDPI and/or the editor(s). MDPI and/or the editor(s) disclaim responsibility for any injury to people or property resulting from any ideas, methods, instructions or products referred to in the content. |
© 2024 by the authors. Licensee MDPI, Basel, Switzerland. This article is an open access article distributed under the terms and conditions of the Creative Commons Attribution (CC BY) license (http://creativecommons.org/licenses/by/4.0/).
Copyright: This open access article is published under a Creative Commons CC BY 4.0 license, which permit the free download, distribution, and reuse, provided that the author and preprint are cited in any reuse.


