1. Introduction
The Olfactory Bulb (OB) is one of the components of the olfactory system and works as a point of communication between the olfactory receptors present in the epithelium of the nasal cavity and different regions of the brain [
1]. Anatomically, it appears as a double bulbar structure, rostral to the corresponding cerebral hemispheres in a ventrocranial position regarding the frontal lobes [
2]. Each OB is located over one of the ethmoid fossae of the cribriform plate, whose foramina serve as a crossing point to the filaments of the olfactory nerve, being separated by the crista galli of the ethmoid bone. Caudally, the OB continues through the olfactory peduncle through which it connects with the corresponding cerebral hemisphere [
3]. The space that separates the OB from the rest of the brain has been tentatively called the olfactory fissure [
4], a term that, although not yet registered in the respective
nomina anatomica, has been used for the anatomical description of this region in both humans [
5] and animals [
6] due to its good descriptive nature. The OB is part of the main olfactory system, in which it functions as an integration center for the information contained in volatile odorants decoded in the receptors of the olfactory epithelium, being responsible for its transmission to higher cortical centers after its correct filtration and modulation [
7]. It is understandable that in species highly dependent on olfaction for behavioral expression and physiological normality, such as dogs and cats, small changes in OB and olfactory acuity can translate into serious changes that are, even so, difficult to be clinically quantified. In cats, in particular, the olfactory system has a close relationship with the regions of the brain related to stress responses, which can severely impact and exacerbate behavioral patterns in this species [
8]. The clinical importance of OB tends to be neglected in Veterinary Medicine, although it is well established in Humans. It is known, for example, that in humans the OB is one of the first locations affected by the establishment of neurodegenerative diseases such as Alzheimer's and Parkinson's, where atrophy of this region is observed parallel to changes in olfactory acuity [
9], depositional changes, and reduced density of other brain locations like the temporal lobe gray matter [
10,
11]. In companion animals, mainly dogs, similar functional and structural changes associated with the establishment of cognitive dysfunction syndrome have also been indicated [
12,
13,
14], allowing to foresee that, as in humans, OB could be a useful early indicator in the diagnosis of this syndrome in animals. However, in companion animals the relationship between the establishment of these clinical entities and changes in the position, shape or volume of the OB have not yet been unequivocally described. A myriad of metabolic and infectious diseases or even the development of neoplasms and the occurrence of head injuries are also capable of inducing olfactory functional abnormalities, but it is believed that these are more related to changes in the nasal cavity and in the brain regions responsible for olfactory processing, failing to establish relationships with direct OB affection due to its distinctive anatomical position within the skull [
1]. Knowing that the OB and its physical and positional characteristics can potentially be affected by various diseases places this structure as a sentinel and early indicator of the development of these processes, both physically and functionally.
An in-depth knowledge of the anatomical and morphological characteristics of OB in companion animals is essential to allow its correct identification, description and confirmation of its normality or the presence of structural changes. Due to its anatomical position, the OB can only be approached in vivo by imaging techniques, either by CT or high-resolution MRI, the latter technique being ideal for detailed determination of its position and description of its shape and volume, using T2 -weighted sequences for better definition [
15]. In dogs, some characterization studies have been carried out that attempt to establish relationships between the position, shape, volume, angle and orientation of the OB regarding to the rest of the brain and the head conformation of the animal, with the shape of the OB appearing to have a direct relationship with the depth of the lamina cribrosa in different breeds [
16] and having the potential to be used as an indicator of the likelihood of developing complications associated with Brachycephalic Obstructive Airway Syndrome (BOAS) [
17]. It is well established, for instance, that brachycephalic breeds of dogs have a more compact OB with a ventral orientation compared to mesocephalic or dolichocephalic ones due to the modifications of the head skeleton [
17,
18], which can translate into reduced olfactory acuity. In the case of cats, imaging studies directly focused on the anatomical description of the OB are limited, being known that this structure tends to appear rostral to the brain in a similar way to that observed in dolichocephalic dogs. In brachycephalic cat breeds, as well as in dogs, the OB is also less protruding and occupies a more ventral position and orientation [
19]. Considering the established variations observed in the dog's OB depending on the different cranial conformations, the authors hypothesize that the same should occur in the cat. Still, there is a need to establish well-defined relationships between the head conformation of different cat breeds and the anatomical, morphological and positional characteristics of the OB in this species, that can serve as a starting point for the use of OB modifications as an early indicator of changes associated with the development of deviations of a varied nature, namely in neurodegenerative entities or metabolic diseases.
The aim of this work is to characterize the OB in cats regarding its shape, position and orientation and to identify possible correlations between these characteristics and the head conformation in different breeds. More broadly, this study aims to explore the potential of using feline OB to indicate early changes secondary to diseases of different etiologies and that affect this structure.
2. Materials and Methods
The medical records and imaging database of the Dick White Referrals Veterinary Center's Diagnostic Imaging service was explored to identify cats that underwent a head MRI scan between 2019 and 2024. Exams were analyzed and just those in which midsagittal and transverse T2-weighted images of the head were available were considered. Only clinical cases with a complete clinical history in which the animal owner signed an informed consent form authorizing the use of image records for research purposes were included. Informed consent was obtained at the time of the animal admission to the hospital and no ethical approval was obtained due to the retrospective nature of this study, and prior acquisition of written owner consent for patient data to be included in scientific studies.
The absence of physical changes in the head that could affect the OB was established as inclusion criteria, and if changes were identified but these did not directly affect the OB either due to its anatomical distance or etiology, the cases were also included. Conversely, the exclusion criteria established were the unavailability of a complete medical history, the lack of informed consent signed by animal's owner or the identification of head changes directly affecting the OB.
The animals' clinical history was reviewed, and information collected included age and sex, imaging findings identified, and established diagnosis. During this phase, the anonymity of the animal and its owner was guaranteed, and breed was not considered when obtaining clinical data and images. Following the established inclusion and exclusion criteria, 40 cats were included in this study. The group included a total of 23 males and 17 females. The age of the animals ranged from 1 to 18 years (7.6 + 4.6 years).
The MRI Images were obtained with an Lucente 0,3T – Hitachi MRI device and the following parameters were considered: slice thickness of 3 mm, 15 slices, matrix size of 512x512, field of view of 180 mm x 180 mm (32,400 mm²). The obtained images were converted into DICOM format and analyzed using a commercially available software (Weasis v4.5.1) [
20]. Images were examined by a single image reviewer who was fully informed about the purposes of the study and of the measurements to be performed, but unaware of the cat's breed and clinical history so as not to influence the evaluation and application of the established methodology. The midsagittal images were identified as those which included the entire head, from the nasal planum (rostrally) to the intercondylar notch of the foramen magnum (caudally), and in which the largest possible image of the cerebellum and interthalamic adhesion were observed. The transverse images selected were those in which it was possible to obtain the maximum interzygomatic distance.
Animals were divided into one of three classical head conformation categories, adapting the methodology used by [
21] for the Skull Index (SI) determination, considering the Skull Width (SW) and Skull Length (SL) integrated in the following formula:
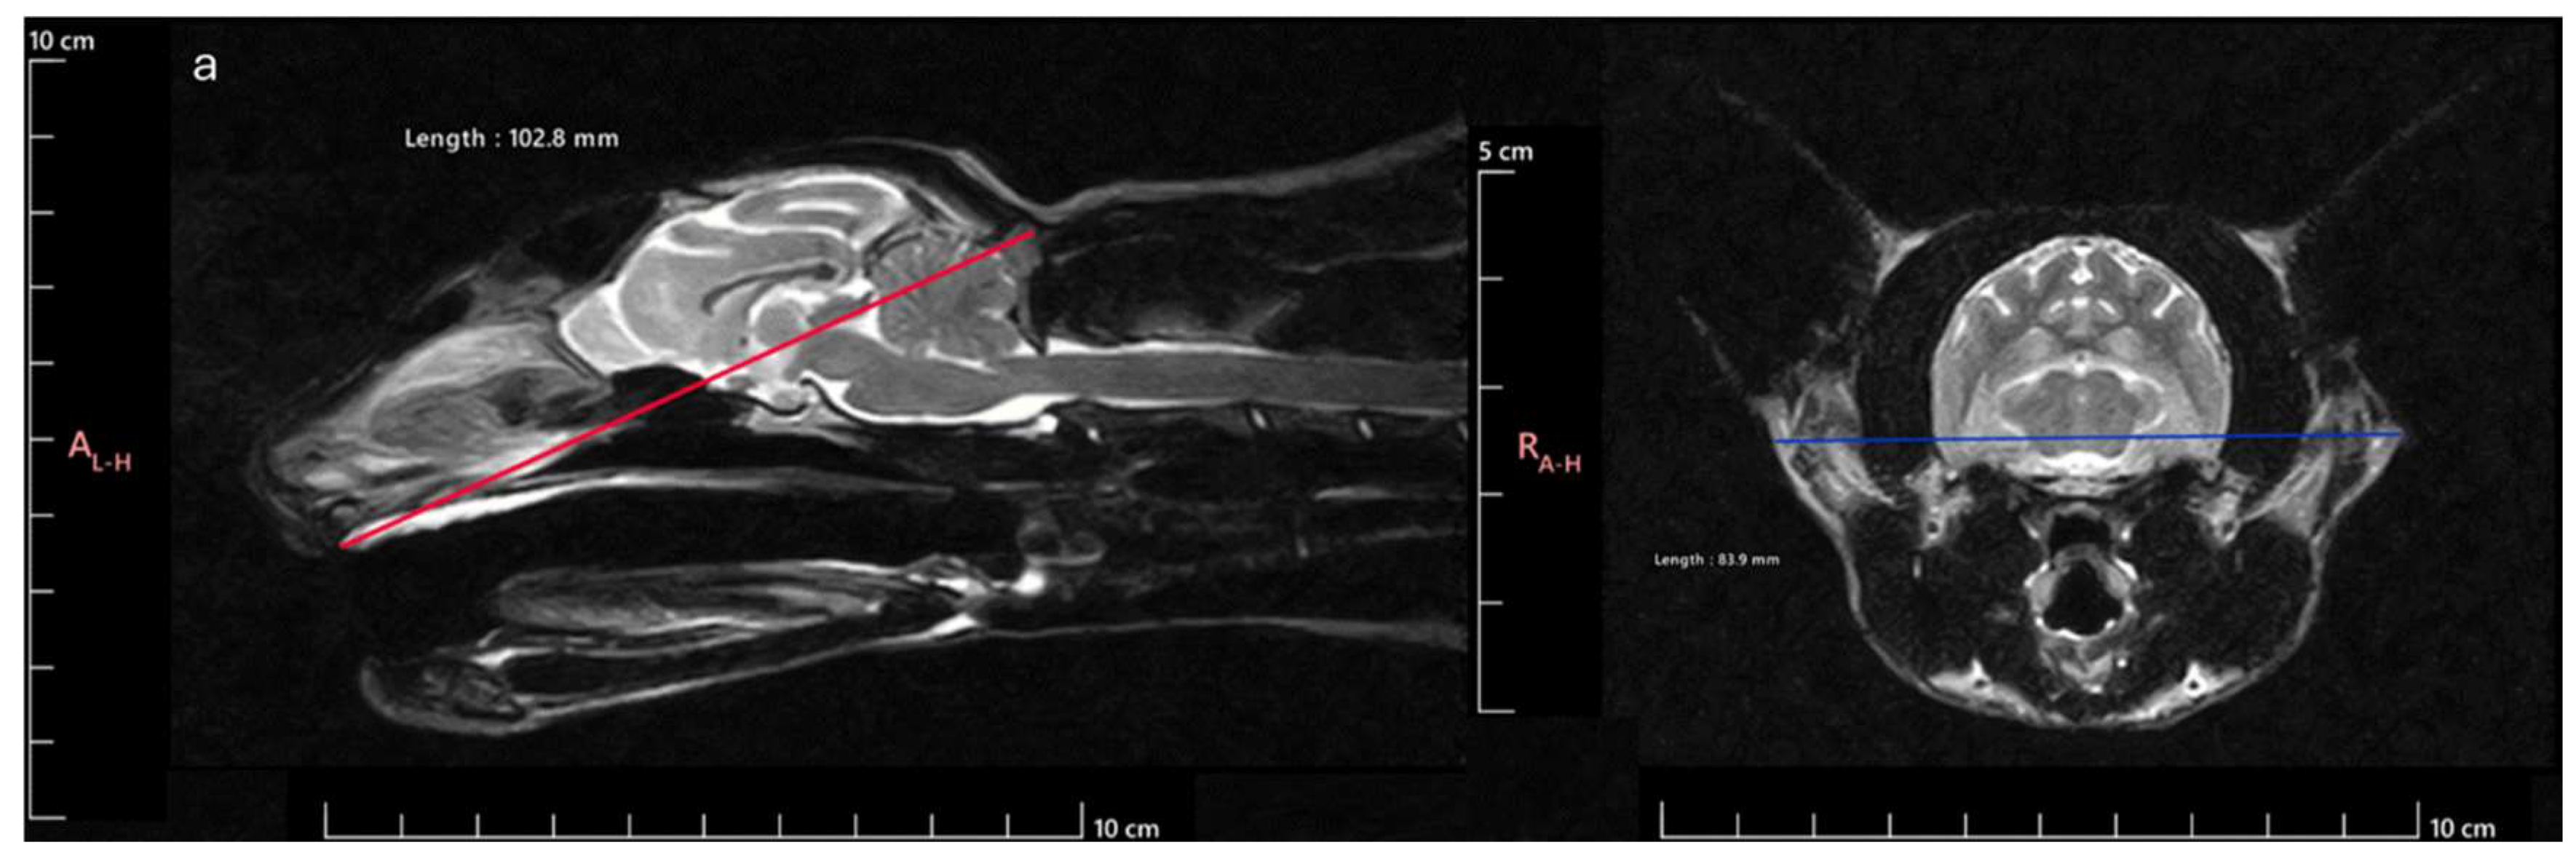
SW was stablished as the maximum distance between the outer margins of the zygomatic arches and SL as the distance between inion (highest point of the external occipital protuberance, near the middle of the squamous part of occipital bone) and prosthion (rostral limit of the interincisive suture) (Figure 1). According to the SI obtained, the animals were classified as Brachycephalic (SI > 80), Mesocephalic (SI 75-79) or Dolichocephalic (SI < 75). Considering this division of animals regarding head conformation, 17 were classified as brachycephalic (8 males and 9 females), 9 as mesocephalic (6 males and 3 females) and 14 as dolichocephalic (9 males and 5 females) (Table 1). The age of the animals was 8.53 + 5,06 years for brachycephalic, 8.67 + 4.15 years for mesocephalic and 5.86 + 4.54 years for dolichocephalic. Thus, all animals in the different groups were skeletally mature, and no groups had significantly younger or older average ages
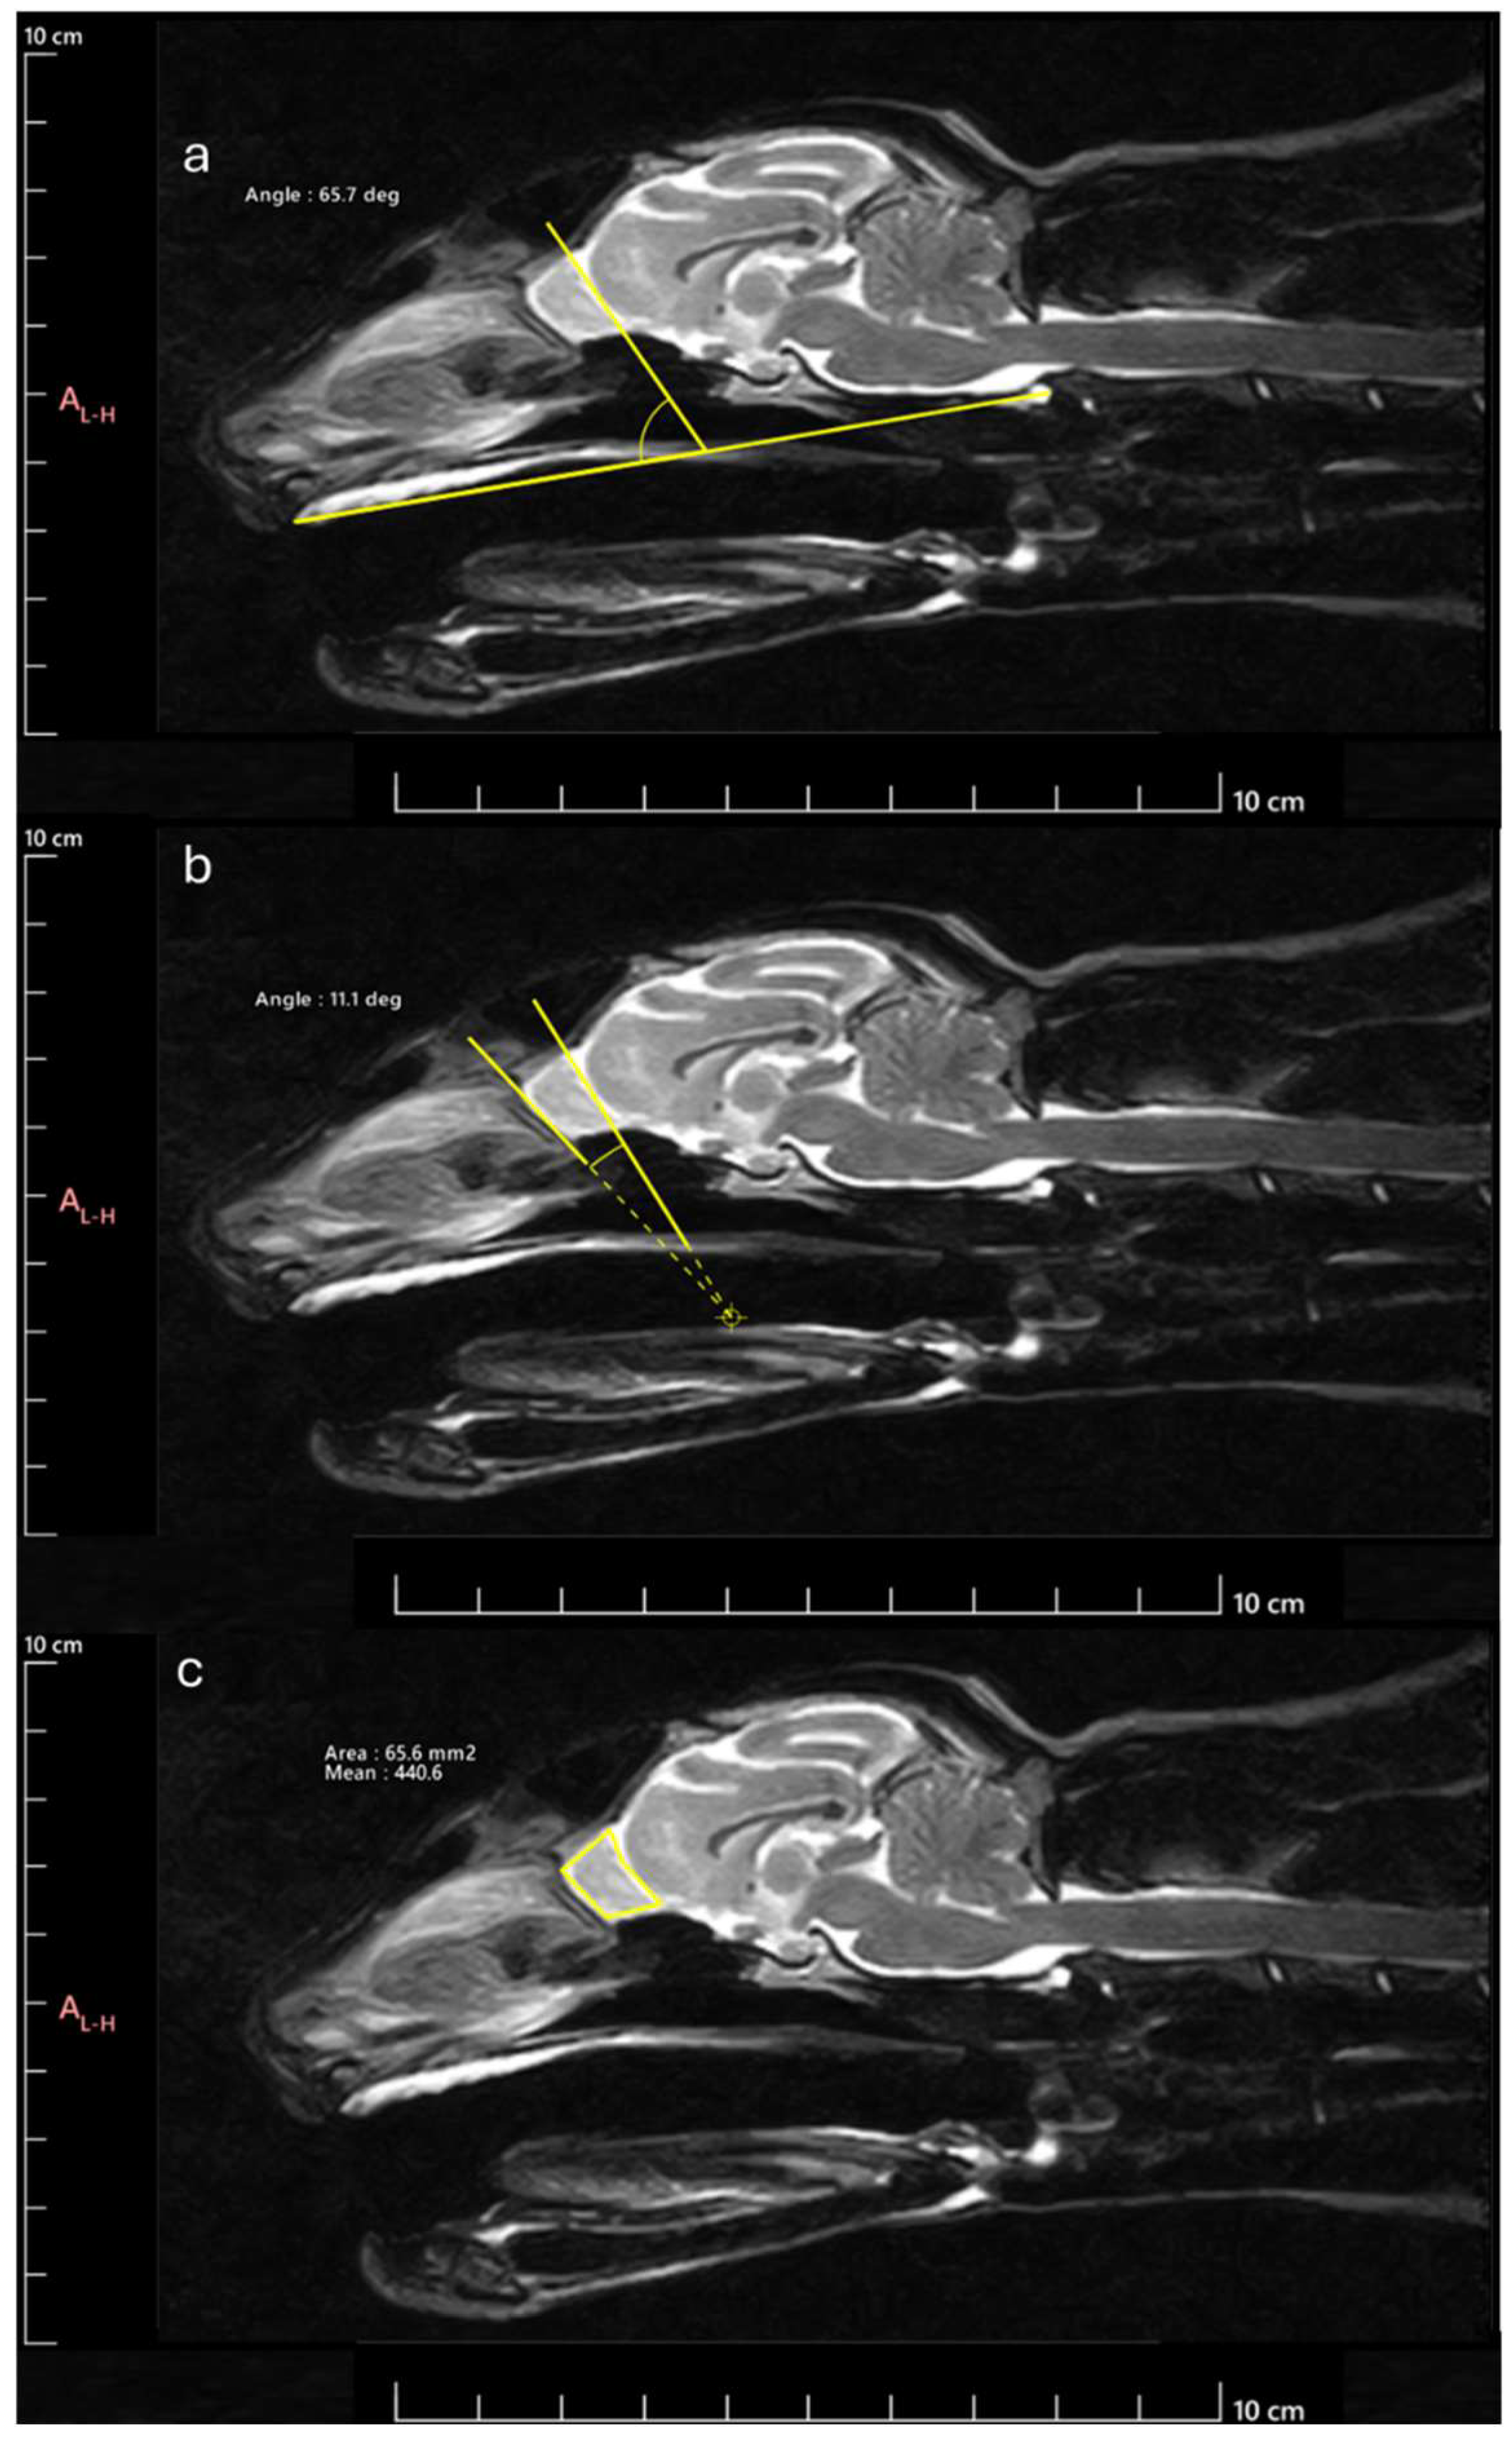
Next, the OB was measured to determine the following parameters: OB angle (OBA), OB orientation (OBO), and OB sagittal section area (OBSA). The OBA was calculated applying the methodology described by [
17]. Briefly, the angle formed by the line passing through the olfactory fissure and the line between the hard palate and the intercondylar notch of the foramen magnum was determined (
Figure 2a). The OBO was evaluated considering the open angle formed by the lines that pass through the olfactory fissure and through the most rostral limit of the OB (
Figure 2b). Bigger angles were considered to correspond to OB with dorsal orientation and smaller angles to OB with ventral orientation. The OBSA was determined automatically using the polygonal selection tool of the selected software (
Figure 2c), a tool that allows to draw custom polygonal shapes over the MRI images to delineate regions of interest and to precisely measure variables such as area after defining the vertices of the desired polygon, in this case, the limits of the OB in sagittal section. The same image reviewer carried out three measurements of all variables in all images on different days, with the average of the three measurements being considered in all cases. Whenever differences greater than 10% were observed between measurements of the same variable in the same animal, a new measurement was taken, and the 3 closest values were considered for the final average.
2.1. Statistical Analysis
Statistical analysis was performed using GraphPad Prism software version 9.00 for Windows (GraphPad Software, La Jolla, CA, USA). The Normal Gaussian distributions of data was confirmed using the Shapiro-Wilk test. Data with normal distribution was compared using an Ordinary one-way ANOVA test, and data without normal distribution using a Kruskal-Wallis test. Linear regression analysis was performed to determine the Pearson correlation coefficients between variables. A value of p < 0.05 was considered as statistically significant. The significance of the results is shown according to p values by the symbol *: * corresponds to 0.01 ≤ p < 0.05, ** to 0.001 ≤ p < 0.01, *** to 0.0001 ≤ p < 0.001, and **** to p < 0.0001.
3. Results
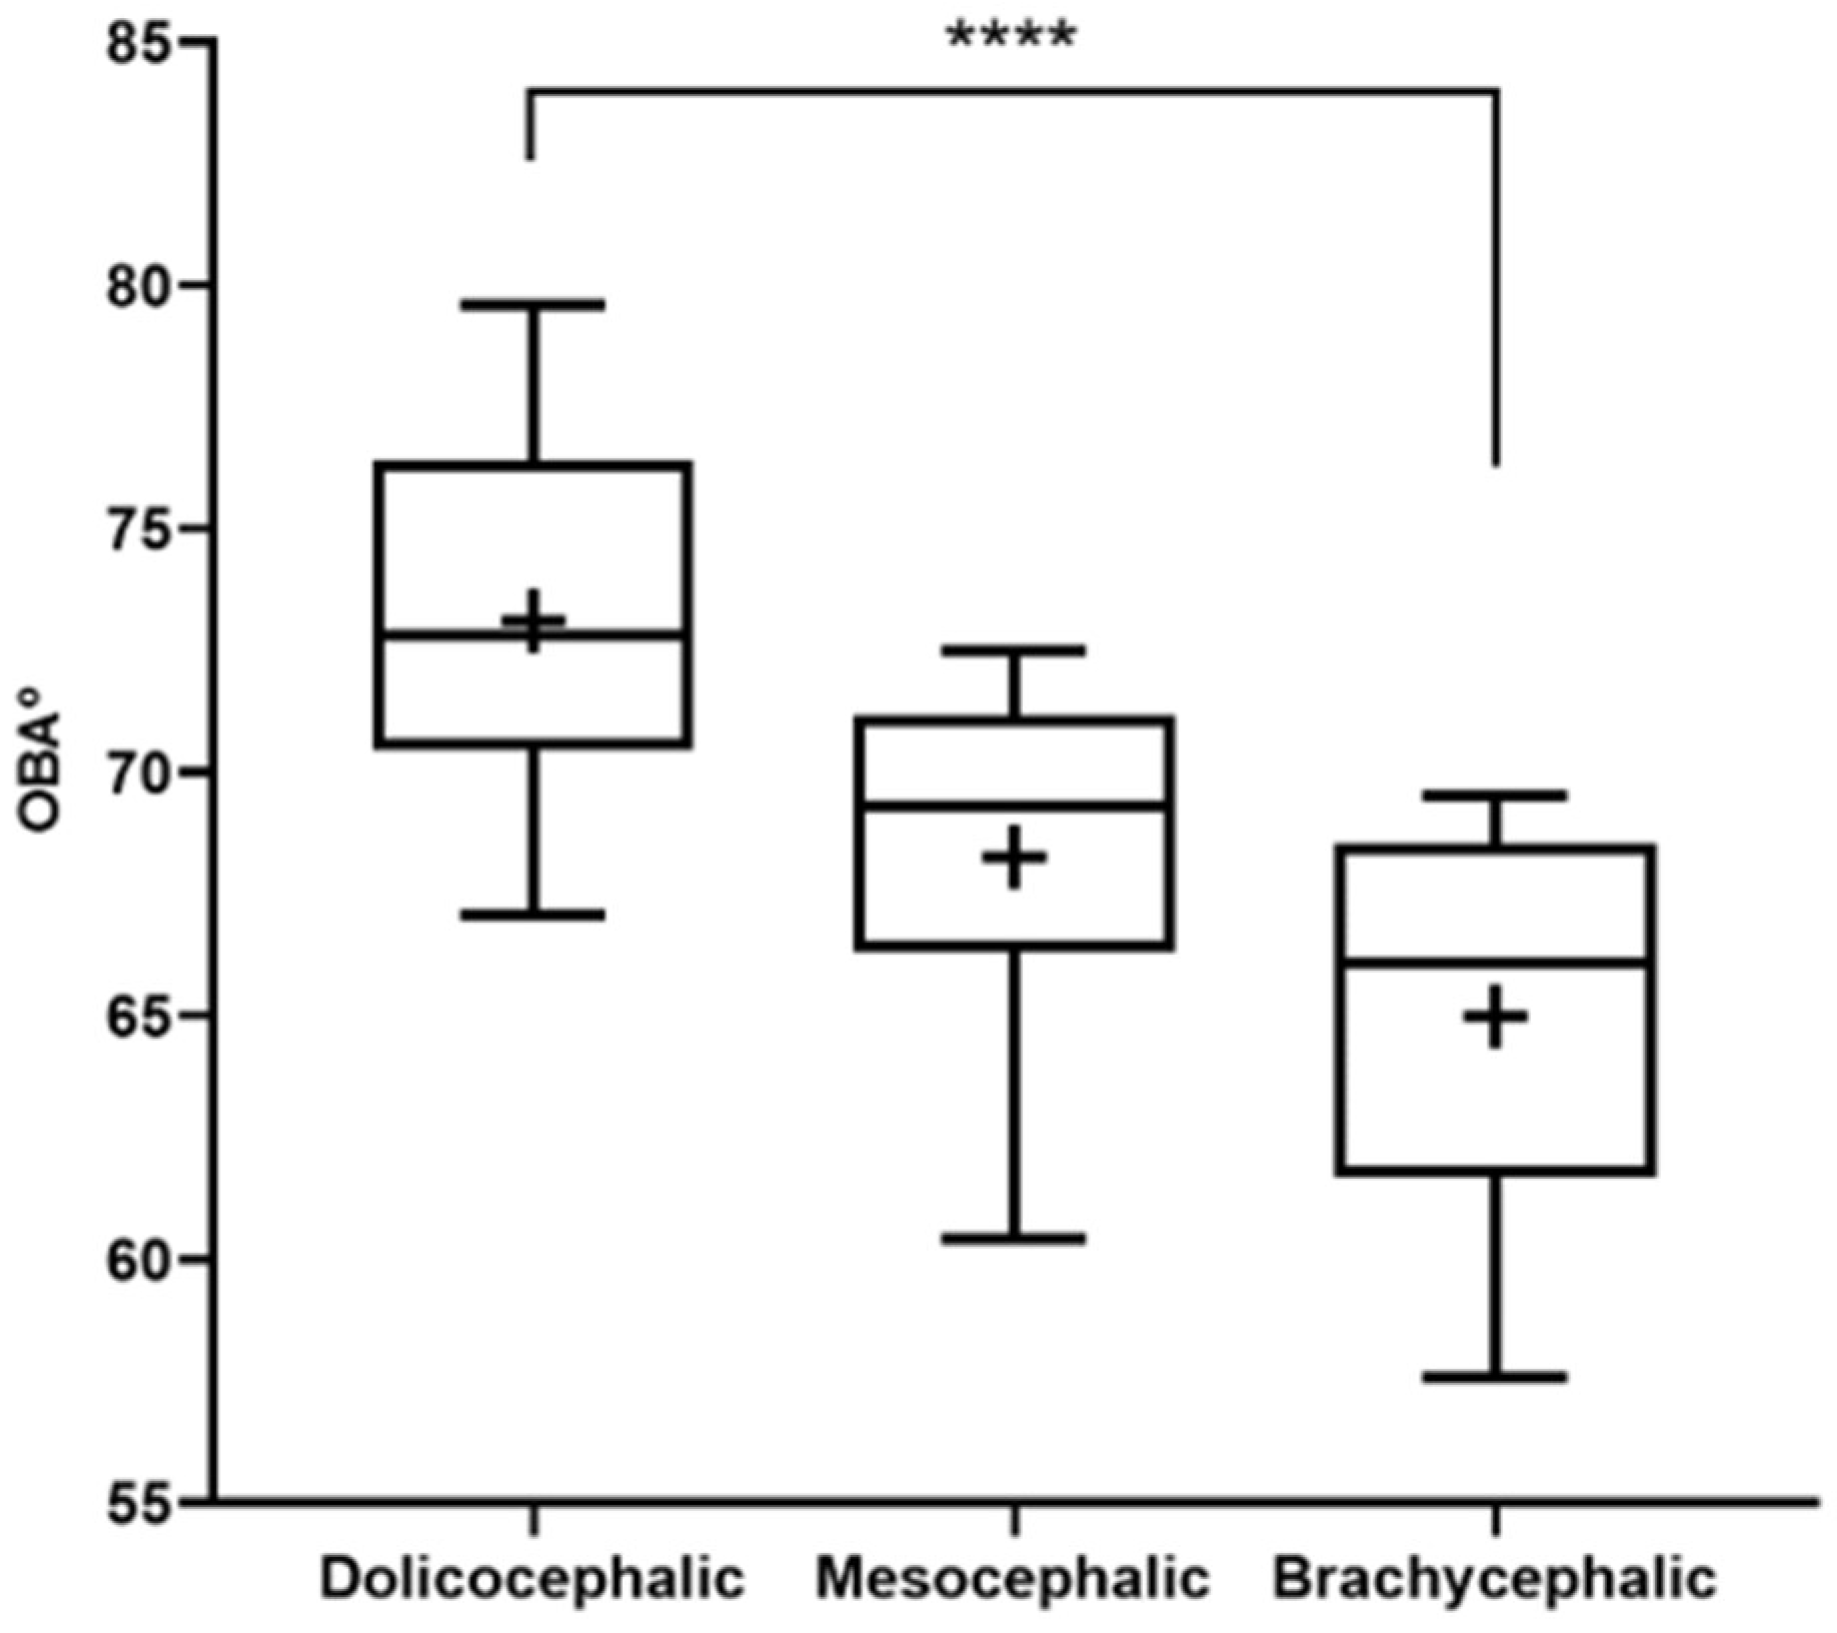
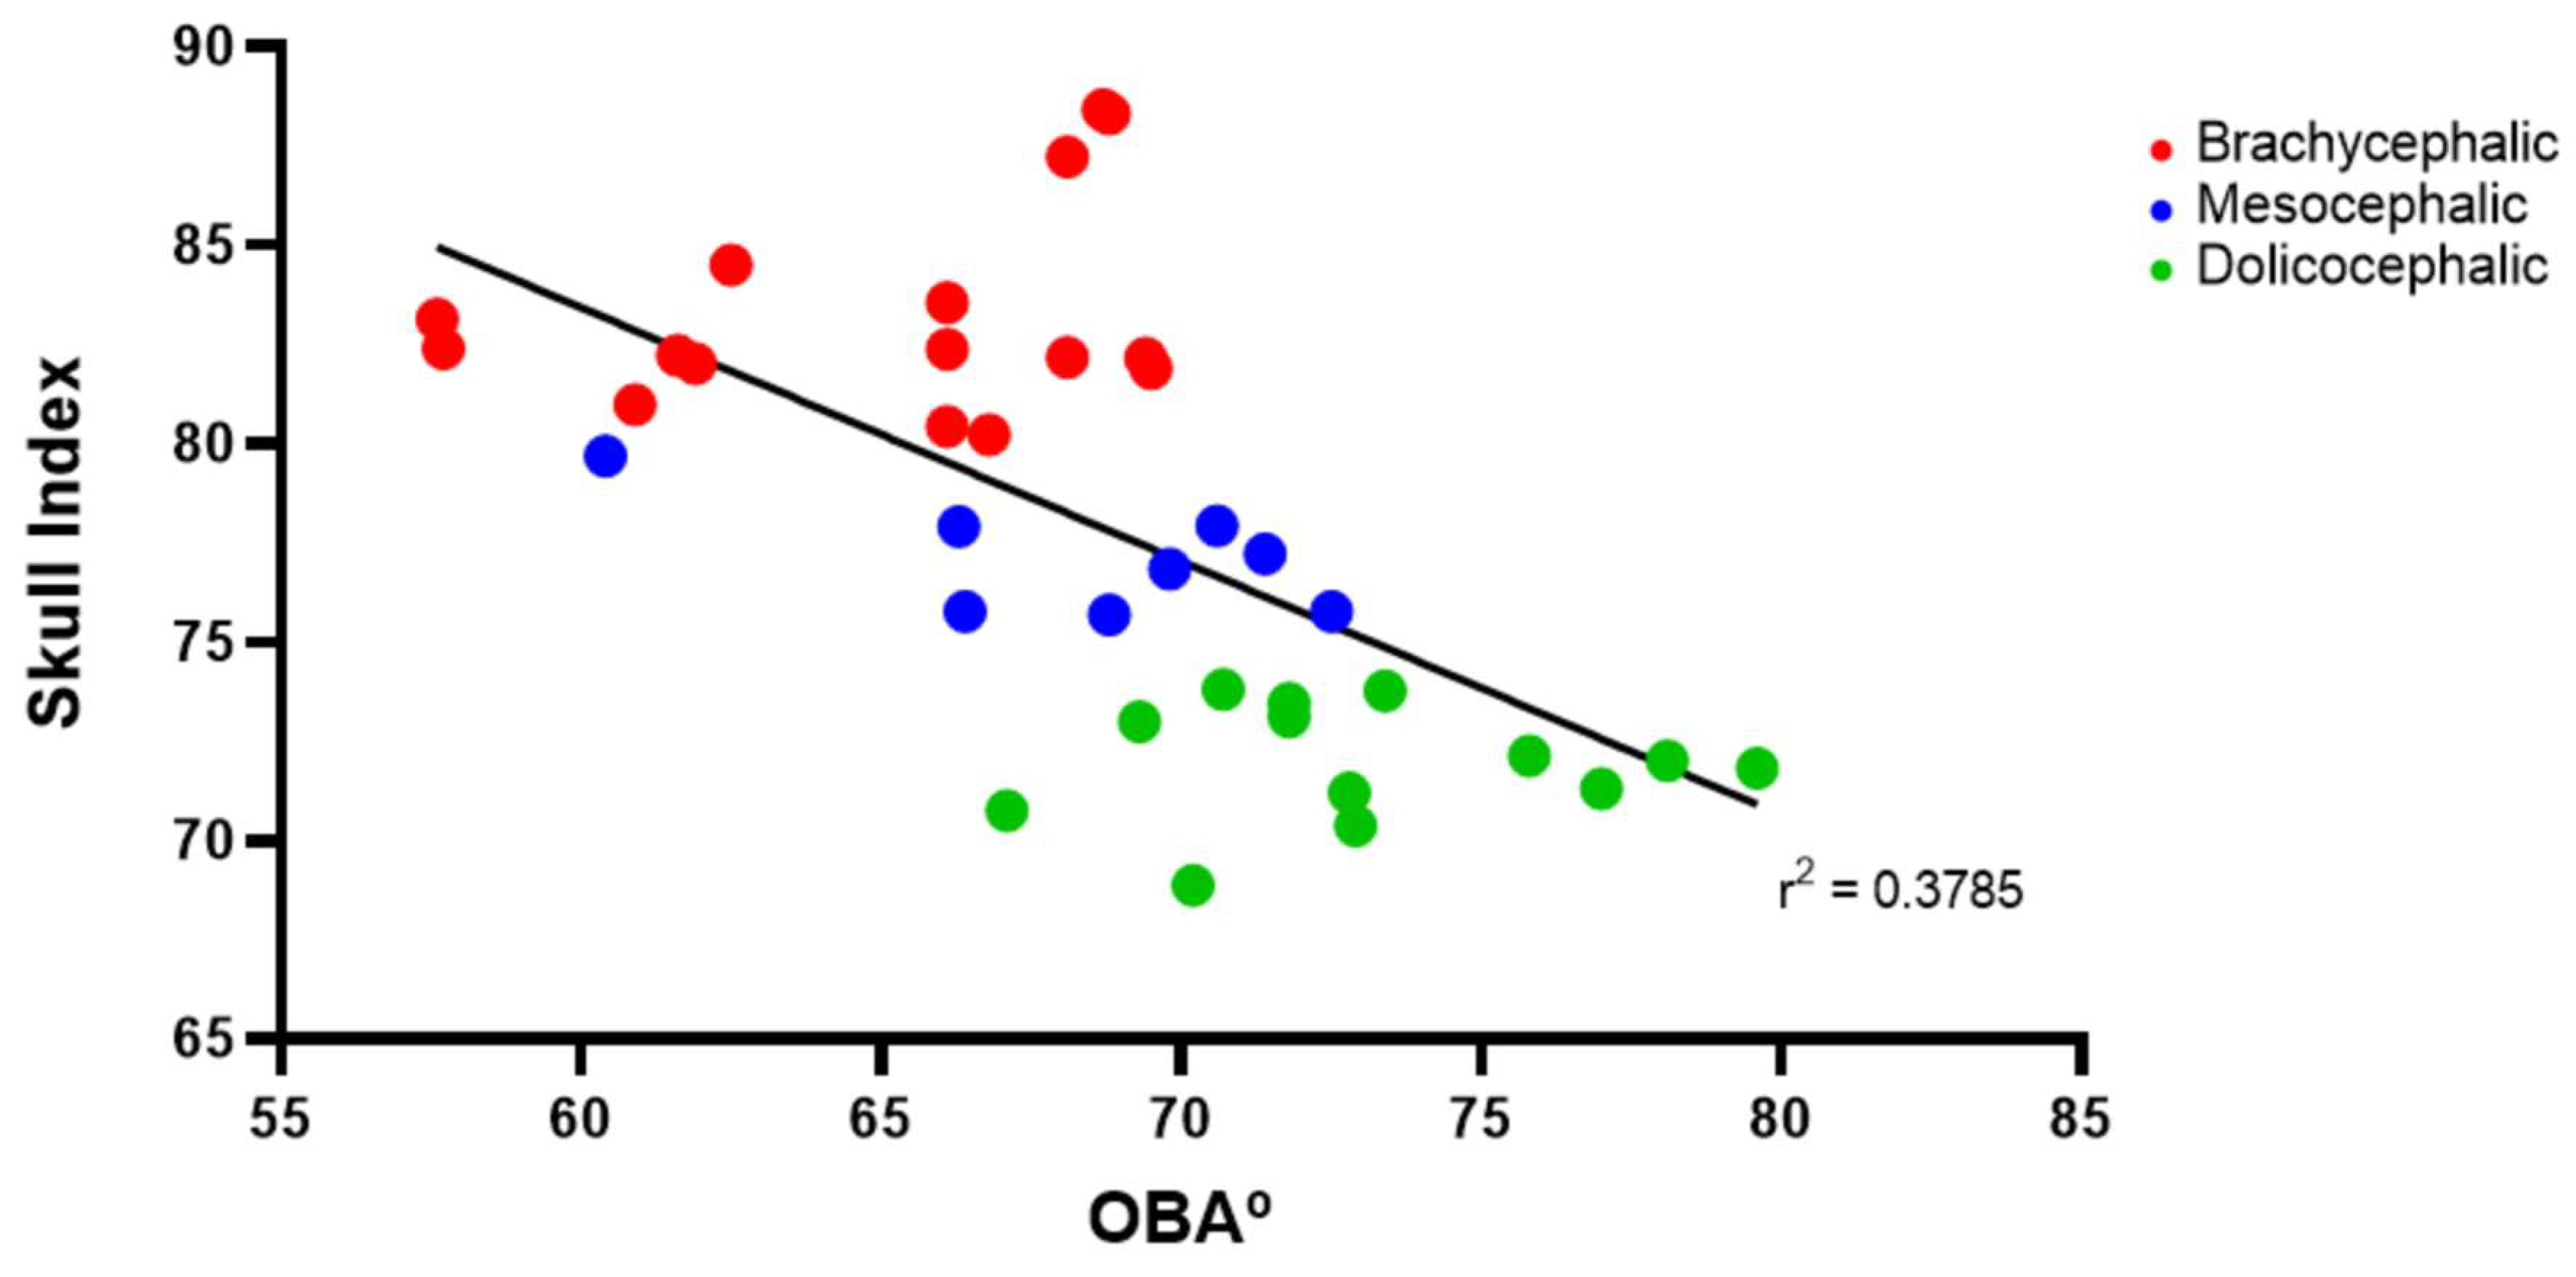
The results of the OBA determination can be found in Figure 3 and Table 2. The OBA is higher in the group of dolichocephalic cats and lower in the group of brachycephalic animals, with the group of mesocephalic animals occupying an intermediate position. The OBA values are respectively 64.99 + 1.01º for the brachycephalic group, 68.28 + 1.37º for the mesocephalic group and 73.12 + 1.01 for the dolichocephalic group. Statistical differences are observed between the brachycephalic and dolichocephalic groups (p < 0.0001). Results of linear regression analysis can be seen in Figure 4 and demonstrate that OBA significantly decreased with increasing SI, with a moderate negative correlation between the two variables (r2 = 0.38).
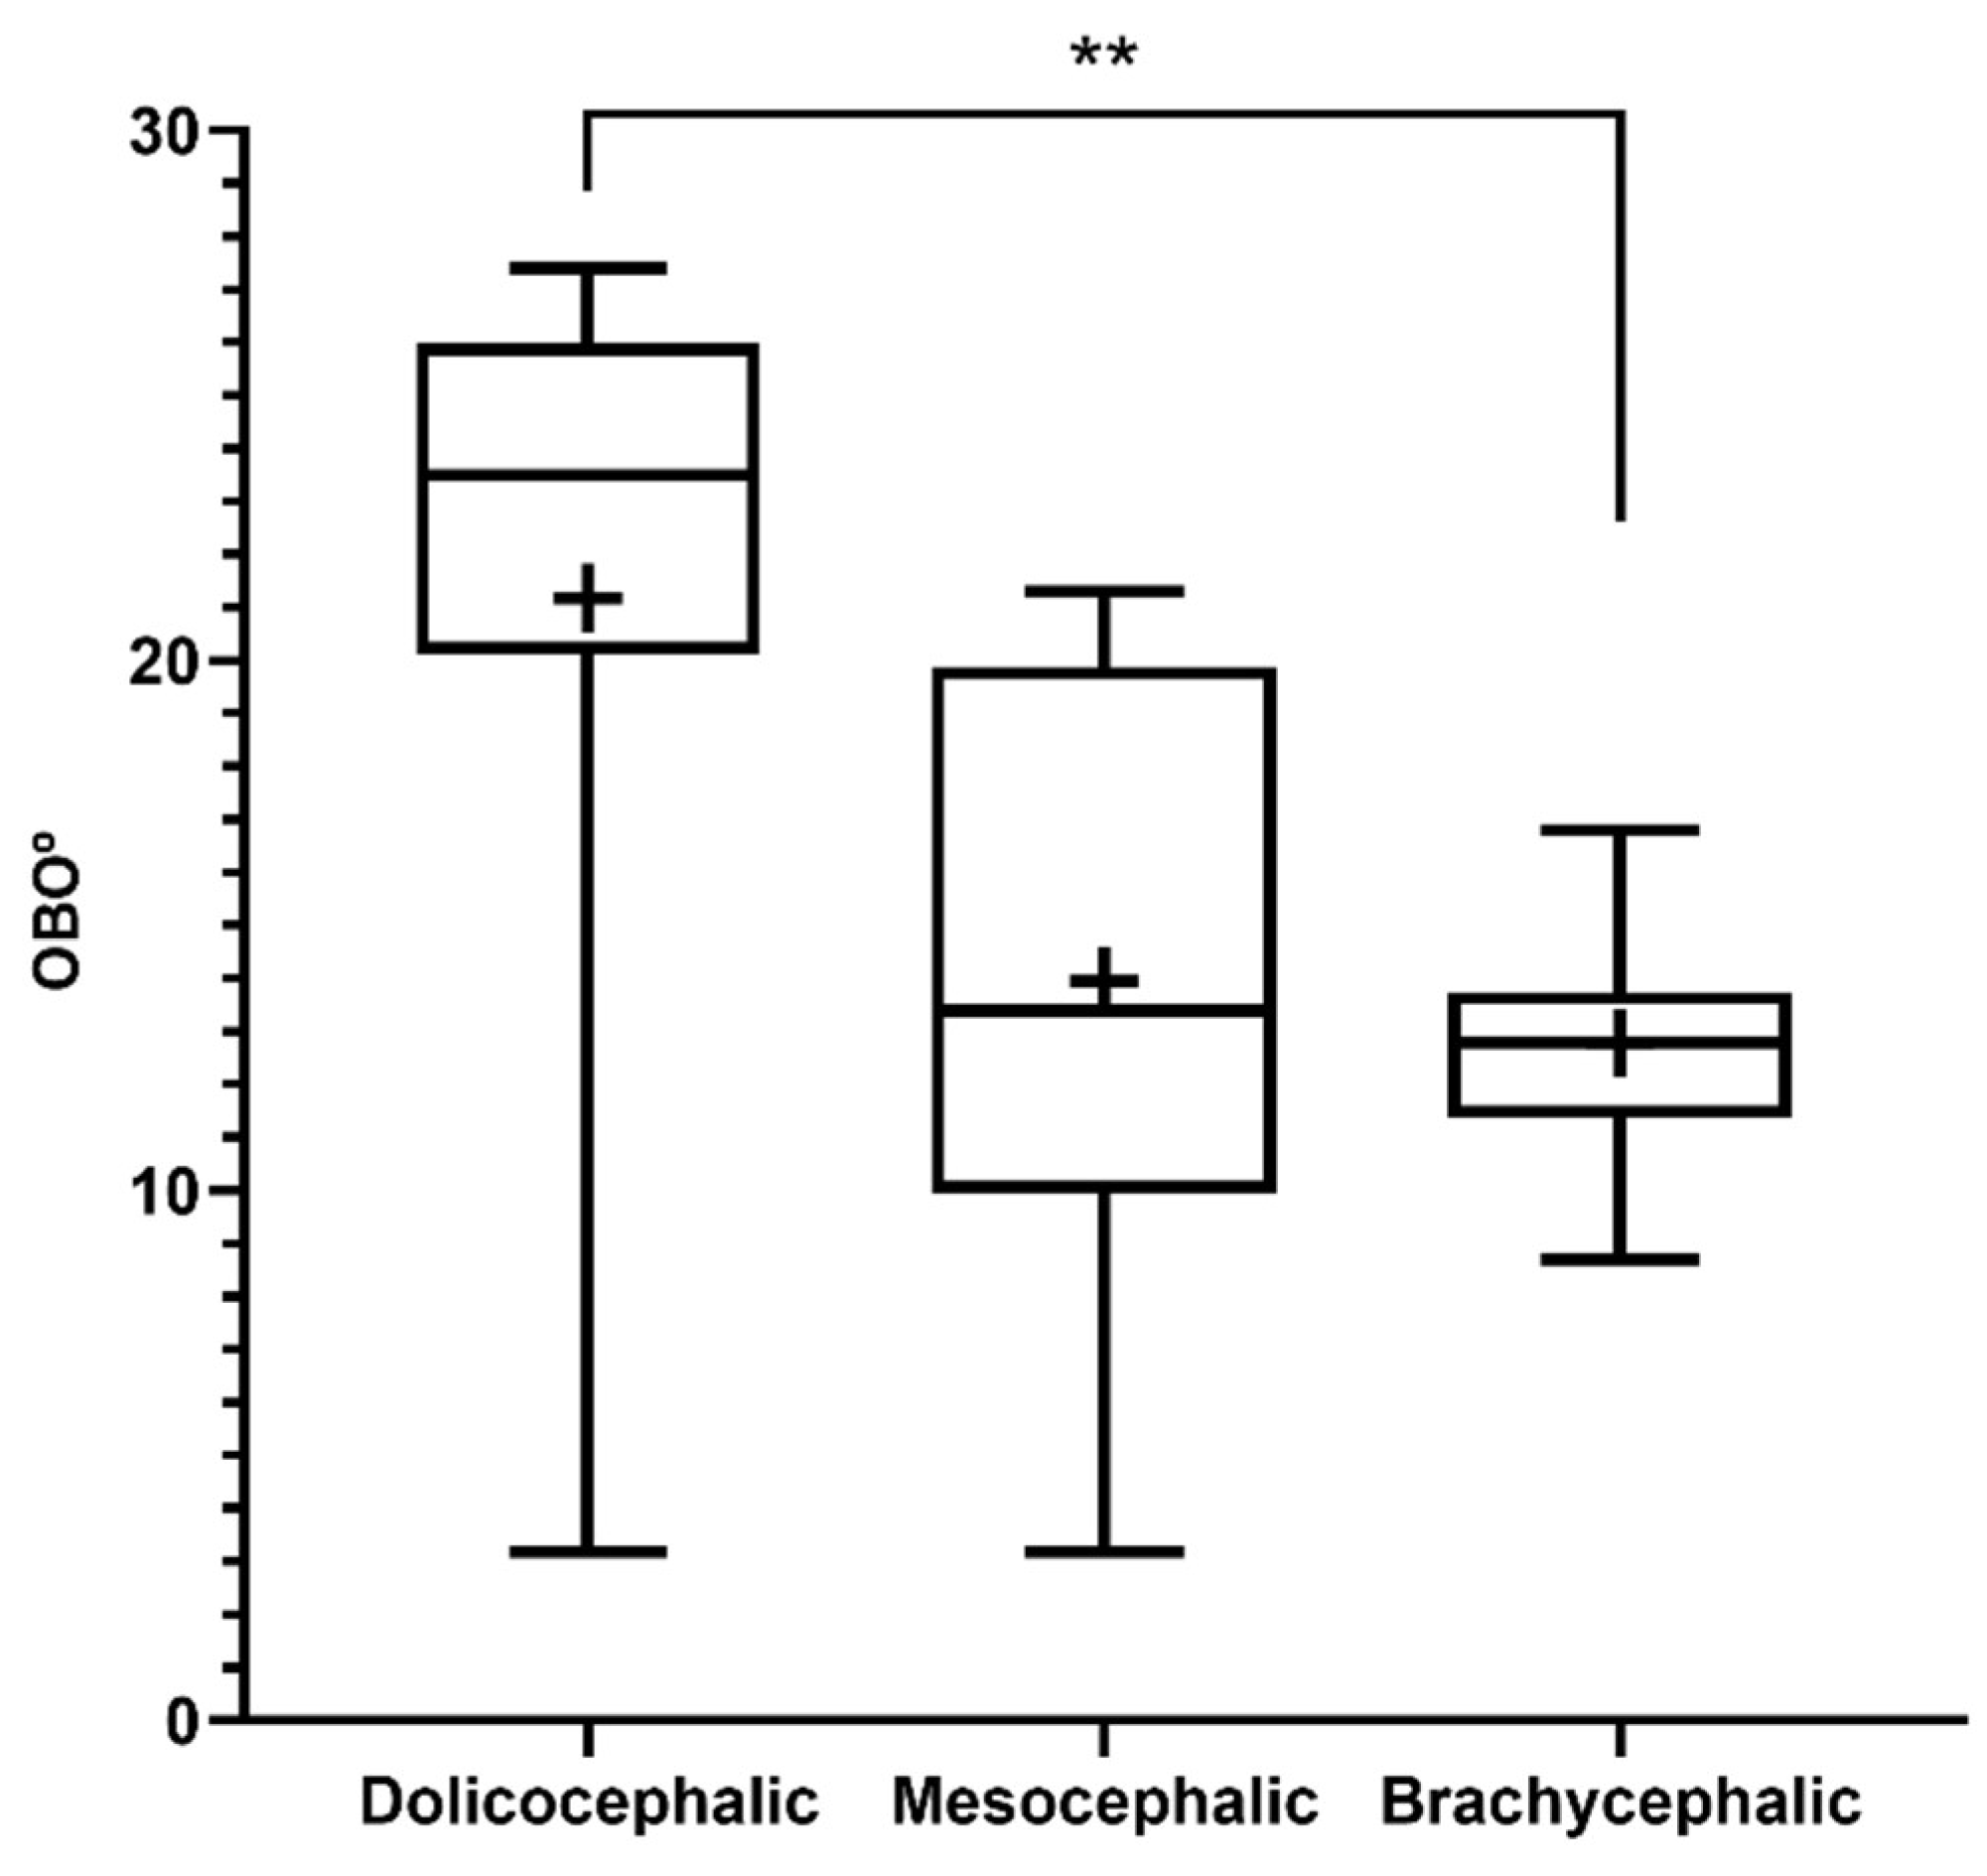
The results of the OBO determination can be found in
Figure 5 and
Table 2. In the group of dolichocephalic animals, a larger open angle is observed (21.18
+ 2.15º), with these animals having a dorsal orientation of the OB. The group of brachycephalic animals presents a OB of ventral orientation associated with smaller open angles (12.79
+ 0.55º). The group of mesocephalic animals occupies an intermediate position (13.95 + 2.15º). Statistical differences are observed between the brachycephalic and dolichocephalic groups (p < 0.0024). Results of linear regression analysis can be seen in
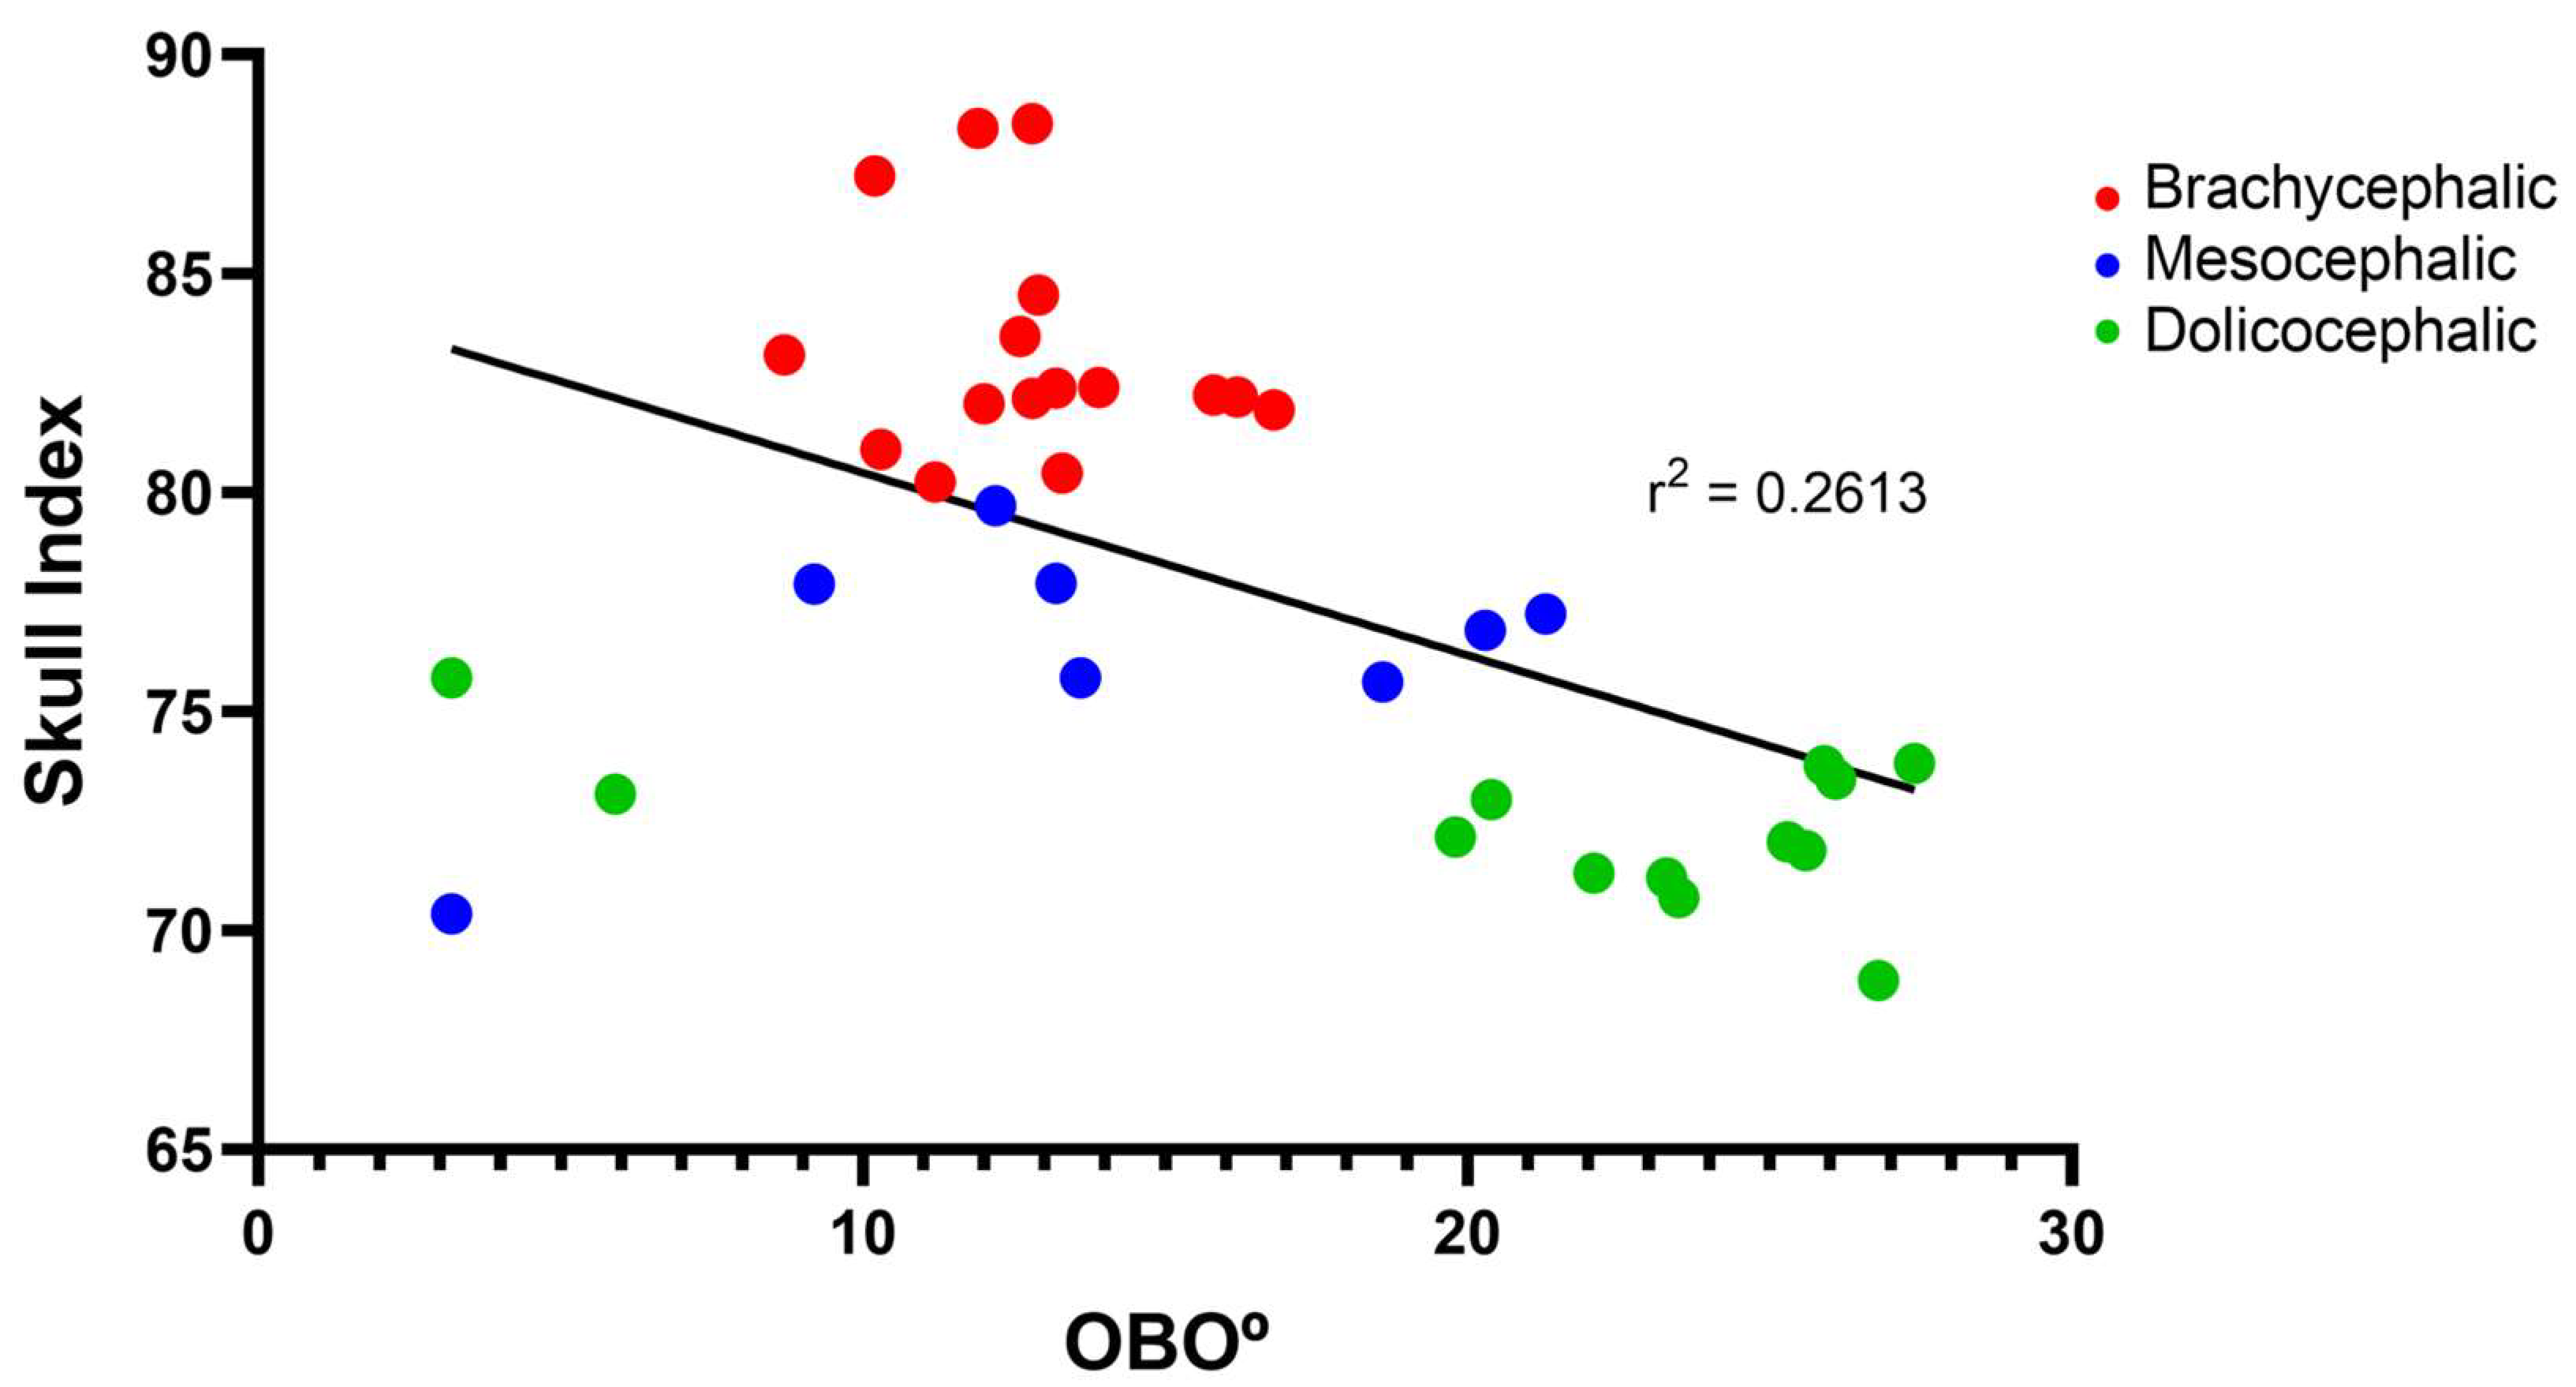
Figure 6 and demonstrate that OBO significantly decreased with increasing SI, with a weak negative correlation between the two variables (r
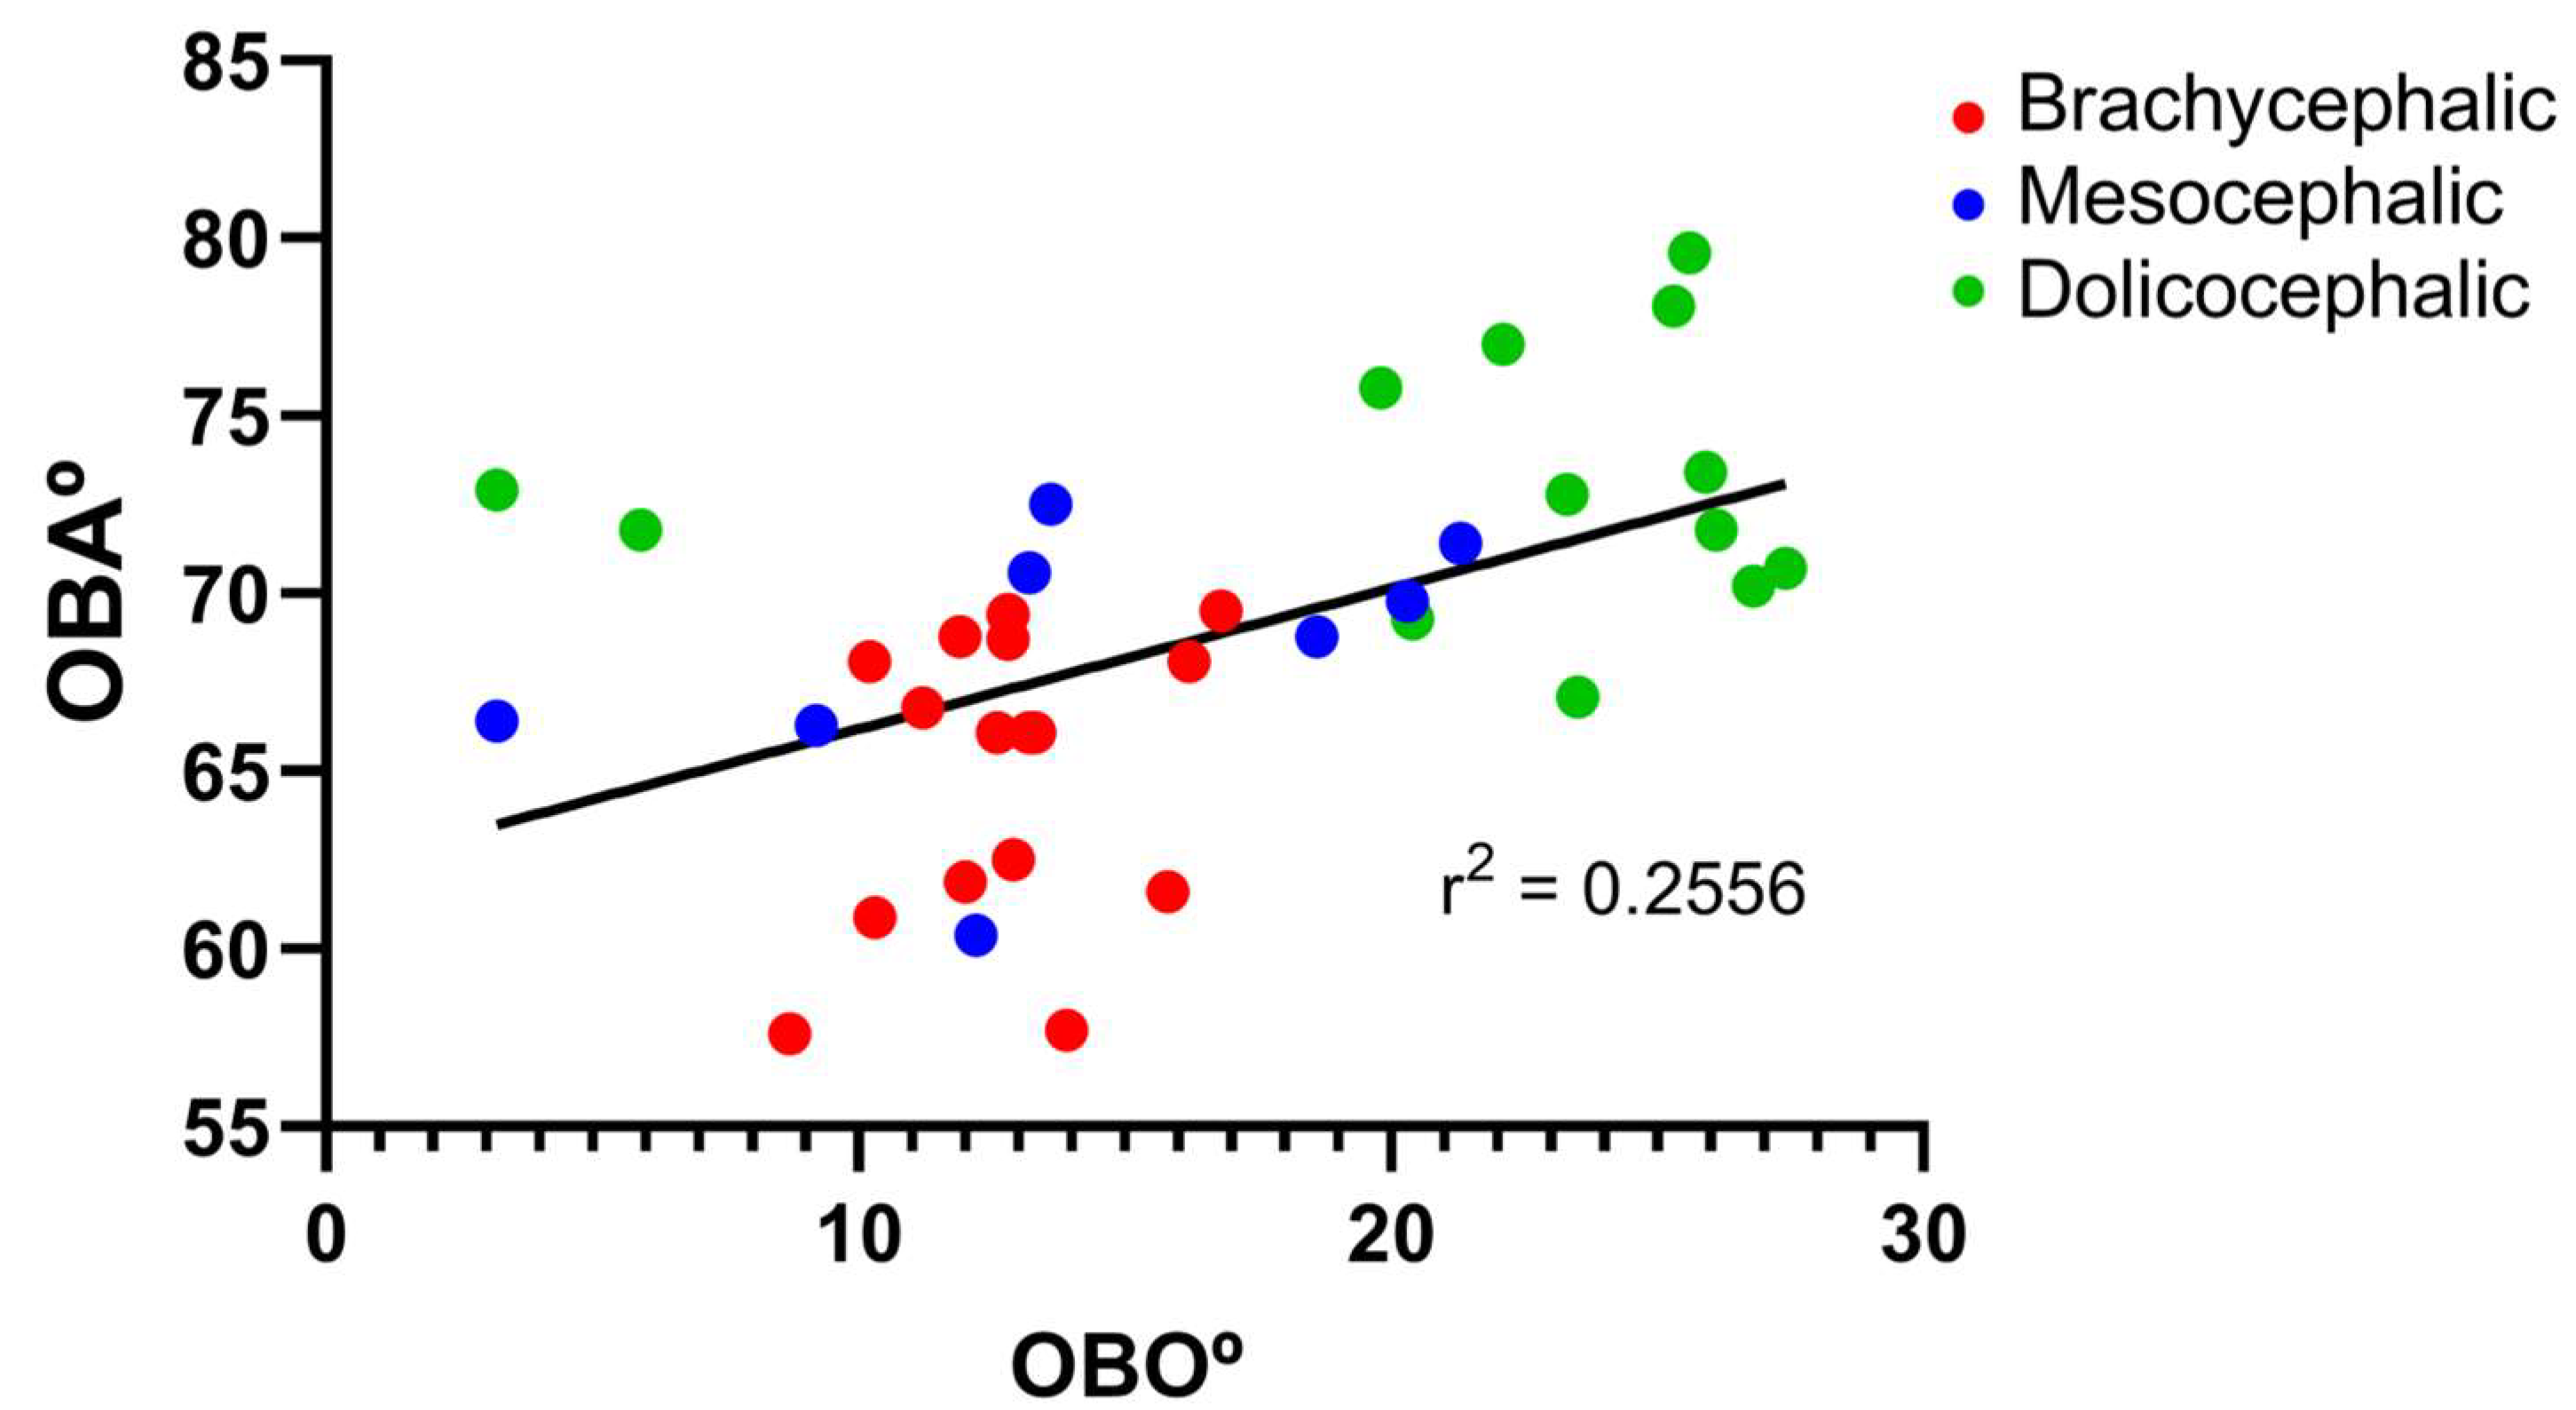
2 = 0.26). Additionally, the results of the linear regression analysis between OBA and OBO can be seen in
Figure 7, which demonstrates, as expected considering the previous results, that a decrease in OBO is associated with an equal decrease in OBA, establishing a weak positive correlation between the two variables (r
2 = 0.26).
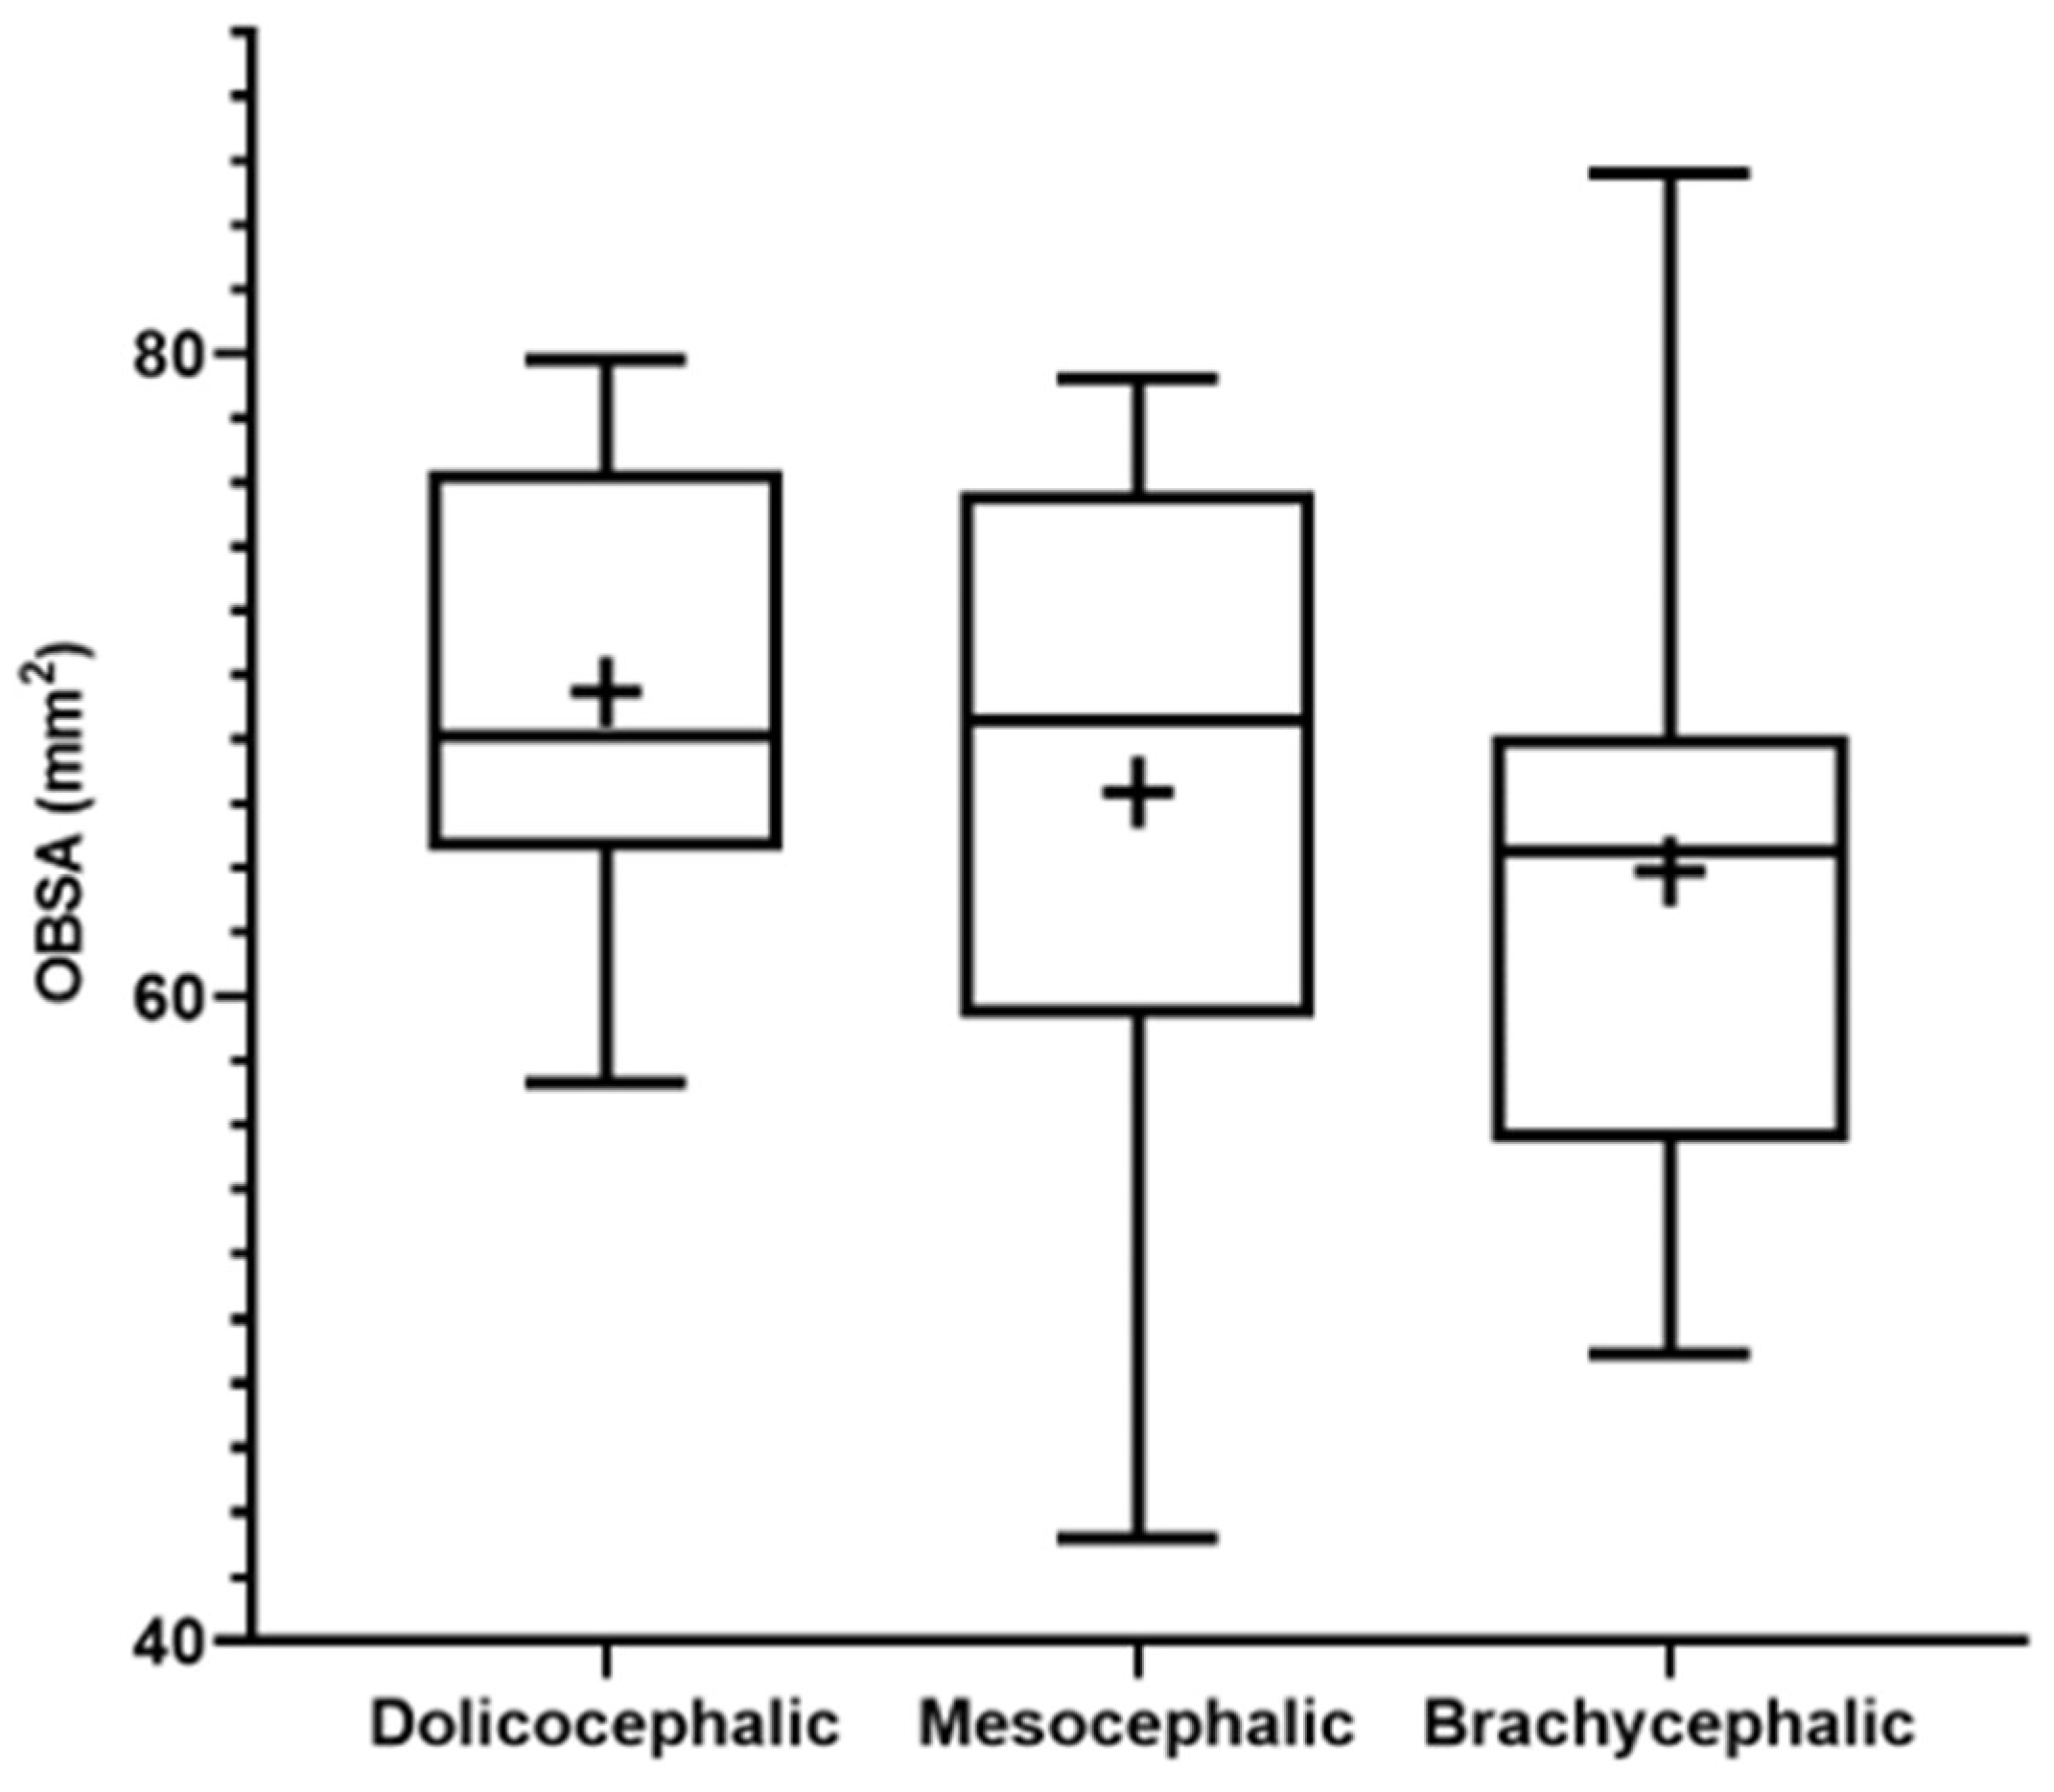
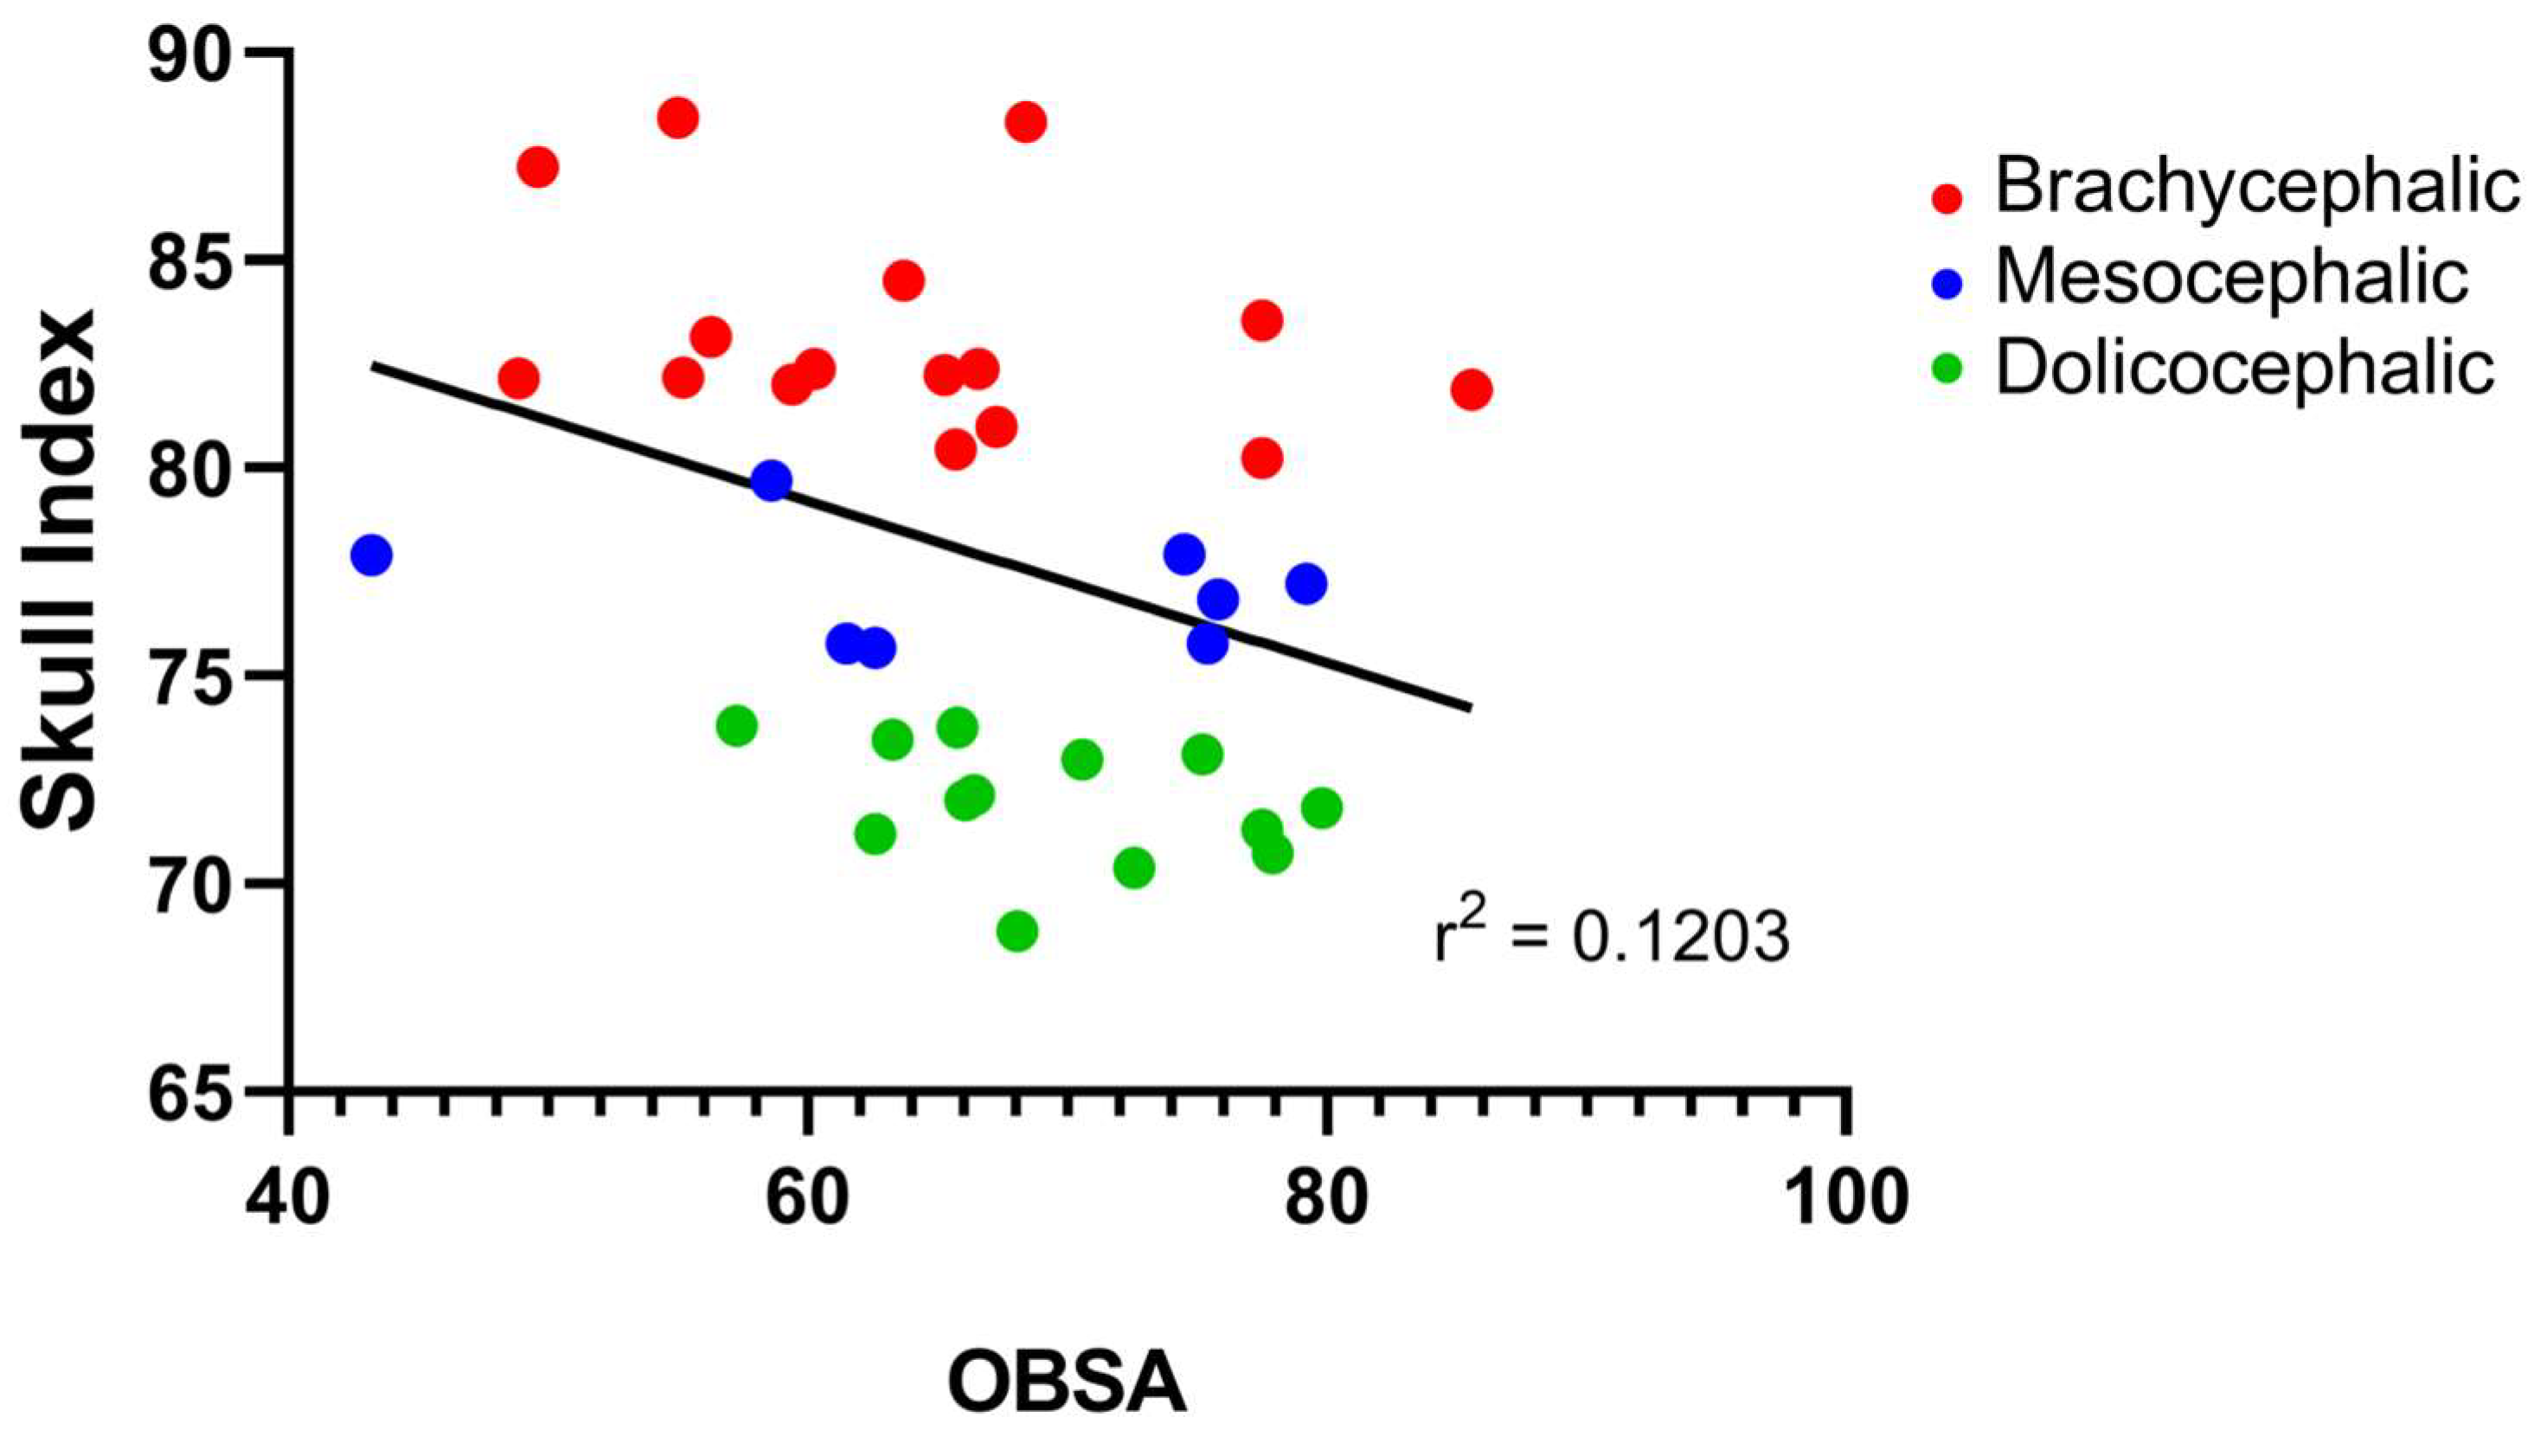
The results of the OBSA can be found in
Figure 8 and
Table 2. In the group of dolichocephalic animals, the OB has a larger sagittal section area (69.48
+ 1.89 mm
2), with the brachycephalic animals presenting the smallest area (63.89
+ 2.55 mm
2) and the mesocephalic group occupying an intermediate position (66.35
+ 4.30 mm
2). However, no statistical differences were observed between the groups. Results of linear regression analysis can be seen in
Figure 9 and demonstrate that OBSA significantly decreased with increasing SI, with a weak negative correlation between the two variables (r
2 = 0.12).
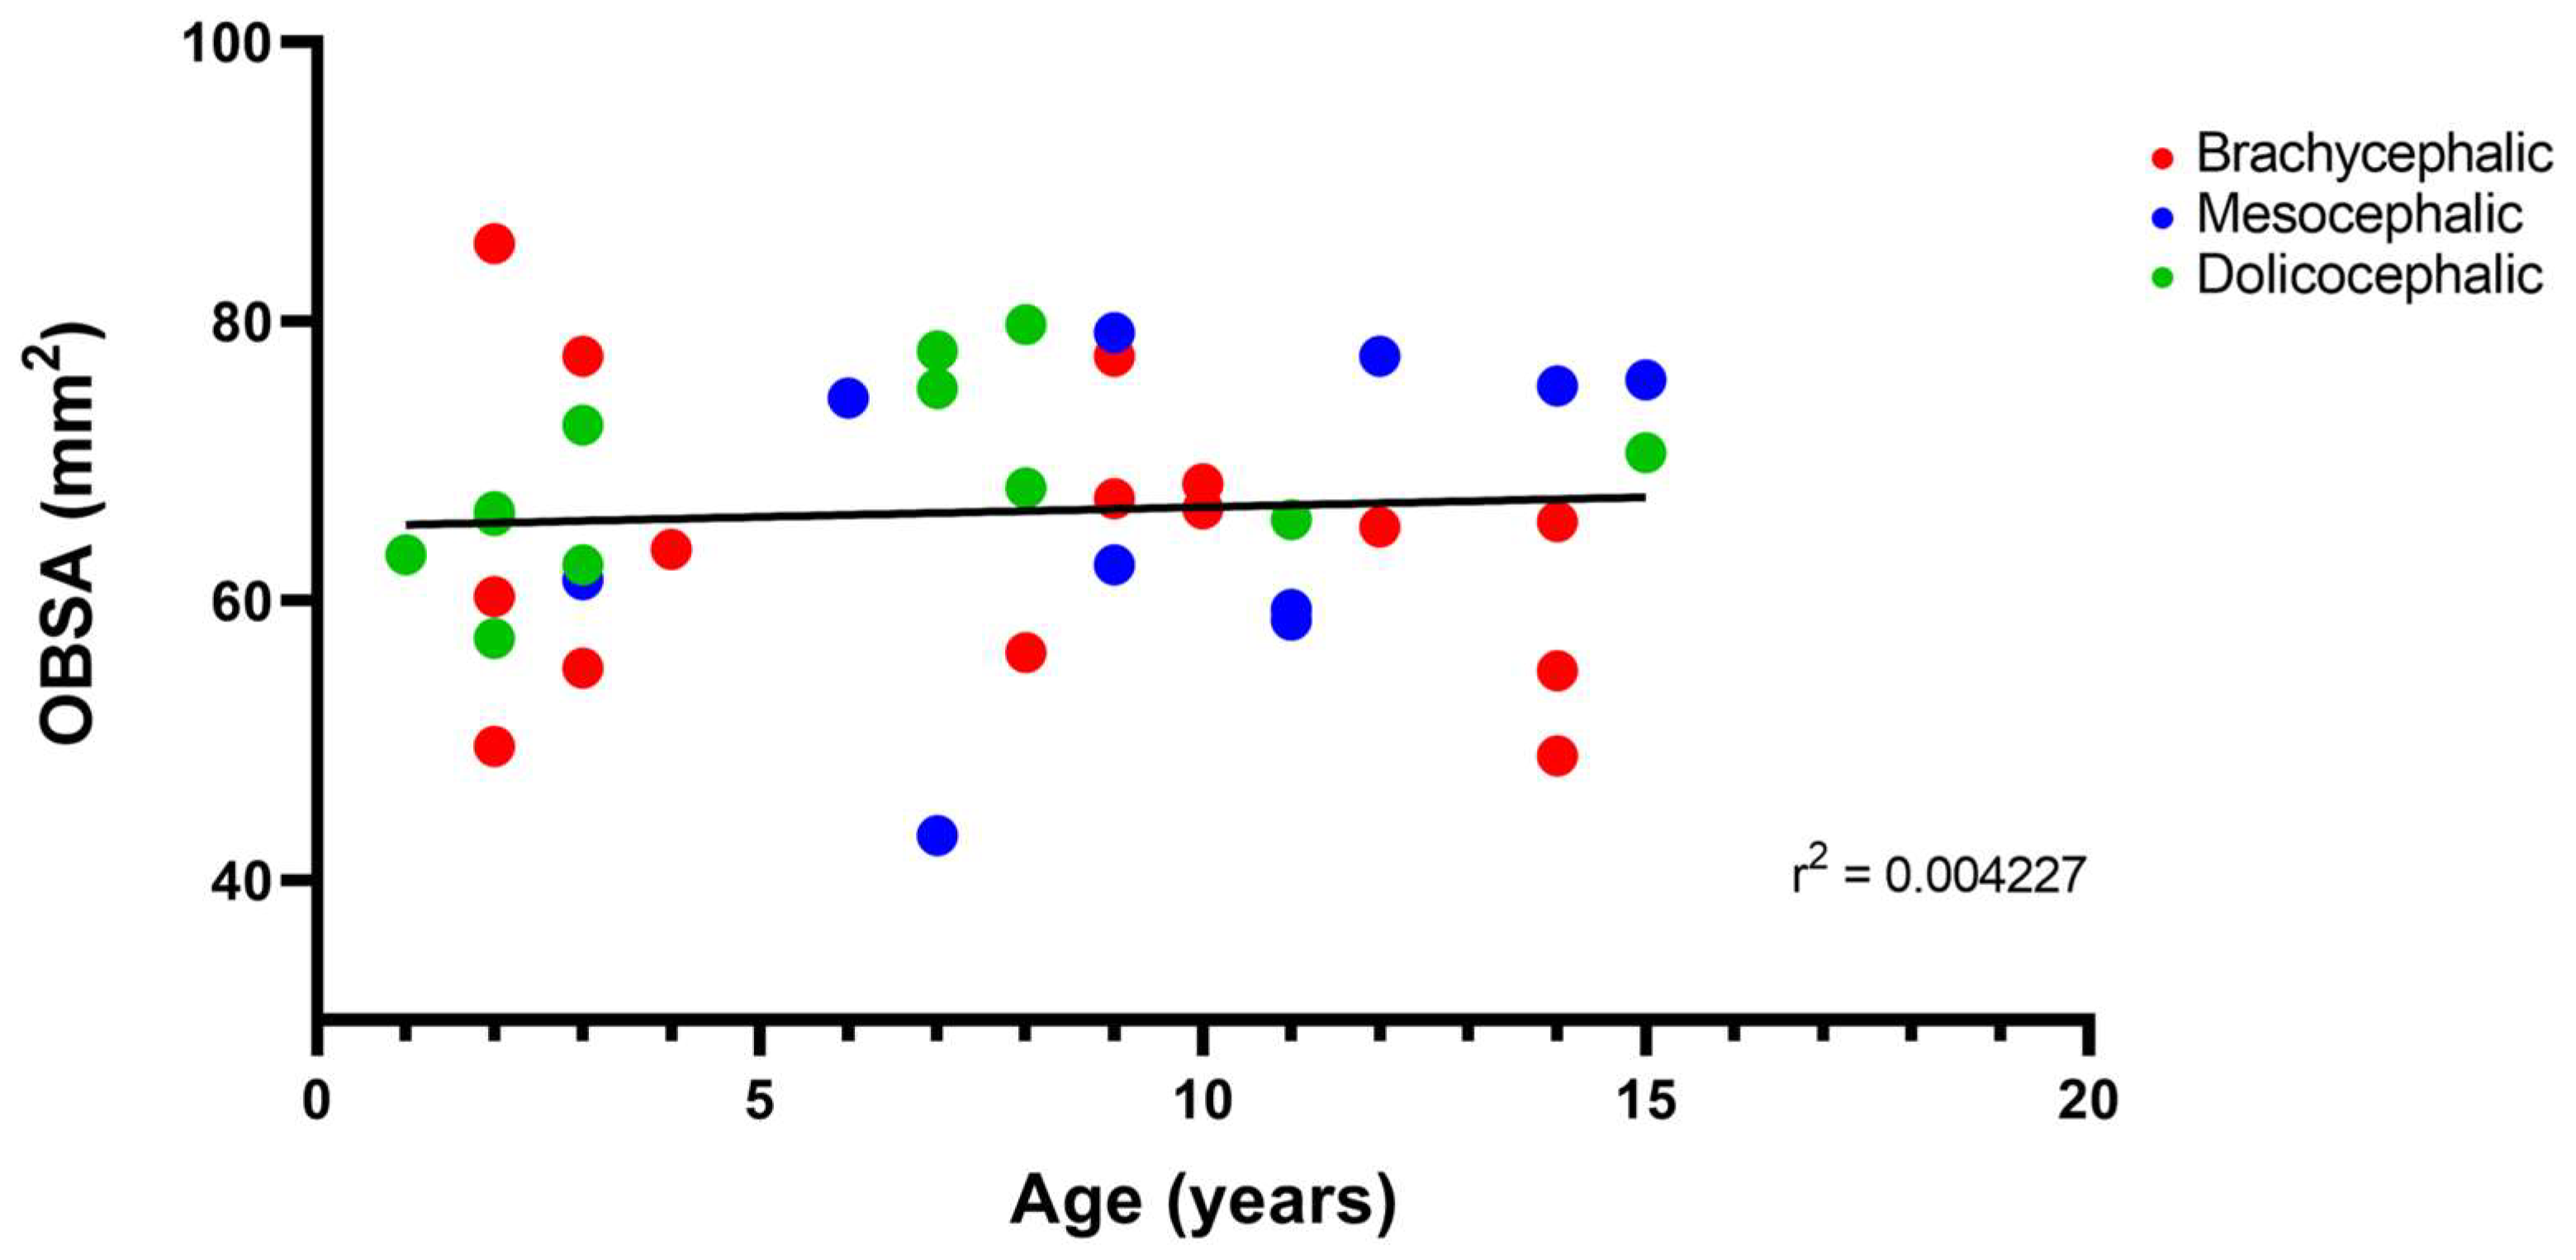
The results of the linear correlation between OBSA and age can be seen in Figure 10, demonstrating an increase in the OB sagittal section area with advancing age, but with a very weak positive correlation between the two variables (r2 = 0.004).
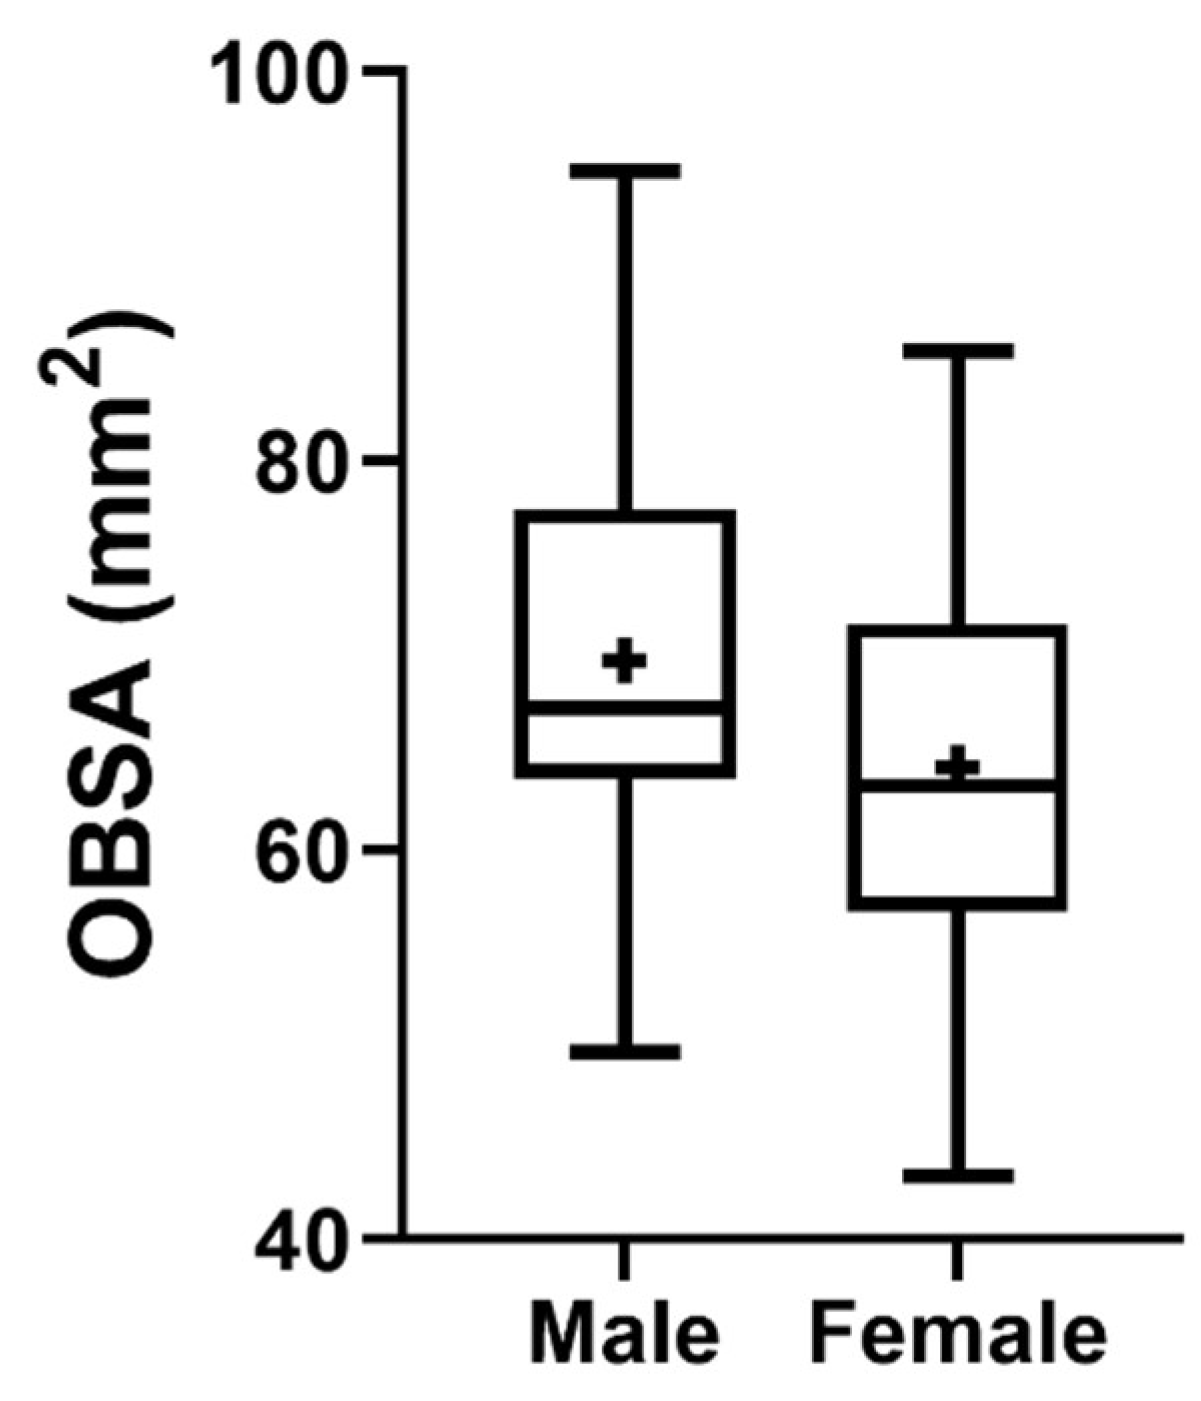
The OBSA results considering the sex of the animals can be seen in Figure 11. The group of females presents a smaller OB compared to the male OB, although no statistical differences are observed between the two groups.
Comprising all the results, it was established that the OB of brachycephalic animals present a smaller OBA, with a ventral orientation and a smaller sagittal cross-sectional area, in opposition to dolichocephalic animals that present larger OBA, tending to be dorsally oriented and a larger sagittal cross-sectional area. Mesocephalic animals occupy an intermediate position. Males present larger OB than females, with an increase in the sagittal cross-sectional area in older animals compared to younger ones. These results effectively demonstrate that, in addition to age and sex, cranial conformation and the consequent cranio-osseous modifications can affect the anatomical arrangement of intracranial central nervous system structures, in this case being able to influence the olfactory acuity of animals and allowing the establishment of morphological and imaging characteristics of the OB related to the cranial conformation in which each breed of cat is inserted.
4. Discussion
In recent years, although to a limited extent, efforts have been made to establish relationships between the morphological and dimensional characteristics of the OB, olfactory acuity and the development of structural or functional changes in the brain or other regions of the head. In humans, this parallelism is beginning to be well established, and it is possible to relate phenomena of bulbar atrophy to the development of neurodegenerative diseases and senility, the occurrence of cranial trauma and the establishment of infectious and metabolic diseases, with the loss of olfactory acuity being a known consequence that is clinically easy to identify [
22,
23,
24,
25]. Similarly, evidence of a positive correlation between OB volumes and olfactory function has also been described [
26].
In companion animals, superior olfactory ability is well established, both in dogs [
27] and cats [
28]. However, not only are studies carried out on cats more limited, but the influence of inter-individual variations depending on the breed, sex or age of animals of both species ends up being little explored. In dogs, imaging studies to characterize the OB allow to create the first relationships between the characteristics of this structure and other elements of the brain and/or head, such as the cranial conformation or the soft palate [
17,
18]. This more in-depth knowledge of the OB [
29] has also allowed to identify relationships between the dimensions and integrity of the OB and the establishment of diseases of different etiologies, such as neurodegenerative [
30] or neoplastic [
31]. Some studies have been carried out in cats to characterize the OB [
32] and its recesses [
33], but these remain limited. To the authors’ knowledge, this is the first study that attempts to characterize the cat’s OB by establishing quantifiable relationships with cranial conformation between brachycephalic, mesocephalic and dolichocephalic cats with intact OBs, creating tools for easier identification of changes in this structure when approached in a sagittal plane. In fact, through this work it was possible to establish a relationship between the cranial conformation of cats and the arrangement, orientation and dimensions of the OB in each group, observing that shorter skulls are associated with compact OBs, with smaller angles established with the brain and with ventral orientations due to the shortening of the nasal cavity and compression of the cribriform plate. An influence of age and sex on OBSA was also observed, with males and older animals presenting larger OB dimensions.
Head conformation refers to the shape and structure of the skull, a definition that can be applied to all species with the necessary adaptations. In companion animals, as a result of the selection processes and planned breed crossings [
28,
29], the evolution of the different categories of cranial conformation took place in a marked way, translating not only into evident differences in anatomy and external morphology, but also influencing the behavior and physiological normality of different systems such as the nervous, digestive, respiratory and ocular in both dogs [
30,
31,
32] and cats [
33]. In the cat, although the division into the same categories is also made, the distinction between these is more difficult and there are no cut-off values as well defined as in the dog [
34]. The dolichocephalic category includes the Siamese and Balinese; the mesocephalic ones include the Maine Coon or British Shorthair; Brachycephalic cats include Persians and Scottish Folds. Within brachycephalic breeds there are still attempts at subdivisions, such as Dool-Face and Peke-Face in the case of Persian cats [
14]. Just like dogs, in cats the brachycephalic breeds are more prone to various medical problems [
16,
33,
35]. Thus, in this study the methodology used by [
16] was adapted to establish the SI limits that allowed the classification of cats as brachycephalic (SI > 80), mesocephalic (SI 75-79) or dolichocephalic (SI < 75).
The results of the OBA determination follow the same trend as that observed in dogs, with brachycephalic animals presenting a lower OBA compared to dolichocephalic and mesocephalic breeds and with a negative correlation between the two variables. However, in dogs the established correlations are stronger than in cats. Even using a different methodology, it is also observed that, as in dogs, cat brachycephalic breeds tend to have a smaller open angle and OB with a ventral orientation compared to the dorsal orientation of dolichocephalic breeds, with a negative correlation established between the two variables. Once again, the correlation is stronger in dogs than in cats. It is important to note that cats have a larger cranial capacity, i.e. the volume of the interior of the cranium occupied by the brain, than dogs [
34,
35], and although classical divisions dependent on cranial conformation can also be established in cats, these variations are not as wide as those observed in dogs [
36]. This may explain why, although in cats the influence of cranial conformation on the position, shape and arrangement of the OB is also observed, there is not such a marked influence as that recorded in dogs. In any case, the use of a larger number of animals in this study could have allowed for more in-depth conclusions.
The OBSA was determined automatically using the polygonal selection tool of the selected software, allowing the determination of the sectional area of the OB in the midsagittal images. Measuring the volume of the OB would be a more accurate comparative method to determine this relationship, but the procedure applied allowed to identify the tendency for animals of brachycephalic breeds to present smaller OBs compared to the remaining ones, although no statistical differences were observed that would allow deeper conclusions. The limited number of morphometric and dimensional studies in [37,38cats [
32] do not allow, currently, to compare results, but it is expected that, as in dogs [
18], the bone changes observed in brachycephalic skulls lead to a shortening of the nasal cavity with compression of the cribriform plate, which becomes flatter, leading to the OBs arranged on it also becoming more compact and less globose, contrary to what is observed in dolichocephalic animals. This compaction leads, in turn, to a smaller sagittal cross-sectional area. Similarly, the comparison of the transectional area of the OB between males and females also demonstrated a smaller OB sectional area in females, without statistical differences, a result that corroborates those observed in humans [
37]. However, it is important to note that this result is not related to a better olfactory acuity in males, since a greater number of active cells in the OB was previously identified in females [
37,
38], this being a better functional indicator than the dimensional issue and attributing to females a greater capacity to retain long-time memory of odors. Likewise, there is evidence that the reproductive status and menstrual cycle of females may also influence olfactory acuity [
39] and, potentially, the OB characteristics, and the reproductive status of the females included in this study was not considered.
Regarding the relationship between OBSA and age, a positive, albeit very weak, correlation was observed between the two variables, with older animals presenting a bigger sectional area than younger ones. This result may be in line with other evidences in animals and humans indicating that cellular activity in the OB and the capacity for long-time memory of odors is greater in adults than in juveniles animals [
38], although OB volume tends to decrease in older adults [
40], particularly in cases of neurodegenerative evolution [
24]. There appears to be a relationship between cognitive maturation and olfactory capacity in both humans and animals [
13,
41], which explains the larger dimensions of the OB in adult cats compared to juvenile ones. However, it is important to note that maturation in animals is much faster than that observed in humans, which makes it more difficult to identify variations and strong correlation in a relatively small population of animals, in which all cats are adults and there will be no major variations in the functional maturity of the OB. Similarly, a greater number of senior c cats would allow a clearer conclusion to be drawn about the changes that occur in the OB in older animals.
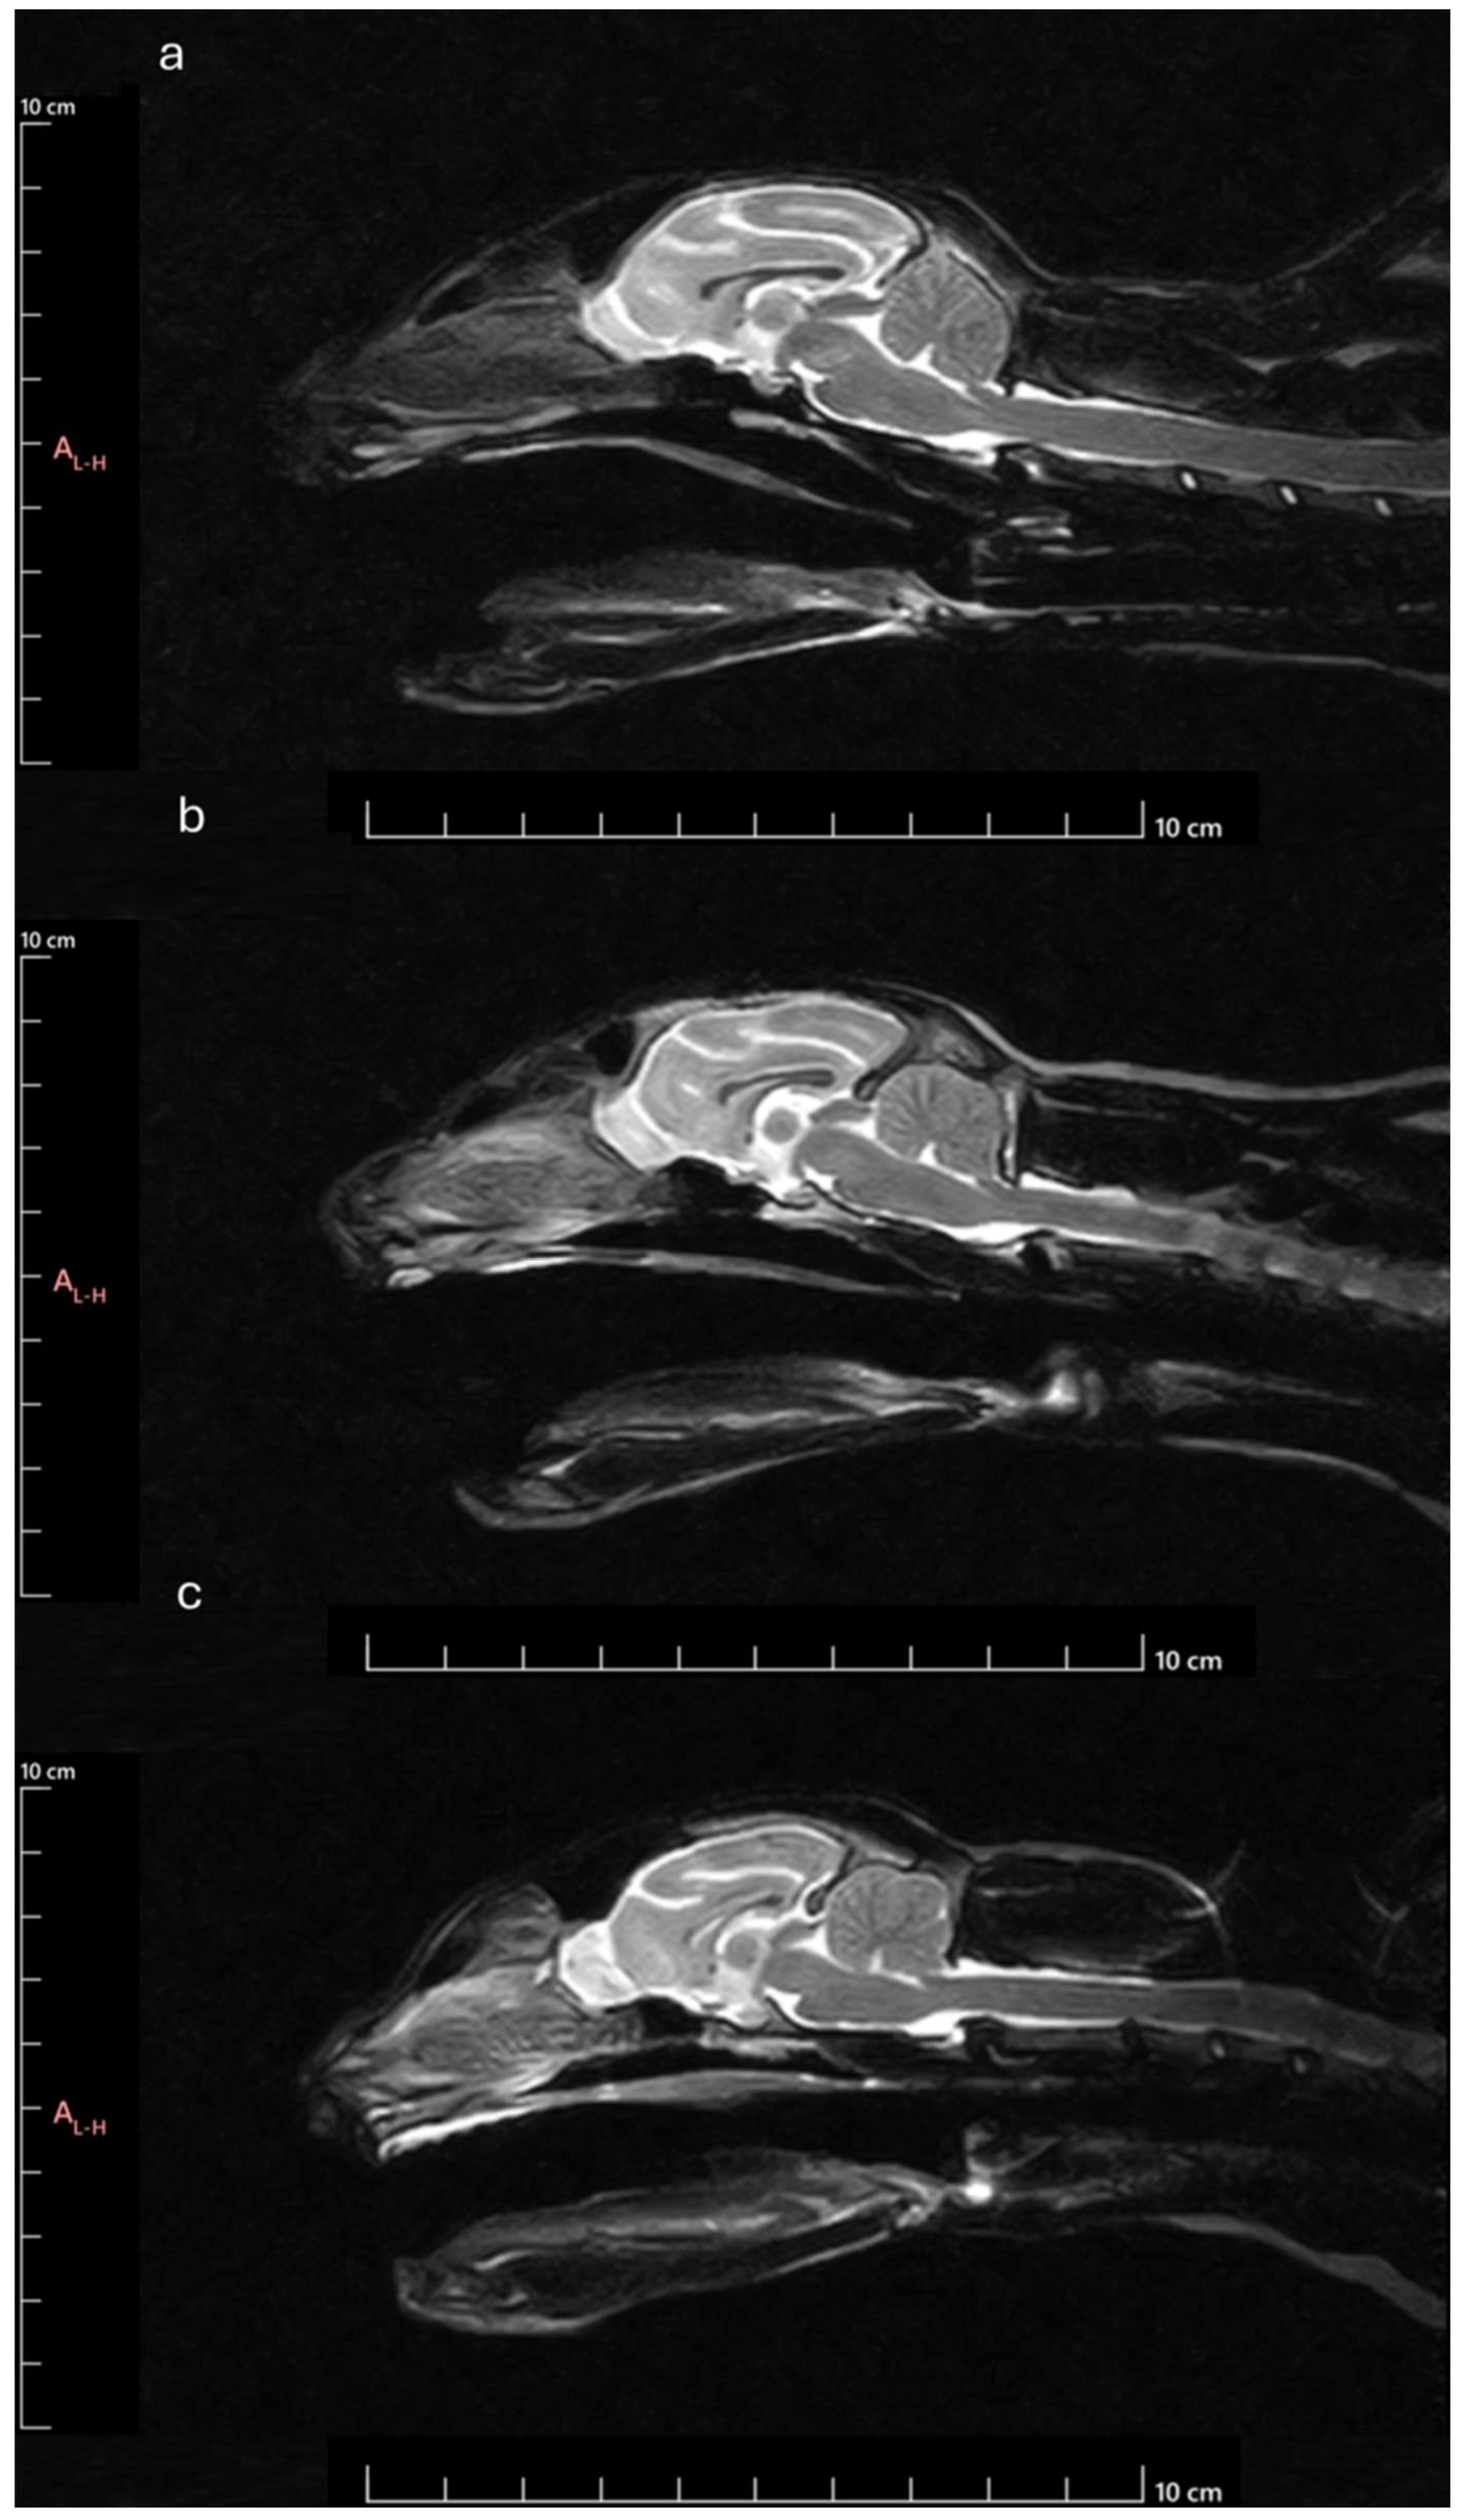
In summary, the results observed in the different variables indicate that brachycephalic cats tend to have smaller OBs, with a ventral orientation and establishing smaller angles with the line that goes from the hard palate to the intercondylar notch of the foramen magnum, in comparison with dolichocephalic and mesocephalic breeds (
Figure 12). These characteristics, shared with dogs, are related to the development of the skeleton of the head, which in these breeds results in a premature closure of certain sutures of the head [
10], leading to a shortened muzzle and rounded head and significant changes such as markedly reduced or absent frontal sinuses, shortening of premaxillary and maxillary bones, aberrant nasal conchae and lower height of the naso-osseal aperture [
19,
42]. Those generally promote narrowing of the nasal and pharyngeal air passages while causing compression of the cribriform plate and reduction and flattening of the ethmoid fossae. Logically, the OB also suffers from this anatomical compression, appearing flattened, with less volume and oriented ventrally. The ventral orientation of the cribriform plate and OB is related to other conformational changes in the brain, such as the ventral orientation of the frontal lobes. Likewise, they are also associated with ventrally oriented ethmoid turbinates that may project into the airways and soft palate–epiglottis overlap, contributing to the complex BOAS patterns in these breeds [
17,
18]. This means that OB characteristics can be used to estimate the level of brachycephaly and the likelihood of developing associated complications in animals subjected to MRI.
This work has some weaknesses that should be considered. The number of animals used is relatively small, and the uneven number of animals included in each cranial conformation group, although resulting from the selection of clinical cases following the inclusion criteria, makes it difficult to draw deeper conclusions and identify statistical differences and more unequivocal correlations. There is also no marked difference in the ages of the animals included in the different groups, which, although allows to identify small differences between young and adult animals, does not allow to draw deeper conclusions regarding senior animals and the possible atrophy of the OB secondary to phenomena of neurodegenerative atrophy. The weight of the animals was not considered, and to adjust for differences in the cranial dimensions measured, standardization relative to the cats' weight could be beneficial. This study was based exclusively on a sagittal plane approach, and did not consider measurements and correlations in the transverse plane that could provide new insights and allow the identification of morphoanatomical compensations related to the cranial conformations in each group. This approach should be considered in future studies. Determining the effective volume of the OB could provide an alternative method to better determine the dimensions of the OB in a complementary way to measuring the sagittal section area. Other elements that may influence the characteristics and cellular activity of the OB, such as the reproductive state of the animals, especially females, were also not explored.
Figure 1.
Cranial measurements necessary to determine the SI: a) SL measurement: distance between the inion and the prosthion; b) SW measurement: distance between the outer margins of the zygomatic arches.
Figure 1.
Cranial measurements necessary to determine the SI: a) SL measurement: distance between the inion and the prosthion; b) SW measurement: distance between the outer margins of the zygomatic arches.
Figure 2.
Methodology for determining the parameters considered: a) OBA: angle formed by the line passing through the olfactory fissure and the line between the hard palate and the intercondylar notch of the foramen magnum; b) OBO: open angle formed by the lines that pass through the olfactory fissure and the most rostral limit of the OB; c) OBSA: automatically determined using the polygonal selection tool.
Figure 3.
Box-and-whisker plots of the OBA determined from T2-weighted MRI reconstructions of the heads of 17 brachycephalic, 9 mesocephalic and 14 dolichocephalic cats included in the study. The OBA was determined between the line passing through the olfactory fissure and the line running from the hard palate to the intercondylar notch of the foramen magnum. In each box, the middle line represents the mean value, and the lower and upper limits represent the 25th and 75th percentile, respectively. The whiskers represent the maximum and minimum values recorded. + represents the mean value. * corresponds to 0.01 ≤ p < 0.05, ** to 0.001 ≤ p < 0.01, *** to 0.0001 ≤ p < 0.001, and **** to p < 0.0001.
Figure 4.
Scatter graphs of values of SI versus OBA determined from T2-weighted MRI reconstructions of 17 brachycephalic, 9 mesocephalic and 14 dolichocephalic cats included in the study. The linear regression line is shown.
Figure 4.
Scatter graphs of values of SI versus OBA determined from T2-weighted MRI reconstructions of 17 brachycephalic, 9 mesocephalic and 14 dolichocephalic cats included in the study. The linear regression line is shown.
Figure 5.
Box-and-whisker plots of the OBO determined from T2-weighted MRI reconstructions of the heads of 17 brachycephalic, 9 mesocephalic and 14 dolichocephalic cats included in the study. The OBO was determined through the open angle formed by the lines that pass through the olfactory fissure and through the most rostral limit of the OB. In each box, the middle line represents the mean value, and the lower and upper limits represent the 25th and 75th percentile, respectively. The whiskers represent the maximum and minimum values recorded. + represents the mean value. * corresponds to 0.01 ≤ p < 0.05, ** to 0.001 ≤ p < 0.01, *** to 0.0001 ≤ p < 0.001, and **** to p < 0.0001.
Figure 6.
Scatter graphs of values of SI versus OBO determined from T2-weighted MRI reconstructions of 17 brachycephalic, 9 mesocephalic and 14 dolichocephalic cats included in the study. The linear regression line is shown.
Figure 6.
Scatter graphs of values of SI versus OBO determined from T2-weighted MRI reconstructions of 17 brachycephalic, 9 mesocephalic and 14 dolichocephalic cats included in the study. The linear regression line is shown.
Figure 7.
Scatter graphs of values of OBA versus OBO determined from T2-weighted MRI reconstructions of 17 brachycephalic, 9 mesocephalic and 14 dolichocephalic cats included in the study. The linear regression line is shown.
Figure 7.
Scatter graphs of values of OBA versus OBO determined from T2-weighted MRI reconstructions of 17 brachycephalic, 9 mesocephalic and 14 dolichocephalic cats included in the study. The linear regression line is shown.
Figure 8.
Box-and-whisker plots of the OBSA determined from T2-weighted MRI reconstructions of the heads of 17 brachycephalic, 9 mesocephalic and 14 dolichocephalic cats included in the study. The OBSA was determined automatically using the polygonal selection tool of the used software. In each box, the middle line represents the mean value, and the lower and upper limits represent the 25th and 75th percentile, respectively. The whiskers represent the maximum and minimum values recorded. + represents the mean value. * corresponds to 0.01 ≤ p < 0.05, ** to 0.001 ≤ p < 0.01, *** to 0.0001 ≤ p < 0.001, and **** to p < 0.0001.
Figure 9.
Scatter graphs of values of SI versus OBSA determined from T2-weighted MRI reconstructions of 17 brachycephalic, 9 mesocephalic and 14 dolichocephalic cats included in the study. The linear regression line is shown.
Figure 9.
Scatter graphs of values of SI versus OBSA determined from T2-weighted MRI reconstructions of 17 brachycephalic, 9 mesocephalic and 14 dolichocephalic cats included in the study. The linear regression line is shown.
Figure 10.
Scatter graphs of values of OBSA versus Age determined from T2-weighted MRI reconstructions of 17 brachycephalic, 9 mesocephalic and 14 dolichocephalic cats included in the study. The linear regression line is shown.
Figure 10.
Scatter graphs of values of OBSA versus Age determined from T2-weighted MRI reconstructions of 17 brachycephalic, 9 mesocephalic and 14 dolichocephalic cats included in the study. The linear regression line is shown.
Figure 11.
Box-and-whisker plots of the OBSA determined from T2-weighted MRI reconstructions of the heads of 17 brachycephalic, 9 mesocephalic and 14 dolichocephalic cats included in the study. The OBSA was determined automatically using the polygonal selection tool of the used software. In each box, the middle line represents the mean value, and the lower and upper limits represent the 25th and 75th percentile, respectively. The whiskers represent the maximum and minimum values recorded. + represents the mean value. * corresponds to 0.01 ≤ p < 0.05, ** to 0.001 ≤ p < 0.01, *** to 0.0001 ≤ p < 0.001, and **** to p < 0.0001.
Figure 12.
MRI Midsagittal T2-weighted images of animals with different head conformations: a) animal classified as brachycephalic – ventral orientated and compressed OB with smaller OBSA, smaller OBA and smaller OBO; b) Animal classified as mesocephalic - OB with intermediate orientation and OBSA, intermediate OBA and intermediate OBO; c) Animal classified as dolichocephalic – dorsally orientated and globose OB with larger OBSA, higher OBA and higher OBO.
Table 1.
Classification of animals included in the study considering their head conformation. SI - skull index; N - number of animals.
Table 1.
Classification of animals included in the study considering their head conformation. SI - skull index; N - number of animals.
| Head Conformation |
SI |
N |
Sex |
| |
|
|
|
|
| Brachycephalic |
> 80 |
17 |
Male |
8 |
| Female |
9 |
| Mesocephalic |
75-79 |
9 |
Male |
6 |
| Female |
3 |
| Dolichocephalic |
< 75 |
14 |
Male |
9 |
| Female |
5 |
Table 2.
Results of measurements of the variables under study, considering the head conformation of the animals used, and respective statistical differences identified. OBA – Olfactory Bulb Angle; OBO – Olfactory Bulb Orientation; OBSA – Olfactory Bulb Sagittal Section Area. * corresponds to 0.01 ≤ p < 0.05, ** to 0.001 ≤ p < 0.01, *** to 0.0001 ≤ p < 0.001, and **** to p < 0.0001. nd – non defined.
| Head啵Conformation |
OBA啵(◦) |
Mesocephalic |
Dolicocephalic |
OBO 啵(◦) |
Mesocephalic |
Dolicocephalic |
OBSA 啵(mm2) |
Mesocephalic |
Dolicocephalic |
|
| Brachycephalic |
64.99 + 1.01 |
nd |
**** |
12.79 + 0.55 |
nd |
** |
63.89 + 2.55 |
nd |
nd |
|
| Mesocephalic |
68.28 + 1.37 |
|
nd |
13.95 + 2.15 |
|
nd |
66.35 + 4.30 |
|
nd |
|
| Dolichocephalic |
73.12 + 1.01 |
|
|
21.18 + 2.15 |
|
|
69.48 + 1.89 |
|
|
|