
Submitted:
12 November 2024
Posted:
14 November 2024
You are already at the latest version
Abstract
Accurate estimation of forest aboveground carbon stock (AGC) is essential for understanding carbon accounting and climate change. In previous studies, the extracted factors such as spectral textures, vegetation indices, and textural features were used to estimate the AGC. However, few studies examined how different factors affect estimation accuracy in detail. Meanwhile, uncertainties in measurement and the fitting of mono-carbon stock model lack calculation. To quantify the various uncertainties in the process of AGC estimation, we used the Random Forest (RF) to establish estimation models based on field plots and Sentinel-1/2 images in Shangri-La. The models included the Band Information Model (BIM), Vegetation Index Model (VIM), Texture Information Model (TIM), Sentinel-2 factor Model (S-2M), and Sentinel-1/2 factor Model (S-1/2M). Then, uncertainties resulted from the plot scale and estimation models were calculated using error equations. Our goal is to analyze the influence of different factors on AGC estimation and to assess the uncertainty of plot scale and estimation models quantitatively. The results showed that: (1) the uncertainty of measurement was 3.02%, while the error of mono-carbon stock model was the main uncertainty at the plot scale, which was 9.09 %; (2) the BIM has the lowest accuracy (R2 = 0.551) and the highest total uncertainty (22.29%); by gradually introducing different factors in the process of modeling, the accuracies improved significantly (VIM: R2 = 0.688, TIM: R2 = 0.715, S-2M: R2 = 0.826) and the total uncertainty decreased to some extent (VIM: 14.12%, TIM: 12.56%, S-2M: 10.79%); (3) the S-1/2M with the introduction of Sentinel-1 Synthetic Aperture Radar (SAR) data has the highest accuracy (R2 = 0.872) and the lowest total uncertainty (8.43%). The uncertainty of spectral features is highest, following by vegetation indices, while textural features have the lowest uncertainty. Uncertainty in the remote sensing-based estimation model remains a significant source of uncertainty compared with the plot scale. Although texture features of SAR data are effective in reducing uncertainty, but uncertainty is lower at the plot scale. The total estimation uncertainty could be reduced by improving the precision of measurement and the fitting of the mono-carbon stock estimation model.
Keywords:
Carbon stock
; remote sensing factors
; plot scale
; SAR data
; uncertainty
1. Introduction
Forest ecosystem plays a vital role in understanding climate change and maintaining carbon balance [1,2,3]. Parameter such as aboveground carbon stock (AGC) measures energy cycling between the organic and inorganic environment. It is also an important indicator for investigating climate change [4,5]. Therefore, accurate estimation of forest AGC is crucial for humans to assess and protect the forest ecosystem [6,7]. However, there are certain uncertainties in estimating AGC at both large and small scales [8]. Ignoring these uncertainties will affect the accurate estimation of forest AGC. Hence, reducing the uncertainty to improve the accuracy in the estimation process has become a significant challenge [9].
The methods for estimating AGC mainly contain the traditional plot survey and remote sensing estimation. Although the plot survey can obtain accurate data, it requires a considerable investment of human and financial resources. Whereas remote sensing-based methods have the characteristics of being fast, low-cost, large-scale, and less destructive. They had been widely used in the estimation of forest aboveground biomass (AGB) and AGC [10,11,12]. Optical remote sensing data have a great advantage in obtaining structural parameters of the forest; their rich spectral information have been widely applied in studies of AGC estimation [13]. However, it is susceptible to the strong influence of canopy thickness, so it is difficult to obtain the vertical structural parameters of the forest and the information it obtains tends to be saturated in areas of high biomass and carbon stock, which has a disadvantage in estimating high AGC [14,15]. Many researchers have found that using only single optical data to estimate forest AGB or AGC has high uncertainty [16,17,18]. Synthetic Aperture Radar (SAR) data has the advantages of longer electromagnetic wavelength, strong penetration ability, and sensitivity to structural attributes [19], so it can overcome the shortcomings of optical data and can obtain valuable information concerning the vertical vegetation canopy. Therefore, combining optical with SAR data to estimate forest AGB and AGC is considered a feasible method [20,21]. For instance, Gesta et al. [22] combined optical and SAR data to estimate AGB and AGC in falcata and to assess the potential for synergy between optical and SAR data in estimating AGB and AGC. Their results showed that the AGB and AGC models generated by combining the two types of data are more robust and accurate than models derived from optical or SAR data. Given the above findings, we combine optical and SAR data to estimate forest AGC in this study. Our goal is to explore the potential of combining different types of data to reduce the uncertainty generated in the estimation process.
Uncertainty is an umbrella term for concepts that include inaccuracy, ambiguity, and inconsistency [23]. It is very common in the process of carbon stock estimation. There are three primary sources of uncertainty in the whole process of AGC estimation: measurement uncertainty, sampling uncertainty, and model uncertainty [24,25]. Shettles et al. [26] regarded model uncertainty as the main source of error, accounting for about 70% of the total uncertainty. Sources of model uncertainty mainly include the uncertainty of input variables [27], improperly setting the model function form [28], residual variability of the model [29], and parameter error of the model [30]. Uncertainty in the input variables mainly refers to the measurement error of variables such as diameter at breast height (DBH) and tree height (H), which is primarily affected by the measurement techniques, equipment, and anthropogenic measurement methods [31]. The incorrect setting of the model form is mainly due to the lack of appropriate test data or modeling techniques [32]. For the residual uncertainty of the model, the standard deviation of residual was used to measure it [33]. However, different results may be produced due to the differences in the study area and data. Compared to the residual uncertainty of the model, the uncertainty caused by the parameter error is relatively small and relates to the number of modeling samples. Current studies focused more on the uncertainty of the model. For example, Eduarda et al. [34] reduced the uncertainty of the biomass model in terms of modeling methods. Huang et al. [35] used the error transfer method to measure the uncertainty of parametric and non-parametric models. Cao et al. [36] combined the random forest and Monte Carlo simulation (RF-MC) to study the effects of models with different types of variables on the accuracy of carbon stock estimation.
In summary, optical and SAR data to measure uncertainties arising from estimation models has been widely used [37]. However, these studies neglected how different factors impact the accuracy and uncertainty of model. Furthermore, few studies have combined optical and SAR data to quantitatively assess the uncertainties generated by two different scales of plot and remote sensing model. To address these research issues, the Pinus densata in Shangri-La was used as the research tree species, Sentinel-1/2 data and field data were used to establish different estimation models. Then, error equations were used to calculate uncertainties of plot scale and remote sensing models. The main objectives of this study were to: (1) investigate the effects of different factors and plot scale on AGC estimation; (2) analyze the primary source of uncertainty at the plot scale; (3) explore the potential of SAR data in reducing uncertainty in the estimation process.
2. Materials and Methods
2.1. Study Area
Shangri-La is located in northwestern Yunnan Province in southwest China, with a total area of 11,613 km² (Figure 1b). It has a large undulating topography, with an elevation difference of 4,042 m (the lowest elevation is 1,503 m) and an average elevation of 3,459 m (Figure 1d). The rainfall time concentrated from June to September, mean annual precipitation is 607 mm and the average annual evaporation is 1643.6 mm [38]. It has four towns and seven villages with a high forest cover of 75%. It is one of the world’s top ten species gene pools [39]. Its main vegetation types are cold-temperate coniferous forest and rubber forest. Pinus densata is one of its dominant tree species (Figure 1c), which covers an area of 1848.18 km2 and accounts for 16.18% of the area of Shangri-La [40].
The methods of this paper are divided into three stages (Figure 2). In the first stage, remote sensing images were processed and remote sensing features were extracted, AGC at each field plot were calculated from the field survey. AGC remote sensing-based estimation models were established in the second stage using the RF method, measurement uncertainty and uncertainty of the mono-carbon stock model at the plot scale were calculated. In the third stage, we used error equations to calculate the remote sensing-based estimation model uncertainty and the total uncertainty at the plot scale. Then, we combined two uncertainties to obtain the total uncertainty of the AGC estimation.
2.2. Data Acquisition and Processing
2.2.1. Field Survey
A total of 60 plots were surveyed in 2019 and 2021. Twenty plots were surveyed in December 2019 and the other forty were surveyed in May 2021. Plot sizes of 10 m x 10 m were considered in this study to ensure correspondence between the field measurement and pixel size in the imagery [41]. Sample points were randomly distributed in pure Pinus densata forest areas; each plot was spaced more than 3 km apart. The field survey mainly recorded DBH and H of pure stand of Pinus densata with DBH of 5 cm or more. The binary lumber volume table was used to calculate the capacity of individual trees in each plot [42]. The AGB of Pinus densata was calculated using the allometric growth equation [43]:
where W is AGB, D is the diameter at breast height, and H is the tree height. Then the carbon stock is calculated as:
where is the AGC of Pinus densata, and is the carbon content coefficient, which is 0.5131 [44]. The field survey data are shown in Table 1.
2.2.2. DEM
The Digital Elevation Model (DEM) used in this study was downloaded from the official website of the United States Geological Survey (USGS) (https://earthexplorer.usgs.gov). It is the Shuttle Radar Topography Mission (SRTM) Version 3 product, with a resolution of 30 m. We resampled it to 10 m using the nearest neighbor method.
2.2.3. Remote Sensing Images and Processing
In this study, we selected two scenes of Sentinel-1 Interferometric Wide Mode (IW) Ground Range Detected (GRD) images acquired in November 2021 with a resolution of 10 m (Table 2). Pre-processing operations such as orbit correction, thermal noise removal, radiometric calibration, speckle filtering, and terrain correction were performed in the SNAP software provided by the European Space Agency (ESA) [45]. Owing to the significant altitude disparities in the study area, we utilized the altitude, slope, and aspect extracted from DEM to correct the image for alleviating the effect of elevation differences on the images [46]. Concerning the influence of the wave propagation path on the images, the alteration in the wave propagation path can be analyzed by extracting terrain information (altitude, slope, and aspect) from DEM; we then used SARscape software to correct this impact through the alteration [47]. Finally, the processed Sentinel-1 images were exported to ENVI format, stitching and cropping operations were performed.
Sentinel-2 is a multispectral imaging satellite that carries a Multispectral Imager (MSI) with 13 spectral bands. The image is unique in that it has three special red-edge bands, making it particularly effective in monitoring vegetation information. We selected six scenes of Sentinel-2 Level-2A (L2A) images in November 2021 (Table 2). It has been atmospherically and orthographically corrected [48]. Then, all 20 m spectral bands were resampled to 10 m using the nearest neighbor method [49]. Finally, the band synthesis, splicing, and cropping were completed in the ENVI software.
2.2.4. Extraction and Selection of Remote Sensing Factors
Remote sensing factors were extracted from the Sentinel-1/2 images after pre-processing through SNAP, SARscape, and ENVI software. Studies have revealed that backscatter coefficients and texture features of SAR were crucial for AGB estimation [50,51]. Hence, we extracted SAR backscatter coefficients (VV, VH) and SAR texture features from Sentinel-1 images. Key parameters such as spectral textures (excluding atmospheric bands B1, B9, and B10), vegetation indices, and texture features were extracted from Sentinel-2 images according to the relevant research [52]. The parameters extracted in this study contained 2 SAR backscatter coefficients, 10 spectral textures, 9 vegetation indices, 16 SAR texture features, and 152 optical texture features, with a total of 189 factors (Table 3). Then, we used the SPSS software to analyze the correlation of remote sensing factors. Finally, high correlation factors were used to construct AGC estimation models. These factors mainly included 3 spectral textures, 4 vegetation indices, 5 optical texture features, and 2 SAR texture features.
2.3. Modeling Method
Random Forest (RF) [53] is an integrated learning model that is widely used in a variety of fields such as classification and nonparametric regression prediction [54]. The implementation of the RF model in this study is based on the “Random Forest Regressor” algorithm provided by the “Scikit-learn” package for the Python language. In this study, different remote sensing-based estimation models were constructed by the RF. The components of each model are BIM: spectral features, VIM: vegetation indices, TIM: optical texture features, S-2M: selected optical remote sensing factors, and S-1/2M: SAR texture features and selected optical factors (Table 4).
2.4. Accuracy Evaluation
70% (42 groups) of the plots were randomly selected for modeling, the remaining 30% (18 groups) were used for validation. Cross-validation was performed in the process of modeling. The evaluation indexes for the accuracy of the estimation model are coefficient of determination (R2), root-mean-square error (RMSE), relative root-mean-square error (rRMSE), and prediction accuracy (P). To ensure that the model results were as objective as possible, each model was fitted ten times in this study to allow the mean values of evaluation indicators to be used for comparison [55]. The formulas are as follows:
where is the observed value, is the predicted value, is the mean of the observed values and represents the plot number.
2.5. The Analysis of Uncertainty at the Plot Scale
2.5.1. The Uncertainty of Measurement
The observed values of diameter at breast height and tree height were denoted as D and H, their errors from the normal distribution were denoted as , and their standard deviation of error were . The observed carbon stock model is , are the independent variable (DBH, H) and denotes the parameter of the model. According to Taylor’s first-order expansion principle, the error of the mono-carbon stock model is:
where is the partial derivative of the function concerning the variable . The variance matrix of prediction error for the model can be expressed as:
where is the covariance matrix of -. If the error between the independent variables is uncorrelated, there is:
For the , there are two types of models: unary model and binary model. The form of used in this article is binary model (), and according to the above equation:
where is the variance of error in DBH, is the variance of error in H, and is the covariance of and . , are the parameters of the mono-carbon stock model. The grouping method [32] was used to calculate : 1) The means of the observed DBH were ranked in ascending order; 2) The observed DBH were grouped on the basis of 10 trees by groups; 3) Calculate the mean value of DBH in each data group as well as the standard deviation between measurements; 4) Measurement error in DBH was calculated by fitting a linear model between standard deviation of measurement error and DBH. The formulas are as follows:
where is the mean value of DBH in each group, is the mean value of the jth sample tree in each group, is the difference between and , is the standard deviation of the difference in each group of data, and the square is in equation (11). is the mean value of in each group. The linear model can be fitted by the relationship between the and the corresponding in each group. The expression is given below:
Since tree height can only be measured by the altimeter, the difference between the measured values and the true values is large in several cases. The average of multiple measurements is still far from the true value [56]. Therefore, the absolute error between the measured value and the true value is used as and the curve is fitted to estimate the error of single tree height. The expression is as follows:
where is the error of tree height, is measured value of tree height, and , , are parameter of the model. can be calculated by and . The can be expressed by the following equation:
where is the covariance of and , is the th measured value of DBH, is mean value of DBH, is the th measured value of , is mean value of , and is dimensionality.
2.5.2. Uncertainty in the Mono-Carbon Stock Model
(1) Residual Uncertainty of the Mono-carbon Stock Model
To calculate the residual uncertainty of the mono-carbon stock model, we used the observed data of Pinus densata carbon stock to fit the mono-carbon stock model. Then the uncertainty caused by residual variation is calculated by the difference between the predicted and observed values. Let the observed value of carbon stock be and the prediction model of carbon stock be , the residual can be expressed by the following equation:
where denotes the difference between the observed and predicted values, is the predicted value of the parameter in the carbon stock model and is the variables of model (DBH, H).
The standard deviation of residual can be used to measure the uncertainty caused by the variation of model residual. It was found that the standard deviation of residual was linearly related to the AGC [33]. Therefore, the standard deviation can be calculated by fitting a linear relationship between the standard deviation and carbon stock. The equation is as follows:
where is the standard deviation of residual, is the fitting parameter. The six-step approach [57] was used to calculate the . The steps include: 1) rank the observed carbon stock values () of the plots in ascending order; 2) calculate the residuals of model (), which are the difference between the observed and predicted values; 3) divide the modeling data into groups of N, with a total of 10 groups; if the last group is less than N, the remaining data is counted in the previous group; 4) calculate the mean values of the predicted carbon stock () and the standard deviation of residual () in each group. The mean value, residual, and standard deviation of residual were calculated as follows:
where denotes the predicted value of carbon stock in the th plot, , denote the residual and the residual mean value of the th plot and denotes the number of samples.
5) fitting the predicted mean value and standard deviation of residual . The relationship can be expressed as:
6) substitute the predicted values of carbon stock into the fitted formula. Calculate the standard deviation of the residuals for each plot. Then, divide them by the sum of the observed carbon stock values to obtain the model residual’s uncertainty.
(2) Parameter Uncertainty of the Mono-carbon Stock Model
The Taylor series first-order expansion was used to measure the uncertainty of model parameter. The carbon stock model is first-order expanded by a Taylor series as follows:
where is the observed value of carbon stock, is the independent variable, is the simulated value of parameter, denotes the true value of parameter, is the partial derivative of model parameter , is the error () of model parameters. can be approximated as:
where denotes the matrix with as , is the transpose matrix of and is the covariance matrix of estimated parameter in the carbon stock equation.
2.5.3. Uncertainty Synthesis
The error in indirect measurement can be expressed by synthesizing each direct measurement error [58]. Therefore, the total error () can be described as:
where denotes the total error, denotes the error of the ith variable. Based on this equation, the total uncertainty () is calculated as:
where denotes the residual uncertainty of the mono-carbon stock model, denotes the uncertainty of model parameters and indicates the measurement uncertainty. The error transfer from the mono-carbon stock model to the plot scale uncertainty () is calculated as follows:
where is the number of sample wood, is the total uncertainty of the mono-carbon stock model for the th plot wood plant in the plot, and is the area of the plot.
2.6. Uncertainty Analysis of Remote Sensing-Based Estimation Models
2.6.1. The Uncertainty of Model Residual
We also used the six-step approach [57] to calculate the residual uncertainty in remote sensing-based estimation models; the detailed steps and formulas are shown in the six-step approach section of Part 2.5.2, Point 1. Finally, the uncertainty of the remote sensing model () can be expressed as:
where is the sum of the standard deviation of the residuals in all plots, and is the sum of the measured AGC.
2.6.2. Total Uncertainty in Carbon Stock Estimation
The total uncertainty () of AGC estimation in Pinus densata was calculated as follows:
where is the uncertainty at the plot scale; is the uncertainty of the remote sensing model.
3. Results and Analysis
3.1. Comparison of Accuracy for Estimation Models
Figure 3-4 show the scatter plots of the prediction accuracy for each model and the distribution of R2 and RMSE values for different models. It showed that the single-band factor directly involved in modeling has the lowest accuracy with R2 of 0.551, RMSE of 23.049 t/ha, and rRMSE of 45.158% (Figure 3a). The prediction accuracies of the models were all improved after we gradually introduced different remote sensing factors during the modeling. Since optical image is prone to light saturation in areas with high biomass and carbon stock, it has a disadvantage in estimating high AGC. Therefore, after introducing Sentinel-1 SAR data based on the S-2M, the model has the highest prediction accuracy with R2 of 0.872, RMSE of 10.821 t/ha, and rRMSE of 21.201%. Sentinel-1 SAR data can overcome shortcomings of the optical data to a certain extent according to the results, which have an important role in improving the estimation accuracy [59]. The above results can be more intuitively shown in Figure 4. R2 of the models gradually increases, and the RMSE gradually decreases with the introduction of different remote sensing factors; the model with joint Sentinel-1 SAR and Sentinel-2 optical data has the largest R2 and the smallest RMSE. This provides some references for improving the accuracy of carbon stock estimation and the rational selection of variables.
3.2. Uncertainty at the Plot Scale
3.2.1. The Uncertainty of Measurement
Scatter plots of measurement error of DBH can be obtained by equations (12) and (14) (Figure 5a). It showed that the measurement error of DBH increases with the increase of DBH, which is basically a linear relationship. The error model of DBH is:, . Then, the true values of DBH were substituted into the fitted model to obtain the error of DBH. For the measurement error of H, we can calculate by fitting a model through the relationship between the H and the measurement error of H. As shown in Figure 5b, similar to the measurement error of DBH, the error of H is also positively correlated with the H and its error form can be expressed as:, . After obtaining the error of H, is calculated according to equation (17), which is 0.70. Finally, the measurement uncertainty is calculated by equation (11). The calculation shows that for the binary carbon stock model, the uncertainty in carbon stock estimation due to measurement error is 3.02%.
3.2.2. Uncertainty in the Mono-Carbon Stock Model
(1) Residual Uncertainty
Figure 6a shows the fit of the binary carbon stock model for Pinus densata, the equation is and the R2 of the model is 0.984. Figure 6b shows the scatter plot of the error equation for the mono-carbon stock model, from which it can be seen that the standard deviation of residual increased with the increase in the predicted value of carbon stock. The error equation of the binary carbon stock model is y=0.0613x-0.369 and R2=0.944, which has an excellent fitting effect. The predicted values of carbon stock were then substituted into the error equation to calculate the total error value. Finally, the residual uncertainty of model was obtained by dividing the total error value into the total observed value of carbon stock, which was 5.96%.
(2) Parameter Uncertainty
For the parameter uncertainty of the binary carbon stock model, we first used Taylor’s first-order expansion to obtain the variance-covariance matrix of parameters. Then, the parameter uncertainty of the model was calculated using the formula. By calculating, we can know that the parameter covariance matrix of the binary carbon stock model is , which substituted into equation (25) to conclude that the parameter uncertainty of binary carbon stock model accounts for about 6.86%. Synthesizing the two uncertainties, the total uncertainty of the binary carbon stock model is 9.09%.
3.2.3. Total Uncertainty at the Plot Scale
The total uncertainty is 9.58% by synthesizing the measurement uncertainty and the uncertainty of the mono-carbon stock model through the equation (27). When the uncertainty of the mono-carbon stock model is superimposed on the plot scale, we used the equation (28) to calculate the uncertainty of the plot scale, which is 3.71%. Table 5 shows the various sources of uncertainty in carbon stock estimation at the plot scale.
3.3. The Uncertainty of Remote Sensing-Based Estimation Models
Figure 7-9 illustrate each model’s error equations, error value of plots and uncertainties. The uncertainties of BIM, VIM, TIM, S-2M, and S-1/2M are 21.98%, 13.63%, 12.01%, 10.14%, and 7.57% by substituting the average values of carbon stock into error equations of each model (Figure 9). Through the Figure 7, the width of the confidence ellipse for each model can reflect the magnitude of the model’s R2 to a certain extent, R2 gradually increases as the ellipse becomes narrower. To more intuitively reflect the difference between the predicted values and the measured values for each model, we compared the observed value and the corresponding predicted value of 60 field sites (Figure 8). BIM, VIM, and TIM have phenomenon of the overestimation of low values and the underestimation of high values and the maximum absolute errors of three models are 61.14 t/ha, 41.847 t/ha, and 36.047 t/ha, which suggests that models modeled using only a single variable have larger error. Then, we filtered the three types of remote sensing factors to establish S-2M. As we can see the error curve of this model is significantly slower compared to the previous three models and its error value is also reduced (Figure 8b), as well as the absolute value of its maximum error is 28.477 t/ha. This indicates that the joint use of different types of remote sensing factors is necessary and makes up for the disadvantage of single-factor modeling, which plays an important role in and reducing uncertainty [60]. However, optical data suffers from light saturation, which impacts the accurate estimation of AGC [61]. Therefore, we added SAR data to S-2M in the following experiments to further explore the potential of SAR data in reducing uncertainty. The trend of the error curve of the model after adding SAR data is further slowed down and its error is also reduced compared with S-2M (Figure 8b); the maximum absolute value of error is 19.808 t/ha and most of the absolute values of error are below 10 t/ha, which indicates that the predicted values are close to the measured values. The comparative analysis of the errors for different models shows that the single-factor model has the largest error, and the joint use of different factors is necessary. SAR data plays an important role in improving estimation accuracy and reducing errors compared to optical data.
3.4. Total Uncertainty in Carbon Stock Estimation
The total uncertainty of AGC estimation for Pinus densata is shown in Table 6. After synthesizing the uncertainties of plot scale and estimation models by equation (30), the total Uncertainty of BIM, VIM, TIM, S-2M, and S-1/2M are 22.29%, 14.12%, 12.56%, 10.79%, and 8.43%. The BIM has the highest uncertainty, while S-1/2M with the introduction of sentinel-1 SAR data has the lowest uncertainty compared with the S-2M. Thus, SAR data have some advantages in reducing the uncertainty of AGC estimation.
4. Discussion
4.1. Analysis of the Uncertainty at the Plot Scale
Although many studies have been conducted on forest carbon stock estimation, there is still a great deal of uncertainty in the current estimation process. In this study, the uncertainty of measurement and residual variation and parameter error of the mono-carbon stock model were calculated by error equations. The uncertainties in the measurement and the mono-carbon stock model were then combined to obtain the uncertainty of plot scale. It was found that the error of the mono-carbon stock model is the most significant source of uncertainty among the uncertainties at the plot scale. Even though the measurement uncertainty is so small that its contribution to the total uncertainty is practically negligible, we identified a small systematic effect that should be considered. This error may have a greater impact if we use different personnel or equipment to collect the field data [62,63,64]. The error of the mono-carbon stock model mainly originated from parameter variation and the residual uncertainty was relatively low, consistent with the results of Huang et al. [35]. However, the parameter error of the model was higher than those of Chen et al. [65] and Wang et al. [66]. The reason is that Chen et al. [65] used 4004 plot trees for modeling, which was much higher than the number of plot trees in this study. When the number of plot trees is large enough, the uncertainty due to the model parameter can converge to zero. Wang et al. [66] used grouping and combined with the Monte Carlo method to measure the errors of unitary and binary biomass models. This method can effectively reduce the variability of parameter covariance matrices. In this paper, we only calculated the parameter uncertainty and residual uncertainty of the binary model; the uncertainty of the unitary carbon stock model needs to be further investigated in the future.
4.2. Influence of Plot Size and Forest Stand Factors on AGC Estimation and Uncertainty
The plot size used in this study is 10 m x 10 m to keep up with the spatial resolution of remote sensing images. Although several studies have shown that uncertainty decreases with the plot size increases [67,68], we need to consider the available space and representative sampling, etc. during the selection of plots. Enough plots were needed to arrange in the limited space to meet the need of the modeling because of the limitation of the study area, which can ensure the representativeness and accuracy of the Pinus densata samples. Even though estimation accuracy and uncertainty can be affected by small-scale plots, we can effectively improve this condition by increasing the number of plots and modeling samples [69]. Secondly, representative sampling is one of the important reasons why we chose small-scale plots. The difference in vegetation density and age structure also affects the estimation of AGC due to the heterogeneity of the distribution of Pinus densata in the study area. Therefore, setting more small-scale plots on this basis gives a better analysis of the factors affecting the accuracy of AGC estimation, thus improving the accuracy and reducing the uncertainty. Canopy density and average age of forest stand factors are also important factors that affect the accuracy and uncertainty of AGC estimation [70]. Previous study has shown that with the gradual increase of stand age, the forest carbon stock also presents a trend of increase [71]. Still, the growth rate decreases slowly with the maturity of the forest stand and tends to balance in the later stage of development [72]. Expect the forest stand age, canopy density is also an important factor affecting the change of AGC and can determine forest structure and vegetation growth to a large extent [73]. An increased canopy opening increased the potential of height growth, thereby increasing the AGC. Therefore, we should consider these two factors to analyze their specific effects on the change and uncertainty of AGC in the subsequent research.
4.3. Uncertainty of Different Remote Sensing Models
In this paper, we constructed different remote sensing models based on Sentinel-1/2 images. Data saturation in optical data is a key issue limiting AGC estimation accuracy, especially in dense forests with high AGB or AGC [74]. The reason is that optical data provide only spectral and horizontal spatial characteristics [75], limiting the effectiveness of spectral reflectance and vegetation indices for estimating high biomass or carbon stock. This is also confirmed by the high uncertainty of BIM and VIM in this study. To alleviate the effect of optical data saturation on the uncertainty of carbon stock estimation, we introduced Sentinel-1 SAR data on the basis of optical data. SAR can better obtain vertical structure parameters of forest vegetation because of its strong penetration ability to forest canopy and sensitivity to water content [76]. Furthermore, the combination of optical and SAR data has been proven to reduce the saturation in AGC estimation [77,78]; the basic principle of fusion is the synergy of spectral and backscattering features. Therefore, the uncertainty of S-1/2M effectively reduced after introducing Sentinel-1 SAR data, which shows that the combined use of optical and SAR data is an effective way to reduce uncertainty in the estimation process.
4.4. Limitations and Future Research
Firstly, since the study area of this paper covers only one county and Pinus densata is a single layer of pure forest [79], this conclusion will be altered if compared with the different types of forest structure, tree species, etc. in other regions. Consequently, the applicability of this study’s method in multi-layered stands or forests of different ages with complex structures needs to be further explored. Secondly, the uncertainty in this paper is only related to the plot scale and remote sensing-based estimation model. Still, during the total process of data collection, processing, model building, and carbon stock estimation, it inevitably generates various sources of error due to the differences in the measurement, data processing and calculation, model building methods and methods of carbon estimation. Therefore, we need to consider the effects of climate, light saturation, topography, error transmission, and the forest carbon cycle on the estimation of carbon stock. Finally, allometric growth equation may lead to uncertainty in the estimation of carbon stock. We attempted to improve the estimation accuracy by using an allometric growth equation for each tree species in the study area. However, some uncertain factors such as tree density, soil texture, and climatic conditions can affect the growth of H and DBH, thereby affecting the calculation of carbon stock. In the future, researchers should consider how precipitation, soil, and climate affect the growth of DBH and H and the calculation of carbon stock. Taking these factors into account will improve the accuracy and reduce the uncertainty in the process of carbon stock estimation.
5. Conclusion
In this study, the random forest was used to establish different remote sensing-based estimation models based on Sentinel-1/2 images and field data. The uncertainties resulted from the plot scale, and different estimation models were calculated using error equations. We then analyzed the impact of uncertainty at different scales on carbon stock estimation. (1) Different remote sensing factors have certain effects on the carbon stock estimation and the uncertainty of the model. In particular, the BIM has the lowest accuracy; the introduction of vegetation and texture factors improves the accuracy of the model, while the S-1/2M combining optical and SAR data has the lowest uncertainty. (2) The error of the mono-carbon stock model is the main uncertainty at the plot scale, which is 9.09 %. The uncertainty at the plot scale is 3.71%, which is lower than the uncertainty of all remote sensing-based estimation models. Therefore, the uncertainty of the estimation model is the primary source of uncertainty in the process of carbon stock estimation compared with the uncertainty at the plot scale. (3) The R2 of S-1/2M combining optical and SAR data was improved by 0.046, and the uncertainty was reduced by 2.36% compared with the S-2M. Adding SAR data to optical data can effectively reduce the uncertainty in the estimation process. This study analyses the effect of different factors on AGC estimation and evaluates the uncertainty of plot scale quantitatively, which provides references for reducing the uncertainty in the process of carbon stock estimation.
Author Contributions
Writing-original draft, software, data curation, investigation, methodology, B.Q.; formal analysis, writing - review & editing, S.L.; methodology, writing - review & editing, J.C.; funding acquisition, project administration, supervision, writing - review & editing, J.Z.; visualization, methodology, formal analysis, writing - review & editing, K.Y.; supervision, resources, writing - review & editing, K.L.; writing - review & editing, K.H.; writing - review & editing, X.J.
Funding
This research was funded by the Forestry Innovation Programs of Southwest Forestry University (Grant No: LXXK-2023Z06), “Young Top Talents” special project of the high-level talent training support program of Yunnan province, China, in 2020 (No. YNWR-QNBJ-2020-164), and the National Natural Science Foundation of China (No. 32260390).
Data Availability Statement
The Sentinel-1/2 data are available through the official website of the United States Geological Survey (USGS) (https://earthexplorer.usgs.gov). Field data presented in this study are available on request from the corresponding author.
Acknowledgments
We would like to thank the editor and anonymous reviewers for their comments, which helped improve the manuscript. We also would like to acknowledge all the others individuals who contributed to this paper.
Conflicts of Interest
The authors declare that they have no known competing financial interests or personal relationships that could have appeared to influence the work reported in this paper.
References
- Ganz, S.; Adler, P.; Kändler, G. Forest cover mapping based on a combination of aerial images and Sentinel-2 satellite data compared to National Forest Inventory data. For. 2020, 11, 1322. [Google Scholar] [CrossRef]
- Cook-Patton, S.C.; Shoch, D.; Ellis, P.W. Dynamic global monitoring needed to use restoration of forest cover as a climate solution. Nat. Clim. Change. 2021, 11, 366–368. [Google Scholar] [CrossRef]
- Zhang, M.; Yang, Z.; Liu, L.; Zhou, D. Impact of renewable energy investment on carbon emissions in China-An empirical study using a nonparametric additive regression model. Sci. Total Environ. 2021, 785, 147109. [Google Scholar] [CrossRef]
- Andoh, J.; Lee, Y. National REDD+ Strategy for Climate Change Mitigation: A Review and Comparison of Developing Countries. Sustainability. 2018, 10, 4781. [Google Scholar] [CrossRef]
- Xie, Y.; Lei, X.; Shi, J. Impacts of climate change on biological rotation of Larix olgensis plantations for timber production and carbon storage in northeast China using the 3-PGmix model. Ecol. Modell. 2020, 435, 109267. [Google Scholar] [CrossRef]
- Wang, J.; Du, H.; Li, X.; Mao, F.; Zhang, M.; Liu, E.; Ji, J.; Kang, F. Remote sensing estimation of bamboo forest aboveground biomass based on geographically weighted regression. Remote Sens. 2021, 13, 2962. [Google Scholar] [CrossRef]
- Nandal, A.; Yadav, S.S.; Rao, A.S.; Meena, R.S.; Lal, R. Advance methodological approaches for carbon stock estimation in forest ecosystems. Environ. Monit. Assess. 2023, 195, 315. [Google Scholar] [CrossRef]
- Cohen, R.; Kaino, J.; Okello, J.A.; Bosire, J.O.; Kairo, J.G.; Huxham, M.; Mencuccini, M. Propagating uncertainty to estimates of above-ground biomass for Kenyan mangroves: A scaling procedure from tree to landscape level. For. Ecol. Manage. 2013, 310, 968–982. [Google Scholar] [CrossRef]
- Gregoire, T.G.; Næsset, E.; McRoberts, R.E.; Ståhl, G.; Andersen, H.E.; Gobakken, T.; Ene, L.; Nelson, R. Statistical rigor in LiDAR-assisted estimation of aboveground forest biomass. Remote Sens. Environ. 2016, 173, 98–108. [Google Scholar] [CrossRef]
- Chen, Q.; Laurin, G.V.; Valentini, R. Uncertainty of remotely sensed aboveground biomass over an African tropical forest: Propagating errors from trees to plots to pixels. Remote Sens. Environ. 2015, 160, 134–143. [Google Scholar] [CrossRef]
- Zharko, V.O.; Bartalev, S.A.; Sidorenkov, V.M. Forest growing stock volume estimation using optical remote sensing over snow-covered ground: a case study for Sentinel-2 data and the Russian Southern Taiga region. Remote Sens. Lett. 2020, 11, 677–686. [Google Scholar] [CrossRef]
- Gülçin, D.; Van Den Bosch, C.C. K. Assessment of above-ground carbon storage by urban trees using LiDAR data: The case of a university campus. For. 2021, 12, 62. [Google Scholar] [CrossRef]
- Lu, C.; Xu, H.; Zhang, J.; Wang, A.; Wu, H.; Bao, R.; Ou, G. A Method for Estimating Forest Aboveground Biomass at the Plot Scale Combining the Horizontal Distribution Model of Biomass and Sampling Technique. For. 2022, 13, 1612. [Google Scholar] [CrossRef]
- Lu, D.; Chen, Q.; Wang, G.; Moran, E.; Batistella, M.; Zhang, M.; Zhang, M.; Saah, D. Aboveground-forest biomass estimation with Landsat and LiDAR data and uncertainty analysis of the estimates. Int. J. For. Res. 2012, 2012, 436537. [Google Scholar] [CrossRef]
- Zhao, P.; Lu, D.; Wang, G.; Wu, C.; Huang, Y.; Yu, S. Examining spectral reflectance saturation in Landsat imagery and corresponding solutions to improve forest aboveground biomass estimation. Remote Sens. 2016, 8, 469. [Google Scholar] [CrossRef]
- Cutler, M.E. J.; Boyd, D.S.; Foody, G.M.; Vetrivel, A. Estimating tropical forest biomass with a combination of SAR image texture and Landsat TM data: An assessment of predictions between regions. ISPRS J. Photogramm. Remote Sens. 2012, 70, 66–77. [Google Scholar] [CrossRef]
- Ojoatre, S.; Zhang, C.; Hussin, Y.A.; Kloosterman, H.E.; Ismail, M.H. Assessing the uncertainty of tree height and aboveground biomass from terrestrial laser scanner and hypsometer using airborne LiDAR data in tropical rainforests. IEEE J. Sel. Top. Appl. Earth Obs. Remote Sens. 2019, 12, 4149–4159. [Google Scholar] [CrossRef]
- Li, L.; Zhou, X.; Chen, L.; Chen, L.; Zhang, Y.; Liu, Y. Estimating urban vegetation biomass from Sentinel-2A image data. For. 2020, 11, 125. [Google Scholar] [CrossRef]
- Yang, X.; Strahler, A.H.; Schaaf, C.B.; Jupp, D.L.; Yao, T.; Zhao, F.; Wang, Z.; Culvenor, D.S.; Newnham, G.J.; Lovell, J.L.; Dubayah, R.O. Three-dimensional forest reconstruction and structural parameter retrievals using a terrestrial full-waveform lidar instrument (Echidna®). Remote Sens. Environ. 2013, 135, 36–51. [Google Scholar] [CrossRef]
- Nuthammachot, N.; Askar, A.; Stratoulias, D.; Wicaksono, P. Combined use of Sentinel-1 and Sentinel-2 data for improving above-ground biomass estimation. Geocarto Int. 2022, 37, 366–376. [Google Scholar] [CrossRef]
- Wang, C.; Zhang, W.; Ji, Y.; Marino, A.; Li, C.; Wang, L.; Zhao, H.; Wang, M. Estimation of Aboveground Biomass for Different Forest Types Using Data from Sentinel-1, Sentinel-2, ALOS PALSAR-2, and GEDI. For. 2024, 15, 215. [Google Scholar] [CrossRef]
- Gesta, J.L. E.; Fernandez, J.M.; Lina, R.S.; Santillan, J.R. Aboveground biomass and carbon stock estimation of falcata through the synergistic use of sentinel-1 and sentinel-2 images. Int. Arch. Photogramm. Remote Sens. Spatial Inf. Sci. 2022. [Google Scholar]
- Shi, W. Principles of modeling uncertainties in spatial data and spatial analyses. CRC press. 2009. [Google Scholar]
- Saarela, S.; Wästlund, A.; Holmström, E.; Mensah, A.A.; Holm, S.; Nilsson, M.; Fridman, J.; Ståhl, G. Mapping aboveground biomass and its prediction uncertainty using LiDAR and field data, accounting for tree-level allometric and LiDAR model errors. For. Ecosyst. 2020, 7, 1–17. [Google Scholar] [CrossRef]
- Qin, L.; Meng, S.; Zhou, G.; Liu, Q.; Xu, Z. Uncertainties in above ground tree biomass estimation. J. For. Res. 2021, 32, 1989–2000. [Google Scholar] [CrossRef]
- Shettles, M.; Hilker, T.; Temesgen, H. Examination of uncertainty in per unit area estimates of aboveground biomass using terrestrial LiDAR and ground data. Can. J. For. Res. 2016, 46, 706–715. [Google Scholar] [CrossRef]
- Kitahara, F.; Mizoue, N.; Yoshida, S. Evaluation of data quality in Japanese national forest inventory. Environ. Monit. Assess. 2009, 159, 331–340. [Google Scholar] [CrossRef]
- Breidenbach, J.; Antón-Fernández, C.; Petersson, H.; McRoberts, R.E.; Astrup, R. Quantifying the model-related variability of biomass stock and change estimates in the Norwegian National Forest Inventory. For. Sci. 2014, 60, 25–33. [Google Scholar] [CrossRef]
- Lessard, V.C.; McRoberts, R.E.; Holdaway, M.R. Diameter growth models using Minnesota forest inventory and analysis data. For. Sci. 2001, 47, 301–310. [Google Scholar] [CrossRef]
- Ståhl, G.; Holm, S.; Gregoire, T.G.; Gobakken, T.; Næsset, E.; Nelson, R. Model-based inference for biomass estimation in a LiDAR sample survey in Hedmark County, Norway. Can. J. For. Res. 2011, 41, 96–107. [Google Scholar] [CrossRef]
- McRoberts, R.E. Estimating variation in field crew estimates of site index. Can. J. For. Res. 1996, 26, 560–565. [Google Scholar] [CrossRef]
- Berger, A.; Gschwantner, T.; McRoberts, R.E.; Schadauer, K. Effects of measurement errors on individual tree stem volume estimates for the Austrian National Forest Inventory. For. Sci. 2014, 60, 14–24. [Google Scholar] [CrossRef]
- Qin, L.H.; Zhang, M.Z.; Zhong, S.H.; Yu, X.H. Model uncertainty analysis in forest biomass estimation. J. Ecol. 2017, 37. [Google Scholar]
- Eduarda, M.O.S.; Fernando, D.E.S.; Michael, A.W.; Fausto, W.A.J.; Mˆonica, C.C. Pre-stratified modelling plus residuals kriging reduces the uncertainty of AGB estimation and spatial distribution in heterogeneous savannas and forest environments. For. Ecol. Manage. 2019, 445, 96–109. [Google Scholar]
- Huang, Y.J.; Zhang, J.L.; Hu, Y.P.; Chen, T. Uncertainty analysis of remote sensing for aboveground biomass estimation of Pinus densata. J. Zhejiang Agric. For. Univ. 2022, 39, 531–539. [Google Scholar]
- Cao, J.; Zhang, J.; Xiao, Q.; Wang, F.; Han, X.; Huang, Y. Above-ground carbon stock estimation and uncertainty analysis of Pinus densata based on random forest and Monte Carlo. For. Sci. Res.
- Urbazaev, M.; Thiel, C.; Cremer, F.; Dubayah, R.; Migliavacca, M.; Reichstein, M.; Schmullius, C. Estimation of forest aboveground biomass and uncertainties by integration of field measurements, airborne LiDAR, and SAR and optical satellite data in Mexico. Carbon Balance Manage. 2018, 13, 1–20. [Google Scholar] [CrossRef]
- Zhang, J.L.; Lu, C.; Xu, H.; Wang, G.X. Estimating aboveground biomass of Pinus densata-dominated forests using Landsat time series and permanent sample plot data. J. For. Res. 1689. [Google Scholar]
- Han, D.; Zhang, J.; Xu, D.; Liao, Y.; Bao, R.; Wang, S.; Chen, S. Improving Pinus densata Carbon Stock Estimations through Remote Sensing in Shangri-La: A Nonlinear Mixed-Effects Model Integrating Soil Thickness and Topographic Variables. For. 2024, 15, 394. [Google Scholar] [CrossRef]
- Chen, C.; He, Y.; Zhang, J.; Xu, D.; Han, D.; Liao, Y.; Teng, C.; Yin, T. Estimation of above-ground biomass for Pinus densata using multi-source time series in Shangri-La considering seasonal effects. For. 2023, 14, 1747. [Google Scholar] [CrossRef]
- David, R.M.; Rosser, N.J.; Donoghue, D.N. Improving above ground biomass estimates of Southern Africa dryland forests by combining Sentinel-1 SAR and Sentinel-2 multispectral imagery. Remote Sens. Environ. 2022, 282, 113232. [Google Scholar] [CrossRef]
- Zheng, S.; Cao, C.; Dang, Y.; Xiang, H.; Zhao, J.; Zhang, Y.; Wang, X.; Guo, H. Retrieval of forest growing stock volume by two different methods using Landsat TM images. Int. J. Remote Sens. 2014, 35, 29–43. [Google Scholar] [CrossRef]
- Sun, X.L. Research on remote sensing estimation model of biomass of alpine pine forest in Shangri-La based on Landsat8-OLI. Master’s Thesis, Southwest Forestry University, Kunming, China. 2016. [Google Scholar]
- Fang, J.; Chen, A.; Peng, C.; Zhao, S.; Ci, L. Changes in forest biomass carbon storage in China between 1949 and 1998. Sci. 2001, 292, 2320–2322. [Google Scholar] [CrossRef]
- Prakash, A.J.; Behera, M.D.; Ghosh, S.M.; Das, A.; Mishra, D.R. A new synergistic approach for Sentinel-1 and PALSAR-2 in a machine learning framework to predict aboveground biomass of a dense mangrove forest. Ecol. Inf. 2022, 72, 101900. [Google Scholar] [CrossRef]
- Huang, Z.; Tian, Y.; Zhang, Q.; Huang, Y.; Liu, R.; Huang, H.; Zhou, G.; Wang, J.; Tao, J.; Yang, Y.; Liu, H. Estimating mangrove above-ground biomass at Maowei Sea, Beibu Gulf of China using machine learning algorithm with Sentinel-1 and Sentinel-2 data. Geocarto Int. 2022, 37, 15778–15805. [Google Scholar] [CrossRef]
- Imperatore, P.; Azar, R.; Calo, F.; Stroppiana, D.; Brivio, P.A.; Lanari, R.; Pepe, A. Effect of the vegetation fire on backscattering: an investigation based on Sentinel-1 observations. IEEE J. Sel. Top. Appl. Earth Obs. Remote Sens. 2017, 10, 4478–4492. [Google Scholar] [CrossRef]
- Puliti, S.; Breidenbach, J.; Schumacher, J.; Hauglin, M.; Klingenberg, T.F.; Astrup, R. Above-ground biomass change estimation using national forest inventory data with Sentinel-2 and Landsat. Remote Sens. Environ. 2021, 265, 112644. [Google Scholar] [CrossRef]
- Naik, P.; Dalponte, M.; Bruzzone, L. Generative feature extraction from sentinel 1 and 2 data for prediction of forest aboveground biomass in the Italian Alps. IEEE J. Sel. Top. Appl. Earth Obs. Remote Sens. 2022, 15, 4755–4771. [Google Scholar] [CrossRef]
- Forkuor, G.; Zoungrana, J.B. B.; Dimobe, K.; Ouattara, B.; Vadrevu, K.P.; Tondoh, J.E. Above-ground biomass map** in West African dryland forest using Sentinel-1 and 2 datasets-A case study. Remote Sens. Environ. 2020, 236, 111496. [Google Scholar] [CrossRef]
- Zhao, Y.; Mao, D.; Zhang, D.; Wang, Z.; Du, B.; Yan, H.; Qiu, Z.; Feng, K.; Wang, J.; Jia, M. Mapping phragmites Australis aboveground biomass in the momoge wetland ramsar site based on Sentinel-1/2 images. Remote Sens. 2022, 14, 694. [Google Scholar] [CrossRef]
- Pan, L.; Sun, Y.; Wang, Y.; Chen, L.; Cao, Y. Estimation of aboveground biomass in a Chinese fir (Cunninghamia lanceolata) forest combining data of Sentinel⁃ 1 and Sentinel⁃ 2. J. Nanjing For. Univ. 2020, 44, 149. [Google Scholar]
- Breiman, L. Random forests. Mach. Learn. 2001, 45, 5–32. [Google Scholar] [CrossRef]
- Svetnik, V.; Liaw, A.; Tong, C.; Culberson, J.C.; Sheridan, R.P.; Feuston, B.P. Random forest: a classification and regression tool for compound classification and QSAR modeling. J. Chem. Inf. Comput. Sci. 2003, 43, 1947–1958. [Google Scholar] [CrossRef]
- Liao, Y.; Zhang, J.; Bao, R.; Xu, D.; Han, D. Modelling the Dynamics of Carbon Storages for Pinus densata Using Landsat Images in Shangri-La Considering Topographic Factors. Remote Sens. 2022, 14, 6244. [Google Scholar] [CrossRef]
- Qin, L.H. Study on the uncertainty of forest carbon stock estimation in Zhejiang Province. Master’s Thesis, Zhejiang Agriculture and Forestry University, Hangzhou, China. 2017. [Google Scholar]
- Hosmer Jr, D.W.; Lemeshow, S.; Sturdivant, R.X. Applied logistic regression (Vol. 398). John Wiley & Sons. 2013.
- Zeger, S.L.; Thomas, D.; Dominici, F.; Samet, J.M.; Schwartz, J.; Dockery, D.; Cohen, A. Exposure measurement error in time-series studies of air pollution: concepts and consequences. Environ. Health Perspect. 2000, 108, 419–426. [Google Scholar] [CrossRef] [PubMed]
- Kitahara, F.; Mizoue, N.; Yoshida, S. Evaluation of data quality in Japanese national forest inventory. Environ. Monit. Assess. 2009, 159, 331–340. [Google Scholar] [CrossRef] [PubMed]
- Wang, J.; Xiao, X.; Bajgain, R.; Starks, P.; Steiner, J.; Doughty, R.B.; Chang, Q. Estimating leaf area index and aboveground biomass of grazing pastures using Sentinel-1, Sentinel-2 and Landsat images. ISPRS J. Photogramm. Remote Sens. 2019, 154, 189–201. [Google Scholar] [CrossRef]
- Safari, A.; Sohrabi, H.; Powell, S.; Shataee, S. A comparative assessment of multi-temporal Landsat 8 and machine learning algorithms for estimating aboveground carbon stock in coppice oak forests. Int. J. Remote Sens. 2017, 38, 6407–6432. [Google Scholar] [CrossRef]
- Chave, J.; Condit, R.; Aguilar, S.; Hernandez, A.; Lao, S.; Perez, R. Error propagation and scaling for tropical forest biomass estimates. Philosophical Transactions of the Royal Society of London. Series B: Biological Sciences. 2004, 359, 409–420. [Google Scholar] [CrossRef]
- Djomo, A.N.; Knohl, A.; Gravenhorst, G. Estimations of total ecosystem carbon pools distribution and carbon biomass current annual increment of a moist tropical forest. For. Ecol. Manage. 2011, 261, 1448–1459. [Google Scholar] [CrossRef]
- Butt, N.; Slade, E.; Thompson, J.; Malhi, Y.; Riutta, T. Quantifying the sampling error in tree census measurements by volunteers and its effect on carbon stock estimates. Ecol. Appl. 2013, 23, 936–943. [Google Scholar] [CrossRef]
- Chen, Q.; Laurin, G.V.; Valentini, R. Uncertainty of remotely sensed aboveground biomass over an African tropical forest: Propagating errors from trees to plots to pixels. Remote Sens. Environ. 2015, 160, 134–143. [Google Scholar] [CrossRef]
- Wang, K.R.; Shu, Q.T.; Zhao, H.Y.; Tan, D.H.; Yuan, Z.J. Modeling uncertainty of single-timber aboveground biomass of Pinus densata. J. Southwest. For. Univ. (Nat. Sci.).
- Frazer, G.W.; Magnussen, S.; Wulder, M.A.; Niemann, K.O. Simulated impact of sample plot size and co-registration error on the accuracy and uncertainty of LiDAR-derived estimates of forest stand biomass. Remote Sens. Environ. 2011, 115, 636–649. [Google Scholar] [CrossRef]
- Mayamanikandan, T.; Reddy, S.; Fararoda, R.; Thumaty, K.C.; Praveen, M.S. S.; Rajashekar, G.; Jha, C.S.; Das, I.C.; Gummapu, J. Quantifying the influence of plot-level uncertainty in above ground biomass up scaling using remote sensing data in central Indian dry deciduous forest. Geocarto Int. 2022, 37, 3489–3503. [Google Scholar] [CrossRef]
- Petersson, H.; Breidenbach, J.; Ellison, D.; Holm, S.; Muszta, A.; Lundblad, M.; Ståhl, G.R. Assessing uncertainty: sample size trade-offs in the development and application of carbon stock models. For. Sci. 2017, 63, 402–412. [Google Scholar] [CrossRef]
- Xu, L.; Shi, Y.; Fang, H.; Zhou, G.; Xu, X.; Zhou, Y.; Tao, J.; Ji, B.; Xu, J.; Li, C.; Chen, L. Vegetation carbon stocks driven by canopy density and forest age in subtropical forest ecosystems. Sci. Total Environ. 2018, 631, 619–626. [Google Scholar] [CrossRef] [PubMed]
- Mensah, S.; Salako, V.K.; Seifert, T. Structural complexity and large-sized trees explain shifting species richness and carbon relationship across vegetation types. Funct. Ecol. 2020, 34, 1731–1745. [Google Scholar] [CrossRef]
- Yang, Y.; Luo, Y.; Finzi, A.C. Carbon and nitrogen dynamics during forest stand development: a global synthesis. New Phytol. 2011, 190, 977–989. [Google Scholar] [CrossRef]
- Jucker, T.; Bouriaud, O.; Coomes, D.A. Crown plasticity enables trees to optimize canopy packing in mixed-species forests. Funct. Ecol. 2015, 29, 1078–1086. [Google Scholar] [CrossRef]
- Mngadi, M.; Odindi, J.; Mutanga, O. The utility of sentinel-2 spectral data in quantifying above-ground carbon stock in an urban reforested landscape. Remote Sens. 2021, 13, 4281. [Google Scholar] [CrossRef]
- Lu, D.; Chen, Q.; Wang, G.; Liu, L.; Li, G.; Moran, E. A survey of remote sensing-based aboveground biomass estimation methods in forest ecosystems. Int. J. Digital Earth. 2016, 9, 63–105. [Google Scholar] [CrossRef]
- Baghdadi, N.; Le Maire, G.; Bailly, J.S.; Osé, K.; Nouvellon, Y.; Zribi, M.; Hakamada, R. Evaluation of ALOS/PALSAR L-band data for the estimation of Eucalyptus plantations aboveground biomass in Brazil. IEEE J. Sel. Top. Appl. Earth Obs. Remote Sens. 2014, 8, 3802–3811. [Google Scholar] [CrossRef]
- Stratoulias, D.; Nuthammachot, N.; Suepa, T.; Phoungthong, K. Assessing the spectral information of Sentinel-1 and Sentinel-2 Satellites for above-ground biomass retrieval of a tropical forest. ISPRS Int. J. Geo-Inf. 2022, 11, 199. [Google Scholar] [CrossRef]
- Zhang, L.; Zhang, X.; Shao, Z.; Jiang, W.; Gao, H. Integrating Sentinel-1 and 2 with LiDAR data to estimate aboveground biomass of subtropical forests in northeast Guangdong, China. Int. J. Digital Earth. 2023, 16, 158–182. [Google Scholar] [CrossRef]
- Wang, B.; MAO, J.F.; Gao, J.I. E.; Zhao, W.E. I.; WANG, X.R. Colonization of the Tibetan Plateau by the homoploid hybrid pine Pinus densata. Mol. Ecol. 2011, 20, 3796–3811. [Google Scholar] [CrossRef]
Figure 1.
(a) Location of Yunnan Province in China; (b) location of Shangri-La in Yunnan Province (c) distribution of Pinus densata and field plots; (d) elevation.
Figure 1.
(a) Location of Yunnan Province in China; (b) location of Shangri-La in Yunnan Province (c) distribution of Pinus densata and field plots; (d) elevation.
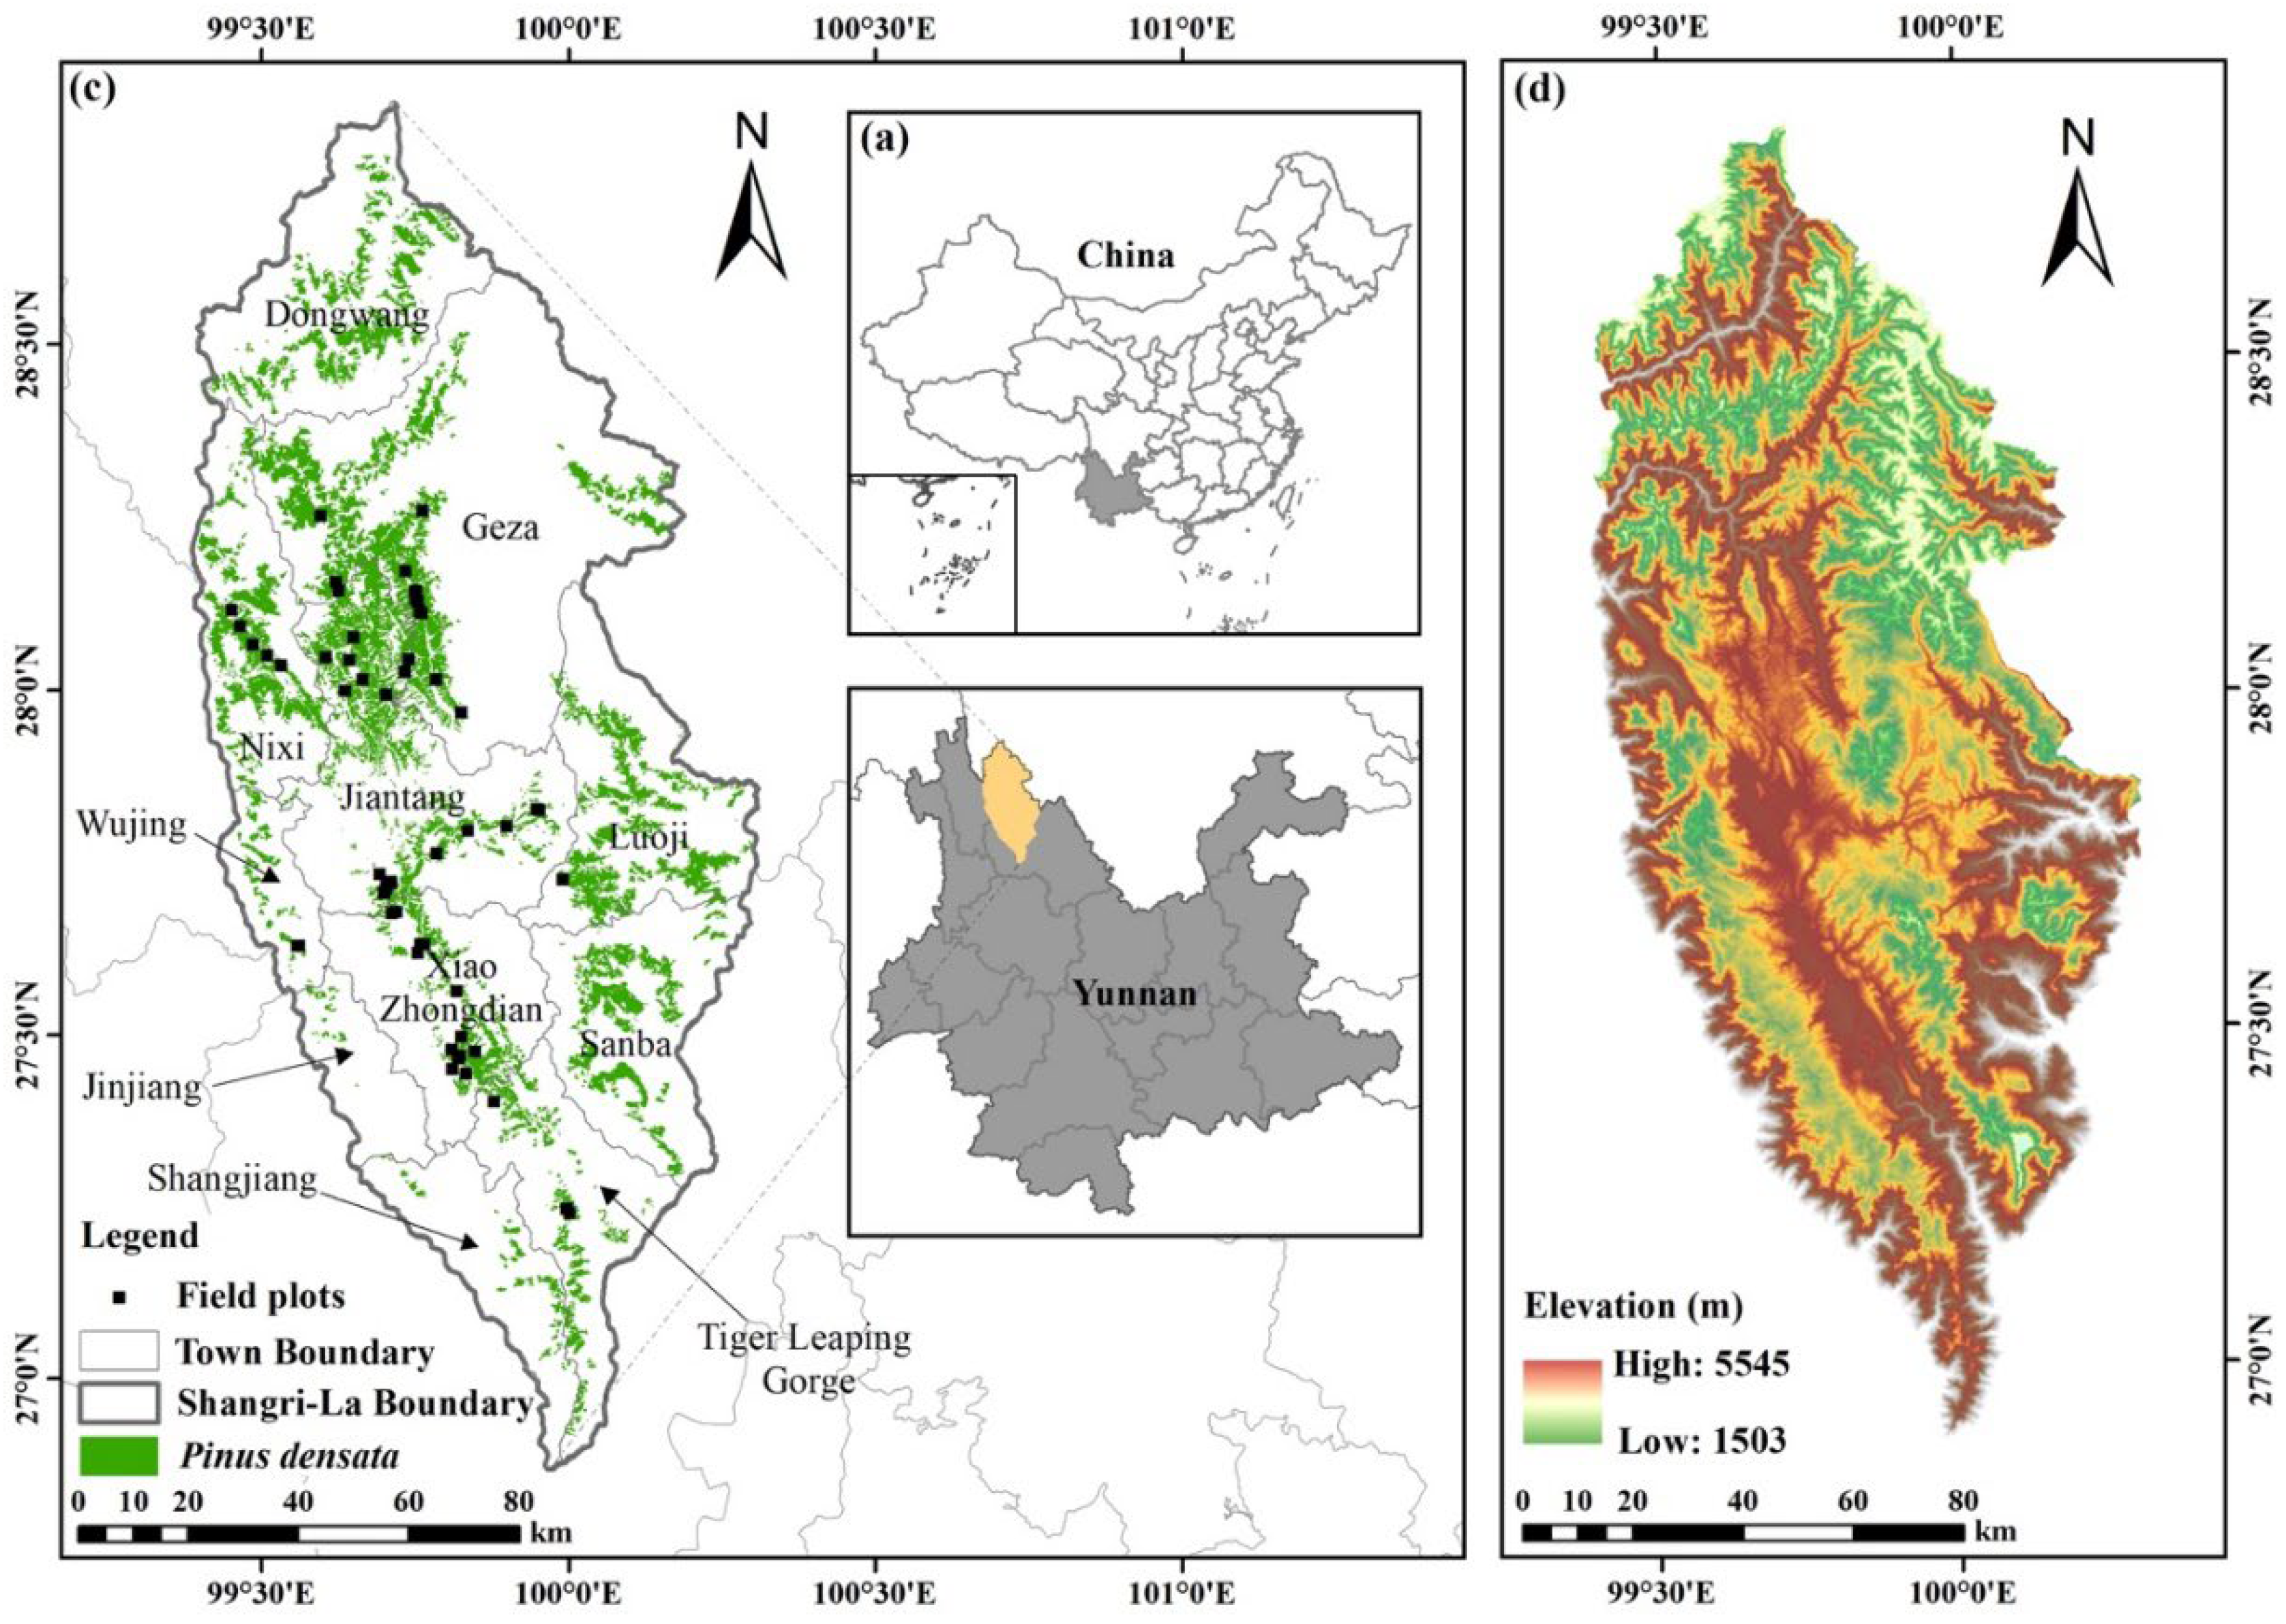
Figure 2.
Overview of methodological approach.
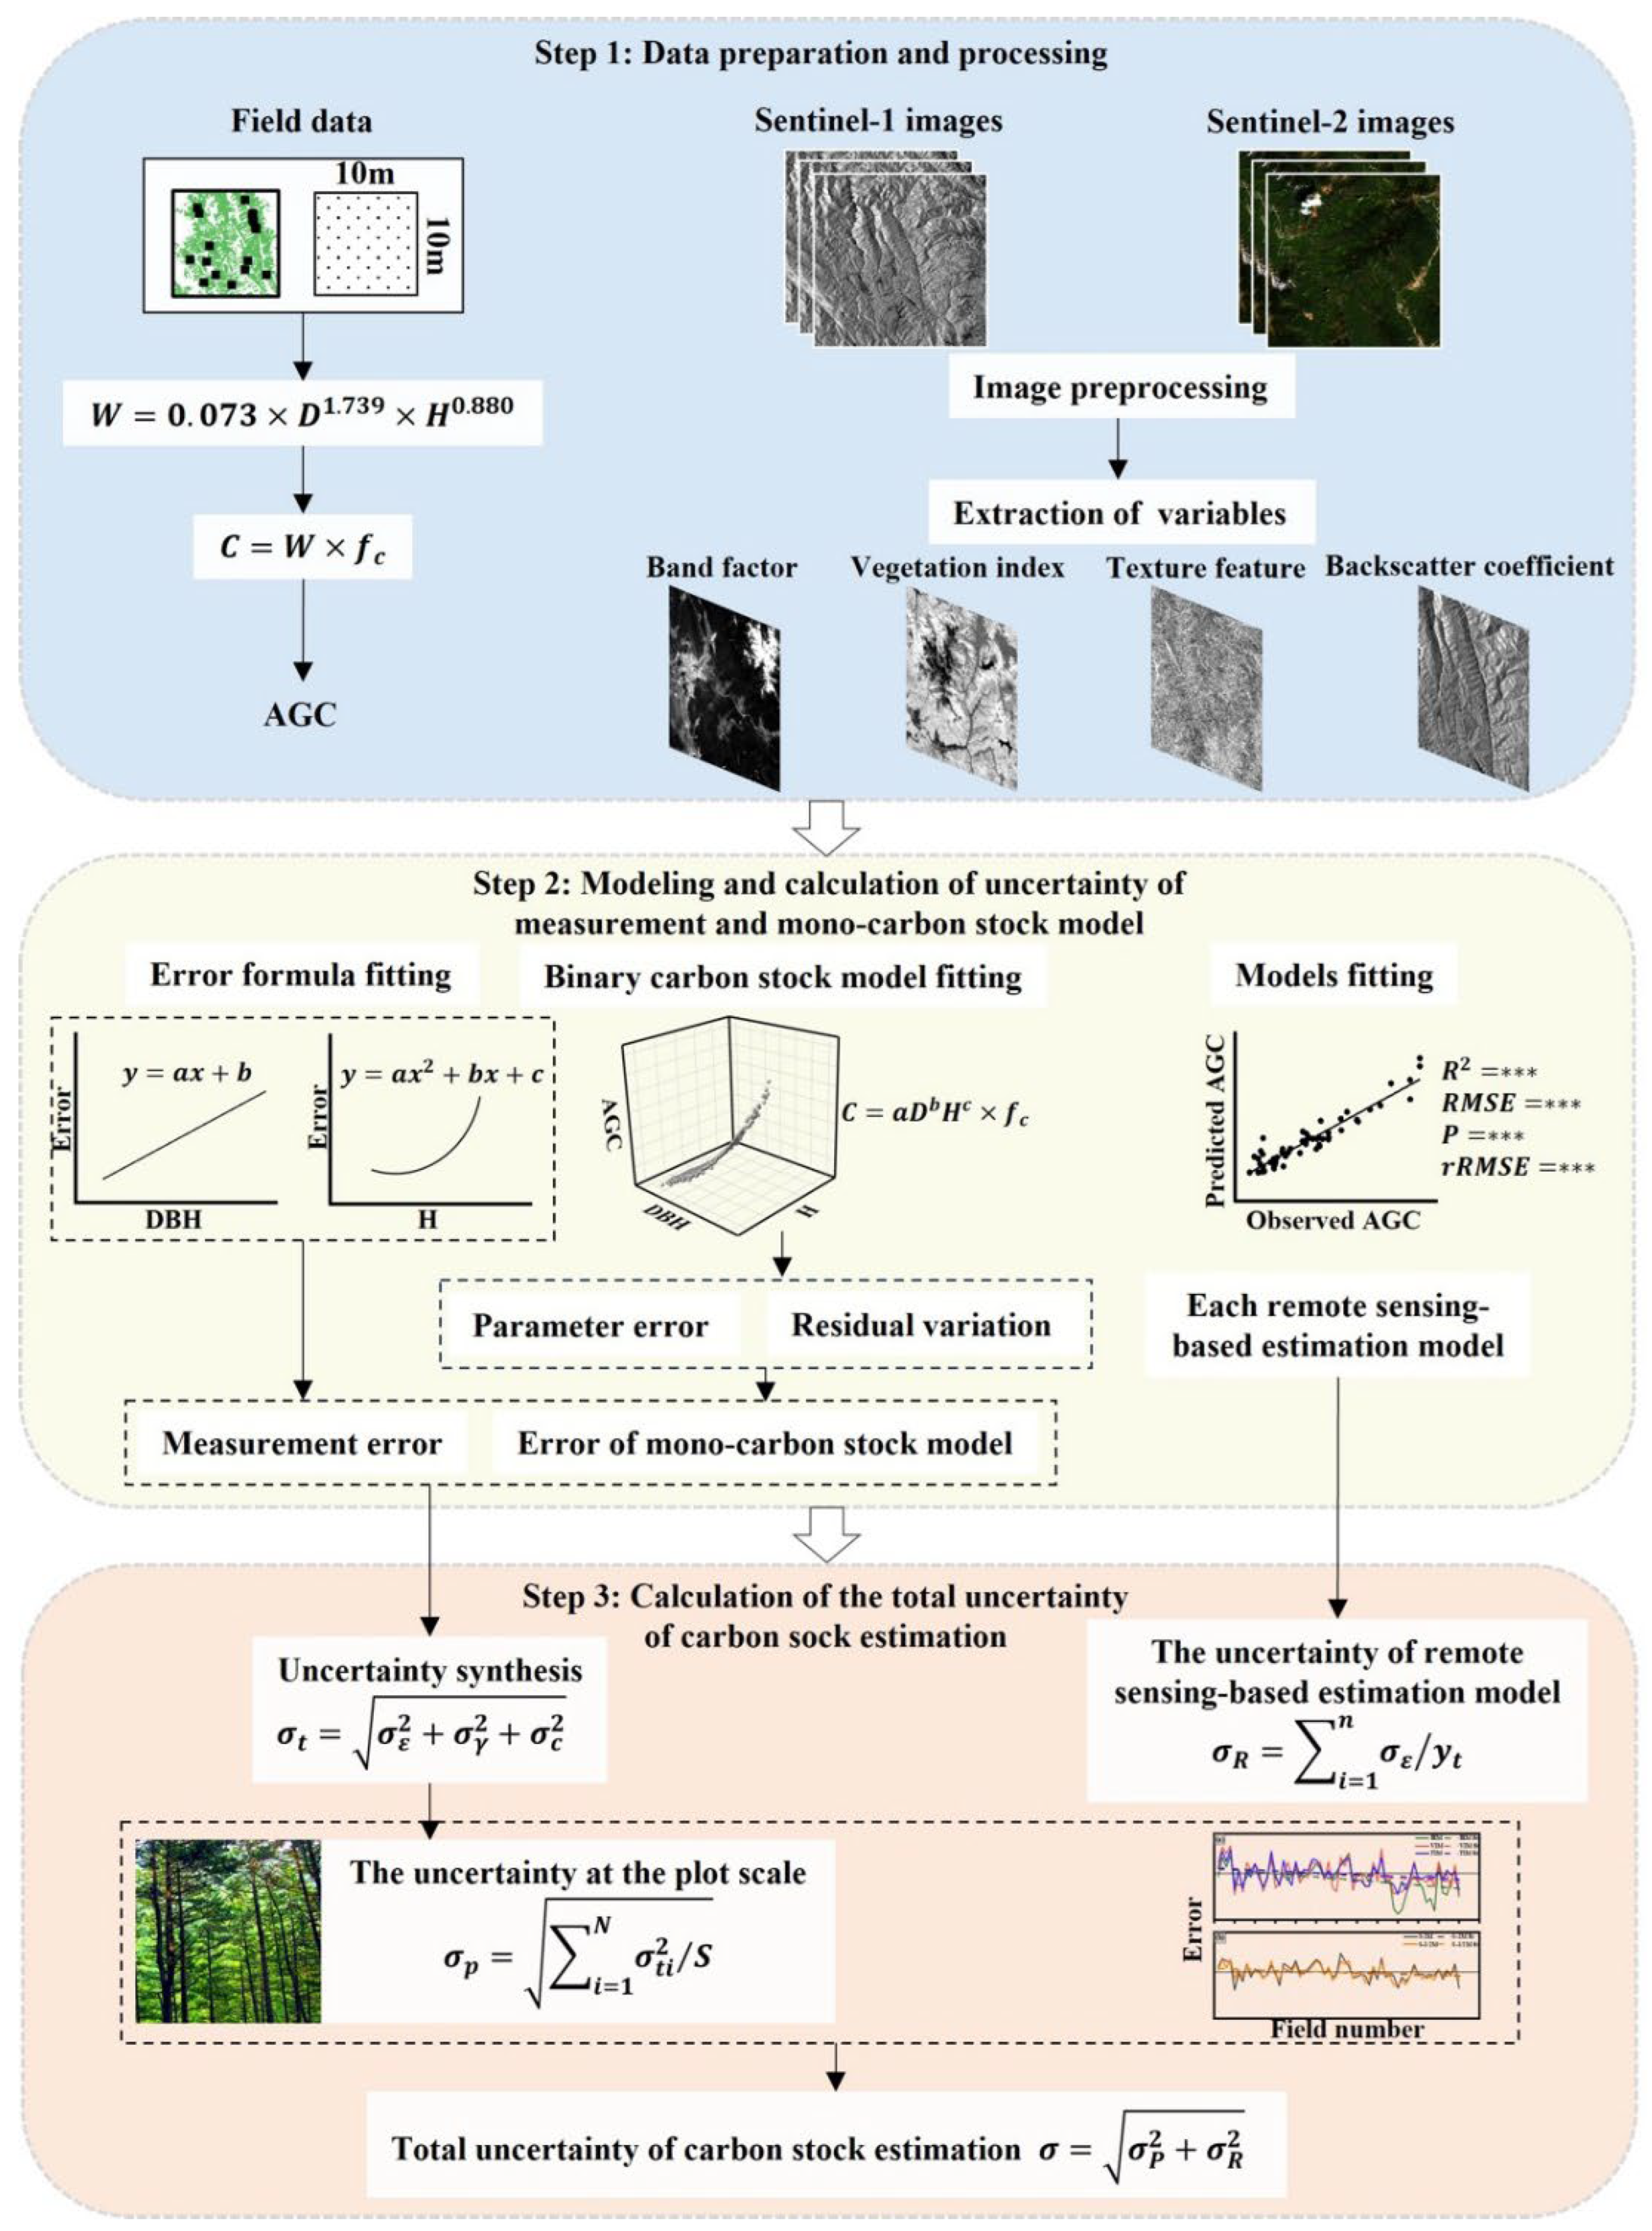
Figure 3.
(a) Scatterplot based on the band information for modeling; (b) scatterplot based on the vegetation index for modeling; (c) scatterplot based on the texture information for modeling; (d) scatterplot based on the sentinel-2 factor for modeling; (e) scatterplot based on the sentinel-1/2 factor for modeling.
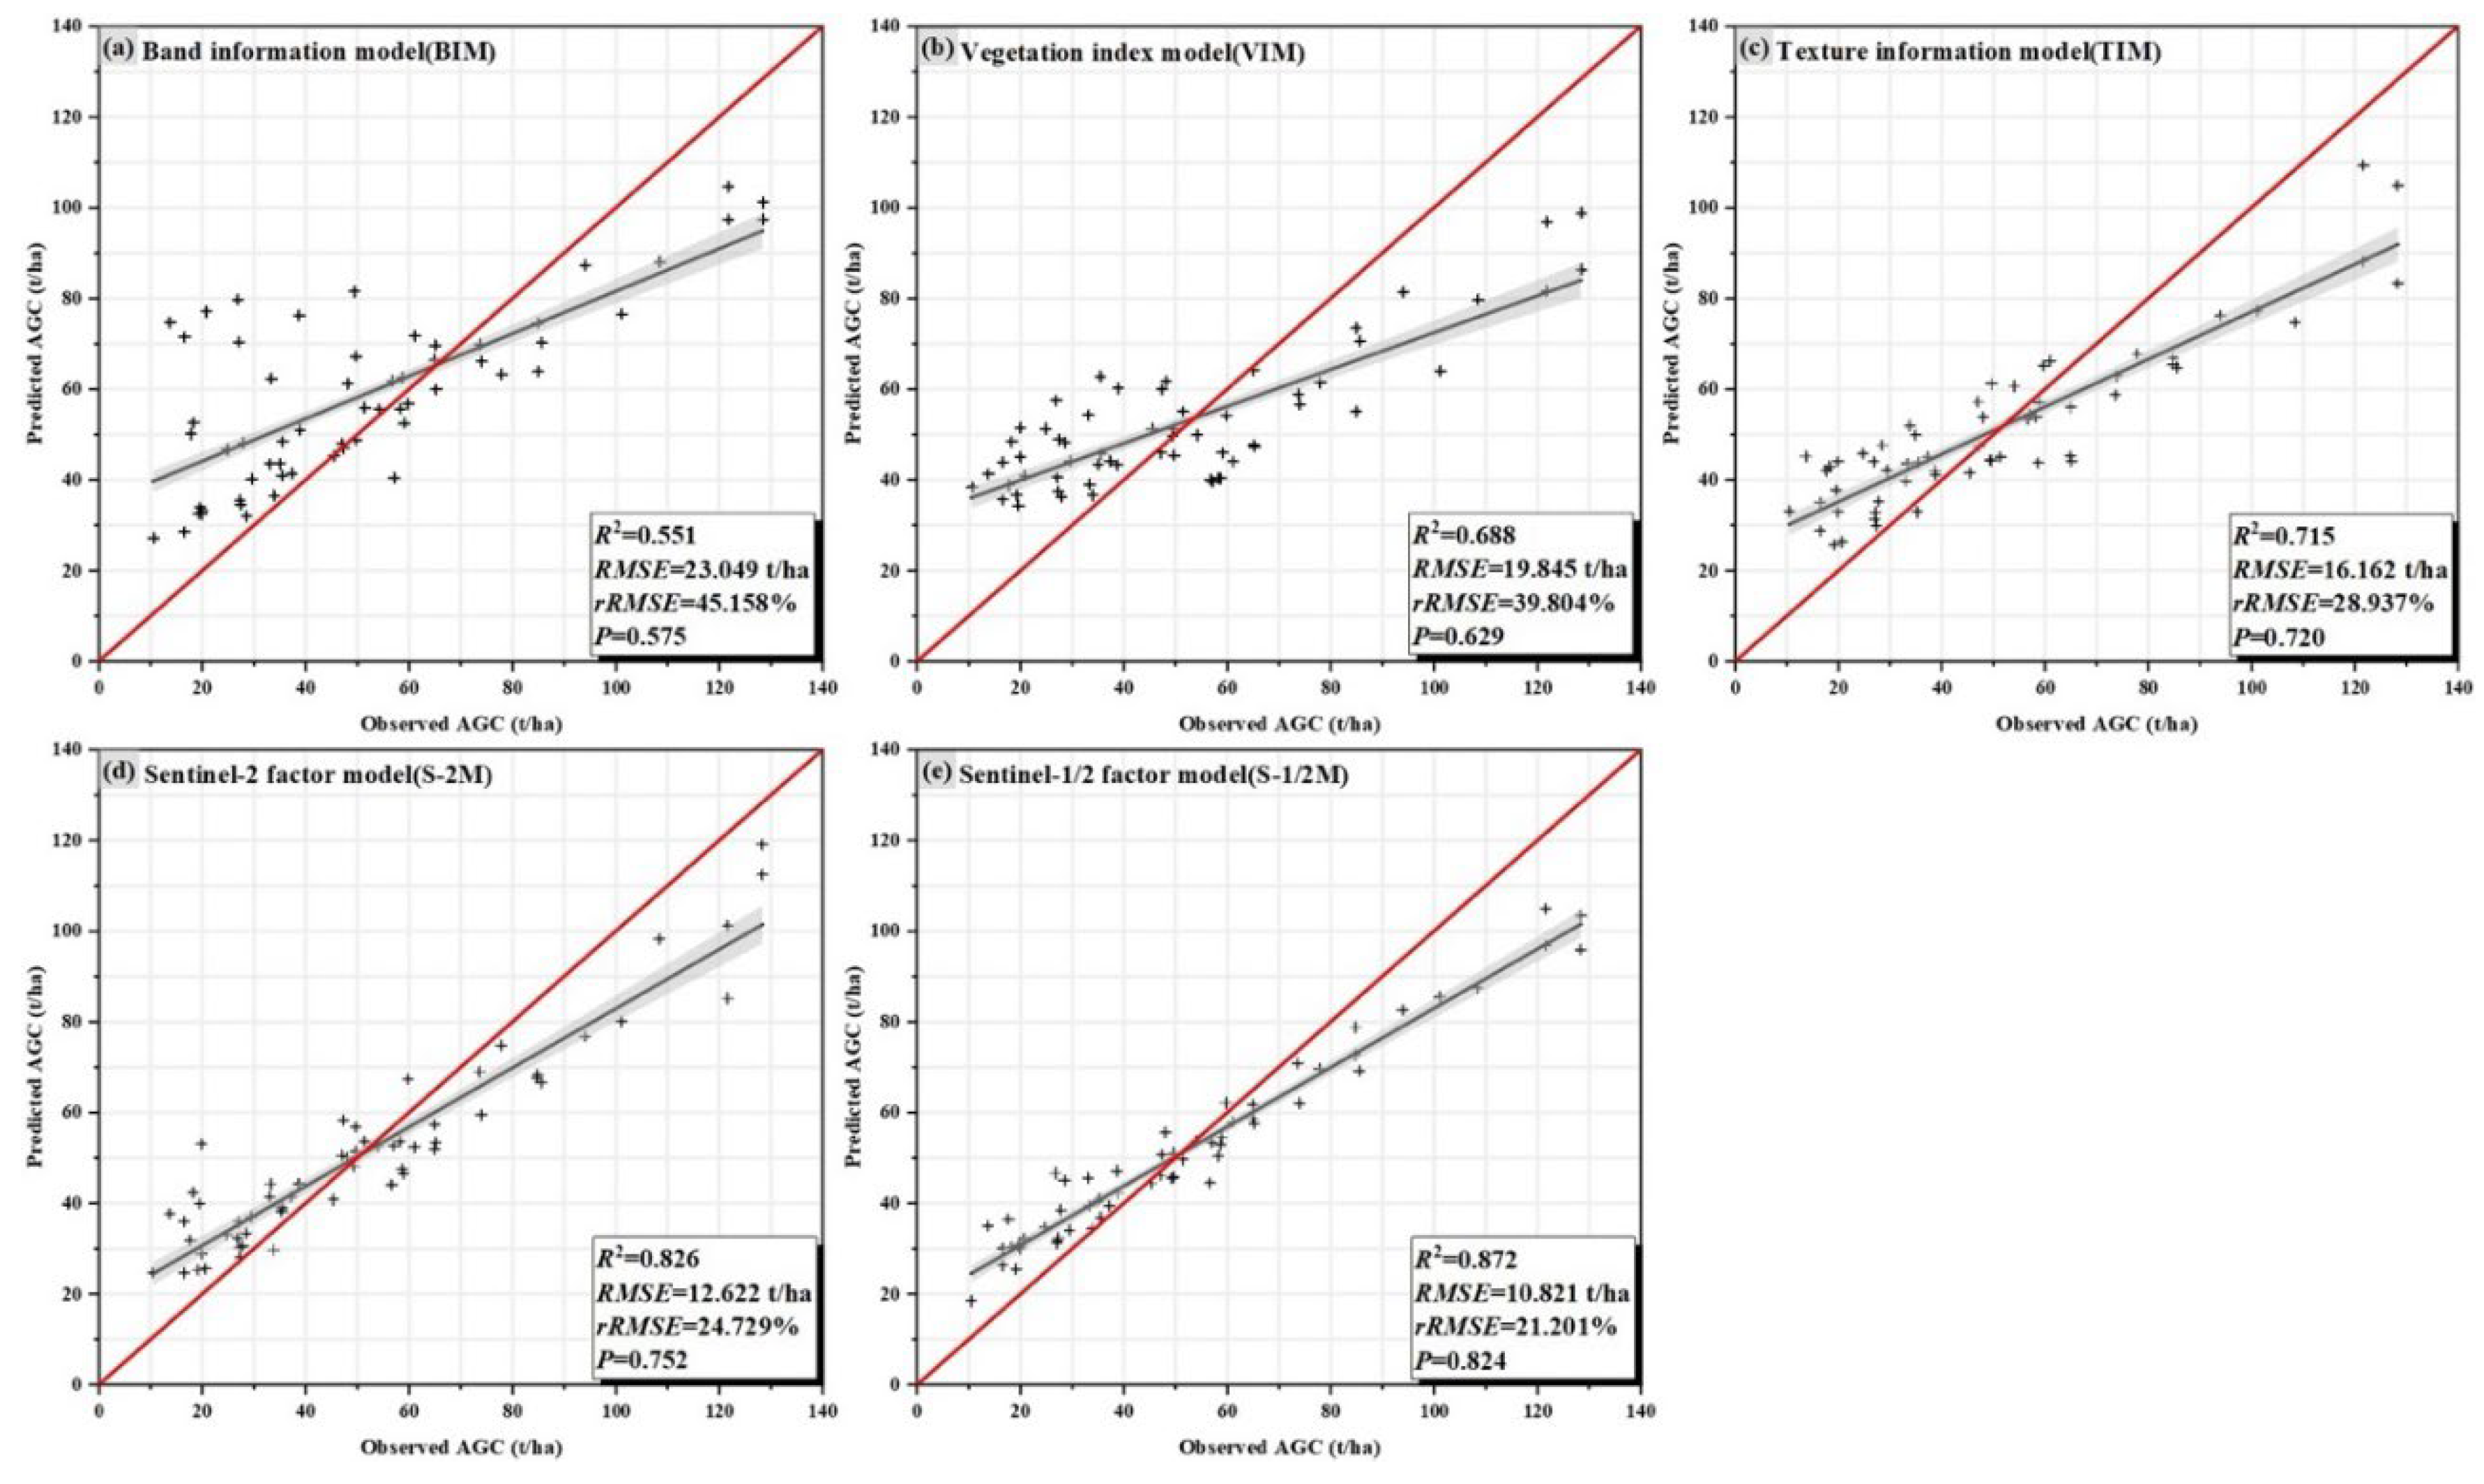
Figure 4.
(a) The distribution of R2 values for different models; (b) the distribution of RMSE values for different models.
Figure 4.
(a) The distribution of R2 values for different models; (b) the distribution of RMSE values for different models.
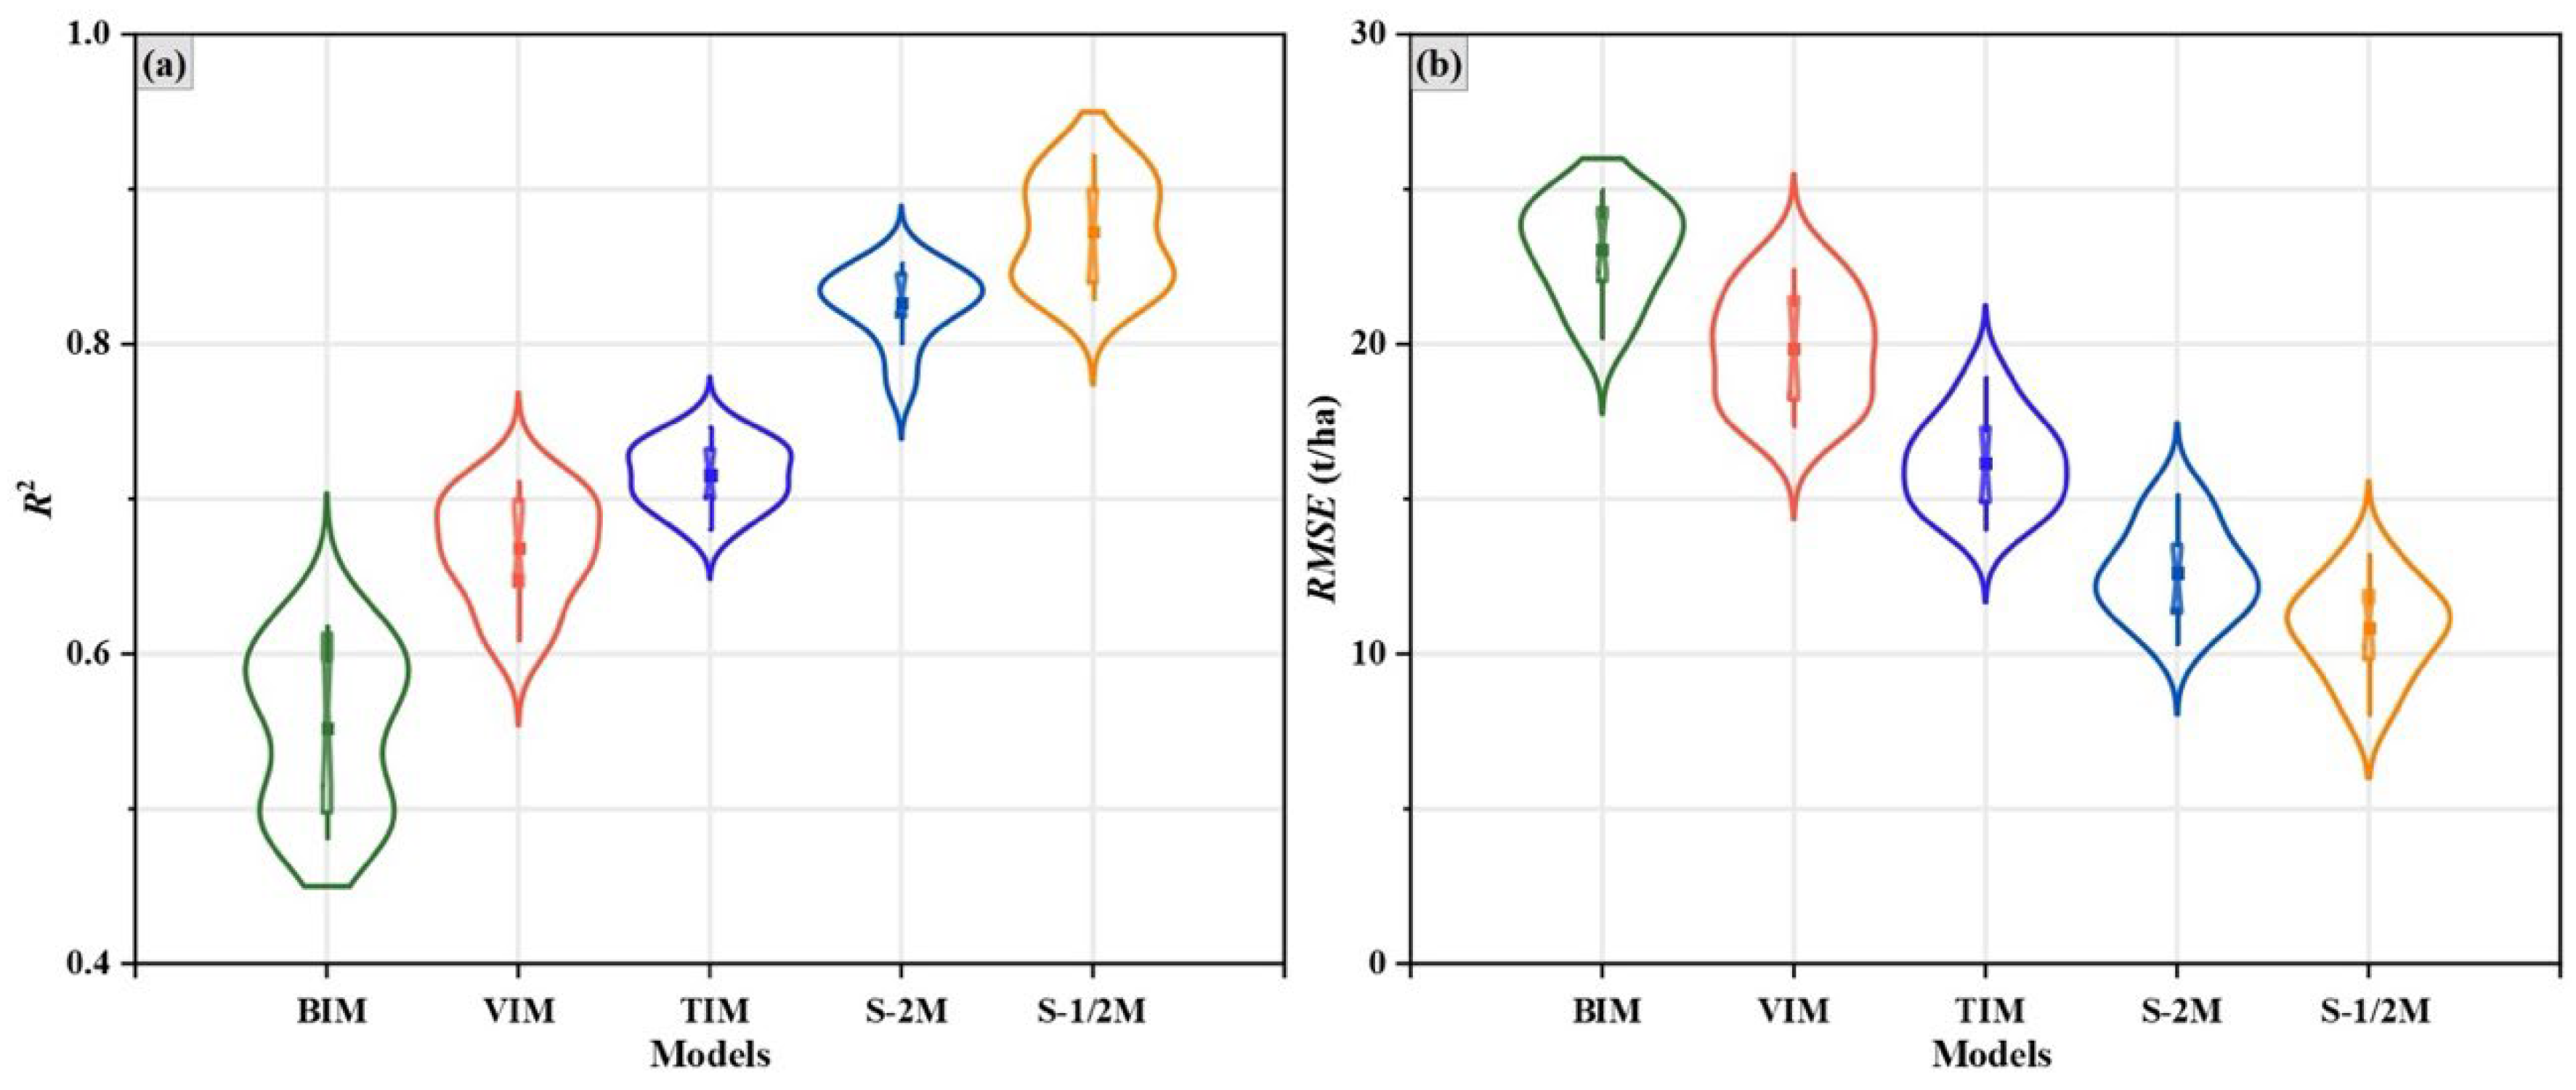
Figure 5.
(a) Relationship between DBH and standard deviation of measurement error; (b) relationship between H and measurement error.
Figure 5.
(a) Relationship between DBH and standard deviation of measurement error; (b) relationship between H and measurement error.
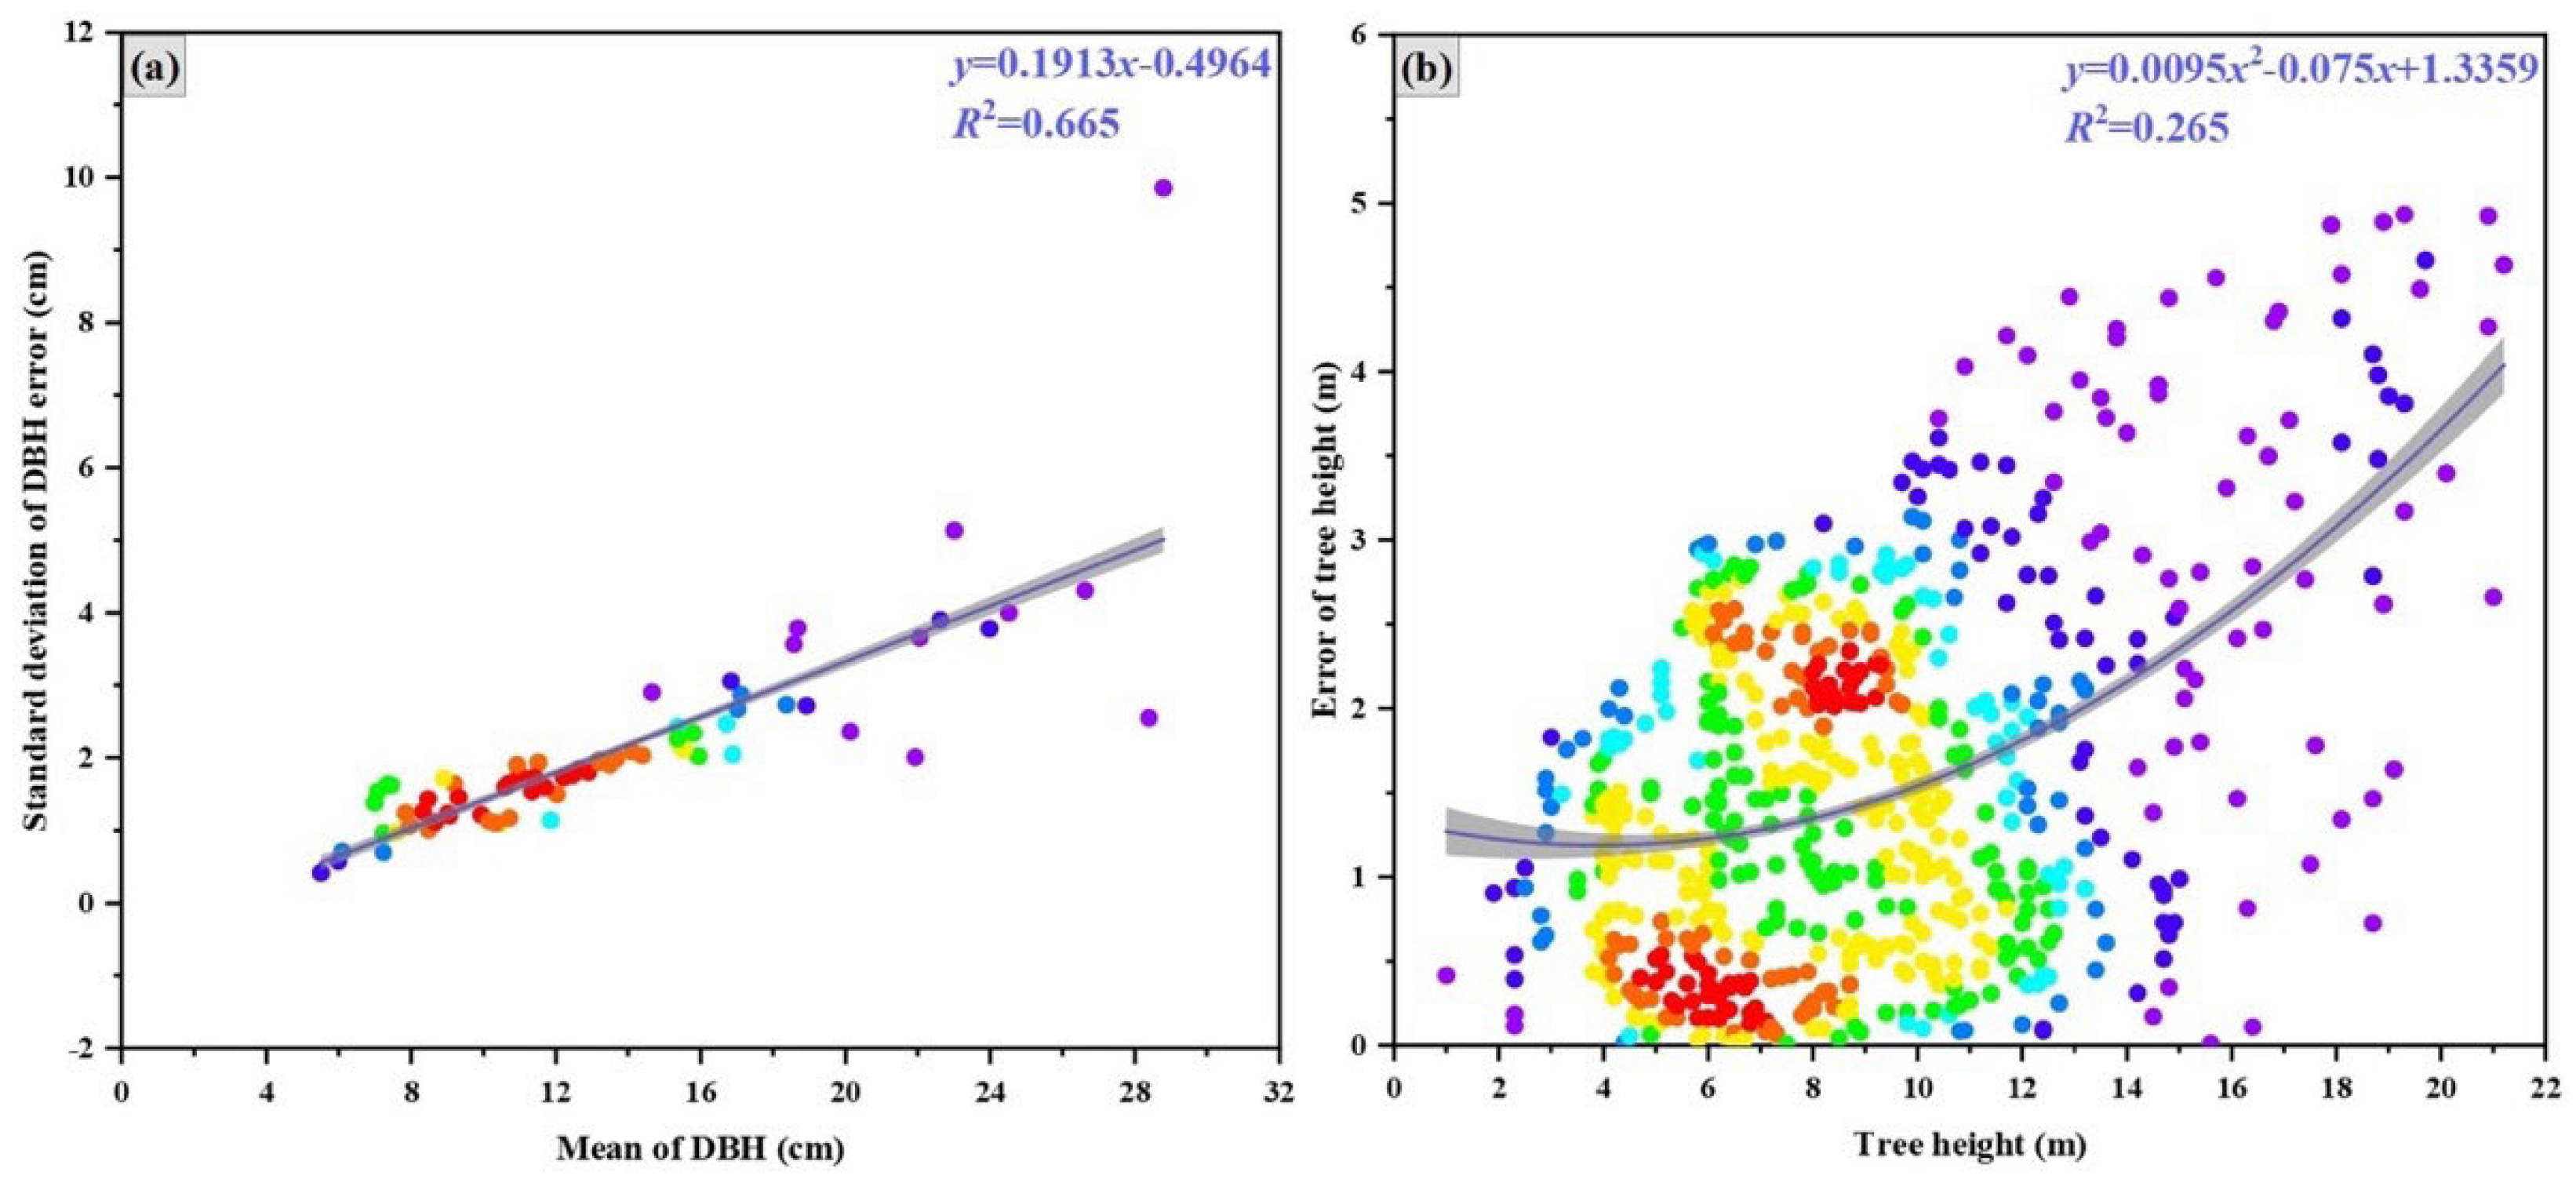
Figure 6.
(a) Three-dimensional scatterplot of the binary carbon stock model for Pinus densata; (b) line plot of errors and accuracy for the model.
Figure 6.
(a) Three-dimensional scatterplot of the binary carbon stock model for Pinus densata; (b) line plot of errors and accuracy for the model.
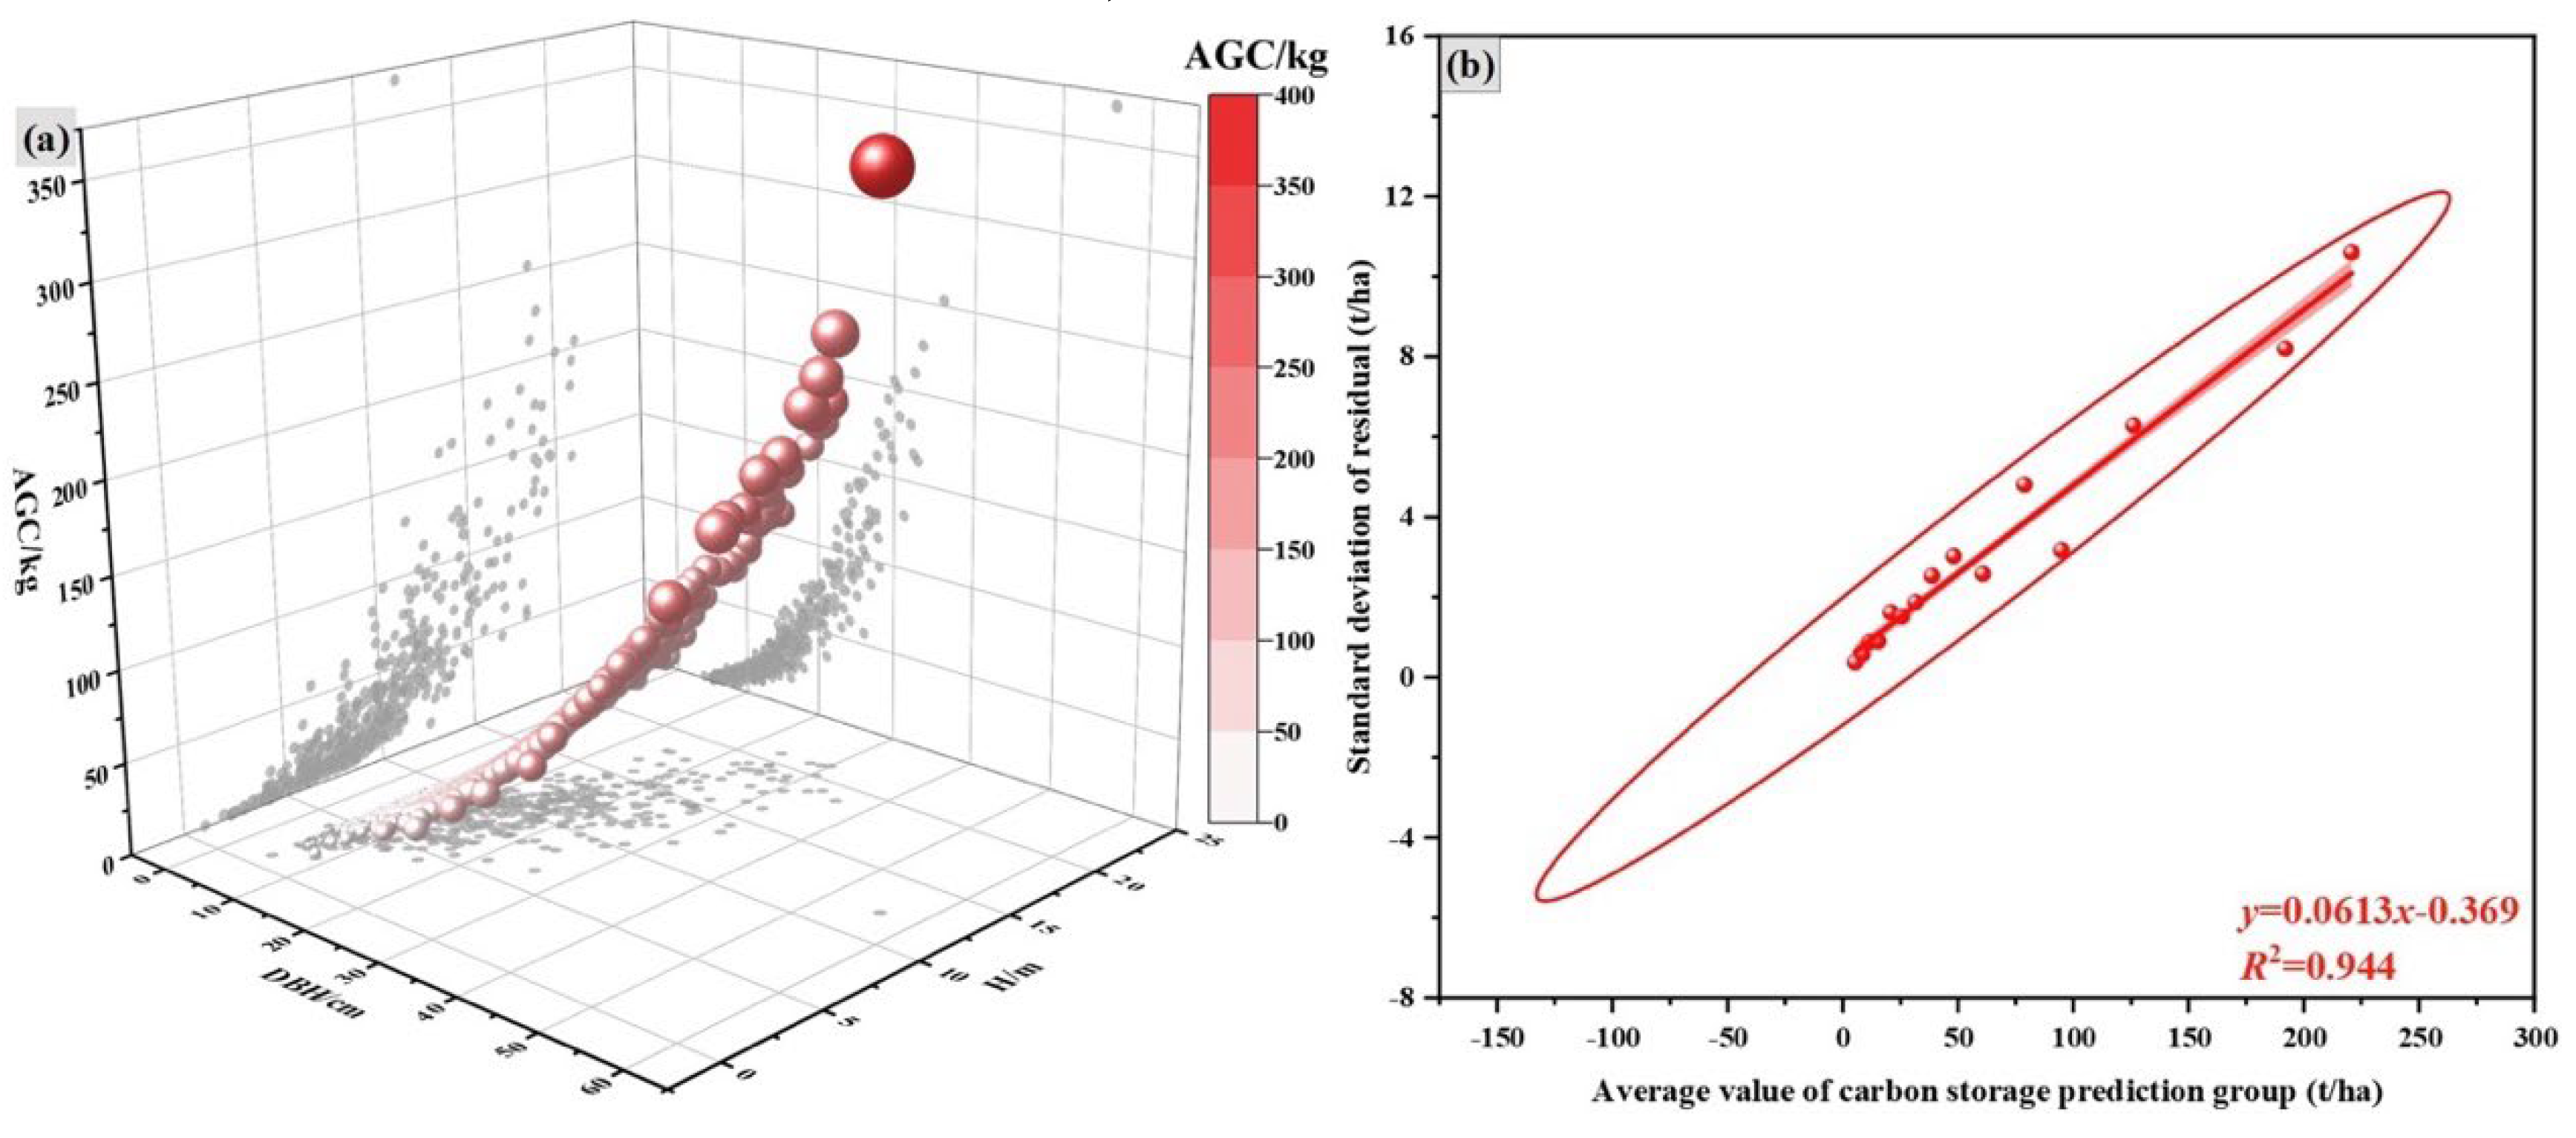
Figure 7.
(a) Error equations for the BIM, VIM, and TIM; (b) error equations for the S-2M and S-1/2M.
Figure 7.
(a) Error equations for the BIM, VIM, and TIM; (b) error equations for the S-2M and S-1/2M.
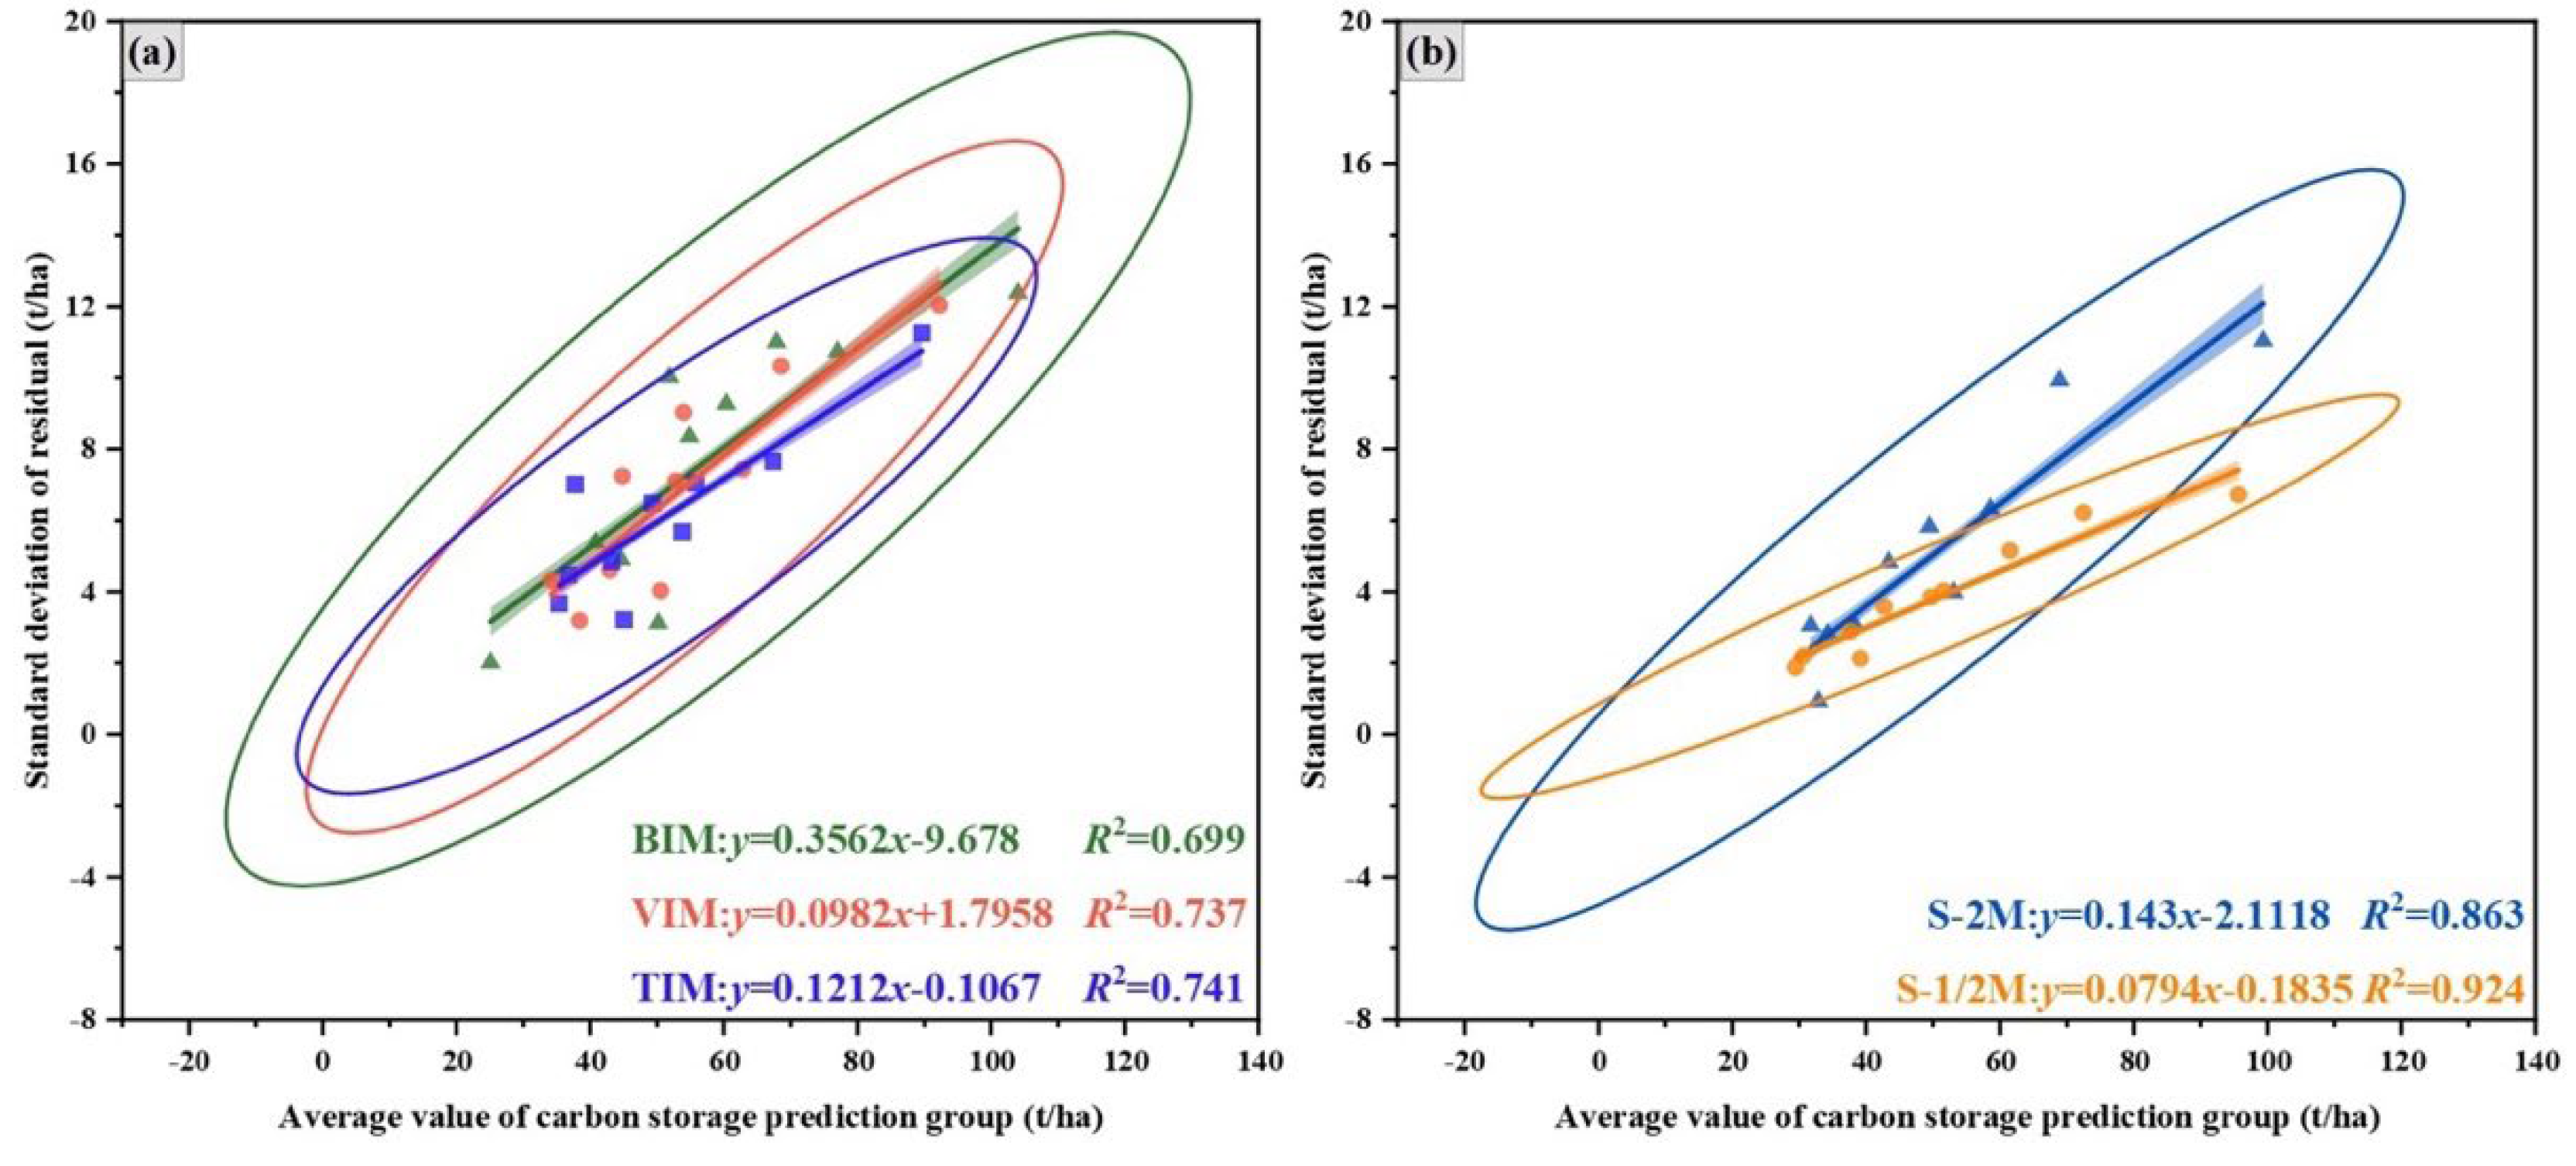
Figure 8.
(a) Difference of each sample plot for BIM, VIM, and TIM; (b) Difference of each sample plot for the S-2M and S-1/2M.
Figure 8.
(a) Difference of each sample plot for BIM, VIM, and TIM; (b) Difference of each sample plot for the S-2M and S-1/2M.
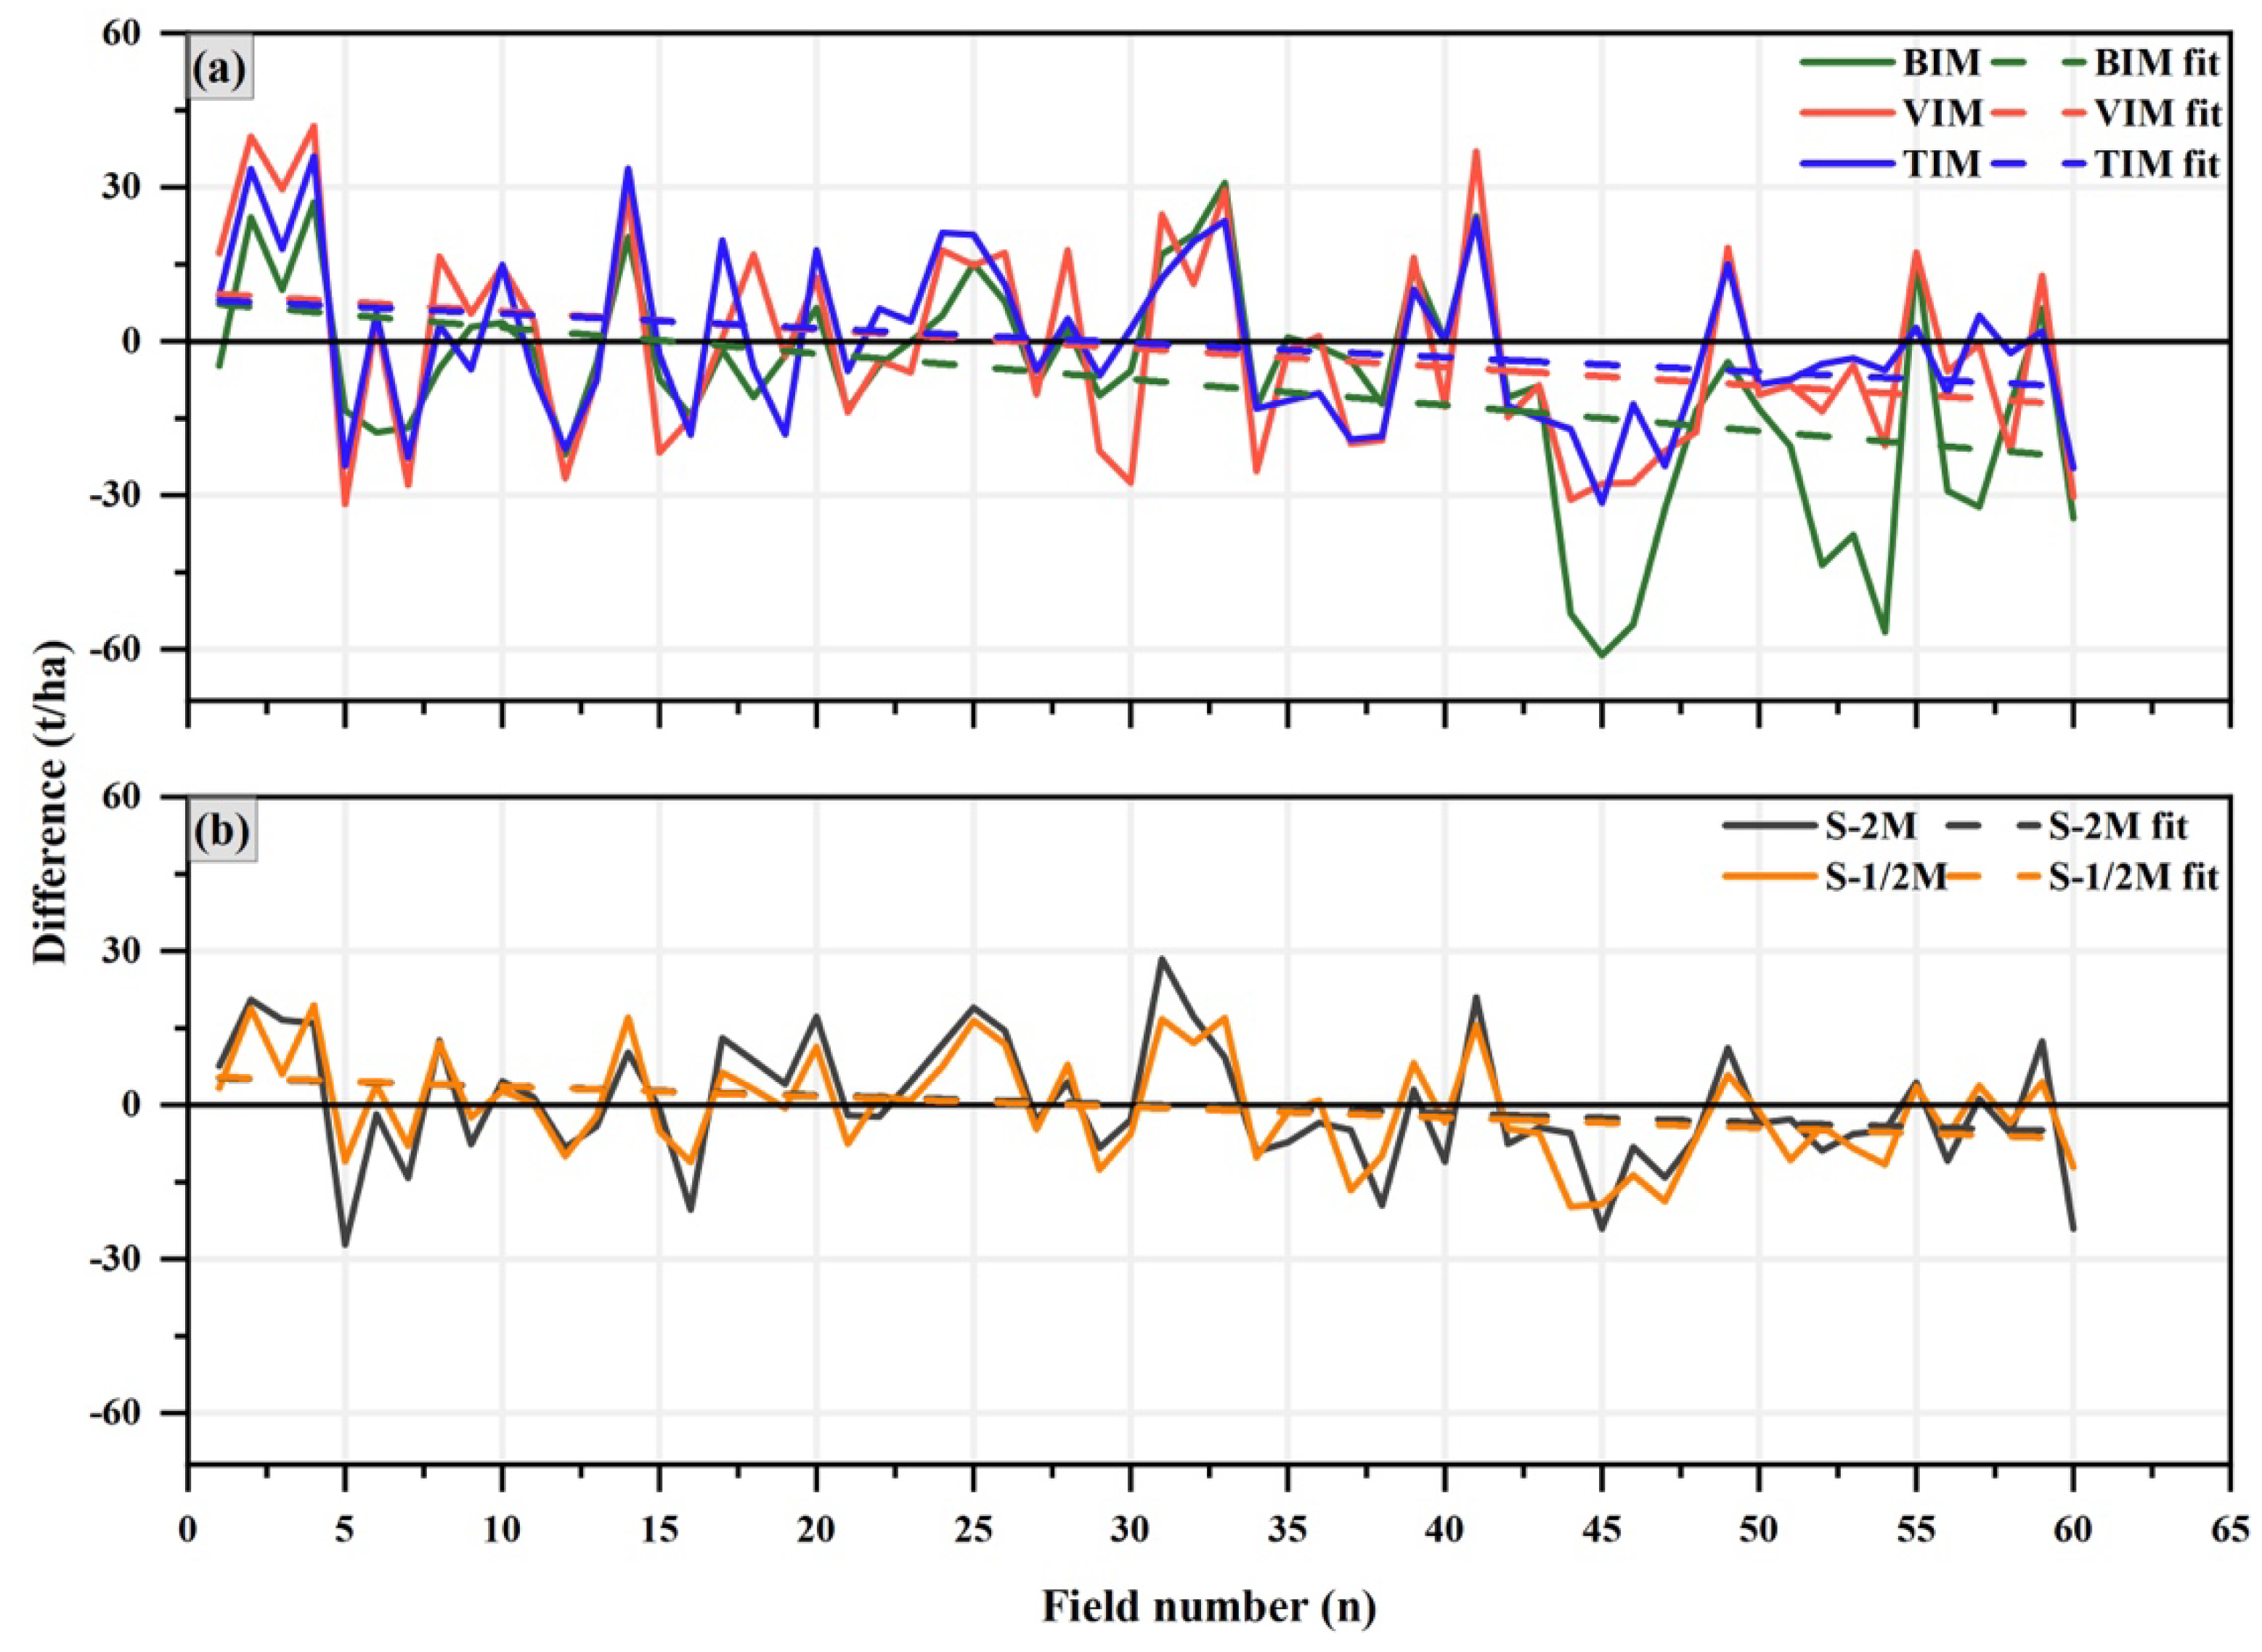
Figure 9.
Uncertainty of different remote sensing-based models.
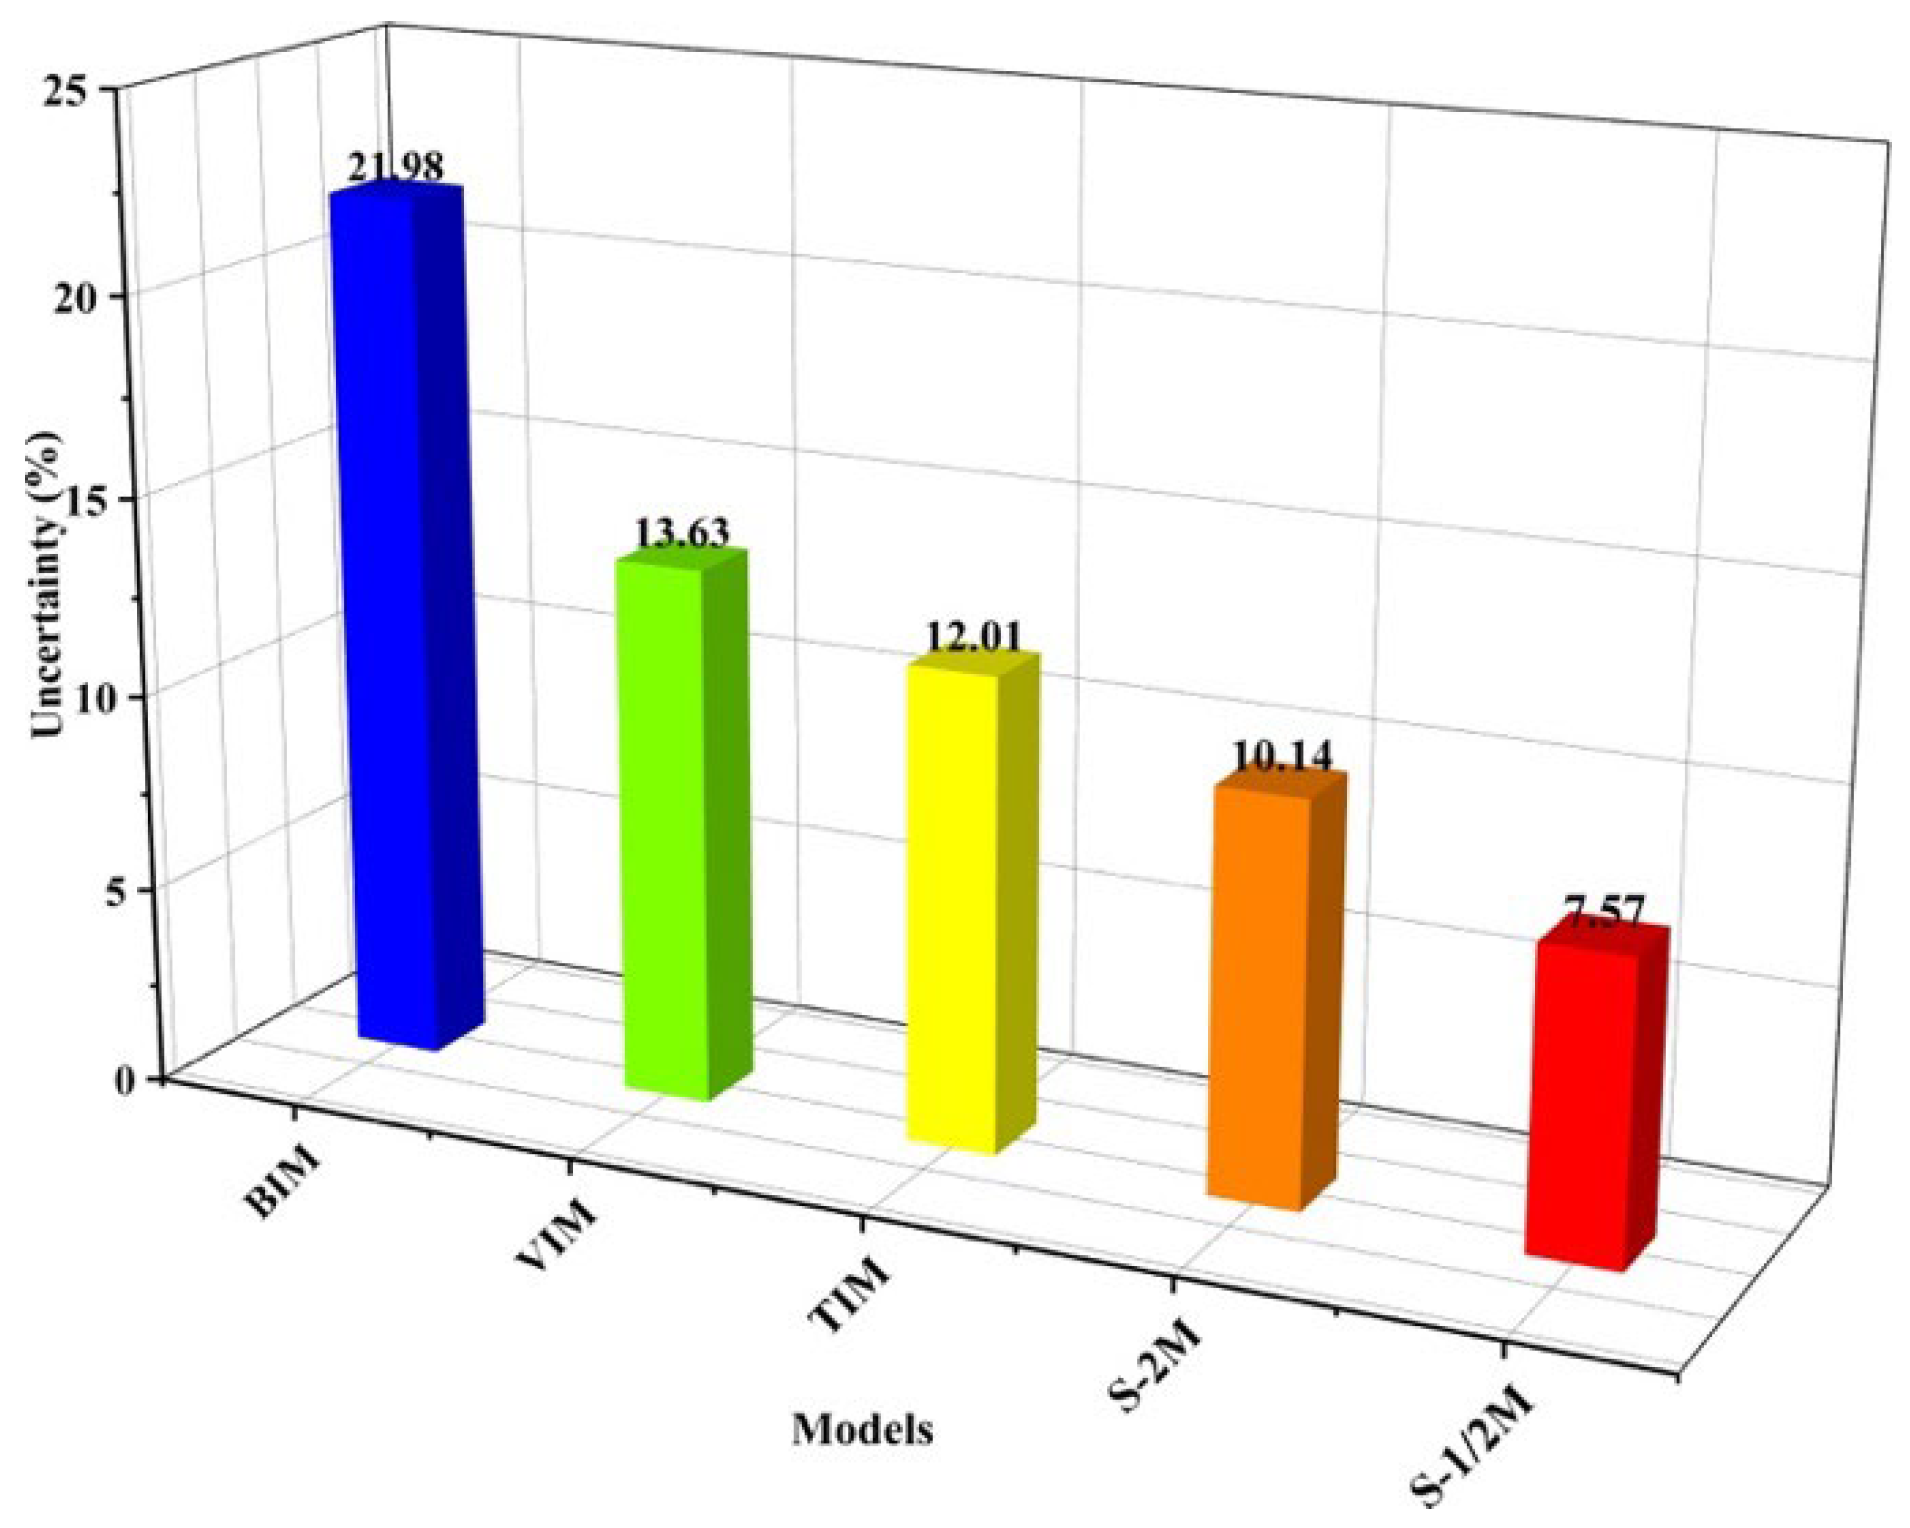

Table 1.
Field survey data in Shangri-La.
| Variables | Max | Min | Mean | SD |
|---|---|---|---|---|
| Mean DBH (cm) | 29.75 | 8.52 | 15.33 | 5.57 |
| Mean H (m) | 19.05 | 4.33 | 9.90 | 3.93 |
| AGC (t/ha) | 128.34 | 10.49 | 51.05 | 30.54 |
Table 2.
Collected images of the study area.
| Sensor | ID | Acquisition date | Cloud cover/% |
|---|---|---|---|
| Sentinel-1 | S1A_IW_GRDH_1SDV_20211104T112504_20211104T112529_040421_04CAB8_ACE9 | 2021/11/04 | |
| S1A_IW_GRDH_1SDV_20211104T112439_20211104T112504_040421_04CAB8_EC62 | 2021/11/04 | ||
| Sentinel-2 | S2A_MSIL2A_20211108T035951_N0301_R004_T47RNK_20211108T071124 | 2021/11/08 | 1.28 |
| S2A_MSIL2A_20211108T035951_N0301_R004_T47RNL_20211108T071124 | 2021/11/08 | 0.16 | |
| S2A_MSIL2A_20211108T035951_N0301_R004_T47RNM_20211108T071124 | 2021/11/08 | 0.06 | |
| S2A_MSIL2A_20211108T035951_N0301_R004_T47RPK_20211108T071124 | 2021/11/08 | 1.79 | |
| S2A_MSIL2A_20211108T035951_N0301_R004_T47RPL_20211108T071124 | 2021/11/08 | 0.97 | |
| S2A_MSIL2A_20211108T035951_N0301_R004_T47RPM_20211108T071124 | 2021/11/08 | 0.29 |
Table 3.
Variables information obtained from Sentinel-1 and Sentinel-2.
| Sensor | Variable type | Variable name | Definition |
|---|---|---|---|
| Sentinel-1 | Polarization | VV | Vertical transmit-vertical channel |
| VH | Vertical transmit-horizontal channel | ||
| Textural features | Contrast (CON), Dissimilarity (DIS), Angular second moment (ASM), Entropy (ENT), Variance (VAR), Correlation (COR), Homogeneity (HOM), Mean (ME) | Grey level co-occurrence matrix | |
| Sentinel-2 | Spectral textures | B2, B3, B4, B5, B6, B7, B8, B8A, B11, B12 | Blue(490nm), Green (560nm), Red (665nm), Red Edge1 (705nm), Red Edge2 (740nm), Red Edge3 (783 nm), NIR (842nm), Red Edge4 (865nm), SWIR1 (1610nm), SWIR2 (2190nm) |
| Vegetation indices | DVI | NIR-Red | |
| RVI | NIR/Red | ||
| NDVI | (NIR – Red)/ (NIR + Red) | ||
| NDI45 | (RE1 – Red)/ (RE1 + Red) | ||
| GNDVI | (RE3 – Green)/ (RE3 + Green) | ||
| SAVI | 1.5 × (NIR − Red)/8 × (NIR + Red + 0.5) | ||
| EVI | 2.5 × ((NIR − Red)/ (NIR + 6 × Red − 7.5 × Blue + 1)) | ||
| S2REP | 705+35× [((RE1+NIR)/2-RE2)/ (RE3-RE2)] | ||
| MSAVI | 2×NIR+1-sqrt[(2×NIR)2-8×(NIR-Red]/2 | ||
| Textural features | Same as Sentinel-1 | ||
Note: RE is the red edge; BX is a certain single band of the image.
Table 4.
Factors of different remote sensing-based estimation models.
| Model | Remote sensing factors |
|---|---|
| BIM: Band Information Model | B2, B3, B5 |
| VIM: Vegetation Index Model | DVI, EVI, MSAVI2, S2REP |
| TIM: Texture Information Model | R5B5VAR, R5B6CON, R5B6VAR, R5B7CON, R5DVICON |
| S-2M: Sentinel-2 factor Model | B5, S2REP, R5B5VAR, R5B6CON, R5B6VAR, R5B7CON, R5DVICON |
| S-1/2M: Sentinel-1/2 factor Model | B5, S2REP, R5B5VAR, R5B6CON, R5B6VAR, R5B7CON, R5DVICON, R5VVME, R5VHCOR |
Table 5.
Results of each uncertainty source at the plot scale.
| Model form | Measurement error/% | Error of mono-carbon stock model/% | Total uncertainty/% | Plot scale uncertainty/% | |
| parameter error/% | residual variation error/% | ||||
| 6.86 | 5.96 | ||||
| 3.02 | 9.09 | 9.58 | 3.71 | ||
Table 6.
Total uncertainty of AGC estimation of Pinus densata based on Sentinel-1/2 data.
| Model | Uncertainty at the plot scale /% | Uncertainty of remote sensing estimation models /% | Total uncertainty /% | |
| measurement error /% | Error of the mono-carbon stock model /% | |||
| 3.02 | 9.09 | |||
| BIM | 3.71 | 21.98 | 22.29 | |
| VIM | 13.63 | 14.12 | ||
| TIM | 12.01 | 12.56 | ||
| S-2M | 10.14 | 10.79 | ||
| S-1/2M | 7.57 | 8.43 | ||
Disclaimer/Publisher’s Note: The statements, opinions and data contained in all publications are solely those of the individual author(s) and contributor(s) and not of MDPI and/or the editor(s). MDPI and/or the editor(s) disclaim responsibility for any injury to people or property resulting from any ideas, methods, instructions or products referred to in the content. |
© 2024 by the authors. Licensee MDPI, Basel, Switzerland. This article is an open access article distributed under the terms and conditions of the Creative Commons Attribution (CC BY) license (http://creativecommons.org/licenses/by/4.0/).
Copyright: This open access article is published under a Creative Commons CC BY 4.0 license, which permit the free download, distribution, and reuse, provided that the author and preprint are cited in any reuse.


