
Submitted:
12 November 2024
Posted:
13 November 2024
You are already at the latest version
Abstract
This article investigates the factors that affect the job satisfaction of university teachers for which 400 teachers from 4 institutions (public and private) in Ecuador were stratifiedly selected, resulting in a total of 1600 data collected through online forms. The research was of cross-sectional design and quantitative type using machine learning techniques of classification and prediction, analyzing variables such as ethnic identity, field of knowledge, gender, number of children, job burnout, perceived stress and occupational risk. The results indicate that the best classification model is neural networks with a precision of 0.7304; the most significant variables for predicting the job satisfaction of university teachers are: the number of children they have, and scores related to perceived stress, professional risk and burnout, province of the university teacher surveyed in the university where he/she works, city where the teacher works; in contrast to marital status, which does not contribute to its prediction. These findings highlight the need for inclusive policies and effective strategies to improve teacher well-being in the university academic environment.
Keywords:
automatic learning
; university teachers
; work factors
; job satisfaction
; sociodemographic variables
1. Introduction
Job satisfaction is a concept that refers to the degree to which employees, in this case, university professors, feel that their needs and expectations at work are being met. In academia, job satisfaction has been closely linked to teaching performance, faculty retention, and the overall well-being of educators, critical factors that impact educational quality [1,2]. The importance of investigating job satisfaction in university teachers lies in the fact that high levels of satisfaction can contribute to a more productive work environment, reducing professional burnout and stress, and fostering long-term commitment to the institution [3,4]. Furthermore, understanding the factors that influence job satisfaction is essential for designing policies that improve the academic environment, increase student performance, and decrease faculty turnover [5,6].
Job satisfaction among university professors is a topic of growing interest due to its impact on their professional performance and personal well-being. Recent studies show that a significant proportion of academics experience job dissatisfaction. For example, a study conducted in the United States found that 41% of university faculty feel dissatisfied in some aspect of their work, particularly in areas related to workload and institutional support [7]. In a European context, a study on the job satisfaction of teachers in the United Kingdom revealed that only 50% of academics feel satisfied with their work, citing lack of resources and pressure to publish as critical factors of dissatisfaction [8]. On the other hand, in Latin America, research in Brazil indicates that 35% of teachers report levels of dissatisfaction due to factors such as low salary and job instability [9]. These data underline the prevalence of job dissatisfaction among university professors globally, evidencing the need to implement strategies that favor their well-being and commitment in the academic environment. Job dissatisfaction among university teachers can have negative effects at multiple levels within the educational environment. Lack of job satisfaction often contributes to professional burnout and decreased motivation, resulting in lower teaching quality and less engaged relationships with students [10]. Students, perceiving this lack of motivation, may experience a decrease in their own academic engagement and performance, which negatively impacts their outcomes and their perception of the quality of the education they receive [11]. At the institutional level, teacher dissatisfaction contributes to high staff turnover, which not only raises the costs associated with hiring and training new teachers, but also affects the stability and reputation of the institution [12]. Together, these effects underscore the importance of promoting a work environment that supports faculty well-being, as this benefits not only the academic staff, but also the students and the institution as a whole.
Research on job satisfaction among university professors is essential due to the multiple negative consequences that low job satisfaction can have on this group. Low job satisfaction is associated with increased levels of stress and burnout, factors that affect both the physical and mental health of teachers and can lead to frequent absences or even to leaving the profession [13,14]. In addition, dissatisfied teachers tend to be less motivated and less committed to their work, which directly affects the quality of education and can reduce the academic performance of students [15]. At the institutional level, job dissatisfaction can trigger high staff turnover, increasing operating costs and hindering the implementation of sustainable academic programs [16]. These implications highlight the need to investigate and address job satisfaction in university faculty to promote a healthy and efficient educational environment. The present study’s main objective is to identify the determinants that influence job satisfaction in university teachers and to analyze how these can be pre-determined using machine learning techniques. In particular, it is expected to classify and quantify variables such as workload, institutional support, professional development opportunities and working conditions, which have been shown to be critical factors in teacher satisfaction [17,18]. Using machine learning algorithms, the study aims to construct predictive models to anticipate satisfaction levels, which may result in the development of specific interventions to improve teachers’ job well-being [19]. By addressing these objectives, it seeks to contribute to a deeper, quantitative understanding of how specific factors influence job satisfaction, making it easier for educational institutions to make data-driven decisions to retain and motivate faculty [20].
Recent research has explored the relationship between job satisfaction and the use of machine learning techniques, highlighting the importance of these en- approaches in academic contexts. For example, a study by [21] reviewed the determinants of job satisfaction and found that factors such as work environment and individual characteristics are crucial to understanding this phenomenon. However, they noted that there is a lack of integration in the literature, suggesting the need for more sophisticated methods to analyze these factors. In this sense, the work of [22] applied machine learning techniques to predict job satisfaction in health professionals, showing how these methods can offer more accurate predictions when considering multiple variables simultaneously. In addition, an analysis by [23] used classification models to identify patterns in the job satisfaction of university teachers, revealing that sociodemographic and occupational variables are significant determinants of their satisfaction levels. These studies highlight the effectiveness of machine learning as an analytical tool in job satisfaction research, indicating that its application can contribute to a better understanding and improvement of job well-being in various contexts. Previous research on job satisfaction in university teachers has several limitations that justify the need for a more comprehensive approach in the present study. A common limitation is the limited use of advanced predictive models, as many studies have employed traditional regression techniques or correlation analysis, which restricts the accuracy in predicting factors associated with job satisfaction [24]. In addition, little research has included sociodemographic considerations, such as age, gender or professional experience, which is relevant, given that these variables influence the perceptions and needs of teachers in the academic setting [25]. Finally, some studies have been conducted in specific contexts or on small samples, which limits the generalizability of the findings and the possibility of developing effective interventions on a larger scale [26]. These limitations highlight the need to implement more sophisticated predictive models that consider sociodemographic variables for a more complete and applicable analysis in diverse contexts.
2. Literature Review
According to ecosystem theory, an individual’s behavior is influenced by both their personal characteristics and the surrounding environment, known as the ecosystem they operate within [27]. This approach has been instrumental in understanding complex interactions between individual and environmental factors in various domains, including job satisfaction. The closest and most direct influence in an individual’s ecosystem is the microsystem, comprising immediate interactions, such as workplace relationships and job demands. For university professors, job satisfaction can be affected by numerous factors within this microsystem, including institutional support, peer interactions, and student relationships. Recent studies have identified four key ecological factors—individual, occupational, institutional, and socio-demographic—that play significant roles in predicting job satisfaction in academia [28].
2.1. Individual Factors and Job Satisfaction
Individual characteristics, such as personality traits and emotional stability, significantly impact job satisfaction. Studies have shown that university professors with higher levels of resilience, self-efficacy, and optimism report higher satisfaction levels compared to those who exhibit traits like neuroticism or low self-control [29,30]. Additionally, psychological well-being factors, including mental health stability and lower levels of work-related anxiety, correlate positively with job satisfaction [28,31]. Professors with higher self-compassion and hope demonstrate higher satisfaction levels and tend to use positive coping strategies more frequently [30].
2.2. Occupational Factors and Job Satisfaction
In the academic profession, specific occupational factors—such as teaching load, research expectations, and administrative responsibilities—strongly influence job satisfaction [32]. Professors who perceive manageable workloads and receive institutional support for research and teaching duties report higher satisfaction levels. Furthermore, the presence of supportive colleagues and constructive feedback channels are positively linked to job satisfaction, while high-stress environments due to lack of resources and increased administrative burdens are detrimental to faculty well-being [32].
2.3. Institutional Factors and Job Satisfaction
University policies, leadership, and the overall work culture constitute the institutional factors that impact professors’ satisfaction. Studies show that positive institutional support, such as fair promotion opportunities and supportive leadership, contribute to higher satisfaction levels [33]. A harmonious relationship between faculty and administration can foster a healthy work environment, decreasing faculty turnover intentions [34]. Professors also report increased job satisfaction when they perceive fair compensation and adequate resources for professional growth.
2.4. Socio-Demographic Factors and Job Satisfaction
Socio-demographic factors, including age, gender, marital status, and years of experience, play essential roles in determining job satisfaction levels among university professors. For instance, older faculty members and those with longer tenure tend to report higher job satisfaction levels than younger, less experienced faculty [35]. Moreover, recent findings suggest that gender differences may affect job satisfaction, with female professors sometimes facing additional pressures balancing professional and personal roles, thereby impacting satisfaction levels [34]. The academic rank of professors also correlates with job satisfaction, where tenured and full professors report higher satisfaction levels compared to adjunct or part-time faculty [36].
2.5. Machine Learning in Predicting Job Satisfaction
Machine learning (ML) techniques have become increasingly relevant in predicting job satisfaction by identifying patterns and complex interactions within diverse data sets. ML algorithms, particularly tree-based models like Random Forests and Gradient Boosting, have proven effective in predicting faculty satisfaction by categorizing socio-demographic, institutional, and occupational factors as predictors [29,33]. Previous studies have applied neural networks to classify faculty into high or low satisfaction groups, achieving high predictive accuracy [35]. However, most of these applications have been limited to predicting general job satisfaction across industries, with few focused specifically on academia. Addressing this gap, the present study aims to apply machine learning classification techniques to predict job satisfaction among university professors, integrating socio-demographic and occupational perspectives for a more nuanced and actionable understanding.
3. Materials and Methods
3.1. Study Design
This study was designed as a cross-sectional, quantitative study. Cross-sectional studies are fundamental in observational research, since they allow the analysis of data from a population or a representative subset at a specific time. This design is particularly useful for identifying relationships and prevalence between variables without inferring causality [36]. The main objective of this study is to evaluate the job satisfaction of university teachers in Ecuador, considering psychosocial and demographic factors.
3.2. Population and Sample
The study population included university professors from various institutions in Ecuador. We selected 400 faculty members from 4 institutions (public and private), which resulted in a total of 1,600 data collected through online forms. This approach allows obtaining a representative sample, which is crucial for the external validity of the results [36]. The type of sampling used in this study is stratified sampling, this method involves dividing the population into homogeneous subgroups (strata) and then randomly selecting samples from each stratum. In this case, the strata were defined according to the characteristics of the public and private institutions and relevant demographic factors [37]. The details of the variables can be seen in Table 1.
3.3. Data Collection Instrument
This study was designed as a cross-sectional, quantitative study. Cross-sectional studies are fundamental in observational research, since they allow the analysis of data from a population or a representative subset at a specific time. This design is particularly useful for identifying relationships and prevalence between variables without inferring causality [36]. Validated questionnaires were used in the Ecuadorian context, including: Questionnaire for the Evaluation of Psychosocial Risks at Work, Job Satisfaction Scale, Perceived Stress Scale, Maslach Burnout Inventory Questionnaire, Sociodemographic sheet with questions about the university to which the teacher belongs, province and city where he/she works among others. The use of validated questionnaires is essential to ensure the reliability and validity of the measurements.
3.4. Procedure
In this study, several classification techniques were employed in the RStudio environment to predict the job satisfaction variable of university professors, including neural networks, Naive Bayes, multiple linear regression, random forest, decision trees, logistic classification, support vector machine (SVM), and k-nearest neighbors (k-NN). These techniques were selected because of their efficiency in handling both linear and nonlinear data, as well as their applicability for accurate predictions in classification and unbalanced data contexts [37,38]. Due to the unbalanced nature of the database, resampling techniques such as oversampling and undersampling were applied to balance the classes and minimize bias towards the majority class [40].
Data preprocessing was the first step in the analysis, where missing values were managed and categorical variables were transformed into numerical format to ensure compatibility with machine learning algorithms [39]. This step is essential to reduce the risk of errors and improve the accuracy of predictive models. In particular, by balancing the labor-boral satisfaction variable, we sought to avoid a biased prediction favoring the majority class, allowing the models to more accurately capture patterns in both job satisfaction classes [44].
For modeling, each classification technique was trained using a subset of data and evaluated on a test set. In the case of neu-ronal networks, a multilayer perceptron architecture was used, optimized by adjusting hyperparameters, such as the number of layers and the learning rate, which is essential for model generalization [41,42,43]. The Naive Bayes model was applied due to its speed and its ability to handle high dimensionality data assuming conditional independence of predictors, a suitable approach to evaluate sociodemographic variables [45]. In the case of multiple linear regression, its ability to interpret the influence of variables on job satisfaction was evaluated, although it is a model generally more suitable for linear analyses than for complex classification patterns [40].
Random forest and decision trees were selected for their ability to handle large and complex data sets and to identify important predictor variables [37]. The random forest uses multiple decision trees constructed from random samples and performs majority voting for final classification, which is useful in situations of data imbalance [42]. Logistic classification, on the other hand, was implemented due to its effectiveness in interpreting probabilities and adjusting weights in imbalance situations, favoring the classification of the minority class in job satisfaction [37].
The support vector machine (SVM) was trained with a radial kernel to maximize its accuracy in class separation, which is especially useful in nonlinear data [43]. Finally, the k-nearest neighbors (k-NN) allowed to evaluate the distances between observations to assign the job satisfaction category based on neighbor similarity, with an optimal value of k determined through cross-validation [44].
To evaluate the models, classification metrics such as accuracy, sensitivity, specificity and the area under the ROC curve were used, with special importance given to sensitivity due to the imbalance of the target variable [38]. The results obtained indicated the model with the best predictive performance, based on sociodemographic and occupational factors, which offers a more comprehensive view to understand the patterns in the job satisfaction of university teachers and highlight the elements with greater relevance in this context [40].
3.5. Descriptive Analysis
Table 2 presents a detailed descriptive analysis of the variables included in the data set. The distribution of universities, provinces and cities is relatively balanced, suggesting good geographic representation. The largest groups for the marital status variable are divorced (21.8%) and single (20.4%), followed closely by common-law (19.2%) and widowed (19.8%). The most common ethnicity is indigenous (20.4%), followed closely by Afro (20.4%), montubio/a (20.3%), mestizo/a (19.9%) and white (18.3%). The gender distribution shows a slight male majority (51.6%). The numerical variables appear with their respective means, with the average age of the participants being option 3: between 35 and 43 years, most of the participants have about two children, the average job risk is 2 (high), job burnout is 2 (moderate) and job satisfaction is 2 (moderate dissatisfaction); the average perceived stress is between 2 and 3 (moderate and high). See Table 2.
The PUNnSL job satisfaction values show considerable variability among the different ethnic groups. The Mestizo/a and Montubio/a groups show the highest values of job satisfaction, while the Indigenous group shows the lowest values.
The Afro group is located at an intermediate point. The female gender presents slightly higher values of job satisfaction compared to the male gender in all ethnic groups. Figure 1a suggests that there is an interaction between ethnicity and gender in influencing PUNnSL job satisfaction values; that is, the effect of gender on job satisfaction may vary depending on the ethnic group to which one belongs. After this, we proceeded to form the database in an Excel sheet with the detail and codifications in Table 1.
According to Figure 1b, as the number of children increases, there appears to be a decrease in average job satisfaction. Teachers with one child tend to report higher levels of satisfaction compared to those with two or more children. Some outliers are observed, especially in the group of teachers with one child, indicating that there are some individuals with very high or very low levels of satisfaction, despite having only one child. Figure 1c shows how job risk, perceived stress and job burnout are apparently inversely proportional to high levels of job satisfaction in university teachers. Before analyzing the data in the statistical software RStudio and the datatab.es application, the file is saved in CSV format.
4. Results
4.1. Description
Table 3 presents a comparison of different classification models in terms of accuracy and evaluation statistics, the most significant of which are detailed below. The Decision Tree presented an accuracy of 57.78% (95% CI: 0.5329 to 0.6217), with a No-Information rate of 20% and a highly significant P value (P < 2.2e-16). The Kappa coefficient of 0.4722 indicates moderate agreement. The AUC of 0.846015 shows good discrimination performance. With an accuracy of 0.578933 and an F1 score of 0.577813, this model is effective in its overall performance (Breiman, 2001). The SVM (Support Vector Machine) model achieved an accuracy of 58.38% (95% CI: 0.539 to 0.6277) and a No-Information rate of 20% (P < 2.2e-16). The Kappa coefficient was 0.4798, suggesting moderate agreement. The AUC was 0.847515, and the precision and recall values of 0.588130 and 0.58383838, respectively, result in an F1 score of 0.584808, evidencing good performance (Boser et al., 1992). The Neural Network achieved an accuracy of 74.84% (95% CI: 0.7068 to 0.7869), with a No-Information rate of 50.53% and a significant P value (P < 2.2e-16). The Kappa coefficient of 0.6229 indicates high concordance, and its AUC of 0.929890 supports a high discriminatory ability. Its accuracy and sensitivity of 0.730435 and 0.748414, respectively, and an F1 score of 0.724373 indicate robust performance (Rumelhart et al., 1986). Ordinal Classification Model by Random Forest: This model achieved an accuracy of 62.02% (95% CI: 0.5758 to 0.6631), with a No-Information rate of 20% (P < 2.2e-16). The Kappa coefficient of 0.5253 suggests moderate agreement, and its AUC of 0.855100 supports its discriminatory ability. The accuracy of 0.615891, together with an F1 score of 0.617414, shows good overall performance (Liaw & Wiener, 2002).
4.2. Clasification Results
A classification neural network model was evaluated to predict job satisfaction in five categories: “High Dissatisfaction”, “Moderate Dissatisfaction”, “High Satisfaction”, “Moderate Satisfaction” and “Moderate High Satisfaction”. The results indicated that the model achieved 44 correct predictions for “High Dissatisfaction”, although it was frequently confused with “Moderate Dissatisfaction” and “Moderate Satisfaction”. For “Moderate Dissatisfaction”, 57 correct predictions were recorded, but confusion with the other classes was also observed. In contrast, “High Satisfaction” showed high performance with 239 hits, while “Moderate Satisfaction” and “Moderate High Satisfaction” had only 6 and 8 hits, respectively. The evaluation metrics revealed an overall average accuracy of 0.7304, with high performance in “High Satisfaction” (99.17%) and “Moderate High Satisfaction” (100%). The average recall was 0.7484, excelling in “High Satisfaction” (100%) and “Moderate Dissatisfaction” (79.17%). The average F1 Score was 0.7244, and the overall AUC reached 0.9299, evidencing a robust ability to discriminate between classes. Despite the high performance in the high satisfaction categories, considerable confusion was identified in the intermediate classes, suggesting the need for additional adjustments to the hyperparameters or data processing to improve accuracy in these categories. Figure 2 shows graphically the AUC values by class, showing that the model performs well in general, with values above 0.8 for all classes: Class 1 (AUC = 0.8859) and Class 2 (AUC = 0.8577) indicate good class-ification ability, while Class 3 (AUC = 0.9996) suggests near perfect ability, possibly due to its clear definition. Class 4 (AUC = 0.8102) remains effective, and Class 5 (AUC = 0.9596) also shows high performance. However, it is important to consider other metrics such as accuracy, recall and F1 Score to obtain a more complete evaluation of the model, especially in the context of possible imbalances between classes.
4.3. Feature Importance
A classification neural network model was evaluated to predict job satisfaction in. The numerical values obtained indicate the importance of each variable in predicting PUNnSL, where a higher value reflects a greater impact on the model. The most significant variables include CHILDREN, PUNnEP, PUNnDL, PUNnRL, ProvA, ProvB and CiuD, suggesting that the number of children and scores on other variables related to well-being or satisfaction are influential in the ranking. In contrast, variables such as EcivilSingle.a, EC_Divorced and EC_Married have significantly low significances, indicating that they are not as relevant in predicting PUNnSL. In conclusion, the most significant variables for classifying PUNnSL, according to the permutation significance results, are those with higher scores, and it is recommended to consider eliminating the less relevant variables in future iterations of the model to simplify it and potentially improve its performance. Figure 3 shows graphically the description of the most significant variables in the prediction of job satisfaction.
4. Discussion
Neural networks have been widely used for damage classification in job satisfaction studies because of their ability to identify complex patterns between multiple predictor variables and the variable of interest. In the classification neural network model evaluated, key variables such as number of children (CHILDREN), perceived level of stress (PUNnEP) and job burnout (PUNnDL) showed considerable impact on the prediction of job satisfaction (PUNnSL) of university teachers [45,46,47,48,49,50]. This suggests that personal and emotional factors play an important role in the well-being of academic workers, which is in line with previous findings highlighting stress and work-family balance as essential factors in job satisfaction [3]. The im-portance analysis of variables revealed that scores on well-being-related variables, such as perceived stress and job burnout, are instrumental in pre-dicting respondents’ job satisfaction [47,51,53]. A high level of stress and burnout is associated with lower job satisfaction, which is consistent with studies that have found that perceived stress negatively affects well-being and, in con-sequence, job satisfaction [48,52]. This indicates the importance of these emotional and environmental factors in the perception of academic job satisfaction, suggesting possible areas of intervention. In addition to emotional factors, neural network analysis suggests that contextual variables such as province and city of work (ProvA, ProvB, and CiuD) also impact job satisfaction, although to a lesser extent [54,55]. These variables could reflect working conditions in different locations, which is relevant in studies on job satisfaction in varied contexts, such as academia, and underscores the importance of adapting classification models to the specific contexts of each institution [56,57]. On the other hand, it was observed that variables such as marital status, including options such as single, married or divorced, showed less importance in predicting job satisfaction, which is consistent with other studies that find that marital status tends to have a minimal impact on job well-being compared to factors such as stress and number of children [53,58,59]. This suggests that the model could be simplified by eliminating these less relevant variables, thus improving its efficiency and accuracy without losing quality in the predictions. In conclusion, variables with higher per-mutation importance scores, such as perceived stress, job burnout, and number of children, are the most significant contributors to the prediction of job satisfaction in university teachers. These findings indicate that personal and emotional factors, in combination with certain aspects of the context, are determinants of job satisfaction, and that the elimination of less relevant variables such as marital status could improve the performance of the model [46,52,53]. This conclusion may be useful for optimizing future models in the assessment of labor well-being.
5. Limitations and Suggestions for Future Studies
This section is not mandatory but can be added to the manuscript if the discussion is unusually long or complex. Firstly, while neural network models for classification have shown potential in predicting job satisfaction among university faculty by capturing complex relationships between multiple predictors, their use raises ethical and accuracy concerns, particularly in predictive contexts involving subjective wellbeing variables. Despite their strengths, these models can misinterpret predictors like perceived stress (PUNnEP) and burnout (PUNnDL), potentially resulting in inaccurate predictions [46,54]. The opacity of neural network algorithms may obscure essential aspects of the prediction process, leading to potential misclassification, especially if used without consideration of the specific personal and professional factors influencing academic staff [54,55]. Secondly, although this study incorporated key predictors such as the number of children (HIJOS) and work location (ProvA, ProvB, and CiuD), it lacked broader contextual variables that could enhance understanding of job satisfaction across diverse populations [48,56]. Future research should examine additional demographic and cultural factors, including socioeconomic status and institutional policies, which could significantly affect job satisfaction in academic settings. Including a wider range of socio-demographic and organizational variables could provide a more nuanced perspective on faculty wellbeing, thereby enhancing model generalizability [50,57]. Thirdly, the reliance on specific institutional locations as predictors in this neural network model limits its applicability to broader academic populations. Job satisfaction can be profoundly impacted by institutional culture and region-specific educational policies, which might not be accurately represented in location-based predictors alone [58]. Therefore, future studies could benefit from integrating qualitative data and longitudinal approaches that capture institutional dynamics and region-specific factors over time. This approach would allow a more comprehensive understanding of how location affects job satisfaction and enhance the model’s flexibility in diverse educational contexts [59]. Fourthly, the neural network model used in this study did not examine the interaction effects among predictors, such as between perceived stress and burnout or between family structure and work location. Interaction effects may offer additional insight into complex dynamics that impact job satisfaction among academic staff [60]. Future research could employ advanced modeling techniques to capture these interactions, potentially revealing new predictive insights. Including interaction terms might help refine predictive accuracy and aid in identifying patterns that better represent the multifaceted nature of job satisfaction [50,61]. Lastly, the exclusion of low-importance predictors, such as marital status, was suggested to improve model efficiency; however, it is important to validate this simplification in various educational environments. Although marital status demonstrated limited predictive power for job satisfaction in this context, future studies should assess whether other personal factors may emerge as relevant predictors across different academic institutions [62,63]. Validation in multiple educational settings would help confirm the generalizability and practical utility of streamlined models in predicting academic job satisfaction.
6. Implications
Our study utilized neural network models to classify factors associated with job satisfaction among university faculty, highlighting the intricate relationships between multiple predictors such as perceived stress (PUNnEP), burnout (PUNnDL), and the number of children (HIJOS). While these models have shown considerable potential for identifying job satisfaction, ethical concerns regarding their accuracy must be addressed, particularly when applied to subjective wellbeing variables. The risk of misinterpreting key predictors due to the opaque nature of neural networks could lead to significant misclassifications, which underscores the necessity for caution in deploying these models in predictive contexts [64,65]. Furthermore, although our analysis incorporated vital predictors, the exclusion of broader contextual variables may limit the applicability of the findings. Future research should aim to include a wider range of demographic and cultural factors, such as socioeconomic status and institutional policies, which may have a profound impact on job satisfaction across diverse academic populations [66,67]. Incorporating these additional variables could enhance the generalizability of the models and provide a more comprehensive perspective on faculty wellbeing. In addition, the reliance on specific work locations (ProvA, ProvB, and CiuD) as predictors restricts the applicability of our findings to broader academic contexts. Job satisfaction is influenced by institutional culture and regional educational policies that may not be fully captured through location-based predictors alone [68]. Future studies should consider integrating qualitative data and longitudinal approaches to explore how these dynamics evolve over time, thereby enriching the understanding of how context influences job satisfaction [65,66]. Moreover, the neural network model did not explore interaction effects between predictors, such as the interplay between perceived stress and burnout, or family structure and work location. Investigating these interaction effects could provide deeper insights into the complex dynamics affecting job satisfaction among academic staff [68]. Future research could implement advanced modeling techniques to identify these interactions, potentially refining predictive accuracy and uncovering patterns that better represent the multifaceted nature of job satisfaction [69]. Finally, while our findings suggested that excluding low-importance predictors like marital status could enhance model efficiency, it is crucial to validate this simplification across diverse educational environments. Future studies should assess the relevance of various personal factors as predictors of job satisfaction in different academic institutions [70]. This validation process will ensure that streamlined models remain robust and applicable in predicting job satisfaction within varied educational.
7. Conclusions
This study investigated factors that can predict job satisfaction of university teachers through a neural network model. The findings revealed that key variables such as number of children (HIJOS), perceived level of stress (PUNnEP) and job burnout (PUNnDL) emerged as significant determinants in predicting job satisfaction (PUNnSL). These results underscore the importance of addressing personal and emotional factors to improve the well-being of academics, aligning with previous research highlighting stress and work-family balance as essential in job satisfaction. In addition, variable significance analysis showed that scores on well-being-related variables, such as perceived stress and job burnout, are pivotal in predicting job satisfaction. A high level of stress and burnout is associated with lower job satisfaction, which is consistent with studies that have found that perceived stress negatively affects well-being and, consequently, job satisfaction. This indicates the relevance of these factors in the perception of satisfaction in academic work, suggesting possible areas of intervention. The analysis also suggests that contextual variables, such as province and city of work (ProvA, ProvB and CiuD), have an impact on job satisfaction, although to a lesser extent. These variables may reflect working conditions in different locations, which is relevant in studies on job satisfaction in varied contexts and highlights the importance of adapting the models to the specific characteristics of each institution. On the other hand, it was observed that variables such as marital status showed less importance in the prediction of job satisfaction, which is consistent with other studies that find that marital status has a minimal impact on job well-being compared to factors such as stress and number of children. This suggests that the model could be simplified by eliminating less relevant variables, improving its efficiency and accuracy without compromising the quality of the predictions. In conclusion, personal and emotional factors, together with contextual aspects, are determinants in the job satisfaction of university teachers. Focusing on variables with high predictive importance, such as perceived stress and burnout, could guide effective interventions to optimize well-being in the academic environment. These findings highlight the need to develop more specific models adapted to the realities of each educational institution to improve the prediction of job satisfaction in future studies.
Acknowledgments
In this section, we acknowledge the support provided that is not covered by the authors’ contribution or funding sections. This article is derived from a research project approved and sponsored by the Universidad Tecnológica Indoamérica, which included administrative and technical support.
References
- Ducharme, M.J.; Martin, J.K. Unrewarding work, coworker support, and job satisfaction: A test of the buffering hypothesis. Work and Occupations 2000, 27(2), 223–243. [Google Scholar] [CrossRef]
- Warr, P. Work, happiness, and unhappiness; Lawrence Erlbaum Associates: Mahwah, NJ, 2007. [Google Scholar]
- Judge, T.A.; Thoresen, C.J.; Bono, J.E.; Patton, G.K. The job satisfaction–job performance relationship: A qualitative and quantitative review. Psychological Bulletin 2001, 127(3), 376–407. [Google Scholar] [CrossRef]
- Oshagbemi, T. Gender differences in the job satisfaction of university teachers. Women in Management Review 2000, 15(7), 331–343. [Google Scholar] [CrossRef]
- Spector, P. E. Job satisfaction: Application, assessment, causes, and consequences; Sage, 1997. [Google Scholar]
- Dinham, S.; Scott, C. Moving into the third, outer domain of teacher satisfaction. Journal of Educational Administration 2000, 38(4), 379–396. [Google Scholar] [CrossRef]
- Cardoso, C.G.L.d.V.; Costa, N.M. Factors connected with professional satisfaction and dissatisfaction among nutrition teachers. Cien Saude Colet 2016, 21(8), 2357–2364. [Google Scholar] [CrossRef]
- De Simone, S.; Cicotto, G.; Lampis, J. Occupational stress, job satisfaction and physical health in teachers. European Review of Applied Psychology 2016, 66(2), 65–77. [Google Scholar] [CrossRef]
- Maslach, C.; Leiter, M.P. Understanding the burnout experience: Recent research and its implications for psychiatry. World Psychiatry 2016, 15(2), 103–111. [Google Scholar] [CrossRef]
- Rothmann, S.; Barkhuizen, N. Job satisfaction, occupational stress, burnout, and work engagement as components of work-related wellbeing. South African Journal of Industrial Psychology 2008, 34(3), 11–16. [Google Scholar] [CrossRef]
- Hakanen, J.J.; Bakker, A.B.; Schaufeli, W.B. Burnout and work engagement among teachers. Journal of School Psychology 2006, 43(6), 495–513. [Google Scholar] [CrossRef]
- Bakker, A.B.; Demerouti, E. The Job Demands-Resources model: State of the art. Journal of Managerial Psychology 2007, 22(3), 309–328. [Google Scholar] [CrossRef]
- Skaalvik, E.M.; Skaalvik, S. Motivated for teaching? Associations with school goal structure, teacher self-efficacy, job satisfaction, and emotional exhaustion. Teaching and Teacher Education 2017, 67, 152–160. [Google Scholar] [CrossRef]
- Tytherleigh, M.Y.; Webb, C.; Cooper, C.L.; Ricketts, C. Occupational stress in UK higher education institutions: A comparative study of all staff categories. Higher Education Research & Development 2005, 24(1), 41–61. [Google Scholar]
- Ingersoll, R.M. Teacher turnover, teacher shortages, and the organization of schools. American Educational Research Journal 2001, 38(3), 499–534. [Google Scholar] [CrossRef]
- Chadyiwa, M.; Kagura, J.; Stewart, A. Application of machine learning in the prediction of employee satisfaction with support provided in a national park. In Tourism and hospitality for sustainable development; Ndhlovu, E., Dube, K., Makuyana, T., Eds.; Springer: Cham, 2024; pp. 1–12. [Google Scholar]
- Business Management Department, Girne American University, North Cyprus Via Mersin 10, Kyrenia 99320, Turkey; Faculty of Business and Economics, Girne American University, North Cyprus Via Mersin 10, Kyrenia 99320, Turkey; Faculty of Business and Economics, Centre for Management Research, Girne American University, North Cyprus, Via Mersin 10, Kyrenia 99428, Turkey. Author to whom correspondence should be addressed. Behav. Sci. 2024, 14(6), 490.
- Holgado-Apaza, L.A.; Carpio-Vargas, E.E.; Calderon-Vilca, H.D.; Maquera-Ramirez, J.; Ulloa-Gallardo, N.J.; Acosta-Navarrete, M.S.; Barrón-Adame, J.M.; Quispe-Layme, M.; Hidalgo-Pozzi, R.; Valles-Coral, M. Modeling job satisfaction of Peruvian basic education teachers using machine learning techniques. Applied Sciences 2023, 13(6), 3945. [Google Scholar] [CrossRef]
- Mai, H.-N.; Win, T.T.; Kim, H.-S.; Pae, A.; Att, W.; Nguyen, D.D.; Lee, D.-H. Deep learning and explainable artificial intelligence for investigating dental professionals’ satisfaction with CAD software performance. Journal of Prosthodontics 2024, 14(6), 490. [Google Scholar] [CrossRef]
- Sinniah, *!!! REPLACE !!!*; Mamun, A. Sinniah; Mamun, A. Modeling the significance of motivation on job satisfaction and performance among the academicians: The use of hybrid structural equation modeling-artificial neural network analysis. Journal of Business Research 2024. [Google Scholar]
- Golande, A.; Surwase, V.; Patil, N.; Bhandekar, J.; Shinde, J. Envisaging college personnel turnover using machine learning and ensemble learning techniques. In Proceedings of the 2024 IEEE 9th International Conference for Convergence in Technology (I2CT); 2024; p. 1. [Google Scholar]
- Kebede, A.G.; Fikire, A.H. Demographic and job satisfaction variables influencing academic staffs’ turnover intention in Debre Berhan University, Ethiopia. Cogent Business & Management 2022, 9. [Google Scholar]
- Ahumada-Tello E, Ramos K. Reality or utopia? The happiness of university academics in their professional performance: evidence from an emerging country (Mexico). Management Decision 25, 62, 403–25. [Google Scholar]
- Asad Ali Khan, Shamsul Arfin Qasmi, Muhammad Abid, Khushk IA. Factors influencing faculty job satisfaction: a quantitative study of private medical colleges in Karachi. Journal of the Pakistan Medical Association 2024, 1–12. [Google Scholar] [CrossRef]
- Spector PE, Jex SM. Development of four self-report measures of job stressors and strain: Interpersonal Conflict at Work Scale, Organizational Constraints Scale, Quantitative Workload Inventory, and Physical Symptoms Inventory. Journal of Occupational Health Psychology 1998, 3, 356–67. [Google Scholar] [CrossRef] [PubMed]
- Bronfenbrenner, U. The Ecology of Human Development: Experiments by Nature and Design 1979.
- Arias-Flores H, Guadalupe-Lanas J, Pérez-Vega D, Artola-Jarrín V, Cruz-Cárdenas J. Emotional State of Teachers and University Administrative Staff in the Return to Face-to-Face Mode. Behavioral Sciences 2022, 12, 420. [Google Scholar] [CrossRef]
- Nishi M, Yamano M, Matoba S. Prediction of well-being and insight into work-life integration among physicians using machine learning approach. PLOS ONE 2021, 16. [Google Scholar]
- Hammoudi Halat D, Soltani A, Dalli R, Alsarraj L, Malki A. Understanding and Fostering Mental Health and Well-Being among University Faculty: A Narrative Review. Journal of Clinical Medicine 2023, 12, 4425. [Google Scholar] [CrossRef]
- Cao J, Dai T, Dong H, Chen J, Fan Y. Research on the mechanism of academic stress on occupational burnout in Chinese universities. Scientific Reports 2024, 14. [Google Scholar]
- Mudrak J, Zabrodska K, Kveton P, Jelinek M, Blatny M, Solcova I, et al. Occupational Well-being Among University Faculty: A Job Demands-Resources Model. Research in Higher Education 2017, 59, 325–48. [Google Scholar]
- Colla CN, Andriollo DB, Cielo CA. Self-assessment of teachers with normal larynges and vocal and osteomuscular complaints. Journal of Voice 2024, 38, 1253.e1–1253.e10. [Google Scholar] [CrossRef]
- Gurumendi España, I.E.; Panunzio, A.P.; Calle Gómez, M.A.; Borja Santillán, M.A. Síndrome burnout en docentes universitarios. RECIMUNDO 2021, 5, 205–19. [Google Scholar] [CrossRef]
- Luzuriaga Jaramillo, H.A.; Espinosa Pinos, C.A.; Haro Sarango, A.F.; Ortiz Román, H.D. Histograma y distribución normal: Shapiro-Wilk y Kolmogorov Smirnov aplicado en SPSS. LATAM Revista Latinoamericana de Ciencias Sociales y Humanidades 2023, 4. [Google Scholar] [CrossRef]
- Espinosa-Pinos, C.A.; Acuña-Mayorga, J.M.; Acosta-Pérez, P.B.; Lara-Álvarez, P. Ordinal Logistic Regression Model for Predicting Employee Satisfaction from Organizational Climate. 2023 IEEE Seventh Ecuador Technical Chapters Meeting (ECTM); 2023; pp. 1–6. [Google Scholar]
- Park, J.; Feng, Y.; Jeong, S.P. Developing an advanced prediction model for new employee turnover intention utilizing machine learning techniques. Scientific Reports 2024, 14. [Google Scholar] [CrossRef] [PubMed]
- Acosta-Pérez, P.B.; Espinosa-Pinos, C.A.; Acuña-Mayorga, J.M.; Lascano-Arias, G. Occupational Risks: A Comparative Study of the Most Common Indicators in Uruguay, Cuba and Ecuador. 2023 IEEE Seventh Ecuador Technical Chapters Meeting (ECTM); 2023; pp. 1–4. [Google Scholar]
- Rustam, F.; Ashraf, I.; Shafique, R.; Mehmood, A.; Ullah, S.; Sang Choi, G. Review prognosis system to predict employees job satisfaction using deep neural network. Computational Intelligence 2021, 37, 924–50. [Google Scholar] [CrossRef]
- Holgado-Apaza, L.A.; Carpio-Vargas, E.E.; Calderon-Vilca, H.D.; Maquera-Ramirez, J.; Ulloa-Gallardo, N.J.; Acosta-Navarrete, M.S.; et al. Modeling Job Satisfaction of Peruvian Basic Education Teachers Using Machine Learning Techniques. Applied Sciences 2023, 13, 3945. [Google Scholar] [CrossRef]
- Szromek, A.R.; Wolniak, R. Job Satisfaction and Problems among Academic Staff in Higher Education. Sustainability 2020, 12, 4865. [Google Scholar] [CrossRef]
- Predictive models for Employee satisfaction and retention in HR using Machine learning. Journal of Informatics Education and Research 2024.
- Hong, W.-C.; Pai, P.-F.; Huang, Y.-Y.; Yang, S.-L. Application of Support Vector Machines in Predicting Employee Turnover Based on Job Performance. In Lecture Notes in Computer Science; Springer: Berlin Heidelberg, 2005; pp. 668–674. [Google Scholar]
- Maqsood, A.; Gul, S.; Noureen, N.; Yaswi, A. Dynamics of Perceived Stress, Stress Appraisal, and Coping Strategies in an Evolving Educational Landscape. Behavioral Sciences 2024, 14, 532. [Google Scholar] [CrossRef]
- Manoj Kumar, G.V.; Chawla, B.A.; Rao, K.N.; Sita Ratnam, G. Emotional Labour and Perceived Stress at Workplace—HR Analytics. In Lecture Notes in Networks and Systems; Springer Nature: Singapore, 2023; pp. 405–413. [Google Scholar]
- Barigala, V.K.; PJ; S; P; SK; Ganapathy, N.; PA; K; Kumar, D.; Agastinose Ronickom, J.F. Evaluating the effectiveness of machine learning in identifying the optimal facial electromyography location for emotion detection. In Biomedical Signal Processing and Control; Elsevier BV, 2025; Vol. 100, p. 107012. [Google Scholar]
- Boser, B.E.; Guyon, I.M.; Vapnik, V.N. A training algorithm for optimal margin classifiers. In Proceedings of the fifth annual workshop on Computational learning theory, COLT92: 5th Annual Workshop on Computational Learning Theory; 1992; pp. 144–152. [Google Scholar]
- Seok, B.W.; Wee K hoan Park J young Anil Kumar, D.; Reddy, N.S. Modeling the teacher job satisfaction by artificial neural networks. Soft Computing 2021, 25, 11803–15. [Google Scholar] [CrossRef]
- James, G.; Witten, D.; Hastie, T.; Tibshirani, R.; Taylor, J. Statistical Learning. Springer Texts in Statistics 2023, 15–67. [Google Scholar]
- Cranmer, S.J.; Desmarais, B.A. What Can We Learn from Predictive Modeling? Political Analysis 2017, 25, 145–66. [Google Scholar] [CrossRef]
- Shouval, R.; Bondi, O.; Mishan, H.; Shimoni, A.; Unger, R.; Nagler, A. Application of machine learning algorithms for clinical predictive modeling: a data-mining approach in SCT. Bone Marrow Transplantation 2013, 49, 332–7. [Google Scholar] [CrossRef]
- Li, Y.; Lu, F.; Yin, Y. Applying logistic LASSO regression for the diagnosis of atypical Crohn’s disease. Scientific Reports 2022, 12. [Google Scholar] [CrossRef] [PubMed]
- Rumelhart, D.E.; Hinton, G.E.; Williams, R.J. Learning representations by back-propagating errors. Nature 1986, 323, 533–6. [Google Scholar] [CrossRef]
- Clark, M.A.; WStevens, G.; SMichel, J.; Zimmerman, L. Workaholism among Leaders: Implications for Their Own and Their Followers’ Well-Being. Research in Occupational Stress and Well-being. 2016; 1–31. [Google Scholar]
- Schaufeli, W.B.; Taris, T.W. A Critical Review of the Job Demands-Resources Model: Implications for Improving Work and Health. Bridging Occupational 2013, 43–68. [Google Scholar]
- Wang, Y.; Huang, J.; You, X. Personal Resources Influence Job Demands, Resources, and Burnout: A One-year, Three-wave Longitudinal Study. Social Behavior and Personality: an international journal 2016, 44, 247–58. [Google Scholar] [CrossRef]
- Leiter, M.P. The Psychology of Work Engagement; Oxford Research Encyclopedia of Psychology; Oxford University Press, 2019. [Google Scholar]
- Schaufeli, W.B.; Bakker, A.B. Job demands, job resources, and their relationship with burnout and engagement: a multi-sample study. Journal of Organizational Behavior 2004, 25, 293–315. [Google Scholar] [CrossRef]
- Ciencia Digital. Editorial Ciencia, Digital; 2018, 2. Ciencia Digital. Editorial Ciencia Digital. 2018; 2. [Google Scholar]
- Adhikary, S. Exploring school principle’s practices in developing teacher leaders in their school. Social Sciences & Humanities Open 2021, 4, 100189. [Google Scholar] [CrossRef]
- Oo, C.Z.; Alonzo, D.; Ei, W.Y.; Marynowski, R. Assessment practices of teachers in Myanmar: Are we there yet? Teaching and Teacher Education 2024, 145, 104634. [Google Scholar] [CrossRef]
- Sinniah, S.; Al Mamun, A.; Md Salleh, M.F.; Makhbul, Z.K.M.; Hayat, N. Modeling the Significance of Motivation on Job Satisfaction and Performance Among the Academicians: The Use of Hybrid Structural Equation Modeling-Artificial Neural Network Analysis. Frontiers in Psychology 2022, 13. [Google Scholar] [CrossRef]
- Ryan, R.M.; Deci, E.L. Intrinsic and Extrinsic Motivations: Classic Definitions and New Directions. Contemporary Educational Psychology 2000, 25, 54–67. [Google Scholar] [CrossRef]
- Schonfeld, I.S.; Verkuilen, J.; Bianchi, R. Inquiry into the correlation between burnout and depression. Journal of Occupational Health Psychology 2019, 24, 603–16. [Google Scholar] [CrossRef]
- Seok, B.W.; Wee, K.H.; Park, J.Y.; Anil Kumar, D.; Reddy, N.S. Modeling the teacher job satisfaction by artificial neural networks. Soft Computing 2021, 25, 11803–15. [Google Scholar] [CrossRef]
- Conlon S, Simmons L, Liu F. Predicting Tech Employee Job Satisfaction Using Machine Learning Techniques Sumali J. Conlon1 Lakisha L. Simmons2 Feng Liu3. International Journal Of Management & Information Technology 2021, 16, 97–113.
- Fallucchi, F.; Coladangelo, M.; Giuliano, R.; William De Luca, E. Predicting Employee Attrition Using Machine Learning Techniques. Computers 2020, 9, 86. [Google Scholar] [CrossRef]
- Nabais, A.R.; Chambel, M.J.; Carvalho, V.S. Unravelling Time in Higher Education: Exploring the Mediating Role of Psychological Capital in Burnout and Academic Engagement. Education Sciences 2024, 14, 663. [Google Scholar] [CrossRef]
- Sancoko, S.; Yuliawan, R.; Al Aufa, B.; Yuliyanto, H. The effects of job satisfaction on lecturer performance : case study in faculty x Universitas Indonesia. Jurnal Pendidikan Teknologi dan Kejuruan 2023, 29, 45–58. [Google Scholar] [CrossRef]
- Kartol, A.; Üztemur, S.; Griffiths, M.D.; Şahin, D. Exploring the interplay of emotional intelligence, psychological resilience, perceived stress, and life satisfaction: A cross-sectional study in the Turkish context. BMC Psychology 2024, 12. [Google Scholar] [CrossRef]
Figure 1.
Descriptive Graphs: (a) Bar chart for Job Satisfaction according to ET-NIA and GEN; (b) Box plot between Job Satisfaction and CHILDREN; (c) Bar chart for Job Satisfaction according to ET-NIA and GEN.
Figure 1.
Descriptive Graphs: (a) Bar chart for Job Satisfaction according to ET-NIA and GEN; (b) Box plot between Job Satisfaction and CHILDREN; (c) Bar chart for Job Satisfaction according to ET-NIA and GEN.
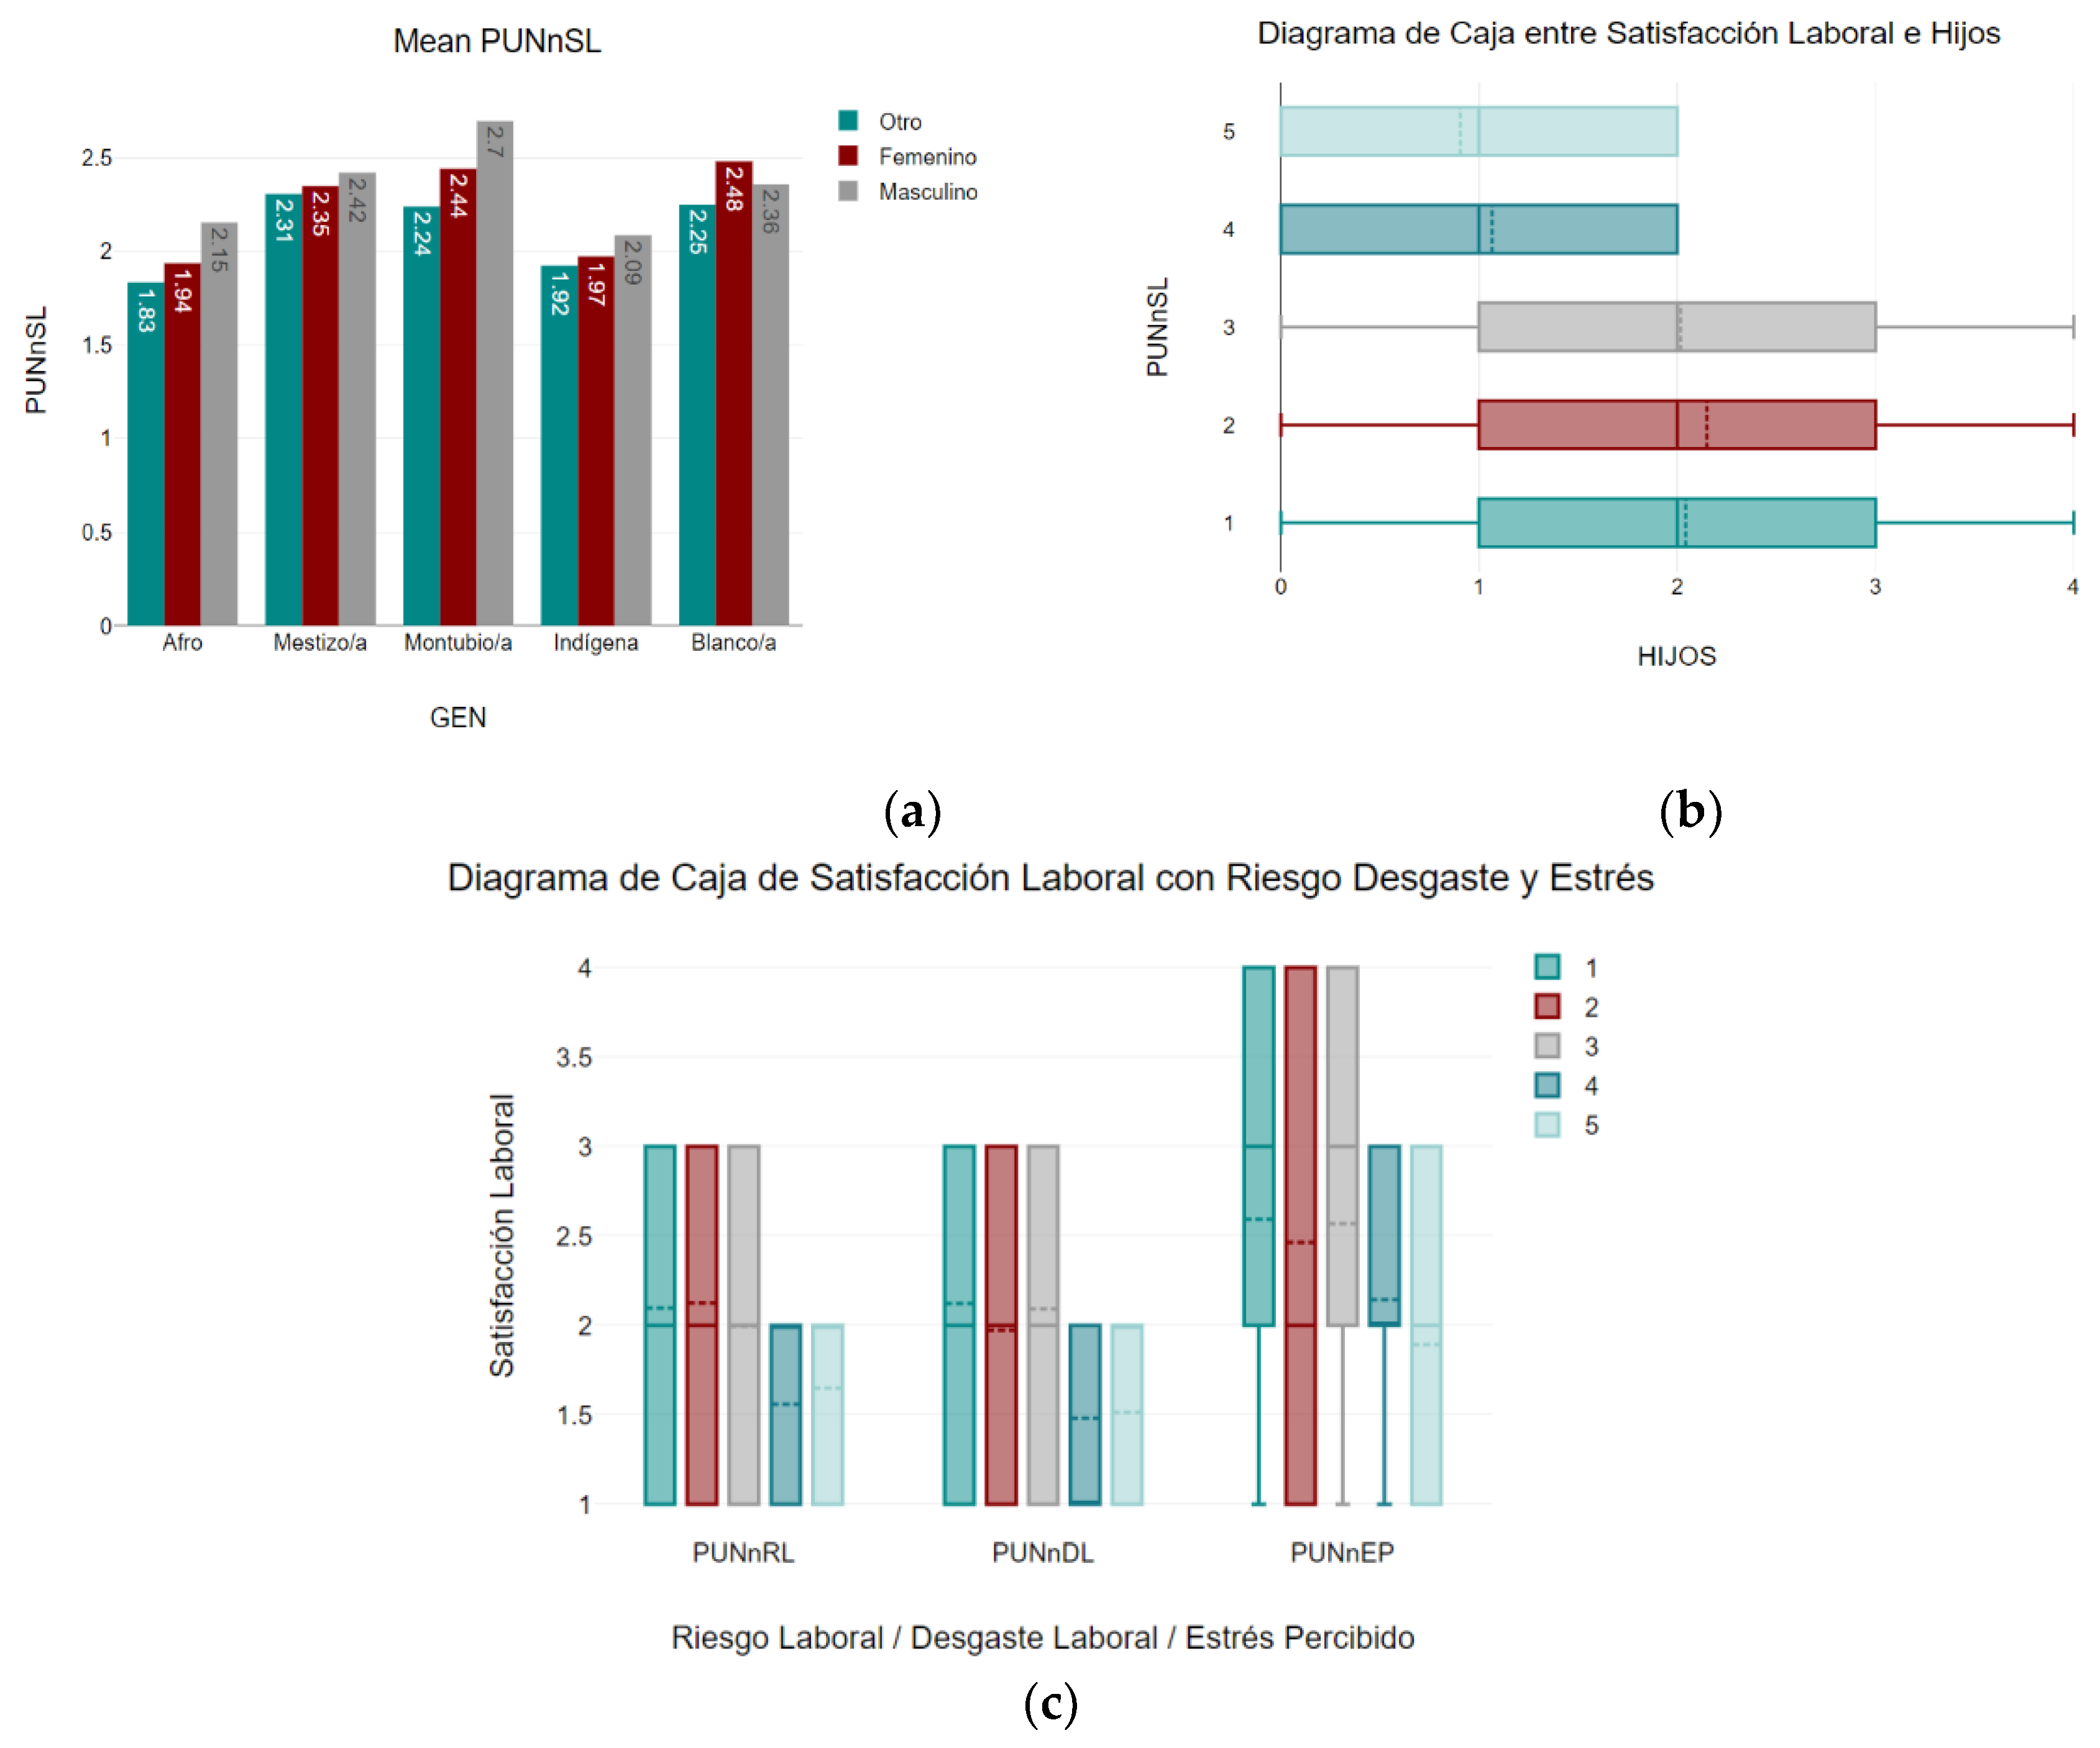
Figure 2.
ROC curve of the neural network model.
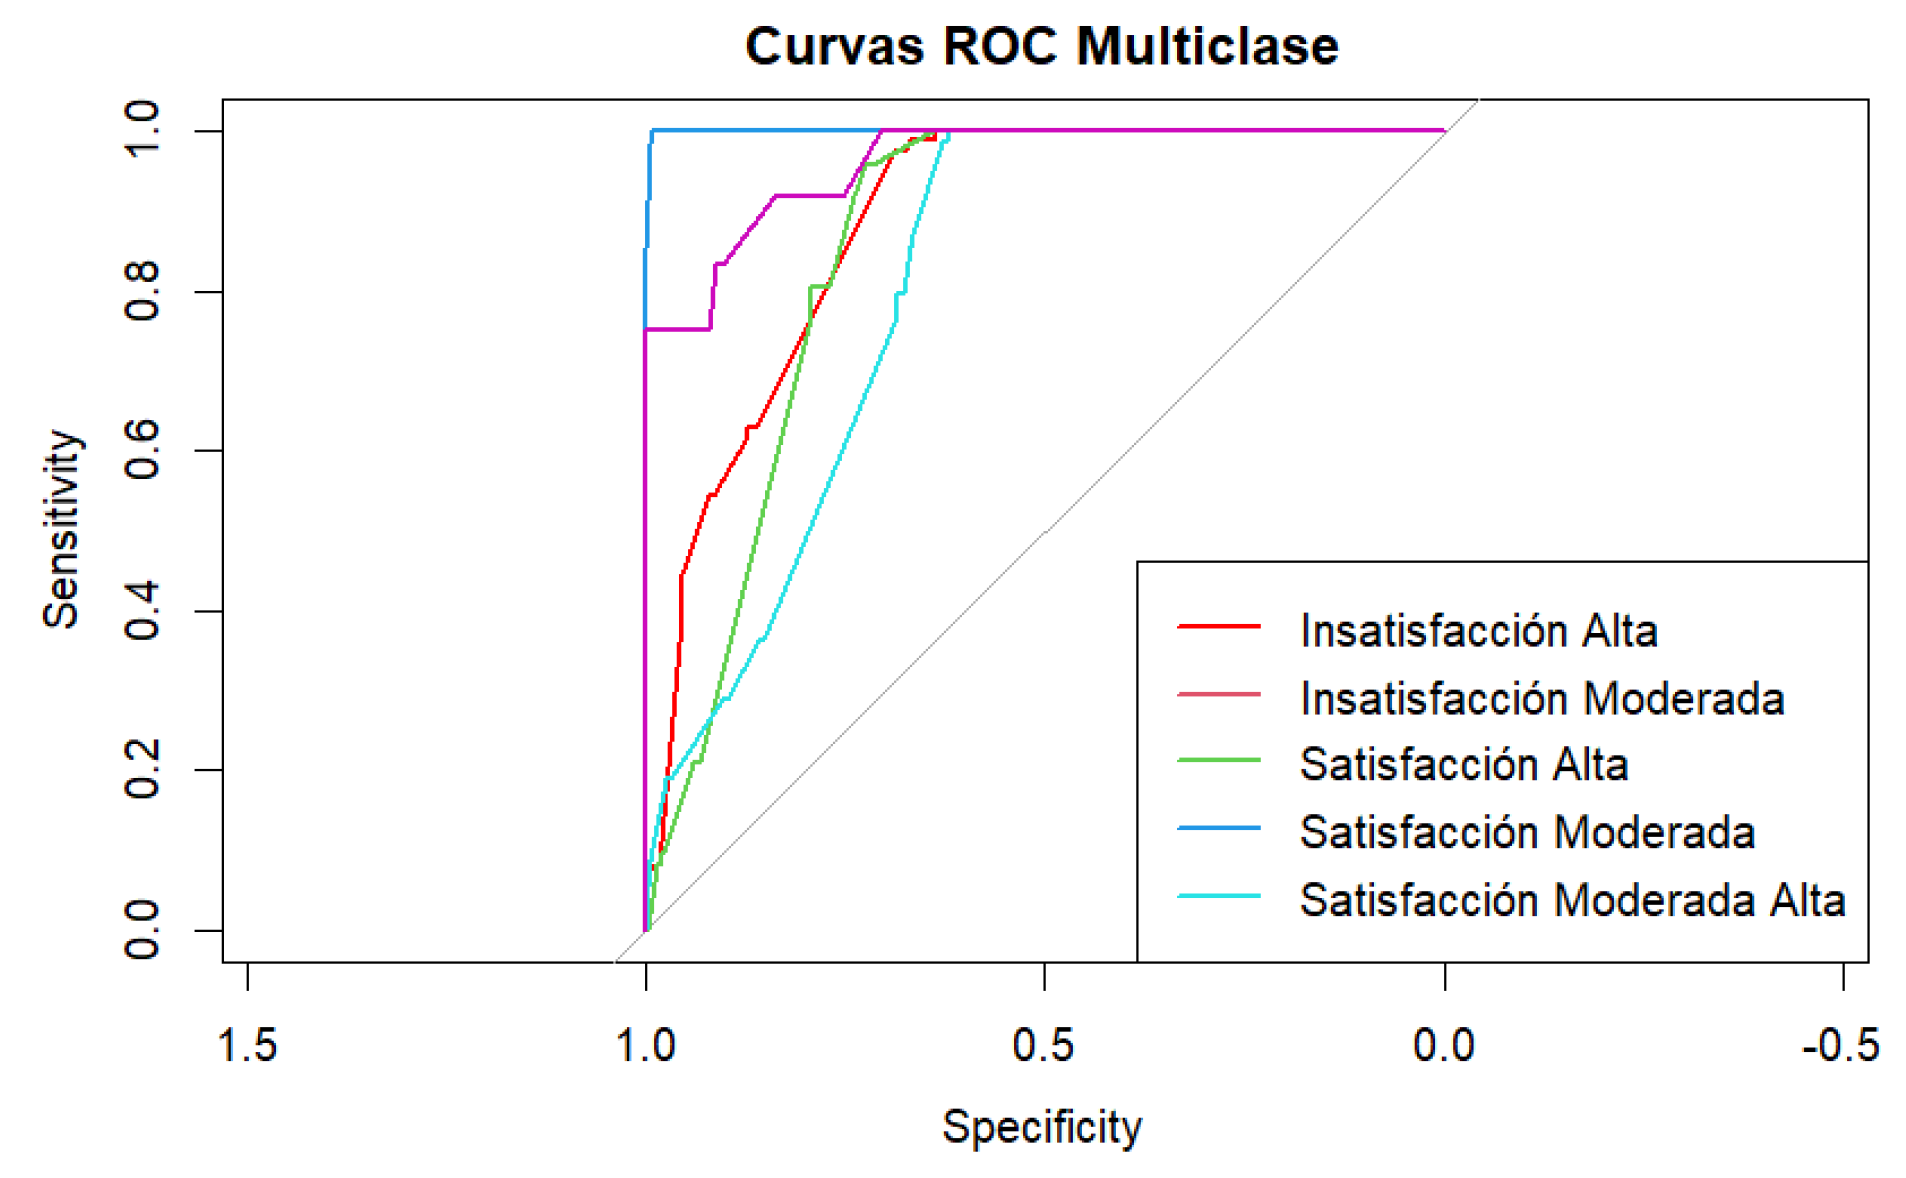
Figure 3.
Importance of characteristics in predicting job satisfaction of university professors.
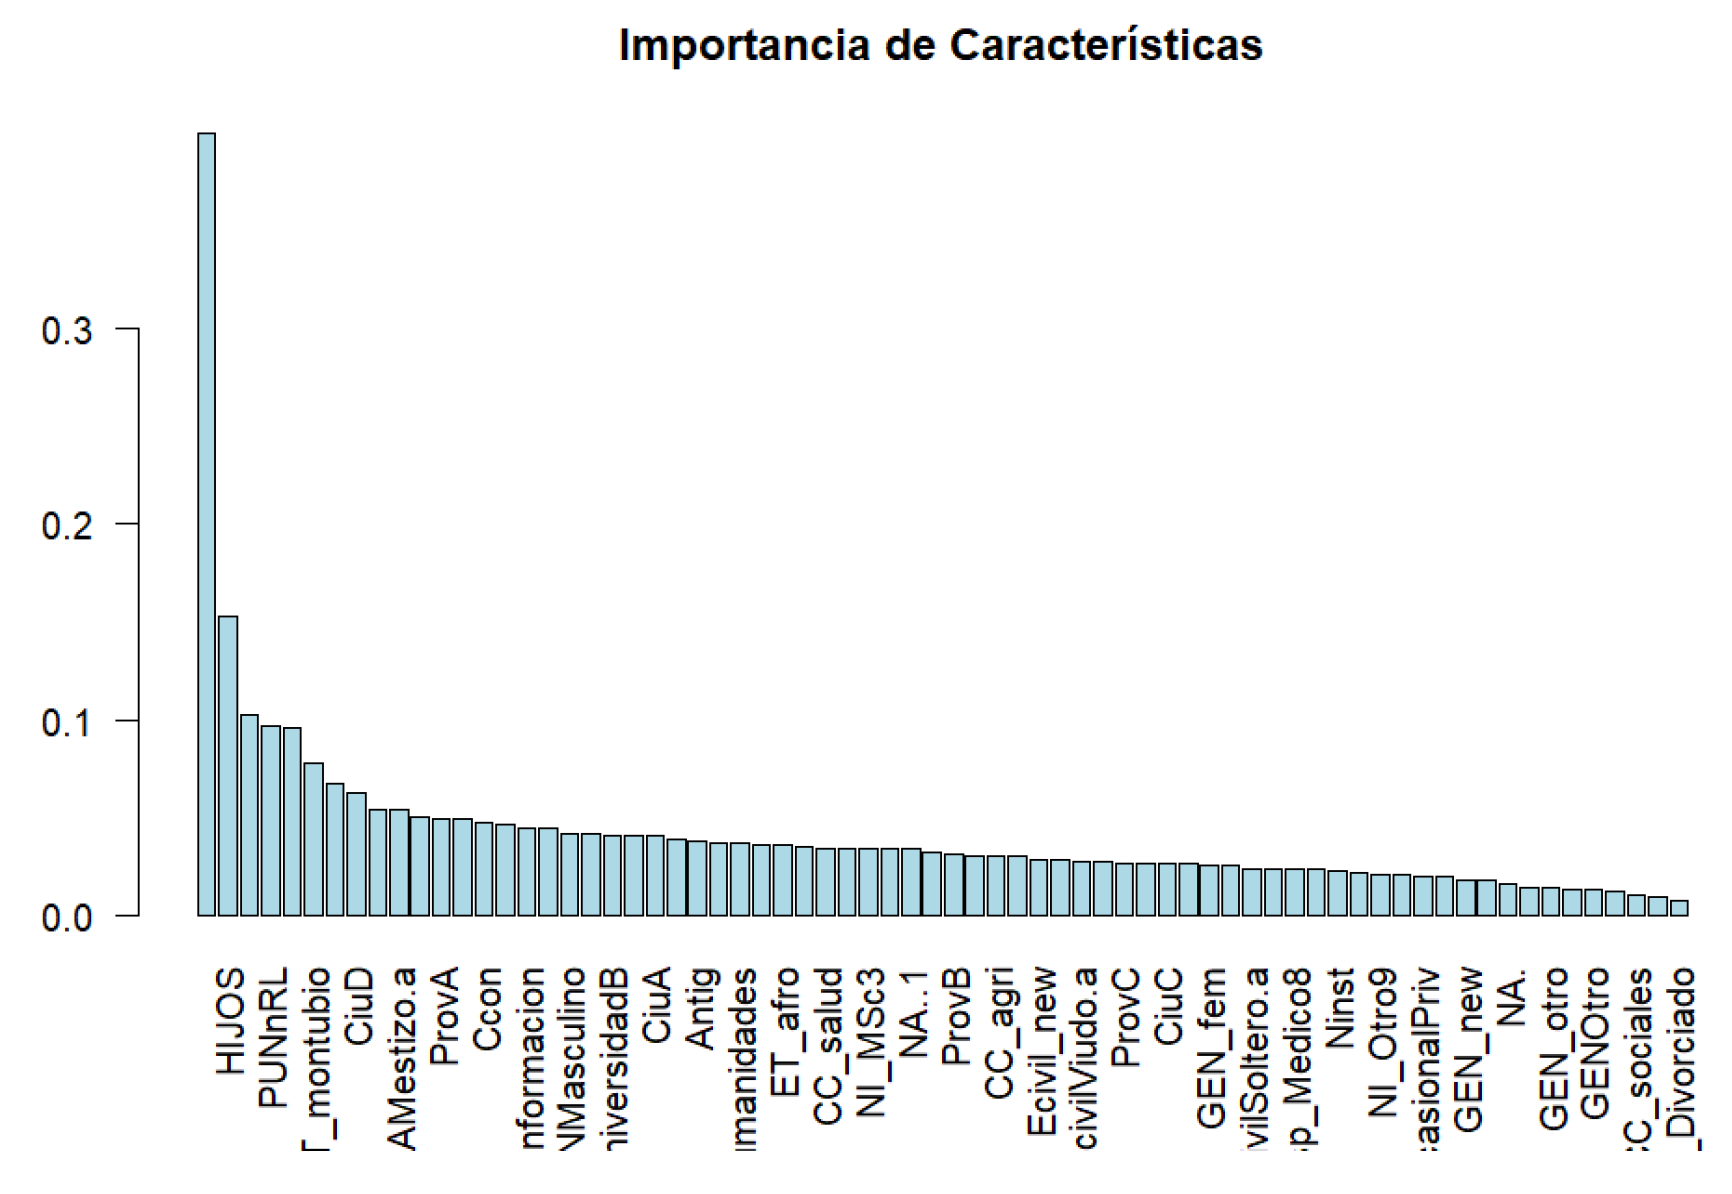

Table 1.
Description of variables used.
| Type | Variable | Label |
|---|---|---|
| Numeric | HIJOS | From 0 to 4 children. |
| Numeric | EDAD | Age 1 is 16 to 24 years; 2 is 25 to 34 years; 3 is 35 to 43 years; 4 is 44 to 52 years; 5 is 53 years and older. |
| Numeric | Antig | Length of service, 1 is 0 to 2 years, 2 is 3 to 10 years, 3 is 11 to 20 years, 4 is 21 years or more. |
| Categoric | Uni | University to which the surveyed university professor belongs, options A,B,C,D. |
| Categoric | Prov | Represents a province of Ecuador of the university teacher surveyed in the university where he/she works options A,B,C,D. |
| Categoric | Ciu | City where the teacher works |
| Categoric | Ecivil | Marital status can be, Single, Divorced, Married, Widowed, Common-law, of the university professor. |
| Categoric | Ninst | Level of education, 1 is Postdoctorate, 2 is Ph.D., 3 is Master’s, 5 is Specialist, 6, 8 is medical specialist, 9 is other. of the respondent at university A,B,C,D. |
| Categoric | ETNIA | Ethnicity with the options: Mes-tizo/a; Indígena; Afro; Blan-co/a; Montubio/a. of the respondent in the university A,B,C,D. |
| Categoric | GEN | Male, female, other. of the survey in university A,B,C,D. |
| Categoric | Ccon | Field of knowledge, where 1 is Natural Sciences; 2 is Engineering and Technology; 3 is Medical and Health Sciences; 4 is Agricultural Sciences; 5 is Social Sciences; 6 is Humanities; 7 is Education; 8 is Communication and Information Sciences. of respondent at university A,B,C,D |
| Categoric | TcLAB | It is the type of contract, 1 is appointment; 2 is indefinite contract, 3 is occasional public contract, 4 is occasional private contract. of the unit A,B,C,D. |
| Categoric | PUNnDL | Represents the labor attrition. 1 is Low; 2 is Moderate; 3 is High. of the respondent at university A,B,C,D |
| Categoric | PUNnEP | Represents perceived stress. 1 is Low Stress; 2 is Moderate Stress; 3 is High Stress, 4 is High Stress. of the respondent in the university A,B,C,D |
| Categoric | PUNnSL1 | Represents job satisfaction. 1 is High Dissatisfaction; 2 is Moderate Dissatisfaction; 3 is Moderate Satisfaction, 4 is Moderate High Satisfaction, 5 is High Satisfaction. of the survey at the university A,B,C,D |
| Categoric | PUNnRL | Represents job satisfaction. 1 is High Dissatisfaction; 2 is Moderate Dissatisfaction; 3 is Moderate Satisfaction, 4 is Moderate High Satisfaction, 5 is High Satisfaction. of the survey at the university A,B,C,D |
1 Variable to predict.
Table 2.
Descriptive Values.
| Var | Cat | Frec | % | Var | Cat | Frec | % |
|---|---|---|---|---|---|---|---|
| Universidad | A | 396 | 24.6 | Etnia | Indígena | 0.0189 | 0.0302 |
| B | 402 | 25.0 | Afro | 0.0183 | 0.0293 | ||
| C | 417 | 25.9 | Blanco/a | 0.1767 | 0.1726 | ||
| D | 385 | 24.0 | Mestizo/a | 0.2067 | 0.1983 | ||
| Provincia | A | 418 | 26.0 | Montubio/a | 0.8363 | 0.8130 | |
| B | 366 | 22.8 | Género | Femenino | 758 | 47.4 | |
| C | 424 | 26.4 | Masculino | 793 | 49.6 | ||
| D | 392 | 24.4 | Otro | 49 | 3.0 | ||
| Ciudad | A | 370 | 23.0 | Hijos | Media | 1.969 | - |
| B | 433 | 26.9 | Edad | Media | 3.004 | - | |
| C | 385 | 23.9 | Ccon | 3 | 217 | 13.5 | |
| D | 412 | 25.6 | 2 | 207 | 12.9 | ||
| Estado Civil | Casado/a | 293 | 18.2 | 4 | 207 | 12.9 | |
| Unión de Hecho | 309 | 19.2 | 1 | 204 | 12.7 | ||
| Divorciado/a | 350 | 21.8 | 6 | 200 | 12.4 | ||
| Soltero/a | 329 | 20.4 | 8 | 200 | 12.4 | ||
| Viudo/a | 319 | 19.8 | Otros | 365 | 22.7 | ||
| Instrucción | 1 | 225 | 14.0 | PUNnRL | Media | 2.029 | - |
| 2 | 205 | 12.7 | TcLAB | 1 | 403 | 25.0 | |
| 3 | 235 | 14.6 | 2 | 374 | 23.3 | ||
| 5 | 235 | 14.6 | 3 | 415 | 25.8 | ||
| 6 | 212 | 13.2 | 4 | 408 | 25.4 | ||
| 8 | 225 | 14.0 | Antig | Media | 2.536 | - | |
| 9 | 263 | 16.3 | PUNnDL | Media | 2.007 | ||
| PUNnSL | Media | 2.231 | - | PUNnEP | Media | 2.491 | - |
Var=Variable, Cat=Category, Freq=Absolute Frequency, %=Percentage.
Table 3.
Comparison of Classification Models: Descriptive Values and Evaluation Statistics.
| Method | Accuracy | 95% CI | No Information rate (Tasa de No-Information) | P-Value [Acc > NIR] | Kappa | Mcnemar’s Test P-Value | AUC Score | Precision | Recall | F1 Score |
|---|---|---|---|---|---|---|---|---|---|---|
| Regresión logística multinomial | 42.42% | (0.3803, 0.4691) | 20% | P < 2e-16 | 0.2803 | 0.06781 | 0.79975 | 0.416892 | 0.424242 | 0.418694 |
| K-Nearest Neighbors (KNN) | 49.49% | (0.45, 0.5399) | 20% | P < 2.2e-16 | 0.3687 | 4.001e-15 | 0.686868 | 0.448025 | 0.498989 | 0.458717 |
| Naive Bayes | 25.86% | (0.2205, 0.2995) | 20% | P < 0.000931 | 0.0732 | P < 2.2e-16 | 0.536616 | 0.251783 | 0.258585 | 0.192793 |
| Árbol de Decisión | 0.5778 | (0.5329, 0.6217) | 20% | P < 2.2e-16 | 0.4722 | NA | 0.846015 | 0.578933 | 0.577777 | 0.577813 |
| Modelo de Máquina de Vectores de Soporte SVN | 58.38% | (0.539, 0.6277) | 20% | P<2.2e-16 | 0.4798 | NA | 0.847515 | 0.588130 | 0.583838 | 0.584808 |
| Regresión Logística Ordinal | 33.25% | (0.3094, 0.3562) | 0.3119 | P<0.0403 | 0.0475 | NA | 0.523898 | 0.345042 | 0.332500 | 0.308198 |
| Red Neuronal Artificial | 74.84% | (0.7068, 0.7869) | 0.5053 | P < 2.2e-16 | 0.6229 | NA | 0.929890 | 0.730435 | 0.748414 | 0.724373 |
| Clasificación Ordinal mediante Random Forest | 62.02% | (0.5758, 0.6631) | 0.2 | P < 2.2e-16 | 0.5253 | NA | 0.855100 | 0.615891 | 0.620202 | 0.617414 |
95% CI= 95% confidence interval.
Disclaimer/Publisher’s Note: The statements, opinions and data contained in all publications are solely those of the individual author(s) and contributor(s) and not of MDPI and/or the editor(s). MDPI and/or the editor(s) disclaim responsibility for any injury to people or property resulting from any ideas, methods, instructions or products referred to in the content. |
© 2024 by the authors. Licensee MDPI, Basel, Switzerland. This article is an open access article distributed under the terms and conditions of the Creative Commons Attribution (CC BY) license (http://creativecommons.org/licenses/by/4.0/).
Copyright: This open access article is published under a Creative Commons CC BY 4.0 license, which permit the free download, distribution, and reuse, provided that the author and preprint are cited in any reuse.


