
Submitted:
11 November 2024
Posted:
13 November 2024
You are already at the latest version
Abstract
Bioinformatics is a rapidly evolving field charged with cataloguing, disseminating, and analyzing biological data. Bioinformatics started with genomics, and the distinction remains a source of confusion, but while genomics focuses more narrowly on the genes comprising a genome, bioinformatics now encompasses a much broader range of omics technologies. Overcoming barriers of scale and effort that plagued earlier sequencing methods, bioinformatics adopted an ambitious strategy involving high-throughput and highly automated assays. However, as the list of omics technologies continues to grow, the field of bioinformatics has changed in two fundamental ways. Despite enormous success in expanding our understanding of the biological world, the failure of bulk methods to account for biologically important variability among cells of the same or different type has led to a major shift towards single-cell and spatially resolved omics methods, which attempt to disentangle the conflicting signals contained in heterogeneous samples by examining individual cells or cell clusters. The second major shift has been the attempt to integrate two or more different classes of omics data in a single multimodal analysis to identify patterns that bridge biological layers. For example, unraveling the cause of disease may reveal a metabolite deficiency caused by failure of an enzyme to be phosphorylated because a gene is not expressed due to aberrant methylation as a result of a rare germline variant. Conclusions: There is a fine line between superficial understanding and analysis paralysis, but like a detective novel, multi-omics increasingly provides the clues we need if only we are able to see them.
Keywords:
bioinformatics
; epigenomics
; transcriptomics
; proteomics
; metabolomics
; lipidomics
; glycomics
; single-cell RNA sequencing
; spatially resolved transcriptomics
1. Introduction
With few exceptions, each cell in the human body contains its own complete copy of the genome, but cells can vary enormously in terms of morphology, composition, and longevity. The Human Cell Atlas defines at least 300 distinct cell types [1], and cell morphology and metabolic activity can vary over time and spatial orientation even among cells of the same type. Characterizing these differences is essential within the field of medicine, especially in terms of drug development. Despite sharing the same underlying DNA, the repertoire of genes available to cells of each type is limited as a result of epigenetic changes such as methylation and acetylation. Many genes are only expressed in the presence of external growth factors, and expression of numerous genes is tightly regulated in response to environmental conditions within and outside of the cell. Measuring gene expression (genomics, transcriptomics, and epigenomics) within homogenous samples provides valuable insight into the cell, but it does not provide a complete picture. Measuring the expression level of a protein-coding gene is not same as quantifying the translated protein (proteomics), and the function of many proteins is further influenced by post-translational modifications such as phosphorylation (phosphoproteomics) and glycosylation (glycomics and glycoinformatics). Furthermore, the presence of an enzyme is not evidence of its activity, and the presence of expected metabolites or lipids should be confirmed directly (metabolomics and lipidomics). Given this vast range of available omics methods, which one(s) should be selected? The flippant answer, as many as possible, is often impractical due to the combinatorial costs as well as technical limitations, such as sample volume or quality. Nonetheless, it is likely that some as-yet-unimagined properties of life can only be perceived across biological levels (Figure 1).
2. Omics Methods
2.1. Genomics
As the National Human Genome Research Institute proclaims, the Human Genome Project (HGP) was “one of the greatest scientific feats in history.” Launched in 1990 and completed in 2003, the HPG remains one of largest ever international scientific collaborations spanning six nations at a cost of $2.7 billion. The pioneering sequencing efforts fueled innovation at every level, from sequencing technologies to data storage and software development, and the human reference sequence continues to form the foundation of modern bioinformatics. However, the project ended in 2003 with the lingering sense that the human genome laid bare was not the open book some had expected [2]. Annotation of the human genome is an ongoing, long-term effort and has been updated numerous times. The latest genome assembly is T2T-CHM13v2.0 [3], although Genome Reference Consortium Human Build 38 (GRCh38 or hg38), first released in 2013 and even Build 37 (GRCh37 or hg19), first released in 2009, are still widely used, partly due to incompatibility between the coordinates used among the major releases.
2.1.1. Hierarchical Shotgun Sequencing
The human genome was sequenced using hierarchical shotgun sequencing, a laborious process in which the genome was broken into 150-200kb fragments cloned into bacterial artificial chromosomes. Amplified sequences were then further fragmented and sequenced using Sanger sequencing across multiple laboratories.
2.1.2. Sanger Sequencing
In this chain termination method, the complementary DNA strand is synthesized with the addition of a small number of fluorescently-labeled nucleotides modified to prevent further chain extension. In principle, this should produce chains that terminate at each position along the sequence. The original DNA sequence can therefore be reconstructed by sorting the fragments by size on an electrophoretic gel and reading the order of the fluorescent labels.
2.1.3. Next-Generation Sequencing
While the HGP was able to sequence multiple fragments in parallel through careful planning and coordination, this approach has been superceded by massively parallel sequencing (next-generation sequencing), which is capable of generating multiple reads in parallel during the same sequencing run using a method called sequencing by synthesis. Libraries are created by extracting and PCR amplifying sample DNA, and the addition of each type of nucleotide is monitored during synthesis of the complementary strand. This method produces a large number of relatively short reads. In paired-end sequencing, overlapping forward and reverse reads with a fixed offset are used to aid assembly.
2.1.3.1. Bioinformatics Methods for Next-Generation Sequencing
Although NGS methods improved the speed and cost of sequencing, there is a tradeoff. The large number of short reads requires stringent quality control steps. Reads are exported as FASTQ files that contain not only the sequence but the location of the read on the flow cell as well as a phred quality score that indicates the probability of an incorrect base call at each position. Tools like FastQC and Trimmomatic [4] are used to remove adapters, exclude chimeric reads, and trim low-quality sequences from the ends. Newly sequenced genomes require reads to be assembled without reference to an existing genome sequencing using methods such as greedy algorithms and De Bruijn graphs. Popular de novo assemblers include ABySS [5], Trinity [6], SPAdes [7], and Velvet [8], SOAPdenovo2 [9].
When a reference genome is already available, tools such as BWA [10] and Bowtie2 [11] are used to align each read to the reference sequence. This problem is computationally challenging due to the large number of reads, the presence of reads that should map in the correct orientation on both the forward and reverse strands, the potential for insertions and deletions, and the potential of reads from non-unique regions of the genome to map equally well to two or more locations. Aligned reads are stored in a Sequence Alignment Map (SAM) file, which is normally compressed in an indexed binary format (BAM and BAI files) using samtools [12]. BAM files can be visualized using genome viewers such as Integrative Genomics Viewer [13] and Tablet [14], which provide information on the sequencing depth and consensus sequence as well as the CIGAR string for each read. Once reads are aligned to the reference sequence, variant calling is performed using tools such as Bcftools mpileup or GATK HaplotypeCaller, and differences from reference alleles are saved in Variant Call Format (VCF) files. Variant calling is highly dependent on the local alignment at each position, but the Genome Analysis Toolkit provides best practices and tools to improve variant calling accuracy [15].
2.1.4. Third-Generation/Long-Read Sequencing
The reference genome published in 2003 was 92% complete, but numerous gaps remained consisting of long stretches of highly repetitive DNA that could not be sequenced with the technology of the time. The last remaining gaps were only completed in 2022 [3] with the aid of long-read sequencing methods pioneered by Pacific Biosciences and Oxford Nanopore Technology. Nanopore sequencing works by measuring the changes in an electrical field as a DNA sequence passes through a microscopic pore. This method is less precise than short-read sequencing but produces much longer reads, between 10 kilobases and 1 megabase under certain conditions. Nanopore sequencing can also be performed using inexpensive flowcells on small portable devices such as MinION, which contributed greatly in efforts to monitor SARS-CoV-2 [16,17]. Despite these advantages, long-read sequencing is unlikely to supplant short-read sequencing, and hybrid methods provide the best of both worlds by using ultra-long-read sequencing for scaffolding paired with short read mapping to improve accuracy.
2.1.4.1. Bioinformatics Methods for Nanopore Sequencing
Long-read sequencing requires different approaches and software than short-read sequencing. Base-calling the raw output from Nanopore sequencers requires specialized tools, such as Guppy and Bonito. Quality control software such as NanoPack [18] and porechop [19] contain methods for plotting and filtering long-read data and removing chimeric reads. Canu [20] and Flye [21] perform de novo assembly, and Minimap2 [22] and NGMLR [23] map reads to a reference genome. The higher error rate is a known limitation of Nanopore sequencing, but error correction tools like Nanopolish [24] and Medaka make use of information contained in the raw signal data to recalibrate base calls and polish assemblies. Medaka can also be used for variant-calling, along with tools such as Longshot [25], Pepper-Margin-DeepVariant [26], and Sniffles [23].
2.1.5. Public Repositories of Genomic Data
2.1.5.1. DNA Sequence Databases
Most genomic data in the public domain is managed by the International Nucleotide Sequence Database Collaboration (INSDC) [27], which includes GenBank, the European Molecular Biology Laboratory (EMBL) Nucleotide Sequence Database, and the DNA Data Bank of Japan (DDBJ). Sequence data is carefully annotated and cross-referenced and can be queried and exported in multiple ways. The University of California, Santa Cruz (UCSC) Genome Browser also provides useful tools for genome visualization with fine-grained control over tracks.
2.1.5.2. DNA Variant Databases
The human reference genome is haploid sequence that does not represent the genome of any single person but serves as a coordinate system and point of reference. A number of projects have attempted to assess the range of variation among individuals within and among populations, including the Human HapMap project [28], the 1000 Genomes project [29], the UK Biobank [30], and All of US [31], the last of which aims to include a diverse group of more than a million people in the United States. Information gleaned from these databases is widely used in genome-wide association studies to identify germline variants associated with disease risk, response to treatment, personalized medicine, etc. [32]. In cancer genome profiling, tools such as Mutect2 [33] can be used to identify somatic variants that appear in paired tumor-normal sequencing and that are uncommon in the general population. Packages such as SnpEff [34] can be used to predict the potential effect of single nucleotide variants on coding sequences and compared to known variants by querying databases such as ClinVar [35].
2.2. Epigenomics
Many bioinformatics studies compare gene expression levels in samples under different condition using RNA sequencing or transcriptomics, but fundamental insight may also be gained by examining the epigenetic modifications such as DNA or histone methylation or histone acetylation that influence the extent to which a gene is accessible to transcription machinery within the target sample. Epigenetic regulation is a crucial aspect of developmental biology, and epigenetic dysregulation is a common characteristic of many diseases such as cancer and is important in the development of novel treatments [36].
An advantage of Nanopore sequencing is that passage of methylated DNA through the nanopore opening creates a signature that can be interpreted from raw signal data using tools such Nanopolish [24] and Tombo [37].However, a number of dedicated epigenomics methods have also been developed, including bisulfite sequencing and methylated DNA immunoprecipitation sequencing to characterize patterns of DNA methylation and ATAC-Seq, DNase-seq, and ChIP-seq to identify regions of chromatin accessible to transcription machinery. Tools for epigenomics analysis include Bismark [38] and MethylKit for bisulfite sequencing [39], MACS [40] for ChIP-seq data, and HMMRATAC [41] and Signac [42] for chromatin accessibility studies. The Encyclopedia of DNA Elements (ENCODE) project is an ambitious international collaboration that set out to catalog the functional elements within the human genome [43]. The UCSC Genome Browser includes a number of ENCODE tracks transcription factor binding sites, DNase hypersensitivity, and histone marks that can aid interpretation of gene expression data.
2.3. Transcriptomics
Genomics provides invaluable insight into genetic variation among individuals as well as within heterogeneous tissue such as tumors, but the information only reveals an organisms genetic POTENTIAL. The transcriptome provides much more direct insight into which genes and transcripts are being actively expressed. Cells contain an enormous amount and variety of RNA, including messenger RNA, ribosomal RNA, transfer RNA, micro RNA, small nuclear RNA, small nucleolar RNA, PIWI-interacting RNA, long-non-coding RNA, etc. As only mRNA and miRNA are generally of most interest, this large excess poses a challenge and may be removed prior to sequencing. Mapping mRNA back to the genome for identifying and counting also poses a challenge due to splice junctions. Tools such as Salmon [44] skirt this problem by mapping reads to a transcriptome consisting of known transcripts, but this method is only suitable for known splice junctions. Popular splice-aware tools such as STAR [45], Tophat2 [46], and HISAT2 [47] map reads directly to the reference sequence based on genome annotations.
A major goal of transcriptomics is to compare gene expression under different conditions. As sequencing run acts as a batch effect, it is advantageous to run as many samples as possible within the same sequencing run. Barcoding makes this possible by including a short lane-specific barcode sequence within the adaptor. During the quality control stage, sequence reads are first demultiplexed and labeled. Popular differential gene expression tools such as Limma-voom [48], DEseq2 [49], and edgeR [50] compare expression levels by sample each transcript and calculate a p-value and fold-change. The tools vary in the details, but each tool takes into account factors such library size, RNA length, and multiple testing to minimize confounding factors. However, RNA-Seq is a relative measure and it is difficult to compare expression levels across experiments. RNA-Seq also provide insight into alternative splicing using tools such as rMATS [51] and DEXSeq [52].
Aside from reporting up- and down-regulated genes, many studies perform some form of pathway or functional analysis using tools such as GSEA [53], DAVID [54], or Panther [55] to identify overrepresented pathways or gene ontology terms. Pathway data can be visualized using KEGG Mapper KEGG [56] and Cytoscape [57]. Unsupervised methods can also provide powerful insight into RNA-Seq data. Dimension reduction techniques such as PCA, t-SNE, and UMAP help to identify structure within the data and reveal outliers. Weighted gene correlation network analysis using WGCNA [58] uses hierarchical clustering to classify genes into clusters and identify eigengenes or hub genes associated with experimental conditions, which can serve as targets for further experimentation.
2.4. Proteomics
While transcriptomics is essential for elucidating regulatory pathways, it is a mistake to assume that gene expression levels accurately reflect the actual protein levels. In mammals, only about 30-40% of the variation in protein levels is associated with corresponding mRNA levels, highlighting the importance of post-transcriptional and post-translational regulation [61]. The goal of proteomics is to identify and quantify the proteins present in a sample as well as to determine protein structure, function, and interactions [62]. Cells are lysed, and proteins are extracted and digested into smaller peptides. Proteins can be separated based on properties such as charge and mass using methods such as gel electrophoresis and liquid chromatography. Peptides are ionized using electrospray ionization or matrix-assisted desorption/ionization and then separated based on mass-to-charge ratio in a mass analyzer. Proteins are identified and quantified by comparing spectrum peaks against a database of theoretical spectra such as using software such as MaxQuant [63], MSstats [64], and PRIDE (Proteomics Identification Database) [65]. As with gene expression data, differential protein abundance data can be analyzed using pathway and functional analysis tools such as KEGG [56], DAVID [54], and Reactome [66]. Protein-protein interactions networks can be analyzed using STRING [67].
2.4.1. Public Repositoris for Protein Data
UniProt is the primary database for protein sequence data and contains both automatically annotated sequences in UniProtKB/TrEMBL as well as expertly curated and experimentally verified protein data in UniProtKB/Swiss-Prot. The Human Protein Atlas is another important database dedicated to mapping all human proteins by organ, tissue, and cell type [68].
2.4.2. Protein Structure Prediction
The three-dimensional structure of a protein is also critically important and is often only solved after laborious efforts spanning months or years. Protein structures are stored in the RCSB Protein Data Bank [69]. Although the structures of novel proteins can be predicted using homology modeling using tools such as Swiss-Model [70], accuracy is often low. Protein structure prediction has long remained an open challenge even with state of the art tools, but this changed dramatically following the introduction of the advanced machine learning tool AlphaFold [71]. Predicted structures for over 214 million proteins have also been deposited in the AlphaFold Protein Structure Database [72].
2.4.3. Post-Translational Modifications
Analysis of protein data includes an additional layer of complexity due to the more than 650 known forms of post-translation modification, including phosphorylation, glycosylation, ubiquitination, methylation, acetylation, and SUMOylation [73]. Up to two-thirds of all proteins are thought to undergo phosphorylation, in which a phosphate group is reversibly added to a serine, threonine, or tyrosine residue [74]. Phosphoproteomics is an important branch of proteomics that can provide additional insight about protein function, such as identification of drug targets within signal transduction pathways. Phosphoproteins in the sample are enriched using affinity purification followed by mass spectrometry [75].
2.5. Glycoinformatics
More than half of all proteins are also thought to be glycosylated, in which a sugar moiety called a glycan is attached to an asparagine (N-linked glycoproteins) residue or to a serine or threonine residue (O-linked glycoproteins) [76] Glycosylation plays underappreciated roles in protein folding, cell-cell interactions, and immune regulation, and aberrant glycosylation has been implicated in autoimmune diseases and cancer [77].
Glycomics is the study of the diversity of glycan structures, while glycoinformatics is a branch of bioinformatics tasked with the storage, visualization, and analysis of glycan data. Unlike genes and proteins, glycans cannot be encoded directly as a linear sequence but rather is formed by the coordinated activity of numerous glycosyltransferases in different compartments within the cell.
Glycan structures are determined by releasing, labeling, and separating glycan chains followed by mass spectroscopy or nuclear magnetic resonance spectroscopy and comparing spectra with known glycan databases such as GlyTouCan [78] and UniCarbKB [79]. Lectin arrays are another approach to glycan identification, which takes advantage of the high binding affinity and specificity of lectins for specific glycan structures [80]. A number of databases and tools attempt to integrate glycan data, including GlycoPOST [81], the GlyCosmos Portal [82], GlyGen [83], and Glycomics@Expasy [84].
2.6. Metabolomics
If a cell’s DNA represents the backdrop and the RNA and proteins the actors, then the cell’s metabolites are the dialogue of a given scene. Metabolomics is the comprehensive analysis of metabolites in a specimen, yielding unprecedented insight into internal biochemical activity and “chemical fingerprints” of cellular processes [85]. Metabolites are small molecules that often serve as intermediates or end products in metabolic pathways, including simple sugars, fatty acids, amino acids, nucleotides, vitamins, and organic acids. Of particular concern in capturing metabolomics data is rapid collection and storing of samples to preserve the state of metabolic reactions. A combination of polar and non-polar solvents, filtration, centrifugation, separation by chromatography or electrophoresis, and chemical modification to improve volatility or stability may be needed to extract biochemically diverse metabolites. Identification involves mass spectrometry or nuclear magnetic resonance and comparison of peaks against known spectra and annotation using databases such as the Human Metabolome Database [86] and the Small Molecule Pathway Database [87]. Experimental data is also contained within the MetaboLights database [88].
2.6.1. Lipidomics
While metabolomics mainly focuses on hydrophilic polar compounds, lipidomics is a branch of metabolomics that focuses on hydrophobic nonpolar compounds such as fatty acyls, glycerophospholipids, sphingolipids, and other lipids [89]. Tools for lipidomics analysis include Mzmine [90] and MS-DIAL 4 lipidome atlas [91]. Metabolites may be labeled with identifiers from HMDB, KEGG, and ChEBI, but lipids such as triacylglycerols, diacylglycerol, phosphatidylcholine, phosphatidylethanolamine, may be sub-classified further based on the number of carbons and double bonds, e.g., PC(40:5). MetaboAnalyst [92] and MetaboDiff [93] are popular tools for differential metabolomics analysis.
2.7. Single-Cell RNA Sequencing
Bulk RNA sequencing is efficient in terms of the scale of sequencing but discards all information about spatial context and variation among cells of the same or different type [94]. This is particular limiting in the analysis of complex samples such as blood and tumor samples.
Even with bulk sequencing, it has long been possible to use barcodes to separate reads based on lane, and single-cell sequencing extends this approach to label individual cells prior to sequencing [95]. First samples are digested and filtered to isolate individual cells. Early methods involved distributing cells within wells on a plate, but newer methods capture cells using microfluidic droplets along with beads containing barcodes and unique molecular identifiers (UMIs). The barcode identifies the cell, while the UMI serves to identify transcripts prior to amplification. Amplified cDNA is sequenced together and then demultiplexed, providing simultaneous sequencing of tens of thousands of cells. As cells are sequenced individually using arbitrary identifiers, it is necessary to use dimension reduction techniques such as T-SNE or UMAP to identify cell clusters for further analysis based on a selected resolution. Although scRNA-Seq is a powerful and increasingly widely-used technique, isolating and labeling individual cells poses practical quality control challenges. Both the sample volume and the number of beads are maintained at relatively low values to reduce the frequency of doublets (wells containing more than one cell or bead).
Although similar in principle to the tools for bulk RNA-Seq, scRNA-Seq has resulted in the development of numerous toolkits for analyze single-cell data. scDblFinder can be used to remove doublets [96], and SingleCellExperiment [97] is a Bioconductor package that can be used to organize experimental data. Seurat [98] is a popular R library for single-cell, spatially resolved, and integrative multimodal analysis. In a typical Seurat workflow, scRNA-Seq data can be downloaded from a public repository, filtered interactively based on sequencing depth, level of mitochondrial DNA, and cell-to-cell variability, normalized and scaled, assigned to clusters, and prepared for differential gene expression analysis. Similarly, SCANPY is a Python toolkit for analyzing scRNA-Seq data and includes methods for preprocessing, visualization, clustering, and differential expression analysis [99]. Although single-cell methods are not able to incorporate spatial data, tools such as Monocle3 [100] can analyze trends over “pseudo-time” using trajectory analysis, useful in studies involving stem cells, for example, in which changes in gene expression profiles among cells reflect underlying transitions in state.
2.8. Spatially Resolved Transcriptomics
Even though single-cell RNA sequencing provides high resolution data at the level of individual cells, it shares one of the same limitations of bulk RNA sequencing: it discards information about the spatial orientation of cells. In some cases, this can affect the interpretation, such as when examining the tumor microenvironment [104], and in tissues such as liver sinusoids, in which hepatocyte activity varies across a gradient from the portal vein to the central vein [105]. Spatially resolved transcriptomics is a flexible technique that can be used to compare gene expression at the level of small clusters of cells, at single-cell resolution, and even subcellular resolution to reveal variation in transcript abundance within different regions of a single cell. Several methods have been developed to incorporate spatial data into the gene expression analysis. For example, RNA molecules can be directly labeled within tissue sections using multiplexed error-robust fluorescence in situ hybridization [106]. Alternatively, tissue samples can be mounted to a glass slide with the spatial coordinates of each region encoded within barcode adapters using the 10x Genomics Visium platform. Hybrid techniques such as Nanostring GeoMX can simultaneously profile RNA and proteins using oligonucleotide tags. Seurat and Scanpy can also be used to analyzed spatially resolved transcriptomics data, and a number of other R and Python tools and frameworks have been developed, including Squidpy [107], Giotto [108], SPATA2 [109], SpatialDE [110], and BayesSpace [111]. Single cell and spatial bioinformatics still face a number of hurdles in terms of cost and complexity and the need for specialized equipment and workflows. Bulk sequencing may yield better results for homogeneous or delicate samples as well as for examining novel transcripts and genes with low levels of expression, but adoption of single cell and spatial methods will continue to grow.
3. Multi-Omics Methods
In the transition from microarrays to RNA-Seq, differential gene expression data is often reported alone as a single-omics study, whereas studies incorporating alternative omics methods such as proteomics and metabolomics often anticipate the logical follow-up question of how observed changes relate to underlying patterns of gene expression. However, researchers may be uncertain how to combine multi-modal data and report them as standalone results. The introduction of single-cell and spatially resolved methods has further exacerbated this difficulty by including additional levels of information that should be taken into account. The challenge of multi-omics is that adding more data is just as likely to obfuscate the underlying signal as it is to clarify it. In the ideal case of vertical integration, multiple forms of omics data are collected from the same samples, but it should also be possible to analyze data collected using different samples (horizonal integration) or even different types of omics methods on different samples (diagonal integration).
3.1. Statistical Approaches to Multi-Omics Analysis
There are many approaches to integration of multi-omics data, but a common theme is to extract higher-level representations using dimension reduction techniques. Methods such as hierarchical clustering, K-nearest neighbors, t-SNE, and UMAP help to simplify analysis and visualization of high-dimensional data and reveal clusters and outliers. The naïve approach to integrating different forms of omics would be to treat the combined data as additional columns in the table in the same way as increasing the number of probes on a microarray, but this approach has a number of statistical pitfalls due to fundamental incompatibilities among the data collected using different omics technologies. However, latent factor analysis using methods such as canonical covariance analysis (CCA), principal components analysis (PCA), and non-negative matrix factorization (NMF), provides a statistically sound way to integrate different forms of data in by reducing the dimensionality of each data set into representative factors based on joint and omics-specific sources of variation. For example, CCA maximizes the correlation among linear combinations of variables between two datasets, while the canonical correlations indicate how much of the variation in one form of omics data is explained by the other. Regardless of the method, preprocessing is an essential step and may involve normalization, scaling, dimension reduction, imputation and filtering. Preprocessing tools are often included with the analysis frameworks but are also available as standalone tools such as MultiAssayExperiment and OmicsData. While examination of differentially expressed genes or proteins/metabolites can be used to identify biomarkers in single-omics analysis, an advantage of CCA is that canonical loadings can be used to identify biomarkers that are informative across molecular levels.
3.2. Partial Least Squares Integration Using mixOmics
MixOmics implements a number of vertical and horizontal multi-omics integration methods as well as offers guidance on how to select the most appropriate approach depending on the goals and limitations of the study [112]. For example, the multivariate integration (MINT) framework can be used to combine multiple datasets that involve the same omics method. Multigroup sparse partial least squares (sPLS) is an unsupervised method, whereas multigroup sparse partial least squares discriminant analysis (sPLS-DA) is a supervised method used for classification. For vertical integration with multi-omics data collected from the same samples, multiblock sPLS can be used for unsupervised analysis, while multiblock sPLS-DA (nicknamed DIABLO) is suitable for supervised analysis.
3.3. Multi-Modal Weighted Correlation Network Analysis with MiBiOmics
However, this table-based method is not the only approach. MiBiOmics [113] extends the weighted gene correlation network analysis concept in the WGCNA package to support both proteomics and metabolomics data sets. Eigen-genes, eigen-proteins, and eigen-metabolites constitute a form of dimension reduction within each omics type by highlighting genes, proteins, and metabolites that best represent a cluster of highly correlated markers within each data set. MiBiOmics then takes this a step further by examining the correlations among each set of eigen-markers, revealing cross-omics patterns. The method is unsupervised but modules can be plotted with user-provided sample data to identify potentially interesting biomarkers. The method also helps to visualize the relationship between omics source and class data and uses multiple co-inertia analysis to identify highly influential biomarkers [114].
3.4. Pathway-Based Multi-Omics Analysis
Nonetheless, a key limitation of these methods is that they ignore the biological context. There are benefits to detecting correlations among cross-omics biomarkers based only count data, but other approaches seek to take into account known functional associations between biomarkers. Tools such as Pathway Commons, PaintOmics [115], and Cytoscape plugins such as cytoscapeOmics and OmicsNet support multi-omics analysis based on biological pathways [116].
3.5. Cloud-Based Tools
Of the multi-omics tools discussed so far, MiBiOmics has an advantage in ease-of-use as a web-based tool. Laboratories often outsource omics data collection and receive a detailed, high-quality analysis of the single-omics results. However, they may the struggle to perform multi-omics analysis themselves and may look to web-based tools as a first step before committing to locals tools with a steeper learning curve. However, MiBiOmics, for example, is not particularly intuitive, requires data to be uploaded in a specific format. It also lacks persistent sessions, a distinct disadvantage in the case long-running analyzes. Galaxy has long been used for online analysis of bioinformatics data and includes workflows for quality control, integration, and analysis of multi-omics data (The Galaxy 2024). Mergeomics is another web-based tool but is oriented more for disease-association studies such as genome-wide association studies, transcriptome-wide association studies, etc. to identify key drivers and predict drug targets [117]. OmicsNet [118] is a network-based tool that provides 2D and 3D graph layouts and provides support for SNP data, from microbiome profiling taxon data, and metabolomics LC-MS peaks data. PhenoMeNal [119] is cloud-based multi-omics platform with support for metabolomics data. The Analyst Suite is a recent multi-omics extension of the popular MetaboAnalyst metabolomics tool [120]. Commercial tools include the Illumina BaseSpace Sequence Hub and Correlation Engine, the Seven Bridges Genomics platform, Google Cloud Life Sciences, AWS Genomics, Microsoft Azure for Genomes, and DNAnexus Apollo.
3.6. Locally-Installed and Desktop Multi-Omics Tools
Moving away from the cloud, installation and use of multi-omics software on the desktop becomes more challenging and/or expensive, although several commercial desktop suites are available, including CLC Genomics Workbench, Partek Genomics Suite, DNASTAR Lasergene, Agilent GeneSpring, OriginPro, and SIMCA. However, aside from the licensing costs, use of commercial desktop tools often requires a powerful desktop computer or workstation and limits portability and collaboration. Commercial tools provided by the omics vender likely provides access to features not available in open source tools, but such tools are also likely to lag behind the rapid pace and innovation of open source software. OmicsSuite aims at this middle ground with an open source desktop application that provides an interface for 175 analysis tasks and integrating more than 300 R and BioJava packages [121].
3.7. Libraries and Command Line Tools
Over time, bioinformaticians are likely to assemble ad hoc pipelines ranging from RMarkdown or Jupyter notebooks to Docker containers, Bash scripts and Snakemake or Nextflow workflows running on AWS or a cluster or supercomputer orchestrated using a grid engine like SLURM. In short, bioinformaticians often prefer using open source Linux command line tools and libraries written in e.g., C++, R, Python or Java that can be chained together and automated in a flexible and reproducible way.
In this context, MixOmics, MiBiOmics, Mergeomics, and OmicsNet all provide R packages or source code, allowing them to be run as part of a workflow, and a vast number of other libraries and packages have also been published. Among the most popular are MOFA2 [122] for multi-omics analysis and MOFA+ [123], which supports single-cell analysis, IMPALA [124], and NetZoo [125]. Other tools include MEFISTO [126], MOMA [127], Omics Notebook [128], Omics Playground [129], SMITE [130], DeepMO: [131], MUON [132], Miodin [133], OmicsIntegrator [134], MOGSA [135], MOGONET [136], and JIVE [137].
3.8. Public Repositories Containing Multi-Omics Data
It is probably safe to assume that data submitted to public repositories still contains interesting findings yet to be found. A number of databases now provide well-annotated data for two or more types of omics methods that can be used for multi-omics analysis, including the ENCODE database, the Cancer Genome Atlas (TCGA) [138], the Human Cell Atlas, the Human Protein Atlas, Gene Expression Omnibus, the Proteomics Identifications Database, ArrayExpress, LinkedOmics, the 1000 Genomes Project, the Clinical Proteomic Tumor Analysis Consortium (CPTAC), the Molecular Taxonomy of Breast Cancer International Consortium (METABRIC), and the CellMiner NCI-60 cell line database [139].
4. Discussion
There is no guarantee that gathering more and different types of data will make a problem easier to solve, and rapid expansion of the omics portfolio brings with it a new set of challenges [140]. Many multi-omics studies likely either become bogged down in analysis paralysis, lost down a rabbit hole of competing tools and methods, or publish too quickly after only a superficial analysis that fails to detect important cross-omics patterns. Both cases represent missed opportunities that tool developers should strive to help avoid by focusing on streamlining the most common use cases and identifying unmet needs among end users. However, while making tools easier and more robust to use will benefit users, ease-of-use is less important than giving users confidence in being able to use the tools and interpret the results, especially when challenged during peer review or a doctoral examination. Open source tools are much less likely to provide up-to-date tutorials, realistic sample data, walkthroughs, cookbooks, videos, frequently asked questions, etc. in the way that commercial tools do, nor are they as likely to include rigorous testing and user input validation to ensure that user data satisfies assumptions made by the software. This is unfortunate as these tools often represent the cutting edge and are sometimes provided as reference implementations of novel algorithms that are eventually incorporated into commercial tools.
Tool developers could also help to improve the design of experiments by providing guidance on how many samples are needed, such as in the MultiPower tool [141], and encourage best practices for handling of normalization, standardization, imputation, variance stabilization, multicollinearity, library size effects, minimum variance thresholds, technical variability, batch effects, outlier detection, independence, confounding, benchmarking, ground truth, and false discovery rate. Effective multi-omics analysis can also be waylaid by misunderstandings regarding nomenclature and ID mapping among databases as well as the differences between hypothesis generation versus validation, a priori versus a posteriori tests, and supervised versus unsupervised methods. Developing integrated tool suites and well-supported best practices similar to the GATK should help researchers to publish meaningful and reproducible studies.
5. Conclusions
The future of bioinformatics appears encouraging, with rapid innovation in the diversity and resolution of omics data and the development of new analysis tools. The next stage will likely see rapid growth of multi-omics databases and greater flexibility for end users through cloud-based tools based on open source R and Python packages and improved reproducibility and scalability using Docker containers, Jupyter notebooks, and workflow scripts. Considering the enormous impact that artificial intelligence and deep learning methods have had in nearly every field, the use of AI in bioinformatics is also increasingly widespread, marking important advances in gene prediction, variant calling, literature mining, and drug discovery, etc. [142]. The adoption of deep-learning approaches may be difficult to distinguish from more traditional multivariate analysis methods already in use, but the breakthroughs achieved by AlphaFold2 will likely to inspire a rapid wave of innovation in this area. One of the most exciting areas of AI adoption is radiomics, in which deep learning features extracted from medical imaging data such as MRI, CT, and PET are combined with clinical data and other omics data to yield unprecedented insight into disease and clinical outcomes [143]. Ultimately, the goal of multi-omics is to provide a more nuanced insight into the incredible complexity of the world within the cell. At first glance, the image appears obscure and incomprehensible, but like shadows on a screen, it is often a matter of perspective.
Author Contributions
All authors have read and agreed to the published version of the manuscript.
Funding
This research received no external funding.
Conflicts of Interest
The authors declare no conflicts of interest.
References
- Aizarani, N.; Saviano, A.; Sagar; Mailly, L. ; Durand, S.; Herman, J.S.; Pessaux, P.; Baumert, T.F.; Grün, D. A human liver cell atlas reveals heterogeneity and epithelial progenitors. Nature 2019, 572, 199–204. [Google Scholar] [CrossRef] [PubMed]
- Rosenberg, E. It's in your DNA : from discovery to structure, function and role in evolution, cancer and aging; Elsevier Ltd.: Academic Press: London, 2017; pp. xvii, 199 pages. [Google Scholar]
- Nurk, S.; Koren, S.; Rhie, A.; Rautiainen, M.; Bzikadze, A.V.; Mikheenko, A.; Vollger, M.R.; Altemose, N.; Uralsky, L.; Gershman, A.; et al. The complete sequence of a human genome. Science 2022, 376, 44–53. [Google Scholar] [CrossRef] [PubMed]
- Bolger, A.M.; Lohse, M.; Usadel, B. Trimmomatic: a flexible trimmer for Illumina sequence data. Bioinformatics 2014, 30, 2114–2120. [Google Scholar] [CrossRef] [PubMed]
- Simpson, J.T.; Wong, K.; Jackman, S.D.; Schein, J.E.; Jones, S.J.; Birol, I. ABySS: a parallel assembler for short read sequence data. Genome research 2009, 19, 1117–1123. [Google Scholar] [CrossRef]
- Grabherr, M.G.; Haas, B.J.; Yassour, M.; Levin, J.Z.; Thompson, D.A.; Amit, I.; Adiconis, X.; Fan, L.; Raychowdhury, R.; Zeng, Q.; et al. Full-length transcriptome assembly from RNA-Seq data without a reference genome. Nat Biotechnol 2011, 29, 644–652. [Google Scholar] [CrossRef]
- Bankevich, A.; Nurk, S.; Antipov, D.; Gurevich, A.A.; Dvorkin, M.; Kulikov, A.S.; Lesin, V.M.; Nikolenko, S.I.; Pham, S.; Prjibelski, A.D.; et al. SPAdes: a new genome assembly algorithm and its applications to single-cell sequencing. Journal of computational biology : a journal of computational molecular cell biology 2012, 19, 455–477. [Google Scholar] [CrossRef] [PubMed]
- Zerbino, D.R.; Birney, E. Velvet: algorithms for de novo short read assembly using de Bruijn graphs. Genome research 2008, 18, 821–829. [Google Scholar] [CrossRef]
- Luo, R.; Liu, B.; Xie, Y.; Li, Z.; Huang, W.; Yuan, J.; He, G.; Chen, Y.; Pan, Q.; Liu, Y.; et al. SOAPdenovo2: an empirically improved memory-efficient short-read de novo assembler. GigaScience 2012, 1, 18. [Google Scholar] [CrossRef] [PubMed]
- Li, H.; Durbin, R. Fast and accurate short read alignment with Burrows–Wheeler transform. Bioinformatics 2009, 25, 1754–1760. [Google Scholar] [CrossRef]
- Langmead, B.; Salzberg, S.L. Fast gapped-read alignment with Bowtie 2. Nat Methods 2012, 9, 357–359. [Google Scholar] [CrossRef]
- Li, H.; Handsaker, B.; Wysoker, A.; Fennell, T.; Ruan, J.; Homer, N.; Marth, G.; Abecasis, G.; Durbin, R.; Genome Project Data Processing, S. The Sequence Alignment/Map format and SAMtools. Bioinformatics 2009, 25, 2078–2079. [Google Scholar] [CrossRef] [PubMed]
- Robinson, J.T.; Thorvaldsdóttir, H.; Winckler, W.; Guttman, M.; Lander, E.S.; Getz, G.; Mesirov, J.P. Integrative genomics viewer. Nat Biotechnol 2011, 29, 24–26. [Google Scholar] [CrossRef] [PubMed]
- Milne, I.; Bayer, M.; Cardle, L.; Shaw, P.; Stephen, G.; Wright, F.; Marshall, D. Tablet--next generation sequence assembly visualization. Bioinformatics 2010, 26, 401–402. [Google Scholar] [CrossRef] [PubMed]
- McKenna, A.; Hanna, M.; Banks, E.; Sivachenko, A.; Cibulskis, K.; Kernytsky, A.; Garimella, K.; Altshuler, D.; Gabriel, S.; Daly, M.; et al. The Genome Analysis Toolkit: a MapReduce framework for analyzing next-generation DNA sequencing data. Genome research 2010, 20, 1297–1303. [Google Scholar] [CrossRef]
- Bull, R.A.; Adikari, T.N.; Ferguson, J.M.; Hammond, J.M.; Stevanovski, I.; Beukers, A.G.; Naing, Z.; Yeang, M.; Verich, A.; Gamaarachchi, H.; et al. Analytical validity of nanopore sequencing for rapid SARS-CoV-2 genome analysis. Nature Communications 2020, 11, 6272. [Google Scholar] [CrossRef] [PubMed]
- Yakovleva, A.; Kovalenko, G.; Redlinger, M.; Liulchuk, M.G.; Bortz, E.; Zadorozhna, V.I.; Scherbinska, A.M.; Wertheim, J.O.; Goodfellow, I.; Meredith, L.; et al. Tracking SARS-COV-2 variants using Nanopore sequencing in Ukraine in 2021. Scientific Reports 2022, 12, 15749. [Google Scholar] [CrossRef] [PubMed]
- De Coster, W.; Rademakers, R. NanoPack2: population-scale evaluation of long-read sequencing data. Bioinformatics 2023, 39, btad311. [Google Scholar] [CrossRef]
- Bonenfant, Q.; Noé, L.; Touzet, H. Porechop_ABI: discovering unknown adapters in Oxford Nanopore Technology sequencing reads for downstream trimming. Bioinformatics Advances 2023, 3, vbac085. [Google Scholar] [CrossRef]
- Koren, S.; Walenz, B.P.; Berlin, K.; Miller, J.R.; Bergman, N.H.; Phillippy, A.M. Canu: scalable and accurate long-read assembly via adaptive k-mer weighting and repeat separation. Genome research 2017, 27, 722–736. [Google Scholar] [CrossRef]
- Kolmogorov, M.; Yuan, J.; Lin, Y.; Pevzner, P.A. Assembly of long, error-prone reads using repeat graphs. Nature Biotechnology 2019, 37, 540–546. [Google Scholar] [CrossRef]
- Li, H. Minimap2: pairwise alignment for nucleotide sequences. Bioinformatics 2018, 34, 3094–3100. [Google Scholar] [CrossRef] [PubMed]
- Sedlazeck, F.J.; Rescheneder, P.; Smolka, M.; Fang, H.; Nattestad, M.; von Haeseler, A.; Schatz, M.C. Accurate detection of complex structural variations using single-molecule sequencing. Nat Methods 2018, 15, 461–468. [Google Scholar] [CrossRef] [PubMed]
- Loman, N.J.; Quick, J.; Simpson, J.T. A complete bacterial genome assembled de novo using only nanopore sequencing data. Nat Methods 2015, 12, 733–735. [Google Scholar] [CrossRef] [PubMed]
- Edge, P.; Bansal, V. Longshot enables accurate variant calling in diploid genomes from single-molecule long read sequencing. Nature Communications 2019, 10, 4660. [Google Scholar] [CrossRef] [PubMed]
- Shafin, K.; Pesout, T.; Chang, P.-C.; Nattestad, M.; Kolesnikov, A.; Goel, S.; Baid, G.; Kolmogorov, M.; Eizenga, J.M.; Miga, K.H.; et al. Haplotype-aware variant calling with PEPPER-Margin-DeepVariant enables high accuracy in nanopore long-reads. Nature Methods 2021, 18, 1322–1332. [Google Scholar] [CrossRef] [PubMed]
- Karsch-Mizrachi, I.; Takagi, T.; Cochrane, G. The international nucleotide sequence database collaboration. Nucleic Acids Res 2018, 46, D48–d51. [Google Scholar] [CrossRef]
- Gibbs, R.A.; Belmont, J.W.; Hardenbol, P.; Willis, T.D.; Yu, F.; Yang, H.; Ch'ang, L.-Y.; Huang, W.; Liu, B.; Shen, Y.; et al. The International HapMap Project. Nature 2003, 426, 789–796. [Google Scholar] [CrossRef]
- Auton, A.; Abecasis, G.R.; Altshuler, D.M.; Durbin, R.M.; Abecasis, G.R.; Bentley, D.R.; Chakravarti, A.; Clark, A.G.; Donnelly, P.; Eichler, E.E.; et al. A global reference for human genetic variation. Nature 2015, 526, 68–74. [Google Scholar] [CrossRef]
- Sudlow, C.; Gallacher, J.; Allen, N.; Beral, V.; Burton, P.; Danesh, J.; Downey, P.; Elliott, P.; Green, J.; Landray, M.; et al. UK biobank: an open access resource for identifying the causes of a wide range of complex diseases of middle and old age. PLoS medicine 2015, 12, e1001779. [Google Scholar] [CrossRef]
- Denny, J.C.; Rutter, J.L.; Goldstein, D.B.; Philippakis, A.; Smoller, J.W.; Jenkins, G.; Dishman, E. The "All of Us" Research Program. N Engl J Med 2019, 381, 668–676. [Google Scholar] [CrossRef]
- Sud, A.; Kinnersley, B.; Houlston, R.S. Genome-wide association studies of cancer: current insights and future perspectives. Nature Reviews Cancer 2017, 17, 692–704. [Google Scholar] [CrossRef] [PubMed]
- Cibulskis, K.; Lawrence, M.S.; Carter, S.L.; Sivachenko, A.; Jaffe, D.; Sougnez, C.; Gabriel, S.; Meyerson, M.; Lander, E.S.; Getz, G. Sensitive detection of somatic point mutations in impure and heterogeneous cancer samples. Nature Biotechnology 2013, 31, 213–219. [Google Scholar] [CrossRef]
- Cingolani, P.; Platts, A.; Wang le, L.; Coon, M.; Nguyen, T.; Wang, L.; Land, S.J.; Lu, X.; Ruden, D.M. A program for annotating and predicting the effects of single nucleotide polymorphisms, SnpEff: SNPs in the genome of Drosophila melanogaster strain w1118; iso-2; iso-3. Fly 2012, 6, 80–92. [Google Scholar] [CrossRef]
- Landrum, M.J.; Lee, J.M.; Benson, M.; Brown, G.R.; Chao, C.; Chitipiralla, S.; Gu, B.; Hart, J.; Hoffman, D.; Jang, W.; et al. ClinVar: improving access to variant interpretations and supporting evidence. Nucleic Acids Research 2018, 46, D1062–D1067. [Google Scholar] [CrossRef] [PubMed]
- Yu, X.; Zhao, H.; Wang, R.; Chen, Y.; Ouyang, X.; Li, W.; Sun, Y.; Peng, A. Cancer epigenetics: from laboratory studies and clinical trials to precision medicine. Cell Death Discovery 2024, 10, 28. [Google Scholar] [CrossRef]
- Liu, Y.; Rosikiewicz, W.; Pan, Z.; Jillette, N.; Wang, P.; Taghbalout, A.; Foox, J.; Mason, C.; Carroll, M.; Cheng, A.; et al. DNA methylation-calling tools for Oxford Nanopore sequencing: a survey and human epigenome-wide evaluation. Genome Biology 2021, 22, 295. [Google Scholar] [CrossRef]
- Krueger, F.; Andrews, S.R. Bismark: a flexible aligner and methylation caller for Bisulfite-Seq applications. Bioinformatics 2011, 27, 1571–1572. [Google Scholar] [CrossRef]
- Akalin, A.; Kormaksson, M.; Li, S.; Garrett-Bakelman, F.E.; Figueroa, M.E.; Melnick, A.; Mason, C.E. methylKit: a comprehensive R package for the analysis of genome-wide DNA methylation profiles. Genome Biology 2012, 13, R87. [Google Scholar] [CrossRef]
- Zhang, Y.; Liu, T.; Meyer, C.A.; Eeckhoute, J.; Johnson, D.S.; Bernstein, B.E.; Nusbaum, C.; Myers, R.M.; Brown, M.; Li, W.; et al. Model-based Analysis of ChIP-Seq (MACS). Genome Biology 2008, 9, R137. [Google Scholar] [CrossRef] [PubMed]
- Tarbell, E.D.; Liu, T. HMMRATAC: a Hidden Markov ModeleR for ATAC-seq. Nucleic Acids Research 2019, 47, e91–e91. [Google Scholar] [CrossRef]
- Stuart, T.; Srivastava, A.; Madad, S.; Lareau, C.A.; Satija, R. Single-cell chromatin state analysis with Signac. Nat Methods 2021, 18, 1333–1341. [Google Scholar] [CrossRef]
- An integrated encyclopedia of DNA elements in the human genome. Nature 2012, 489, 57–74. [CrossRef] [PubMed]
- Patro, R.; Duggal, G.; Love, M.I.; Irizarry, R.A.; Kingsford, C. Salmon provides fast and bias-aware quantification of transcript expression. Nat Methods 2017, 14, 417–419. [Google Scholar] [CrossRef]
- Dobin, A.; Davis, C.A.; Schlesinger, F.; Drenkow, J.; Zaleski, C.; Jha, S.; Batut, P.; Chaisson, M.; Gingeras, T.R. STAR: ultrafast universal RNA-seq aligner. Bioinformatics 2013, 29, 15–21. [Google Scholar] [CrossRef]
- Kim, D.; Pertea, G.; Trapnell, C.; Pimentel, H.; Kelley, R.; Salzberg, S.L. TopHat2: accurate alignment of transcriptomes in the presence of insertions, deletions and gene fusions. Genome Biology 2013, 14, R36. [Google Scholar] [CrossRef] [PubMed]
- Kim, D.; Paggi, J.M.; Park, C.; Bennett, C.; Salzberg, S.L. Graph-based genome alignment and genotyping with HISAT2 and HISAT-genotype. Nature Biotechnology 2019, 37, 907–915. [Google Scholar] [CrossRef]
- Ritchie, M.E.; Phipson, B.; Wu, D.; Hu, Y.; Law, C.W.; Shi, W.; Smyth, G.K. limma powers differential expression analyses for RNA-sequencing and microarray studies. Nucleic Acids Res 2015, 43, e47. [Google Scholar] [CrossRef] [PubMed]
- Love, M.I.; Huber, W.; Anders, S. Moderated estimation of fold change and dispersion for RNA-seq data with DESeq2. Genome Biol 2014, 15, 550. [Google Scholar] [CrossRef] [PubMed]
- Chen, Y.; Lun, A.T.; Smyth, G.K. From reads to genes to pathways: differential expression analysis of RNA-Seq experiments using Rsubread and the edgeR quasi-likelihood pipeline. F1000Research 2016, 5, 1438. [Google Scholar] [CrossRef] [PubMed]
- Shen, S.; Park, J.W.; Lu, Z.-x.; Lin, L.; Henry, M.D.; Wu, Y.N.; Zhou, Q.; Xing, Y. rMATS: Robust and flexible detection of differential alternative splicing from replicate RNA-Seq data. Proceedings of the National Academy of Sciences 2014, 111, E5593–E5601. [Google Scholar] [CrossRef] [PubMed]
- Anders, S.; Reyes, A.; Huber, W. Detecting differential usage of exons from RNA-seq data. Genome research 2012, 22, 2008–2017. [Google Scholar] [CrossRef] [PubMed]
- Subramanian, A.; Tamayo, P.; Mootha, V.K.; Mukherjee, S.; Ebert, B.L.; Gillette, M.A.; Paulovich, A.; Pomeroy, S.L.; Golub, T.R.; Lander, E.S.; et al. Gene set enrichment analysis: a knowledge-based approach for interpreting genome-wide expression profiles. Proc Natl Acad Sci U S A 2005, 102, 15545–15550. [Google Scholar] [CrossRef] [PubMed]
- Sherman, B.T.; Hao, M.; Qiu, J.; Jiao, X.; Baseler, M.W.; Lane, H.C.; Imamichi, T.; Chang, W. DAVID: a web server for functional enrichment analysis and functional annotation of gene lists (2021 update). Nucleic Acids Research 2022, 50, W216–W221. [Google Scholar] [CrossRef]
- Mi, H.; Thomas, P. PANTHER pathway: an ontology-based pathway database coupled with data analysis tools. Methods Mol Biol 2009, 563, 123–140. [Google Scholar] [CrossRef]
- Kanehisa, M.; Goto, S. KEGG: kyoto encyclopedia of genes and genomes. Nucleic Acids Res 2000, 28, 27–30. [Google Scholar] [CrossRef]
- Shannon, P.; Markiel, A.; Ozier, O.; Baliga, N.S.; Wang, J.T.; Ramage, D.; Amin, N.; Schwikowski, B.; Ideker, T. Cytoscape: a software environment for integrated models of biomolecular interaction networks. Genome research 2003, 13, 2498–2504. [Google Scholar] [CrossRef] [PubMed]
- Langfelder, P.; Horvath, S. WGCNA: an R package for weighted correlation network analysis. BMC Bioinformatics 2008, 9, 559. [Google Scholar] [CrossRef] [PubMed]
- Edgar, R.; Domrachev, M.; Lash, A.E. Gene Expression Omnibus: NCBI gene expression and hybridization array data repository. Nucleic Acids Res 2002, 30, 207–210. [Google Scholar] [CrossRef]
- Parkinson, H.; Kapushesky, M.; Shojatalab, M.; Abeygunawardena, N.; Coulson, R.; Farne, A.; Holloway, E.; Kolesnykov, N.; Lilja, P.; Lukk, M.; et al. ArrayExpress--a public database of microarray experiments and gene expression profiles. Nucleic Acids Res 2007, 35, D747–750. [Google Scholar] [CrossRef]
- Vogel, C.; Marcotte, E.M. Insights into the regulation of protein abundance from proteomic and transcriptomic analyses. Nature reviews. Genetics 2012, 13, 227–232. [Google Scholar] [CrossRef]
- Agrawal, G.K.; Sarkar, A.; Righetti, P.G.; Pedreschi, R.; Carpentier, S.; Wang, T.; Barkla, B.J.; Kohli, A.; Ndimba, B.K.; Bykova, N.V.; et al. A decade of plant proteomics and mass spectrometry: translation of technical advancements to food security and safety issues. Mass Spectrom Rev 2013, 32, 335–365. [Google Scholar] [CrossRef] [PubMed]
- Cox, J.; Mann, M. MaxQuant enables high peptide identification rates, individualized p.p.b.-range mass accuracies and proteome-wide protein quantification. Nature Biotechnology 2008, 26, 1367–1372. [Google Scholar] [CrossRef] [PubMed]
- Choi, M.; Chang, C.Y.; Clough, T.; Broudy, D.; Killeen, T.; MacLean, B.; Vitek, O. MSstats: an R package for statistical analysis of quantitative mass spectrometry-based proteomic experiments. Bioinformatics 2014, 30, 2524–2526. [Google Scholar] [CrossRef] [PubMed]
- Perez-Riverol, Y.; Bai, J.; Bandla, C.; García-Seisdedos, D.; Hewapathirana, S.; Kamatchinathan, S.; Kundu, Deepti J. ; Prakash, A.; Frericks-Zipper, A.; Eisenacher, M.; et al. The PRIDE database resources in 2022: a hub for mass spectrometry-based proteomics evidences. Nucleic Acids Research 2022, 50, D543–D552. [Google Scholar] [CrossRef]
- Croft, D.; O'Kelly, G.; Wu, G.; Haw, R.; Gillespie, M.; Matthews, L.; Caudy, M.; Garapati, P.; Gopinath, G.; Jassal, B.; et al. Reactome: a database of reactions, pathways and biological processes. Nucleic Acids Res 2011, 39, D691–697. [Google Scholar] [CrossRef] [PubMed]
- Szklarczyk, D.; Kirsch, R.; Koutrouli, M.; Nastou, K.; Mehryary, F.; Hachilif, R.; Gable, A.L.; Fang, T.; Doncheva, N.T.; Pyysalo, S.; et al. The STRING database in 2023: protein-protein association networks and functional enrichment analyses for any sequenced genome of interest. Nucleic Acids Res 2023, 51, D638–d646. [Google Scholar] [CrossRef] [PubMed]
- Uhlén, M.; Fagerberg, L.; Hallström, B.M.; Lindskog, C.; Oksvold, P.; Mardinoglu, A.; Sivertsson, Å.; Kampf, C.; Sjöstedt, E.; Asplund, A.; et al. Proteomics. Tissue-based map of the human proteome. Science 2015, 347, 1260419. [Google Scholar] [CrossRef]
- Berman, H.M.; Westbrook, J.; Feng, Z.; Gilliland, G.; Bhat, T.N.; Weissig, H.; Shindyalov, I.N.; Bourne, P.E. The Protein Data Bank. Nucleic Acids Res 2000, 28, 235–242. [Google Scholar] [CrossRef]
- Schwede, T.; Kopp, J.; Guex, N.; Peitsch, M.C. SWISS-MODEL: An automated protein homology-modeling server. Nucleic Acids Res 2003, 31, 3381–3385. [Google Scholar] [CrossRef]
- Jumper, J.; Evans, R.; Pritzel, A.; Green, T.; Figurnov, M.; Ronneberger, O.; Tunyasuvunakool, K.; Bates, R.; Žídek, A.; Potapenko, A.; et al. Highly accurate protein structure prediction with AlphaFold. Nature 2021, 596, 583–589. [Google Scholar] [CrossRef]
- Varadi, M.; Bertoni, D.; Magana, P.; Paramval, U.; Pidruchna, I.; Radhakrishnan, M.; Tsenkov, M.; Nair, S.; Mirdita, M.; Yeo, J.; et al. AlphaFold Protein Structure Database in 2024: providing structure coverage for over 214 million protein sequences. Nucleic Acids Res 2024, 52, D368–d375. [Google Scholar] [CrossRef] [PubMed]
- Zhong, Q.; Xiao, X.; Qiu, Y.; Xu, Z.; Chen, C.; Chong, B.; Zhao, X.; Hai, S.; Li, S.; An, Z.; et al. Protein posttranslational modifications in health and diseases: Functions, regulatory mechanisms, and therapeutic implications. MedComm 2023, 4, e261. [Google Scholar] [CrossRef] [PubMed]
- Vlastaridis, P.; Kyriakidou, P.; Chaliotis, A.; Van de Peer, Y.; Oliver, S.G.; Amoutzias, G.D. Estimating the total number of phosphoproteins and phosphorylation sites in eukaryotic proteomes. Gigascience 2017, 6, 1–11. [Google Scholar] [CrossRef] [PubMed]
- Schmelzle, K.; White, F.M. Phosphoproteomic approaches to elucidate cellular signaling networks. Current opinion in biotechnology 2006, 17, 406–414. [Google Scholar] [CrossRef] [PubMed]
- An, H.J.; Froehlich, J.W.; Lebrilla, C.B. Determination of glycosylation sites and site-specific heterogeneity in glycoproteins. Current Opinion in Chemical Biology 2009, 13, 421–426. [Google Scholar] [CrossRef] [PubMed]
- Fernández-Tejada, A.; Brailsford, J.; Zhang, Q.; Shieh, J.H.; Moore, M.A.; Danishefsky, S.J. Total synthesis of glycosylated proteins. Topics in current chemistry 2015, 362, 1–26. [Google Scholar] [CrossRef]
- Tiemeyer, M.; Aoki, K.; Paulson, J.; Cummings, R.D.; York, W.S.; Karlsson, N.G.; Lisacek, F.; Packer, N.H.; Campbell, M.P.; Aoki, N.P.; et al. GlyTouCan: an accessible glycan structure repository. Glycobiology 2017, 27, 915–919. [Google Scholar] [CrossRef]
- Campbell, M.P.; Peterson, R.; Mariethoz, J.; Gasteiger, E.; Akune, Y.; Aoki-Kinoshita, K.F.; Lisacek, F.; Packer, N.H. UniCarbKB: building a knowledge platform for glycoproteomics. Nucleic Acids Research 2014, 42, D215–D221. [Google Scholar] [CrossRef]
- Hu, S.; Wong, D.T. Lectin microarray. Proteomics. Clinical applications 2009, 3, 148–154. [Google Scholar] [CrossRef]
- Watanabe, Y.; Aoki-Kinoshita, K.F.; Ishihama, Y.; Okuda, S. GlycoPOST realizes FAIR principles for glycomics mass spectrometry data. Nucleic Acids Research 2021, 49, D1523–D1528. [Google Scholar] [CrossRef]
- Yamada, I.; Shiota, M.; Shinmachi, D.; Ono, T.; Tsuchiya, S.; Hosoda, M.; Fujita, A.; Aoki, N.P.; Watanabe, Y.; Fujita, N.; et al. The GlyCosmos Portal: a unified and comprehensive web resource for the glycosciences. Nature Methods 2020, 17, 649–650. [Google Scholar] [CrossRef] [PubMed]
- York, W.S.; Mazumder, R.; Ranzinger, R.; Edwards, N.; Kahsay, R.; Aoki-Kinoshita, K.F.; Campbell, M.P.; Cummings, R.D.; Feizi, T.; Martin, M.; et al. GlyGen: Computational and Informatics Resources for Glycoscience. Glycobiology 2020, 30, 72–73. [Google Scholar] [CrossRef] [PubMed]
- Mariethoz, J.; Alocci, D.; Gastaldello, A.; Horlacher, O.; Gasteiger, E.; Rojas-Macias, M.; Karlsson, N.G.; Packer, N.H.; Lisacek, F. Glycomics@ExPASy: Bridging the Gap. Mol Cell Proteomics 2018, 17, 2164–2176. [Google Scholar] [CrossRef] [PubMed]
- Daviss, B. Growing pains for metabolomics: the newest 'omic science is producing results--and more data than researchers know what to do with. The Scientist 2005, 19, 25–29. [Google Scholar]
- Wishart, D.S.; Feunang, Y.D.; Marcu, A.; Guo, A.C.; Liang, K.; Vazquez-Fresno, R.; Sajed, T.; Johnson, D.; Li, C.; Karu, N.; et al. HMDB 4.0: the human metabolome database for 2018. Nucleic Acids Res 2018, 46, D608–D617. [Google Scholar] [CrossRef]
- Frolkis, A.; Knox, C.; Lim, E.; Jewison, T.; Law, V.; Hau, D.D.; Liu, P.; Gautam, B.; Ly, S.; Guo, A.C.; et al. SMPDB: The Small Molecule Pathway Database. Nucleic Acids Res 2010, 38, D480–487. [Google Scholar] [CrossRef] [PubMed]
- Haug, K.; Salek, R.M.; Conesa, P.; Hastings, J.; de Matos, P.; Rijnbeek, M.; Mahendraker, T.; Williams, M.; Neumann, S.; Rocca-Serra, P.; et al. MetaboLights--an open-access general-purpose repository for metabolomics studies and associated meta-data. Nucleic Acids Res 2013, 41, D781–786. [Google Scholar] [CrossRef]
- Wang, R.; Li, B.; Lam, S.M.; Shui, G. Integration of lipidomics and metabolomics for in-depth understanding of cellular mechanism and disease progression. Journal of Genetics and Genomics 2020, 47, 69–83. [Google Scholar] [CrossRef] [PubMed]
- Katajamaa, M.; Miettinen, J.; Oresic, M. MZmine: toolbox for processing and visualization of mass spectrometry based molecular profile data. Bioinformatics 2006, 22, 634–636. [Google Scholar] [CrossRef]
- Tsugawa, H.; Ikeda, K.; Takahashi, M.; Satoh, A.; Mori, Y.; Uchino, H.; Okahashi, N.; Yamada, Y.; Tada, I.; Bonini, P.; et al. A lipidome atlas in MS-DIAL 4. Nat Biotechnol 2020, 38, 1159–1163. [Google Scholar] [CrossRef]
- Pang, Z.; Lu, Y.; Zhou, G.; Hui, F.; Xu, L.; Viau, C.; Spigelman, Aliya F. ; MacDonald, Patrick E.; Wishart, David S.; Li, S.; et al. MetaboAnalyst 6.0: towards a unified platform for metabolomics data processing, analysis and interpretation. Nucleic Acids Research 2024, 52, W398–W406. [Google Scholar] [CrossRef] [PubMed]
- Mock, A.; Warta, R.; Dettling, S.; Brors, B.; Jäger, D.; Herold-Mende, C. MetaboDiff: an R package for differential metabolomic analysis. Bioinformatics 2018, 34, 3417–3418. [Google Scholar] [CrossRef] [PubMed]
- Macaulay, I.C.; Ponting, C.P.; Voet, T. Single-Cell Multiomics: Multiple Measurements from Single Cells. Trends in genetics : TIG 2017, 33, 155–168. [Google Scholar] [CrossRef]
- Heumos, L.; Schaar, A.C.; Lance, C.; Litinetskaya, A.; Drost, F.; Zappia, L.; Lücken, M.D.; Strobl, D.C.; Henao, J.; Curion, F.; et al. Best practices for single-cell analysis across modalities. Nature Reviews Genetics 2023, 24, 550–572. [Google Scholar] [CrossRef] [PubMed]
- Germain, P.L.; Lun, A.; Garcia Meixide, C.; Macnair, W.; Robinson, M.D. Doublet identification in single-cell sequencing data using scDblFinder. F1000Research 2021, 10, 979. [Google Scholar] [CrossRef]
- Amezquita, R.A.; Lun, A.T.L.; Becht, E.; Carey, V.J.; Carpp, L.N.; Geistlinger, L.; Marini, F.; Rue-Albrecht, K.; Risso, D.; Soneson, C.; et al. Orchestrating single-cell analysis with Bioconductor. Nat Methods 2020, 17, 137–145. [Google Scholar] [CrossRef]
- Hao, Y.; Hao, S.; Andersen-Nissen, E.; Mauck, W.M., 3rd; Zheng, S.; Butler, A.; Lee, M.J.; Wilk, A.J.; Darby, C.; Zager, M.; et al. Integrated analysis of multimodal single-cell data. Cell 2021, 184, 3573–3587.e3529. [Google Scholar] [CrossRef] [PubMed]
- Wolf, F.A.; Angerer, P.; Theis, F.J. SCANPY: large-scale single-cell gene expression data analysis. Genome Biol 2018, 19, 15. [Google Scholar] [CrossRef]
- Trapnell, C.; Cacchiarelli, D.; Grimsby, J.; Pokharel, P.; Li, S.; Morse, M.; Lennon, N.J.; Livak, K.J.; Mikkelsen, T.S.; Rinn, J.L. The dynamics and regulators of cell fate decisions are revealed by pseudotemporal ordering of single cells. Nature Biotechnology 2014, 32, 381–386. [Google Scholar] [CrossRef]
- Fang, R.; Preissl, S.; Li, Y.; Hou, X.; Lucero, J.; Wang, X.; Motamedi, A.; Shiau, A.K.; Zhou, X.; Xie, F.; et al. Comprehensive analysis of single cell ATAC-seq data with SnapATAC. Nature Communications 2021, 12, 1337. [Google Scholar] [CrossRef]
- McGarvey, A.C.; Kopp, W.; Vučićević, D.; Mattonet, K.; Kempfer, R.; Hirsekorn, A.; Bilić, I.; Gil, M.; Trinks, A.; Merks, A.M.; et al. Single-cell-resolved dynamics of chromatin architecture delineate cell and regulatory states in zebrafish embryos. Cell genomics 2022, 2, 100083. [Google Scholar] [CrossRef] [PubMed]
- Granja, J.M.; Corces, M.R.; Pierce, S.E.; Bagdatli, S.T.; Choudhry, H.; Chang, H.Y.; Greenleaf, W.J. ArchR is a scalable software package for integrative single-cell chromatin accessibility analysis. Nature Genetics 2021, 53, 403–411. [Google Scholar] [CrossRef] [PubMed]
- Arora, R.; Cao, C.; Kumar, M.; Sinha, S.; Chanda, A.; McNeil, R.; Samuel, D.; Arora, R.K.; Matthews, T.W.; Chandarana, S.; et al. Spatial transcriptomics reveals distinct and conserved tumor core and edge architectures that predict survival and targeted therapy response. Nature Communications 2023, 14, 5029. [Google Scholar] [CrossRef] [PubMed]
- Yu, S.; Wang, H.; Yang, L.; Yan, Y.; Cai, Q.; Ma, D.; Jiang, L.; Gao, Z.; Yu, Z.; Xia, Z. Spatial transcriptome profiling of normal human liver. Scientific Data 2022, 9, 633. [Google Scholar] [CrossRef]
- Moffitt, J.R.; Zhuang, X. RNA Imaging with Multiplexed Error-Robust Fluorescence In Situ Hybridization (MERFISH). Methods in enzymology 2016, 572, 1–49. [Google Scholar] [CrossRef] [PubMed]
- Palla, G.; Spitzer, H.; Klein, M.; Fischer, D.; Schaar, A.C.; Kuemmerle, L.B.; Rybakov, S.; Ibarra, I.L.; Holmberg, O.; Virshup, I.; et al. Squidpy: a scalable framework for spatial omics analysis. Nature Methods 2022, 19, 171–178. [Google Scholar] [CrossRef]
- Dries, R.; Zhu, Q.; Dong, R.; Eng, C.-H.L.; Li, H.; Liu, K.; Fu, Y.; Zhao, T.; Sarkar, A.; Bao, F.; et al. Giotto: a toolbox for integrative analysis and visualization of spatial expression data. Genome Biology 2021, 22, 78. [Google Scholar] [CrossRef] [PubMed]
- Kueckelhaus, J.; Frerich, S.; Kada-Benotmane, J.; Koupourtidou, C.; Ninkovic, J.; Dichgans, M.; Beck, J.; Schnell, O.; Heiland, D.H. Inferring histology-associated gene expression gradients in spatial transcriptomic studies. Nature Communications 2024, 15, 7280. [Google Scholar] [CrossRef]
- Svensson, V.; Teichmann, S.A.; Stegle, O. SpatialDE: identification of spatially variable genes. Nature Methods 2018, 15, 343–346. [Google Scholar] [CrossRef]
- Zhao, E.; Stone, M.R.; Ren, X.; Guenthoer, J.; Smythe, K.S.; Pulliam, T.; Williams, S.R.; Uytingco, C.R.; Taylor, S.E.B.; Nghiem, P.; et al. Spatial transcriptomics at subspot resolution with BayesSpace. Nature Biotechnology 2021, 39, 1375–1384. [Google Scholar] [CrossRef]
- Rohart, F.; Gautier, B.; Singh, A.; Le Cao, K.A. mixOmics: An R package for 'omics feature selection and multiple data integration. PLoS Comput Biol 2017, 13, e1005752. [Google Scholar] [CrossRef] [PubMed]
- Zoppi, J.; Guillaume, J.F.; Neunlist, M.; Chaffron, S. MiBiOmics: an interactive web application for multi-omics data exploration and integration. BMC Bioinformatics 2021, 22, 6. [Google Scholar] [CrossRef] [PubMed]
- Min, E.J.; Long, Q. Sparse multiple co-Inertia analysis with application to integrative analysis of multi -Omics data. BMC Bioinformatics 2020, 21, 141. [Google Scholar] [CrossRef] [PubMed]
- Liu, T.; Salguero, P.; Petek, M.; Martinez-Mira, C.; Balzano-Nogueira, L.; Ramšak, Ž.; McIntyre, L.; Gruden, K.; Tarazona, S.; Conesa, A. PaintOmics 4: new tools for the integrative analysis of multi-omics datasets supported by multiple pathway databases. Nucleic Acids Research 2022, 50, W551–W559. [Google Scholar] [CrossRef] [PubMed]
- Rodchenkov, I.; Babur, O.; Luna, A.; Aksoy, B.A.; Wong, J.V.; Fong, D.; Franz, M.; Siper, M.C.; Cheung, M.; Wrana, M.; et al. Pathway Commons 2019 Update: integration, analysis and exploration of pathway data. Nucleic Acids Research 2020, 48, D489–D497. [Google Scholar] [CrossRef]
- Ding, J.; Blencowe, M.; Nghiem, T.; Ha, S.-m.; Chen, Y.-W.; Li, G.; Yang, X. Mergeomics 2.0: a web server for multi-omics data integration to elucidate disease networks and predict therapeutics. Nucleic Acids Research 2021, 49, W375–W387. [Google Scholar] [CrossRef]
- Zhou, G.; Pang, Z.; Lu, Y.; Ewald, J.; Xia, J. OmicsNet 2.0: a web-based platform for multi-omics integration and network visual analytics. Nucleic Acids Research 2022, 50, W527–W533. [Google Scholar] [CrossRef]
- Peters, K.; Bradbury, J.; Bergmann, S.; Capuccini, M.; Cascante, M.; de Atauri, P.; Ebbels, T.M.D.; Foguet, C.; Glen, R.; Gonzalez-Beltran, A.; et al. PhenoMeNal: processing and analysis of metabolomics data in the cloud. GigaScience 2019, 8, giy149. [Google Scholar] [CrossRef] [PubMed]
- Ewald, J.D.; Zhou, G.; Lu, Y.; Kolic, J.; Ellis, C.; Johnson, J.D.; Macdonald, P.E.; Xia, J. Web-based multi-omics integration using the Analyst software suite. Nature Protocols 2024, 19, 1467–1497. [Google Scholar] [CrossRef]
- Miao, B.-B.; Dong, W.; Gu, Y.-X.; Han, Z.-F.; Luo, X.; Ke, C.-H.; You, W.-W. OmicsSuite: a customized and pipelined suite for analysis and visualization of multi-omics big data. Horticulture Research 2023, 10, uhad195. [Google Scholar] [CrossRef]
- Argelaguet, R.; Velten, B.; Arnol, D.; Dietrich, S.; Zenz, T.; Marioni, J.C.; Buettner, F.; Huber, W.; Stegle, O. Multi-Omics Factor Analysis—a framework for unsupervised integration of multi-omics data sets. Molecular Systems Biology 2018, 14, e8124. [Google Scholar] [CrossRef] [PubMed]
- Argelaguet, R.; Arnol, D.; Bredikhin, D.; Deloro, Y.; Velten, B.; Marioni, J.C.; Stegle, O. MOFA+: a statistical framework for comprehensive integration of multi-modal single-cell data. Genome Biology 2020, 21, 111. [Google Scholar] [CrossRef] [PubMed]
- Kamburov, A.; Cavill, R.; Ebbels, T.M.D.; Herwig, R.; Keun, H.C. Integrated pathway-level analysis of transcriptomics and metabolomics data with IMPaLA. Bioinformatics 2011, 27, 2917–2918. [Google Scholar] [CrossRef] [PubMed]
- Ben Guebila, M.; Wang, T.; Lopes-Ramos, C.M.; Fanfani, V.; Weighill, D.; Burkholz, R.; Schlauch, D.; Paulson, J.N.; Altenbuchinger, M.; Shutta, K.H.; et al. The Network Zoo: a multilingual package for the inference and analysis of gene regulatory networks. Genome Biology 2023, 24, 45. [Google Scholar] [CrossRef]
- Velten, B.; Braunger, J.M.; Argelaguet, R.; Arnol, D.; Wirbel, J.; Bredikhin, D.; Zeller, G.; Stegle, O. Identifying temporal and spatial patterns of variation from multimodal data using MEFISTO. Nature Methods 2022, 19, 179–186. [Google Scholar] [CrossRef] [PubMed]
- Moon, S.; Lee, H. MOMA: a multi-task attention learning algorithm for multi-omics data interpretation and classification. Bioinformatics 2022, 38, 2287–2296. [Google Scholar] [CrossRef] [PubMed]
- Blum, B.C.; Emili, A. Omics Notebook: robust, reproducible and flexible automated multiomics exploratory analysis and reporting. Bioinformatics Advances 2021, 1, vbab024. [Google Scholar] [CrossRef]
- Akhmedov, M.; Martinelli, A.; Geiger, R.; Kwee, I. Omics Playground: a comprehensive self-service platform for visualization, analytics and exploration of Big Omics Data. NAR Genomics and Bioinformatics 2020, 2, lqz019. [Google Scholar] [CrossRef]
- Wijetunga, N.A.; Johnston, A.D.; Maekawa, R.; Delahaye, F.; Ulahannan, N.; Kim, K.; Greally, J.M. SMITE: an R/Bioconductor package that identifies network modules by integrating genomic and epigenomic information. BMC Bioinformatics 2017, 18, 41. [Google Scholar] [CrossRef]
- Lin, Y.; Zhang, W.; Cao, H.; li, G.; Du, W. Classifying Breast Cancer Subtypes Using Deep Neural Networks Based on Multi-Omics Data. Genes 2020, 11, 888. [Google Scholar] [CrossRef]
- Bredikhin, D.; Kats, I.; Stegle, O. MUON: multimodal omics analysis framework. Genome Biology 2022, 23, 42. [Google Scholar] [CrossRef] [PubMed]
- Ulfenborg, B. Vertical and horizontal integration of multi-omics data with miodin. BMC Bioinformatics 2019, 20, 649. [Google Scholar] [CrossRef] [PubMed]
- Tuncbag, N.; Gosline, S.J.C.; Kedaigle, A.; Soltis, A.R.; Gitter, A.; Fraenkel, E. Network-Based Interpretation of Diverse High-Throughput Datasets through the Omics Integrator Software Package. PLOS Computational Biology 2016, 12, e1004879. [Google Scholar] [CrossRef]
- Meng, C.; Basunia, A.; Peters, B.; Gholami, A.M.; Kuster, B.; Culhane, A.C. MOGSA: Integrative Single Sample Gene-set Analysis of Multiple Omics Data. Mol Cell Proteomics 2019, 18, S153–s168. [Google Scholar] [CrossRef] [PubMed]
- Wang, T.; Shao, W.; Huang, Z.; Tang, H.; Zhang, J.; Ding, Z.; Huang, K. MOGONET integrates multi-omics data using graph convolutional networks allowing patient classification and biomarker identification. Nat Commun 2021, 12, 3445. [Google Scholar] [CrossRef]
- Lock, E.F.; Hoadley, K.A.; Marron, J.S.; Nobel, A.B. JOINT AND INDIVIDUAL VARIATION EXPLAINED (JIVE) FOR INTEGRATED ANALYSIS OF MULTIPLE DATA TYPES. The annals of applied statistics 2013, 7, 523–542. [Google Scholar] [CrossRef]
- Chang, K.; Creighton, C.J.; Davis, C.; Donehower, L.; Drummond, J.; Wheeler, D.; Ally, A.; Balasundaram, M.; Birol, I.; Butterfield, Y.S.N.; et al. The Cancer Genome Atlas Pan-Cancer analysis project. Nature Genetics 2013, 45, 1113–1120. [Google Scholar] [CrossRef]
- Shankavaram, U.T.; Varma, S.; Kane, D.; Sunshine, M.; Chary, K.K.; Reinhold, W.C.; Pommier, Y.; Weinstein, J.N. CellMiner: a relational database and query tool for the NCI-60 cancer cell lines. BMC Genomics 2009, 10, 277. [Google Scholar] [CrossRef] [PubMed]
- Tarazona, S.; Arzalluz-Luque, A.; Conesa, A. Undisclosed, unmet and neglected challenges in multi-omics studies. Nature Computational Science 2021, 1, 395–402. [Google Scholar] [CrossRef]
- Tarazona, S.; Balzano-Nogueira, L.; Gómez-Cabrero, D.; Schmidt, A.; Imhof, A.; Hankemeier, T.; Tegnér, J.; Westerhuis, J.A.; Conesa, A. Harmonization of quality metrics and power calculation in multi-omic studies. Nature Communications 2020, 11, 3092. [Google Scholar] [CrossRef]
- Yousef, M.; Allmer, J. Deep learning in bioinformatics. Turkish journal of biology = Turk biyoloji dergisi 2023, 47, 366–382. [Google Scholar] [CrossRef] [PubMed]
- van Timmeren, J.E.; Cester, D.; Tanadini-Lang, S.; Alkadhi, H.; Baessler, B. Radiomics in medical imaging—“how-to” guide and critical reflection. Insights into Imaging 2020, 11, 91. [Google Scholar] [CrossRef] [PubMed]
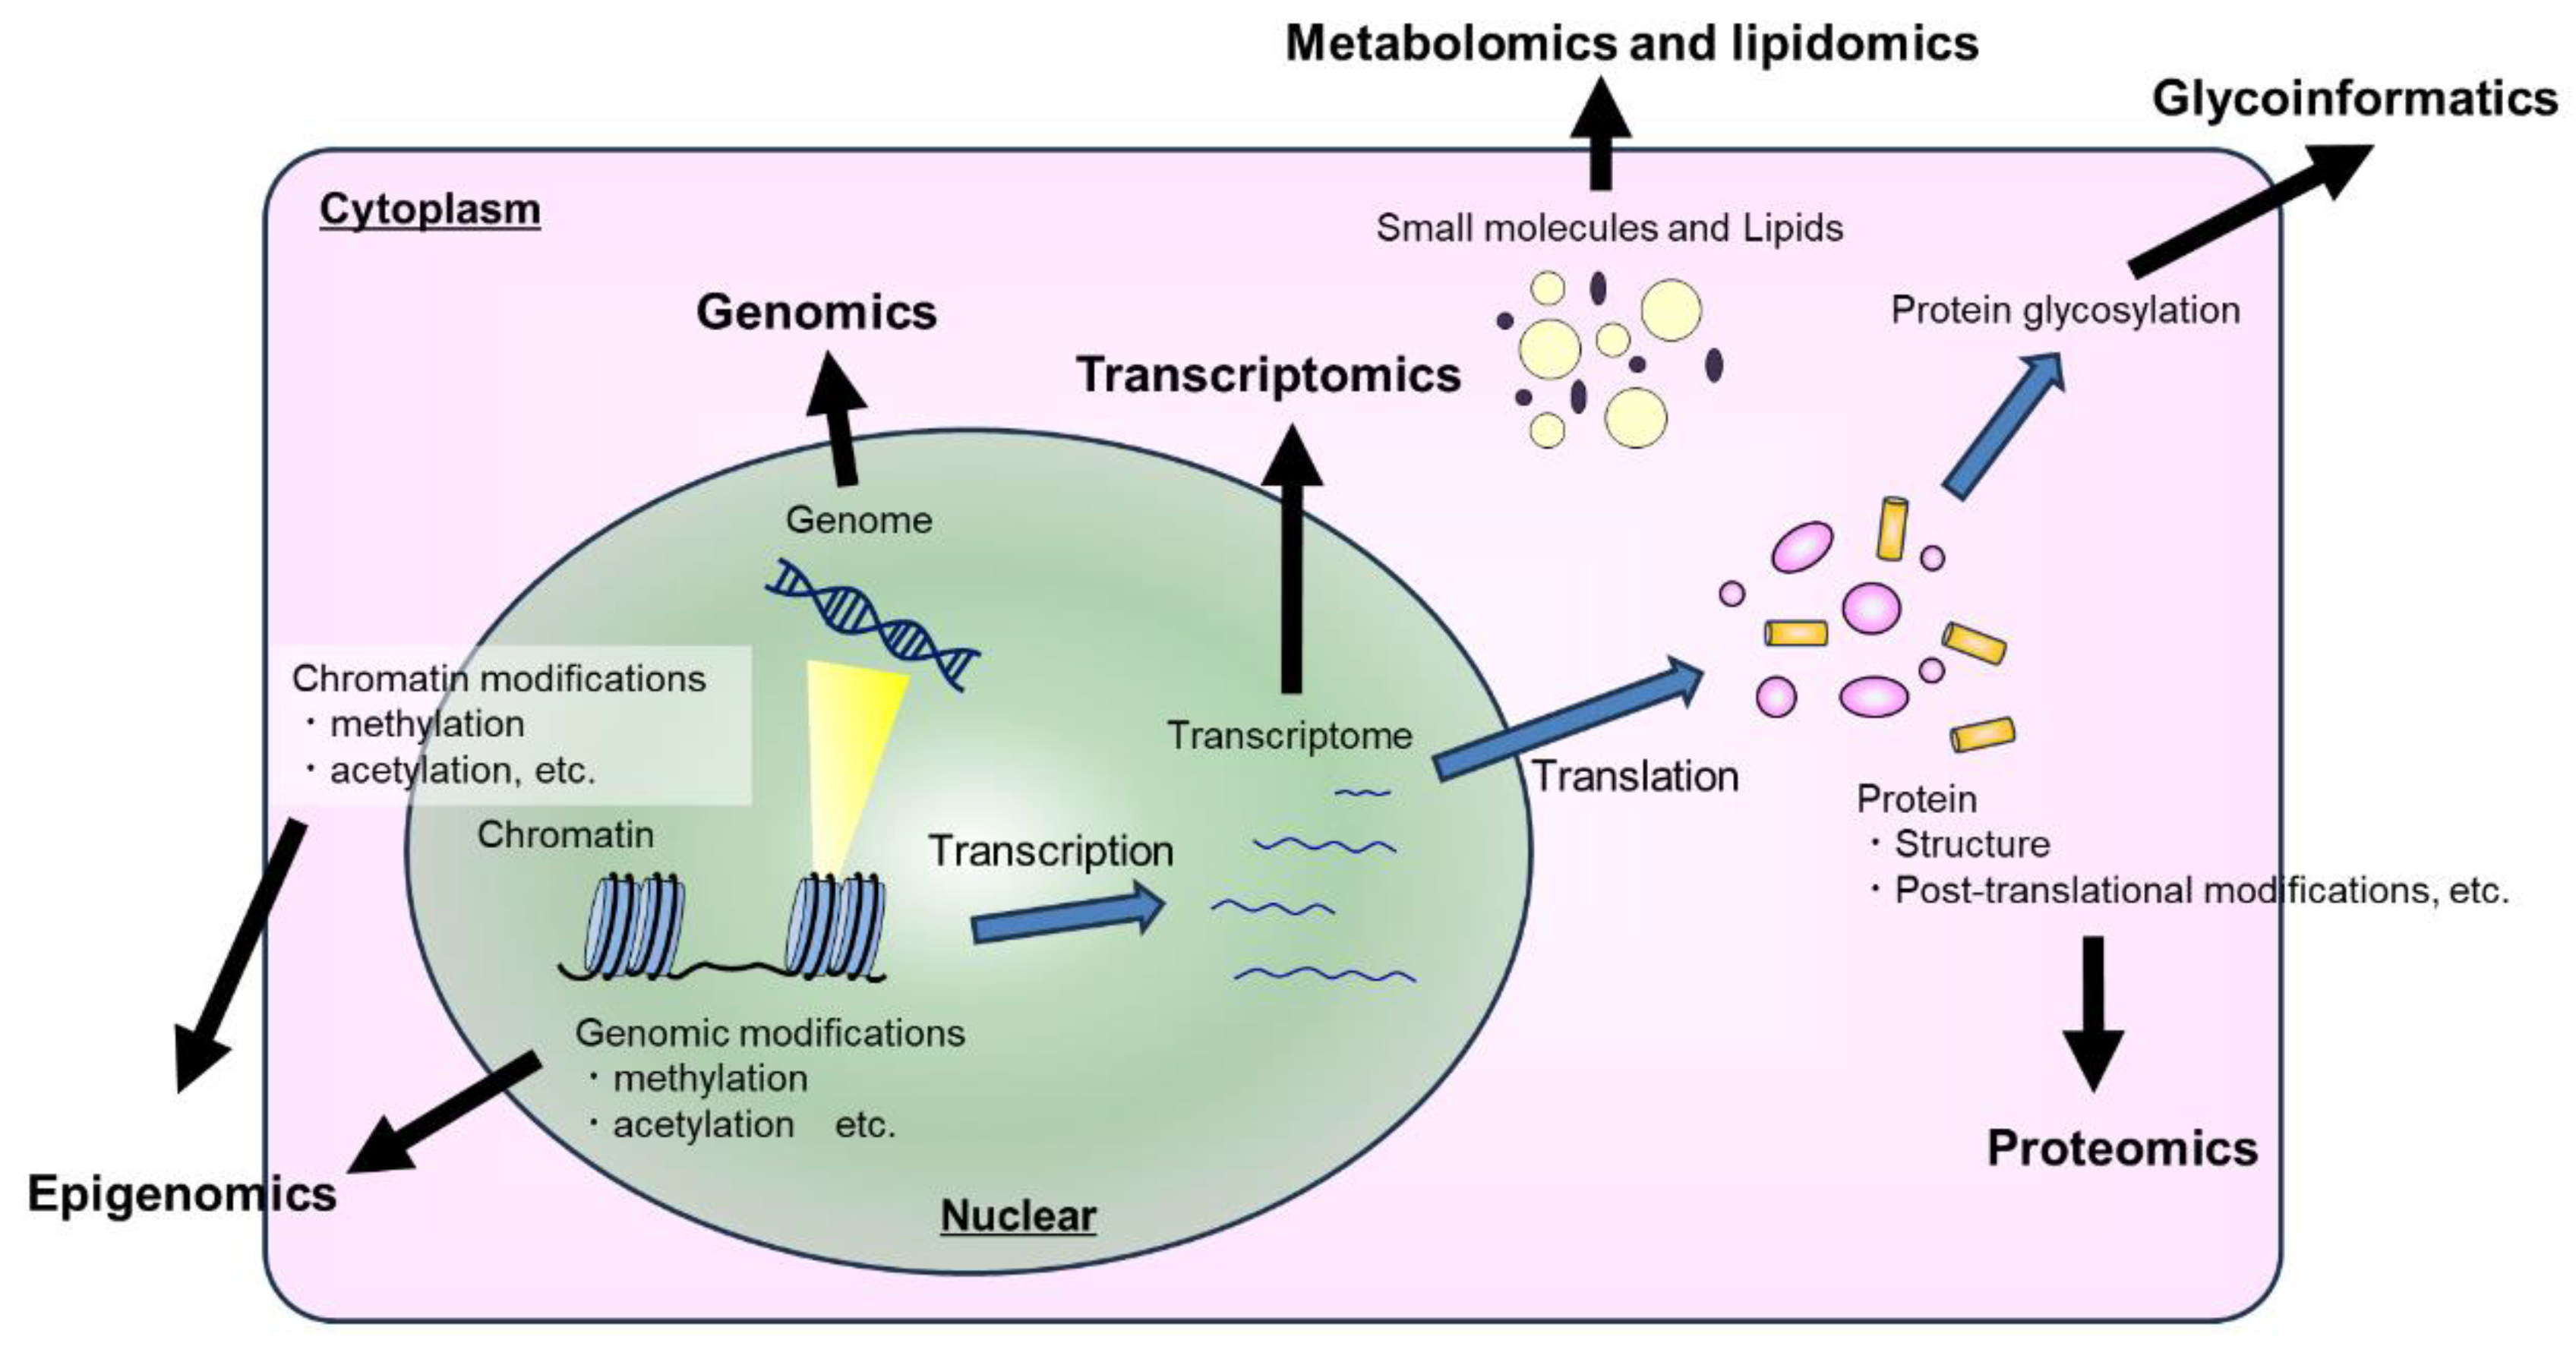
Figure 1.
There are numerous omics methods, but each provides insight into a distinct aspect of the biological state of a sample. Genomics and epigenomics focus on the sequence and accessibility of the genetic material, whereas transcriptomics, proteomics, metabolomics, and glycoinformatics examine the expression levels, post-translational modifications, and biochemical activity of proteins and other biomolecules under different conditions.
Disclaimer/Publisher’s Note: The statements, opinions and data contained in all publications are solely those of the individual author(s) and contributor(s) and not of MDPI and/or the editor(s). MDPI and/or the editor(s) disclaim responsibility for any injury to people or property resulting from any ideas, methods, instructions or products referred to in the content. |
© 2024 by the authors. Licensee MDPI, Basel, Switzerland. This article is an open access article distributed under the terms and conditions of the Creative Commons Attribution (CC BY) license (http://creativecommons.org/licenses/by/4.0/).
Copyright: This open access article is published under a Creative Commons CC BY 4.0 license, which permit the free download, distribution, and reuse, provided that the author and preprint are cited in any reuse.


