Submitted:
12 November 2024
Posted:
12 November 2024
You are already at the latest version
Abstract
The Hulunbuir grasslands are a crucial ecological security barrier in northern China. However, owing to factors such as overgrazing and climate change, it has experienced considerable degradation. Understanding the current state of grassland degradation and elucidating its impact on vegetation-soil relationships is of paramount importance. This study employed a combination of remote sensing monitoring and field surveys to assess the degradation status of the Hulunbuir grasslands. Field surveys were conducted to examine vegetation community structure and soil nutrient status at different degradation stages. Grassland degradation significantly affected the species composition of vegetation communities. As degradation intensified, species richness declined, with the proportion of Gramineae and Legume species decreasing and Asteraceae species increasing. Additionally, the proportion of annual species initially increased and then decreased. Degradation also markedly reduced aboveground, belowground, and litter biomass within the communities. Soil moisture, electrical conductivity, organic carbon, total carbon, total potassium, and hydrolyzable nitrogen contents in non-degraded areas were higher than those in severely degraded areas. Conversely, soil total phosphorus content and bulk density gradually increased with degradation. Nitrate nitrogen and ammonium nitrogen levels in severely degraded soils were significantly higher than those in non-degraded soils. Plant diversity and productivity are linearly correlated in the study area. Under the impact of degradation, soil nutrients were the primary factors influencing ecosystem productivity. Plant diversity had a significant positive impact on soil nutrients but did not significantly affect ecosystem productivity. These findings provide a theoretical basis for the effective management and restoration of degraded grasslands.
Keywords:
Hulunbuir grasslands
; Species diversity
; community productivity
; Soil nutrients
; the partial least squares path modeling
1. Introduction
Grasslands, which represent the largest terrestrial ecosystems on Earth, cover ~40 % of the surface of the planet and deliver numerous ecosystem services that are crucial to human society (Hu et al., 2016; Lyu et al., 2020). The Hulunbuir grasslands are one of China’s important bases for the animal husbandry industry and an integral part of the Eurasian grasslands. They boast a complex and diverse range of vegetation types, with over 1,000 species of grassland plants (Bai et al., 2008). In recent decades, due to overgrazing and climatic aridity, large areas of the Hulunbuir grasslands have degraded. Grassland degradation leads to a series of ecological and environmental issues, such as reduced productivity (Auffret et al., 2018), loss of biodiversity (Zhou et al., 2020), and weakened ecosystem services (Zhou et al., 2020), which also severely impact the economic development of local herders. Therefore, correctly monitoring and assessing the degradation status of the Hulunbuir grasslands is an essential prerequisite for formulating conservation measures and managing grasslands. Due to cost constraints, field surveys typically cover only a limited number of sample points, making it challenging to achieve comprehensive coverage at large scales (Wan et al., 2016). Therefore, in this study, remote sensing technology was employed, and vegetation coverage was selected as an indicator for assessing grassland degradation in Hulunbuir (Ministry of Ecology and Environment, 2021). This approach enables spatial coverage over a large scale.
Grassland degradation notably alters plant community composition, modifies soil nutrient characteristics, and leads to biodiversity loss and ecosystem function decline (Gang et al., 2014; Lyu et al., 2020; Raiesi and Salek-Gilani, 2020). As degradation progresses, there are noticeable shifts in grassland community structure and dominant species, coupled with a general decline in biomass. In addition to plant composition, grassland degradation reduces soil organic carbon (SOC), total or available N, and P concentrations, and their stocks (Dong et al., 2012; Wang et al., 2014), which, in turn, contributes negatively to plant composition in terrestrial ecosystems (Cheng et al., 2007; Potthoff et al., 2005; Robertson et al., 1988). Research has indicated that in relatively moist grassland ecosystems, such as alpine meadows, biodiversity peaks under moderate grazing intensity. Conversely, in arid ecosystems, such as desert grasslands, species diversity markedly declines as grazing intensity increases (Gao and Carmel, 2020). Additionally, grassland degradation can affect plant community structure by altering species composition, thereby suppressing gramineous species (Rada et al., 2014). Therefore, elucidating the influence of grassland degradation on changes in vegetation community composition and soil nutrients is crucial for developing effective restoration strategies for degraded grassland ecosystems.
Aboveground and belowground biomass are important indicators of grassland ecosystem productivity and function. The relationship between biodiversity and productivity in grasslands remains controversial in ecosystem function and stability research (Axmanová et al., 2013; Wu et al., 2019). This relationship is complex and affected by many factors (A. M.fti et al., 1977; Gillman and Wright, 2006; Gough et al., 1994; Hector and Bagchi, 2007; McNaughton, 1983; Zhang et al., 2018). Soil nutrients are important abiotic factors that affect vegetation productivity (Tilman, 1985), and vegetative growth and biomass depend heavily on the availability of soil nutrients (Sardans et al., 2017). Conversely, the chemical composition of plant residue and soil nutrient status influence microbial activity and community structure, in turn affecting the litter decomposition rate (Aneja et al., 2006). Empirical evidence shows varied correlations between biodiversity and productivity—a positive linear relationship has been observed in the Eurasian Steppe (Bai et al., 2007), and a weak positive relationship in the Qinghai-Tibetan Plateau (Fayiah et al., 2019). Wang et al. (2013) demonstrated no significant correlation between plant species richness and community productivity in the semi-arid regions of Tibet (Wang et al., 2013). Zhang et al. (2011) used ordinary least squares regression (OLS) to examine the form (linear vs quadratic) of relationship between productivity and species richness across different scales. They noted that this relationship could change with special research scales in the temperate steppes of Inner Mongolia (Zhang et al., 2011). SOC, total N, total P, and available N concentrations are positively correlated with plant productivity (Li et al., 2006; Wang et al., 2010; Zuo et al., 2009). The regulation of vegetation productivity by plant diversity has received considerable attention from researchers (Erfanzadeh et al., 2015; Grace et al., 2016). In Tanzania’s Mount Kilimanjaro, researchers studied the relationship between species richness and ecosystem functions along an altitudinal gradient, from lowlands to high mountains (Albrecht et al., 2021). The results showed that the relationship between species richness and ecosystem functions is influenced by environmental conditions, including climate, land use, and soil properties. However, few studies have adequately investigated the relationship between plant diversity and productivity shaped by grassland degradation and the role of abiotic factors (soil nutrients) in this process on larger scales.
Therefore, the main objective of this study is to quantitatively assess the degradation status of the Hulun Buir grasslands using remote sensing and to investigate how the composition, diversity, biomass of plant communities, and soil nutrients are affected by grassland degradation. Based on the remote sensing assessment, five levels of vegetation degradation were identified: non-degraded grassland (ND), slightly degraded (LD), moderately degraded (MD), severely degraded (SD), and extremely degraded (ED). Field vegetation surveys and soil physicochemical property measurements were conducted in the HulunBuir grasslands from July to August 2023. The study established three specific objectives: (1) to examine how the characteristics of plant communities, including species composition, diversity, and biomass, change with grassland degradation; (2) to determine how soil nutrient characteristics vary across different stages of grassland degradation; (3) to explore how grassland degradation shapes the relationship between plant diversity and productivity, and the role of abiotic factors (soil nutrients) in this process. We hypothesize that as the degree of vegetation degradation increases, (1) plant species richness will decline due to the deterioration of the growing environment, leading to simplified composition and structure, reduced plant diversity, and decreased biomass; (2) soil nutrient content will decrease due to reduced litter input and accelerated nutrient decomposition following vegetation degradation; (3) grassland degradation will have a negative impact on plant diversity and biomass, with a linear correlation between the two; soil nutrient conditions will affect biomass accumulation and exert some influence on the relationship between diversity and productivity.
2. Materials and Methods
2.1. Study Sites
The Hulunbuir grasslands, located in the northeastern part of the Inner Mongolia Autonomous Region, China. They span from 47°05’ to 53°04’ north latitude and from 115°31’ to 126°04’ east longitude. The soil is primarily dark and chestnut chernozem (Gan et al., 2019), and the average elevation ranges between 650 and 700 m, with the terrain sloping from east to west. The climate is mid-temperate continental monsoon, with average temperatures between -3 and 0 °C and a frost-free period of 40 to 130 days. Precipitation in the Hulunbuir grasslands decreases gradually from east to west, with an annual rainfall of 250– 500 mm, concentrated mostly in July and August. The annual evaporation rate ranges from 900 to 1630 mm.
2.2. Grassland Degradation Evaluation
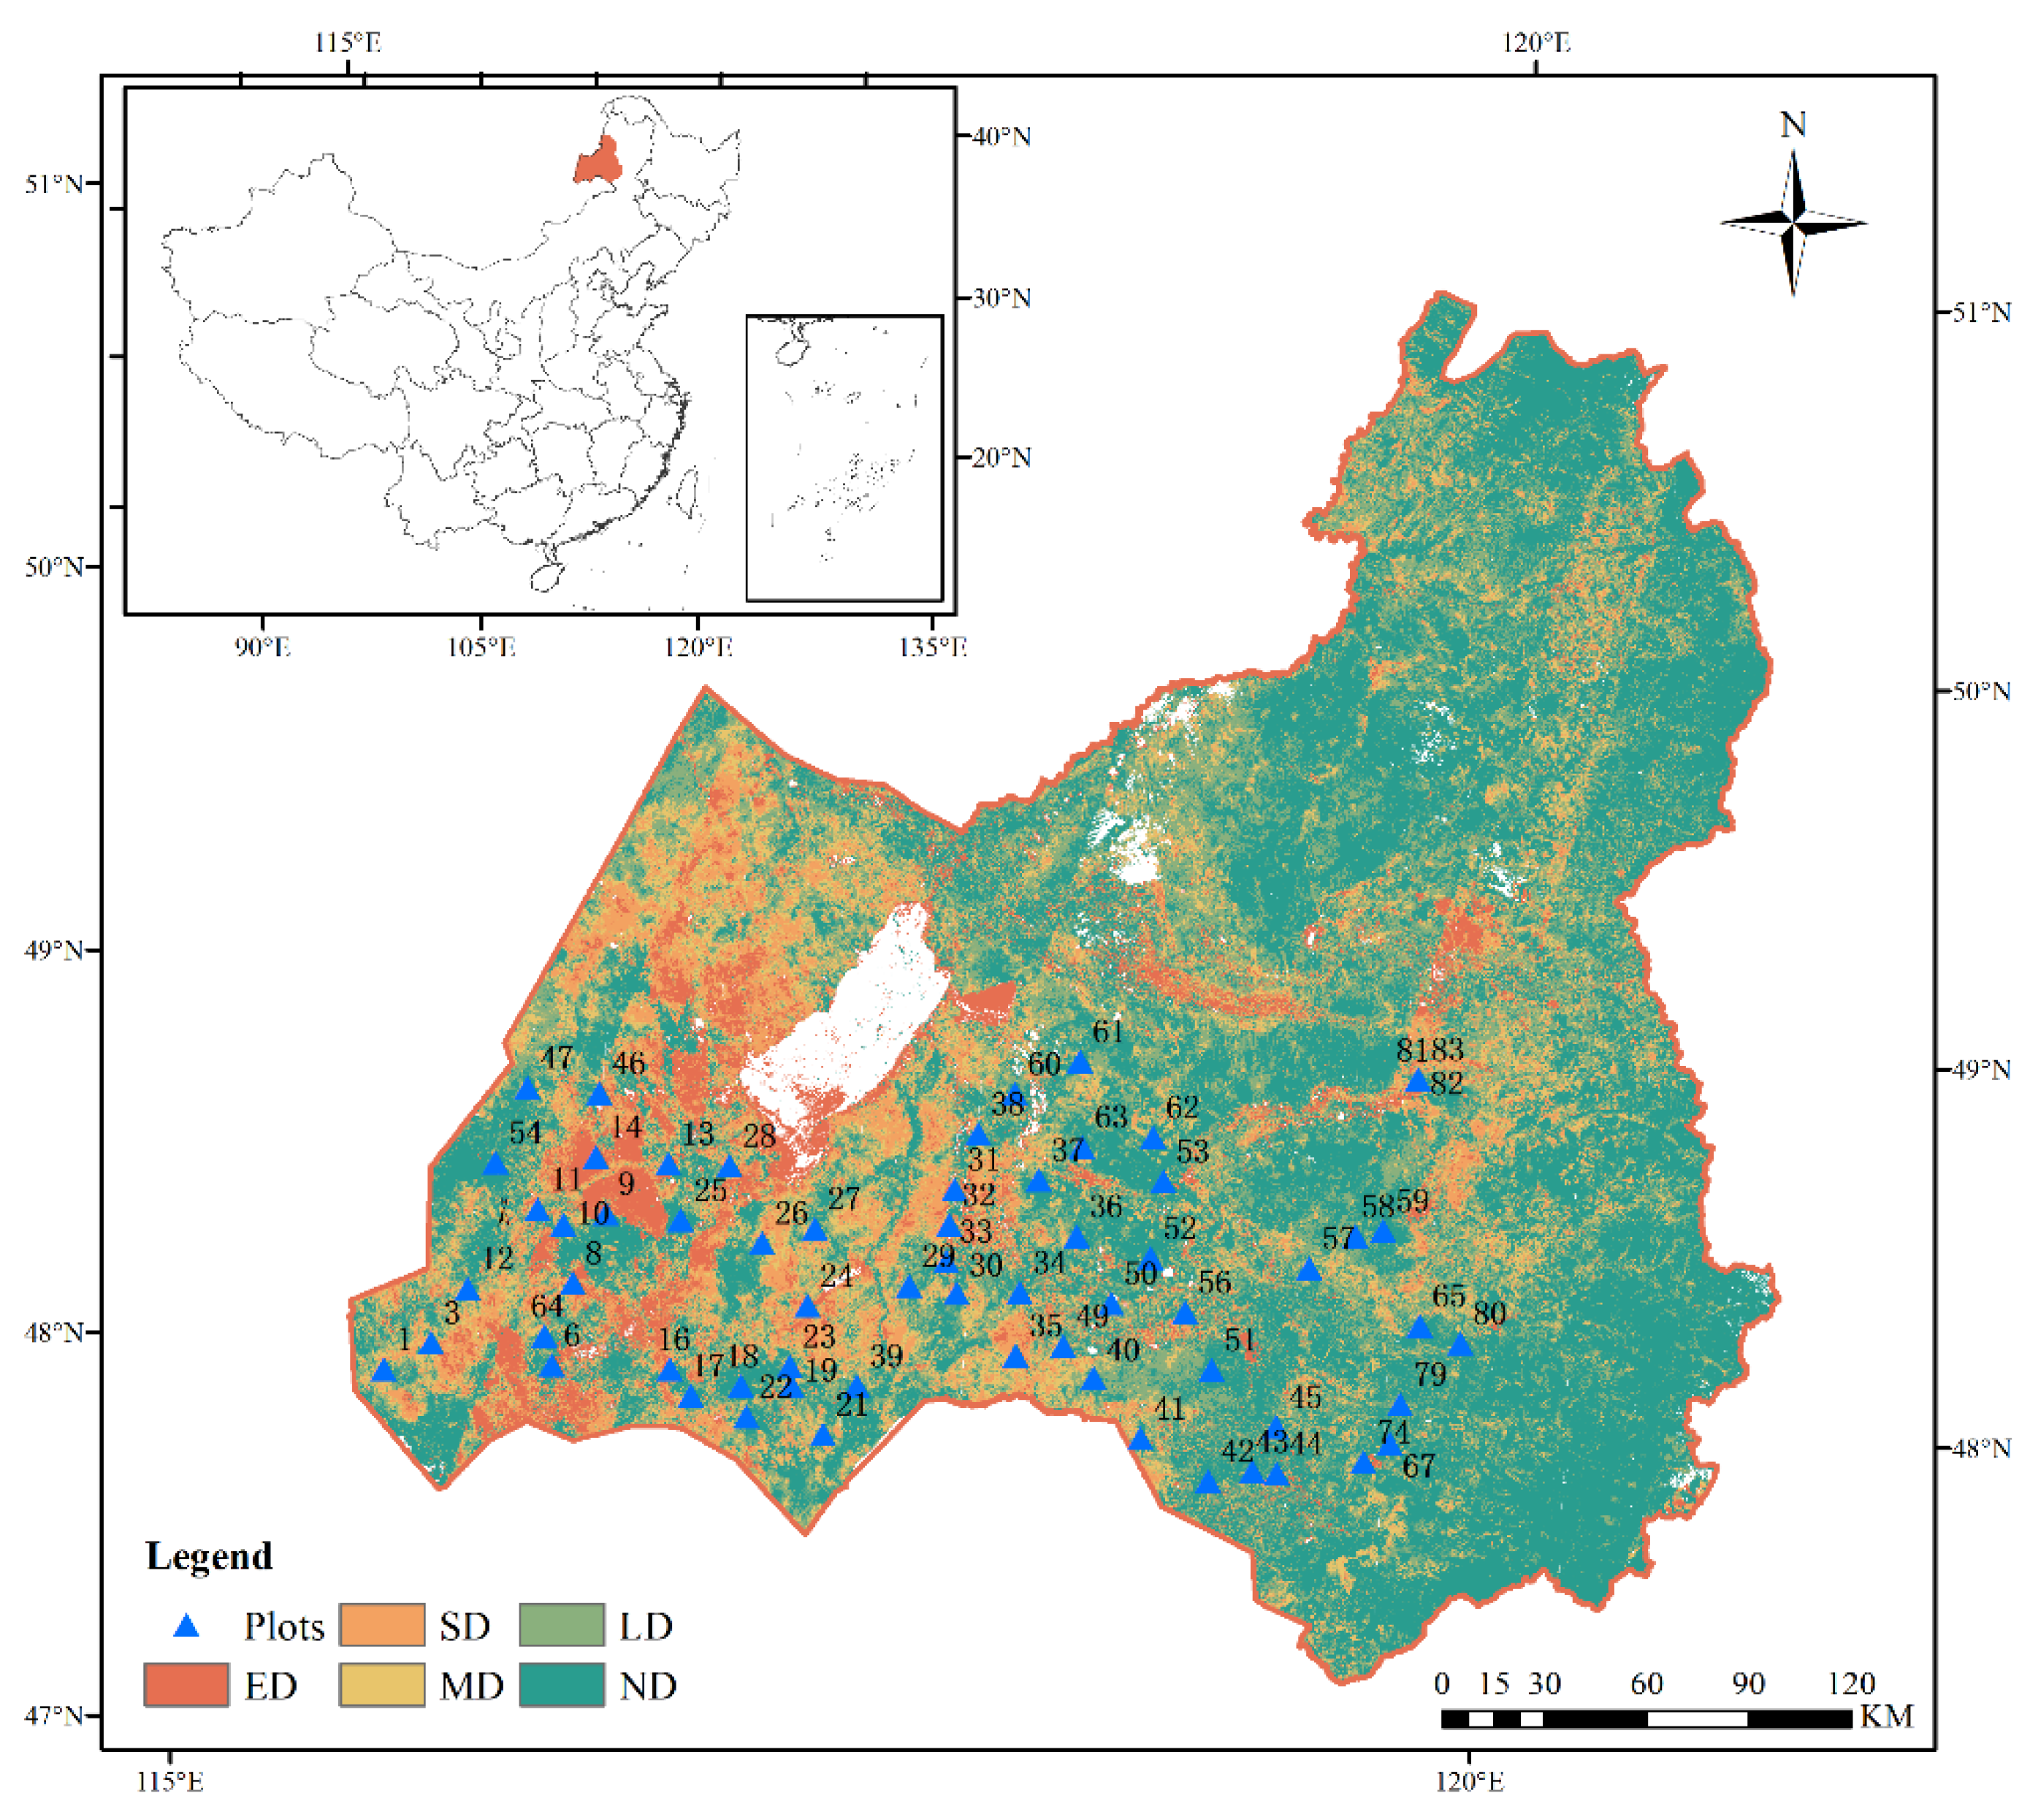
The degradation status of the Hulunbuir grasslands was assessed using quantitative remote sensing. Landsat 7 and 8 remote sensing data with a spatial resolution of 30 m were used to calculate the annual maximum normalized difference vegetation index (NDVI) during the growing season (May to September) and subsequently, the vegetation cover from 2000 to 2023. For each pixel, the year with the maximum grassland cover was removed, and the maximum cover of the remaining five years was selected. The sliding average for these five years was used as a reference for non-degraded grassland to calculate the GDI. Based on the spatial distribution pattern of land degradation in the Hulunbuir grasslands and its spectral landscape characteristics, combined with the grading indicators for degradation, desertification, and salinization of natural grasslands (GB/19377-2003) (General Administration of Quality Supervision, Inspection, and Quarantine of the People’s Republic of China, 2003), and referring to relevant on-site survey factors—vegetation biomass and coverage —the degree of degradation of the Hulunbuir grasslands in 2023 was classified according to Table 1.
Figure 1.
Degradation of grassland and plots setting in Hulunbuir. ND, LD, MD, SD and ED represent non-degraded, lightly degraded, moderately degraded, severely degraded, and extremely degraded grasslands.
Figure 1.
Degradation of grassland and plots setting in Hulunbuir. ND, LD, MD, SD and ED represent non-degraded, lightly degraded, moderately degraded, severely degraded, and extremely degraded grasslands.
2.3. Vegetation Sampling
From July to August 2023 (plant growing season), a sampling survey was conducted during the peak vegetation growing season in the Hulunbuir grasslands—conducive to the collection of plant indicators. Within the survey area, a 20 km × 20 km grid was designed, and survey plots were evenly set up according to the degree of grassland degradation and vegetation type distribution map (1-2 plots per grid), totaling 64 plots: 15 ND plots, 12 LD plots, 11 MD plots, 14 SD plots, and 12 ED plots. Each plot contains 3 replicates of 1 m² quadrats, set up according to the principle of representativeness to capture the grassland vegetation, topography, and soil characteristics of the entire plot (National Forestry and Grassland Administration, Department of Forest Resource Management, 2022). Within each quadrat, various vegetation characteristics were measured and recorded, including the species, number of individuals, plant height, percentage cover, and total community cover. The density of each plant species was calculated based on the number of individuals within the quadrat and the quadrat area. For plant height, the average of 3-5 randomly selected individuals per species was taken; if there were fewer than 3 individuals, all were measured and the average was taken (Liu et al., 2022). Aboveground biomass (AGB) was obtained using the harvest method, where each plant species within the yield quadrat was cut at ground level, dried in a 65°C oven to a constant weight, and weighed (Sun et al., 2018). Belowground biomass (BGB) was obtained by randomly selecting three points in the yield quadrat and using a root drill with a diameter of 5 cm to collect soil samples with roots from the 0 to 60 cm soil layer. The root-containing soil samples were washed in a 20-mesh sieve, and the cleaned roots were dried in a 65°C oven to constant weight before being weighed (Chen et al., 2022). The importance values (Curtis, 1959), and Shannon–Wiener index (Shannon and Weave, 1949) of each plant species were calculated using the following formulae:
- (1)
- Importance value
- (2)
- Shannon–Wiener Index
In the above formulae, is the relative importance of species i;
2.4. Soil Sampling and Analysis
After removing the surface litter layer, a soil auger with a diameter of 4 cm was used to collect 0–5 cm of topsoil from each quadrat (Chen et al., 2022). Three samples from the same plot were mixed thoroughly to form composite sample. The collected soil samples were sieved through a sieve with a mesh size of 2.5 millimeters, placed in a sealed bag, and stored at a low temperature for subsequent physicochemical property measurements (Liu et al., 2024). Soil moisture content (MC) and bulk density (BD) were measured by collecting samples of the same depth using a ring cutter and aluminum box next to the soil sample collection points, weighing them before and after drying in a 65 °C oven to a constant weight. Soil pH and electrical conductivity (EC) were measured using the electrode potential method. Total nitrogen (TN) was analyzed by the Kjeldahl method. Soluble total nitrogen (STN) was assessed using a potassium-chloride solution and alkaline potassium persulfate, followed by ultraviolet spectrophotometry. Ammonium-N was extracted with a potassium-chloride solution and quantified using the indophenol blue colorimetric method. Nitrate-N was extracted with a potassium-chloride solution and measured by dual wavelength colorimetry. Total potassium (TK) was analyzed by the NaOH fusion-atomic absorption method. Total phosphorus (TP) was determined by the NaOH fusion-molybdenum antimony anti-colorimetric-ultraviolet spectrophotometry method. Soil organic carbon (SOC) was measured by the potassium-dichromate volumetric-external heating method. Total carbon (TC) was analyzed using an elemental analyzer. Hydrolyzable nitrogen (HN) was assessed by the alkali-hydrolysis diffusion method. Available potassium (AK) was determined by the molybdenum antimony anti-colorimetric method. Available phosphorus (AP) was measured by the flame-photometry method. The measurement of all physicochemical properties of the soil used the methodology in Bao Shidan (Bao, 2005).
2.5. Statistical Analysis
Species richness and the Shannon–Wiener diversity index were employed to characterize the α diversity of vegetation communities. Soil nutrients and plant characteristics (Shannon–Wiener index, plant species richness, plant AGB, and plant coverage) were presented as the mean ± standard error. An analysis of variance (ANOVA) was conducted using SPSS version 20.0 on the soil nutrients and plant variables at different degradation stages, with Duncan’s test (P < 0.05) employed to determine significant differences. The Welch test was used for indicators that did not meet variance homogeneity, and the Games–Howell test (P < 0.05) was used to test inter-group significance. Soil nutrient parameters were included as environmental factors and standardization was performed to account for the different units of measurement in the data.
A redundancy analysis (RDA) was used to analyze effects of soil nutrients on vegetation biomass. Because the maximum value of the first four axes of the detrended correspondence analysis ranking was 2.72, the RDA was chosen. A Monte Carlo permutation test was used to determine the environmental factors that had significant effects on vegetation. Based on the significant correlation between species richness and the Shannon–Wiener index, species richness was selected for a linear regression analysis. Partial least squares path modeling (PLS-PM) was performed using the PLS-PM package in R software (version 4.3.2) to determine the direct and indirect driving factors affecting plant biomass. The model comprises two sub-models: (1) the measurement model, in which the observable variables are related to their latent variables—for example, plant coverage and proportion of annual species are defined as observable variables, and their corresponding latent variable is grassland degradation; and (2) the path model, in which some latent variables are associated with other latent variables.
3. Results
3.1. Vegetation Characteristics in Grasslands with Different Levels of Degradation
3.1.1. Plant Community Composition
In the study area, the plant communities at different stages of degradation comprised 158 species distributed across 36 families and 105 genera. The species composition was predominantly characterized by members of the Asteraceae, Poaceae, Cyperaceae, Rosaceae, and Leguminosae families, which collectively accounted for 86 % of the total species. Grassland degradation significantly altered biomass ratios at the branch level. With grassland degradation, the Gramineae and Leguminosae proportions decreased, while the Asteraceae and Lamiaceae proportions increased (Figure 2A). Compared with the ND stage, the gramineous plants declined by 59.13 % in ED stages, whereas the legumes declined by 61.24 % in ED stages. In addition, with an increase in the degree of degradation, the proportion of annual plants first increased and then decreased, reaching the maximum value in the MD stage, whereas the proportion of perennial plants exhibited the opposite (Figure 2B).
Plant species differed at different degradation stages. A total of 104 plant species were identified in the ND stage, with species such as Leymus chinensis (22.1 %) and Carex duriuscula (18.2 %) being dominant. In the LD stage, there were 85 plant species, whereas the MD stage comprised 58 species, with C. duriuscula at 14.8 and 17.8 %, L. chinensis at 11.4 and 15.2 %, and Cleistogenes squarrosa at 10.2 and 11.6 %, respectively, dominating these two stages. The SD stage contained 74 plant species, with the dominant species being C. duriuscula (24.3 %), C. squarrosa (11.6 %), Stipa grandis (7.9 %), and Allium bidentatum (6.4 %). At the ED stage, 50 plant species were present, such as C. duriuscula (17.6 %), A. bidentatum (12.8 %), C. squarrosa (8.4 %), and Suaeda glauca (8.1 %) (Figure 3). Integrating the findings, it is observed that with the degradation of grasslands, dominant species such as Leymus chinensis are progressively declining, while species like Carex kobomugi and Allium mongolicum are increasingly playing a significant role. Meanwhile, Carex duriuscula maintain a dominant position throughout the succession of the degraded grassland habitat, indicating its broad ecological niche and resistance to disturbance. These changes are attributed to the deterioration of the degraded environment and the growth strategies adopted by the vegetation (Chapin et al., 1993; Davidson et al., 2006).
3.1.2. Plant Diversity and Biomass
Species diversity of plant communities was significantly affected by grassland degradation. As shown in Figure 4, the Shannon–Wiener index and richness indices changed consistently. At different stages of grassland degradation, the richness and Shannon– Wiener indices in the ND and LD stages were significantly higher than those in the SD stage (P < 0.05), with no significant differences observed in the other degradation stages (Figure 4A, B). With an increase in grassland degradation, grassland vegetation cover decreased. Compared to the ND stage, plant coverage in the LD stage decreased slightly by 4.05 %, whereas the MD, SD, and ED stages decreased significantly by 17.64, 15.50, and 28.89 % (F = 7.934, P < 0.01), respectively (Figure 4C). Grassland degradation significantly affected the AGB and litter biomass (LB) of plant communities. AGB and LB in the ED stage were significantly lower than those in the ND and LD stages (P < 0.05) and both showed a decreasing trend with increasing degradation levels (Figure 4D, E). Compared to the changes in AGB, BGB exhibited a lag effect with the progression of grassland degradation. Compared to the ND stage (2196.5 g/m²), BGB in the LD, MD and SD stages decreased by 2.9, 25.97, and 20.65 %, respectively, but the differences were not significant. In the ED stage, BGB significantly decreased by 52.99 % (F = 5.669, P < 0.01), consistent with the AGB and LB changes (Figure 4F).
3.2. Soil Nutrient Characteristics in Grasslands with Different Levels of Degradation
The changes in soil factors at different stages of grassland degradation are shown in Figure 5. The contents of HN, AK, SOC, STN, TN, TK, and TC showed a decreasing trend with degradation progression (Figure 5A, B, I, J, K, L, M). Compared to the ND stage, the HN content in the LD, MD, SD, and ED stages decreased significantly by 28.70, 41.66, 47.04, and 61.24 %, respectively (F = 12.79, P < 0.01). The SOC and TC contents in the ED decreased significantly by 40.02 % (F = 3.131, P = 0.0211) and 39.08 % (F = 3.382, P = 0.0147), respectively. The TK content in the ED stage was significantly lower than that in the ND, LD, and SD stages by 11.11, 9.87, and 11.24 %, respectively (F = 5.114, P < 0.01). The MC of the ND stage was significantly higher than that of the LD, MD, SD, and ED stages (F = 13.16, P < 0.01), showing a decreasing trend with degradation (Figure 5E). The soil EC in the ND stage was significantly higher than that in the LD, MD, and SD stages (F = 7.961, P < 0.01), with a slight increase in the ED stage, but the difference was not statistically significant (Figure 5D). Unlike other soil nutrients, the TP content of the ED stage was significantly higher than that of the ND and LD stages by 46.43 and 78.26 %, respectively (F = 4.234, P < 0.01) showing an increasing trend with degradation (Figure 5N). Soil pH and BD content also showed an increasing trend with degradation. Compared with the ND stage, the BD content in the MD, SD, and ED stages increased significantly by 17.36, 14.88, and 23.14 %, respectively (F = 9.045, P < 0.01). Soil pH in the ED stage was significantly higher than that in the ND, LD, and MD stages (F = 6.49, P < 0.01) (Figure 5H, O). The ammonium-N and nitrate-N contents in the ED stage were significantly higher than that in the other four stages for ammonium-N (F = 47.26, P < 0.01) and significantly higher than the ND stage for nitrate-N (F = 3.033, P = 0.0242), showing an increasing trend with degradation (Figure 5F, G).
3.3. Soil Nutrient Effects on Plant Biomass in Grasslands with Different Degradation Levels
RDA can be used to explore the patterns and factors influencing changes in plant biomass in degraded grasslands. RDA was applied to analyze the relationship between the plant biomass characteristics of the degraded grassland and soil nutrient indicators. The results showed that the two axes had significant explanatory power for the relationship between vegetation diversity and environmental factors. RDA1 positively correlated with TK, STN, SOC, MC, and TC and negatively correlated with ammonium-N, BD, EC, TN,TP, and pH. RDA2 positively correlated with HN, TN, MC, SOC, and AP and negatively correlated with BD, pH, and TP (Figure 6). Additionally, the results illustrate a trend in which, with increasing levels of degradation, the distribution and structure of plant biomass became more homogeneous, as evidenced by the decreasing range of biomass distribution (Figure 6). This pattern may be attributable to the inability of many species to sustain their biomass during the severe degradation stages, resulting in diminished diversity in biomass distribution. The RDA results show that TK, BD, pH, SOC, and TC have the greatest impact on the composition of species biomass, while the effects of TK, nitrate-N, and EC are relatively minor. Additionally, there is a positive correlation between TK and both SOC and TC, whereas there is a negative correlation between TK and soil BD, as well as pH. Based on the CCA results, a Monte Carlo permutation test was used to determine the soil environmental factors that significantly impacted vegetation biomass. The test revealed that the soil nutrient factors SOC, TC, HN, BD, pH, and TK significantly affected plant biomass (P < 0.05). The P-values for both TK and BD were 0.001, indicating that the TK content and soil BD had the greatest impact on plant biomass in the study area (Table 2).
3.4. Plant Biomass, Soil Nutrients, and Plant Diversity Relationships
Based on the RDA results, soil nutrient factors such as SOC, TC, HN, BD, pH, and TK were selected for linear regression analysis because of their significant impact on plant biomass. The vegetation richness index was significantly positively correlated with the Shannon–Wiener diversity index (P < 0.001). Therefore, the vegetation richness index was used as a substitute for the Shannon–Wiener diversity index in the linear regression analysis. The regression analysis (Figure 6) demonstrates varying degrees of correlation between species richness and different measures of biomass and soil nutrient properties. The AGB and BGB showed a positive relationship with species richness (R² = 0.26, P < 0.001 for AGB and R² = 0.31, P < 0.001 for BGB), suggesting that ecosystems with greater species diversity tended to have higher AGB and BGB (Figure 7A, B). Conversely, the LB was not significantly correlated with richness (R² = 0.01, P = 0.344). SOC, TC, and TK were positively correlated with species richness (R² = 0.27, P < 0.001 for SOC; R² = 0.33, P < 0.001 for TC; and R² = 0.10, P = 0.011 for TK), indicating that richer ecosystems may contribute to higher soil carbon and potassium storage (Figure 7D, E, I). Soil BD (R² = 0.22, P < 0.001) and pH (R² = 0.08, P = 0.022) were significantly negatively correlated with species richness (Figure 7G, H). These results collectively underscore the complex interactions among plant diversity, various aspects of ecosystem functions, and resource cycling.
3.5. Plant Diversity and Soil Nutrient Effects on Plant Biomass
The PLS-PM depicted in Figure 8 elucidates the direct and indirect influences of grassland degradation impact on plant diversity, soil nutrients, and biomass. Calculating the variance inflation factor for each variable indicated no excessive collinearity among the variables, affirming their suitability for constructing a path model. The observable variables (pH, HN, and LB) exhibited low loadings for their respective latent variables. Consequently, these variables were removed before conducting the path analysis to ensure the integrity of the model and analytical precision. Grassland degradation is inversely correlated with plant diversity, presenting a significant negative effect (standardized path coefficient = -0.456, P < 0.001), suggesting that with grassland degradation, plant diversity decreased. Simultaneously, grassland degradation detrimentally influences soil nutrient levels (standardized path coefficient = -0.326, P < 0.01). The direct effect of grassland degradation on biomass was significant, with the path model exhibiting a negative standardized path coefficient of -0.317 (P < 0.001). Grassland degradation indirectly influences biomass by affecting plant diversity and soil nutrients. The results also revealed how plant diversity and soil nutrient variables affect plant biomass. Soil nutrients positively affected plant biomass (standardized path coefficient = 0.539, P < 0.001). However, the direct effect of plant diversity on biomass was not statistically significant (standardized path coefficient = 0.117), indicating that soil nutrients may play a more substantial role than plant diversity in determining biomass during grassland degradation.
4. Discussion
4.1. Grassland Degradation Effects on Plant Composition and Diversity
Grassland degradation modifies community composition and diversity. Here, from the ND to ED degradation stages, the mass proportions of gramineous plants, and legumes decreased, whereas those of Asteraceae plants increased. Species richness gradually declined, as did the importance values of dominant species such as Leymus chinensis, while those of Cleistogenes squarrosa and Allium bidentatum increased, simplifying the vegetation community structure. This pattern results from prolonged selective grazing by livestock, which significantly reduces the proportion and biomass of high-quality pasture grasses (Wang et al., 2014; Xu et al., 2019). Meanwhile, the proportion of toxic weeds, such as Stellera chamaejasme, Asparagus cochinchinensis, and Orostachys fimbriatus increased, leading to the dominance of low-quality forage and the evolution of a mixed grass community (Wang et al., 2005). The proportion of annual plants first increased and then decreased during grassland degradation, reaching a maximum at MD stage. This may be due to the fact that annual plants generally have a high reproductive capacity and the ability to rapidly occupy space. These plants can rapidly grow and reproduce during the early stages of grassland degradation. However, during the severe grassland degradation stage, soil quality deteriorated further, and the proportion of annual plants with poor adaptability could not continue to maintain their competitive advantages, resulting in the decline of annual plants, which were replaced by some more tolerant perennials or desertification indicator plants, such as Achnatherum splendens. The Shannon–Wiener diversity index typically peaked in the LD stages, decreased slightly in the ND stages, and diminished further as degradation intensified, supporting the intermediate disturbance hypothesis (Yuan et al., 2016). Yuan et al. conducted a study on the temperate grassland system in Inner Mongolia, focusing on the primary human disturbance factor in the region, which is the intensity of grazing. They analyzed the relationship between species richness and disturbance. Their research results support the intermediate disturbance hypothesis, indicating that human disturbance is a necessary condition for maintaining biodiversity in grassland systems (Yuan et al., 2016). Moderate grassland disturbances, such as grazing, can stimulate the regeneration of forage grasses, promote compensatory plant growth, eliminate redundancy in plant communities, and are beneficial for enhancing grassland productivity and maintaining the stability of grassland communities (Wang et al., 2005; Liu et al., 2023).
We also observed a significant decline in plant AGB and LB as degradation progressed (P < 0.01), indicating severe negative effects on plant productivity and soil- carrying capacity. In ecosystems approximating a soil-atmosphere system, the decomposition rate of litter and the rate of nutrient input from plants to the soil are critical variables governing the carbon cycle in grassland ecosystems (Han et al., 2020). Here, deeper degradation correlated with lower LB because of poorer baseline vegetation conditions in the ED stages which reduced the rate of nutrient input from plants to soil. Additionally, continual grazing and trampling by livestock may rapidly increase soil surface temperature (Song et al., 2017). Grazing may also reduce the cover of plant communities, potentially increasing photodegradation (Li et al., 2021), thereby accelerating the decomposition of surface soil organic matter. The impact of LD on BGB was not significant, likely because under the stress of grassland degradation—mainly due to climate change and excessive grazing—plants actively allocate biomass to various organs, enhancing the efficiency of resource acquisition and utilization. When nutrient scarcity results from degradation, plants prioritize root biomass to ensure nutrient uptake and utilization. This aligns with the optimal partitioning theory, which posits active regulation of biomass distribution among different organs by plants to maximize resource acquisition under resource-scarce conditions (Bloom et al., 1985).
4.2. Grassland Degradation Effects on Soil Nutrient Factors
Grassland degradation induced by overgrazing adversely affects soil nutrients (Wu et al., 2014). Our results showed that grassland degradation had severe negative effects on soil MC, EC, HN, AK, TN, TK, SOC, and TC compared to non-degraded conditions. However, it paradoxically increased soil pH and BD, which is in agreement with other findings (Frank et al., 1995; Steffens et al., 2008; Dai et al., 2021; Talore et al., 2016). During grassland degradation, surface vegetation cover decreased, leading to increased evaporation of the surface MC. This process, combined with the destruction of nutrient-rich clay particles in the soil, results in coarsening and soil quality depletion (Lai and Kumar, 2020). Additionally, soil compaction caused by livestock trampling increases soil BD, reduces soil permeability and water retention capacity, and accelerates soil salinization (Wang et al., 2012). SOC originates from the humification of litter residue and secretions released from the rhizosphere during plant growth (Dijkstra et al., 2006; Zhang et al., 2004). AGB decreased as vegetation degradation intensified (Figure 4E), resulting in a decrease in LB and the plant residue amount that can enter the soil, resulting in a decline in the main source of grassland SOC (Wang et al., 2014; Yan et al., 2018). Additionally, previous studies by Wu et al. (2010) and Dong et al. (2012) indicate that grazing can adversely affect the soil carbon pool and nitrogen sequestration, particularly under high grazing intensities. Conversely, the TP content increased as degradation progressed, as evidenced by a significant 46.43 % increase in the ED stage compared to the ND stage, which was different from some previous studies. This increase was primarily due to diminished phosphorus absorbed for root growth, associated with reduced vegetation biomass (Figure 4D, E, F) and phosphorus input from livestock excreta which in turn elevated soil TP levels (Hinsinger et al., 2011; Wang and Wesche, 2016).
The increase in degradation intensity resulted in decreases in community height and cover, AGB, and soil water-holding capacity, thus limiting the input of grassland soil nitrogen sources. This is consistent with other research findings (He et al., 2020) that indicate a consequent decrease in TN and HN content, both of which are correlated with soil carbon levels. Notably, the levels of ammonium-N and nitrate-N were significantly higher in the ED stage than in the ND stage, whereas the impact of grassland degradation on STN content was not significant. STN primarily consists of soluble organic nitrogen and inorganic nitrogen (ammonium-N and nitrate-N). The primary reasons for these differences are that most of the soluble organic nitrogen in the soil comes from root exudate and litter decomposition and is easily leached and reduced under overgrazing, resulting in a decrease in N mineralization (Pan et al., 2023; Reay et al., 2023; Zhang et al., 2022). Soil ammonium-N storage increased under overgrazing because of the increased ability of microorganisms to capture urine N, thereby reducing STN loss (Mosier et al., 2021). Furthermore, urea and ammonium-N—the major nitrogenous components of livestock excreta—can be directly utilized by plants or further transformed into inorganic N through microbial activity (Ali et al., 2021). Soil compaction by livestock trampling may alter soil aeration and moisture conditions, thereby affecting microbial activity and N mineralization processes (Maitlo et al., 2022), resulting in increased levels of ammonium-N and nitrate-N in the soil during ED stages. Climate factors also affect the inorganic nitrogen content in the soil. In years with high rainfall, intense grazing can increase nitrate-N content (Chen et al., 2023).
4.3. Grassland Degradation Effects on Soil Nutrient, Plant Diversity, and Plant Biomass Relationships
Changes in biodiversity are believed to dramatically affect the functioning of various ecosystems (Bai et al., 2010; Boyero et al., 2007; Hooper and Vitousek, 1997; Isbell et al., 2009; Jiang et al., 2007; Naeem et al., 1994; Tilman, 1999). Productivity may serve as the most integrated indicator of ecosystem function (Bai et al., 2004; Naeem, 2002). The RDA results revealed that soil nutrient factors (SOC, TC, HN, BD, pH, and TK) significantly affected plant biomass here, which is consistent with previous studies (Chen et al., 2021; Wang et al., 2022). Additionally, the linear regression analysis indicated a positive correlation between species richness and both aboveground and belowground biomass. However, other research has identified a hump-shaped or unimodal relationship between plant diversity and productivity, with diversity peaking at moderate productivity levels (Grime, 1973; Laughlin and Moore, 2009; Ni et al., 2007). Waide et al. (1999) analyzed 200 studies on plant-animal relationships and found that 30, 26, 12, and 32 % exhibited unimodal, positive linear, negative linear, and indeterminate relationships, respectively (Waide et al., 1999). Such variability is primarily due to the scale-dependent nature of the relationship between plant productivity and species diversity (Waide et al., 1999; Ni et al., 2007; Mittelbach et al., 2001; Harrison et al., 2006; Guo and Berry, 1998; Chase and Leibold, 2002; Chalcraft et al., 2004; Bai et al., 2007). Specifically, the unimodal relationship between biodiversity and plant productivity predominates at local scales but shifts toward a positive linear relationship at larger spatial scales (Bond and Chase, 2002; Gillman and Wright, 2006; Zhang et al., 2011). Our study recorded the highest annual productivity at 208.2 g/m², 17 times greater than the lowest productivity at 12.1 g/m². This range exceeds that reported in the North American prairies, where the highest productivity was only 13 times that of the lowest (Gross et al., 2000), thus supporting a positive linear relationship within this productivity range. The positive effects of biodiversity on ecosystem productivity can be explained by complementarity and selection effects (Loreau et al., 2001; Tilman et al., 1997). The complementarity effect arises from niche differentiation among species or positive interspecific interactions, which allows species to perform better in high-diversity communities. The selection effect refers to that a more diverse community has a higher probability of containing more-productive species. Researchers in grassland ecosystems on a global scale have found that the positive correlation between biodiversity and productivity gradually weakens and eventually becomes negative as productivity increases (Wang et al., 2019). This suggests that biodiversity influences productivity differently under different environmental conditions. This is different from the results of regional small-scale studies, so the study area scale factor should be fully considered when studying the relationship between biodiversity and productivity (Harrison et al., 2006; Gillman and Wright, 2006; Bai et al., 2007). In addition, studies have found that in forest ecosystems worldwide, climate change may alter the relationship between tree species diversity and productivity, affecting the ability of forests to adapt to drought and other environmental stresses (Ammer, 2019). The relationship between tree species diversity and forest productivity was not linear. With the increases of productivity, the positive effect of diversity on productivity gradually weakened, or even became negative. From a policy/management perspective, the positive biodiversity -productivity relationship in the world’s forests helps to justify rewarding landowners for protecting or enhancing the diversity of their native or planted forests (Barrett et al., 2016), as well as for the management and restoration of grassland ecosystems.
Plant diversity was positively correlated with soil TC, TK, and SOC but negatively correlated with soil BD and pH, consistent with the findings of Tilman et al. (1996) and Li et al. (2021). PLS-PM was used to further explore grassland degradation effects on these relationships. The results indicate that grassland degradation significantly and negatively affects plant diversity, biomass, and soil nutrients. Soil nutrients have emerged as key determinants of ecosystem productivity under the influence of degradation. Grassland degradation reduces essential nutrients, which directly affects plant growth and biomass production (Fay et al., 2015). In addition, degradation increases soil BD (Dong et al., 2012) and accelerates SOC depletion (Peng et al., 2018), which ultimately limits plant productivity. A high soil pH may decrease the capacity for SOC storage and nutrient supply in all biome types (Weil and Brady, 2017). High soil acidity increases SOC accumulation by inhibiting microbial activity and accelerating the leaching of dissolved organic carbon into the subsoil (Funakawa et al., 2014). The results also showed that plant diversity had a significant positive effect on soil nutrients. Highly diverse plant communities enhance soil nutrient cycling and microbial diversity through varied root structures and exudates (Bardgett and Wardle, 2010; De Deyn et al., 2008), thereby improving soil quality. Furthermore, high plant diversity increases belowground carbon inputs, enhances the diversity and activity of soil microbial communities, and suppresses carbon loss from microbial decomposition, thereby increasing SOC storage and enhancing ecosystem productivity (De Deyn et al., 2011; Fornara and Tilman, 2008; Lange et al., 2015). High plant diversity can have a positive impact on the availability of soil N and P by increasing community productivity, altering the quality of litterfall, and affecting the physical and chemical properties of the soil (Fay et al., 2015; Liu et al., 2021). Communities with high plant diversity can enhance soil nutrient cycling and microbial diversity through different root structures and exudates, thereby improving soil quality (Bardgett and Wardle, 2010). In turn, an increase in soil nutrients, especially N and P, can increase plant growth and total belowground C input, stimulating the growth of soil bacteria and fungi (Fornara and Tilman, 2008; Hu et al., 2024). These microorganisms form the basis of complex food webs and significantly affect the diversity-function relationship. An increase in soil nutrients may change the stoichiometry of nutrient elements in the soil, potentially giving certain nutrient-loving organisms a competitive advantage over others (Peng et al., 2018). Our study highlights the importance of the interlinks between soil nutrients, plant diversity, and biomass, as well as the need for an integrated approach for the effective management and restoration of degraded grasslands.
4.4. Limitations of the Study
Conducting research on monitoring and evaluating the degradation status of grasslands is of great value for the ecological restoration of grassland ecosystems. However, evaluation methods based on remote sensing data can be convenient, rapid, and cover large spatial scales, but they also have certain limitations. Grassland degradation is not only reflected in the vegetation cover on the surface but is also accompanied by changes in plant species, such as shifts in dominant species and a reduction in perennial species, which are important indicators of grassland ecosystem degradation (Ren et al., 2007). Additionally, remote sensing data on vegetation coverage is easily affected by climate and seasonal changes, which can introduce certain errors in the assessment of grassland degradation (Xie et al., 2008). Furthermore, the sample size does not cover the entire Hulun Buir grassland; only typical grasslands with varying degrees of degradation were selected for studying the vegetation-soil relationship in degraded grasslands, which may result in certain biases. Therefore, future research should aim to more accurately obtain field measurement information, fully integrate remote sensing technology with on-site measurements, strengthen validation efforts, and enhance the accuracy and precision of grassland degradation assessments.
5. Conclusion
As an important ecological resource, it is of great significance to evaluate grassland degradation and study vegetation-soil relationship in Hulunbuir Grassland. Based on the degradation degree of grassland classified by remote sensing and the data of vegetation and soil in field survey, the results showed that the dominant species changed and the biomass decreased significantly due to grassland degradation. Plant diversity generally increased and then decreased, peaking at the LD stage. Compared with ND grassland, AN, AK, TN, SOC, TK, TC, MC and EC in ED grassland were decreased, while BD, pH, ammonium nitrogen and nitrate nitrogen were increased. Plant diversity was significantly positively correlated with aboveground biomass and belowground biomass, as well as soil nutrient pools, especially total carbon and available carbon. Soil bulk density was negatively correlated with plant diversity. Partial least squares path modeling showed that grassland degradation had a significant negative impact on plant diversity, soil nutrient status, and biomass. Soil nutrients are the dominant factors affecting ecosystem productivity. The direct effect of plant diversity on biomass was not significant, suggesting that soil nutrient dynamics may replace the effect of plant diversity on biomass during grassland degradation. Therefore, effective management and restoration of degraded grasslands need to take into account both soil nutrient management and plant diversity conservation to enhance ecological stability and resilience.
CRediT statements
Yuxuan Wu: Conceptualization, Methodology, Software, Investigation, Data curation, Writing- Original draft preparation, Visualization. Ping Wang: Conceptualization, Methodology, Software, Investigation, Validation. Xiaosheng Hu: Conceptualization, Methodology, Software, Investigation. Ming Li: Conceptualization, Methodology, Investigation. Ding Yi: Methodology, Software, Investigation. Tiantian Peng: Conceptualization, Methodology, Investigation. Qiuying Zhi: Software, Investigation, Data curation. Qiqige Bademu: Software, Data curation. Wenjie Li: Methodology, Investigation. Xiao Guan: Conceptualization, Methodology. Junsheng Li: Conceptualization, Methodology, Software, Investigation, Supervision.
Funding
This work was supported by Hulunbuir Grassland Ecological Restoration Comprehensive Survey Project [grant numbers No.DD20230474].
References
- Al-Mufti, M.M.; Sydes, C.L.; Furness, S.B.; Grime, J.P.; Band, S.R. A Quantitative Analysis of Shoot Phenology and Dominance in Herbaceous Vegetation. J. Ecol. 1977, 65, 759–791. [Google Scholar] [CrossRef]
- Albrecht, J.; Peters, M.K.; Becker, J.N.; Behler, C.; Classen, A.; Ensslin, A.; Ferger, S.W.; Gebert, F.; Gerschlauer, F.; Helbig-Bonitz, M.; et al. Species richness is more important for ecosystem functioning than species turnover along an elevational gradient. Nat. Ecol. Evol. 2021, 5, 1582–1593. [Google Scholar] [CrossRef] [PubMed]
- Ali, S.; Liu, K.; Ahmed, W.; Jing, H.; Qaswar, M.; Anthonio, C.K.; Maitlo, A.A.; Lu, Z.; Liu, L.; Zhang, H. Nitrogen Mineralization, Soil Microbial Biomass and Extracellular Enzyme Activities Regulated by Long-Term N Fertilizer Inputs: A Comparison Study from Upland and Paddy Soils in a Red Soil Region of China. Agronomy 2021, 11, 2057. [Google Scholar] [CrossRef]
- Ammer, C. Diversity and forest productivity in a changing climate. New Phytol. 2018, 221, 50–66. [Google Scholar] [CrossRef]
- Aneja, M.K.; Sharma, S.; Fleischmann, F.; Stich, S.; Heller, W.; Bahnweg, G.; Munch, J.C.; Schloter, M. Microbial Colonization of Beech and Spruce Litter—Influence of Decomposition Site and Plant Litter Species on the Diversity of Microbial Community. Microb. Ecol. 2006, 52, 127–135. [Google Scholar] [CrossRef]
- Auffret AG, Kimberley A, Plue J, Waldén E (2018) Super-regional land-use change and effects on the grassland specialist flora. Nature Communications 9: 3464.
- Axmanová, I.; Chytrý, M.; Danihelka, J.; Lustyk, P.; Kočí, M.; Kubešová, S.; Horsák, M.; Cherosov, M.M.; Gogoleva, P.A. Plant species richness–productivity relationships in a low-productive boreal region. Plant Ecol. 2012, 214, 207–219. [Google Scholar] [CrossRef]
- Bai, Y.; Han, X.; Wu, J.; Chen, Z.; Li, L. Ecosystem stability and compensatory effects in the Inner Mongolia grassland. Nature 2004, 431, 181–184. [Google Scholar] [CrossRef]
- Bai, Y.; Wu, J.; Clark, C.M.; Naeem, S.; Pan, Q.; Huang, J.; Zhang, L.; Han, X. Tradeoffs and thresholds in the effects of nitrogen addition on biodiversity and ecosystem functioning: evidence from inner Mongolia Grasslands. Glob. Chang. Biol. 2010, 16, 358–372. [Google Scholar] [CrossRef]
- Bai, Y.; Wu, J.; Pan, Q.; Huang, J.; Wang, Q.; Li, F.; Buyantuyev, A.; Han, X. Positive linear relationship between productivity and diversity: evidence from the Eurasian Steppe. J. Appl. Ecol. 2007, 44, 1023–1034. [Google Scholar] [CrossRef]
- Bai, Y.; Wu, J.; Xing, Q.; Pan, Q.; Huang, J.; Yang, D.; Han, X. Primary Production And Rain Use Efficiency Across A Precipitation Gradient On The Mongolia Plateau. Ecology 2008, 89, 2140–2153. [Google Scholar] [CrossRef]
- Bao, S. , 2005. Soil Agrochemical Analysis, Third ed. China Agriculture Press.
- Bardgett, R.D. , Wardle, D.A., 2010. Aboveground-Belowground Linkages: Biotic Interactions, Ecosystem Processes, and Global Change. Oxford University Press, New York.
- Barrett, C.B.; Zhou, M.; Reich, P.B.; Crowther, T.W.; Liang, J. Forest value: More than commercial—Response. Science 2016, 354, 1541–1542. [Google Scholar] [CrossRef] [PubMed]
- Bloom, A.J.; Chapin, F.S., III; Mooney, H.A. Resource Limitation in Plants-An Economic Analogy. Annu. Rev. Ecol. Evol. Syst. 1985, 16, 363–392. [Google Scholar] [CrossRef]
- Bond, E.M.; Chase, J.M. Biodiversity and ecosystem functioning at local and regional spatial scales. Ecol. Lett. 2002, 5, 467–470. [Google Scholar] [CrossRef]
- Boyero, L.; Pearson, R.G.; Bastian, M. How biological diversity influences ecosystem function: a test with a tropical stream detritivore guild. Ecol. Res. 2006, 22, 551–558. [Google Scholar] [CrossRef]
- Cardinale, B.J.; Duffy, J.E.; Gonzalez, A.; Hooper, D.U.; Perrings, C.; Venail, P.; Narwani, A.; Mace, G.M.; Tilman, D.; Wardle, D.A.; et al. Biodiversity loss and its impact on humanity. Nature 2012, 486, 59–67. [Google Scholar] [CrossRef] [PubMed]
- Chalcraft, D.R.; Williams, J.W.; Smith, M.D.; Willig, M.R. Scale Dependence In The Species-Richness–Productivity Relationship: The Role Of Species Turnover. Ecology 2004, 85, 2701–2708. [Google Scholar] [CrossRef]
- Chase, J.M.; Leibold, M.A. Spatial scale dictates the productivity–biodiversity relationship. Nature 2002, 416, 427–430. [Google Scholar] [CrossRef]
- Chapin, F.S.; Autumn, K.; Pugnaire, F. Evolution of Suites of Traits in Response to Environmental Stress. Am. Nat. 1993, 142, S78–S92. [Google Scholar] [CrossRef]
- Chen, L.; Jiang, L.; Jing, X.; Wang, J.; Shi, Y.; Chu, H.; He, J. Above- and belowground biodiversity jointly drive ecosystem stability in natural alpine grasslands on the Tibetan Plateau. Glob. Ecol. Biogeogr. 2021, 30, 1418–1429. [Google Scholar] [CrossRef]
- Chen, S.; Wang, M.; Zhang, C.; Yu, T.; Xin, X.; Bai, K.; Zhu, X.; Yan, R. Impacts of Grazing Disturbance on Soil Nitrogen Component Contents and Storages in a Leymus chinensis Meadow Steppe. Agronomy 2023, 13, 1574. [Google Scholar] [CrossRef]
- Chen, L., Baoyin, T., Xia, F., 2022. Grassland management strategies influence soil C, N, and P sequestration through shifting plant community composition in a semi-arid grasslands of northern China. Ecol. Ind. 134, 108470. [CrossRef]
- Cheng, X.; An, S.; Chen, J.; Li, B.; Liu, Y.; Liu, S. Spatial relationships among species, above-ground biomass, N, and P in degraded grasslands in Ordos Plateau, northwestern China. J. Arid. Environ. 2006, 68, 652–667. [Google Scholar] [CrossRef]
- Curtis, J.T. , 1959. The Vegetation of Wisconsin: An Ordination of Plant Communities. University of Wisconsin Press.
- Dai, L.; Fu, R.; Guo, X.; Du, Y.; Lin, L.; Zhang, F.; Li, Y.; Cao, G. Long-term grazing exclusion greatly improve carbon and nitrogen store in an alpine meadow on the northern Qinghai-Tibet Plateau. CATENA 2020, 197, 104955. [Google Scholar] [CrossRef]
- Davidson, E.A.; Janssens, I.A. Temperature sensitivity of soil carbon decomposition and feedbacks to climate change. Nature 2006, 440, 165–173. [Google Scholar] [CrossRef] [PubMed]
- De Deyn, G.B.; Cornelissen, J.H.C.; Bardgett, R.D. Plant functional traits and soil carbon sequestration in contrasting biomes. Ecol. Lett. 2008, 11, 516–531. [Google Scholar] [CrossRef] [PubMed]
- De Deyn, G.B.; Shiel, R.S.; Ostle, N.J.; McNamara, N.P.; Oakley, S.; Young, I.; Freeman, C.; Fenner, N.; Quirk, H.; Bardgett, R.D. Additional carbon sequestration benefits of grassland diversity restoration. J. Appl. Ecol. 2010, 48, 600–608. [Google Scholar] [CrossRef]
- Dijkstra, F.A.; Cheng, W.; Johnson, D.W. Plant biomass influences rhizosphere priming effects on soil organic matter decomposition in two differently managed soils. Soil Biol. Biochem. 2006, 38, 2519–2526. [Google Scholar] [CrossRef]
- Dong, Q.; Zhao, X.; Wu, G.; Shi, J.; Wang, Y.; Sheng, L. Response of soil properties to yak grazing intensity in a Kobresia parva-meadow on the Qinghai-Tibetan Plateau, China. J. Soil Sci. Plant Nutr. 2012, 12, 535–546. [Google Scholar] [CrossRef]
- Erfanzadeh, R.; Omidipour, R.; Faramarzi, M. Variation of plant diversity components in different scales in relation to grazing and climatic conditions. Plant Ecol. Divers. 2015, 8, 537–545. [Google Scholar] [CrossRef]
- Fay, P.A.; Prober, S.M.; Harpole, W.S.; Knops, J.M.H.; Bakker, J.D.; Borer, E.T.; Lind, E.M.; MacDougall, A.S.; Seabloom, E.W.; Wragg, P.D.; et al. Grassland productivity limited by multiple nutrients. Nat. Plants 2015, 1, 15080. [Google Scholar] [CrossRef]
- Fayiah, M.; Dong, S.; Li, Y.; Xu, Y.; Gao, X.; Li, S.; Shen, H.; Xiao, J.; Yang, Y.; Wessell, K. The relationships between plant diversity, plant cover, plant biomass and soil fertility vary with grassland type on Qinghai-Tibetan Plateau. Agric. Ecosyst. Environ. 2019, 286, 106659. [Google Scholar] [CrossRef]
- Fornara, D.A.; Tilman, D. Plant functional composition influences rates of soil carbon and nitrogen accumulation. J. Ecol. 2008, 96, 314–322. [Google Scholar] [CrossRef]
- Frank, A.B.; Tanaka, D.L.; Hofmann, L.; Follett, R.F. Soil Carbon and Nitrogen of Northern Great Plains Grasslands as Influenced by Long-Term Grazing. J. Range Manag. 1995, 48, 470. [Google Scholar] [CrossRef]
- Funakawa, S. , Fujii, K., Kadono, A., Watanabe, T., Kosaki, T., 2014. Could Soil Acidity Enhance Sequestration of Organic Carbon in Soils?, in: Hartemink, A.E., McSweeney, K. (Eds.), Soil Carbon. Springer International Publishing, Cham, pp. 209–216. [CrossRef]
- Gan, S. , Xiao, Y., Xu, J., Wang, Y., Yu, F., Xie, G., 2019. Comprehensive cost-benefit evaluation of the Hulunbuir grassland meadow ecological function area. Acta Ecologica Sinica 39: 5874–5884.
- Gang, C.; Zhou, W.; Chen, Y.; Wang, Z.; Sun, Z.; Li, J.; Qi, J.; Odeh, I. Quantitative assessment of the contributions of climate change and human activities on global grassland degradation. Environ. Earth Sci. 2014, 72, 4273–4282. [Google Scholar] [CrossRef]
- Gao, J.; Carmel, Y. Can the intermediate disturbance hypothesis explain grazing–diversity relations at a global scale? Oikos 2019, 129, 493–502. [Google Scholar] [CrossRef]
- General Administration of Quality Supervision, Inspection and Quarantine of the People’s Republic of China. 2003. GB/19377-2003 Parameters for degradation,sandification and salification of rangelands.
- Gillman, L.N.; Wright, S.D. The Influence Of Productivity On The Species Richness Of Plants: A Critical Assessment. Ecology 2006, 87, 1234–1243. [Google Scholar] [CrossRef]
- Gough, L.; Grace, J.B.; Taylor, K.L. The Relationship between Species Richness and Community Biomass: The Importance of Environmental Variables. Oikos 1994, 70, 271. [Google Scholar] [CrossRef]
- Grace, J.B.; Anderson, T.M.; Seabloom, E.W.; Borer, E.T.; Adler, P.B.; Harpole, W.S.; Hautier, Y.; Hillebrand, H.; Lind, E.M.; Pärtel, M.; et al. Integrative modelling reveals mechanisms linking productivity and plant species richness. Nature 2016, 529, 390–393. [Google Scholar] [CrossRef]
- Grime, J.P. , 1973. Control of species density in herbaceous vegetation. Journal of Environmental Management.
- Gross, K.L.; Willig, M.R.; Gough, L.; Inouye, R.; Cox, S.B. Patterns of species density and productivity at different spatial scales in herbaceous plant communities. Oikos 2000, 89, 417–427. [Google Scholar] [CrossRef]
- Guo, Q. , Berry, W.L., 1998. Species Richness and Biomass: Dissection of the Hump-Shaped Relationships. Ecology 79, 2555–2559. [CrossRef]
- Han, X.; Li, Y.; Du, X.; Li, Y.; Wang, Z.; Jiang, S.; Li, Q. Effect of grassland degradation on soil quality and soil biotic community in a semi-arid temperate steppe. Ecol. Process. 2020, 9, 1–11. [Google Scholar] [CrossRef]
- Harris, R. Rangeland degradation on the Qinghai-Tibetan plateau: A review of the evidence of its magnitude and causes. 74, 12. [CrossRef]
- Harrison, S.; Davies, K.F.; Safford, H.D.; Viers, J.H. Beta diversity and the scale-dependence of the productivity-diversity relationship: a test in the Californian serpentine flora. J. Ecol. 2005, 94, 110–117. [Google Scholar] [CrossRef]
- He, M.; Zhou, G.; Yuan, T.; van Groenigen, K.J.; Shao, J.; Zhou, X. Grazing intensity significantly changes the C : N : P stoichiometry in grassland ecosystems. Glob. Ecol. Biogeogr. 2019, 29, 355–369. [Google Scholar] [CrossRef]
- Hector, A.; Bagchi, R. Biodiversity and ecosystem multifunctionality. Nature 2007, 448, 188–190. [Google Scholar] [CrossRef] [PubMed]
- Hinsinger, P.; Betencourt, E.; Bernard, L.; Brauman, A.; Plassard, C.; Shen, J.; Tang, X.; Zhang, F. P for Two, Sharing a Scarce Resource: Soil Phosphorus Acquisition in the Rhizosphere of Intercropped Species. Plant Physiol. 2011, 156, 1078–1086. [Google Scholar] [CrossRef]
- Hooper, D.U.; Vitousek, P.M. The Effects of Plant Composition and Diversity on Ecosystem Processes. Science 1997, 277, 1302–1305. [Google Scholar] [CrossRef]
- Hu, Z.; Delgado-Baquerizo, M.; Fanin, N.; Chen, X.; Zhou, Y.; Du, G.; Hu, F.; Jiang, L.; Hu, S.; Liu, M. Nutrient-induced acidification modulates soil biodiversity-function relationships. Nat. Commun. 2024, 15, 1–12. [Google Scholar] [CrossRef]
- Hu, Z.; Li, S.; Guo, Q.; Niu, S.; He, N.; Li, L.; Yu, G. A synthesis of the effect of grazing exclusion on carbon dynamics in grasslands in China. Glob. Chang. Biol. 2016, 22, 1385–1393. [Google Scholar] [CrossRef]
- Isbell, F.I.; Polley, H.W.; Wilsey, B.J. Biodiversity, productivity and the temporal stability of productivity: patterns and processes. Ecol. Lett. 2009, 12, 443–451. [Google Scholar] [CrossRef]
- Jiang, X.L.; Zhang, W.G.; Wang, G. Effects of different components of diversity on productivity in artificial plant communities. Ecol. Res. 2007, 22, 629–634. [Google Scholar] [CrossRef]
- Lai, L.; Kumar, S. A global meta-analysis of livestock grazing impacts on soil properties. PLOS ONE 2020, 15, e0236638. [Google Scholar] [CrossRef]
- Lange, M.; Eisenhauer, N.; Sierra, C.A.; Bessler, H.; Engels, C.; Griffiths, R.I.; Mellado-Vázquez, P.G.; Malik, A.A.; Roy, J.; Scheu, S.; et al. Plant diversity increases soil microbial activity and soil carbon storage. Nat. Commun. 2015, 6, 6707. [Google Scholar] [CrossRef]
- Laughlin, D.C.; Moore, M.M. Climate-induced temporal variation in the productivity–diversity relationship. Oikos 2009, 118, 897–902. [Google Scholar] [CrossRef]
- Li, W.; Liu, C.; Wang, W.; Zhou, H.; Xue, Y.; Xu, J.; Xue, P.; Yan, H. Effects of Different Grazing Disturbances on the Plant Diversity and Ecological Functions of Alpine Grassland Ecosystem on the Qinghai-Tibetan Plateau. Front. Plant Sci. 2021, 12, 765070. [Google Scholar] [CrossRef] [PubMed]
- Li, X.; Jia, X.; Dong, G. Influence of desertification on vegetation pattern variations in the cold semi-arid grasslands of Qinghai-Tibet Plateau, North-west China. J. Arid. Environ. 2006, 64, 505–522. [Google Scholar] [CrossRef]
- Liu, L. , Jing, X., Ren, H., Huang, J., He, J., & Fang, J. 2023. Grassland Biodiversity and Stability and Implications for Grassland Conservation and Restoration. 37(04). [CrossRef]
- Liu, J.; Li, L.; Ji, L.; Li, Y.; Liu, J.; Li, F.Y. Divergent effects of grazing versus mowing on plant nutrients in typical steppe grasslands of Inner Mongolia. J. Plant Ecol. 2023, 16. [Google Scholar] [CrossRef]
- Liu, X.; Tan, N.; Zhou, G.; Zhang, D.; Zhang, Q.; Liu, S.; Chu, G.; Liu, J. Plant diversity and species turnover co-regulate soil nitrogen and phosphorus availability in Dinghushan forests, southern China. Plant Soil 2021, 464, 1–16. [Google Scholar] [CrossRef]
- Liu, Y.; Zhao, X.; Liu, W.; Feng, B.; Lv, W.; Zhang, Z.; Yang, X.; Dong, Q. Plant biomass partitioning in alpine meadows under different herbivores as influenced by soil bulk density and available nutrients. CATENA 2024, 240. [Google Scholar] [CrossRef]
- Loreau, M.; Naeem, S.; Inchausti, P.; Bengtsson, J.; Grime, J. P.; Hector, A.; Hooper, D.U.; Huston, M.A.; Raffaelli, D.; Schmid, B.; Tilman, D.; et al. Biodiversity and Ecosystem Functioning: Current Knowledge and Future Challenges. Science 2001, 294, 804–808. [Google Scholar] [CrossRef]
- Lyu, X.; Li, X.; Gong, J.; Wang, H.; Dang, D.; Dou, H.; Li, S.; Liu, S. Comprehensive Grassland Degradation Monitoring by Remote Sensing in Xilinhot, Inner Mongolia, China. Sustainability 2020, 12, 3682. [Google Scholar] [CrossRef]
- Maitlo, A.A.; Zhang, S.; Ahmed, W.; Jangid, K.; Ali, S.; Yang, H.; Bhatti, S.M.; Duan, Y.; Xu, M. Potential Nitrogen Mineralization and Its Availability in Response to Long-Term Fertilization in a Chinese Fluvo-Aquic Soil. Agronomy 2022, 12, 1260. [Google Scholar] [CrossRef]
- McNaughton, S.J. Compensatory Plant Growth as a Response to Herbivory. Oikos 1983, 40, 329. [Google Scholar] [CrossRef]
- Ministry of Ecology and Environment. 2021. National Eco-environmental Standard of the People’s Republic of China HJ 1174-2021.
- Mittelbach, G.G. , Steiner, C.F., Scheiner, S.M., Gross, K.L., Reynolds, H.L., Waide, R.B., Willig, M.R., Dodson, S.I., Gough, L., 2001. What Is the Observed Relationship Between Species Richness and Productivity? Ecology 82, 2381–2396. [CrossRef]
- Mosier, S.; Apfelbaum, S.; Byck, P.; Calderon, F.; Teague, R.; Thompson, R.; Cotrufo, M.F. Adaptive multi-paddock grazing enhances soil carbon and nitrogen stocks and stabilization through mineral association in southeastern U.S. grazing lands. J. Environ. Manag. 2021, 288, 112409. [Google Scholar] [CrossRef] [PubMed]
- Naeem, S. , 2002. Ecosystem Consequences of Biodiversity Loss: The Evolution of a Paradigm. Ecology 83, 1537–1552. [CrossRef]
- Naeem, S.; Thompson, L.J.; Lawler, S.P.; Lawton, J.H.; Woodfin, R.M. Declining biodiversity can alter the performance of ecosystems. Nature 1994, 368, 734–737. [Google Scholar] [CrossRef]
- National Forestry and Grassland Administration, Department of Forest Resource Management, 2022. Technical Regulations for National Forest, Grassland, and Wetland Survey and Monitoring in 2022.
- Ni, J.; Wang, G.; Bai, Y.; Li, X. Scale-dependent relationships between plant diversity and above-ground biomass in temperate grasslands, south-eastern Mongolia. J. Arid. Environ. 2007, 68, 132–142. [Google Scholar] [CrossRef]
- Pan, Y.; Tang, H.; Fang, F.; Ma, Y.; Chen, Z. Is elemental stoichiometry (C, N, P) of soil and soil microbial biomass influenced by management modes and soil depth in agro-pastoral transitional zone of northern China? J. Soils Sediments 2022, 23, 32–48. [Google Scholar] [CrossRef]
- Peng, F.; Xue, X.; You, Q.; Huang, C.; Dong, S.; Liao, J.; Duan, H.; Tsunekawa, A.; Wang, T. Changes of soil properties regulate the soil organic carbon loss with grassland degradation on the Qinghai-Tibet Plateau. Ecol. Indic. 2018, 93, 572–580. [Google Scholar] [CrossRef]
- Potthoff, M.; Jackson, L.E.; Steenwerth, K.L.; Ramirez, I.; Stromberg, M.R.; Rolston, D.E. Soil Biological and Chemical Properties in Restored Perennial Grassland in California. Restor. Ecol. 2005, 13, 61–73. [Google Scholar] [CrossRef]
- Rada, S.; Mazalová, M.; Šipoš, J.; Kuras, T. Impacts of Mowing, Grazing and Edge Effect on Orthoptera of Submontane Grasslands: Perspectives for Biodiversity Protection. Pol. J. Ecol. 2014, 62, 123–138. [Google Scholar] [CrossRef]
- Raiesi, F.; Salek-Gilani, S. Development of a soil quality index for characterizing effects of land-use changes on degradation and ecological restoration of rangeland soils in a semi-arid ecosystem. Land Degrad. Dev. 2020, 31, 1533–1544. [Google Scholar] [CrossRef]
- Reay, M.K.; Marsden, K.A.; Powell, S.; Chadwick, D.R.; Jones, D.L.; Evershed, R.P. Combining field and laboratory approaches to quantify N assimilation in a soil microbe-plant-animal grazing land system. Agric. Ecosyst. Environ. 2023, 346. [Google Scholar] [CrossRef]
- Ren, H.; Li, Z.; Shen, W.; Yu, Z.; Peng, S.; Liao, C.; Ding, M.; Wu, J. Changes in biodiversity and ecosystem function during the restoration of a tropical forest in south China. Sci. China Life Sci. 2007, 50, 277–284. [Google Scholar] [CrossRef] [PubMed]
- Robertson, G.P.; Hutson, M.A.; Evans, F.C.; Tiedje, J.M. Spatial Variability in a Successional Plant Community: Patterns of Nitrogen Availability. Ecology 1988, 69, 1517–1524. [Google Scholar] [CrossRef]
- Sardans, J.; Bartrons, M.; Margalef, O.; Gargallo-Garriga, A.; Janssens, I.A.; Ciais, P.; Obersteiner, M.; Sigurdsson, B.D.; Chen, H.Y.H.; Peñuelas, J. Plant invasion is associated with higher plant–soil nutrient concentrations in nutrient-poor environments. Glob. Chang. Biol. 2016, 23, 1282–1291. [Google Scholar] [CrossRef] [PubMed]
- Hockett, C.F.; Shannon, C.L.; Weaver, W. The Mathematical Theory of Communication. Language 1953, 29, 69. [Google Scholar] [CrossRef]
- Song, X.; Wang, L.; Zhao, X.; Liu, C.; Chang, Q.; Wang, Y.; Xu, T.; Wang, D. Sheep grazing and local community diversity interact to control litter decomposition of dominant species in grassland ecosystem. Soil Biol. Biochem. 2017, 115, 364–370. [Google Scholar] [CrossRef]
- Steffens, M.; Kölbl, A.; Totsche, K.U.; Kögel-Knabner, I. Grazing effects on soil chemical and physical properties in a semiarid steppe of Inner Mongolia (P.R. China). Geoderma 2007, 143, 63–72. [Google Scholar] [CrossRef]
- Sun, J.; Ma, B.; Lu, X. Grazing enhances soil nutrient effects: Trade-offs between aboveground and belowground biomass in alpine grasslands of the Tibetan Plateau. Land Degrad. Dev. 2017, 29, 337–348. [Google Scholar] [CrossRef]
- Talore, D.G.; Tesfamariam, E.H.; Hassen, A.; Du Toit, J.; Klampp, K.; Jean-Francois, S. Long-term impacts of grazing intensity on soil carbon sequestration and selected soil properties in the arid Eastern Cape, South Africa. J. Sci. Food Agric. 2015, 96, 1945–1952. [Google Scholar] [CrossRef]
- Tilman, D. The Ecological Consequences of Changes in Biodiversity: A Search for General Principles. Ecology 1999, 80, 1455. [Google Scholar] [CrossRef]
- Tilman, D. The Resource-Ratio Hypothesis of Plant Succession. Am. Nat. 1985, 125, 827–852. [Google Scholar] [CrossRef]
- Tilman, D.; Lehman, C.L.; Thomson, K.T. Plant diversity and ecosystem productivity: Theoretical considerations. Proc. Natl. Acad. Sci. 1997, 94, 1857–1861. [Google Scholar] [CrossRef] [PubMed]
- Tilman, D.; Wedin, D.; Knops, J. Productivity and sustainability influenced by biodiversity in grassland ecosystems. Nature 1996, 379, 718–720. [Google Scholar] [CrossRef]
- Waide, R.B.; Willig, M.R.; Steiner, C.F.; Mittelbach, G.; Gough, L.; Dodson, S.I.; Juday, G.P.; Parmenter, R. The Relationship Between Productivity and Species Richness. Annu. Rev. Ecol. Syst. 1999, 30, 257–300. [Google Scholar] [CrossRef]
- Huawei, W. Grassland degradation monitoring and spatio-temporal variation analysis of the Hulun Buir Ecological Function Region. 资源科学 2016, 38, 24–28. [Google Scholar] [CrossRef]
- Wang, H.; Guo, Z.G.; Xu, X.H.; Liang, T.G.; Ren, J.Z. Response of vegetation and soils to desertification of alpine meadow in the upper basin of the Yellow River, China. New Zealand J. Agric. Res. 2007, 50, 491–501. [Google Scholar] [CrossRef]
- Wang, H. , Hong, Y., Bao, G., Hu, L., Bao, H., Ga, B., 2014. Comparative study on plant community characteristics in Hulunbuir grassland. Journal of Inner Mongonlia Normal University (Natural Science Edition).
- Wang, J.; Yang, C.; Wang, T. [Changes of biomass allocation of Artemisia frigida population in grazing-induced retrogressive communities]. . 2005, 16, 2316–20. [Google Scholar]
- Wang, R.; Yang, J.; Liu, H.; Sardans, J.; Zhang, Y.; Wang, X.; Wei, C.; Lü, X.; Dijkstra, F.A.; Jiang, Y.; et al. Nitrogen enrichment buffers phosphorus limitation by mobilizing mineral-bound soil phosphorus in grasslands. Ecology 2021, 103, e3616. [Google Scholar] [CrossRef]
- Wang, W.; Sardans, J.; Zeng, C.; Zhong, C.; Li, Y.; Peñuelas, J. Responses of soil nutrient concentrations and stoichiometry to different human land uses in a subtropical tidal wetland. 232-234. [CrossRef]
- Wang, X.; Dong, S.; Yang, B.; Li, Y.; Su, X. The effects of grassland degradation on plant diversity, primary productivity, and soil fertility in the alpine region of Asia’s headwaters. Environ. Monit. Assess. 2014, 186, 6903–6917. [Google Scholar] [CrossRef]
- Wang, X.; Yan, Y.; Cao, Y. Impact of historic grazing on steppe soils on the northern Tibetan Plateau. Plant Soil 2011, 354, 173–183. [Google Scholar] [CrossRef]
- Wang, Y.; Wesche, K. Vegetation and soil responses to livestock grazing in Central Asian grasslands: a review of Chinese literature. Biodivers. Conserv. 2016, 25, 2401–2420. [Google Scholar] [CrossRef]
- Wang, Z.; Luo, T.; Li, R.; Tang, Y.; Du, M. Causes for the unimodal pattern of biomass and productivity in alpine grasslands along a large altitudinal gradient in semi-arid regions. J. Veg. Sci. 2012, 24, 189–201. [Google Scholar] [CrossRef]
- Weil, R. , Brady, N., 2017. The Nature and Properties of Soils. 15th edition.
- Wu, G.-L.; Liu, Z.-H.; Zhang, L.; Chen, J.-M.; Hu, T.-M. Long-term fencing improved soil properties and soil organic carbon storage in an alpine swamp meadow of western China. Plant Soil 2010, 332, 331–337. [Google Scholar] [CrossRef]
- Wu, G.; Ren, G.; Dong, Q.; Shi, J.; Wang, Y. Above- and Belowground Response along Degradation Gradient in an Alpine Grassland of the Qinghai-Tibetan Plateau. CLEAN – Soil, Air, Water 2013, 42, 319–323. [Google Scholar] [CrossRef]
- Wu, J.; Li, M.; Fiedler, S.; Ma, W.; Wang, X.; Zhang, X.; Tietjen, B. Impacts of grazing exclusion on productivity partitioning along regional plant diversity and climatic gradients in Tibetan alpine grasslands. J. Environ. Manag. 2018, 231, 635–645. [Google Scholar] [CrossRef]
- Xie, Y.; Sha, Z.; Yu, M. Remote sensing imagery in vegetation mapping: a review. J. Plant Ecol. 2008, 1, 9–23. [Google Scholar] [CrossRef]
- Xu, H.P.; Zhang, J.; Pang, X.P.; Wang, Q.; Na Zhang, W.; Wang, J.; Guo, Z.G. Responses of plant productivity and soil nutrient concentrations to different alpine grassland degradation levels. Environ. Monit. Assess. 2019, 191, 678. [Google Scholar] [CrossRef]
- Yan, J.; Wang, L.; Hu, Y.; Tsang, Y.F.; Zhang, Y.; Wu, J.; Fu, X.; Sun, Y. Plant litter composition selects different soil microbial structures and in turn drives different litter decomposition pattern and soil carbon sequestration capability. Geoderma 2018, 319, 194–203. [Google Scholar] [CrossRef]
- Yuan, Z.Y.; Jiao, F.; Li, Y.H.; Kallenbach, R.L. Anthropogenic disturbances are key to maintaining the biodiversity of grasslands. Sci. Rep. 2016, 6, 22132. [Google Scholar] [CrossRef]
- Zhang, F.; Shen, J.; Li, L.; Liu, X. An overview of rhizosphere processes related with plant nutrition in major cropping systems in China. Plant Soil 2004, 260, 89–99. [Google Scholar] [CrossRef]
- Zhang, Q.; Niu, J.; Buyantuyev, A.; Zhang, J.; Ding, Y.; Dong, J. Productivity–species richness relationship changes from unimodal to positive linear with increasing spatial scale in the Inner Mongolia steppe. Ecol. Res. 2011, 26, 649–658. [Google Scholar] [CrossRef]
- Zhang, R.; Wang, Z.; Han, G.; Schellenberg, M.P.; Wu, Q.; Gu, C. Grazing induced changes in plant diversity is a critical factor controlling grassland productivity in the Desert Steppe, Northern China. Agric. Ecosyst. Environ. 2018, 265, 73–83. [Google Scholar] [CrossRef]
- Zhang, Y.; Zhao, J.; Xin, X.; Wang, M.; Pan, F.; Yan, R.; Li, L. Effects of stocking rate on the interannual patterns of ecosystem biomass and soil nitrogen mineralization in a meadow steppe of northeast China. Plant Soil 2021, 473, 9–31. [Google Scholar] [CrossRef]
- Zhou M, Yang Q, Zhang H, Yao X, Zeng W, Wang W (2020) Plant community temporal stability in response to nitrogen addition among different degraded grasslands. Science Of the Total Environment 729: 138886.
- Zuo, X.; Zhao, H.; Zhao, X.; Guo, Y.; Yun, J.; Wang, S.; Miyasaka, T. Vegetation pattern variation, soil degradation and their relationship along a grassland desertification gradient in Horqin Sandy Land, northern China. Environ. Geol. 2008, 58, 1227–1237. [Google Scholar] [CrossRef]
Figure 2.
Variation in plant families, annual species proportion and perennial species proportion at different degradation stages. ND, LD, MD, SD and ED represent non-degraded, lightly degraded, moderately degraded, severely degraded, and extremely degraded grasslands.
Figure 2.
Variation in plant families, annual species proportion and perennial species proportion at different degradation stages. ND, LD, MD, SD and ED represent non-degraded, lightly degraded, moderately degraded, severely degraded, and extremely degraded grasslands.
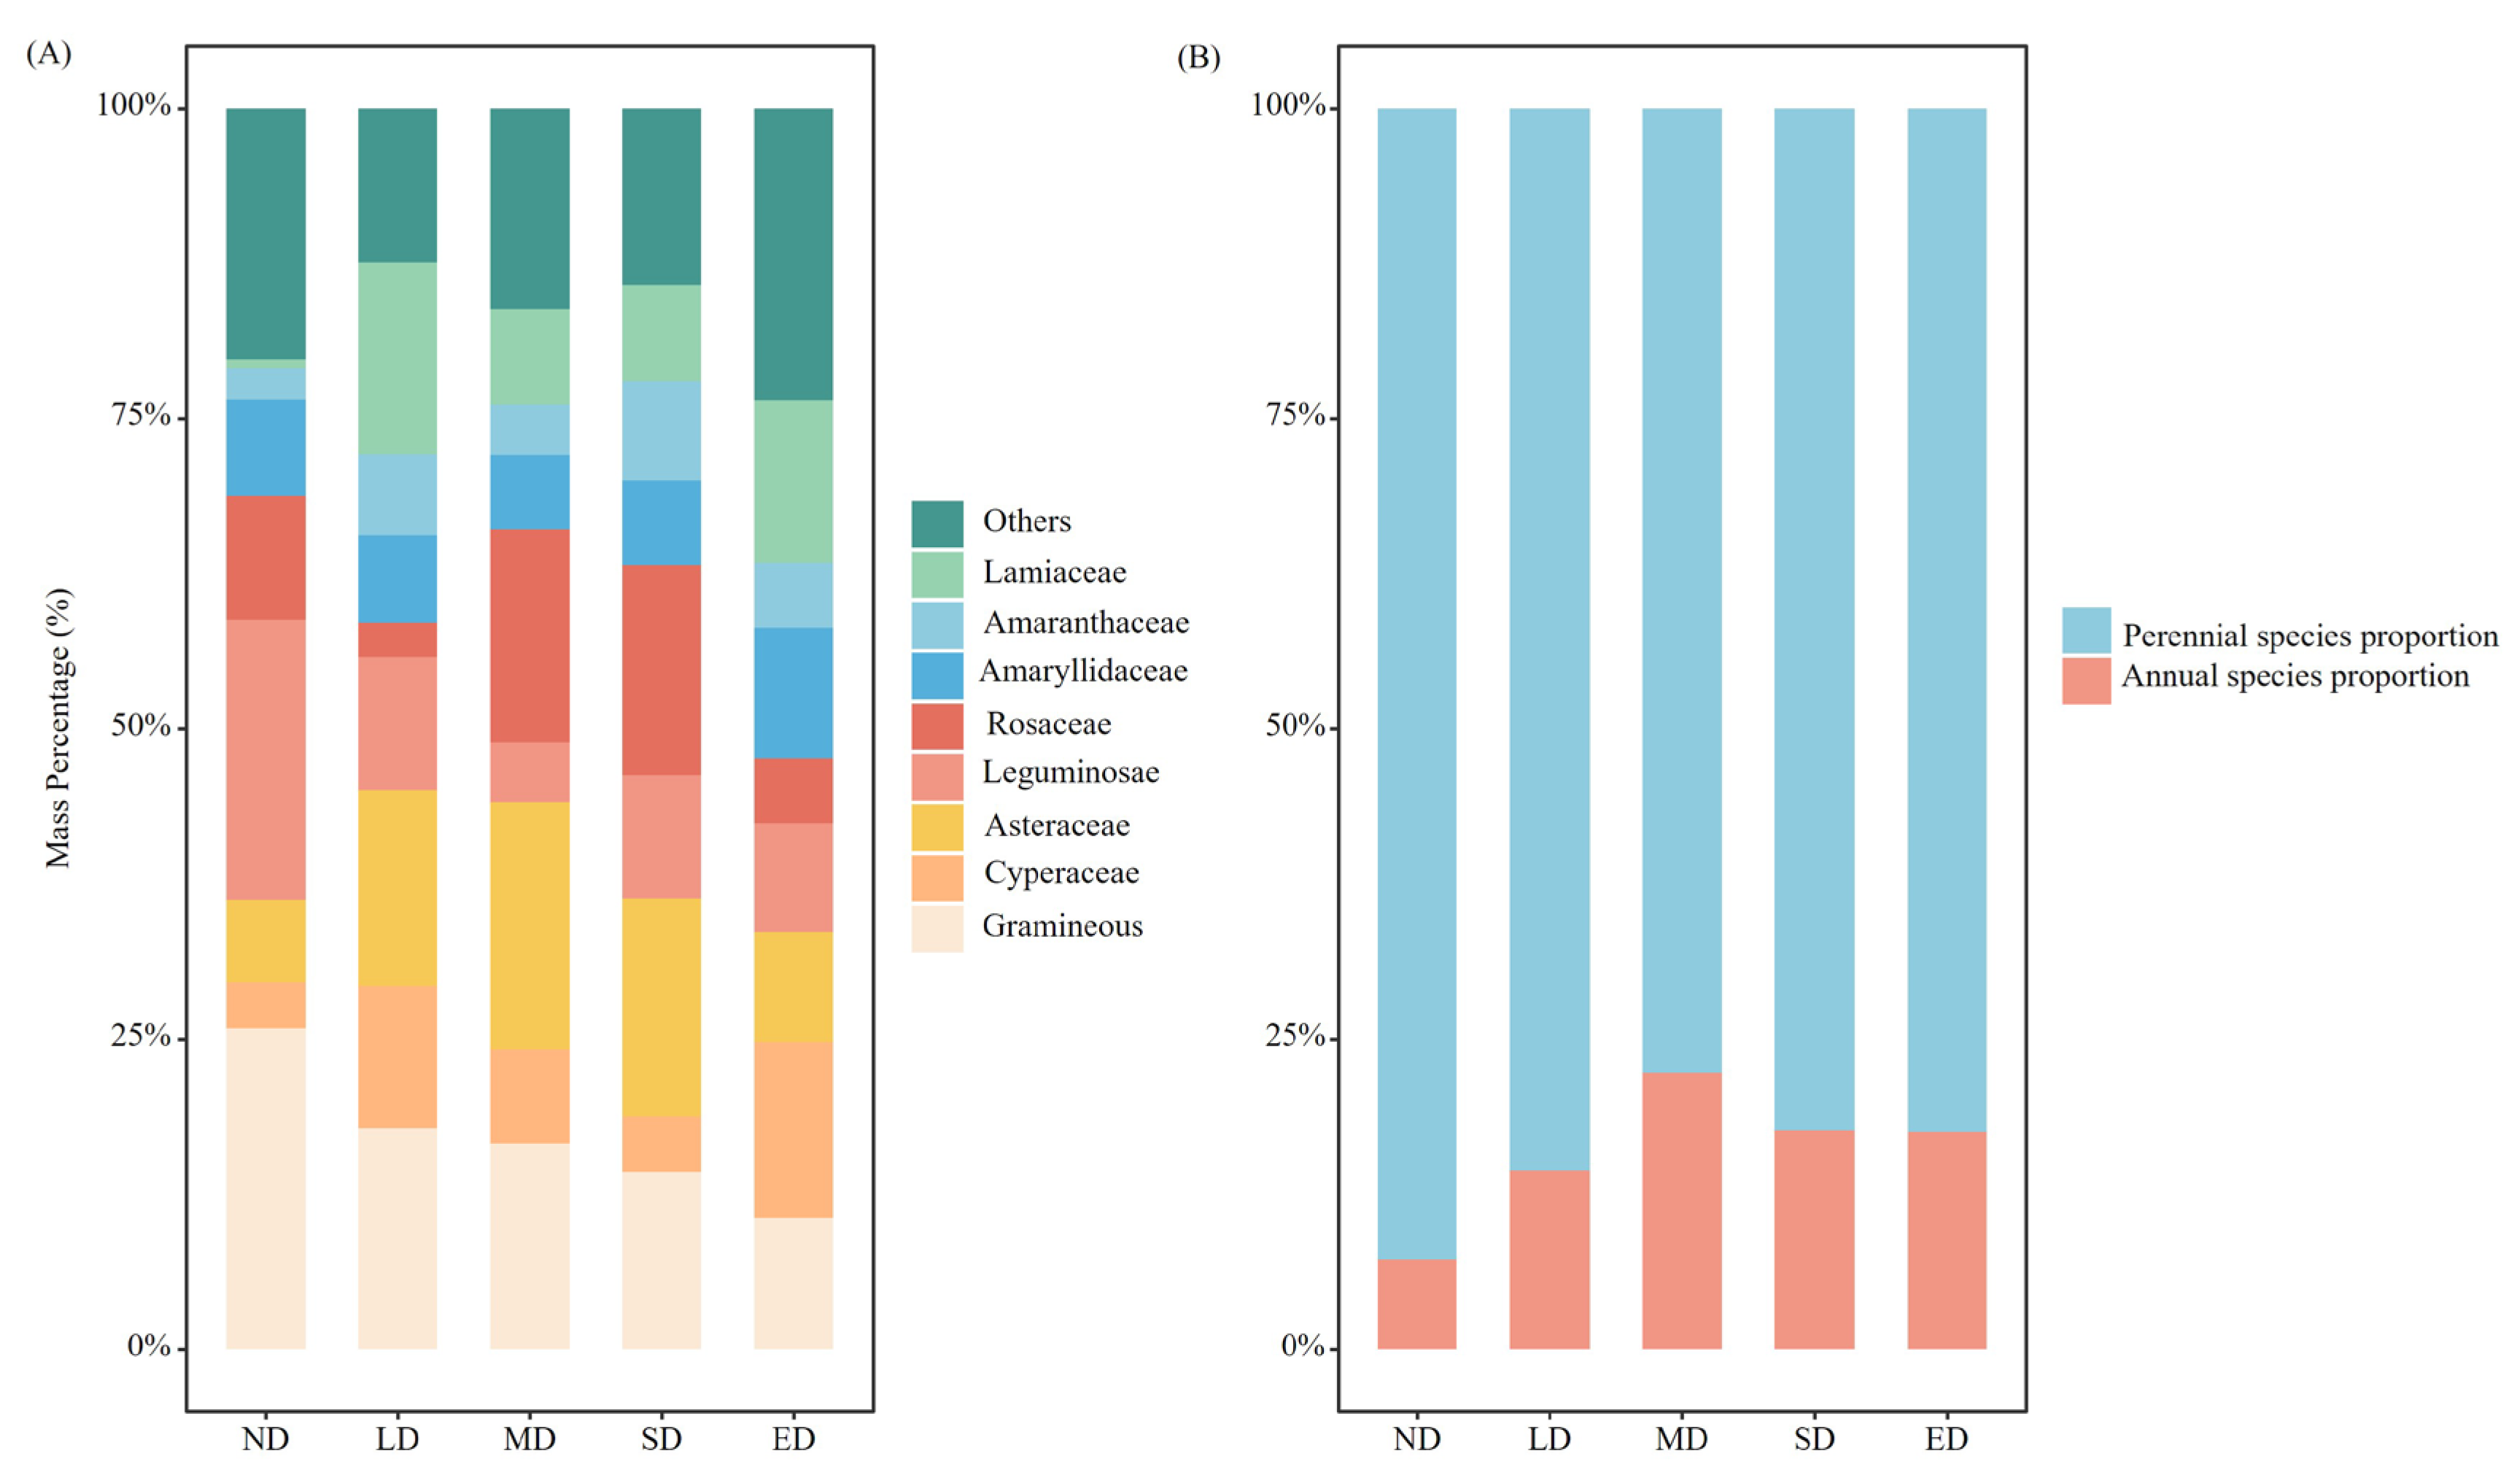
Figure 3.
Radar map of important values of herbaceous plants in the study area at different degradation stages. ND, LD, MD, SD and ED represent non-degraded, lightly degraded, moderately degraded, severely degraded, and extremely degraded grasslands.
Figure 3.
Radar map of important values of herbaceous plants in the study area at different degradation stages. ND, LD, MD, SD and ED represent non-degraded, lightly degraded, moderately degraded, severely degraded, and extremely degraded grasslands.
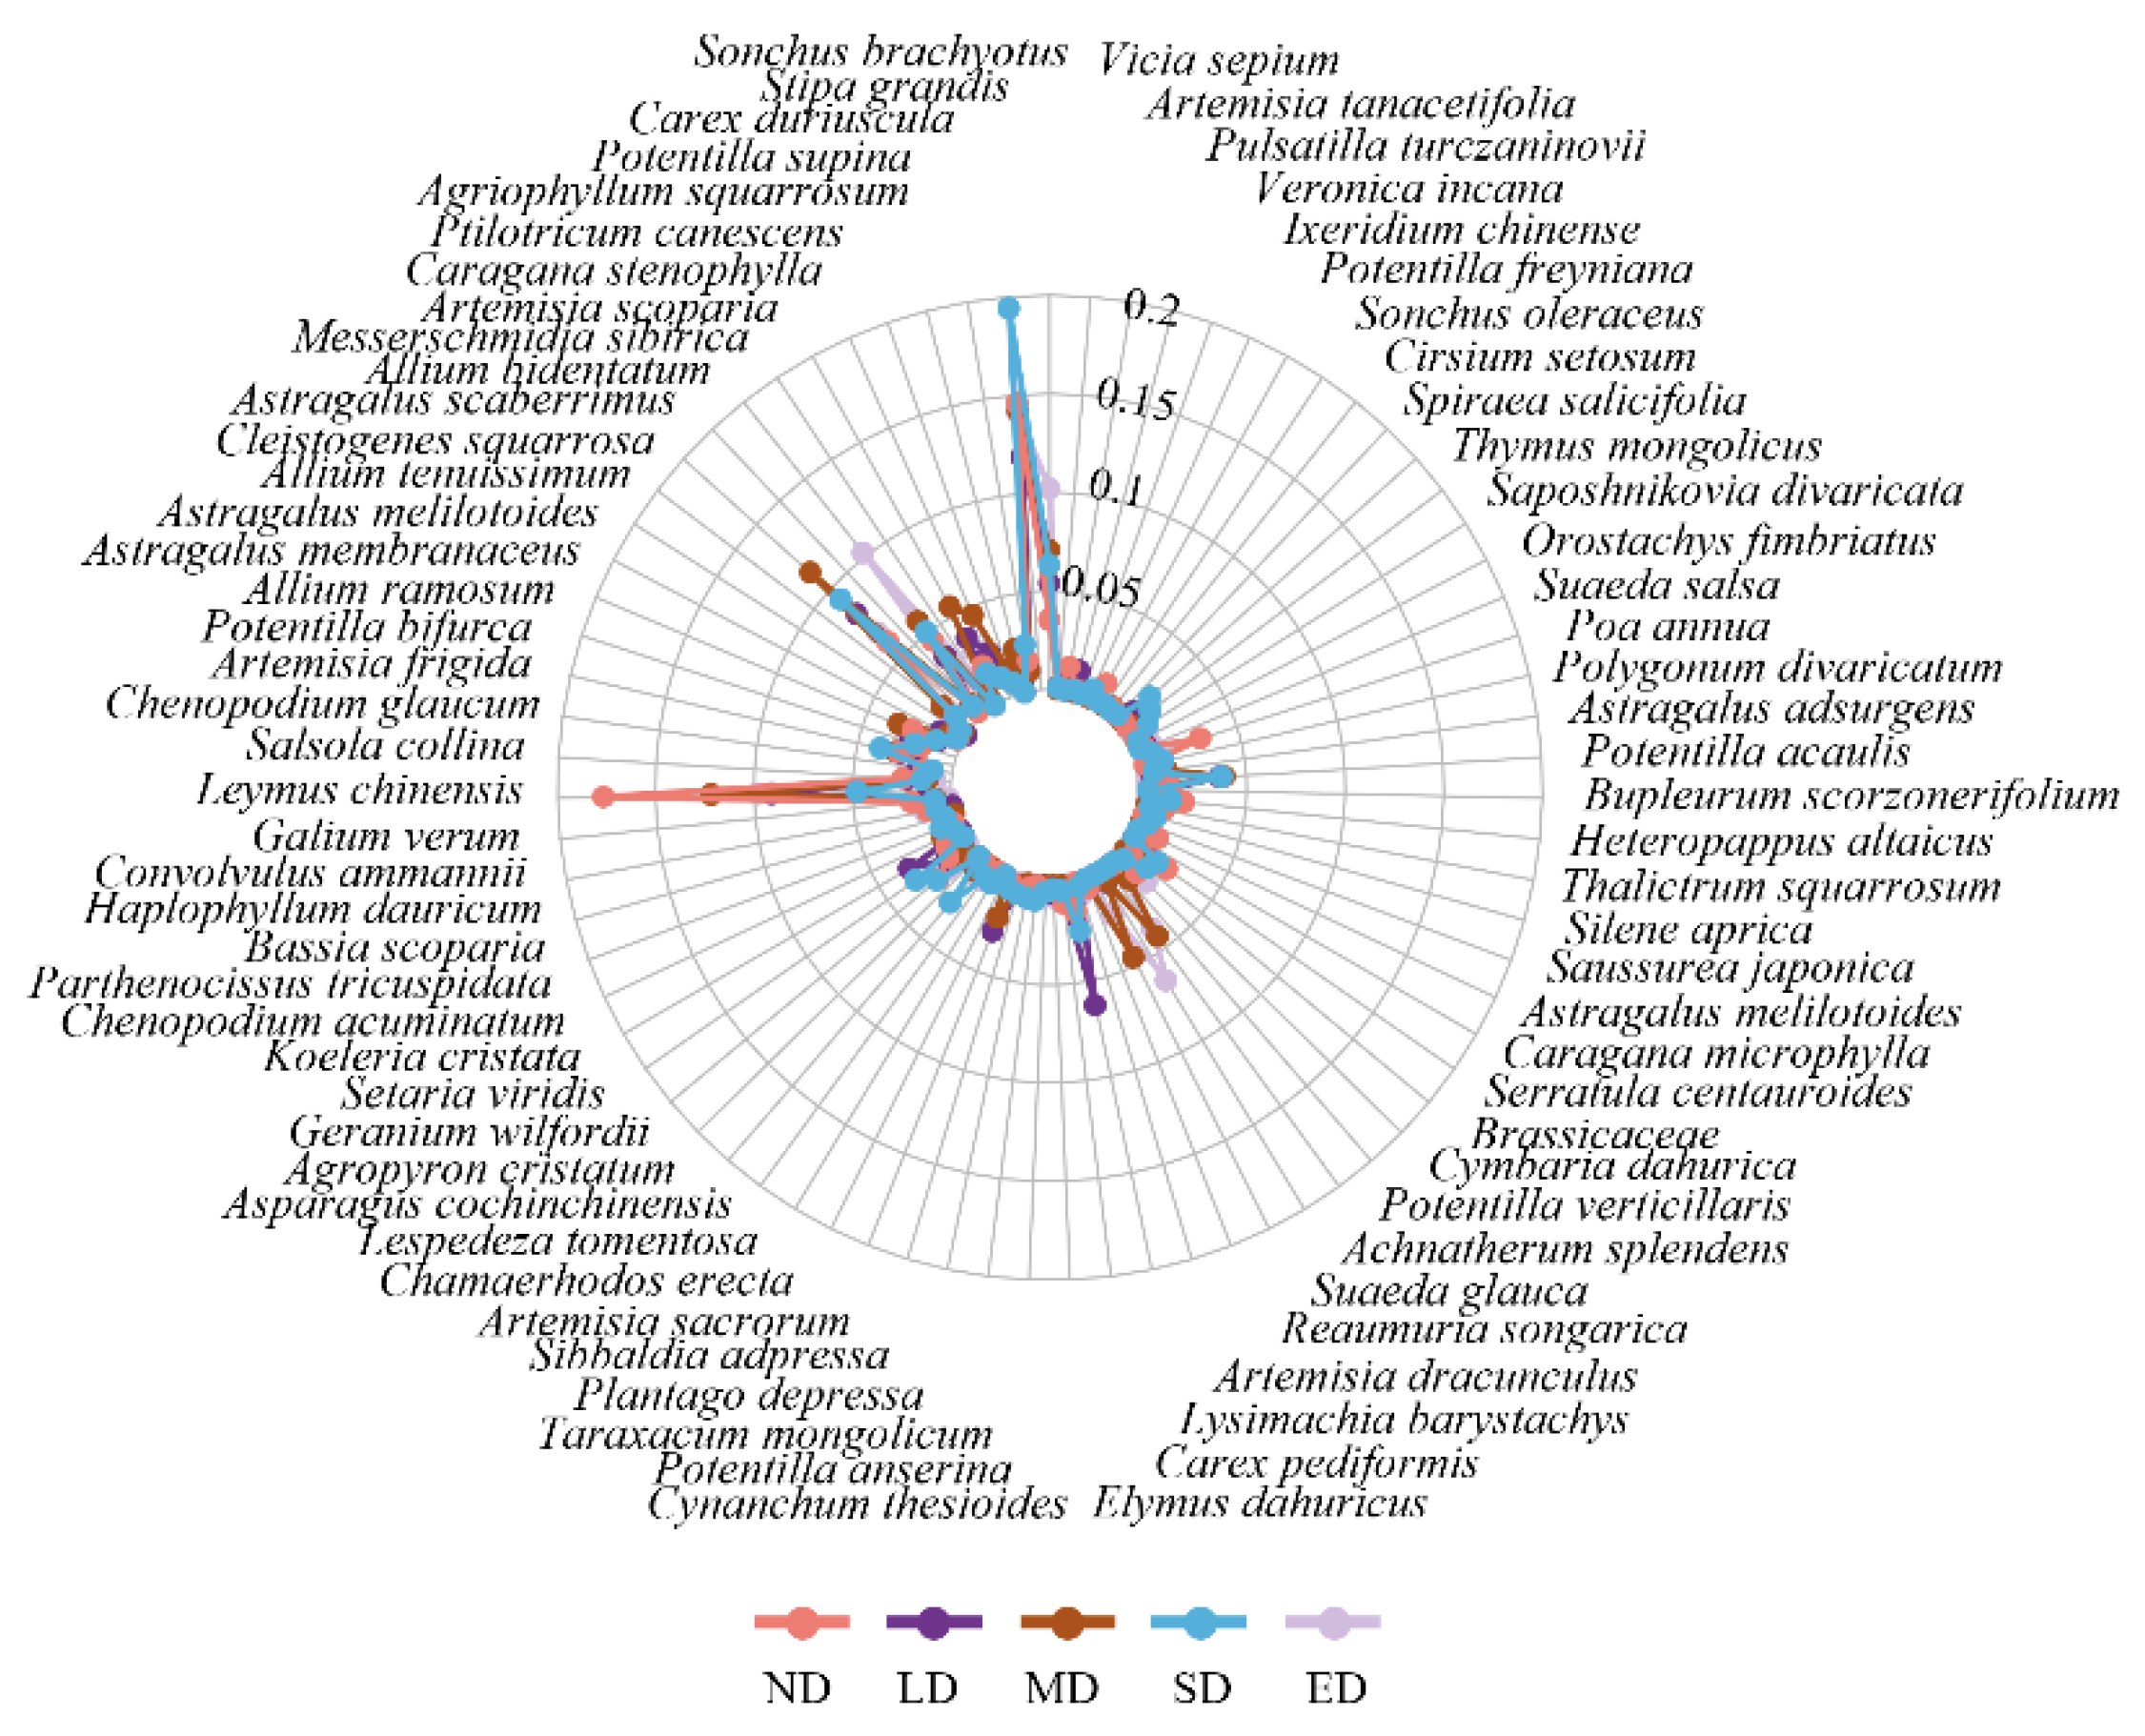
Figure 4.
Variation in plant richness, Shannon–Wiener index, AGB, BGB, LB and plant coverage at the different degradation stages. ND, LD, MD, SD and ED represent non-degraded, lightly degraded, moderately degraded, severely degraded, and extremely degraded grasslands. AGB represents the aboveground biomass. BGB represents the belowground biomass. LB represents the litter biomass. Lowercase letters represent significant differences by different degradation stages at P < 0.05.
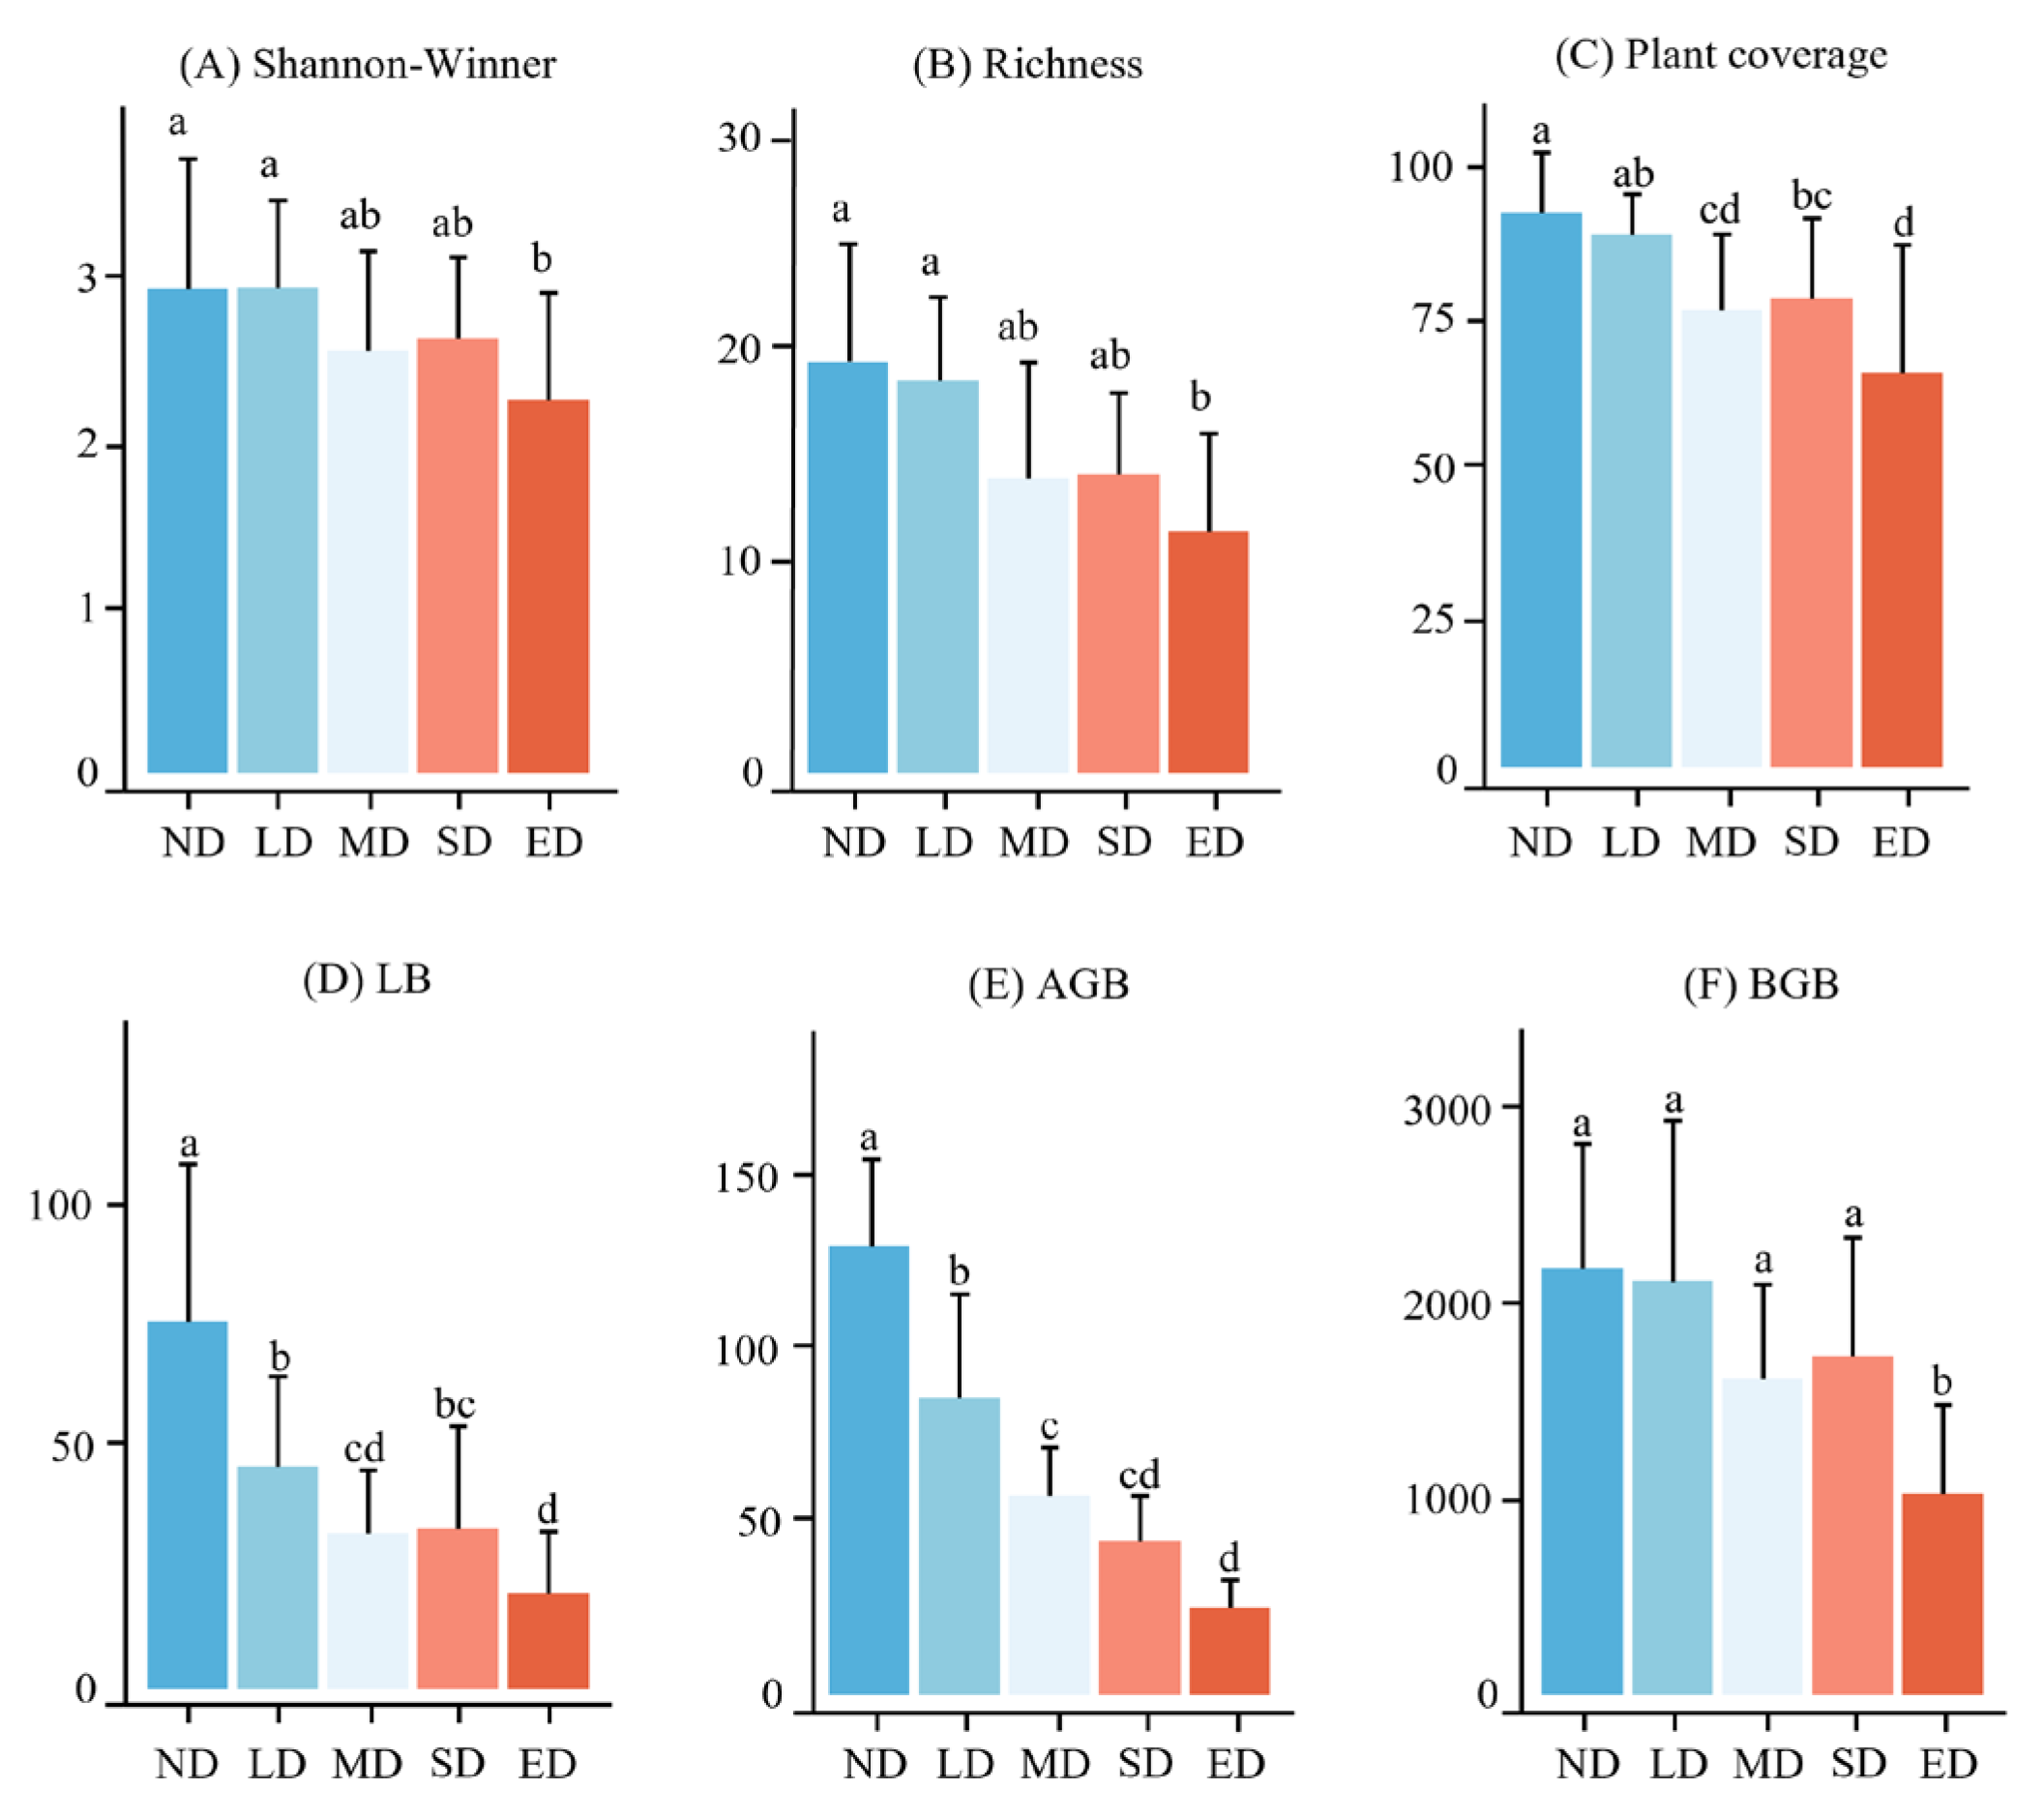
Figure 5.
Variation in soil nutrients at the different degradation stages. ND, LD, MD, SD and ED represent non-degraded, lightly degraded, moderately degraded, severely degraded, and extremely degraded grasslands. AK, HN, AP, EC, MC, Ammonium-N, Nitrate-N, Ph, SOC, STN, TC, TK, TN, TP and BD represent available kalium content, hydrolyzable nitrogen, available potassium content, electric conductivity, soil moisture content, ammonium nitrogen, nitrate nitrogen, potential of hydrogen, soil organic carbon content, soluble total nitrogen, total carbon content, total kalium content, total nitrogen content, total phosphorus content and soil bulk density. Lowercase letters represent significant differences by different degradation stages at P < 0.05.
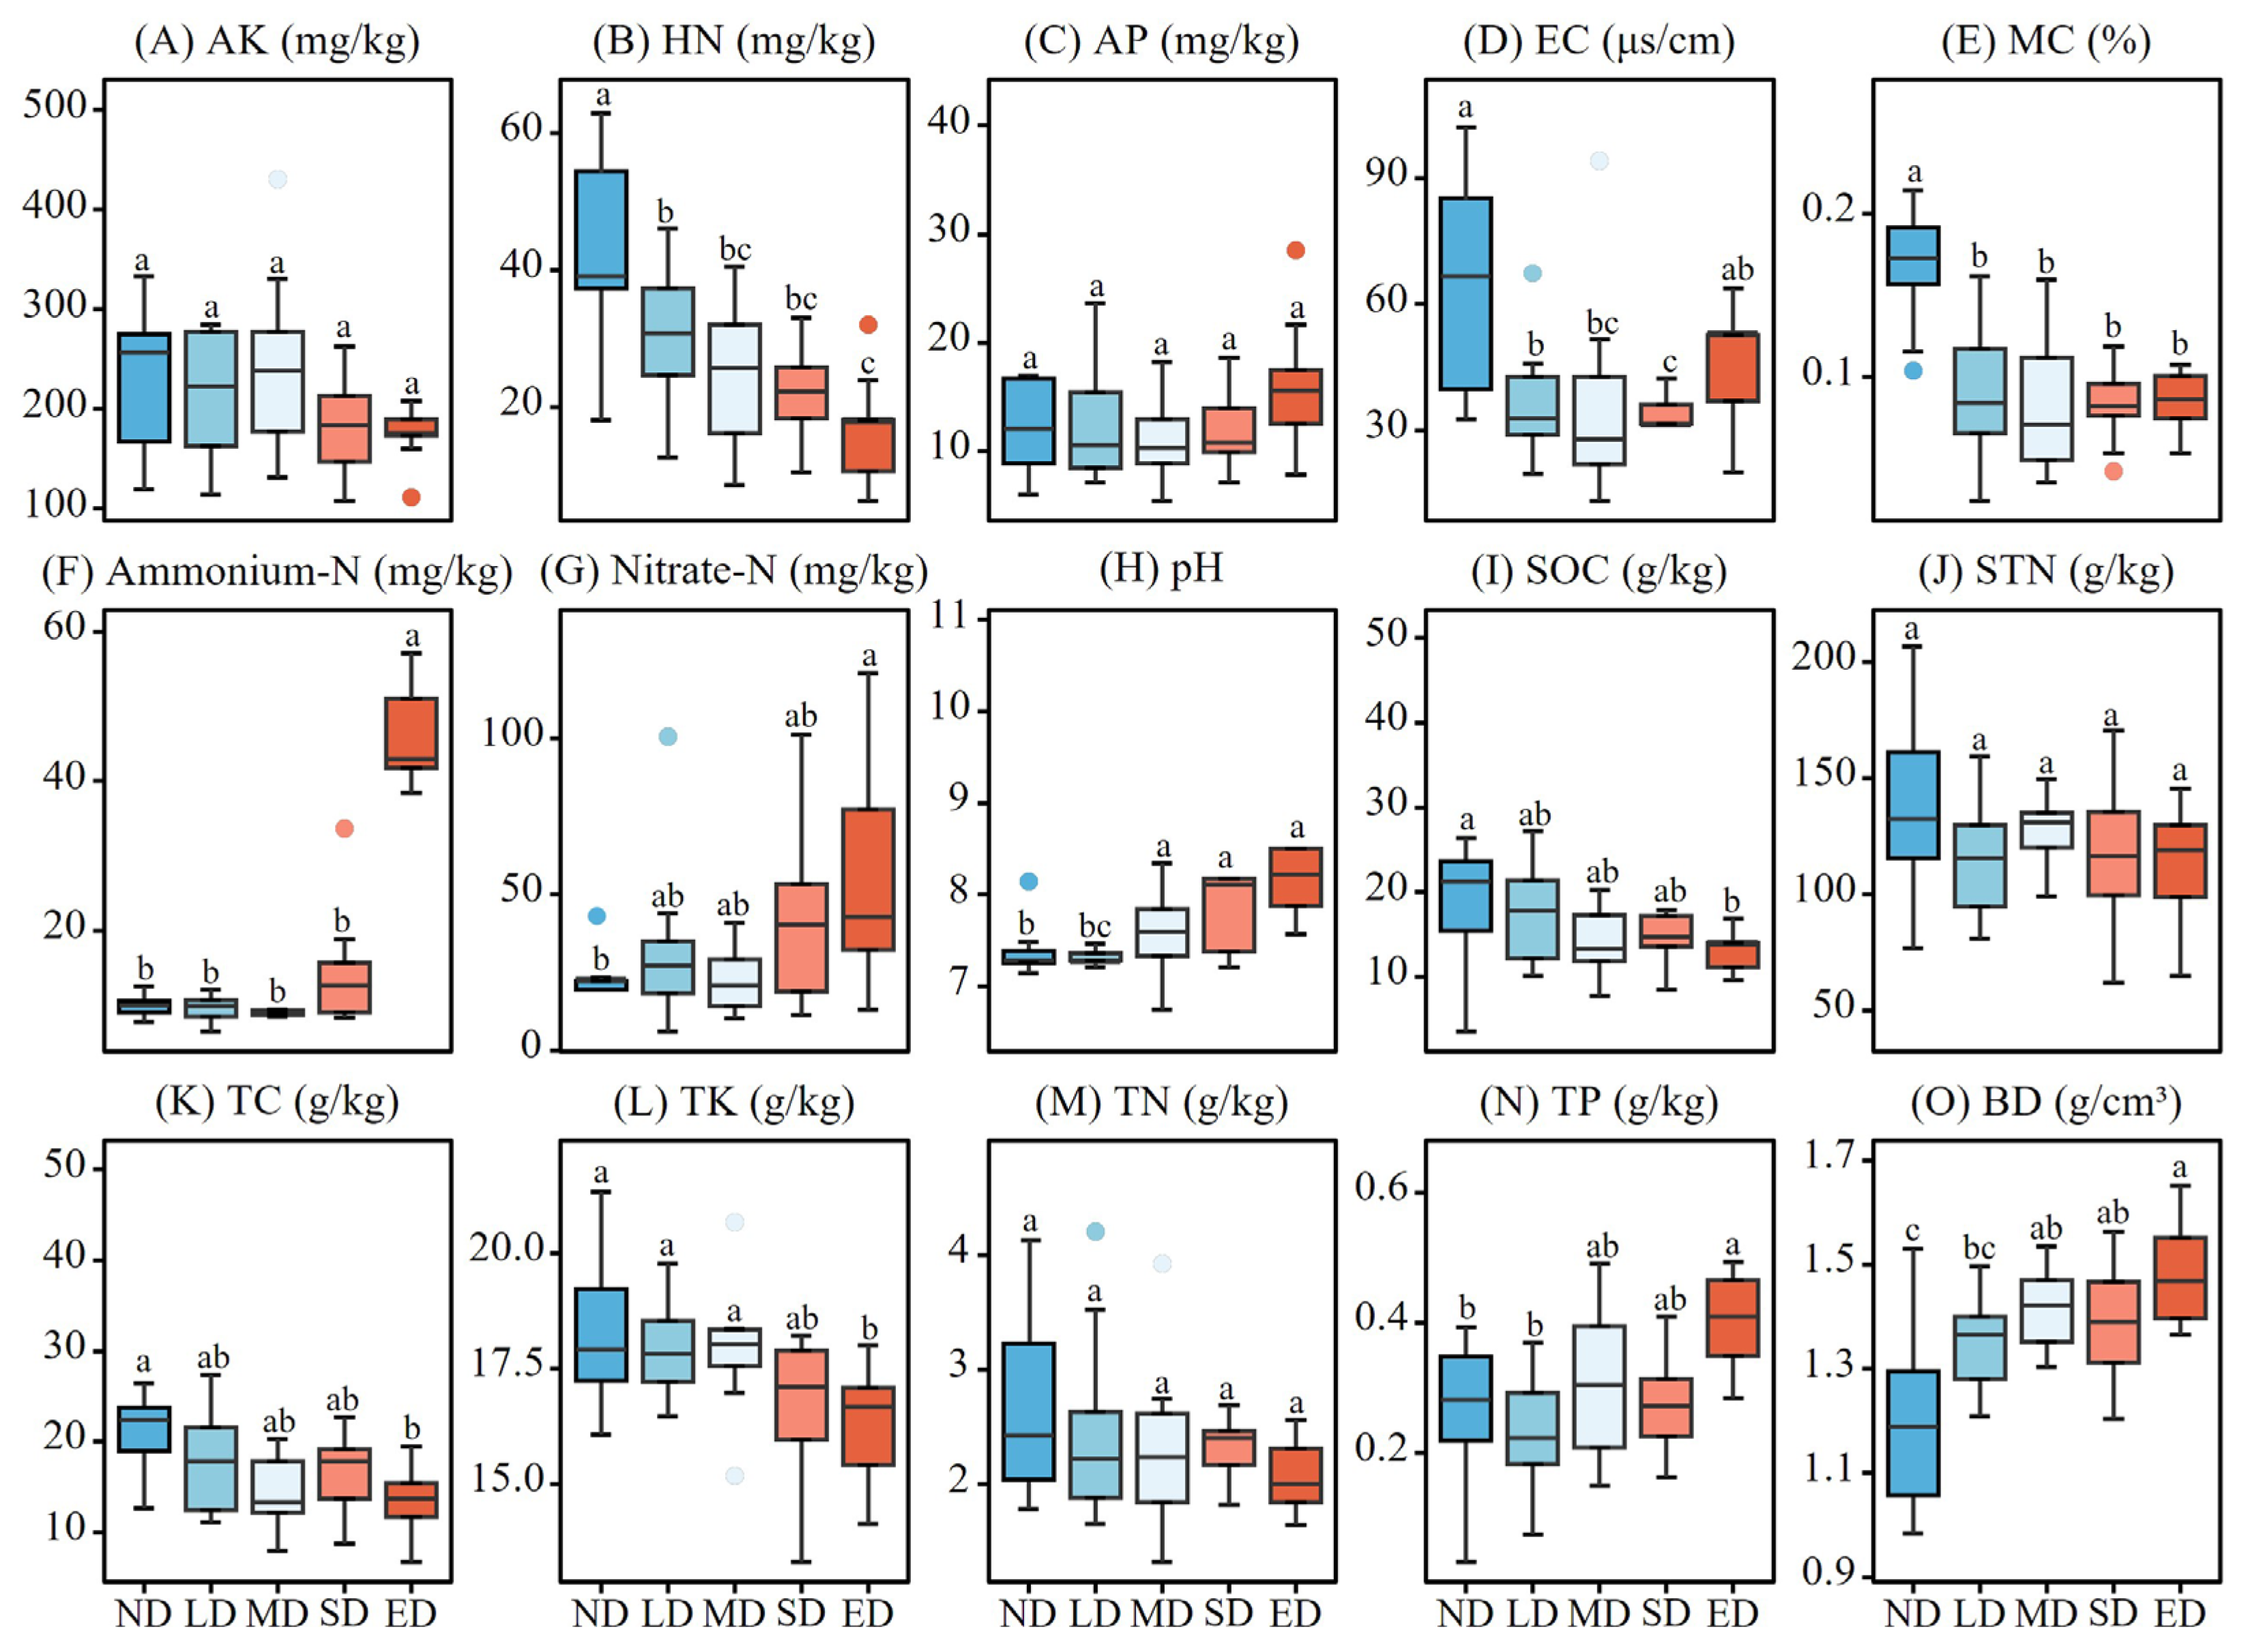
Figure 6.
Redundancy analysis ordination plot showing the effect of soil factors on vegetation biomass. ND, LD, MD, SD and ED represent non-degraded, lightly degraded, moderately degraded, severely degraded, and extremely degraded grasslands. AK, HN, AP, EC, MC, ammonium-N, nitrate-N, pH, SOC, STN, TC, TK, TN, TP and BD represent available kalium, hydrolyzable nitrogen, available potassium, electric conductivity, soil moisture, ammonium nitrogen, nitrate nitrogen, potential of hydrogen, soil organic carbon, soluble total nitrogen, total carbon, total kalium, total nitrogen, total phosphorus, and soil bulk density, respectively.
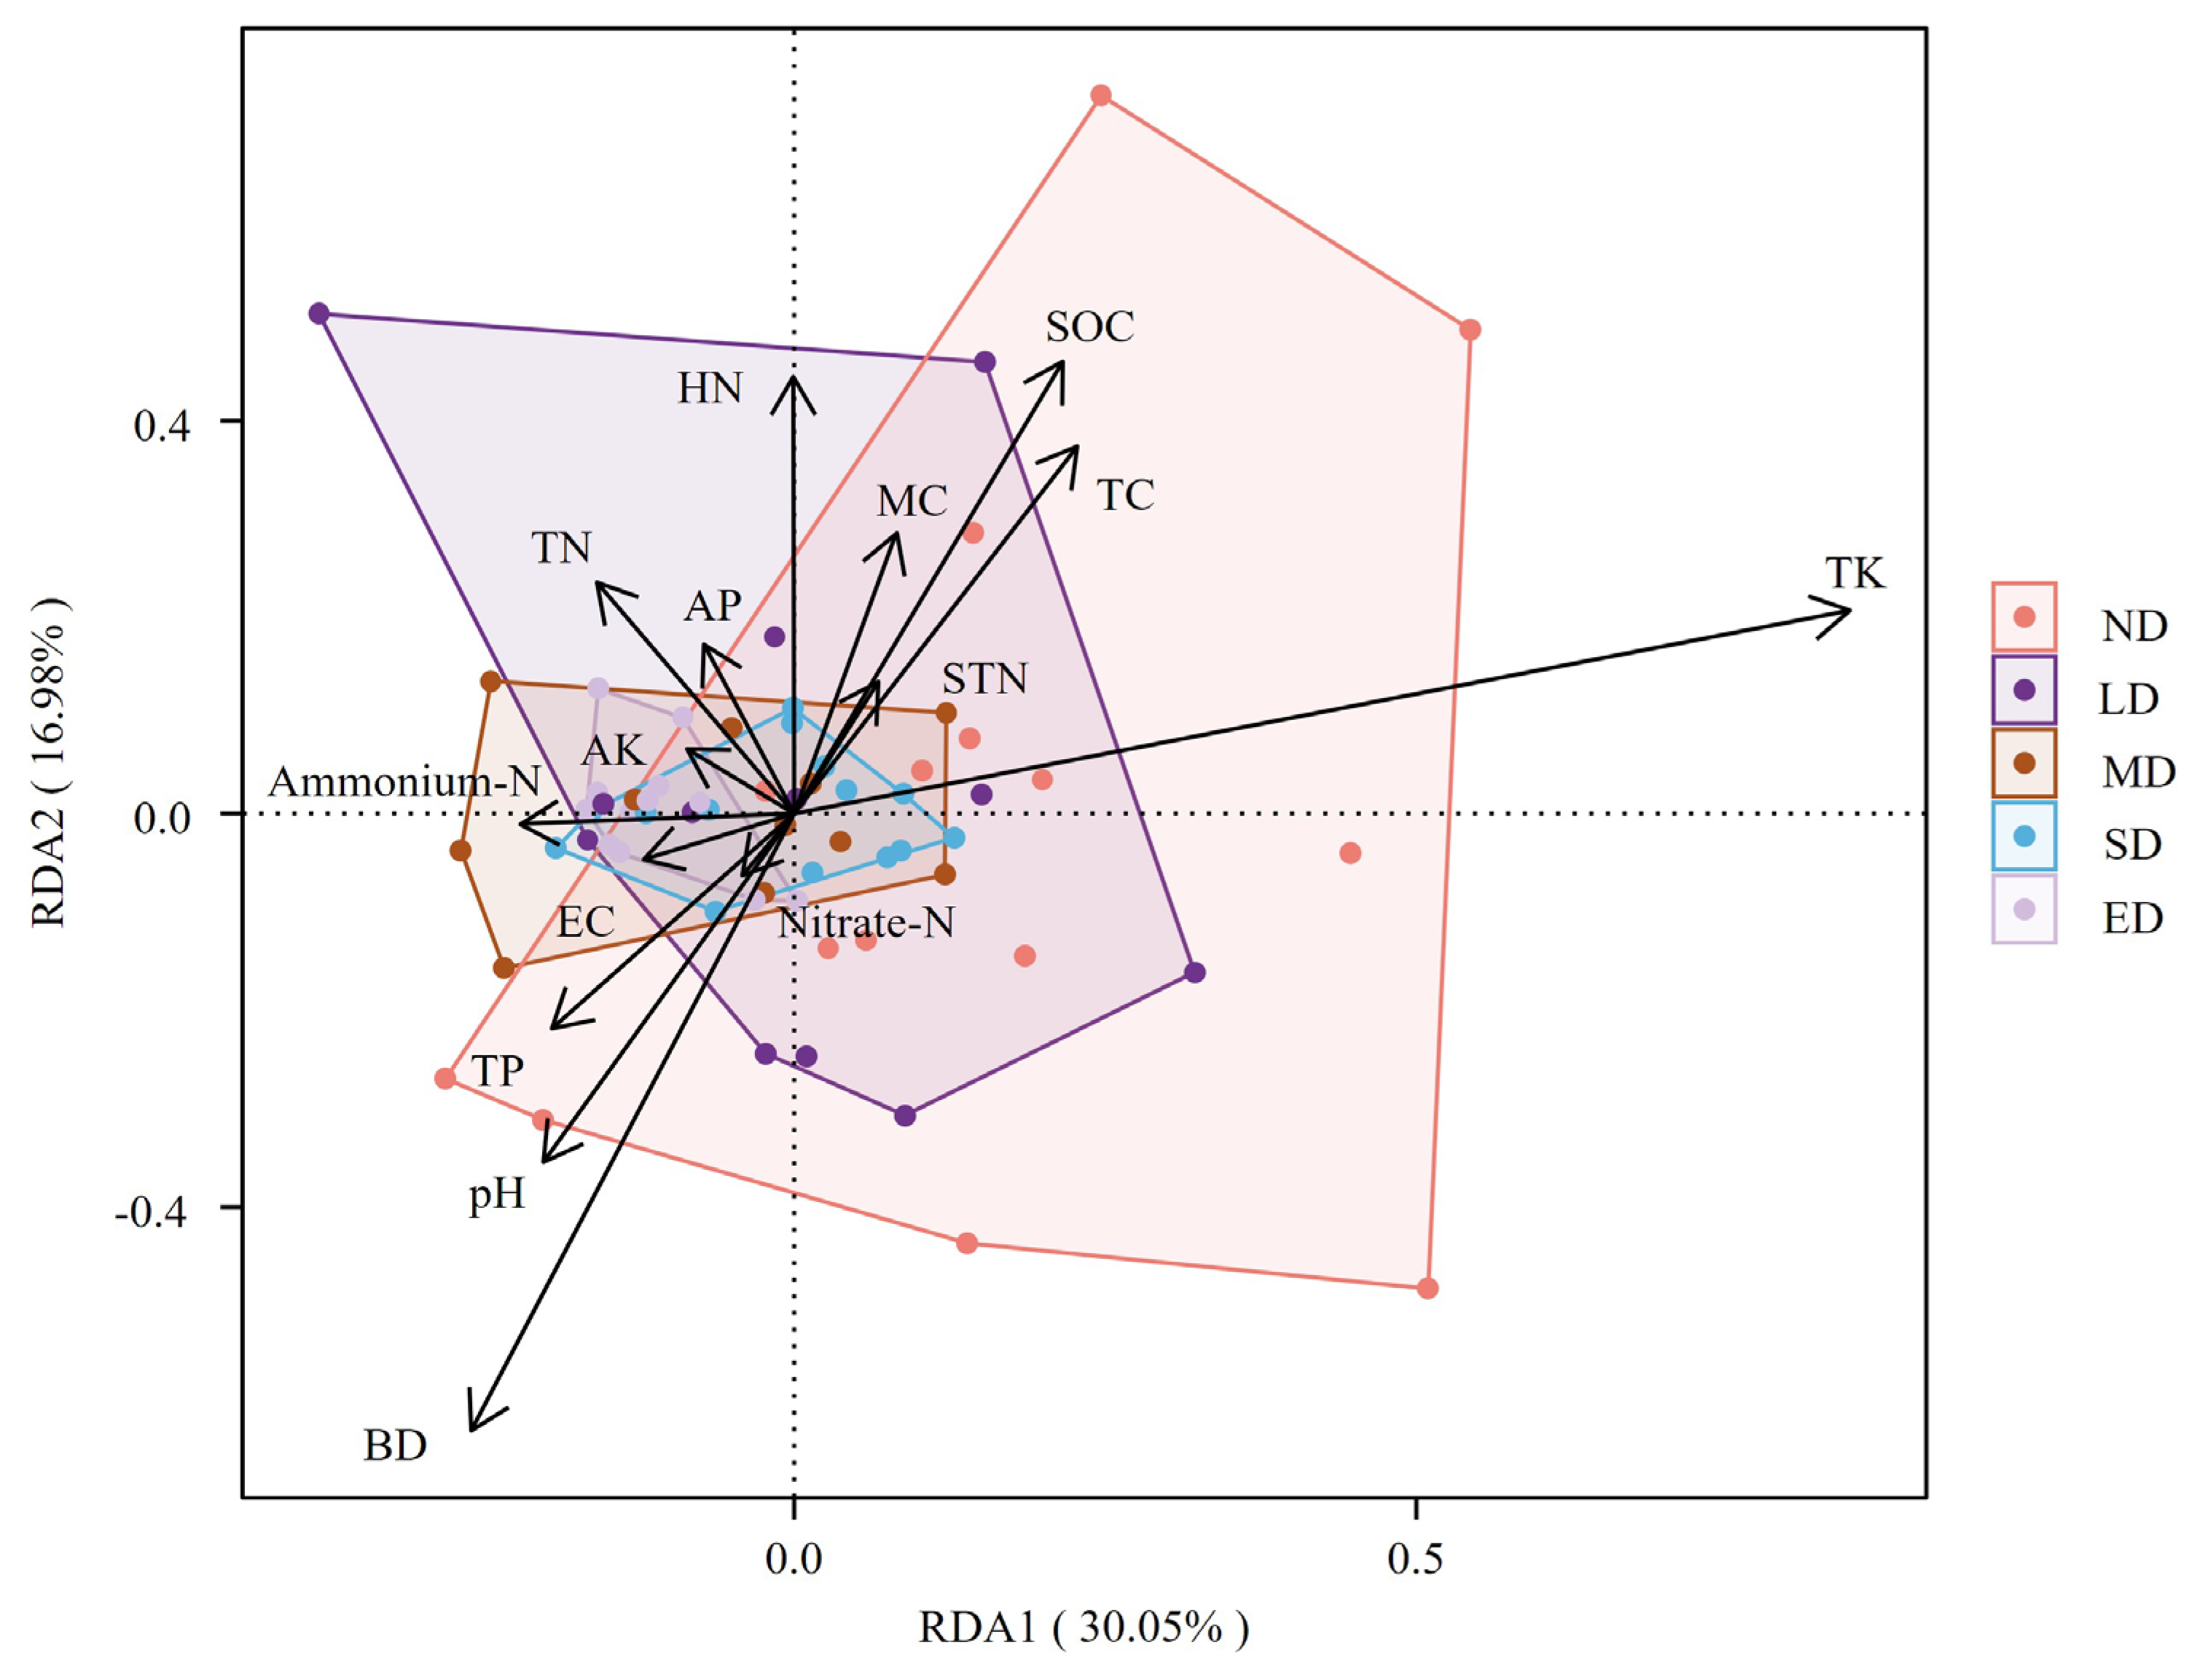
Figure 7.
Relationship between the richness index and the AGB, BGB, LB, SOC, TC, HN, BD, pH, and TK in the study area. AGB, BGB, LB, SOC, TC, HN, BD, pH, and TK represent plant aboveground biomass, plant belowground biomass, litter biomass, soil organic carbon, soil total carbon, hydrolyzable nitrogen content, soil bulk density, potential of hydrogen, and total kalium content respectively.
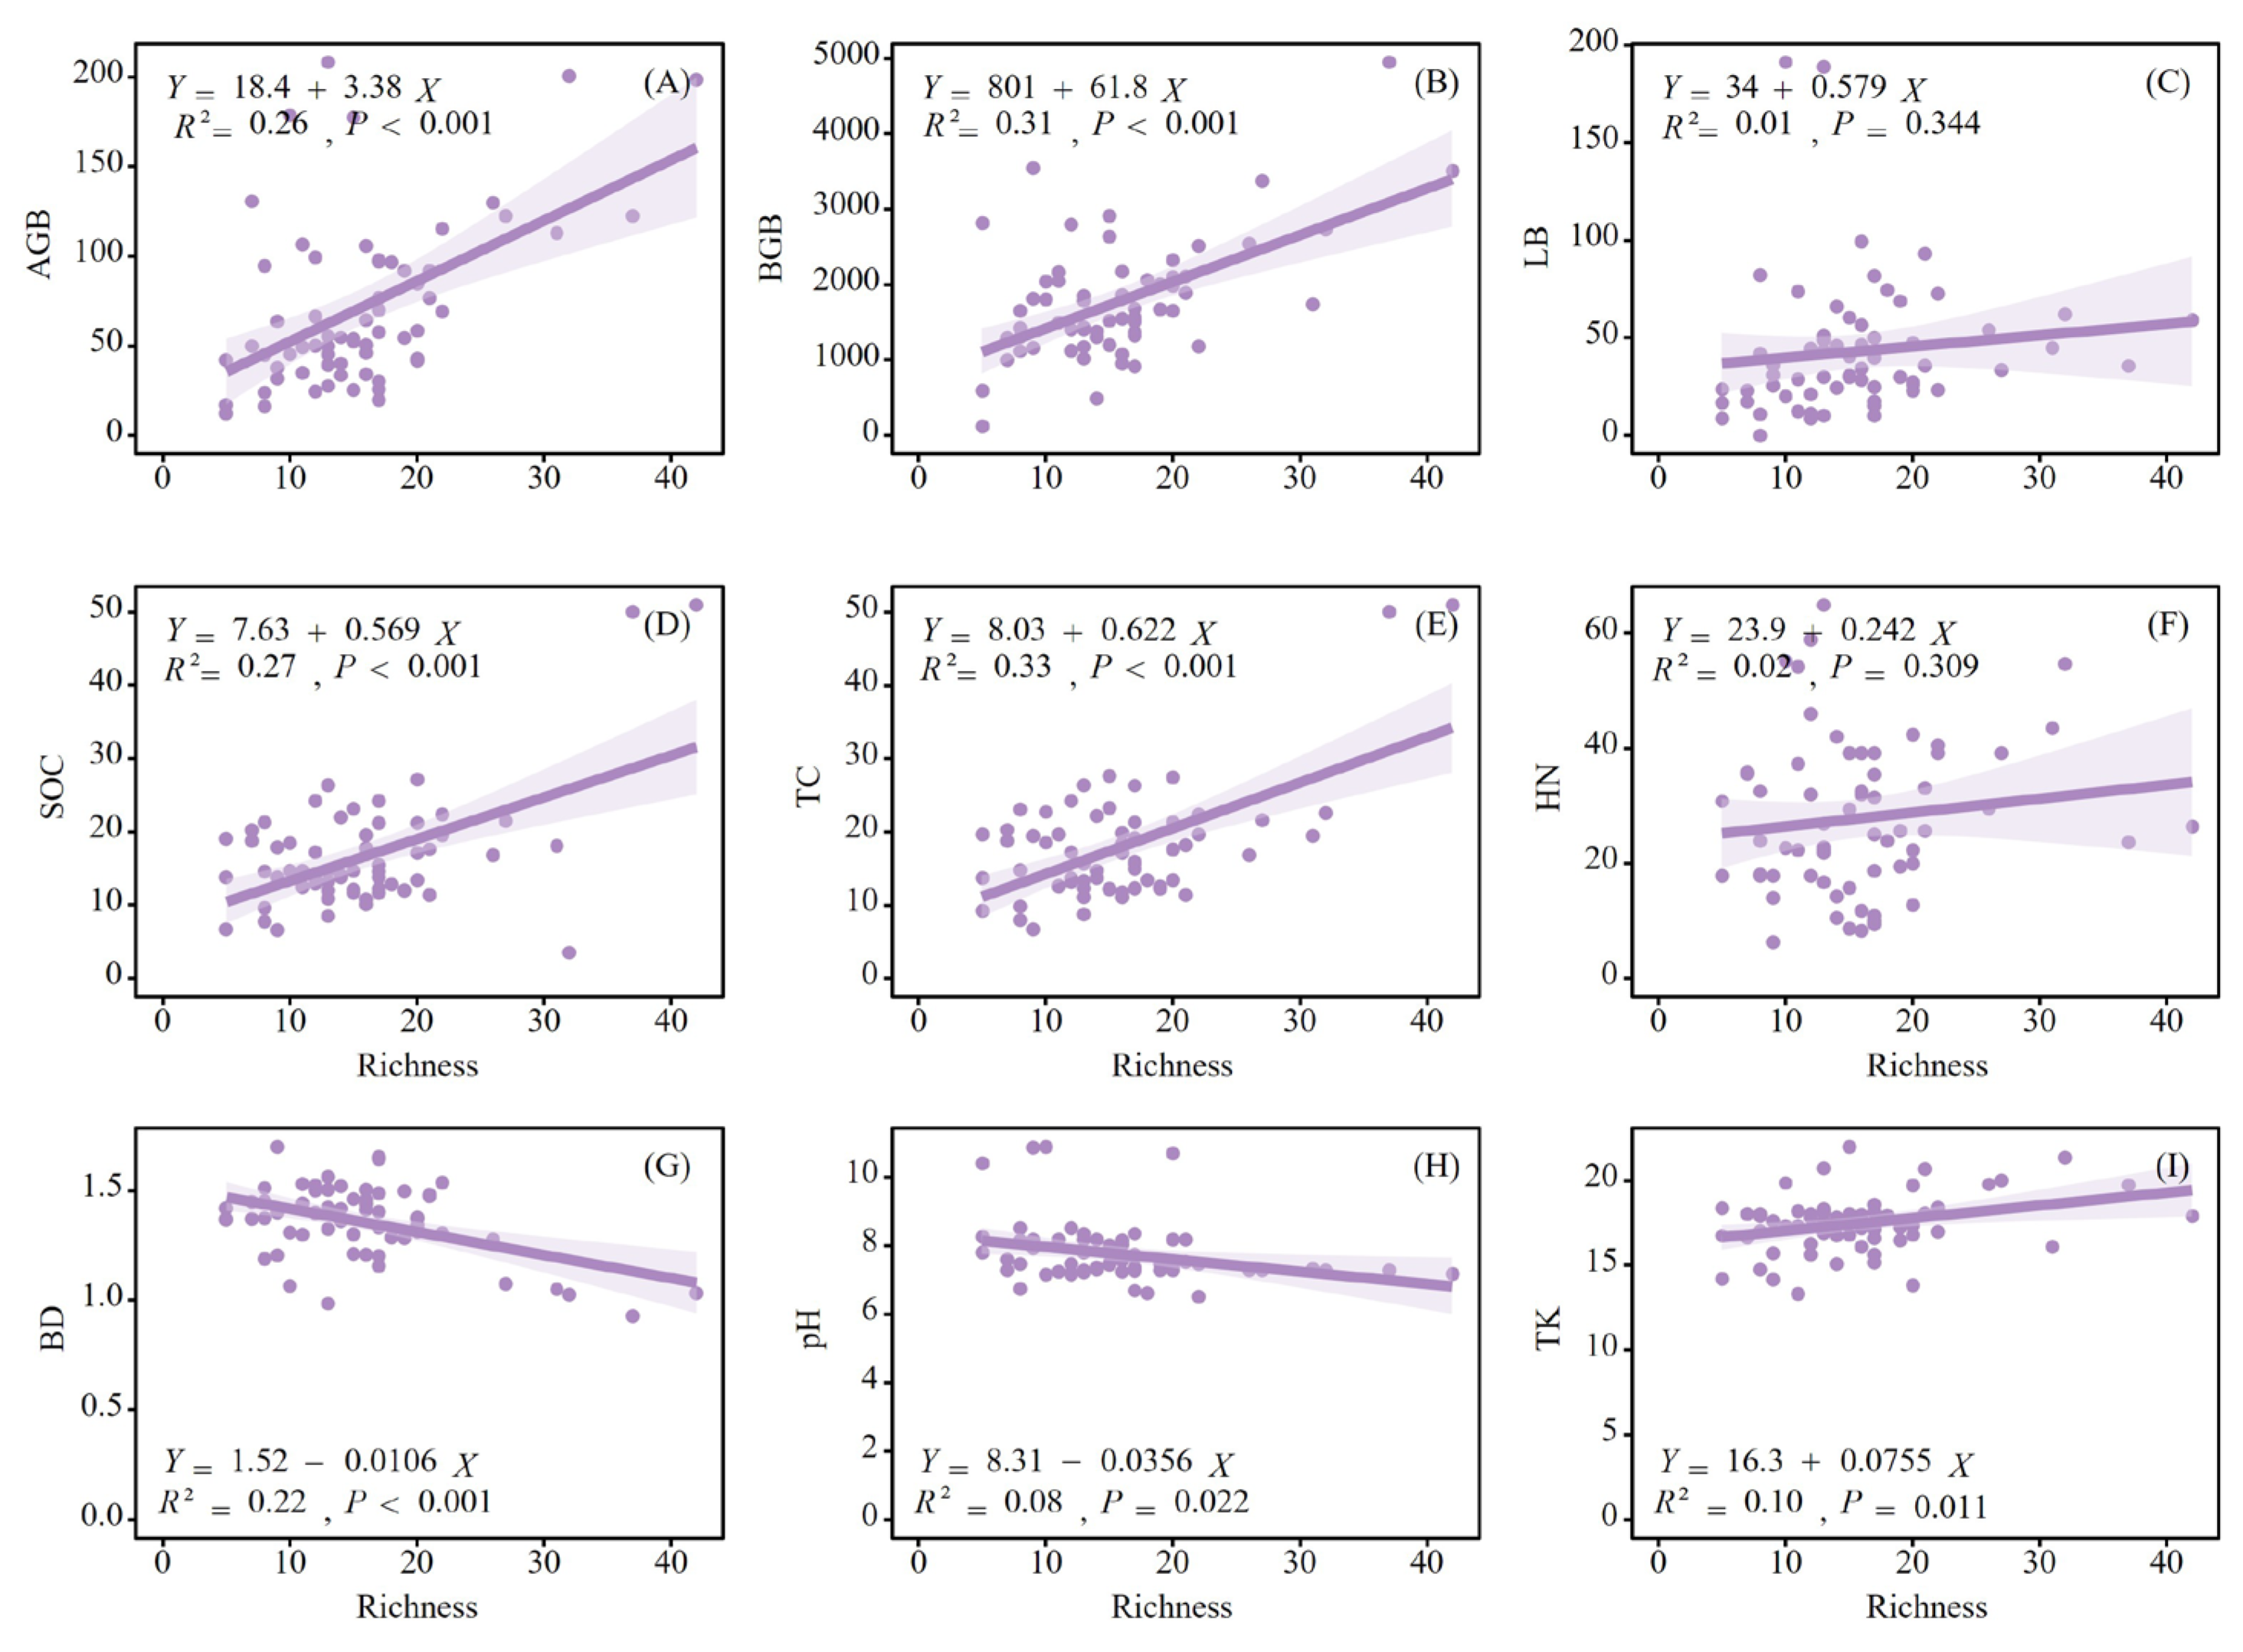
Figure 8.
Partial least squares path modeling was used to analyze the direct and indirect effects of grassland degradation on plant diversity. AGB, BGB, SOC, TC, BD, and TK represent plant aboveground biomass, plant belowground biomass, soil organic carbon, soil total carbon, soil bulk density, and total kalium content, respectively. The red and blue lines indicate positive and negative influences, respectively. The width of the line represents the significance level. Numbers represent standardized path coefficients; *, **, and *** represent P < 0.05, P < 0.01, and P < 0.001, respectively.
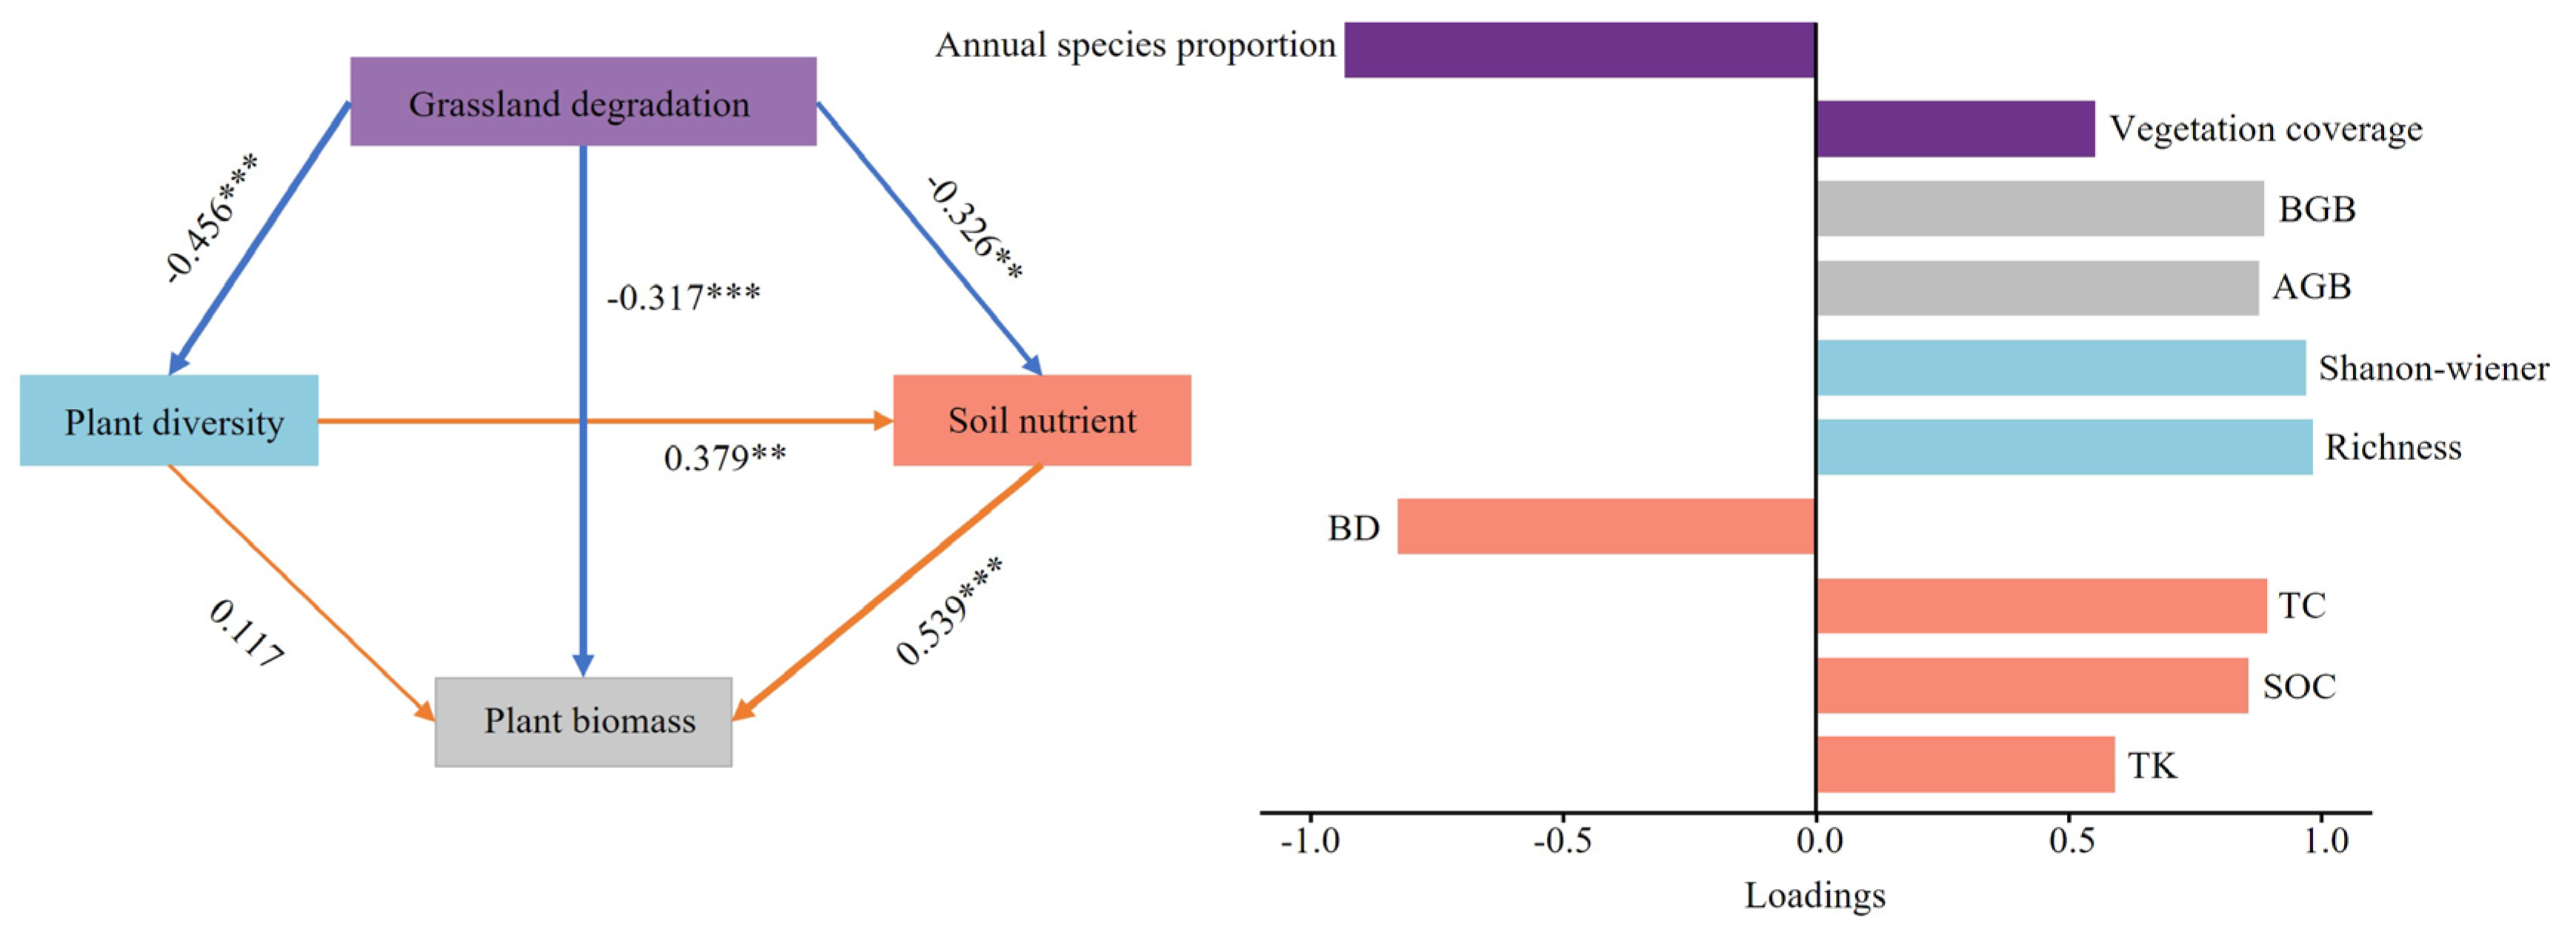

Table 1.
Classification standards for grassland degradation degree.
| Degradation grades | GDI value (%) |
|---|---|
| Non-degraded (ND) | GDI ≥ 90 |
| Lightly Degraded (LD) | 80 ≤ GDI < 90 |
| Moderately Degraded (MD) | 70 ≤GDI < 80 |
| Severely Degraded (SD) | 50 ≤ GDI < 70 |
| Extremely Degraded (ED) | GDI < 50 |
Table 2.
Monte Carlo permutation test results for soil factors with significant effects on the vegetation biomass in the study area.
Table 2.
Monte Carlo permutation test results for soil factors with significant effects on the vegetation biomass in the study area.
| r2 | p-value | |
|---|---|---|
| BD | 0.291 | 0.001 |
| TK | 0.570 | 0.001 |
| SOC | 0.163 | 0.010 |
| TC | 0.123 | 0.029 |
| HN | 0.124 | 0.031 |
| pH | 0.106 | 0.042 |
123. Disclaimer/Publisher’s Note: The statements, opinions and data contained in all publications are solely those of the individual author(s) and contributor(s) and not of MDPI and/or the editor(s). MDPI and/or the editor(s) disclaim responsibility for any injury to people or property resulting from any ideas, methods, instructions or products referred to in the content. |
© 2024 by the authors. Licensee MDPI, Basel, Switzerland. This article is an open access article distributed under the terms and conditions of the Creative Commons Attribution (CC BY) license (https://creativecommons.org/licenses/by/4.0/).
Copyright: This open access article is published under a Creative Commons CC BY 4.0 license, which permit the free download, distribution, and reuse, provided that the author and preprint are cited in any reuse.


