
Submitted:
11 November 2024
Posted:
12 November 2024
You are already at the latest version
Abstract
Rural tourism has emerged as a significant option to meet the people's growing needs for a better life in the new era. Evaluating the competitiveness of the rural tourism industry plays a crucial role in promoting rural revitalization. This thesis is based on a modified Porter’s Diamond Model. The study focuses on representative rural tourism demonstration areas in the upper, middle, and lower reaches of the Yangtze River Economic Belt, specifically Wenjiang District in Chengdu, Huangpi District in Wuhan, and Jiangning District in Nanjing. A Delphi method and Analytic Hierarchy Process were employed to construct a competitiveness evaluation index system for rural tourism and assign weights. The thesis evaluates and compares the competitiveness of the rural tourism industry in the case study regions. The research reveals that the competitiveness of the rural tourism industry in the Yangtze River Economic Belt exhibits a pattern of strong competitiveness in the middle reaches, weaker competitiveness in the upper reaches, and moderate competitiveness in the lower reaches. These differences are significantly influenced by the region's tourism resource endowments, tourism infrastructure, and market scale. Huangpi District demonstrates strong competitiveness in its rural tourism industry. This strength is attributed to its well-developed rural tourism supply system. Jiangning District has moderate competitiveness in its rural tourism industry. This is supported by strong market demand and a relatively complete tourism support system. Wenjiang District shows weaker competitiveness in its rural tourism industry. This weakness results from a fragile rural tourism supply system and sluggish market demand. The thesis concludes with recommendations for enhancing the competitiveness of rural tourism in the Yangtze River Economic Belt.
Keywords:
Rural Tourism Industry
; Competitiveness
; Evaluation
; Diamond Model
; Yangtze River Economic Belt
The tourism industry serves various functions, including structural adjustment, environmental improvement, aesthetic enhancement, harmony promotion, and livelihood benefits. These functions align with the five key objectives of the rural revitalization strategy proposed by the 19th National Congress [1]. Consequently, tourism has been recognized as one of the important pathways for rural revitalization at both national and local levels. The development of the rural tourism industry has assumed a more prominent position. It is currently experiencing significant strategic opportunities. Additionally, with ongoing urbanization, the bidirectional flow of people between urban and rural areas has intensified [2]. As leisure and tourism demands grow stronger, tourism flow plays a vital role in the bidirectional movement of people between cities and countryside. Various forms of rural tourism, such as integrated agricultural complexes, sightseeing farms, modern agricultural technology parks, and distinctive homestays, have developed well [3], significantly improving the industry structure. The tourism industry is gradually becoming a crucial lever for rural development in various regions. However, the development of the rural tourism industry must avoid a reckless approach. Otherwise, it may lead to homogeneous competition and aesthetic fatigue, resulting in economically unviable scales. During the development process, it is essential to clarify individual competitive advantages, capitalize on strengths, and address weaknesses. A scientific development strategy should be formulated to achieve the strategic goals of rural revitalization. In identifying competitive advantages, the most critical foundational work is the evaluation of competitiveness. By assessing various aspects of the rural tourism industry’s competitiveness, one can understand its overall and specific advantages and disadvantages. This understanding is essential for promoting the development of the rural tourism industry and supporting rural revitalization.
Specialized research on the competitiveness of the rural tourism industry is relatively weak in foreign contexts. Noémi Kulcsar (2009) argues that the weakening of cooperation and organizational capabilities is a reason for the low competitiveness of the rural tourism industry in Hungary [4]. Raija Komppula (2014) primarily studied the competitive role of individual enterprises in rural tourism destinations. He found that without entrepreneurs who can innovate and take risks, the destination will not thrive [5]. The tourism market positively influences the competitiveness of the rural tourism industry. Marketing efforts should be strengthened based on market demand. Enhancing the level of service and the quality of business management is crucial for improving competitiveness [6]. Existing research on the competitiveness of the rural tourism industry in China mainly focuses on municipal or provincial levels [7,8,9]. These studies often employ methods such as hierarchical entropy analysis [8], the Diamond Model [10], fuzzy adaptive neural networks [11], typological analysis [12], and gray target modeling to establish relevant evaluation index systems [13,14,15]. Empirical research is then conducted in case study regions. Most research focuses on evaluating the competitiveness of case study regions based on selected indicators [15]. Strategies to enhance competitiveness are then proposed [9].
Scholars both domestically and internationally have made significant progress in studying the competitiveness of the rural tourism industry. However, there remain several shortcomings. First, research by foreign scholars on the competitiveness of the rural tourism industry is quite limited. Existing findings suggest that tourism management organizations, individuals, and marketing efforts are crucial for enhancing rural tourism competitiveness. Nonetheless, the rural tourism industry is a complex system. It involves interactions among various subjects, objects, and intermediaries. International research often presents a narrow view of the factors influencing rural tourism competitiveness. Second, foreign studies tend to emphasize qualitative research on rural tourism managers. Quantitative empirical analyses using established evaluation indicators are less common. The uniqueness of rural areas and their close ties to daily life contribute to significant variations in rural tourism competitiveness across specific regions. Therefore, it is essential to adopt a combined qualitative and quantitative research approach for further study. Third, domestic scholars primarily rely on empirical research for the study of rural tourism industry competitiveness. However, many directly apply existing models or methods, overlooking the uniqueness of rural tourism. This leads to a somewhat arbitrary approach in constructing evaluation systems and selecting indicators. The relevant indicators do not adequately reflect the various characteristics of the rural tourism industry. Fourth, when analyzing rural tourism industry competitiveness, domestic scholars often select case studies from provincial or municipal administrative regions. There are two shortcomings in these case studies. First, the rural characteristics of the case study areas are not sufficiently distinct. The larger urban space lacks empirical research on representative national-level rural tourism destinations, making it difficult to provide effective guidance. Second, targeted research on national strategic economic zones is relatively scarce. National strategic economic zones serve as growth poles and engines for a country’s economic development. They are responsible for coordinating urban-rural development, implementing precise poverty alleviation, and constructing beautiful rural areas. Therefore, targeted research on the competitiveness of the rural tourism industry in these zones is essential.
Based on this, the thesis improves upon classic tourism competitiveness models to construct a suitable evaluation system for rural tourism industry development. This thesis selects typical rural tourism destinations in the Yangtze River Economic Belt as case studies. The study employs the Delphi method and Analytic Hierarchy Process (AHP). It constructs a competitiveness evaluation index system for the rural tourism industry based on an improved competitiveness evaluation model, assigning weights to the indicators. The thesis evaluates the competitiveness of the rural tourism industry in the case study areas and conducts a comparative analysis of their strengths and weaknesses. Corresponding strategies for enhancement are also proposed. This work enriches the models used for evaluating rural tourism industry competitiveness and expands the evaluation pathways. Moreover, due to the representative nature of the selected case studies, this research provides universal guidance for evaluating rural tourism competitiveness, facilitating the implementation of the national rural revitalization strategy. Additionally, this thesis offers diagnostic insights for the development of the rural tourism industry in the case study areas and provides targeted recommendations for enhancing their competitiveness.
I. Overview of the Study Area
The Yangtze River Economic Belt is a vast economic corridor that connects eastern and western China while linking the north and south. This region exhibits significant economic disparities, featuring three major urban clusters: Chengdu-Chongqing, the middle Yangtze River, and the Yangtze River Delta. The Yangtze River Economic Belt is rich in tourism resources and serves as a core support area for China’s development as a strong tourism nation. In 2016, the total number of tourist visits to the Yangtze River Economic Belt reached 6.775 billion, reflecting a year-on-year increase of 17.71%. Total tourism revenue amounted to 7.49 trillion yuan, with a growth rate of 21.17%. The tourism economy within the Yangtze River Economic Belt holds a significant position in the overall landscape of China’s tourism economy [16]. Therefore, this thesis designates the Yangtze River Economic Belt as the case study area. The study selects representative cities from the upper, middle, and lower reaches for empirical research.
This thesis specifically examines Jiangning District in Nanjing, Huangpi District in Wuhan, and Wenjiang District in Chengdu as case studies. There are three main reasons for this selection. First, Nanjing, Wuhan, and Chengdu are significant central cities in the lower, middle, and upper reaches of the Yangtze River Economic Belt, respectively. Choosing these three case studies effectively illustrates the developmental differences across the three-tier regional economic structure. They also represent varying levels of rural tourism industry development within the Yangtze River Economic Belt. Second, comparability. Nanjing, Wuhan, and Chengdu are all sub-provincial cities and provincial capitals. Additionally, Jiangning District, Huangpi District, and Wenjiang District are municipal districts within these cities. The similar urban status of the selected case studies enhances their comparability. Third, universality. Jiangning District, Huangpi District, and Wenjiang District were all designated as “National Rural Tourism Demonstration Zones” in 2012, showcasing notable development in their rural tourism industries. This designation holds significant importance in the local economic landscape. Therefore, the characteristics related to rural tourism competitiveness in these case study areas are highly representative and applicable.
II. Research Methods
(1) Selection of the Rural Tourism Industry Competitiveness Evaluation Model
Michael Porter proposed the theory of competitive advantage in 1990 (Figure 1). This theory states that industry advantage depends on six factors: production factors, market demand, related industry development, corporate management, government policy, and opportunities [17]. In evaluating resource elements, the competitive advantage theory emphasizes management factors and visible competitiveness in the development of rural destinations. It also highlights the potential competitiveness of dynamic development capabilities. Furthermore, in the study of rural tourism industry competitiveness, this theory suggests adopting a differentiation development strategy. The literature review indicates that some researchers directly applied this model when analyzing the competitiveness of tourism destinations.
Additionally, Xiao Hongye (2006) proposed the IMD Regional Competitiveness Evaluation Model [18]. David Ricardo (2013) introduced the theory of comparative advantage in his work [19], which also provides insights into competitiveness evaluation frameworks. In studies of tourism destination competitiveness, a “seven-factor” model based on the diamond model was proposed [20]. Dwyer and Kim (2003) built on the seven-factor model to further develop a comprehensive model for tourism destination competitiveness [21]. These studies identify eight key factors frequently addressed across the models: tourism resources, tourism market, destination support, economic development level, corporate strategy, structural elements, industry competition, government, opportunities, and environmental conditions. Notably, the widely recognized factors influencing competitiveness show significant overlap with Michael Porter’s diamond model.
Residents of cities where tourism destinations are located represent the most important market for rural tourism development. Local population size and economic development level greatly affect the scale and efficiency of the rural tourism market. This ultimately reflects in the market demand for rural tourism. Therefore, the economic development level of a destination should be included in the evaluation of tourism market factors.
Rural tourism resources are highly attractive to visitors. These resources include the natural scenery and cultural features of the tourism destination. On the other hand, this is also reflected in the rural tourism environment. It includes the unique fresh air, clean water quality, and tranquil atmosphere characteristic of rural tourism destinations. Tourists visit rural areas primarily to pursue tourism resources with rural features and to enjoy a high-quality rural tourism environment. Tourism resources and the tourism environment are fundamental production factors for rural tourism activities.
The analysis identifies six key factors influencing the competitiveness of the rural tourism industry: production factors, market demand, destination support conditions, corporate strategy, structural elements, and government actions. This aligns with Michael Porter’s diamond model. Therefore, this thesis adopts Michael Porter’s diamond model as the foundational theoretical framework for evaluating rural tourism industry competitiveness.
However, the model emphasizes a macro perspective. It is primarily applicable to evaluating competitiveness at the national level. Consequently, factors such as corporate strategy, structural elements, and horizontal competition are prominently macro characteristics. However, the uniqueness of the rural tourism industry dictates that the model cannot be directly applied. It requires corresponding modifications.
The development of the rural tourism industry in China is significantly influenced by government factors. National strategies, such as rural revitalization and beautiful countryside construction, have greatly promoted the improvement of rural landscapes and the development of leisure agriculture. These strategies create excellent strategic opportunities for the development of the rural tourism industry [22]. Therefore, the two external factors of government actions and opportunities can be combined into one external factor: government actions and opportunities.
Furthermore, the evaluation of rural tourism industry competitiveness in a specific region is relatively micro-level. The number and scale of rural tourism enterprises are small, making the influence of development level factors more pronounced. Consequently, corporate strategy, structural elements, and competitive factors can be summarized using the development level of enterprises.
In summary, this thesis constructs a competitiveness evaluation model tailored to the characteristics of rural tourism industry development after the aforementioned modifications. This model comprises production factors, enterprise development levels, related supporting industries, market demand factors, government actions [23], and opportunity factors, thus enabling the evaluation of rural tourism industry competitiveness (Figure 2).
(2) Construction of the Competitiveness Evaluation Index System for the Rural Tourism Industry
This is based on the competitiveness evaluation model for the rural tourism industry. A review of existing literature reveals that production factor elements primarily encompass the resources and environment of rural tourism destinations. Superior rural tourism resources are important attractions. These resources are often developed into scenic spots or even tourist areas. The classification of these spots and areas reflects the quality of rural tourism resources. Therefore, the quantity of A-level scenic areas and high-level tourist attractions is used to assess the state of tourism resources. Within the tourism environment, the natural environment serves as the foundation. This is measured by the number of days with good air quality and the rate of waste disposal. The development level of enterprises is primarily evaluated through travel agencies, catering, and accommodation sectors. This includes scale and benefit indicators such as the number of travel agencies, the number of rooms in star-rated hotels, the number of star-rated homestays, and revenue from the catering and accommodation industry. The relevant supporting industries include infrastructure such as road transportation and telecommunications. Road transportation is measured by road mileage and passenger turnover; telecommunications is analyzed by the number of internet access ports. The competitiveness of the tourism market is influenced by both the current market size and the potential for market growth. Markets with large sizes and high growth potential exhibit greater competitiveness. Therefore, the analysis includes the scale and growth rates of tourist numbers and tourism revenue, as well as the proportion of tourism revenue to GDP. Additionally, urban populations represent a potential customer base for rural tourism. The local urban population and economic development levels are significant indicators of the scale and potential of the rural tourism market. Thus, total urban population, disposable income, per capita GDP, and the Engel coefficient reflect the scale and potential of the tourism market. Government factors primarily include government investment and policy support [7,8,9,11,12,15]. Fixed asset investment and the frequency of the term “tourism” in government work reports serve as measurement indicators.
By integrating these factors, the study employs the Delphi method and Analytical Hierarchy Process to construct an evaluation index system for the competitiveness of the rural tourism industry. This also includes determining data sources for each indicator (Table 1).
(3) Determination of Indicator Weights for the Competitiveness of the Rural Tourism Industry in the Yangtze River Economic Belt
The study employed the Delphi method to distribute a survey to five experts in tourism from universities. Experts assessed the importance of each indicator through pairwise comparisons and provided anonymous feedback. Based on the experts’ scores, the Analytic Hierarchy Process (AHP) was used to determine the weight values.
1. Construction of the Judgment Matrix
In the AHP model, indicators were evaluated through pairwise comparisons based on their importance, resulting in the following judgment matrix. To improve calculation accuracy and reduce difficulties in comparing different types of factors, a consistent matrix method was employed. This method established the weights among the factors at each level through pairwise comparisons. Importance levels were classified and assigned values using the 1-9 scale method proposed by Santy, resulting in the judgment matrix.
2. Weight Calculation
① Calculate the product of each row’s elements in matrix M.
② Compute the n‐th root of Mi:
③ Perform normalization:
④ Calculate the maximum eigenvalue λmax.
3. Consistency Test
To assess the feasibility of the constructed matrix, the allowable range of inconsistency for the judgment matrix was determined. Each matrix underwent a consistency test using the following formula:
In the formula, n represents the order of the judgment matrix; CR is the consistency ratio; CI denotes the consistency index; and RI is the average random consistency index. If CR < 0.10, the matrix is considered consistent. Following these steps, the weight values for the indicators assessing the competitiveness of the rural tourism industry in the Yangtze River Economic Belt were obtained (Table 2).
In calculating the weights of the five primary indicators through the judgment matrix, the consistency index (CI) values for all five indicators were found to be 0. This indicates complete consistency in the judgment matrices. A consistency check was then conducted on the overall hierarchy ranking. The results showed that CI = 0.00. This indicates that the overall hierarchy ranking meets the consistency verification requirements. Regarding the weights of each evaluation indicator, the order from highest to lowest is market demand, production factors, government policies and opportunities, related supportive industries, and enterprise development level.
III. Results and Analysis
(1) Evaluation Scores of Tourism Industry Competitiveness in the Case Area
Due to the differing attributes of the original data, direct comparability among the various characteristics is lacking. Therefore, this thesis applies the methods of subtraction normalization and deviation standardization to process the original data, thereby enhancing data comparability. It multiplies the weight values of each indicator by their normalized values to obtain the scores for the criterion layer C indicators (Table 3). Based on the scores of the sub-criterion layer C indicators, the scores for the criterion layer B indicators are further calculated (Table 4). Utilizing the scores from the criterion layer B indicators, the Analytic Hierarchy Process (AHP) is employed to derive the competitiveness ratings for the rural tourism industry in the three case areas (Table 5). A higher score reflects stronger competitiveness, and vice versa. It is important to note that the competitiveness scores presented in this thesis are relative values. A score of 0 does not imply that the region has no foundation in that indicator. Rather, it indicates that, relative to the comparison object, the competitiveness for that indicator is 0.
(2) Results of the Competitiveness Evaluation of the Rural Tourism Industry
Based on the scores above, the competitiveness of the rural tourism industry in the three case areas ranks from strongest to weakest as follows: Huangpi District, Jiangning District, and Wenjiang District. Huangpi District has a high competitiveness index, primarily supported by production factors, related supportive industries, and government actions and opportunities. In Wenjiang District, while the market demand factor stands out, other factors lag significantly behind those in Huangpi and Jiangning districts.
Regarding production factors, Huangpi District benefits from its comparative advantage in tourism resources, making it more competitive than Jiangning and Wenjiang districts; Wenjiang District exhibits the weakest competitiveness. In 2019, Huangpi District was recognized as one of the first national all-for-one tourism demonstration zones. Its endowment of tourism resources is significantly higher than that of Jiangning and Wenjiang districts. However, Huangpi District lags in the rate of harmless treatment of municipal waste. This rate is the lowest among the three regions. The tourism environment in Jiangning District is superior to that of Huangpi and Wenjiang districts. This is mainly due to its significantly better air quality compared to Huangpi and Wenjiang districts. However, its tourism resource quality is relatively poor. Wenjiang District’s production factors for rural tourism are comprehensively inferior to those of the other two regions. The air quality indicator is a key reason for Wenjiang District’s lower competitiveness score in production factors compared to Huangpi and Jiangning districts.
From the perspective of enterprise development level, Jiangning District has a competitiveness index higher than that of Huangpi District and Wenjiang District. This advantage is primarily due to the significantly greater number of travel agencies and star-rated farm stays in Jiangning District compared to the other two regions. However, Jiangning District’s revenue from the catering and accommodation industry is relatively low, representing a weakness. Huangpi District exceeds the other two regions in both catering and accommodation revenue as well as the number of star-rated hotel rooms. Wenjiang District lags behind the other two regions in the number of travel agencies, star-rated hotel rooms, and star-rated farm stays. The disparity in the number of star-rated hotel rooms is particularly pronounced. This deficiency lowers Wenjiang District’s competitiveness score.
From the perspective of related supportive industries, Huangpi District’s competitiveness index is higher than that of Jiangning and Wenjiang districts. This is mainly due to its superior highway mileage and highway passenger turnover, which are significantly greater than those in the other two regions. However, the per capita volume of mail services represents a shortcoming, as it is lower than in the other two regions. Jiangning District leads in per capita postal service volume compared to the other two regions. However, its highway passenger turnover and the number of internet access ports detract from its competitiveness score. Wenjiang District has the highest number of internet access ports, but its performance in other indicators is not outstanding. In particular, there is a significant gap in highway mileage compared to the other two regions. This gap lowers its overall score.
From the perspective of market demand, Jiangning District has a competitiveness index higher than that of Wenjiang District and Huangpi District. It significantly outperforms the other two regions in seven indicators: D17 tourism revenue and its share of GDP, D13 number of tourists, D14 average growth rate of tourists over the past three years, D19 disposable income of residents, D20 per capita GDP, and D21 Engel’s coefficient. However, Jiangning District scores lower in D16 average growth rate of tourism revenue over the past three years and in D18 total urban population. Wenjiang District has the highest average growth rate of tourism revenue and total urban population over the past three years. This significantly supports its competitiveness score. However, its total tourism revenue and number of visitors received are lower than those of the other two regions. In particular, the average growth rate of tourists over the past three years is far below that of the other two regions. This hinders improvements in its score. Huangpi District’s share of tourism revenue in GDP, disposable income of residents, and per capita GDP are lower than those of the other two districts. Other indicators are also not outstanding, resulting in its lowest overall score.
From the perspective of government actions and opportunities, Huangpi District has a competitiveness index higher than that of Jiangning District and Wenjiang District. This advantage is mainly due to the significantly higher number of mentions of “tourism” in its government work reports compared to the other two regions. Data analysis indicates that Jiangning District has the highest total social fixed asset investment. However, it has the lowest number of mentions of “tourism” in its government work reports. This reflects insufficient policy support. Consequently, this lowers its score. In contrast, Wenjiang District has the lowest total social fixed asset investment score, which results in its overall score being the lowest.
IV. Conclusions and Recommendations
(1) Conclusions
1. There are significant differences in the competitiveness of rural tourism industries along the Yangtze Economic Belt, particularly between the upper, middle, and lower reaches. The rural tourism industry in the middle reaches of the Yangtze River is relatively strong, while it is weaker in the upper reaches and moderate in the lower reaches. The differences in the competitiveness of rural tourism industries across various regions of the Yangtze Economic Belt are influenced by multiple factors. Among these, the endowment of tourism resources, infrastructure, and market scale have a substantial impact. Additionally, factors such as local policy support, the environment of rural tourism destinations, and economic development levels also play significant roles.
2. Huangpi District exhibits strong competitiveness in its rural tourism industry. The primary reason is the district’s rich tourism resources, which provide a comparative advantage. Additionally, it has established a relatively complete supply system for the rural tourism industry. The district performs exceptionally well in terms of rural tourism production factors, related support industries, and government actions and opportunities. However, the market demand for rural tourism in Huangpi District is relatively weak. Development primarily relies on the Wuhan metropolitan area. This creates a noticeable gap when compared to the Yangtze River Delta and Chengdu-Chongqing urban agglomerations. There are disparities in both regional economic development levels and the maturity of the tourism market. Moreover, differences in regional economic development levels also affect the support for the rural tourism market. This leads to a lag in the development of information infrastructure. The governance of the rural living environment is also insufficient, negatively impacting the quality of the tourism environment.
3. Jiangning District demonstrates moderate competitiveness in its rural tourism industry. This is largely due to the influence of the Yangtze River Delta tourism market. The demand for rural tourism in Jiangning District is strong. Tourism enterprises sufficiently meet this market demand, with a large number and scale. However, economic growth is slow, resulting in low profitability. Additionally, the government’s limited focus on tourism restricts improvements in competitiveness. Jiangning District has relatively poor tourism resource endowments, but it has invested significantly in tourism facilities and the living environment in recent years. The support system for the rural tourism industry is relatively complete, with aesthetically pleasing rural living conditions and a favorable tourism environment.
4. Wenjiang District exhibits relatively weak competitiveness in its rural tourism industry. Its rural tourism production factors, enterprise development levels, related support industries, and government actions all show delayed growth. Consequently, the supply system for the rural tourism industry is weak. Within this system, the number of tourism enterprises and investment in tourism facilities are relatively insufficient. Particularly, the severe shortage of star-rated hotels negatively impacts rural tourism revenues. Limited road traffic mileage affects the accessibility of rural tourism sites. Additionally, issues such as relatively poor air quality further contribute to low tourist reception levels in Wenjiang District. Growth in tourism is slow, and the profitability of tourism enterprises is also poor. However, there is a positive growth trend. This may be due to the low baseline of tourism enterprise profitability, where even modest gains can reflect a favorable development trend.
(2) Recommendations
Regions along the Yangtze River Economic Belt should prioritize rural tourism as a key strategy for rural revitalization and targeted poverty alleviation. They should place significant emphasis on developing the rural tourism industry. Specialized policies must be established to promote and support the development of this sector. Additionally, efforts should be intensified to leverage unique resources while prioritizing infrastructure and the rural living environment. These regions should enhance outreach efforts to facilitate the diffusion of regional tourism markets and economic development factors toward rural tourism. Areas along the Yangtze River Economic Belt should strengthen coordination and cooperation within the rural tourism industry. They should complement each other’s advantages and create an interactive network that enhances competitive synergy.
Huangpi District should leverage the Wuhan metropolitan area to further expand the rural tourism market. It should strengthen the integration of the rural tourism industry with related sectors. The region’s economic influence on rural tourism should be increased. Efforts must be made to accelerate the development of rural information technology and improve living conditions. Focus should be placed on enhancing both soft and hard infrastructure to improve the tourism experience and attract visitors.
Jiangning District should intensify efforts to innovate rural tourism resources. It should develop diverse consumer projects to stimulate tourism consumption. Enhancing the tourism experience in Jiangning District will increase participation and attract more visitors, thereby improving economic benefits. Additionally, the government should elevate its focus on rural tourism. More policies supporting the development of the rural tourism industry should be implemented to further unlock the benefits of economic integration in the Yangtze River Delta region.
Wenchuan District should strengthen its economic outreach within the Chengdu-Chongqing metropolitan area. Increased investment in rural tourism enterprises and facilities is essential. Emphasis must be placed on constructing rural accommodation and transportation infrastructure. This will improve accessibility and enhance local tourism reception capacity. Wenchuan District should focus on the clean use of energy and pollution control from vehicles. Optimizing the regional industrial layout is also necessary. Furthermore, improving rural environmental management will enhance tourism quality. Efforts should be made to expand the rural tourism market in Wenchuan District. This includes addressing both supply and demand to further stimulate consumer potential.
References
- Sun, Zhen, and Wang, Qian. “Research on the Formation and Enhancement of Core Competitiveness in Rural Tourism Under the Context of Cultural and Tourism Integration.” Agricultural Economics, 2021, (01).
- Xiang, Jiquan, and Liu, Kaichuang. “The Transformation and Development of Rural Governance in China under the Background of Urbanization.” Journal of Central China Normal University (Humanities and Social Sciences), 2019, (02).
- Wang, Jingyao, and Duan, Xueshan. “Rural Revitalization: Examination of Japan’s Rural Complex Construction.” Jianghan Tribune, 2018, (05).
- Noémi K. Rural tourism in Hungary: the key of competitiveness[J]. Symposium for Young Researchers, 2009, (03).
- Raija K. The role of individual entrepreneurs in the development of competitiveness for a rural tourism destination[J]. Tourism Management, 2014, (04). [CrossRef]
- Ahn B Y, Lee B K, Shafer C S. Operationalizing sustainability in regional tourism planning: An application of the limits of acceptable change framework[J]. Tourism Management, 2002, (01). [CrossRef]
- Zhao, Wei, Li, Zirong, Li, Ruirui, et al. “Evaluation of Rural Tourism Competitiveness in County Areas of Fujian Province.” Chinese Agricultural Resources and Regional Planning, 2017, (03). [CrossRef]
- Yang, Yanhong. “Evaluation of the Competitiveness of Leisure Farms in Hainan Province Based on Rural Tourism.” Chinese Agricultural Resources and Regional Planning, 2020, (02).
- Liu, Yutang, and Gao, Ruixia. “Research on the Core Competitiveness of Rural Tourism from the Perspective of Cultural and Tourism Integration.” Theoretical Monthly, 2020, (01). [CrossRef]
- Wang, Xinyue, and Zhu, Wenliang. “Evaluation of Rural Tourism Competitiveness and Analysis of Obstacles in Shandong Province.” Geographic Science, 2019, (01). [CrossRef]
- Wang, Jing, and Hu, Aijun. “Evaluation of Agricultural Sightseeing Tourism Competitiveness Based on Fuzzy Neural Networks.” Rural Economy, 2015, (06).
- Cheng, Qian, and Guo, Jingjing. “Analysis of the Competitiveness of Ancient Villages Based on Types.” Economic Geography, 2011, (07).
- Tian, Junfang, and Wang, Fei. “Measurement and Comparison of Service Trade Competitiveness in Central China—An Empirical Test Based on a Grey Target Model of Inbound Tourism.” Jianghan Forum, 2016, (03). [CrossRef]
- Shao, Gejun, and Wang, Guiqing. “Selection of Evaluation Indicators for Tourism Destination Competitiveness.” Rural Economy, 2014, (01).
- Hu, Yuna, Mei, Lin, and Liu, Jisheng. “Construction of an Evaluation Indicator System for County-Level Rural Tourism Competitiveness and Research on Typology—A Case Study of 12 County Units in Yantai.” Journal of Shandong Agricultural University (Social Science Edition), 2015, (03). [CrossRef]
- Zhang, Xiang, Li, Yan, and Xie, Shuangyu. “Tourism Cooperation in the Yangtze River Economic Belt: Potential, Obstacles, and Breakthroughs.” Exploration of Economic Issues, 2018, (03).
- Michael ⋅Porter. “The Competitive Advantage of Nations.” Beijing: CITIC Press, 2012.
- Xiao, Hongye, and Zheng, Huazhang. “IMD World Competitiveness Methodology and Its Application——In the Case of International Competitiveness of China’s Regions.” Statistics and Information Forum, 2006, (05).
- David Ricardo. “Principles of Political Economy and Taxation.” Beijing: Huaxia Publishing House, 2012.
- Ritchie J R, Crouch G J. The competitive destination: A sustainable tourism perspective[M]. Wallingford: CABI, 2003.
- Larry D, Chulwon K. Destination competitiveness: Determinants and indicators[J]. Current Issues in Tourism, 2003, (05). [CrossRef]
- Wang, Weixing. “Construction of Beautiful Villages: Current Situation and Countermeasures.” Journal of Central China Normal University (Humanities and Social Sciences), 2014, (01).
- Xu, Ke. “Research on the Evaluation of Rural Tourism Competitiveness in Huangpi District.” Wuhan: College of Urban and Environmental Sciences, Central China Normal University, 2019.
Figure 1.
Porter’s Competitiveness Model.
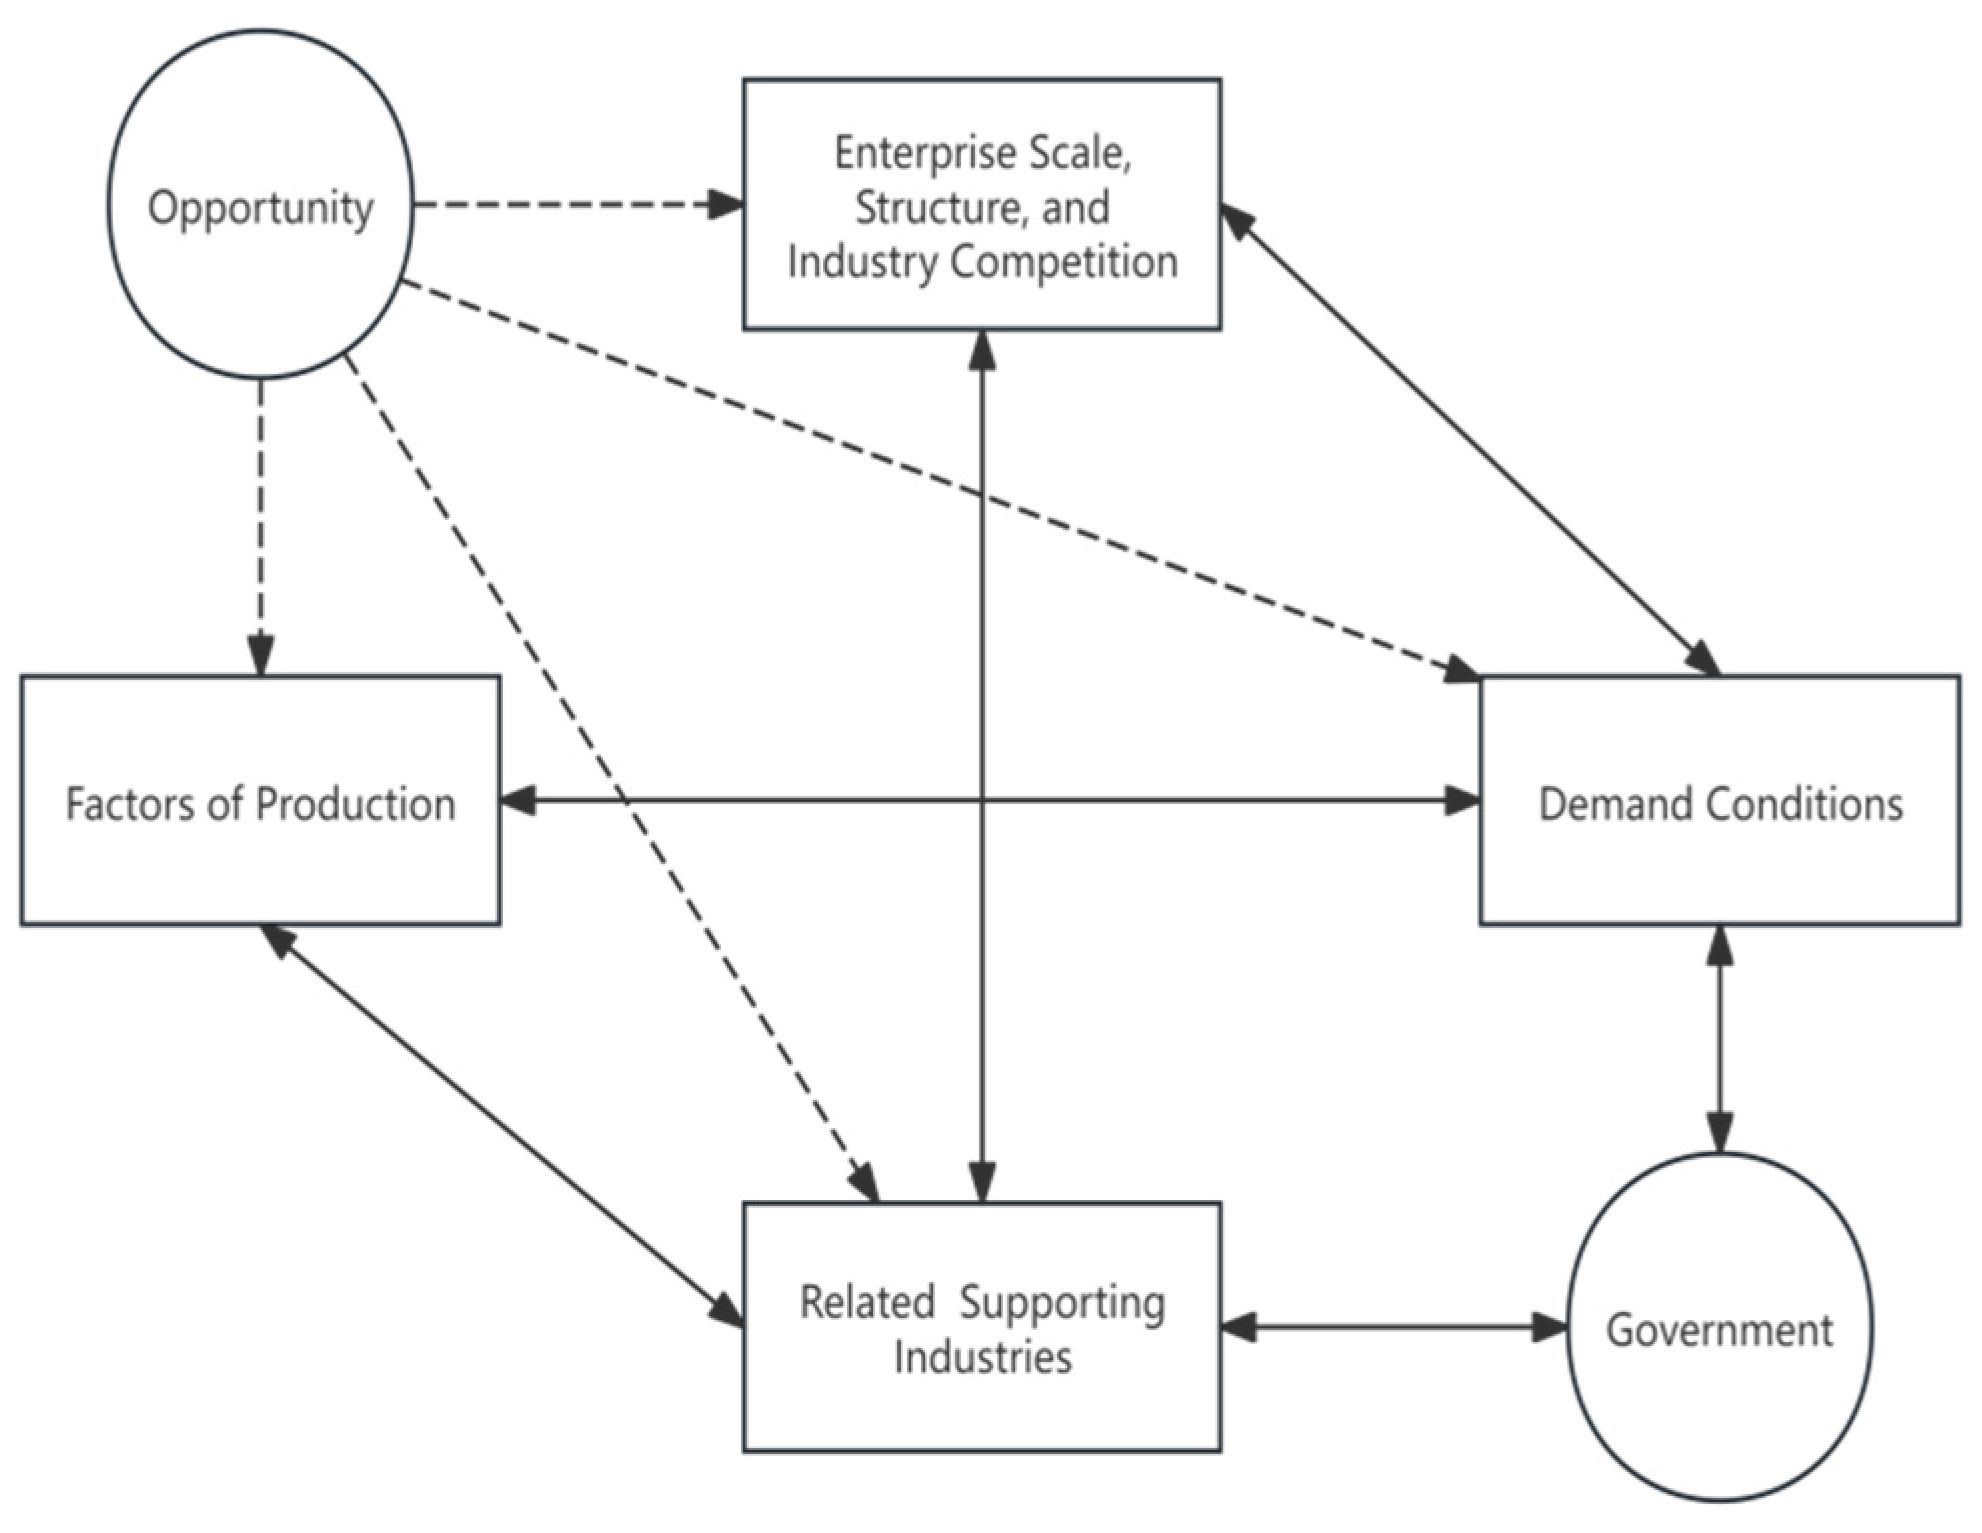
Figure 2.
Revised evaluation model of rural tourism competitiveness.
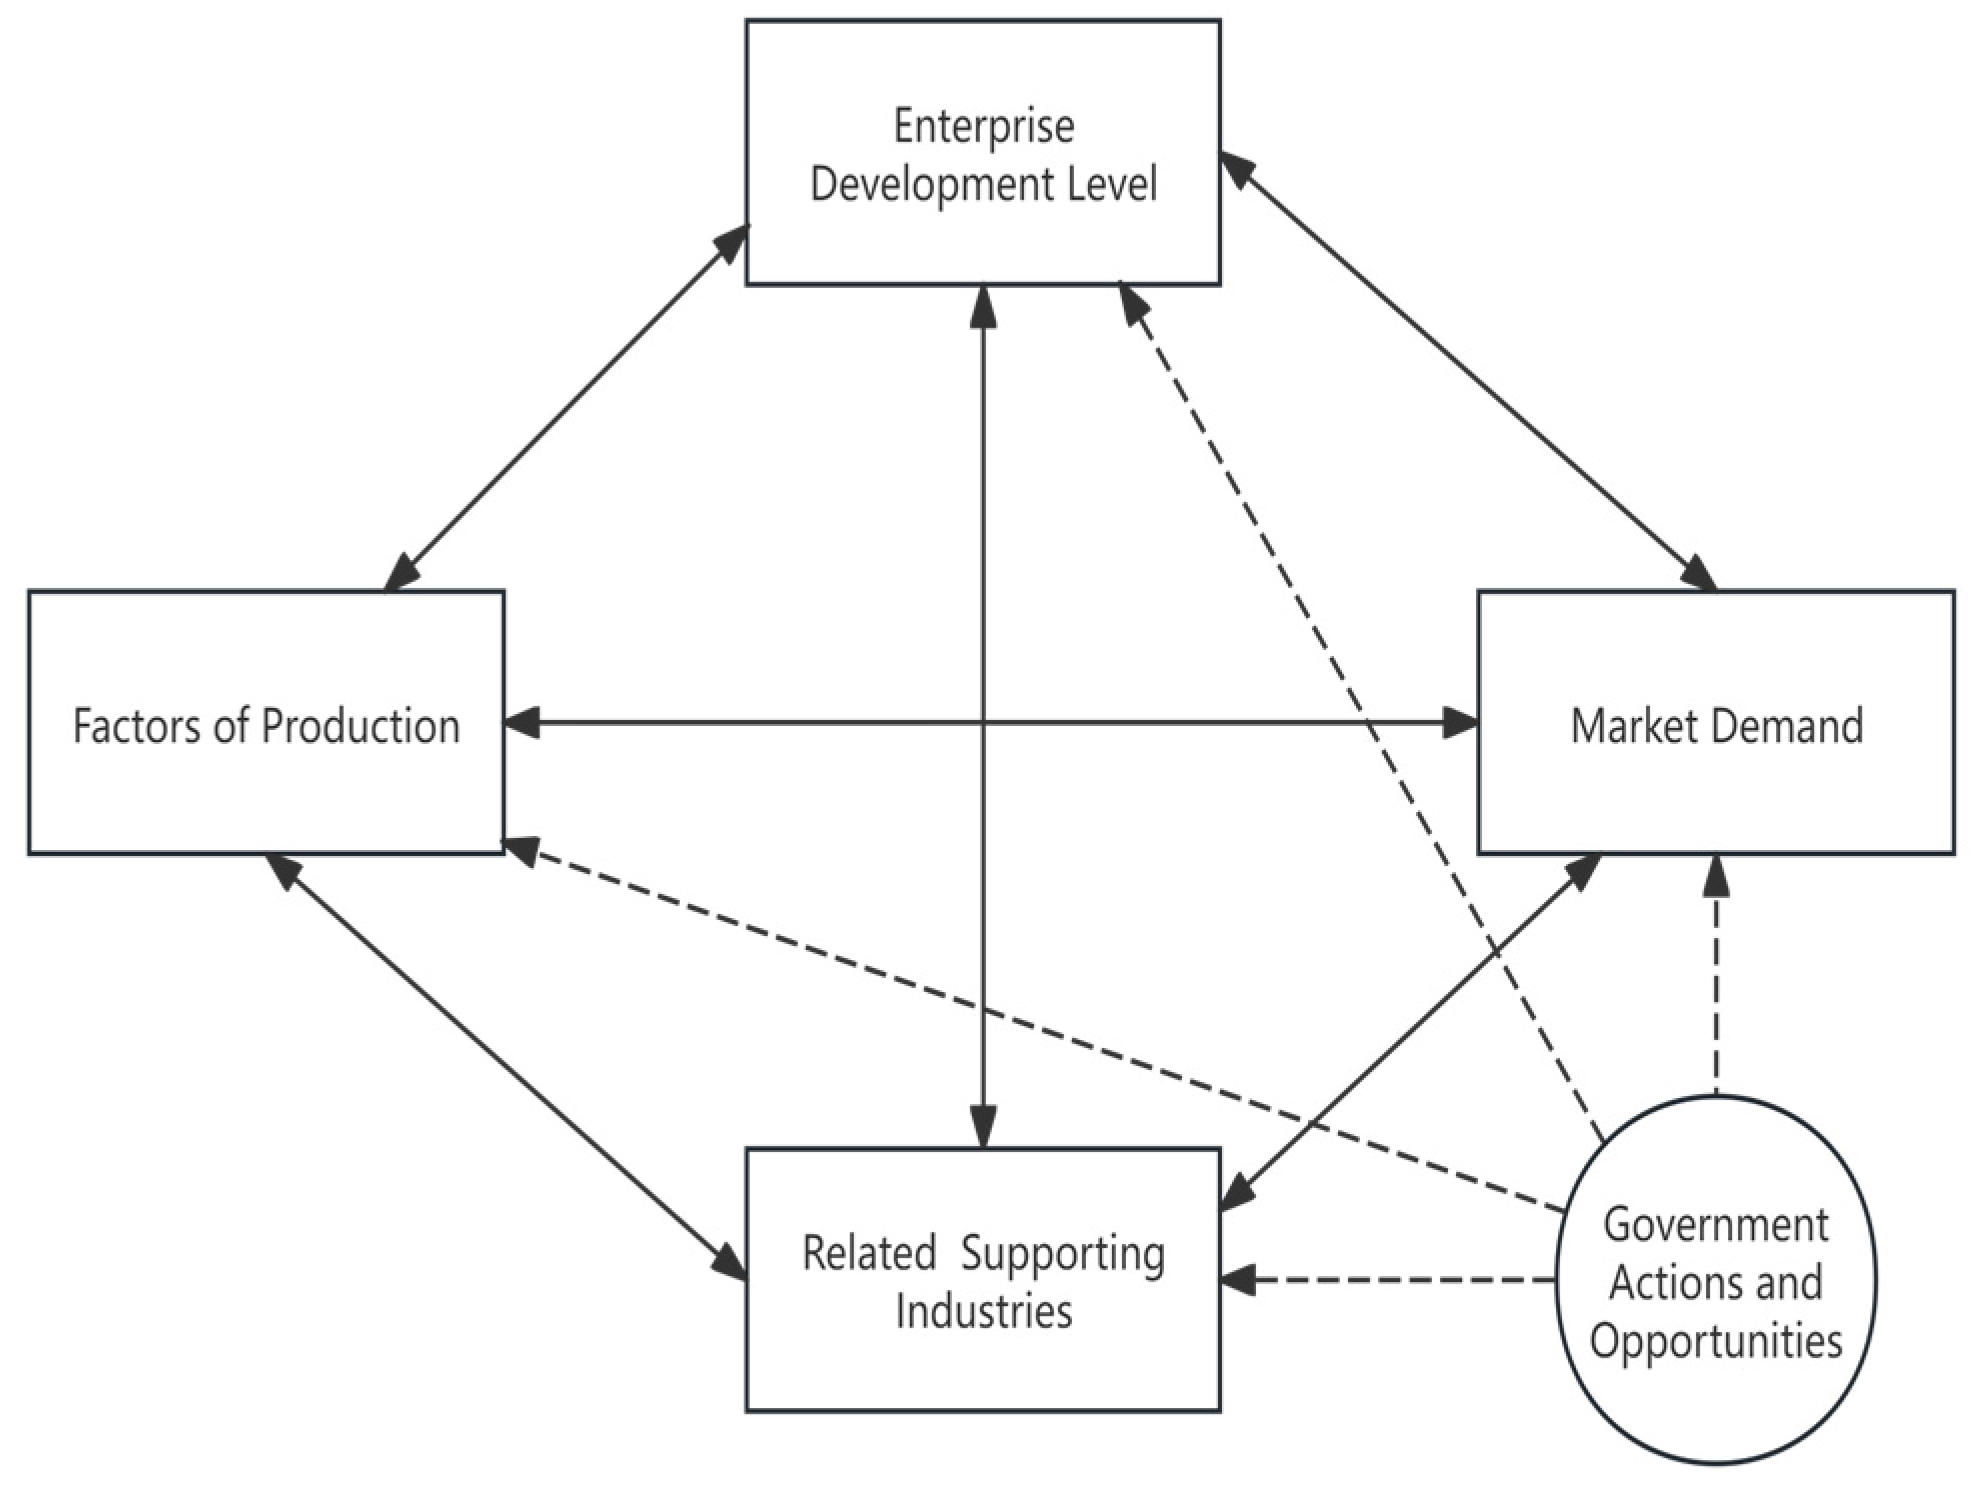

Table 1.
Evaluation Index System for the Competitiveness of the Rural Tourism Industry and Data Sources.
Table 1.
Evaluation Index System for the Competitiveness of the Rural Tourism Industry and Data Sources.
| Criteria Level C | Indicator Level D | Data Sources |
|---|---|---|
| C1 Tourism Resources | D1: Number of A-Level Scenic Areas | Source: Tourism Bureau Website |
| D2: Number of 4A and 5A Scenic Areas | ||
| C2 Tourism Environment | D3: Number of Days with Good Air Quality | Source: 2018 Statistical Bulletin on National Economic and Social Development |
| D4: Rate of Non-Hazardous Treatment of Household Waste | ||
| C3 Travel Agencies | D5: Number of Travel Agencies | |
| C4 Dining and Accommodation Industry | D6: Revenue of the Dining and Accommodation Industry | |
| D7: Number of Star-rated Hotel Rooms | Source: Ctrip | |
| D8: Number of Star-rated Farm Stays | Source: Tourism Bureau Website | |
| C5 Road Traffic | D9: Length of Roads | Source: 2018 Statistical Bulletin on National Economic and Social Development |
| D10: Passenger Turnover in Road Transport | ||
| C6 Telecommunications | D11: Per Capita Postal and Telecommunications Volume | Source: 2017-2019 Statistical Bulletin on National Economic and Social Development |
| D12: Number of Internet Port Connections | Source: 2018 Statistical Bulletin on National Economic and Social Development | |
| C7 Tourism Market | D13: Total Number of Tourists | |
| D14: Average Growth Rate of Tourist Numbers | Source: 2017-2019 Statistical Bulletin on National Economic and Social Development | |
| D15: Total Tourism Revenue | ||
| D16: Average Growth Rate of Tourism Revenue | ||
| D17: Total Tourism Revenue as a Percentage of GDP | ||
| C8 Population and Economy | D18: Total Urban Population | Source: 2018 Statistical Bulletin on National Economic and Social Development |
| D19: Disposable Income of Residents | Source: 2017-2019 Statistical Bulletin on National Economic and Social Development | |
| D20: Per Capita GDP | Source: 2018 Government Work Report | |
| D21: Engel Coefficient | ||
| C9 Government Investment | D22: Fixed Asset Investment | Source: 2018 Statistical Bulletin on National Economic and Social Development |
| C10 Policy Support | D23: Frequency of “Tourism” Mentioned in Government Work Reports | Source: 2018 Government Work Report |
Table 2.
Weights of Evaluation Indicators for the Competitiveness of the Rural Tourism Industry in the Yangtze River Economic Belt.
Table 2.
Weights of Evaluation Indicators for the Competitiveness of the Rural Tourism Industry in the Yangtze River Economic Belt.
| Primary Indicator | Primary Weight | Secondary Indicator | Secondary Weight | Total Secondary Weight | Tertiary Indicator | Tertiary Weight | Total Tertiary Weight |
| Production Factors B1 | 0.2346 | Tourism Resources C1 | 0.6667 | 0.1951 | Number of A-level Scenic Areas D1 | 0.2000 | 0.0356 |
| Number of 4A and 5A Scenic Areas D2 | 0.8000 | 0.1595 | |||||
| Tourism Environment C2 | 0.3333 | 0.0395 | Number of Days with Good Air Quality D3 | 0.6667 | 0.0217 | ||
| Rate of Non-Harmful Treatment of Domestic Waste D4 | 0.3333 | 0.0178 | |||||
| Business Management B2 | 0.0543 | Travel Agencies C3 | 0.3333 | 0.02564 | Number of Travel Agencies D5 | 1.0000 | 0.02564 |
| Food and Accommodation Industry C4 | 0.6667 | 0.0286 | Revenue from Food and Accommodation D6 | 0.1638 | 0.0089 | ||
| Number of Starred Hotel Rooms D7 | 0.5389 | 0.0117 | |||||
| Number of Starred Agritourism Houses D8 | 0.2973 | 0.008 | |||||
| Related Supporting Industries B3 |
0.1454 | Highway Transportation C5 | 0.7500 | 0.1139 | Length of Highways D9 | 0.8750 | 0.0965 |
| Passenger Turnover in Highway Transport D10 | 0.1250 | 0.0174 | |||||
| Network Communications C6 | 0.2500 | 0.0315 | Per Capita Postal and Telecommunications Volume D11 | 0.1250 | 0.0048 | ||
| Number of Internet Port Access Points D12 | 0.8750 | 0.0267 | |||||
| Market Demand B4 | 0.3599 | Tourism Market C7 | 0.8000 | 0.2697 | Total Number of Tourists D13 | 0.4190 | 0.156 |
| Average Growth Rate of Tourist Numbers (2017-2019) D14 | 0.0671 | 0.0089 | |||||
| Total Tourism Revenue D15 | 0.2503 | 0.0423 | |||||
| Average Growth Rate of Tourism Revenue (2017-2019) D16 | 0.1634 | 0.0272 | |||||
| Proportion of Tourism Revenue to GDP D17 | 0.1002 | 0.0353 | |||||
| Population and Economy C8 | 0.2000 | 0.0902 | Total Urban Population D18 | 0.4598 | 0.0366 | ||
| Per Capita Disposable Income D19 | 0.2723 | 0.0167 | |||||
| Per Capita GDP D20 | 0.1803 | 0.013 | |||||
| Engel’s Coefficient D21 | 0.0876 | 0.0239 | |||||
| Government Opportunities and Actions B5 | 0.2058 | Government Investment C9 | 0.2500 | 0.0633 | Fixed Asset Investment D22 | 1.0000 | 0.0633 |
| Policy Support C10 | 0.7500 | 0.1425 | Number of Mentions of “Tourism” in Government Work Reports D23 | 1.0000 | 0.1425 |
Table 3.
Scores of C-Level Indicators in the Indicator System.
| Indicators in the sub-criterion layer C | Competitiveness Scores | ||
| Huangpi District | Jiangning District | Wenjiang District | |
| C1 Tourism Resources | 0.1687 | 0.0067 | 0 |
| C2 Tourism Environment | 0.0498 | 0.1233 | 0.0346 |
| C3 Travel Agencies | 0.0039 | 0.0256 | 0 |
| C4 Dining and Accommodation Industry | 0.0233 | 0.0189 | 0.0045 |
| C5 Road Traffic | 0.1654 | 0.0405 | 0.0036 |
| C6 Telecommunications | 0.0169 | 0.0053 | 0.0289 |
| C7 Tourism Market | 0.0569 | 0.1567 | 0.0756 |
| C8 Population and Economy | 0.0123 | 0.0223 | 0.0432 |
| C9 Government Investment | 0 | 0.036 | 0.0003 |
| C10 Policy Support | 0.0897 | 0.0026 | 0.0189 |
Table 4.
Scores of B-Level Indicators in the Indicator System.
| Indicators in the criterion layer B | Competitiveness Scores | ||
| Huangpi District | Jiangning District | Wenjiang District | |
| B1 Production Factors | 0.3014 | 0.1267 | 0.0408 |
| B2 Enterprise Development Level | 0.0339 | 0.04 | 0.0057 |
| B3 Related Supportive Industries | 0.1298 | 0.0399 | 0.0297 |
| B4 Market Demand | 0.0857 | 0.2897 | 0.1456 |
| B5 Government Actions and Opportunities | 0.1102 | 0.0357 | 0.0124 |
Table 5.
Final Score Summary.
| Huangpi District | Jiangning District | Wenjiang District | |
| Competitiveness Score of the Rural Tourism Industry | 0.687 | 0.508 | 0.354 |
| Ranking of the Rural Tourism Industry Competitiveness | 1 | 2 | 3 |
Disclaimer/Publisher’s Note: The statements, opinions and data contained in all publications are solely those of the individual author(s) and contributor(s) and not of MDPI and/or the editor(s). MDPI and/or the editor(s) disclaim responsibility for any injury to people or property resulting from any ideas, methods, instructions or products referred to in the content. |
© 2024 by the authors. Licensee MDPI, Basel, Switzerland. This article is an open access article distributed under the terms and conditions of the Creative Commons Attribution (CC BY) license (http://creativecommons.org/licenses/by/4.0/).
Copyright: This open access article is published under a Creative Commons CC BY 4.0 license, which permit the free download, distribution, and reuse, provided that the author and preprint are cited in any reuse.


