
Submitted:
08 November 2024
Posted:
12 November 2024
You are already at the latest version
Abstract
Alzheimer's disease is a challenge in modern healthcare due to its complex etiology and increasing prevalence. Despite advances, further understanding of Alzheimer's disease pathophysiology is needed, particularly the role of Aβ neurotoxic peptide. Fourier-transform infrared spectroscopy (FTIR) has shown potential as a screening tool for several pathologies, including Alzheimer's disease. Nonetheless, limited research has explored the Aβ direct effects on neurons and extracellular vesicles metabolic profiles. Hence, this study aims to investigate the Aβ impact on the metabolic profiles of a neuronal-like cell line (N2a) and N2a-derived extracellular vesicles, employing FTIR spectroscopy. A comprehensive analysis of spectral data was carried out, focusing on the 1280-900 cm-1 region, including multivariate partial least squares-discriminant analysis (PLS-DA) and peak intensities analysis. PLS-DA analysis revealed moderate to strong correlations within the 1280-900 cm-1 spectral area for both N2a and N2a-derived extracellular vesicles. The peak intensity analysis revealed additional peaks with significant differences in EVs’ spectra relative to N2a following Aβ treatment. Specifically, Aβ seems to cause alterations in protein phosphoryla-tion and in the nucleic acids content of extracellular vesicles. These findings supports that Aβ’s role in Alzheimer's disease pathology may be mediated by extracellular vesicles and highlighting FTIR’s potential for advancing Alzheimer's disease research and clinical applications.
Keywords:
FTIR
; Aβ
; Alzheimer's Disease
; Extracellular vesicles
; Neuro-2a cells
1. Introduction
Estimates indicate that dementia affects more than 55 million people worldwide, with this number tripling by 2050. Alzheimer’s disease (AD) is the main cause of dementia, contributing to 60-70% of cases [1]. This progressive neurodegenerative disorder is clinically characterized by cognitive decline, affecting memory and orientation, having a huge impact in the patient’s quality of life. At the histopathological level the two main AD hallmarks are amyloid-beta peptides (Aβ) deposition into extracellular senile plaques (SPs) and the intracellular formation of neurofibrillary tangles, due to hyperphosphorylated tau protein aggregation [2].
Aβ is a small peptide generated from amyloid precursor protein (APP) proteolytic cleavage. The latter is a transmembrane protein highly expressed in neurons. Amyloidogenic APP processing comprises an initial proteolytic cleavage by β-secretase leading to the release of soluble fragments, the amyloid precursor proteins (sAPP β) and a C-terminal peptide that is further cleaved by γ-secretase, a protease complex with presenilin becoming the active site, generating the amyloid peptides [3]. Aβ peptides can vary in length, with two major species present in the brain, Aβ1-40 and Aβ1-42, being the last more prompt to aggregate and the primary component of SPs [2]. Once generated, the Aβ monomers tend to assemble first into Aβ oligomers (Aβo), then form protofibrils, that ultimately elongate into insoluble fibrils and accumulate into SPs [4]. Although SPs are one of AD’s hallmarks, Aβo are the major neurotoxic species. Soluble Aβo are highly toxic and can cause synaptic disfunction by interacting with cell-surface neuronal receptors, impairing long-term potentiation and enhancing long-term depression [5]. Aβo but also Aβ protofibrils and fibril, can activate microglia, leading to the release of pro-inflammatory cytokines, inducing neuroinflammation, a key event in AD pathogenesis [3]. Additionally, Aβo can impair mitochondria function, disrupt intracellular calcium homeostasis and induce reactive oxygen species production.
A large body of evidence places Aβ accumulation and aggregation at the center of AD pathophysiology, but many other molecular alterations have been linked to the disease, including metabolic alterations. Distinct metabolic analysis has been carried, including resorting to Fourier Transform Infrared (FTIR) spectroscopy. It is rapid and easy to perform, affordable, label-free and requires very small sample volumes. It measures the vibrational energy of chemical bonds based on the light absorbed by these molecular bonds, providing valuable information simultaneously regarding samples main molecular contents: proteins, nucleic acids, lipids and carbohydrates [6,7,8]. In fact, FTIR offers many advantages, however other techniques such as Raman spectroscopy and nuclear magnetic resonance (NMR) are also widely used in the analysis of biomolecules [9]. FTIR and Raman aim to identify functional groups in samples whereas NMR is applied to the identification of specific molecules, making these techniques complementary. While FTIR measures the frequencies at which samples absorbs radiation, is sensitive to hetero-nuclear functional groups and polar bonds, Raman relies on inelastic light scattering to analyze molecular vibrations, is sensitive to nonpolar and homo-nuclear bonds, allowing the analysis of samples in aqueous environments. However, Raman generated signals are usually weak and it can be necessary to apply signal enhancement techniques or denoising algorithms to improve signal [10,11]. NMR spectroscopy offers high-resolution structural data, which is relevant to identify the exact structure of a molecule, being more specific to the study of metabolites than FTIR or Raman spectroscopic techniques [12,13]. FTIR spectroscopy is a powerful tool for characterizing metabolic profiles and it has been applied successfully to discriminate control from AD cases using biofluids [6,7,8]. Moreover, FTIR-based metabolic analysis has been used to understand AD pathology, focusing on the study of Aβ structure and aggregation [14,15,16,17,18], including the evaluation of how aluminum [19] or oxidative stress [20,21] impact on this process.
Extracellular vesicles (EVs) are nanovesicles, ranging from 30 to 150 nm, secreted by all cell types and recognized as important mediators in cell-to-cell communication. These vesicles have an endocytic origin and present cargo comprising proteins, nucleic acids and lipids [22]. In AD, it has been reported that these EVs can carry Aβ, along with other proteins important in disease pathogenesis, such as tau, further supporting EVs involvement in disease pathogenesis [23].
Metabolomics has been applied to EVs derived from serum samples of AD cases [8,24] and brain tissue [25], but there is a need to explore further the alterations in the metabolic EVs profile relevant to AD. Neuronal cultures mimicking AD conditions represent an attractive model to address EVs role in the disease pathology. Since Aβ is a key player in AD, the aim of this work was to analyze the impact of Aβ on the metabolic profile of a neuronal-like cell line (N2a) and the respective derived EVs, by FTIR spectroscopy. This will shed light on Aβ induced metabolic alterations, and if these can be mediated by EVs, in the context of AD pathology.
2. Results and Discussion
2.1. EVs’ Isolation and Characterization
Previous to FTIR analysis, EVs were isolated from conditioned media of N2a. These cells were treated with or without Aβ, by ultracentrifugation and characterized by Transmission electron microscopy (TEM), Nanoparticle tracking analysis (NTA) and Western blot (WB), to evaluate the nature of EVs’ preparation. The size distribution curve obtained by NTA revealed that the isolated particles were within the expected exosome size range (Figure 1A), with a mode size of 127 nm. The TEM analysis allowed verifying that the isolated EVs exhibited the expected morphology and size (Figure 1B). Additionally, the presence of the EVs markers, Alix and Flotilin, and the absence of the negative cellular marker Calnexin, detected by WB, supported the conclusion that preparations were indeed enriched in EVs (Figure 1C).
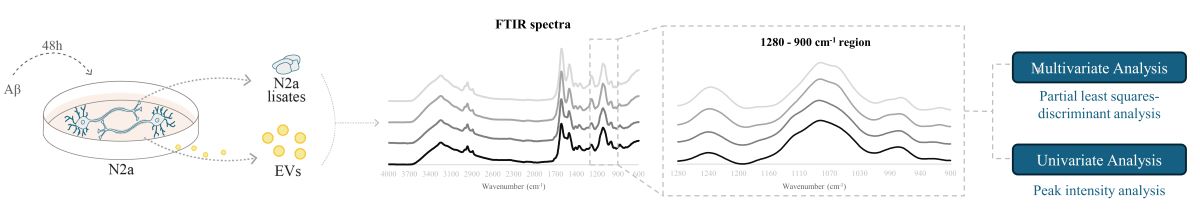
2.2. FTIR Spectra Overview Following Aβ Treatment
The Aβ induced effects on the spectroscopic profile of N2a and N2a-derived EVs following Aβ treatment were evaluated by FTIR analysis. The 4000-600 cm-1 spectra region of both cells and EVs was baseline-corrected, and area normalized (Figure 2). Overall, the spectra profiles of N2a and N2a-derived EVs were similar, even after Aβ treatment.
In the spectral sub-region between 3000-2800 cm-1, assignments to CH3 asymmetric and symmetric stretching could be found, reflecting mainly the lipids composition [26,27], with no obvious differences between control and Aβ-treated groups.
The spectra region associated with proteins is in the range of 1700-1500 cm-1, comprising two main bands: the amide I at 1640 cm-1 assigned to C═O and C─N stretching; and the amide II at 1535 cm-1 assigned to C─N stretching and C─N─H bending [26,27]. An additional small band can be found in this sub-region, between 1760-1730 cm-1 that is assigned to C═O stretching of the lipid molecules within fatty acids and glycerol, that can also be used to measure lipid peroxidation [28]. For this sub-region both peaks are more intense in the N2a-derived EVs than in the N2a lysates.
The 1280-900 cm-1 region, contain bands mainly associated with carbohydrates and nucleic acids, although few assignments related to proteins phosphorylation and phospholipids content can be proposed for some peaks in this region [26,27,29]. Since some differences can be observed between N2a and N2a-derived EVs spectra in these bands, and that previous work by the group showed that this region hold discrimination value between serum-derived EVs from Control and AD cases [8], this was the selected region for further analysis. After applying the second derivative to the 1280-900 cm-1 region, several peaks were identified, and the respective proposed assignments are presented in Table 1.
2.3. Multivariate Analysis of the 1280-900 cm-1 Region
To assess the overall alterations in the 1280-900 cm-1 spectroscopic region of N2a and N2a-derived EVs upon Aβ treatment, a PLS-DA analysis was performed. From the scores plots of the PLS-DA analysis for N2a cells (Figure 3A) and N2a-derived EVs (Figure 3C), it is possible to observe a good discrimination between groups, since the Aβ-treated samples are localized in the factor-1 positive region and the majority of control samples are in the factor-1 negative region. This clear discrimination between groups supports the metabolic alterations induced by Aβ in this AD-mimicking model, not only observed in N2a but also in the EVs secreted by these cells.
Indeed, both N2a and N2a-derived EVs presented moderate to strong correlation values of calibration (0.667 and 0.670 respectively), and similar cross validation coefficients (Table 2). This is in agreement with previous work applying FTIR to AD cases and Controls, where a moderate to strong correlation was observed for serum-derived EVs in the carbohydrates and nucleic acids FTIR spectra region [8].
β-coefficient plots allow identification of the peaks responsible for the discrimination and those that are more related to each condition clusters. Both Aβ-treated groups of N2a and N2a-derived EVs (Figure 3B and 3D respectively) are characterized by the peaks 1240 cm-1 (asymmetric stretching of phosphodiester of phosphorylated proteins, phospholipids and nucleic acids), 1170/1172 cm-1 (C─O stretching of proteins, carbohydrates and nucleic acids), 1085 cm-1 (symmetric stretching of phosphodiester of phosphorylated proteins, phospholipids, glycogen and nucleic acids), 969 cm-1 (mainly due to stretching of nucleic acids and phosphorylated proteins and C─C stretching of DNA), 923 cm-1 (DNA) and 915 cm-1 (ribose ring vibrations of nucleic acids). Furthermore, the peak 1121/1124 cm-1 (C─O stretching of carbohydrates and ribose in RNA) was associated with Aβ-treated N2a and the peak 1053/1056 cm-1 (C─O stretching of nucleic acids, phospholipids and carbohydrates) characterized EVs from Aβ-treated cells. Interestingly, an additional peak at 991 cm-1 (C─O and C─C stretching of RNA mainly but also DNA backbone) was associated with control EVs.
Therefore, the Aβ treatment altered the metabolic profile of N2a and N2a-derived EVs, evident in the 1280 – 900 cm-1 region, causing alterations on peaks that are mostly assigned to nucleic acids content, carbohydrates, but also phospholipids and phosphorylated proteins.
2.4. Peak Intensity Analysis
To better understand the specific spectroscopic alterations caused by Aβ, in the 1280-900 cm-1 region of N2a (Figure 4A) and N2a-derived EVs (Figure 5A), the intensity of peaks resulting from the second derivative spectra was quantified considering those also identified in the β-coefficient plot of PLS-DA analysis. The intensity of peak 1053 cm-1 in N2a second derivative spectra was not quantified due to a peak shift between samples of the same condition.
Significant decreases were found in the intensity of peaks 1240 cm-1 and 1085 cm-1 of N2a after Aβ treatment (Figure 4B), that are assigned to the asymmetric and symmetric stretching of phosphodiester (respectively) of phosphorylated proteins, phospholipids and nucleic acids. The decrease on these peaks intensities was also evident in N2a-derived EVs (Figure 5B). Indeed, peak 1085 cm-1 presented a greater decrease in N2a-derived EVs than in N2a. Since these peaks may reflect the phosphorylated proteins’ content [33,34,35], these results can suggest that Aβ can cause alterations in proteins phosphorylation, a key event in AD pathogenesis [36]. This is also consistent with the reported effects of Aβ peptide on the activity of kinases and phosphatases [37,38], potentially impacting the phosphorylation states of several proteins including tau [39]. Of relevance, phosphorylated tau species have been reported altered in blood-derived EVs of AD cases [40,41,42,43]. On the other hand, these peaks can also represent alterations in DNA/RNA phosphate backbone, indicating that Aβ treatment may impact the nucleic acids content.
For EVs it was possible to observe significant differences in four additional peaks than in N2a cells. Three peaks were significantly decreased, the 1056 cm-1, 969 cm-1 and 915 cm-1. These are mainly assigned to molecular vibrations of C─O, C─C and of nucleic acids, phospholipids, phosphorylated proteins and carbohydrates [44]. Interestingly, a significant increase was observed in the intensity of peak 991 cm-1 that is mostly related to stretching motions of nucleic acids ribose [44,45] but also of DNA backbone. This suggests that Aβ may impact neurons by altering the RNA and DNA content of EVs, potentially causing several alterations in recipient cells [46]. Indeed, nucleic acids cargo in EVs is altered in AD and the decrease in peak intensity associated with nucleic acids may be explained, e.g. by nucleic acids degradation as a consequence of oxidative stress in AD [47,48].
Taken together, the data presented reveal that Aβ had a bigger impact on N2a-derived EVs FTIR profile than on N2a, causing mainly a decrease in the intensity of peaks associated with phosphate groups present at nucleic acids, carbohydrates, phosphorylated proteins and phospholipids. This is consistent with previous work using human samples, in which a FTIR analysis of this spectra region revealed a better discrimination, in serum-derived EVs than in serum [8], between AD and control cases, supporting that this is a promising in vitro model to study AD related metabolic pathology.
3. Materials and Methods
3.1. Cell Culture
Neuro-2a mouse neuroblastoma cells (N2a) were maintained in Dulbecco's Modified Eagle Medium (DMEM) (Gibco 52100) supplemented with 10% fetal bovine serum (FBS) (Gibco 10270) and 1% of penicillin/ streptomycin mix (Biowest L0022). Cells were cultured at 37°C, in an incubator with 5% CO2 and 95% humidity. For Aβ experiments, N2a cells were seeded at a density of 1 x 10⁵ cells/cm2 in 6-well plates and treated with 10µM of Aβ25-35 (Genicbio A-2535), in FBS free medium, for 48 h. Three independent biological experiments were carried out.
3.2. EVs Isolation
Cells were treated as described and cell culture medium from ten 100 mm plates (density 1 x 10⁵ cells/cm2) per condition were collected for EVs isolation by ultracentrifugation. The conditioned medium was submitted to sequential low speed centrifugations of 300xg for 10 min, 2,000xg for 10 min and 10,000xg for 30 min at 4°C. Subsequentially, it was passed through a 0.2 µm filter and the supernatant was then ultracentrifuged at 100,000xg at 4°C for 2 h, using an Ultracentrifuge (Optima L-80K - Beckman) to isolate EVs. The resulting pellet was washed in PBS and ultracentrifuged again at 100,000xg at 4°C for 2 h. The final pellet containing EVs was resuspended in PBS.
3.3. Nanoparticle Tracking Analysis
EVs preparations were submitted to Nanoparticle tracking analysis (NTA) to determine EVs concentration and size distribution curves, using Nanosight NS300 (Malvern Instruments, Malvern). Samples were diluted to achieve ideal particle per frame value of 20–100 particles/frame. The analysis was performed in duplicate for each sample. For each measurement, five videos were captured at room temperature (RT) with a syringe speed of 40uL/s. Video analysis was performed with NTA software version 3.2 using a detection threshold of 5. Particle concentration was corrected by the dilution factor to determine the final concentration.
3.4. Transmission Electron Microscopy
For transmission electron microscopy (TEM) analysis, EVs preparations randomly selected were fixed with 2% Paraformaldehyde and left to adsorb in 75 mesh Formvar/carbon grids. A 3% phosphotungstic acid solution was added, as a negative staining. TEM images were obtained using a Hitachi H-9000 transmission electron microscope at 300 kV and images were captured using a slow-scan CCD camera.
3.5. Western Blot Analysis
Prior to immunodetection of EV markers by western blot (WB), the EVs preparations in PBS were lysed by mixing with an equal volume of RIPA buffer, with phosphatase and protease inhibitors. Protein concentration was determined by BCA protein assay, 50 µg of total protein was separated using a 5% to 20% gradient SDS-PAGE gel and electrophoretically transferred onto a nitrocellulose membrane. The nitrocellulose membranes were blocked in 5% non-fat dry milk and further incubated with the primary antibodies: anti-Alix (1:500) (sc-53538); anti-Flotillin (1:500) (sc-74566); anti-Calnexin (1:1000) (ADI-SPA-860). Then membranes were incubated with the HRP-conjugated secondary antibodies anti-mouse (7076S) or anti-rabbit (7074S) (Cell Signaling Technology). Protein bands were detected using the chemiluminescence reagent ECL Select (GE Healthcare Life Sciences) and images obtained with the ChemiDoc™ gel imaging system (Bio-Rad).
3.6. FTIR Samples Preparation and Spectra Acquisition
For the preparation of N2a samples for FTIR analysis, following treatments, cells were counted in a hemocytometer, using Trypan Blue, and aliquots with 1x10⁵ cells were centrifuged at 300xg for 3 min at RT. The cells pellets were frozen at -30°C until FTIR analysis.
FTIR spectra was acquired using an Attenuated Total Reflectance (ATR)-FTIR Bruker Alpha Platinum spectrometer (Bruker), coupled to OPUS software (Bruker). Cell pellets were resuspended in PBS and 5µL of cells or EVs suspension were placed at the center of ATR diamond and air dried. Three independent biological experiments were carried out and, for each sample, three technical replicates were acquired. Between samples, the ATR crystal was cleaned with 70% ethanol, distilled water and a background spectrum was acquired against air. Spectra were acquired in the region of 4000-600 cm–1, with a resolution of 8 cm–1 and 64 co-added scans. RT and humidity were maintained constant, during acquisition, at 23°C and 35%, respectively.
3.7. FTIR Spectra Pre-Processing and Multivariate Analysis
FTIR spectra were exported in OPUS format and analyzed using the Unscrambler X software (V.10.4., Camo Analytics).
From the initial spectra, the 1280-900 cm-1 region was baseline corrected and area normalized. Further, second derivative with Savitzky-Golay algorithm with 3 smoothing points was applied so that the spectra bands would be deconvoluted to obtain more detailed information. After pre-processing, the spectra were subjected to multivariate supervised approach partial least squares-discriminant analysis (PLS-DA).
3.8. FTIR Spectra Peak Intensities Analysis
To calculate the intensity of the spectral bands, the second derivative spectra was inverted by factoring by -1 [49]. Then the intensity of peaks assigned to 1240 cm-1, 1170 cm-1, 1121 cm-1, 1085 cm-1, 969 cm-1 and 903 cm-1 for cells samples and 1240 cm-1, 1172 cm-1, 1121 cm-1, 1102 cm-1, 1085 cm-1, 1056 cm-1, 991 cm-1, 969 cm-1, 915 cm-1 for EVs samples were extracted.
To compare peak intensities, data distribution was assessed, and non-parametric Mann-Whitney test was applied using GraphPad Prism 8.0.2 software (GraphPad Software). The results were expressed as mean ± standard deviation and were considered statistically significant when p < 0.05.
4. Conclusions
In sum, this FTIR spectroscopy study allowed investigating the influence of Aβ treatment on the metabolic profiles of a neuronal cell model and the released EVs. Aβ treatment induced alterations in the 1280-900 cm-1 region of FTIR spectra. N2a-derived EVs mainly showed significant alterations in peak intensities mainly associated with nucleic acids content, although it cannot be excluded that other functional groups such as carbohydrates and proteins can also contribute to these peaks. This effect may represent a mechanism by which Aβ can impact neurons and likely affect these and/or other EVs recipient cells. Elucidating the functional significance of the altered EV cargo may uncover novel pathways by which AD pathology spreads between brain cells and could potentially contribute to advancements in AD diagnosis and treatment.
Author Contributions
Conceptualization, M.V. and A.G.H.; methodology, M.V., T.S.M., K.L., A.N. and A.G.H.; investigation M.V., T.S.M. and A.G.H.; data curation, M.V. and A.G.H.; writing—original draft preparation, M.V., A.N. and A.G.H.; writing—review and editing, M.V., T.S.M., K.L., L.P.A., O.C.S., A.N. and A.G.H.; supervision, A.G.H.; funding acquisition, A.G.H. All authors have read and agreed to the published version of the manuscript.
Data Availability Statement
The original contributions presented in the study are included in the article, further inquiries can be directed to the corresponding author.
Acknowledgments
This research was supported by - Fundação para a Ciência e Tecnologia, I.P. by project reference UIDB/04501/2020 and DOI identifier https://doi.org/10.54499/UIDB/04501/2020 and project reference UIDP/04501/2020 and DOI identifier https://doi.org/10.54499/UIDP/04501/2020. MV is supported by the FCT through the individual PhD grant (UI/BD/151354/2021; and DOI identifier https://doi.org/10.54499/UI/BD/151354/2021).
Conflicts of Interest
The authors declare no conflicts of interest.
References
- Global Status Report on the Public Health Response to Dementia.; Geneva. 2021.
- Blennow, K.; de Leon, M.J.; Zetterberg, H. Alzheimer’s Disease. Lancet 2006, 368, 387–403. [Google Scholar] [CrossRef]
- Hampel, H.; Hardy, J.; Blennow, K.; Chen, C.; Perry, G.; Kim, S.H.; Villemagne, V.L.; Aisen, P.; Vendruscolo, M.; Iwatsubo, T.; et al. The Amyloid-β Pathway in Alzheimer’s Disease. Molecular Psychiatry 2021, 26, 5481–5503. [Google Scholar] [CrossRef] [PubMed]
- Guo, T.; Zhang, D.; Zeng, Y.; Huang, T.Y.; Xu, H.; Zhao, Y. Molecular and Cellular Mechanisms Underlying the Pathogenesis of Alzheimer’s Disease. Molecular Neurodegeneration 2020, 15, 1–37. [Google Scholar] [CrossRef]
- Li, S.; Selkoe, D.J. A Mechanistic Hypothesis for the Impairment of Synaptic Plasticity by Soluble Aβ Oligomers from Alzheimer’s Brain. Journal of Neurochemistry 2020, 154, 583–597. [Google Scholar] [CrossRef] [PubMed]
- Correia, M.; Lopes, J.; Silva, R.; Rosa, I.M.; Henriques, A.G.; Delgadillo, I.; Silva, O.A.B.D.C.E.; Nunes, A. FTIR Spectroscopy - A Potential Tool to Identify Metabolic Changes in Dementia Patients. Alzheimer’s & Neurodegenerative Diseases 2016, 2, 1–9. [Google Scholar] [CrossRef]
- Depciuch, J.; Zawlik, I.; Skrzypa, M.; Pajak, J.; Potocka, N.; Łach, K.; Bartosik-Psujek, H.; Koziorowska, A.; Kaznowska, E.; Cebulski, J. FTIR Spectroscopy of Cerebrospinal Fluid Reveals Variations in the Lipid: Protein Ratio at Different Stages of Alzheimer’s Disease. Journal of Alzheimer’s Disease 2019, 68, 281–293. [Google Scholar] [CrossRef]
- Soares Martins, T.; Magalhães, S.; Rosa, I.M.; Vogelgsang, J.; Wiltfang, J.; Delgadillo, I.; Catita, J.; da Cruz e Silva, O.A.B.; Nunes, A.; Henriques, A.G. Potential of FTIR Spectroscopy Applied to Exosomes for Alzheimer’s Disease Discrimination: A Pilot Study. Journal of Alzheimer’s Disease 2020, 74, 391–405. [Google Scholar] [CrossRef]
- Lopes, J.; Correia, M.; Martins, I.; Henriques, A.G.; Delgadillo, I.; Da Cruz, E.; Silva, O.; Nunes, A. FTIR and Raman Spectroscopy Applied to Dementia Diagnosis Through Analysis of Biological Fluids. Journal of Alzheimer’s Disease 2016, 52, 801–812. [Google Scholar] [CrossRef]
- Jones, R.R.; Hooper, D.C.; Zhang, L.; Wolverson, D.; Valev, V.K. Raman Techniques: Fundamentals and Frontiers. Nanoscale Research Letters 2019, 14. [Google Scholar] [CrossRef]
- Fang, S.; Wu, S.; Chen, Z.; He, C.; Lin, L.L.; Ye, J. Recent Progress and Applications of Raman Spectrum Denoising Algorithms in Chemical and Biological Analyses: A Review. TrAC - Trends in Analytical Chemistry 2024, 172, 117578. [Google Scholar] [CrossRef]
- Marion, D. An Introduction to Biological NMR Spectroscopy. Molecular and Cellular Proteomics 2013, 12, 3006–3025. [Google Scholar] [CrossRef] [PubMed]
- Kovermann, M.; Rogne, P.; Wolf-Watz, M. Protein Dynamics and Function from Solution State NMR Spectroscopy. Quarterly reviews of biophysics 2016, 49, e6. [Google Scholar] [CrossRef] [PubMed]
- Vosough, F.; Barth, A. Characterization of Homogeneous and Heterogeneous Amyloid-Β42 Oligomer Preparations with Biochemical Methods and Infrared Spectroscopy Reveals a Correlation between Infrared Spectrum and Oligomer Size. ACS Chemical Neuroscience 2021, 12, 473–488. [Google Scholar] [CrossRef]
- Álvarez-Marimon, E.; Castillo-Michel, H.; Reyes-Herrera, J.; Seira, J.; Aso, E.; Carmona, M.; Ferrer, I.; Cladera, J.; Benseny-Cases, N. Synchrotron X-Ray Fluorescence and FTIR Signatures for Amyloid Fibrillary and Nonfibrillary Plaques. ACS Chemical Neuroscience 2021, 12, 1961–1971. [Google Scholar] [CrossRef]
- Paulus, A.; Engdahl, A.; Yang, Y.; Boza-Serrano, A.; Bachiller, S.; Torres-Garcia, L.; Svanbergsson, A.; Garcia, M.G.; Gouras, G.K.; Li, J.Y.; et al. Amyloid Structural Changes Studied by Infrared Microspectroscopy in Bigenic Cellular Models of Alzheimer’s Disease. International Journal of Molecular Sciences 2021, 22. [Google Scholar] [CrossRef]
- Cerf, E.; Sarroukh, R.; Tamamizu-Kato, S.; Breydo, L.; Derclayes, S.; Dufrênes, Y.F.; Narayanaswami, V.; Goormaghtigh, E.; Ruysschaert, J.M.; Raussens, V. Antiparallel β-Sheet: A Signature Structure of the Oligomeric Amyloid β-Peptide. Biochemical Journal 2009, 421, 415–423. [Google Scholar] [CrossRef] [PubMed]
- Petty, S.A.; Decatur, S.M. Experimental Evidence for the Reorganization of β-Strands within Aggregates of the Aβ(16−22) Peptide. Journal of the American Chemical Society 2005, 127, 13488–13489. [Google Scholar] [CrossRef]
- Mocanu, C.S.; Jureschi, M.; Drochioiu, G. Aluminium Binding to Modified Amyloid-β Peptides: Implications for Alzheimer’s Disease. Molecules 2020, 25, 4536. [Google Scholar] [CrossRef] [PubMed]
- Komatsu, H.; Liu, L.; Murray, I.V.J.; Axelsen, P.H. A Mechanistic Link between Oxidative Stress and Membrane Mediated Amyloidogenesis Revealed by Infrared Spectroscopy. Biochimica et Biophysica Acta - Biomembranes 2007, 1768, 1913–1922. [Google Scholar] [CrossRef]
- Koppaka, V.; Axelsen, P.H. Accelerated Accumulation of Amyloid β Proteins on Oxidatively Damaged Lipid Membranes. Biochemistry 2000, 39, 10011–10016. [Google Scholar] [CrossRef]
- Gurung, S.; Perocheau, D.; Touramanidou, L.; Baruteau, J. The Exosome Journey: From Biogenesis to Uptake and Intracellular Signalling. Cell Communication and Signaling 2021, 19, 1–19. [Google Scholar] [CrossRef] [PubMed]
- Vaz, M.; Soares Martins, T.; Henriques, A.G. Extracellular Vesicles in the Study of Alzheimer’s and Parkinson’s Diseases: Methodologies Applied from Cells to Biofluids. Journal of Neurochemistry 2022, 163, 266–309. [Google Scholar] [CrossRef] [PubMed]
- Nielsen, J.E.; Maltesen, R.G.; Havelund, J.F.; Færgeman, N.J.; Gotfredsen, C.H.; Vestergård, K.; Kristensen, S.R.; Pedersen, S. Characterising Alzheimer’s Disease through Integrative NMR- and LC-MS-Based Metabolomics. Metabolism Open 2021, 12, 100125. [Google Scholar] [CrossRef] [PubMed]
- Su, H.; Rustam, Y.H.; Masters, C.L.; Makalic, E.; McLean, C.A.; Hill, A.F.; Barnham, K.J.; Reid, G.E.; Vella, L.J. Characterization of Brain-Derived Extracellular Vesicle Lipids in Alzheimer’s Disease. Journal of Extracellular Vesicles 2021, 10. [Google Scholar] [CrossRef]
- Ricciardi, V.; Portaccio, M.; Piccolella, S.; Manti, L.; Pacifico, S.; Lepore, M. Study of SH-SY5Y Cancer Cell Response to Treatment with Polyphenol Extracts Using FT-IR Spectroscopy. Biosensors 2017, 7, 1–16. [Google Scholar] [CrossRef]
- Magalhães, S.; Goodfellow, B.J.; Nunes, A. FTIR Spectroscopy in Biomedical Research: How to Get the Most out of Its Potential. Applied Spectroscopy Reviews 2021, 56, 869–907. [Google Scholar] [CrossRef]
- Oleszko, A.; Olsztyńska-Janus, S.; Walski, T.; Grzeszczuk-Kuć, K.; Bujok, J.; Gałecka, K.; Czerski, A.; Witkiewicz, W.; Komorowska, M. Application of FTIR-ATR Spectroscopy to Determine the Extent of Lipid Peroxidation in Plasma during Haemodialysis. BioMed Research International 2015, 2015, 1–9. [Google Scholar] [CrossRef]
- Mateus, T.; Almeida, I.; Costa, A.; Viegas, D.; Magalhães, S.; Martins, F.; Herdeiro, M.T.; da Cruz e Silva, O.A.B.; Fraga, C.; Alves, I.; et al. Fourier-Transform Infrared Spectroscopy as a Discriminatory Tool for Myotonic Dystrophy Type 1 Metabolism: A Pilot Study. International Journal of Environmental Research and Public Health 2021, 18. [Google Scholar] [CrossRef] [PubMed]
- Talari, A.C.S.; Martinez, M.A.G.; Movasaghi, Z.; Rehman, S.; Rehman, I.U. Advances in Fourier Transform Infrared (FTIR) Spectroscopy of Biological Tissues. Applied Spectroscopy Reviews 2017, 52, 456–506. [Google Scholar] [CrossRef]
- Cao, J.; Ng, E.S.; Mcnaughton, D.; Stanley, E.G.; Elefanty, A.G.; Tobin, M.J.; Heraud, P. The Characterisation of Pluripotent and Multipotent Stem Cells Using Fourier Transform Infrared Microspectroscopy. International Journal of Molecular Sciences 2013, 14, 17453–17476. [Google Scholar] [CrossRef]
- Vazquez-Zapien, G.J.; Mata-Miranda, M.M.; Sanchez-Monroy, V.; Delgado-Macuil, R.J.; Perez-Ishiwara, D.G.; Rojas-Lopez, M. FTIR Spectroscopic and Molecular Analysis during Differentiation of Pluripotent Stem Cells to Pancreatic Cells. Stem Cells International 2016, 2016, 1–11. [Google Scholar] [CrossRef] [PubMed]
- Lee, S.Y.; Yoon, K.A.; Jang, S.H.; Ganbold, E.O.; Uuriintuya, D.; Shin, S.M.; Ryu, P.D.; Joo, S.W. Infrared Spectroscopy Characterization of Normal and Lung Cancer Cells Originated from Epithelium. Journal of Veterinary Science 2009, 10, 299–304. [Google Scholar] [CrossRef] [PubMed]
- Chen, L.; Holman, H.Y.N.; Hao, Z.; Bechtel, H.A.; Martin, M.C.; Wu, C.; Chu, S. Synchrotron Infrared Measurements of Protein Phosphorylation in Living Single PC12 Cells during Neuronal Differentiation. Analytical Chemistry 2012, 84, 4118–4125. [Google Scholar] [CrossRef]
- Meurens, M.; Wallon, J.; Tong, J.; Noël, H.; Haot, J. Breast Cancer Detection by Fourier Transform Infrared Spectrometry. Vibrational Spectroscopy 1996, 10, 341–346. [Google Scholar] [CrossRef]
- Oliveira, J.; Costa, M.; De Almeida, M.S.C.; da Cruz, E.; Silva, O.A.B.; Henriques, A.G. Protein Phosphorylation Is a Key Mechanism in Alzheimer’s Disease. Journal of Alzheimer’s Disease 2017, 58, 953–978. [Google Scholar] [CrossRef] [PubMed]
- Oliveira, J.M.; Henriques, A.G.; Martins, F.; Rebelo, S.; da Cruz, E.; Silva, O.A.B. Amyloid-β Modulates Both AβPP and Tau Phosphorylation. Journal of Alzheimer’s Disease 2015, 45, 495–507. [Google Scholar] [CrossRef]
- Vintém, A.P.B.; Henriques, A.G.; da Cruz e Silva, O.A.B.B.; da Cruz e Silva, E.F. PP1 Inhibition by Aβ Peptide as a Potential Pathological Mechanism in Alzheimer’s Disease. Neurotoxicology and Teratology 2009, 31, 85–88. [Google Scholar] [CrossRef]
- Henriques, A.G.; Müller, T.; Oliveira, J.M.; Cova, M.; da Cruz e Silva, C.B.; da Cruz e Silva, O.A.B. Altered Protein Phosphorylation as a Resource for Potential AD Biomarkers. Scientific Reports 2016, 6, 30319. [Google Scholar] [CrossRef]
- Jia, L.; Qiu, Q.; Zhang, H.; Chu, L.; Du, Y.; Zhang, J.; Zhou, C.; Liang, F.; Shi, S.; Wang, S.; et al. Concordance between the Assessment of Aβ42, T-Tau, and P-T181-Tau in Peripheral Blood Neuronal-Derived Exosomes and Cerebrospinal Fluid. Alzheimer’s and Dementia 2019, 15, 1071–1080. [Google Scholar] [CrossRef]
- Goetzl, E.J.; Mustapic, M.; Kapogiannis, D.; Eitan, E.; Lobach, I.V.; Goetzl, L.; Schwartz, J.B.; Miller, B.L. Cargo Proteins of Plasma Astrocyte-Derived Exosomes in Alzheimer’s Disease. FASEB Journal 2016, 30, 3853–3859. [Google Scholar] [CrossRef]
- Winston, C.N.; Goetzl, E.J.; Akers, J.C.; Carter, B.S.; Rockenstein, E.M.; Galasko, D.; Masliah, E.; Rissman, R.A. Prediction of Conversion from Mild Cognitive Impairment to Dementia with Neuronally Derived Blood Exosome Protein Profile. Alzheimer’s and Dementia: Diagnosis, Assessment and Disease Monitoring 2016, 3, 63–72. [Google Scholar] [CrossRef] [PubMed]
- Fiandaca, M.S.; Kapogiannis, D.; Mapstone, M.; Boxer, A.; Eitan, E.; Schwartz, J.B.; Abner, E.L.; Petersen, R.C.; Federoff, H.J.; Miller, B.L.; et al. Identification of Preclinical Alzheimer’s Disease by a Profile of Pathogenic Proteins in Neurally Derived Blood Exosomes: A Case-Control Study. Alzheimer’s & dementia : the journal of the Alzheimer’s Association 2015, 11, 600–7.e1. [Google Scholar] [CrossRef]
- Colagar, A.H.; Chaichi, M.J.; Khadjvand, T. Fourier Transform Infrared Microspectroscopy as a Diagnostic Tool for Distinguishing between Normal and Malignant Human Gastric Tissue. Journal of Biosciences 2011, 36, 669–677. [Google Scholar] [CrossRef] [PubMed]
- Zucchiatti, P.; Mitri, E.; Kenig, S.; Bille, F.; Kourousias, G.; Bedolla, D.E.; Vaccari, L. Contribution of Ribonucleic Acid (RNA) to the Fourier Transform Infrared (FTIR) Spectrum of Eukaryotic Cells. Analytical Chemistry 2016, 88, 12090–12098. [Google Scholar] [CrossRef] [PubMed]
- O’Brien, K.; Breyne, K.; Ughetto, S.; Laurent, L.C.; Breakefield, X.O. RNA Delivery by Extracellular Vesicles in Mammalian Cells and Its Applications. Nature Reviews Molecular Cell Biology 2020, 21, 585–606. [Google Scholar] [CrossRef] [PubMed]
- Soares Martins, T.; Trindade, D.; Vaz, M.; Campelo, I.; Almeida, M.; Trigo, G.; da Cruz e Silva, O.A.B.; Henriques, A.G. Diagnostic and Therapeutic Potential of Exosomes in Alzheimer’s Disease. Journal of Neurochemistry 2020, 1–20. [Google Scholar] [CrossRef]
- Bradley-Whitman, M.A.; Timmons, M.D.; Beckett, T.L.; Murphy, M.P.; Lynn, B.C.; Lovell, M.A. Nucleic Acid Oxidation: An Early Feature of Alzheimer’s Disease. Journal of neurochemistry 2014, 128, 294–304. [Google Scholar] [CrossRef]
- Yang, H.; Yang, S.; Kong, J.; Dong, A.; Yu, S. Obtaining Information about Protein Secondary Structures in Aqueous Solution Using Fourier Transform IR Spectroscopy. Nature Protocols 2015, 10, 382–396. [Google Scholar] [CrossRef]
Figure 1.
Characterization of N2a-derived EVs. (A) Size distribution curves of EVs obtained by NTA. (B) Representative TEM image of the isolated EVs. (C) EVs markers (Alix and Flotilin) and negative marker (Calnexin) detected by WB.
Figure 1.
Characterization of N2a-derived EVs. (A) Size distribution curves of EVs obtained by NTA. (B) Representative TEM image of the isolated EVs. (C) EVs markers (Alix and Flotilin) and negative marker (Calnexin) detected by WB.
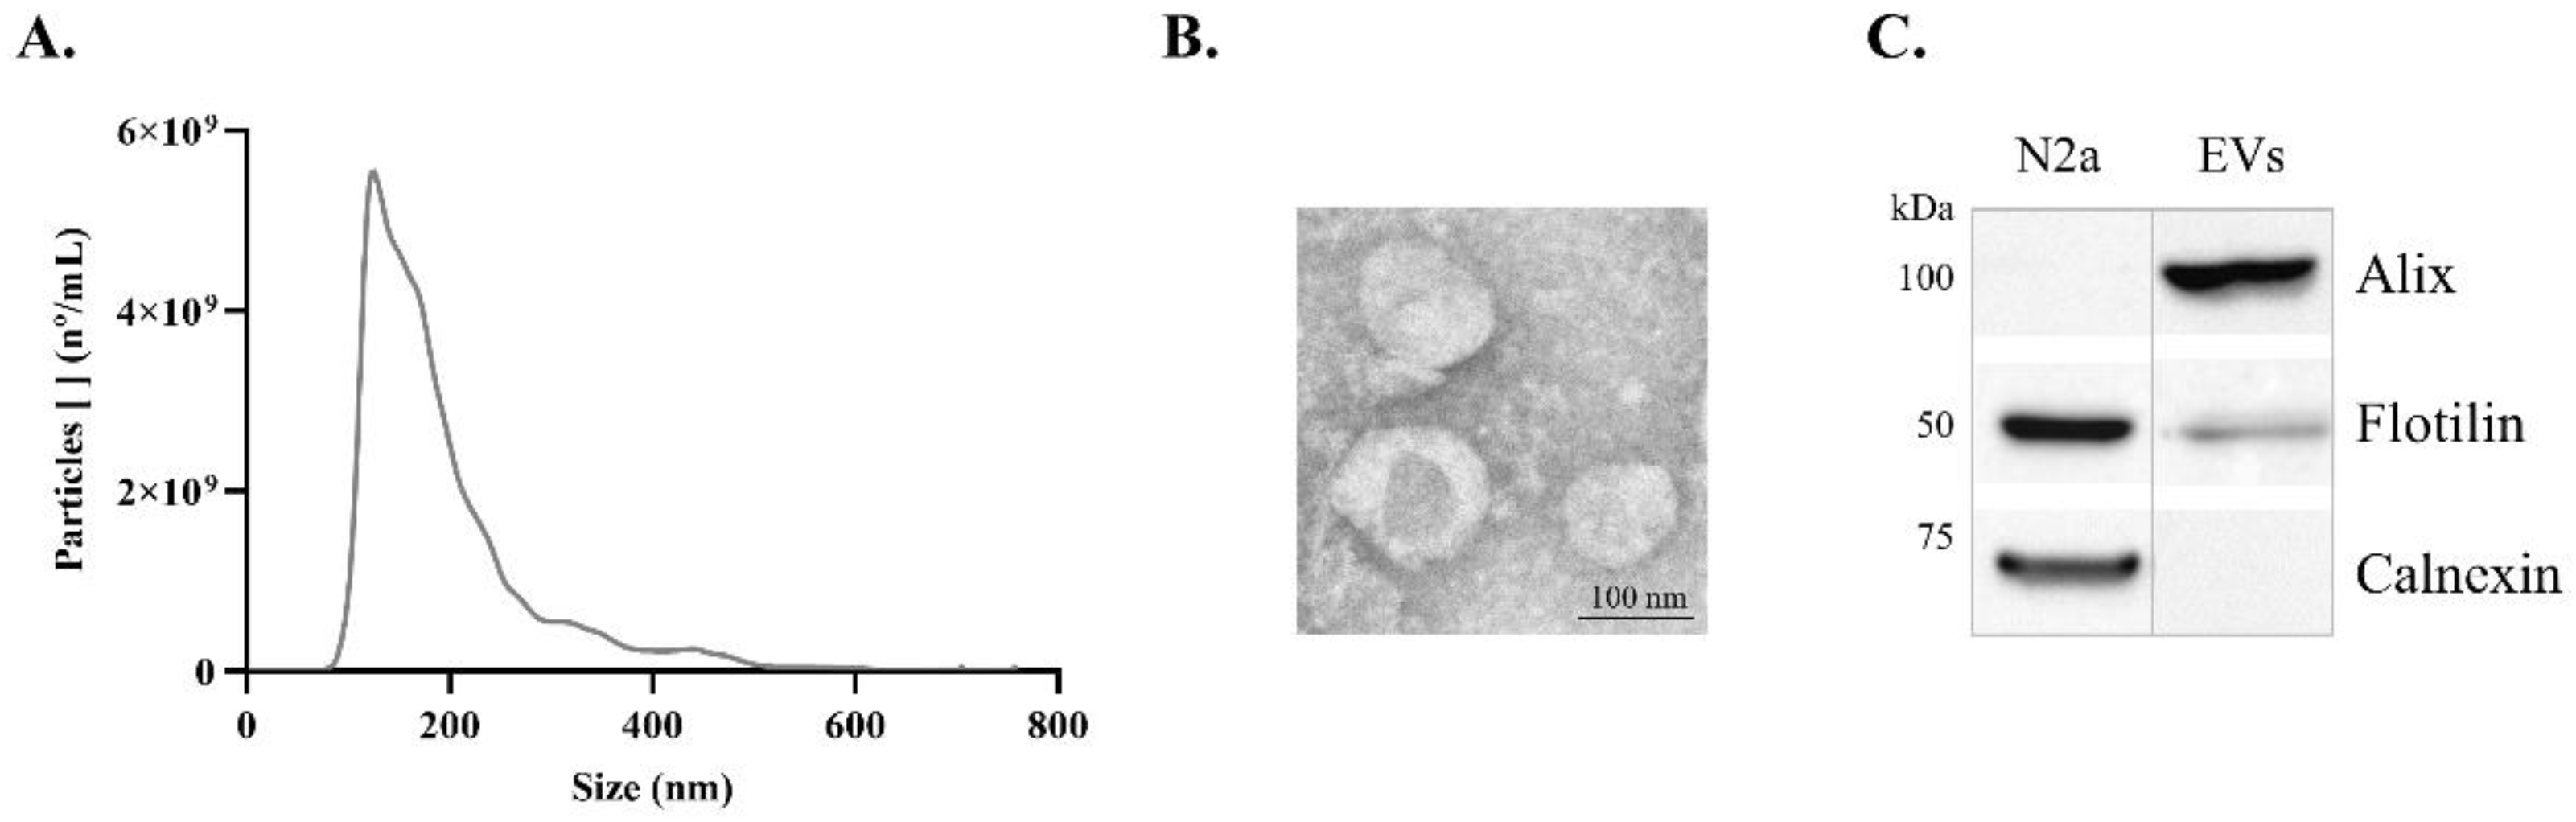
Figure 2.
N2a and N2a-derived EVs FTIR spectra. Average pre-processed FTIR spectra of the 4000-600 cm-1 region from N2a and N2a-derived EVs. The FTIR spectra of the 1280-900 cm-1 region and the respective second derivative are highlighted.
Figure 2.
N2a and N2a-derived EVs FTIR spectra. Average pre-processed FTIR spectra of the 4000-600 cm-1 region from N2a and N2a-derived EVs. The FTIR spectra of the 1280-900 cm-1 region and the respective second derivative are highlighted.
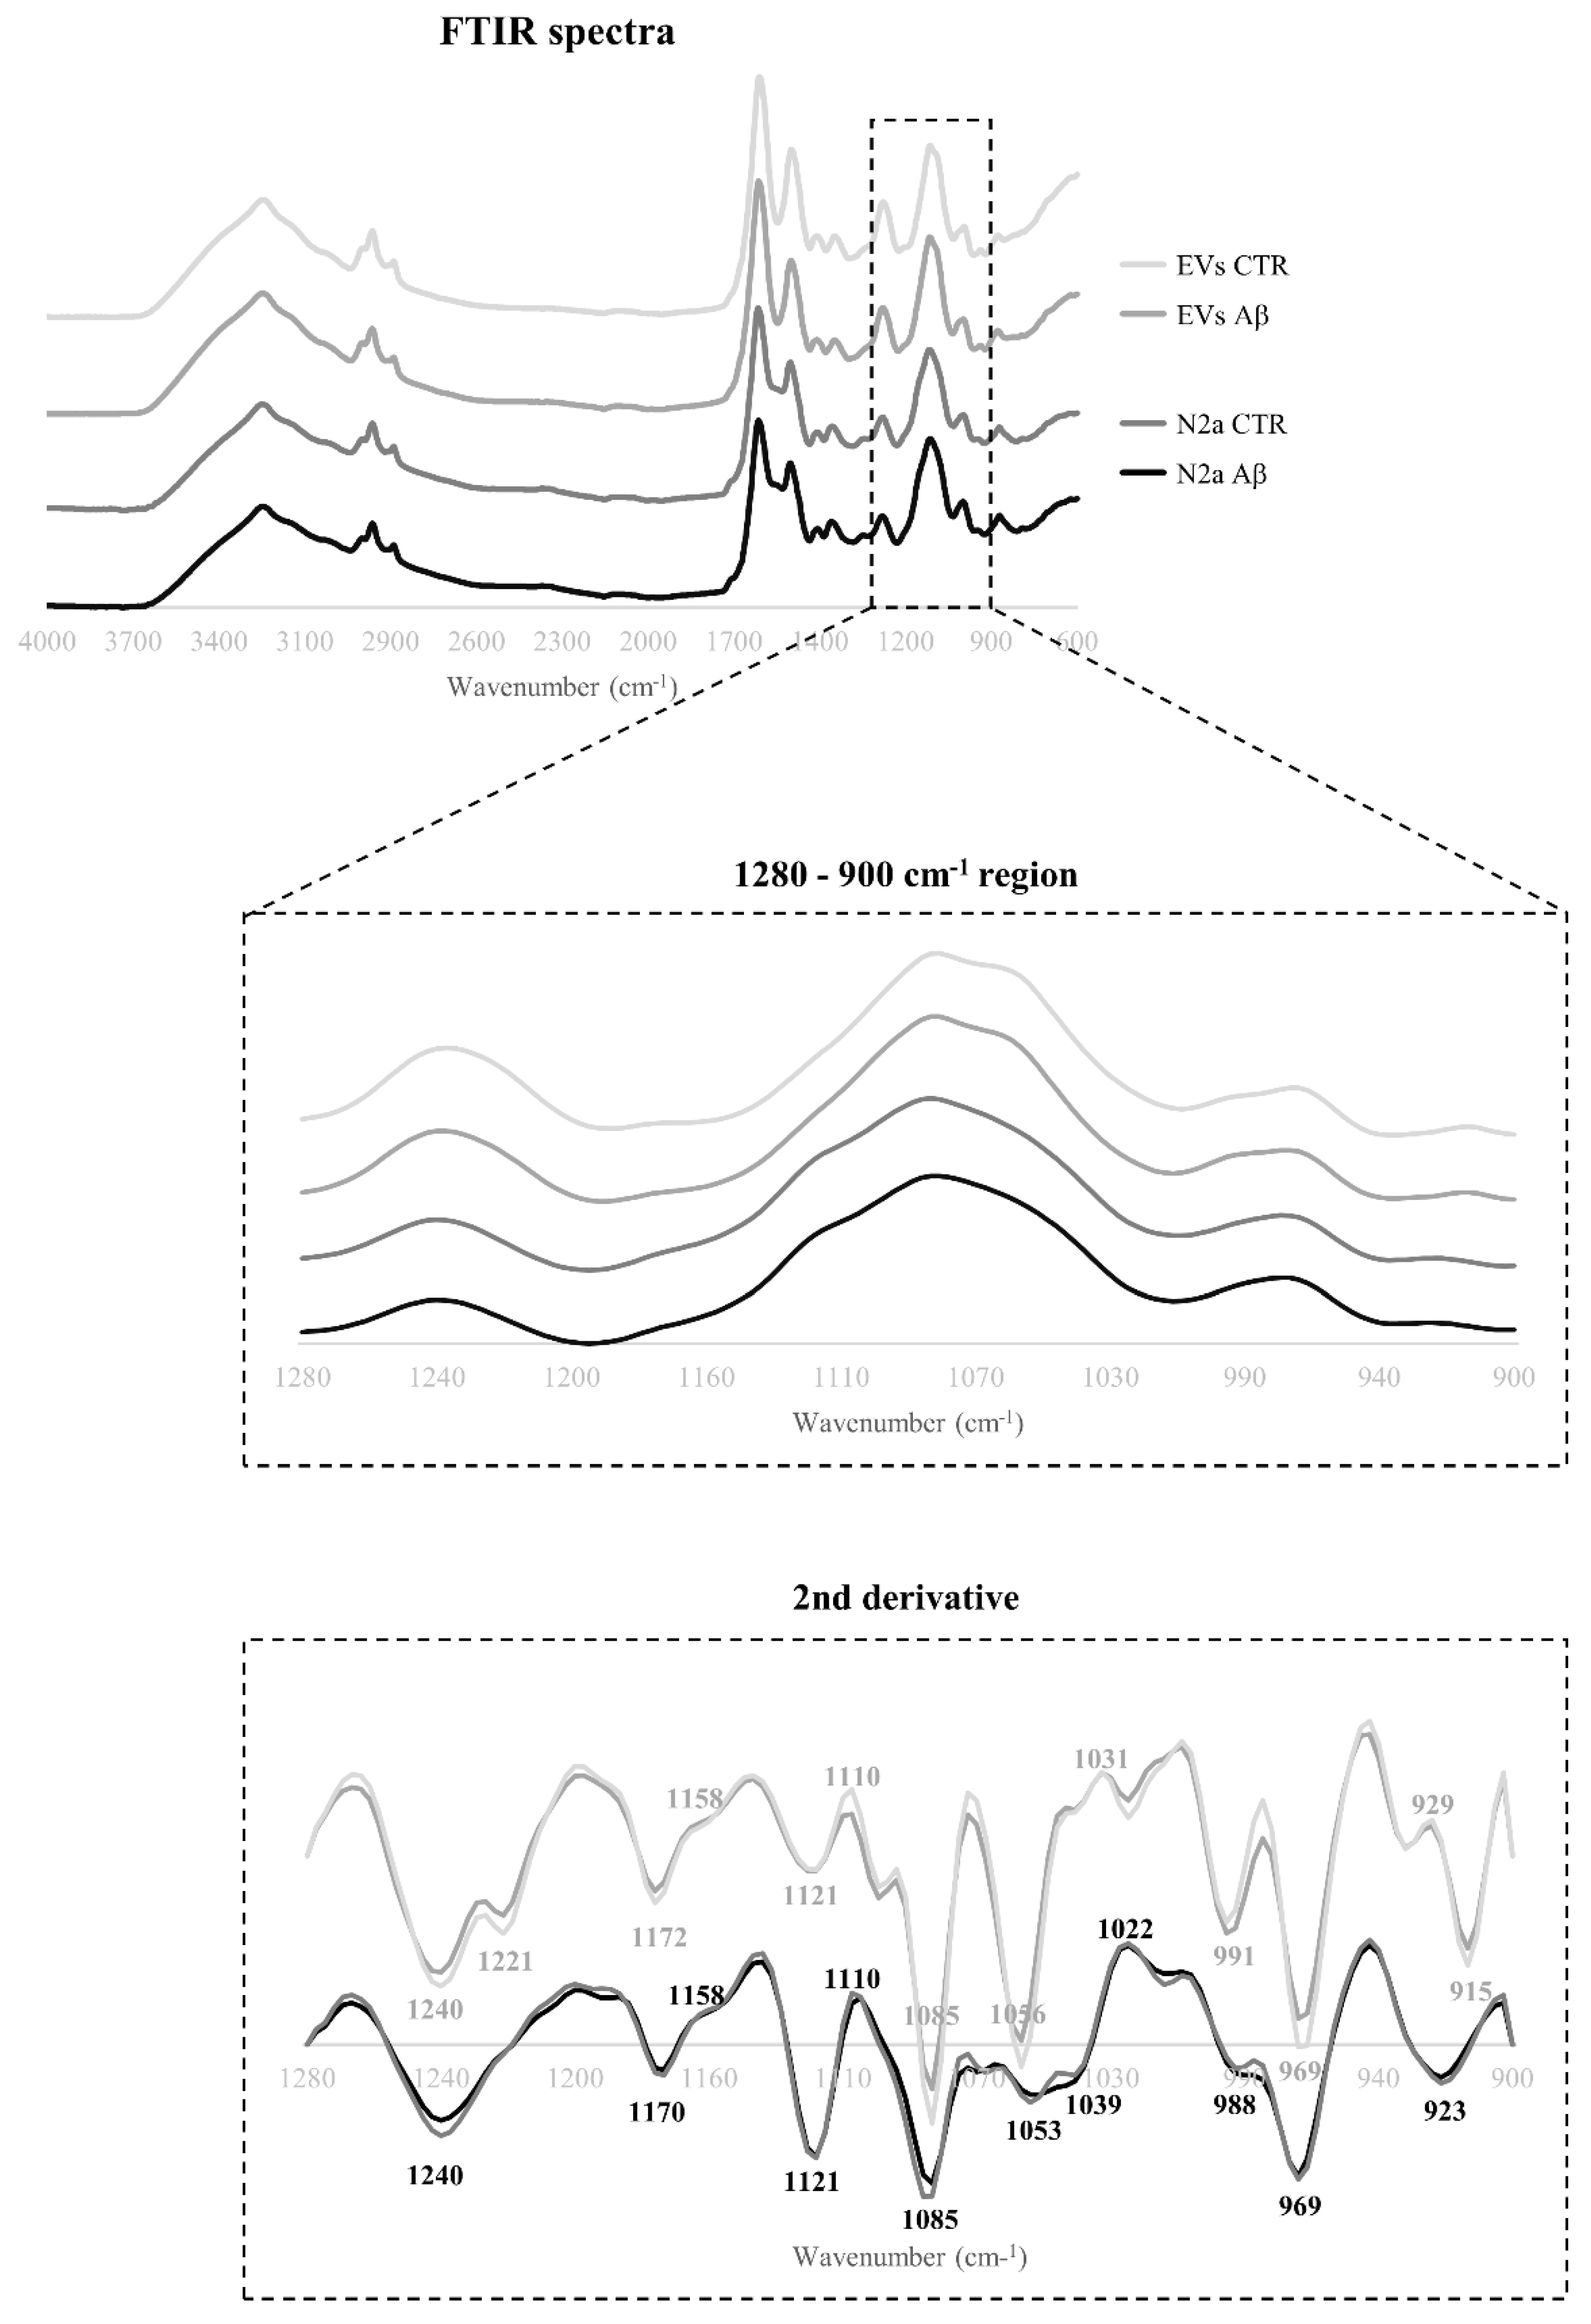
Figure 3.
PLS-DA analysis of the 1280-900 cm-1 region of FTIR spectra. (A) PLS scores plots and (B) respective β-coefficients plots of factor 1 for N2a. (C) PLS scores plots and (D) respective β-coefficients plots of factor 1 for N2a-derived EVs.
Figure 3.
PLS-DA analysis of the 1280-900 cm-1 region of FTIR spectra. (A) PLS scores plots and (B) respective β-coefficients plots of factor 1 for N2a. (C) PLS scores plots and (D) respective β-coefficients plots of factor 1 for N2a-derived EVs.
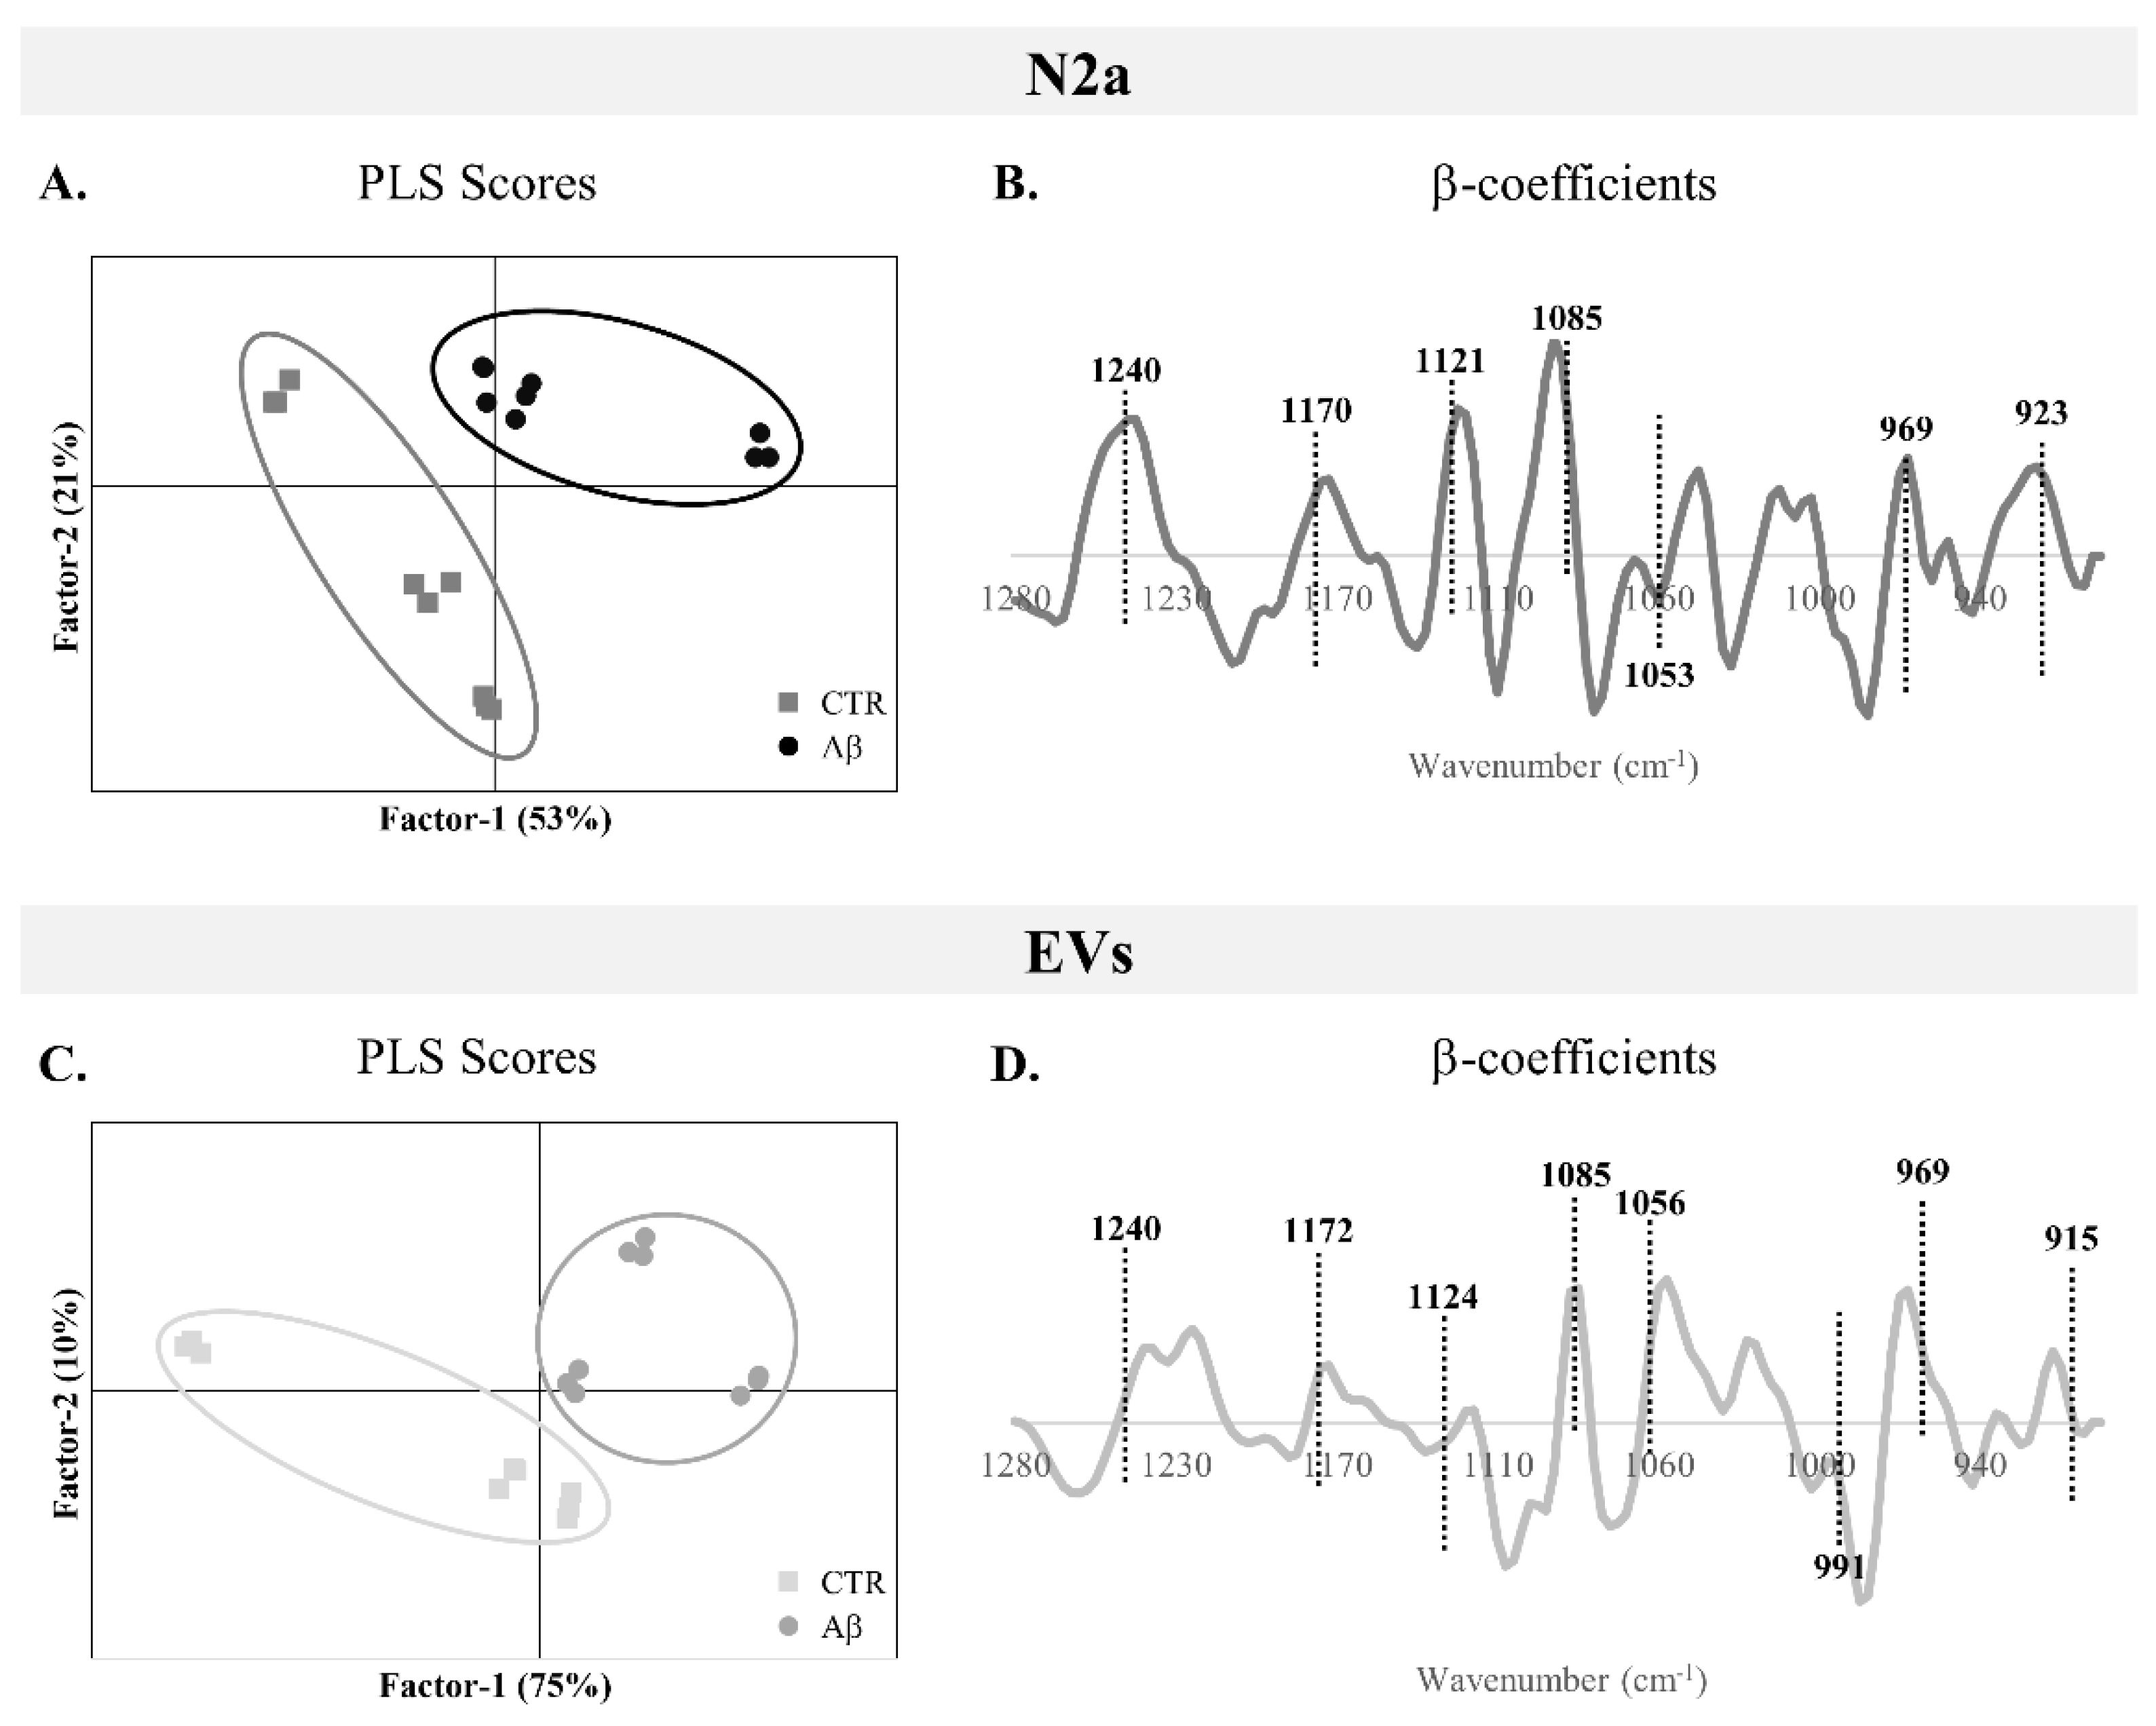
Figure 4.
Analysis of peaks’ intensity in the 1280-900 cm-1 region of N2a FTIR spectra. (A) Mean second derivative spectra of N2a. (B) Peak intensity analysis of N2a spectra. Abbreviations: A.U., arbitrary units. **p <0.01.
Figure 4.
Analysis of peaks’ intensity in the 1280-900 cm-1 region of N2a FTIR spectra. (A) Mean second derivative spectra of N2a. (B) Peak intensity analysis of N2a spectra. Abbreviations: A.U., arbitrary units. **p <0.01.
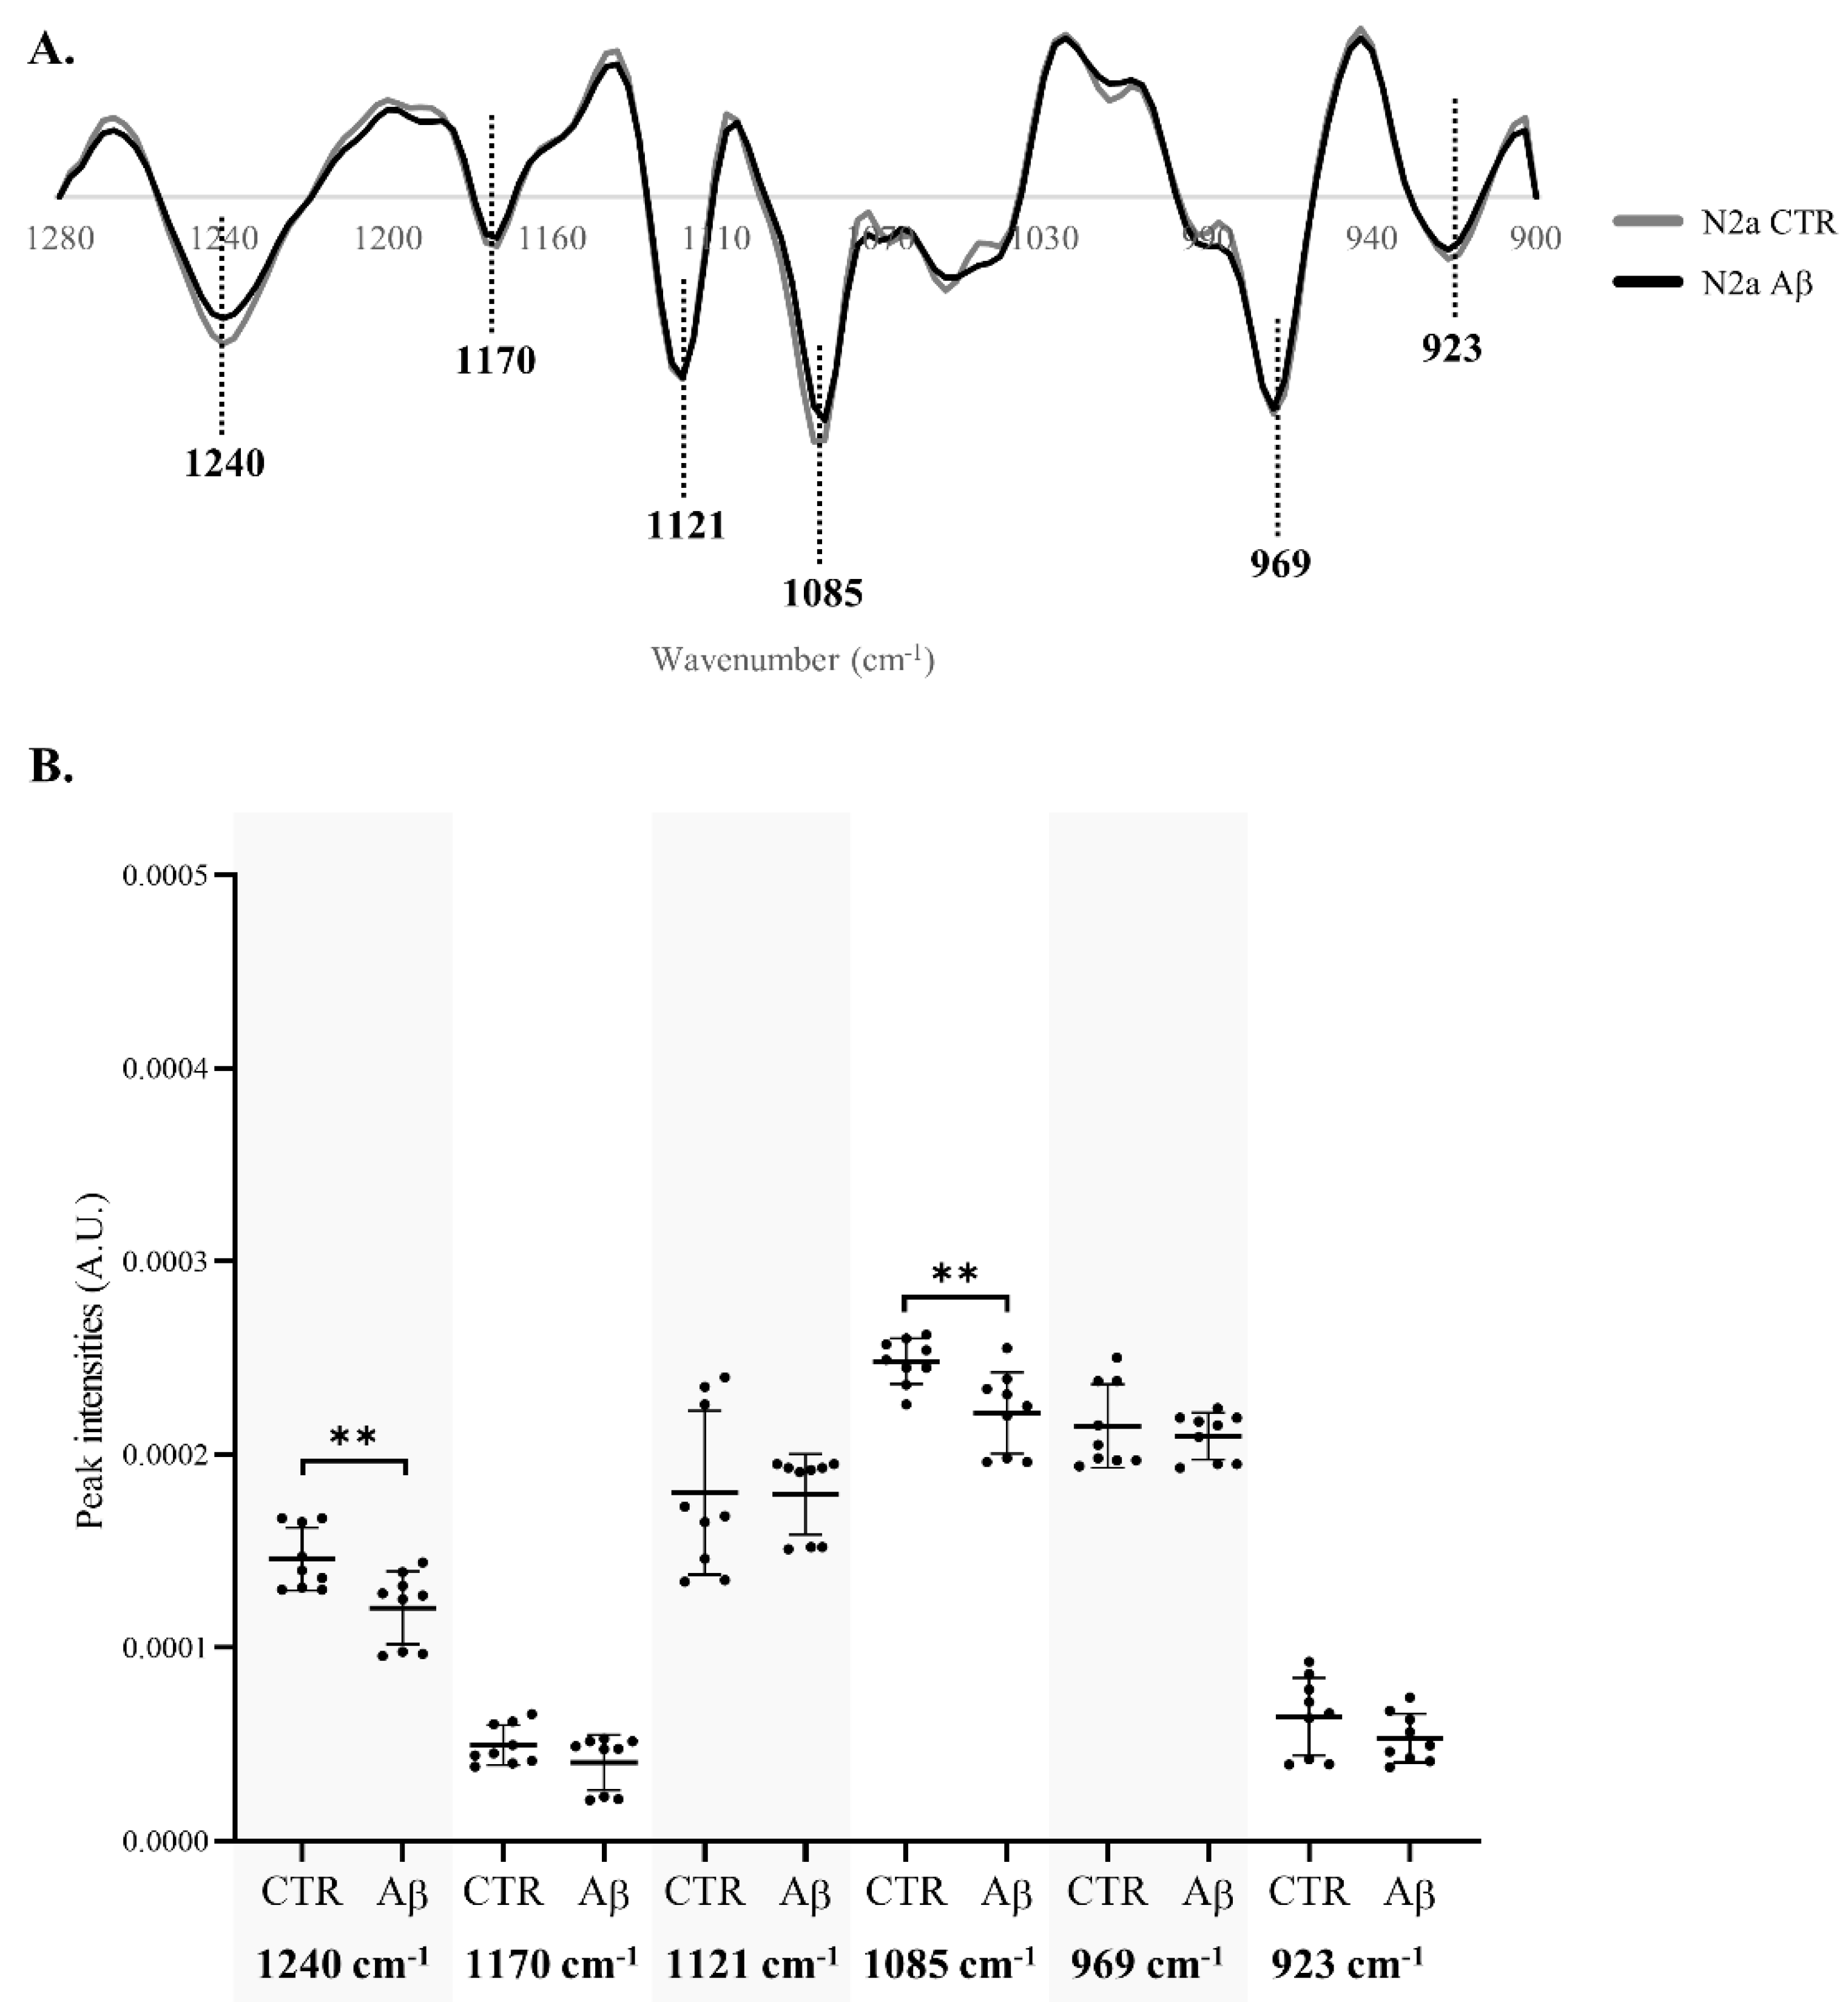
Figure 5.
Analysis of peaks’ intensity in the 1280-900 cm-1 region of N2a-derived EVs. (A) Mean second derivative spectra of N2a-derived EVs. (B) Peak intensity analysis of N2a-derived EVs. Abbreviations: A.U., arbitrary units. **p <0.01***, p <0.001; ****p <0.0001.
Figure 5.
Analysis of peaks’ intensity in the 1280-900 cm-1 region of N2a-derived EVs. (A) Mean second derivative spectra of N2a-derived EVs. (B) Peak intensity analysis of N2a-derived EVs. Abbreviations: A.U., arbitrary units. **p <0.01***, p <0.001; ****p <0.0001.
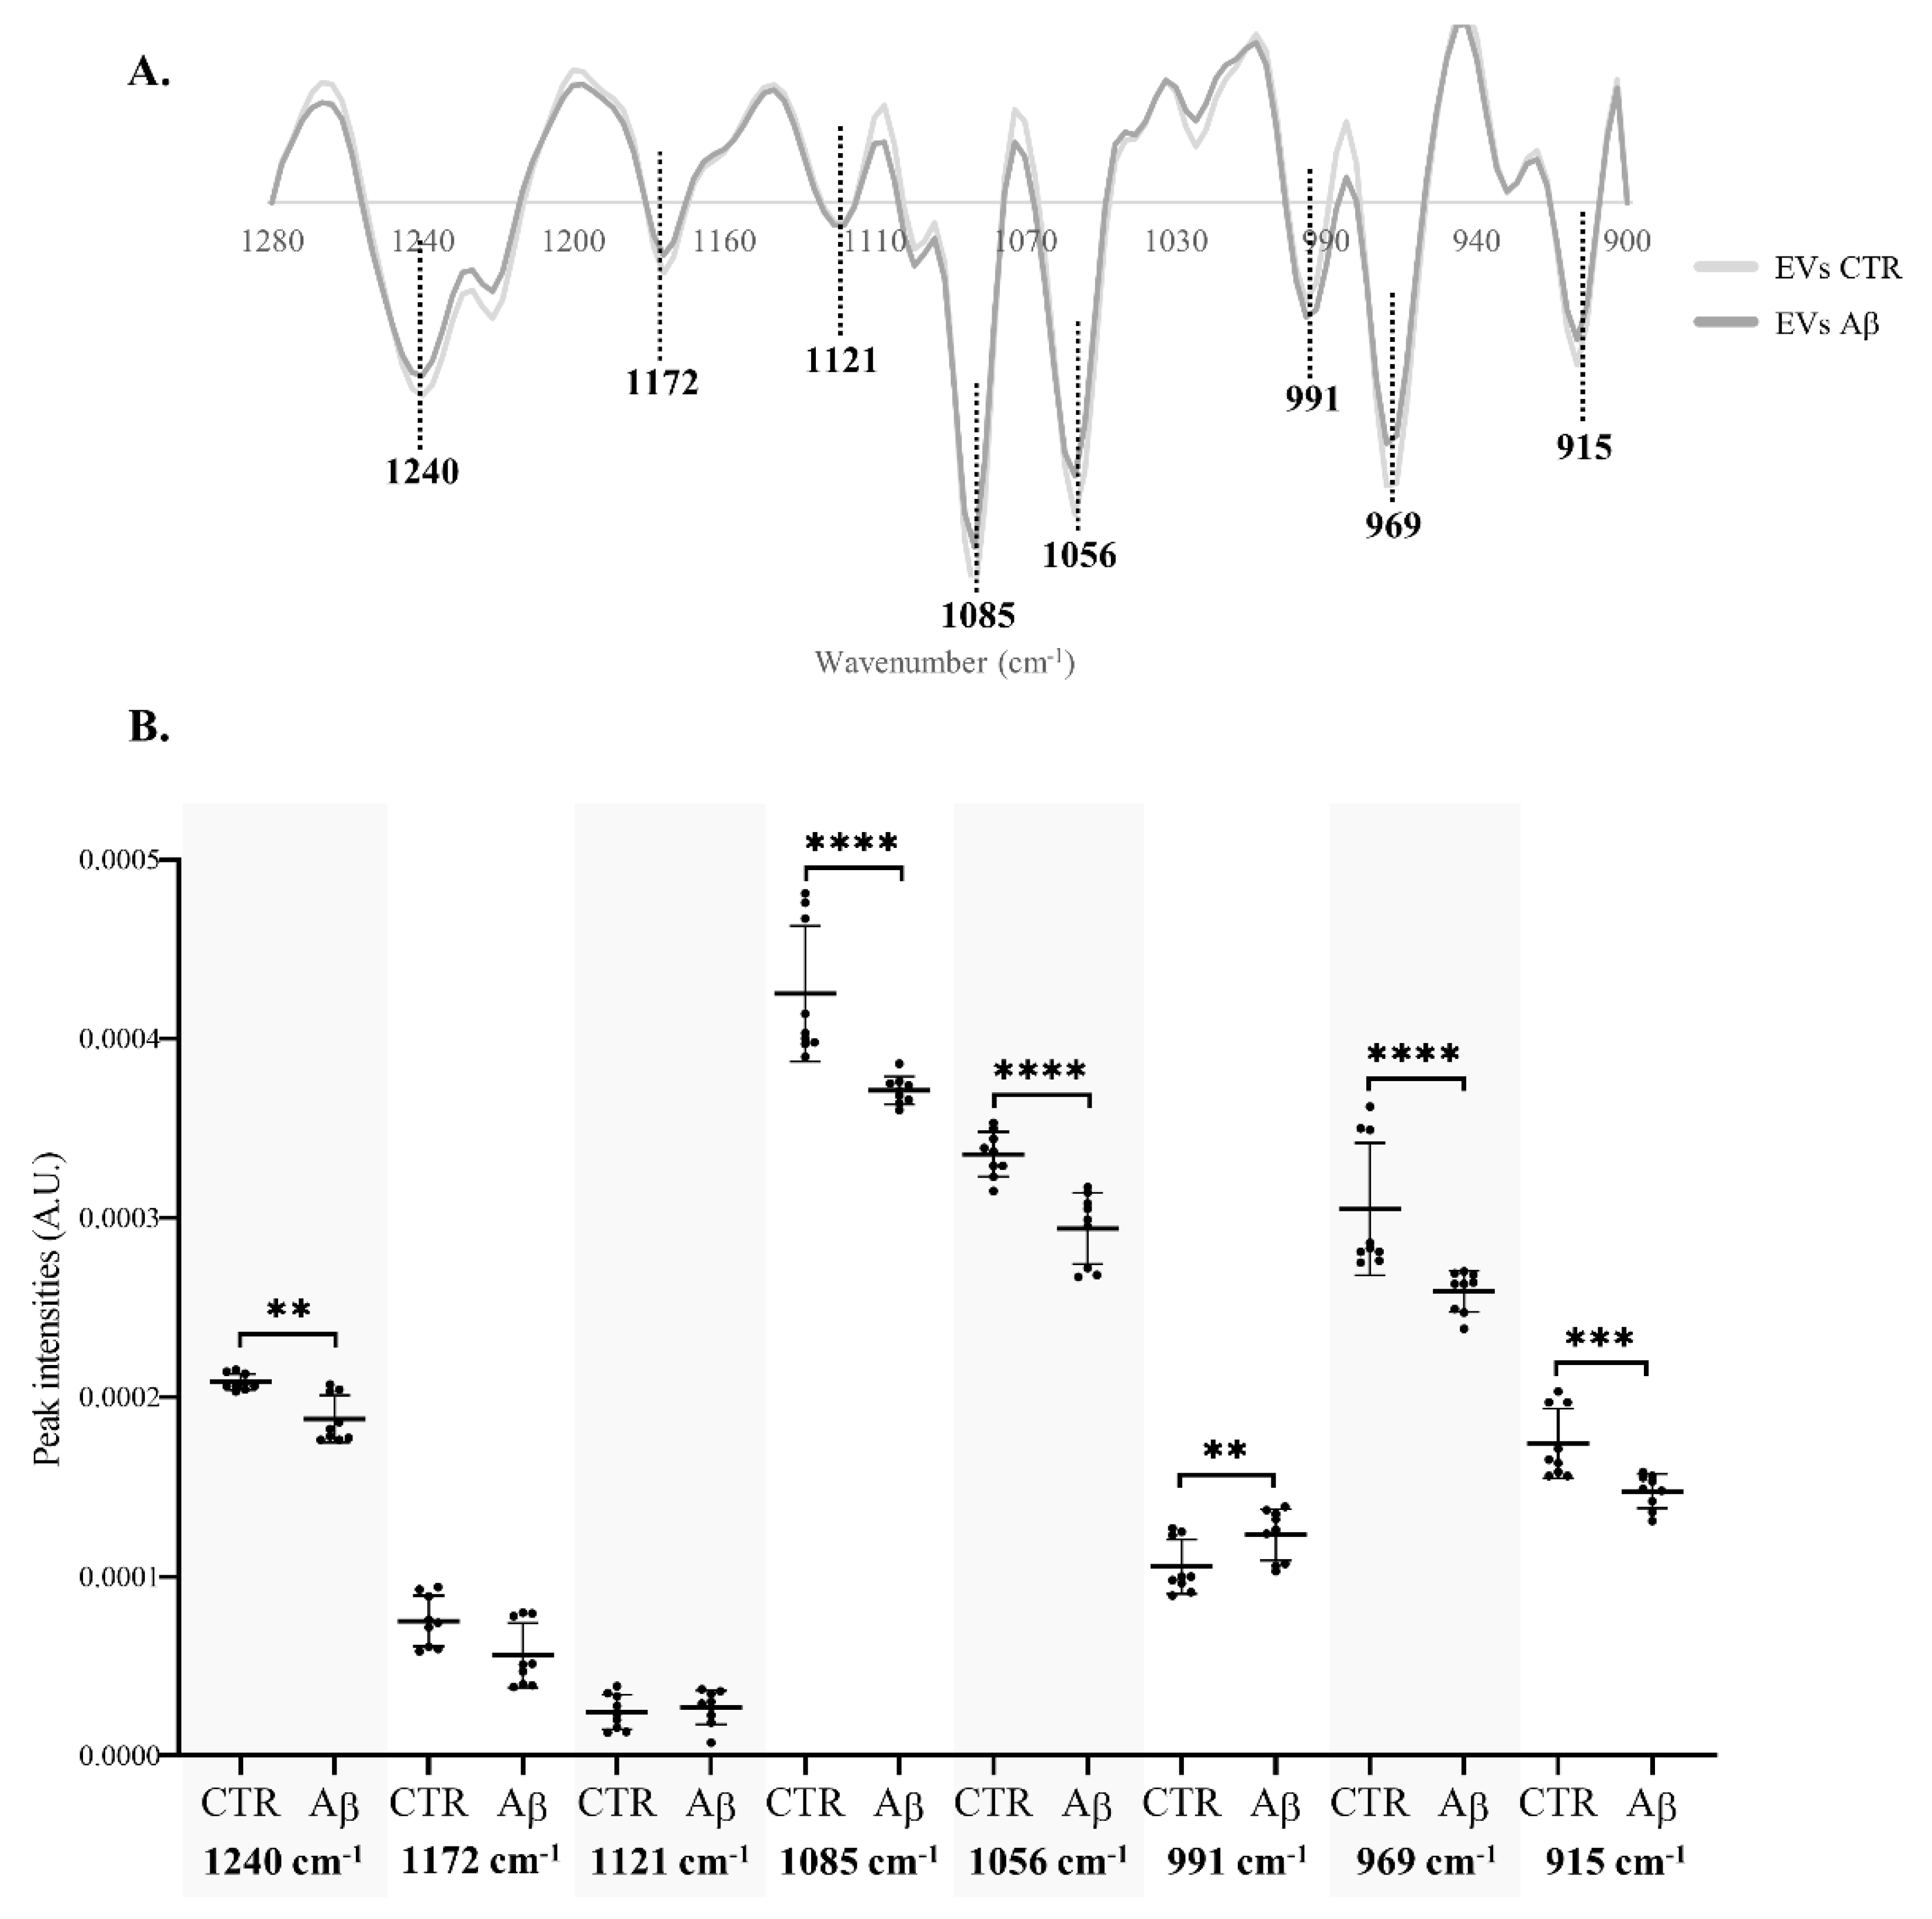

Table 1.
Proposed peak assignments for N2a cells and N2a-derived EVs for the 1280 – 900 cm-1 region of FTIR spectra.
Table 1.
Proposed peak assignments for N2a cells and N2a-derived EVs for the 1280 – 900 cm-1 region of FTIR spectra.
|
Peak (cm-1) |
Proposed assignments | Ref |
|---|---|---|
| 1240 1221* |
asymmetric stretching of phosphorylated proteins, phospholipids and nucleic acids C─O─P stretching (phosphorylated proteins and lipids) |
[26,30,31] |
| 1172* 1170# |
C─O stretching of C─OH groups of serine, threonine and tyrosine in proteins and of carbohydrates (proteins; carbohydrates/ glycogen) C─O stretching (nucleic acids) CO─O─C asymmetric stretching of ester bonds in cholesteryl esters (carbohydrates) |
[29,30] |
| 1158 | C─O stretching, C─C stretching and C─O─H bending (glycogen/carbohydrate and proteins) | [29,30,31] |
| 1121 | C─O stretching of C─OH group of ribose and carbohydrates (RNA; carbohydrates) | [29,30] |
| 1110 | CC─OC stretching of ribose (RNA) Symmetric stretching C─O─P Carbohydrates |
[29,30] |
| 1085 |
asymmetric stretching of phosphorylated proteins, phospholipids, glycogen and nucleic acids C─O─P stretching (phosphorylated proteins and lipids) |
[26,29,30,31] |
| 1056* 1053# |
C─O stretching and C─OH bending (nucleic acids, phospholipid phosphate; glycogen and other carbohydrates) | [29,30,31] |
| 1039# 1031* |
C─O stretching (lipid; carbohydrate) C─O stretching and C─OH bending (nucleic acids and carbohydrates) Glycogen vibration |
[26,29,30,32] |
| 1022# | C─O stretching and C─OH bending (nucleic acids and carbohydrates) C─O and C─C stretching and C─O─H deformation (glycogen) |
[29,30,31] |
| 991* 988# |
C─O stretching from RNA ribose chain and other carbohydrates (nucleic acids ribose) RNA Ribose phosphate main chain mode C─C stretching of DNA backbone |
[29,30,31,32] |
| 969 |
symmetric stretching of nucleic acids and phosphorylated proteins C─C, C─O and C─N─C stretching of phosphodiester, deoxyribose and ribose (nucleic acids) |
[29,30,32,33] |
| 929* 923# |
Left-handed helix DNA (Z-form) | [30] |
| 915* | Ribose ring vibrations (nucleic acids) | [30,32] |
# FTIR peak observed in N2a; * FTIR peak observed in N2a-derived EVs.
Table 2.
Parameters of PLS-DA classification models of factor 1 for N2a and N2a-derived EVs for 1280-900 cm-1 spectroscopic region.
Table 2.
Parameters of PLS-DA classification models of factor 1 for N2a and N2a-derived EVs for 1280-900 cm-1 spectroscopic region.
| Correlation | RMSEC – RMSECV | |||||
| Calibration | Validation | Calibration | Validation | |||
| N2a | 0.667 | 0.523 | 0.373 | 0.437 | ||
| EVs | 0.670 | 0.582 | 0.371 | 0.412 | ||
RMSEC, Root Mean Squares Error of Calibration; RMSECV, Root Mean Squares Error of Cross Validation.
Disclaimer/Publisher’s Note: The statements, opinions and data contained in all publications are solely those of the individual author(s) and contributor(s) and not of MDPI and/or the editor(s). MDPI and/or the editor(s) disclaim responsibility for any injury to people or property resulting from any ideas, methods, instructions or products referred to in the content. |
© 2024 by the authors. Licensee MDPI, Basel, Switzerland. This article is an open access article distributed under the terms and conditions of the Creative Commons Attribution (CC BY) license (http://creativecommons.org/licenses/by/4.0/).
Copyright: This open access article is published under a Creative Commons CC BY 4.0 license, which permit the free download, distribution, and reuse, provided that the author and preprint are cited in any reuse.


