
Submitted:
08 November 2024
Posted:
11 November 2024
You are already at the latest version
Abstract
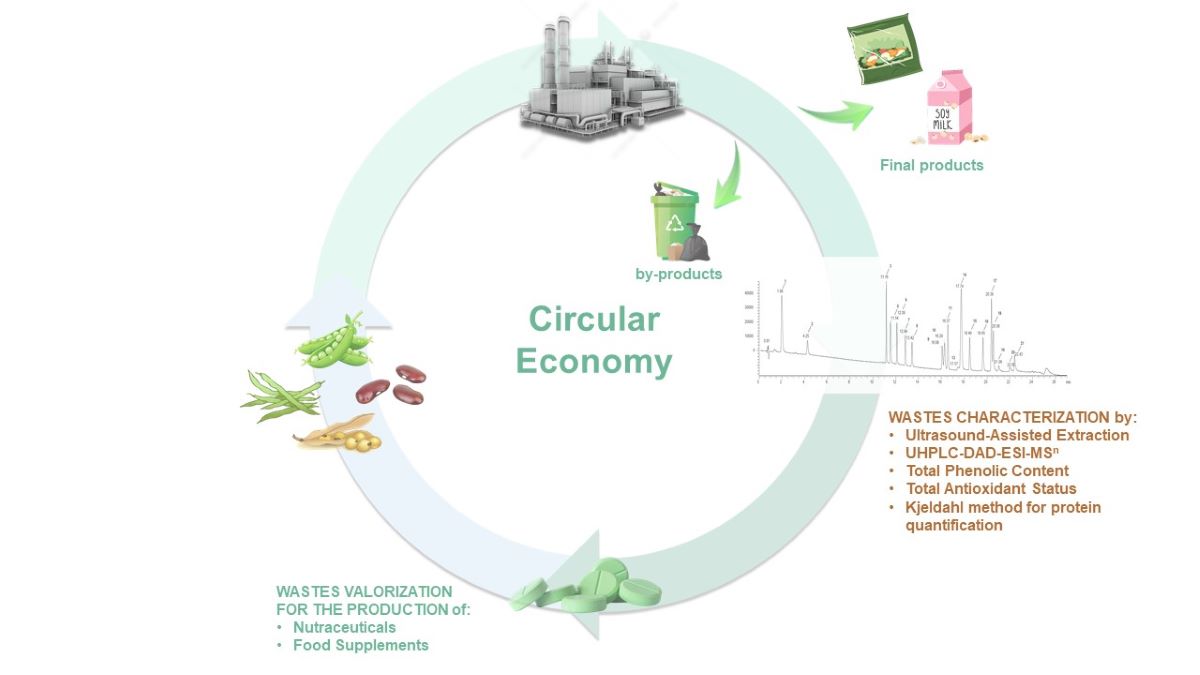
A significant amount of agri-food by-products is generated by large food industry production lines. Aligned with the principles of a circular economy, this project aims to recycle and valorize legumes, green beans and soy by-products, which are still rich in bioactive compounds such as polyphenols and proteins. The valorization of food waste involved the development of an ultrasound-assisted extraction (UAE) method to isolate polyphenols. Analytical techniques, including UHPLC-DAD-ESI-MSn, were used to identify polyphenolic compounds in the legume, green beans and soy extracts obtained through UAE. Additionally, UV-Vis spectrophotometric assays measured the total phenolic content (TPC) and total antioxidant status (TAS), while the Kjeldahl method was employed to assess the protein content in each sample. The analyses revealed a variety of valuable polyphenols in legume, green beans and soy by-products. For instance, beans by-products contain feruloyl glucaric acid derivatives, green beans by-products have different types of flavonols such as quercetin-3-O-glucuronide, and soy by-product is rich in isoflavones. These findings demonstrate the potential for formulating nutraceuticals and cosmetics from these by-products extracts.
Keywords:
legumes and green beans secondary products
; soy raw material
; polyphenols
; UHPLC-DAD-ESI-MSn
; antioxidant activity
; protein content
; waste valorization
; circular economy
; sustainable ingredients
; nutraceutical and cosmetic products
1. Introduction
Nowadays, food industries are facing a significant challenge related to sustainability, largely due to the problem of food waste. This issue has serious implications for both the economy and the environment. It has been found that about 14% of global food is lost between the point of harvesting and reaching the point of sale, and another 17% is wasted by consumers [1]. As a result, the annual global volume of food waste is estimated at 1.3 billion tons [2]. Given these figures and the inefficiencies in managing food waste, it can be argued that waste reduction is a major challenge. One of the proposed strategies is the transition from the traditional linear economy model to the circular economy model [3]. In the linear economy, the process starts with raw materials and ends in waste, while the circular economy model considers waste as valuable resources that can be used in the economic cycle. This approach allows for the optimal conservation of resources by reusing, recycling, and recovering materials for as long as possible, aiming to extend their life cycle and minimize waste production [3].
In the global food industry, horticulture is the leading sector in terms of production, accounting for 38% of agricultural production and 65% of plant production [4]. However, large-scale horticultural industries produce a significant amount of waste, most of which is incinerated in landfills, releasing polluting gases. These agri-food by-products, such as peels, seeds, shells, and leaves, contain valuable bioactive compounds like polyphenols and proteins [5].
Indeed, in nature, plants produce polyphenols as secondary metabolites, playing a critical role in their biological functions and overall survival. These compounds serve as a defense mechanism against various threats such as infections, ultraviolet radiation, and pollutants. They also deter pathogens and herbivores by creating unpleasant flavors. Additionally, phenolic compounds contribute to the pigmentation of plants and the sensory properties of foods [6,7]. Polyphenols are widely present in foods, including legumes. These compounds are of great interest for the development of functional foods, nutraceuticals, cosmetics, and new pharmaceutical formulations aimed at preventing chronic diseases thanks to their antioxidant properties [8]. This study focuses on the valorization of selected by-products and wastes from the industrial production of frozen legumes by an agri-food company in the Romagna region of Italy. The company also provided the relative final product intended for sale for comparison with the corresponding by-product. Samples supplied have also been taken from different steps of the production chain (pre- and post-cooking). Moreover, two distinct stages of maturation were observed for Phaseolus vulgaris species: the green beans (young stage; fruits and seeds) and the beans (more mature stage; seeds). Subsequently, the polyphenol profiles of the two maturation stages were compared.
The valorization of food waste was achieved through the development of an extraction method based on ultrasound bath (UAE), which was employed to isolate polyphenols. Additionally, effective analytical approaches were utilized for the chemical and functional characterization of these polyphenolic compounds. UHPLC-DAD-ESI-MSn analyses were performed to identify the polyphenolic compounds found in all of the UAE legume extracts. Furthermore, the extracts were characterized via two distinct UV-Vis spectrophotometric assays, specifically total phenolic content (TPC) to determine the polyphenolic content and total antioxidant status (TAS) to assess the antioxidant activity of the extracts. The Kjeldahl method was also applied to determine the protein content of each sample. As a consequence of all results found, waste materials have been demonstrated to contain valuable components when compared to the final product.
2. Materials and Methods
2.1. Chemicals and Reagents
Methanol for HPLC-MS, Water for HPLC-MS, Acetic acid for HPLC-MS, Methanol HPLC grade ≥ 99.9%, methanol ≥ 99.8%, Acetone HPLC grade ≥ 99.8%, Ethanol and acetic acid ≥ 99.8%, Potassium persulfate ≥ 99.0%, ABTS (2,2-azinobis-(3ethylbenzothiazoline-6-sulfonate), Trolox® (6-hydroxy-2,5,7,8-tetramethyl-3,4-dihydrochro mene-2-carboxylic acid), Sodium hydroxide ≥ 98% in pellets, Sodium carbonate ≥ 99.5% and Folin–Ciocalteu reagent were purchased from VWR Chemicals (Darmstadt, Germany). Copper (II) sulfate pentahydrate and Potassium sodium tartrate tetrahydrate EMSURE® were purchased from Merck (Darmstadt, Germany). Gallic acid, Protocatechuic acid, Trans-cinnamic acid, Caffeic acid ≥98.0%, p-coumaric acid ≥98.0%, Ferulic acid, (+)-Catechin, Isoquercitrin, Daidzein, Genistein, and Phloridzin dihydrate were purchased from Sigma-Aldrich (Taufkirchen, Germany). Chlorogenic acid, ≥98.0% was purchased from Apollo Scientific (Bredbury, UK). Quercitrin was purchased from Cayman Chemical (Michigan, USA). (-)-Epicatechin > 97.0%, Hesperetin > 97.0% and Apigenin > 97.0% were purchased from TCI (Zwijndrecht, Belgium). Hyperoside was purchased from HWI group (Rulzheim, Germany). (+)-Rutin trihydrate 97% was purchased from Alfa Aesar (Haverhill, Massachusetts, USA). Myricetin 98%, Naringenin 97% and Kaempferol ≥98.0% were purchased from ThermoFisher (Kandel, Germany). Naringenin chalcone was purchased from PhytoLab (Vestenbergsgreuth, Germany).
2.2. Equipment
Dionex UltiMate 3000 RS system including a DAD detector coupled to a LTQ XL linear ion-trap mass spectrometer-ESI ion source from Thermo Fisher Scientific (Waltham, MA, USA). The Thermo XCalibur software, version 3.1.66.10 (Waltham, Massachusetts, USA), was employed for the acquisition of mass chromatograms and spectral data. Ultrasound Bath from Bandelin Sonorex (Berlin, Germany); Analytical balance from Sartorius; Shimadzu HPLC from Thermo Fisher Scientific (Waltham, MA, USA); Centrifuge from Heraeus Biofuge Pico (Barcellona, Spain); Spectrophotometer: Jasco UV-VIS V-630 (Jasco Europe, Lecco, Italy). Ultrasound Bath: Elmasonic S 40 H (GEASS S.R.L., Turin, Italy). Centrifuge: Awel International MF 20-R multifunction centrifuge (MedWrench, East Point, GA, USA). Freeze-dryer: Alpha 1-4 LO plus (Martin Christ, Harz, Germany). Rotatory evaporator: IKA Rotary Evaporators RV 10 basic (IKA-Werke GmbH & Co. KG, Staufen im Breisgau, Germany).
2.3. Samples
Beans, green beans, and soy samples were provided by Fruttagel S.C.p.A (Alfonsine, Italy). The samples were supplied already freeze-dried. The materials were then ground in two steps. First, a domestic mixer was used to break the solid materials and reduce particle size. Next, a second milling process (using an IKA Tube Mill 100 control) was employed to obtain fine powders. These powders were then cryo-lyophilized for 24 hours at -60 °C and stored at -20 °C until use.
Legume by-products (ByP), final products (FinalP), and raw material (RM) are reported in Table 1. In this context, in case of soy the term "raw material" refers to the seeds that are used as the initial source material for the production of soy milk. In contrast, the by-product is the waste material obtained during the industrial processing stage.
Lotta integrata* is a crop defense practice that aims to reduce pesticide use through the implementation of multiple measures. It is the intermedium between conventional and biological methodologies.
The products were classified as either biological or conventional based on the following criteria. Conventional products are obtained using active compounds regulated by Reg. (CE) No 396/2005. In contrast, biological products are obtained through cultivation practices governed by Reg. (CE) 848/2018. The primary objective of biological methodologies is to minimize chemical treatments by employing microorganisms or insects to naturally combat harmful organisms. In this case, the chemicals used are carefully selected based on their environmental impact.
2.4. UAE of Polyphenols from Agri-Food Samples
The freeze-dried powders of the legume samples were subjected to an extraction method that exploits the ultrasound bath as reported by Terenzi et al. [9]. The applied extraction procedure allowed to obtain 25 mL of extract for each legume sample analyzed in the project.
2.5. Gravimetric Determination (Yield of Extraction), TPC Assay, TAS Assay and Protein Content
A gravimetric determination was carried out on all dried extracts obtained through UAE in order to calculate the extraction yield (%). Additionally, TPC assay was conducted to determine the polyphenol content of the extracts, expressed in millimoles of gallic acid equivalents (GAE) per 100 grams of dry weight (DW) of the lyophilized sample powder. Subsequently, the spectrophotometric assay TAS—ABTS•+ Radical Cation Scavenging Activity was carried out to evaluate the antioxidant activity of the extracts, expressed as mmol Trolox per 100 g of lyophilized sample powder. Lastly, the protein content was determined using the Kjeldahl method. All assays were performed in accordance with the established methodologies by Terenzi et al. [9].
2.6. UHPLC-DAD-ESI-MSn Analysis of Polyphenols
The qualitative analysis of polyphenolic compounds in legumes was carried out by UHPLC-DAD-ESI-MSn analyses. The Liquid Chromatography (LC) was performed by a Dionex UltiMate 3000 RS system including a Diode Array Detector (DAD). A Kinetex C18 column (50 x 2.1 mm, 1.7 µm) was used and kept at 20 °C in a thermostatic device (UltiMateTM RS Column Compartment). 1.4 µL injection and an optimized gradient were performed with [A] 0.1% formic acid (v/v) and [B] 100% methanol at a flow rate of 0.250 mL min-1. The gradient elution used was as previously reported by Terenzi et al.9 with some modifications. A gradient elution was performed, starting with 2% [B] for 5 min, increasing to 10% [B] at 7.78 min, 30% [B] at 9.72 min, 37% [B] at 14 min, 60% [B] at 23.0 min, then dropping back to 2% [B] at 23.23 min and keeping this composition until the end (27 min). The UHPLC system was coupled to an LTQ XL linear ion-trap mass spectrometer with ESI ion source (all Thermo Fisher Scientific, Waltham, MA, USA) equipped with an electrospray ionization source working in negative and positive mode. The chromatographic separation is reported in Figure 5.
Semi-quantitative determination of polyphenols in the legume samples was performed by using DAD total scan chromatograms. The recorded peak areas of the standard reference compounds and their known concentrations were compared with the peak areas of the polyphenols identified in the samples, employing the following equation:
3. Results
Different analytical methodologies were performed in this research to compare the by-products with the relative final products of legume samples. General tests such as Gravimetric determination, TPC, TAS, and the Kjeldahl method were performed to compare extraction yields (%), polyphenolic content, antioxidant activity, and protein content. More selective and advanced techniques, such as UHPLC-MS, were applied for the specific identification of the polyphenolic compounds in each sample. Qualitative UHPLC-MS analysis was also useful in highlighting differences between the young and mature stages of the Phaseolus vulgaris species.
3.1. Gravimetric Determination (Yield of Extraction)
Figure 1 shows a comparison of extract yield values (%) obtained from bean by-products (brown full bars) and the respective final product (brown striped bar). For soy, the graph compares the extract yield values (%) between the soy by-product (pink full bar) obtained after pressing during the industrial process and the seeds (RM-raw material in pink striped bars). In the case of green beans, a comparison is reported between the different by-products analyzed in the project (all green full bars). Regarding bean samples, the results demonstrate that the amount of extracts obtained from the by-products is only slightly lower than that of the corresponding final product. Moreover, the fresh biological by-product (B-Bio-Fr-ByP) even shows a higher yield value (%). This suggests that the extractable portion from the by-product and the final product is similar. As for the green beans by-products, no significant differences are observed except for the cooked biological by-product (GB-Bio-Co-ByP), which has the lowest yield values (%) among green beans. This difference could be attributed to the composition of this sample. Lastly, soy seeds (S-Bio-RM and S-Conv-RM) were found to have higher yield values (%) than the by-product. In this case, both the industrial procedure for obtaining soy milk and the composition of the sample itself may have affected the % yield of dry extract obtained.
3.2. TPC
The TPC of the legume samples exhibited considerable variations, with the exception of soy, which demonstrated comparable levels among the samples. Regarding beans, the TPC of the by-products generally equals or exceeds that of the final product, indicating similar polyphenol amounts in the by-products and the final product. Upon closer inspection, it is evident that the TPC of the two cooked by-products is slightly lower than that of the respective fresh by-products, suggesting that the cooking process during industrial processing may have affected the polyphenol content. The same trend was observed among green bean by-products. As illustrated in Figure 2, the cooked by-product exhibited a reduction in TPC in comparison to the fresh sample.
3.3 TAS—ABTS•+ Radical Cation Scavenging Activity
Figure 3 illustrates the TAS values for all samples, which exhibit a high degree of similarity. This is evident even in the case of beans, where a comparison of the by-product with the final product reveals that the TAS value of the by-product is comparable to that of the final product.
3.4. Protein Content by Kjeldahl Method
The protein content of each sample was determined using the Kjeldahl method, and the results are presented in Figure 4. It was immediately evident that the soybean by-product exhibited the highest protein content. This is an interesting finding, as it highlights the potential use of soy by-products, which may offer a more substantial benefit than the seeds themselves. In contrast, the majority of bean by-products exhibited protein content comparable to that of the final product. It is noteworthy that the cooked biological green bean by-product (GB-Bio-Co-ByP) exhibited a markedly elevated protein content in comparison to the other green bean by-products.
3.5. Characterization of Legume Samples by UHPLC-DAD-ESI-MSn
To determine the qualitative profile of polyphenols in the legume samples under investigation, the chromatographic separation of a mixture of 21 standard polyphenols was initially optimized using a UHPLC-DAD-ESI-MSn. The Scan range for DAD was 190 – 500 nm and the mass range was m/z 50 – 2000. Figure 5 illustrates the chromatographic separation of the reference standard mixture.
Figure 5.
The UHPLC-DAD-ESI-MSn chromatographic analysis of the 21 standards polyphenolic mixture at λ = 280 nm obtained by following the method reported in par. 2.5; 1= Gallic acid; 2= Protocatechuic acid; 3= (+)-Catechin; 4= Caffeic Acid; 5= Chlorogenic acid; 6= (-)-Epicatechin; 7= p-Coumaric acid; 8= Ferulic acid; 9= Isoquercitrin; 10= (+)-Rutin trihydrate; 11= Hyperoside; 12= Phloridzin dihydrate; 13= Myricetin; 14= Quercitrin; 15= Daidzein; 16= Naringenin; 17= Genistein; 18= Hesperetin; 19= Naringenin chalcone; 20= Kaempferol; 21= Apigenin.
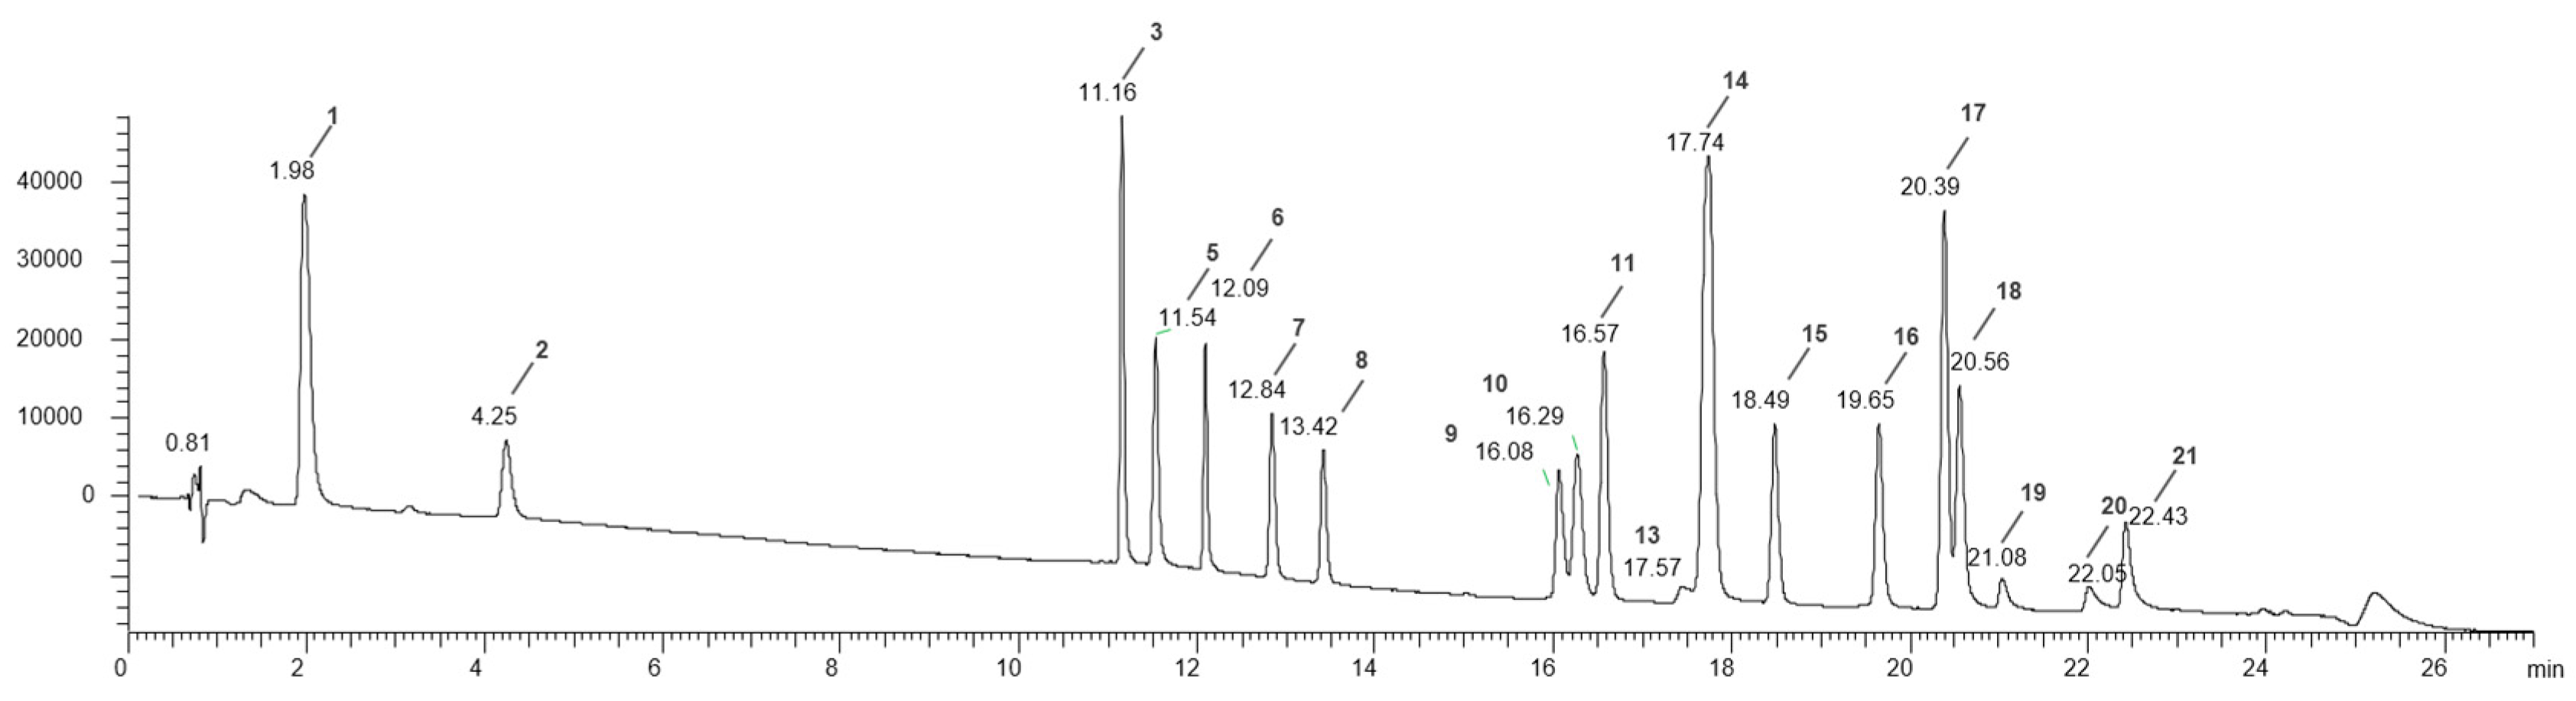
Table 2 shows the retention times, mass, precursor ion, and concentration used in the analysis of each standard polyphenol.
A procedure combining retention times (RT), UV-Vis absorption spectra, and liquid chromatography-mass spectrometry (LC-MS) pattern analysis was employed for the qualitative analysis of polyphenols in all legume samples. The major polyphenols were identified through the use of MS analysis. These analyses were conducted through the examination of parent ions and their respective fragments, as observed in both negative and positive mode spectra. Subsequently, the mass spectra pattern was compared with that of standard compounds and existing literature.
Regarding sample preparation, all UAE extracts of 25 mL were subjected to a 10-times concentration and subsequent centrifugation at 13,000 rpm for 10 minutes before injection. The sample injection volume was 1.4 µL, with a double injection in both positive and negative modes in accordance with the specified chromatographic conditions outlined in par. 2.5.
Subsequently, a semi-quantitative analysis was conducted to estimate the amounts of individual polyphenols present in the samples. As a result, it was possible to perform a comparative analysis between the samples, particularly between fresh and cooked products with regard to their phenolic content. The quantity of polyphenols in the samples was determined by comparing the recorded areas of the standard reference compounds peaks and their known concentrations with the areas of the polyphenol peaks identified in the samples, employing the following equation:
In the absence of a standard reference compound, semi-quantitative calculations were performed using the areas of polyphenol standards from the same class or family, as previously reported by Mesquita and Monteiro [10]. The quantity of polyphenols was expressed in milligrams per 100 grams of dry weight (DW) of the lyophilized sample powder. As a comprehensive quantitative analysis was not conducted, standard deviations (SDs) cannot be provided for the data presented in the bar graphs (Figure 3, 5, and 7).
3.6. Green Bean Samples (Phaseolus vulgaris)
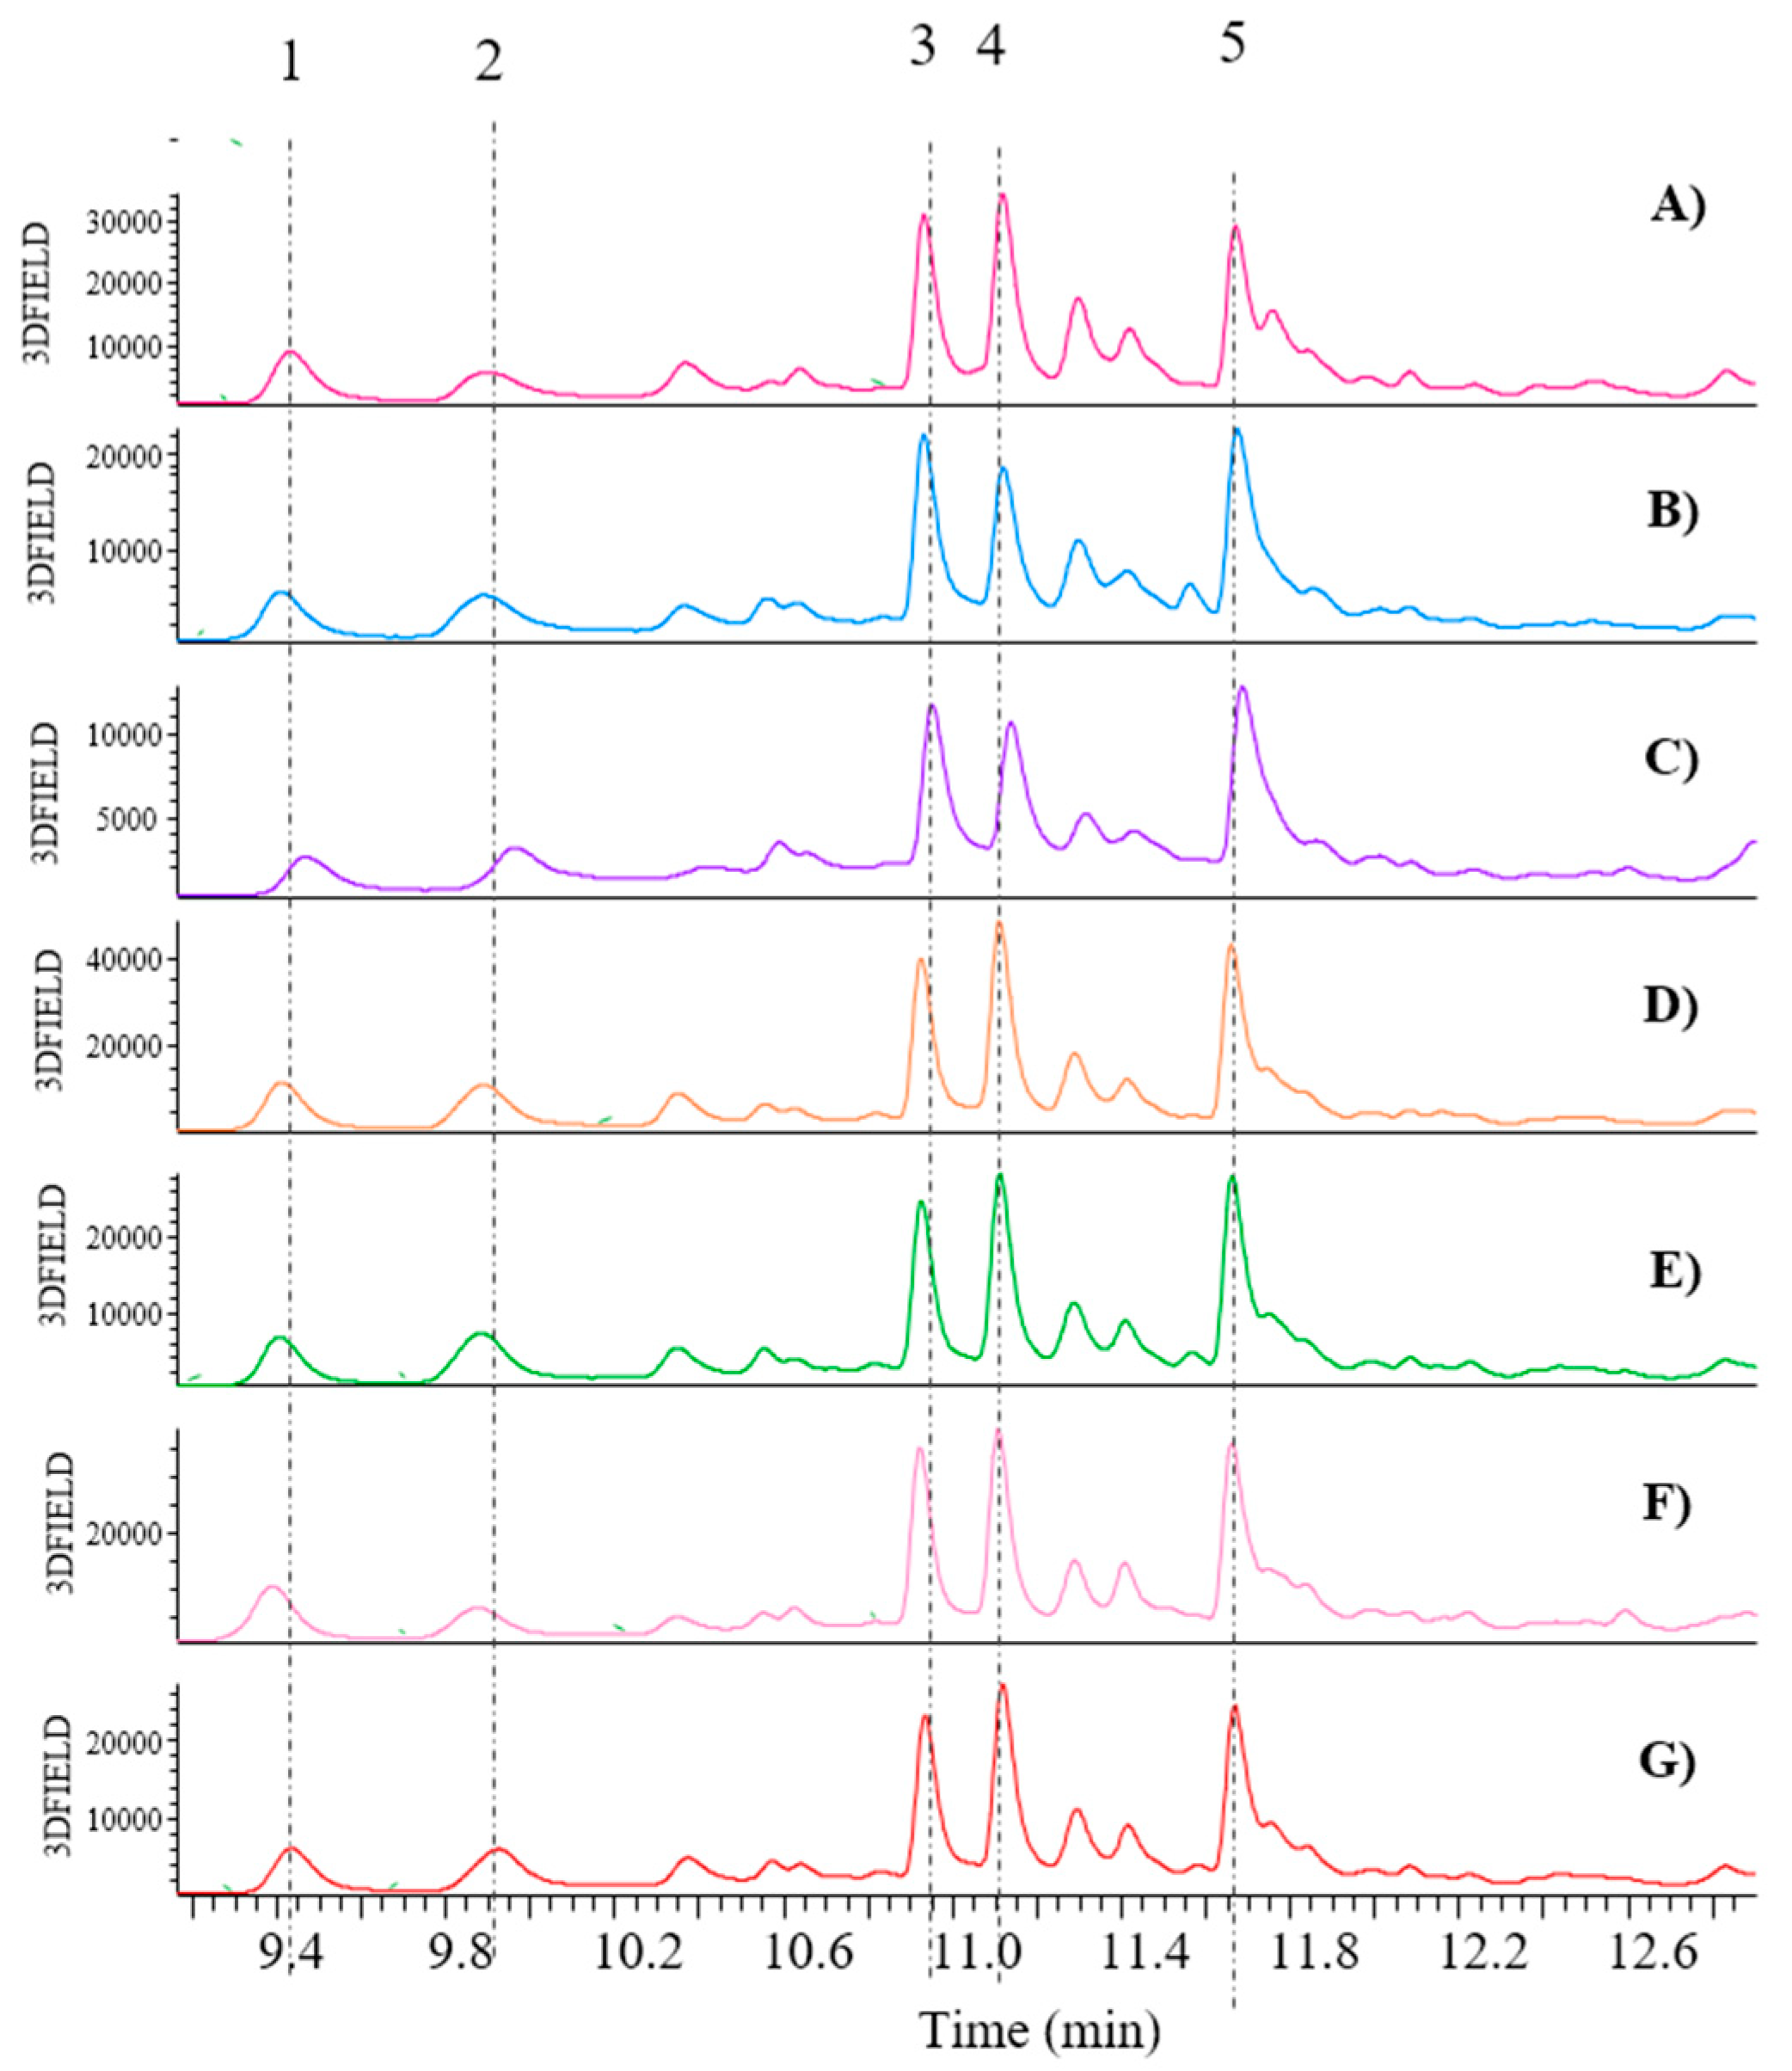
For the green bean samples, only by-products were analysed as the final product was not supplied. These samples include fresh and cooked by-products taken before and after cooking during the industrial production of frozen legumes. As the varieties grown are the same in both LI and biological systems, with the difference that the seeds are not treated at all in the latter case, we can affirm that both cooked and fresh by-products have been subjected to biological and LI cultivation. The pattern of mass spectra was analyzed in negative mode [M-H]-. The main compounds found in all green bean samples were flavonols and derivatives as previously reported [11]. From a qualitative perspective, no notable differences were observed between the fresh and cooked by-products derived from biological and LI cultivation, respectively. As illustrated in Figure 6, the fresh and cooked samples exhibited comparable profiles of flavonols. However, this is not the case for the samples belonging to the two cultivation types, where a difference between biological and LI samples was immediately apparent. Indeed, both fresh and cooked LI by-products (A-B samples of Figure 6) are devoid of the presence of a compound whose precursor ion is m/z 593, which would appear to correspond to Kaempferol 3-O-rutinoside (peak 7), as already reported [11]. Conversely, both biological by-products (C-D samples of Figure 2) are devoid of the presence of peak 4, which is Quercetin 3-O-glucuronide, as it has a parent ion of m/z 477 [11] and peak 8, which is Kaempferol 3-O-glucuronide as it has a parent ion of m/z 461. However, regarding all other compounds, the MS spectra have revealed the presence of the parent ion at m/z 741 (peak 1), which is identified as Quercetin 3-O-xylosylrutinoside. Peak 2 at m/z 595 has been demonstrated to be Quercetin 3-O-vicianoside, which is present even in the biological fresh by-product but absent in the cooked one. The compound with m/z 725 (peak 3) has been identified as Kaempferol 3-O-xylosylrutinoside, as previously described [11]. The identification of Quercetin 3-O-rutinoside (rutin), corresponding to peak 5, was confirmed by comparison with the reference molecule available in our laboratories. This compound was identified in all green bean samples, with the exception of the LI-cooked by-product. The parent ion of m/z 579 observed for compound 6 has been proposed to be Kaempferol 3-O-sambubioside, according to the literature 11. Thus, the qualitative analysis has demonstrated that green bean by-products are rich in polyphenols, which have strong biological activities beneficial for human health. For instance, literature has documented Quercetin 3-O-glucuronide to possess anti-vascular effects [24]. This emphasises the significance of utilising agri-food by-products that would otherwise be discarded.
Figure 7 shows the results of the semi-quantitative analysis conducted on green bean by-products. The bar graph presents a comparison of the polyphenol profile of fresh and cooked samples, as well as samples derived from biological cultivation (in blue) and those from LI cultivation (in green). A notable observation when comparing the fresh and cooked by-products is the presence of certain compounds, such as Quercetin 3-O-xylosylrutinoside (1) and Rutin (5), in higher amounts in the cooked by-products (GB-Co-LI-ByP and GB-Co-Bio-ByP) compared to their fresh counterparts (GB-Fr-LI-ByP and GB-Fr-Bio-ByP). A similar pattern is observed for compounds 4 (Quercetin 3-O-glucuronide) and 8 (Kaempferol 3-O-glucuronide), which are present in higher amounts in the cooked by-products (GB-Co-LI-ByP). It seems probable that the polyphenols in fresh green beans are bound to other molecules or trapped within the plant cells. However, the process of cooking is likely to alter the cell structure, thereby releasing these compounds and making them more available [12]. Conversely, certain compounds are no longer present in the cooked by-products, including Kaempferol 3-O-xylosylrutinoside (3) and Kaempferol 3-O-sambubioside (6) in the GB-Co-Bio-ByP sample. This outcome is to be expected, given that the cooking process is likely to result in the degradation or hydrolysis of the sugar chains of these two compounds.
3.7. Bean Samples (Phaseolus vulgaris)
In the case of beans, the most rudimentary waste material obtained from the initial stages of the industrial process, defined as B-Bio-ByP and B-Conv-ByP, underwent UHPLC-DAD-MSn analysis. This material is characterized by the presence of a multitude of foreign bodies, including stones, branches, and leaves. Furthermore, also by-products from collection points close to the final product were analyzed, which therefore appear to be less contaminated by foreign bodies than those previously mentioned. Among them, there are the biological by-products (B-Fr-Bio-ByP and B-Co-Bio-ByP), and the LI by-products (B-Fr-LI-ByP and B-Co-LI-ByP), while the final product (B-FinalP) corresponds to frozen beans.
From a qualitative perspective, the phenolic composition of all bean samples is comparable, including both by-products and the final product. Specifically, the presence of five distinct main compounds, with retention times of 9.47, 9.96, 10.95, 11.14, and 14.69 minutes, was identified in all bean samples. The peaks exhibit the same absorption spectra (λ = 326 nm) and identical mass spectra patterns, with a parent ion of m/z 385 in negative mode [M-H]-. It has been postulated that these compounds are derivatives of ferulic acid coupled with glucaric or galactaric acid, as previously described by Nguyen et al [13]. It is noteworthy that all bean waste contains derivatives of feruloylglucaric acid, a significant polyphenol that has been demonstrated to possess anticholesterolemic properties [23].
Figure 8.
Comparison of the UHPLC-DAD chromatograms recorded at λ= 330 nm of bean samples obtained by following the method reported in par 2.5. This includes a zoom of the retention times in the range of 9.16 and 12.91 min; A) B-FinalP; B) B-Bio-ByP; C) B-Conv-ByP; D) B-Fr-Bio-ByP; E) B-Co-Bio-ByP; F) B-Fr-LI-ByP; G) B-Co-LI-ByP; 1, 2, 3, 4, 5= Feruloyl glucaric/galactaric acid derivative.
Although no qualitative differences were observed in the polyphenol composition of the bean samples, the semi-quantitative analysis revealed significant variations among the samples. One noteworthy observation, as illustrated in Figure 9, is that peak number 4 appears to be the most concentrated in all the bean samples. This concentration is consistent regardless of whether the beans are by-products or final products and regardless of the type of cultivation. Moreover, it is notable that, in contrast to green beans, there are no appreciable differences between fresh and cooked by-products in the case of beans. Indeed, in this instance, the fresh by-products contain more concentrated compounds than the cooked ones, irrespective of the type of cultivation. This may result from the cooking process, which may have facilitated the extraction of polar compounds into the cooking water. It is also important that three distinct types of bean cultivation were compared: biological, conventional, and LI. An examination of the bar graph in Figure 9 reveals that biological cultivation is the most effective method, resulting in higher concentrations of all five identified compounds. Finally, a comparison of the by-product with the final product revealed that the content of the five identified polyphenols is higher in the by-products, except the cooked ones.
3.8. Soy Samples
Regarding the soy samples, the LC-MS qualitative analysis was carried out on the raw materials (RM), including biological and conventional seeds (S-Bio-RM and S-Conv-RM), as well as the biological by-product obtained from the industrial pressing process (S-Bio-ByP). In this instance, the mass spectral pattern was analyzed in ESI positive mode. It has been demonstrated in several studies 14 that soy is a rich source of isoflavones and their derivatives. The identification of these compounds was achieved through a comparison with previously published LC-MS data by Lee et al. [15]. The qualitative analysis of soy, comprising both seed and waste product samples, revealed a comparable isoflavone composition. Among the isoflavones identified, all soy samples showed the presence of Daidzin m/z 417 (peak 1), Glycitin m/z 447 (peak 2), Genistin m/z 433 (peak 3), Malonyl daidzin m/z 503 (peak 4), Malonyl glycitin m/z 533 (peak 5), and Malonyl genistin m/z 519 (peak 6). The identification of Daidzein and Genistein, with respective parent ions of m/z 255 and m/z 271 (peaks 7 and 8) was confirmed by comparison with the standard molecules. Similarly, as has been previously observed in the case of beans and green beans, the by-product of soy must be considered a rich source of isoflavones. Indeed, it contains the same isoflavones qualitative profile as biological and conventional seeds. For this reason, it can be reasonably deduced that isoflavones derived from soy waste may be employed in the treatment of symptoms associated with osteoporosis [16].
Figure 10.
Comparison of the UHPLC-DAD chromatograms recorded at λ= 330 nm of soy samples obtained by following the method reported in par 2.5. This analysis includes a zoom of the retention times in the range of 12.24 and 20.77 min; A) S-Bio-ByP; B) S-Bio-RM; C) S-Conv-RM; 1= Daidzin; 2 = Glycitin; 3=Genistin; 4= Malonyl daidzin; 5= Malonyl glycitin; 6= Malonyl genistin; 7= Daidzein; 8= Genistein.
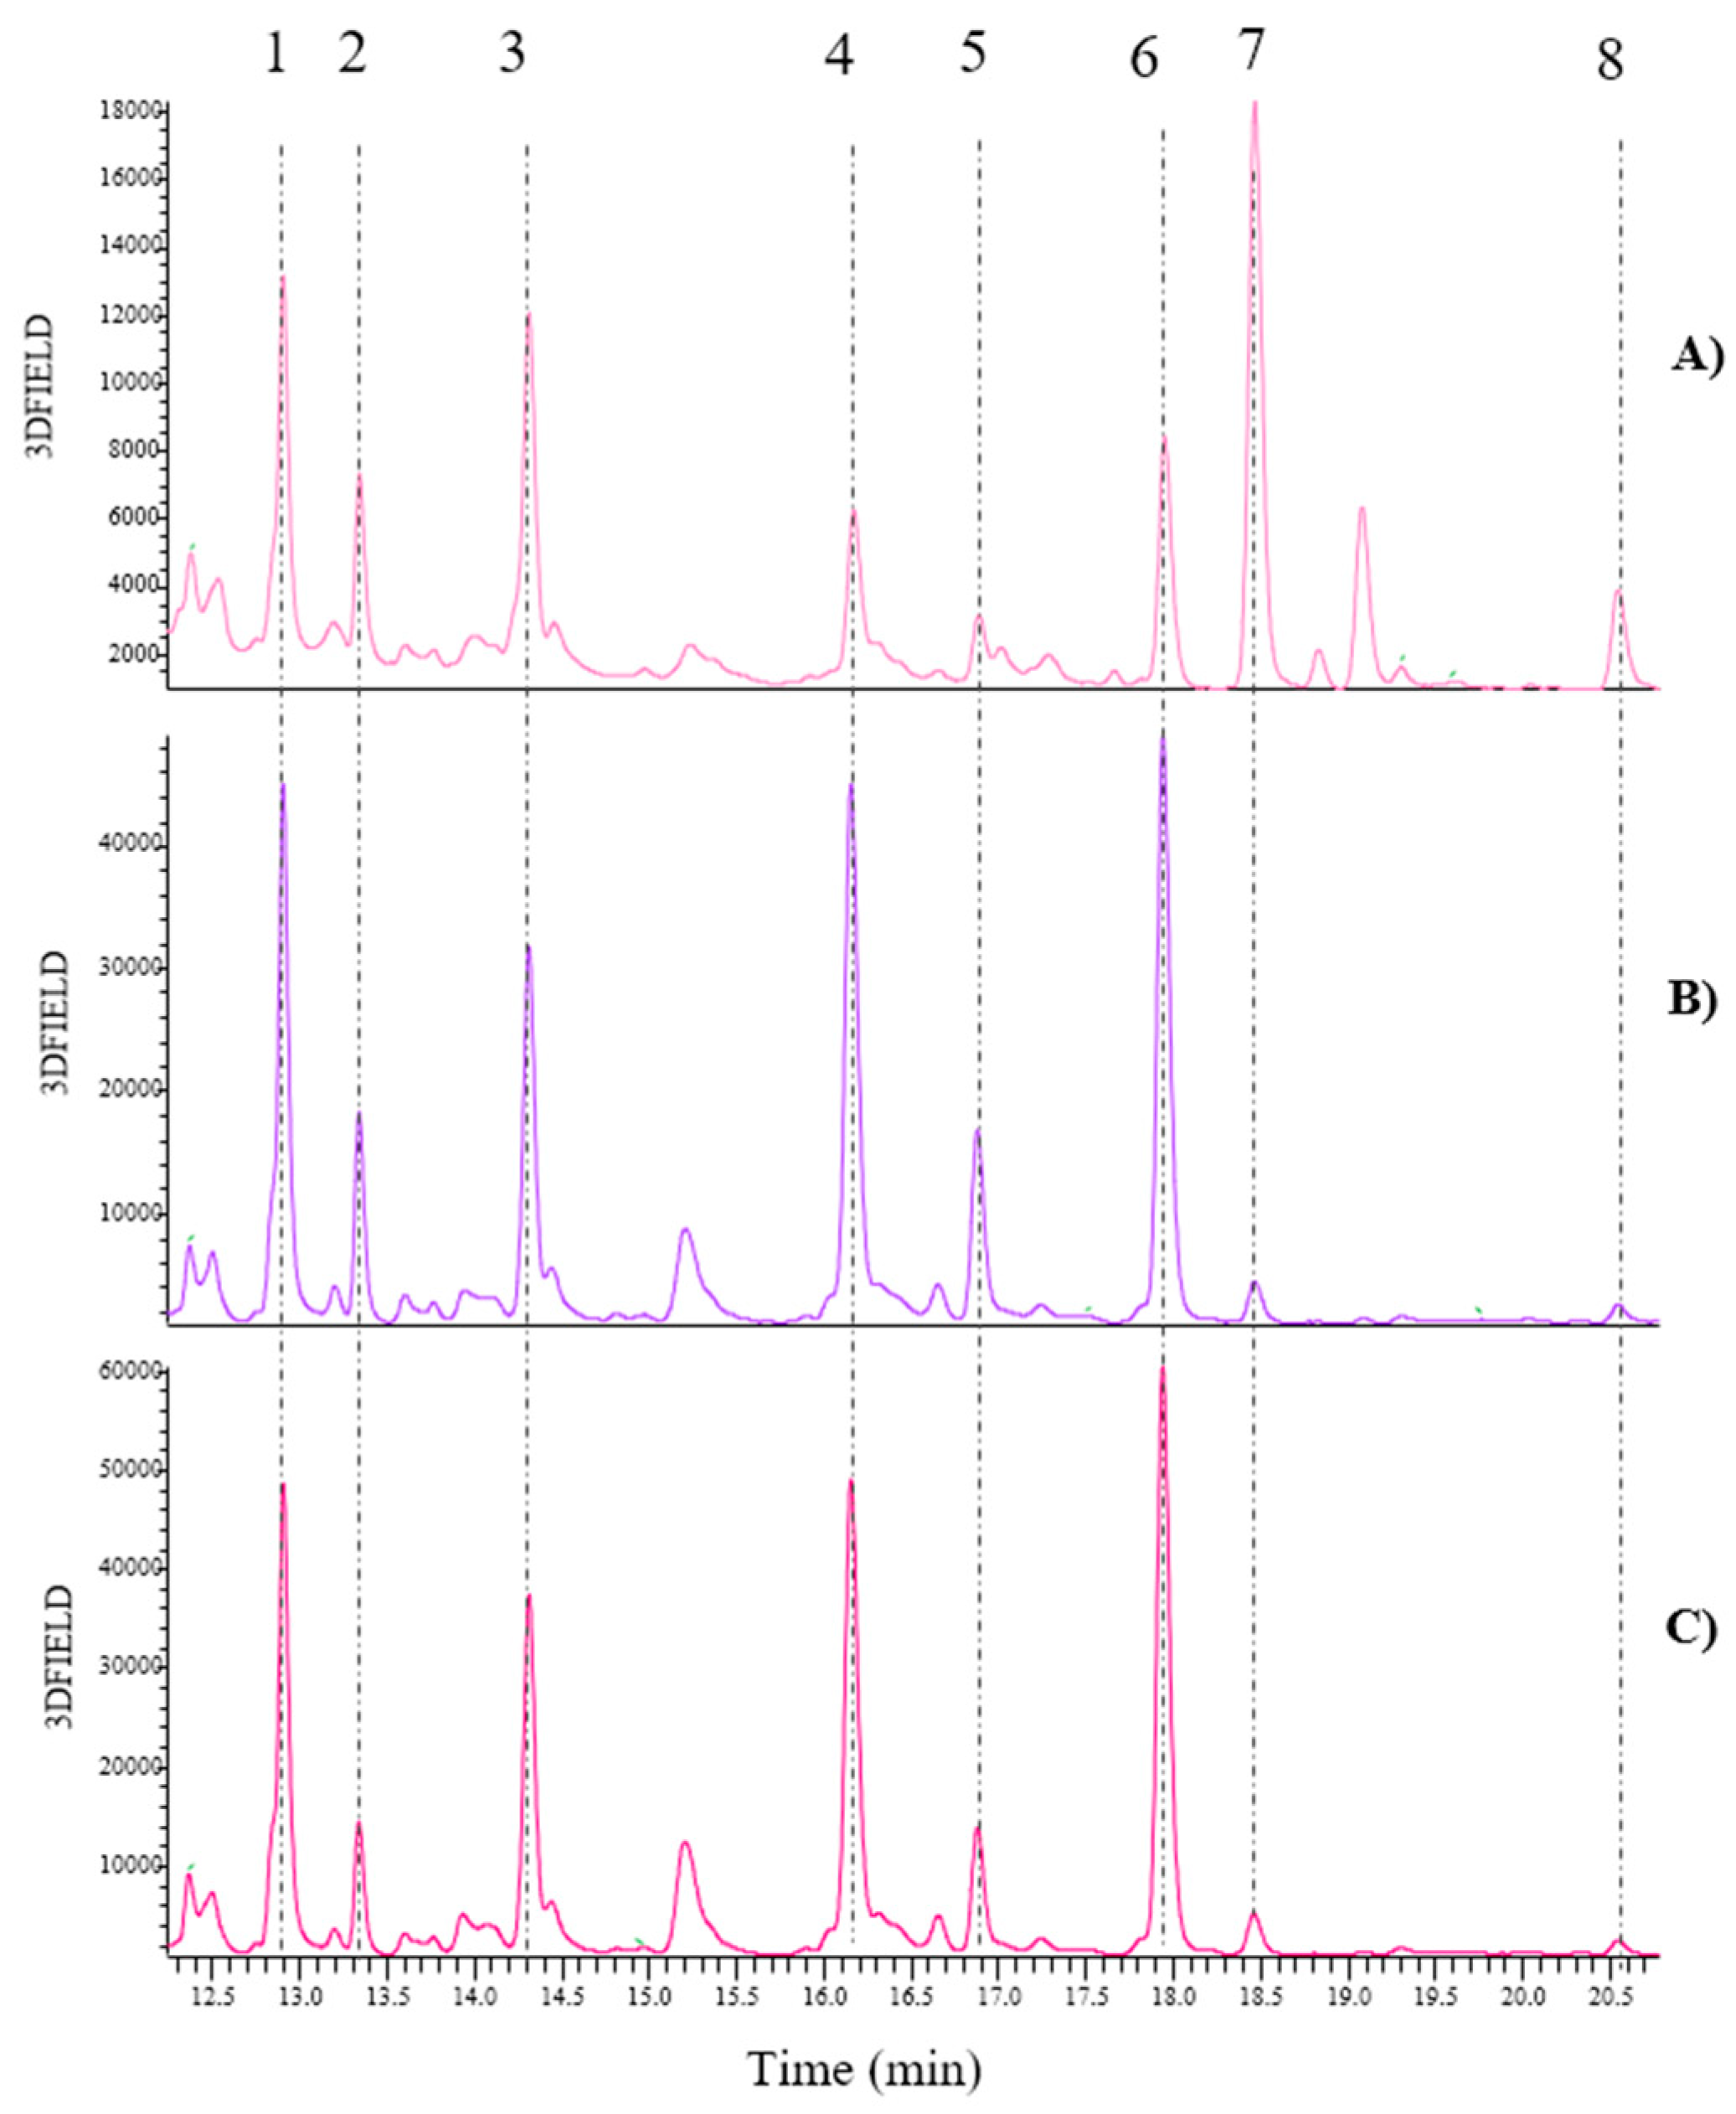
Figure 11 presents a bar graph comparing the data obtained through semi-quantitative analysis of soy samples. From a qualitative standpoint, it was previously established that there were no notable differences in the types of polyphenols present between the seeds, and the by-product. However, the semi-quantitative analysis revealed that the content of the identified isoflavones exhibited variation between the seeds and the by-product. In general, all glucoside isoflavones are more concentrated in the seeds, while aglycone isoflavones, such as Daidzein (peak 7) and Genistein (peak 8) are more concentrated in the by-product (Figure 11). This is a particularly noteworthy outcome, given that Malonyl glucosides and β-glucosides are widely acknowledged as the predominant forms present in soy. These compounds may undergo transformation into aglycones as a consequence of thermal stress during the processing stage, with the resulting aglycones then retained in the by-product due to their lower water solubility [17]. Furthermore, glucoside derivatives, which are highly present in soy seeds, can be extracted into soy milk, thereby reducing their concentration in the by-product.
4. Discussion
Green beans represent the ‘youngest’ stage in bean ripening and for this reason, it was interesting to observe any similarities or differences in the type of polyphenols they contain. Comparing beans and green beans shows that the polyphenol content is totally different. Indeed, green bean by-products contain glycosidic flavonols (see Table 3), whereas beans do not contain flavonols, but ferulic acid derivatives (see Table 4). This difference could be attributable to the fact that plants produce various substances, including polyphenols, during ripening to protect themselves from environmental stresses and pathogens [18,19]. Indeed, the existing literature confirms that heat affects the degradation of flavonols [20]. For instance, it has been demonstrated that the application of heat can result in the degradation of rutin, leading to the formation of a mixture comprising Protocatechuic acid and other degradation derivatives with a reduced antioxidant activity [20]. In light of these results, it can be hypothesised that in green beans, which represent the earliest and therefore most vulnerable stage of ripening, polyphenols with higher antioxidant activity, such as flavonols, are present. Conversely, beans exhibit a greater presence of polyphenols with lower antioxidant activity, such as phenolic acids. Once they have reached maturity, beans have a reduced need to actively defend themselves and therefore produce fewer substances. Additionally, it is essential to consider that the mature plant will have endured adverse weather conditions, such as drought or extreme temperatures, which may have caused a degradation of the polyphenol structure, leading to the formation of phenolic acids.
Still following the results obtained for green bean by-products, the comparison between cooked and fresh by-products was carried out in order to observe whether the cooking process affected the polyphenol content. The most striking example, both qualitatively and semi-quantitatively, concerns green beans. Since green beans generally contain predominantly glycosidic flavonols, including the cooked by-product, it was expected to find the corresponding flavonol aglycons in the fresh by-product. In fact, chemical reactions generally occur during cooking that can transform some polyphenols into other forms, making them more stable or more easily absorbed. For example, cooking may favor the formation of compounds such as glycosylated flavonoids, which are more easily absorbed than flavonoid aglycons. In reality, the results obtained disproved this hypothesis. Glycosylated flavonols are not present in either fresh or cooked by-products. However, one difference emerged from the semi-quantitative analysis: some glycosidic flavonols were found to be higher in the cooked by-product (Figure 7). It was therefore hypothesized that in fresh green beans polyphenols are bound to other molecules or trapped within the plant cells. Probably, cooking altered the cell structure, releasing these compounds and making them more easily available [12]. In contrast, in the case of bean by-products, which do not contain glycosidic flavonols but derivatives of ferulic acid, a different pattern was observed between cooked and fresh by-products. Indeed, no notable dissimilarities were identified in the semi-quantitative analysis between cooked and fresh bean by-products, as was observed for green beans. Moreover, in general, all the legume samples showed no significant differences in terms of antioxidant activity. In the case of the bean and soy samples, it was interesting to observe that the by-products present a TAS value comparable to that of the final products, for beans, and seeds, for soy. This is in accordance with the extract yield (%) and the TPC values. In contrast, in the case of the bean by-products, a slight trend difference was observed between the TAS and TPC values. For example, GB-Li-Fr-ByP is the sample with the highest TPC compared to the others of the same species, but this was not confirmed by the TAS values. This could be due to the different antioxidant capacities of the individual polyphenols. Indeed, the chemical structure of polyphenols is linked to a higher free radical scavenging capacity [21]. Furthermore, according to the results obtained and discussed, even a higher extraction yield (%) does not necessarily correlate with a proportional increase in the content of phenolic compounds. This observation applies to all by-products of green beans, which have a high yield but no correlated TPC, and to conventional soy seeds.
Of particular interest was the high protein content in all the analyzed legumes. Specifically, the soy by-product showed a higher content than the other samples. This characteristic is extremely interesting as legume proteins represent an added value for sports people. Indeed, legume proteins have several beneficial properties as they enable muscle growth and repair, especially after training. Legume proteins offer several advantages over other protein sources. They contain all the essential amino acids necessary for building muscle protein, are slow to digest, represent a source of fiber, and contain low levels of saturated lipids [22]. For this reason, it would be appropriate to address the use of these proteins from the waste products of legumes in the formulation of food supplements for athletes.
5. Conclusions
In conclusion, all the analyses carried out in this research have confirmed that legumes, green beans and soy waste materials are rich in bioactive molecules. The results from the experiments conducted have highlighted the opportunity to obtain ingredients suitable for formulating both nutraceuticals and food supplements from the studied by-products. The advanced UHPLC-DAD-MSn method was used to characterize the samples' polyphenol content, allowing for qualitative analysis of legume samples, especially when they were not corresponding to standards. The analysis confirmed that legume by-products contain a wide range of valuable polyphenols due to their biological properties, highlighting their potential for use. For instance, beans contain Feruloyl glucaric acid derivatives with anticholesterolemic activity [23], green beans contain Quercetin glucuronide with anti-vascular effects [24], and soy isoflavones can be utilized for treating menopausal symptoms [16], including osteoporosis. In addition, all legumes proved to be sources of proteins, with concentrations comparable or higher than those obtained from the final product as in the case of beans. Furthermore, the soy by-product was even found to have a higher protein content than seeds. The findings of this study mark the initial stage in advancing a circular economy approach, in which the agri-food sector could utilize waste materials to create new sustainable ingredients. These ingredients can serve as alternatives to traditional ones to be utilized in the nutraceutical and food supplement industries. The content of identified polyphenols will be further investigated through quantitative analysis in the future. The results obtained from the experiments indicate that the studied by-product extracts could be used as active ingredients for nutraceuticals and food supplements. These active ingredients could help in treating or reducing the risk of certain diseases in nutraceutical products, and in compensating for micro or macronutrient deficiencies in food supplements. Therefore, it is reasonable to consider using polyphenol extracts for nutraceutical formulations due to their antioxidant properties and using proteins for the preparation of food supplements.
Author Contributions
Conceptualization, V.A.; Validation, C.T. and G.B.; Formal analysis, C.T. and G.B.; Data curation, C.T. and G.B.; Writing—original draft, C.T. and G.B.; Writing—review & editing, V.A., S.M., and F.M.; Supervision, VA, S.M. Project administration, V.A. All authors have read and agreed to the published version of the manuscript.
Funding
Thanks are due to Fruttagel S.p.A. (Alfonsine, RA Italy) for supplying samples and Valpharma International S.p.A. (Pennabilli, RN, Italy) for the interest in this project and fruitful discussion. This project was also supported by the University of Bologna, CIRI-MAM and UniRimini SpA.
Conflicts of Interest
“The authors declare no conflicts of interest.”
References
- Tackling food loss and waste: A triple win opportunity. Newsroom. https://www.fao.org/newsroom/detail/FAO-UNEP-agriculture-environment-food-loss-waste-day-2022/en (accessed 2024-08-28).
- Panzella, L.; Moccia, F.; Nasti, R.; Marzorati, S.; Verotta, L.; Napolitano, A. Bioactive Phenolic Compounds From Agri-Food Wastes: An Update on Green and Sustainable Extraction Methodologies. Frontiers in Nutrition 2020, 7.
- Campos, D. A.; Gómez-García, R.; Vilas-Boas, A. A.; Madureira, A. R.; Pintado, M. M. Management of Fruit Industrial By-Products—A Case Study on Circular Economy Approach. Molecules 2020, 25 (2), 320. [CrossRef]
- Osorio, L. L. D. R.; Flórez-López, E.; Grande-Tovar, C. D. The Potential of Selected Agri-Food Loss and Waste to Contribute to a Circular Economy: Applications in the Food, Cosmetic and Pharmaceutical Industries. Molecules 2021, 26 (2), 515. [CrossRef]
- Baiano, A. Recovery of Biomolecules from Food Wastes — A Review. Molecules 2014, 19 (9), 14821–14842. [CrossRef]
- Li, A.-N.; Li, S.; Zhang, Y.-J.; Xu, X.-R.; Chen, Y.-M.; Li, H.-B. Resources and Biological Activities of Natural Polyphenols. Nutrients 2014, 6 (12), 6020–6047. [CrossRef]
- Montanari, S.; Davani, L.; Tumiatti, V.; Dimilta, M.; Gaddi, A. V.; De Simone, A.; Andrisano, V. Development of an UHPLC-Diode Arrays Detector (DAD) Method for the Analysis of Polydatin in Human Plasma. Journal of Pharmaceutical and Biomedical Analysis 2021, 198, 113985. [CrossRef]
- Castrica, M.; Rebucci, R.; Giromini, C.; Tretola, M.; Cattaneo, D.; Baldi, A. Total Phenolic Content and Antioxidant Capacity of Agri-Food Waste and by-Products. Italian Journal of Animal Science 2019, 18 (1), 336–341. [CrossRef]
- Terenzi, C.; Bermudez, G.; Medri, F.; Davani, L.; Tumiatti, V.; Andrisano, V.; Montanari, S.; De Simone, A. Phenolic and Antioxidant Characterization of Fruit By-Products for Their Nutraceuticals and Dietary Supplements Valorization under a Circular Bio-Economy Approach. Antioxidants 2024, 13 (5), 604. [CrossRef]
- Mesquita, E.; Monteiro, M. Simultaneous HPLC Determination of Flavonoids and Phenolic Acids Profile in Pêra-Rio Orange Juice. Food Research International 2018, 106, 54–63. [CrossRef]
- Abu-Reidah, I. M.; Arráez-Román, D.; Lozano-Sánchez, J.; Segura-Carretero, A.; Fernández-Gutiérrez, A. Phytochemical Characterisation of Green Beans (Phaseolus Vulgaris L.) by Using High-Performance Liquid Chromatography Coupled with Time-of-Flight Mass Spectrometry. Phytochem Anal 2013, 24 (2), 105–116. [CrossRef]
- Lima, G. P. P.; Costa, S. M.; Monaco, K. de A.; Uliana, M. R.; Fernandez, R. M.; Correa, C. R.; Vianello, F.; Cisneros-Zevallos, L.; Minatel, I. O. Cooking Processes Increase Bioactive Compounds in Organic and Conventional Green Beans. Int J Food Sci Nutr 2017, 68 (8), 919–930. [CrossRef]
- Nguyen, T.-K.-O.; Jamali, A.; Grand, E.; Morreel, K.; Marcelo, P.; Gontier, E.; Dauwe, R. Phenylpropanoid Profiling Reveals a Class of Hydroxycinnamoyl Glucaric Acid Conjugates in Isatis Tinctoria Leaves. Phytochemistry 2017, 144, 127–140. [CrossRef]
- Jung, Y. S.; Rha, C.-S.; Baik, M.-Y.; Baek, N.-I.; Kim, D.-O. A Brief History and Spectroscopic Analysis of Soy Isoflavones. Food Sci Biotechnol 2020, 29 (12), 1605–1617. [CrossRef]
- Lee, M. J.; Chung, I.-M.; Kim, H.; Jung, M. Y. High Resolution LC–ESI-TOF-Mass Spectrometry Method for Fast Separation, Identification, and Quantification of 12 Isoflavones in Soybeans and Soybean Products. Food Chemistry 2015, 176, 254–262. [CrossRef]
- Miadoková, E. Isoflavonoids — an Overview of Their Biological Activities and Potential Health Benefits. Interdisciplinary Toxicology 2009, 2 (4), 211–218. [CrossRef]
- Colletti, A.; Attrovio, A.; Boffa, L.; Mantegna, S.; Cravotto, G. Valorisation of By-Products from Soybean (Glycine Max (L.) Merr.) Processing. Molecules 2020, 25 (9), 2129. [CrossRef]
- Yang, Q.-Q.; Gan, R.-Y.; Ge, Y.-Y.; Zhang, D.; Corke, H. Polyphenols in Common Beans ( Phaseolus Vulgaris L.): Chemistry, Analysis, and Factors Affecting Composition: Common Bean Polyphenols…. Comprehensive Reviews in Food Science and Food Safety 2018, 17 (6), 1518–1539. [CrossRef]
- Davani, L.; Terenzi, C.; Tumiatti, V.; De Simone, A.; Andrisano, V.; Montanari, S. Integrated Analytical Approaches for the Characterization of Spirulina and Chlorella Microalgae. Journal of Pharmaceutical and Biomedical Analysis 2022, 219, 114943. [CrossRef]
- Chaaban, H.; Ioannou, I.; Chebil, L.; Slimane, M.; Gérardin, C.; Paris, C.; Charbonnel, C.; Chekir, L.; Ghoul, M. Effect of Heat Processing on Thermal Stability and Antioxidant Activity of Six Flavonoids. Journal of Food Processing and Preservation 2017, 41 (5), e13203. [CrossRef]
- Rice-Evans, C. A.; Miller, N. J.; Paganga, G. Structure-Antioxidant Activity Relationships of Flavonoids and Phenolic Acids. Free Radical Biology and Medicine 1996, 20 (7), 933–956. [CrossRef]
- Carbonaro, M.; Nucara, A. Legume Proteins and Peptides as Compounds in Nutraceuticals: A Structural Basis for Dietary Health Effects. Nutrients 2022, 14 (6). [CrossRef]
- Walaszek, Z.; Szemraj, J.; Hanausek, M.; Adams, A. K.; Sherman, U. D-Glucaric Acid Content of Various Fruits and Vegetables and Cholesterol-Lowering Effects of Dietary d-Glucarate in the Rat. Nutrition Research 1996, 16 (4), 673–681. [CrossRef]
- Cioffi, E.; Comune, L.; Piccolella, S.; Buono, M.; Pacifico, S. Quercetin 3-O-Glucuronide from Aglianico Vine Leaves: A Selective Sustainable Recovery and Accumulation Monitoring. Foods 2023, 12 (14), 2646. [CrossRef]
Figure 1.
The yield (%) of the extracts obtained by following the method reported by Terenzi et al. [9] of legume by-products (designated as ByP) and final products (designated as FinalP) achieved via UAE. The results represent the mean value of three extractions, with standard deviation (SD) values for the same sample. *** p < 0.005 * p < 0.05. ns = not significant.
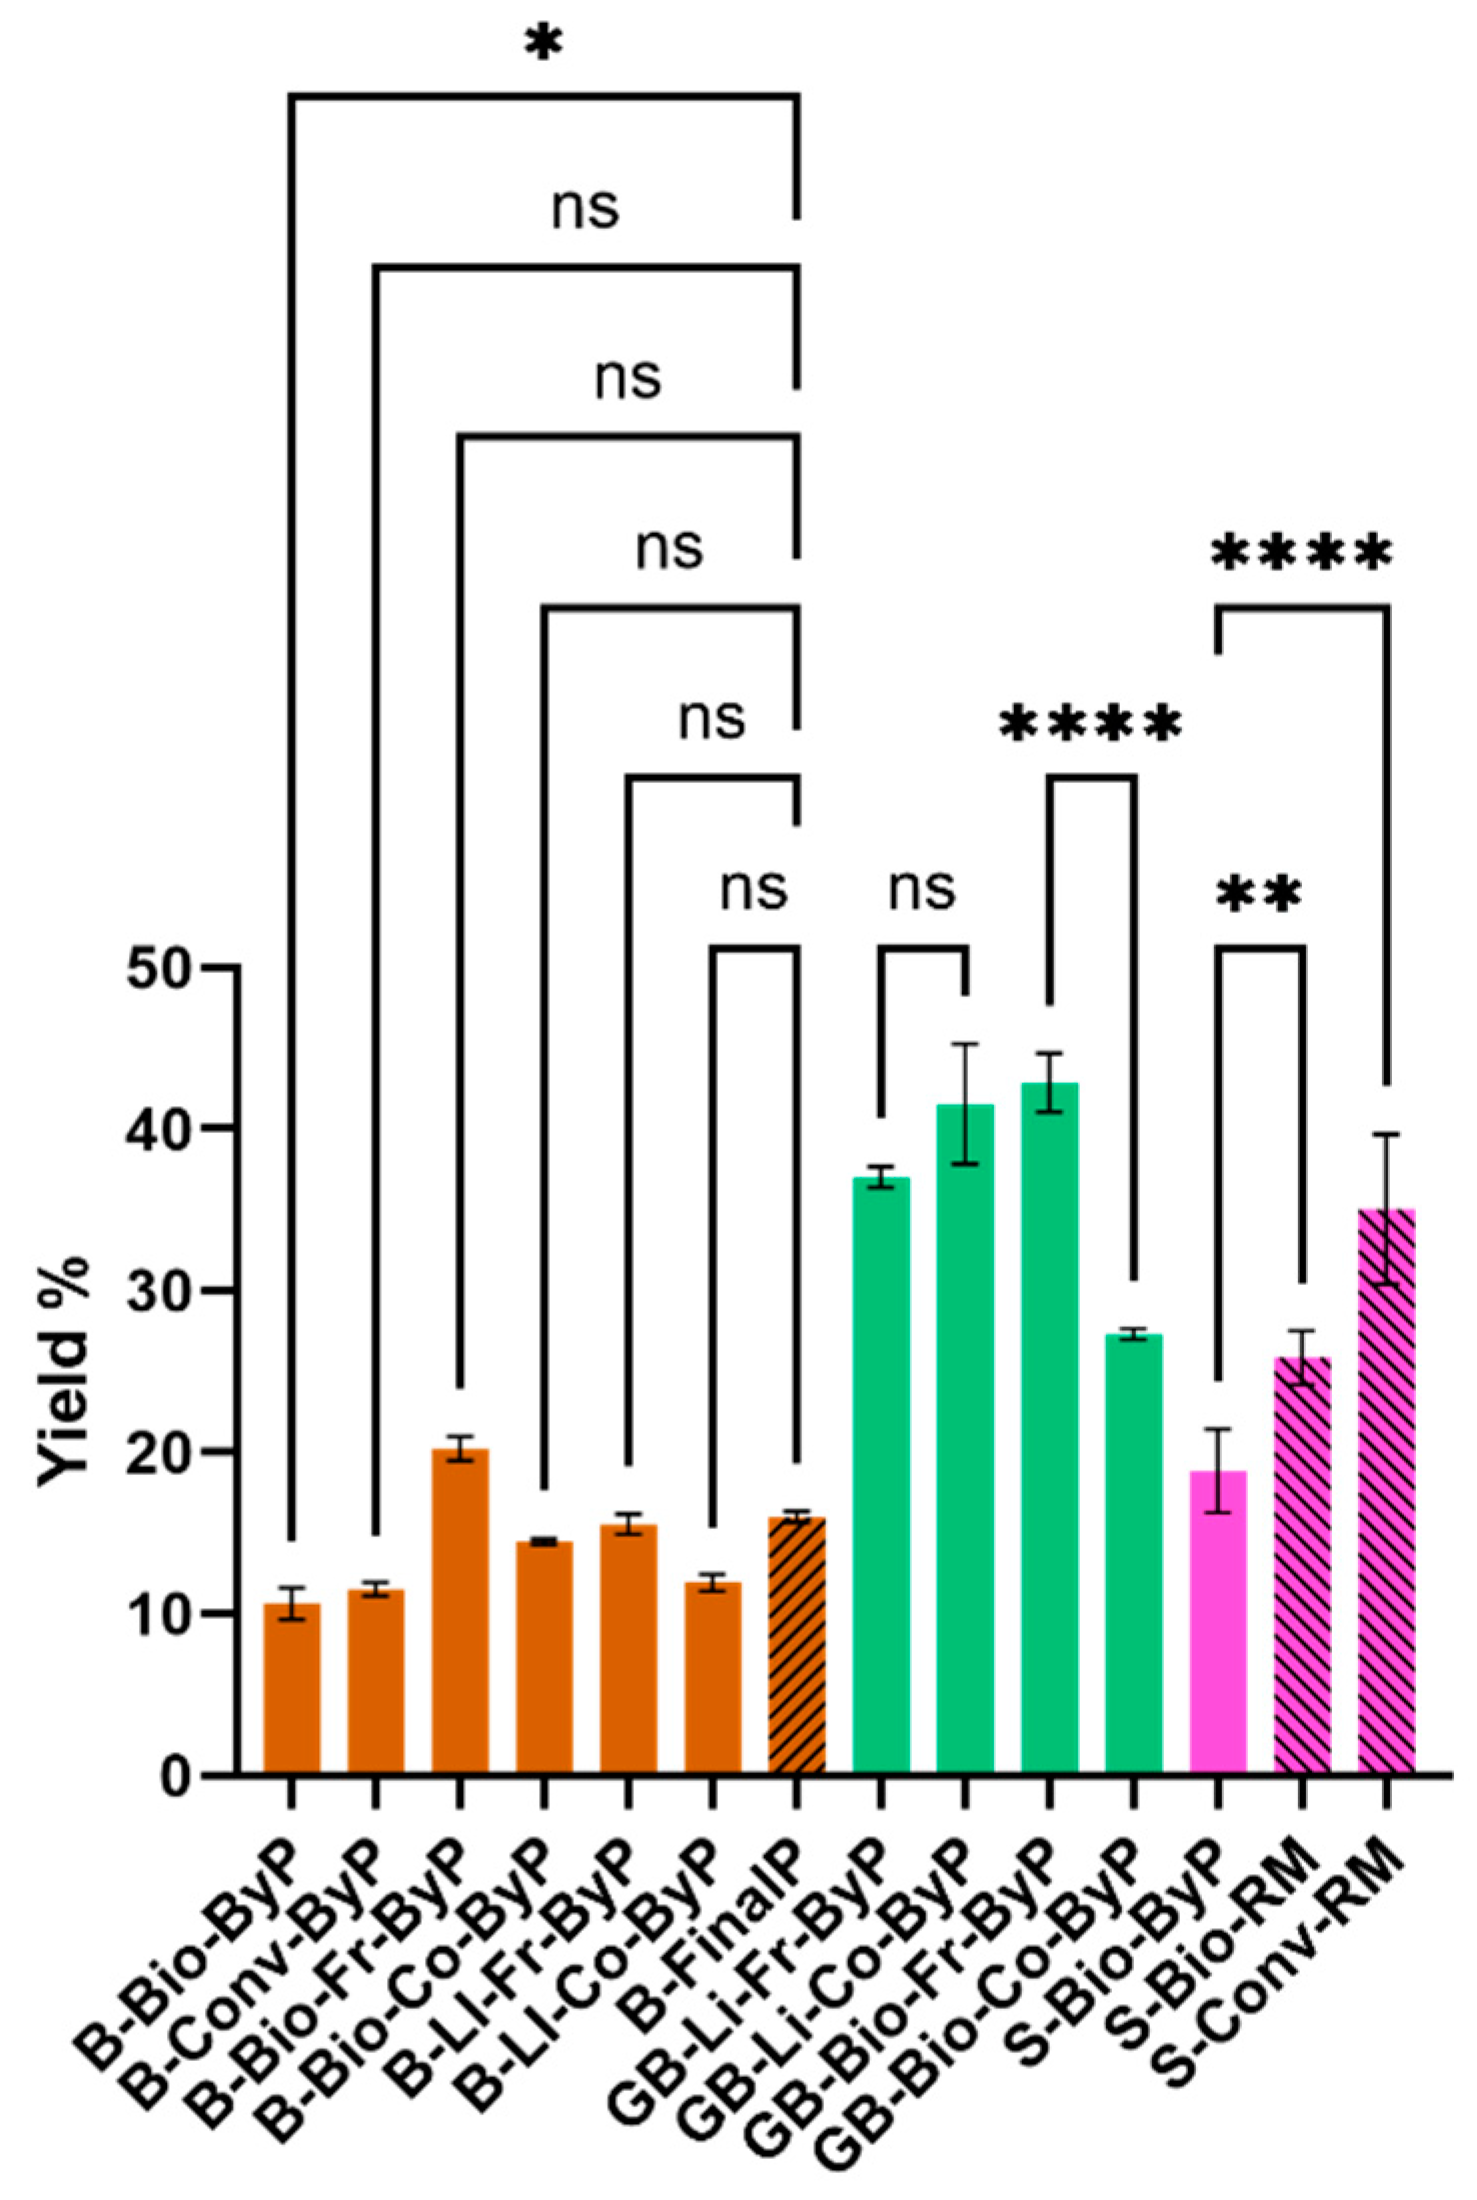
Figure 2.
TPC values obtained by following the method reported by Terenzi et al. [9] of the ByP and FinalP extracts achieved via UAE are presented. The results represent the mean value of three extractions, with SD values for the same sample each analysed in duplicate. *** p < 0.005 * p < 0.05.
Figure 2.
TPC values obtained by following the method reported by Terenzi et al. [9] of the ByP and FinalP extracts achieved via UAE are presented. The results represent the mean value of three extractions, with SD values for the same sample each analysed in duplicate. *** p < 0.005 * p < 0.05.
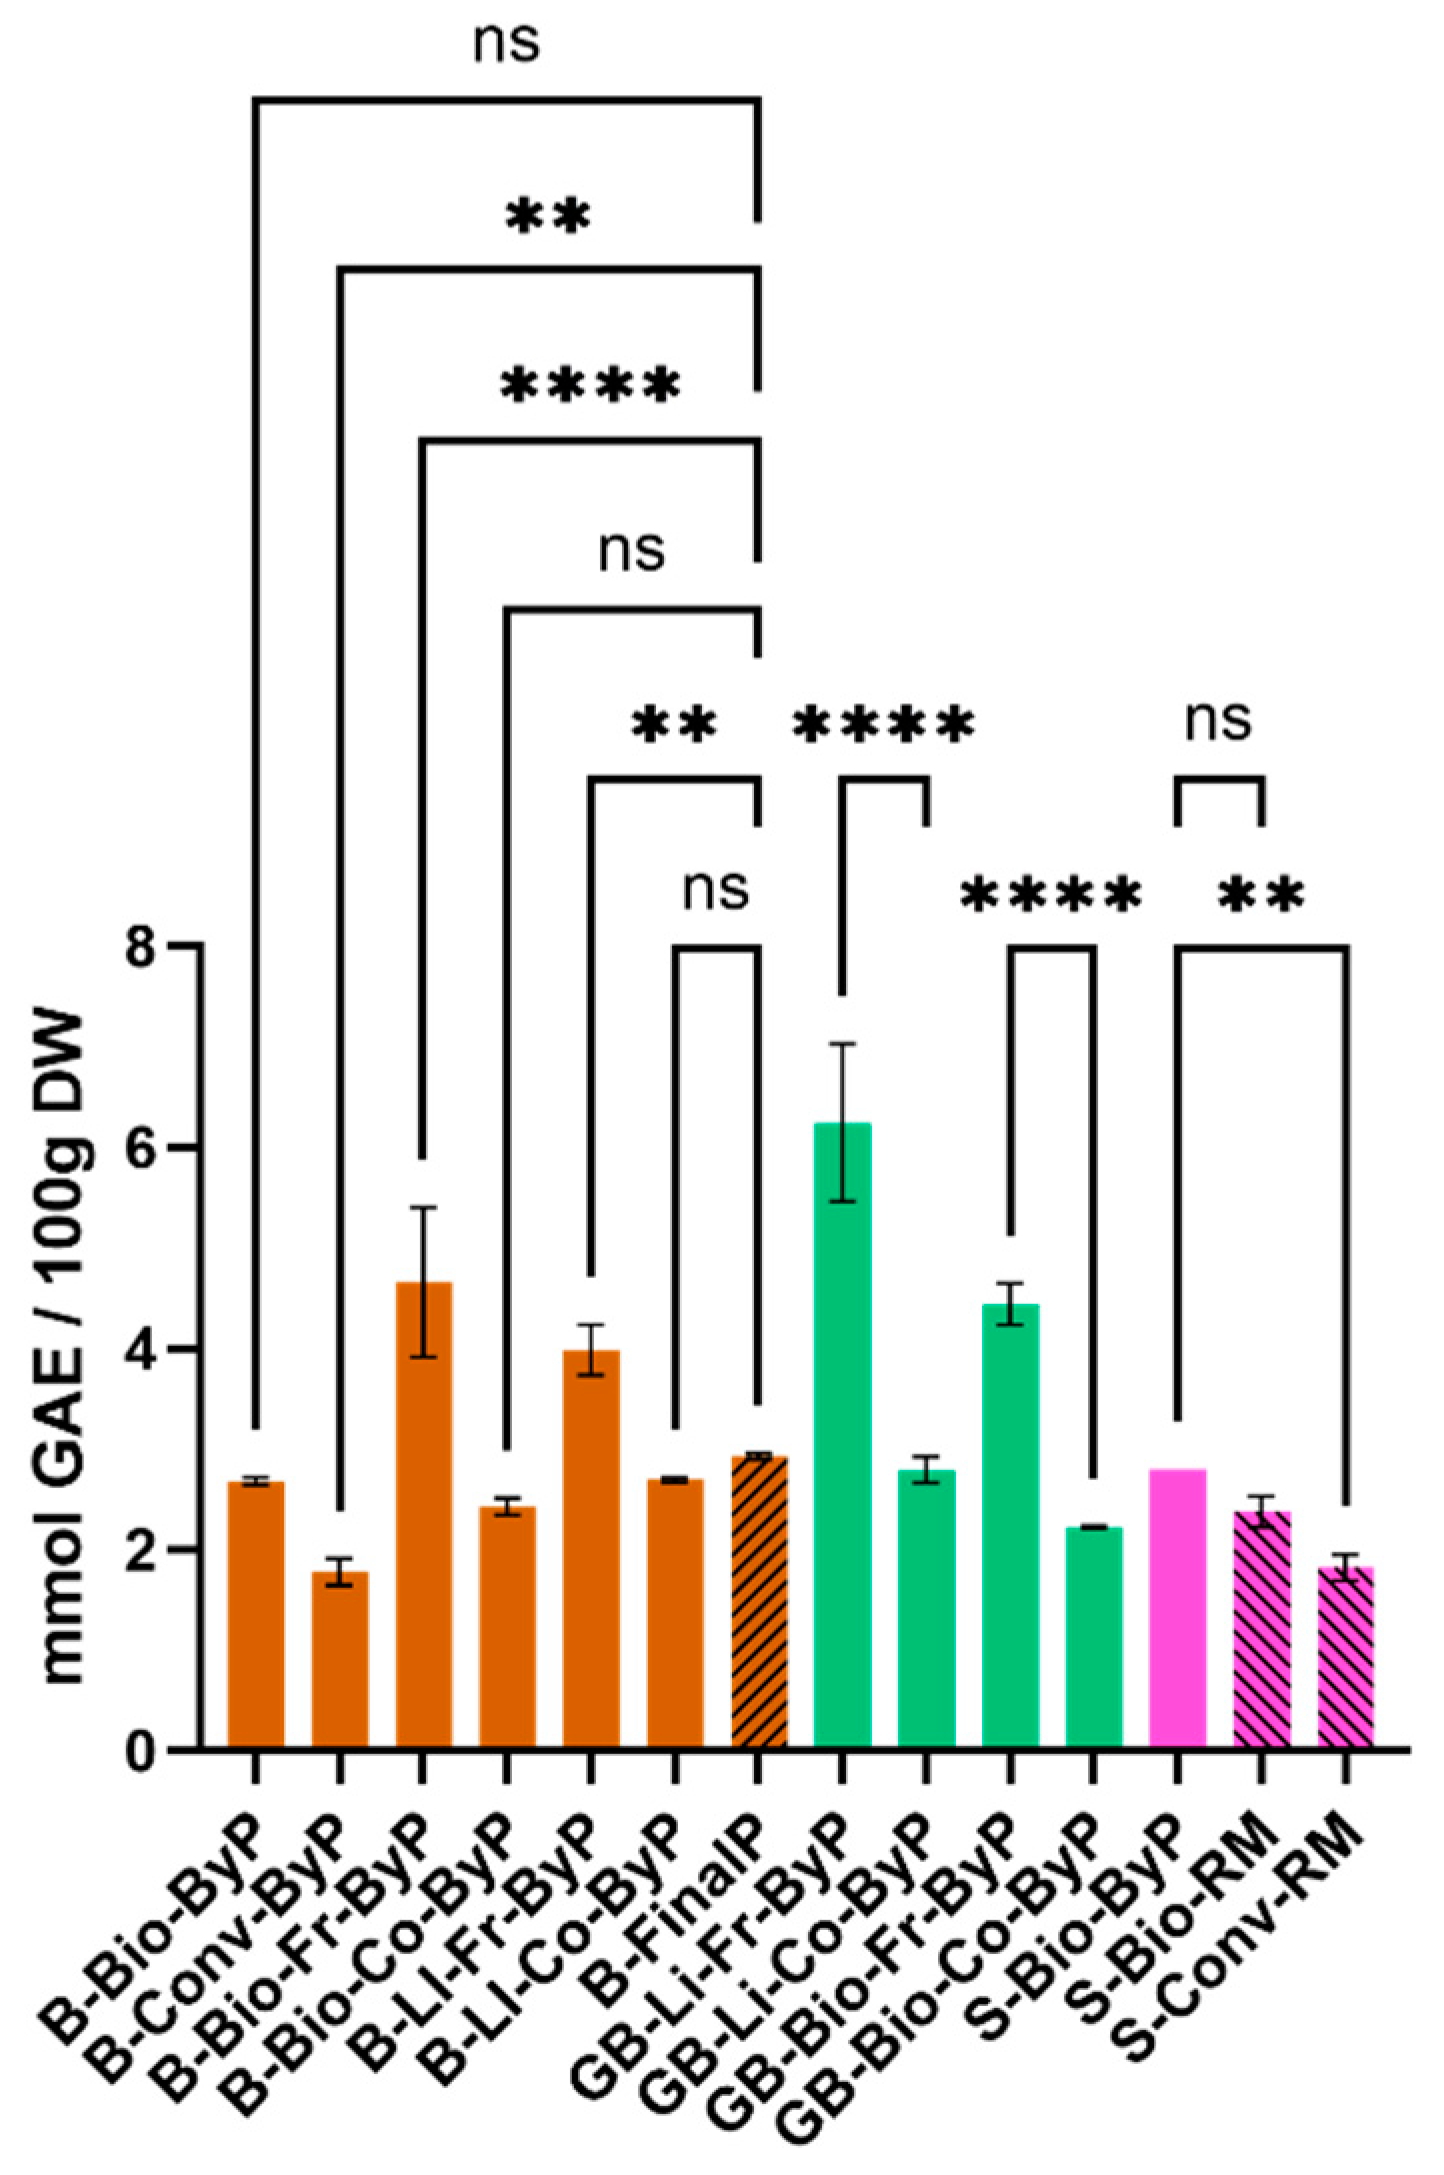
Figure 3.
TAS values obtained by following the method reported by Terenzi et. al. [9] of ByP and FinalP extracts achieved from legume via UAE. The results are the mean value of three extractions ± SD of the same sample each analysed in duplicate. * p < 0.05. ns = not significant.
Figure 3.
TAS values obtained by following the method reported by Terenzi et. al. [9] of ByP and FinalP extracts achieved from legume via UAE. The results are the mean value of three extractions ± SD of the same sample each analysed in duplicate. * p < 0.05. ns = not significant.
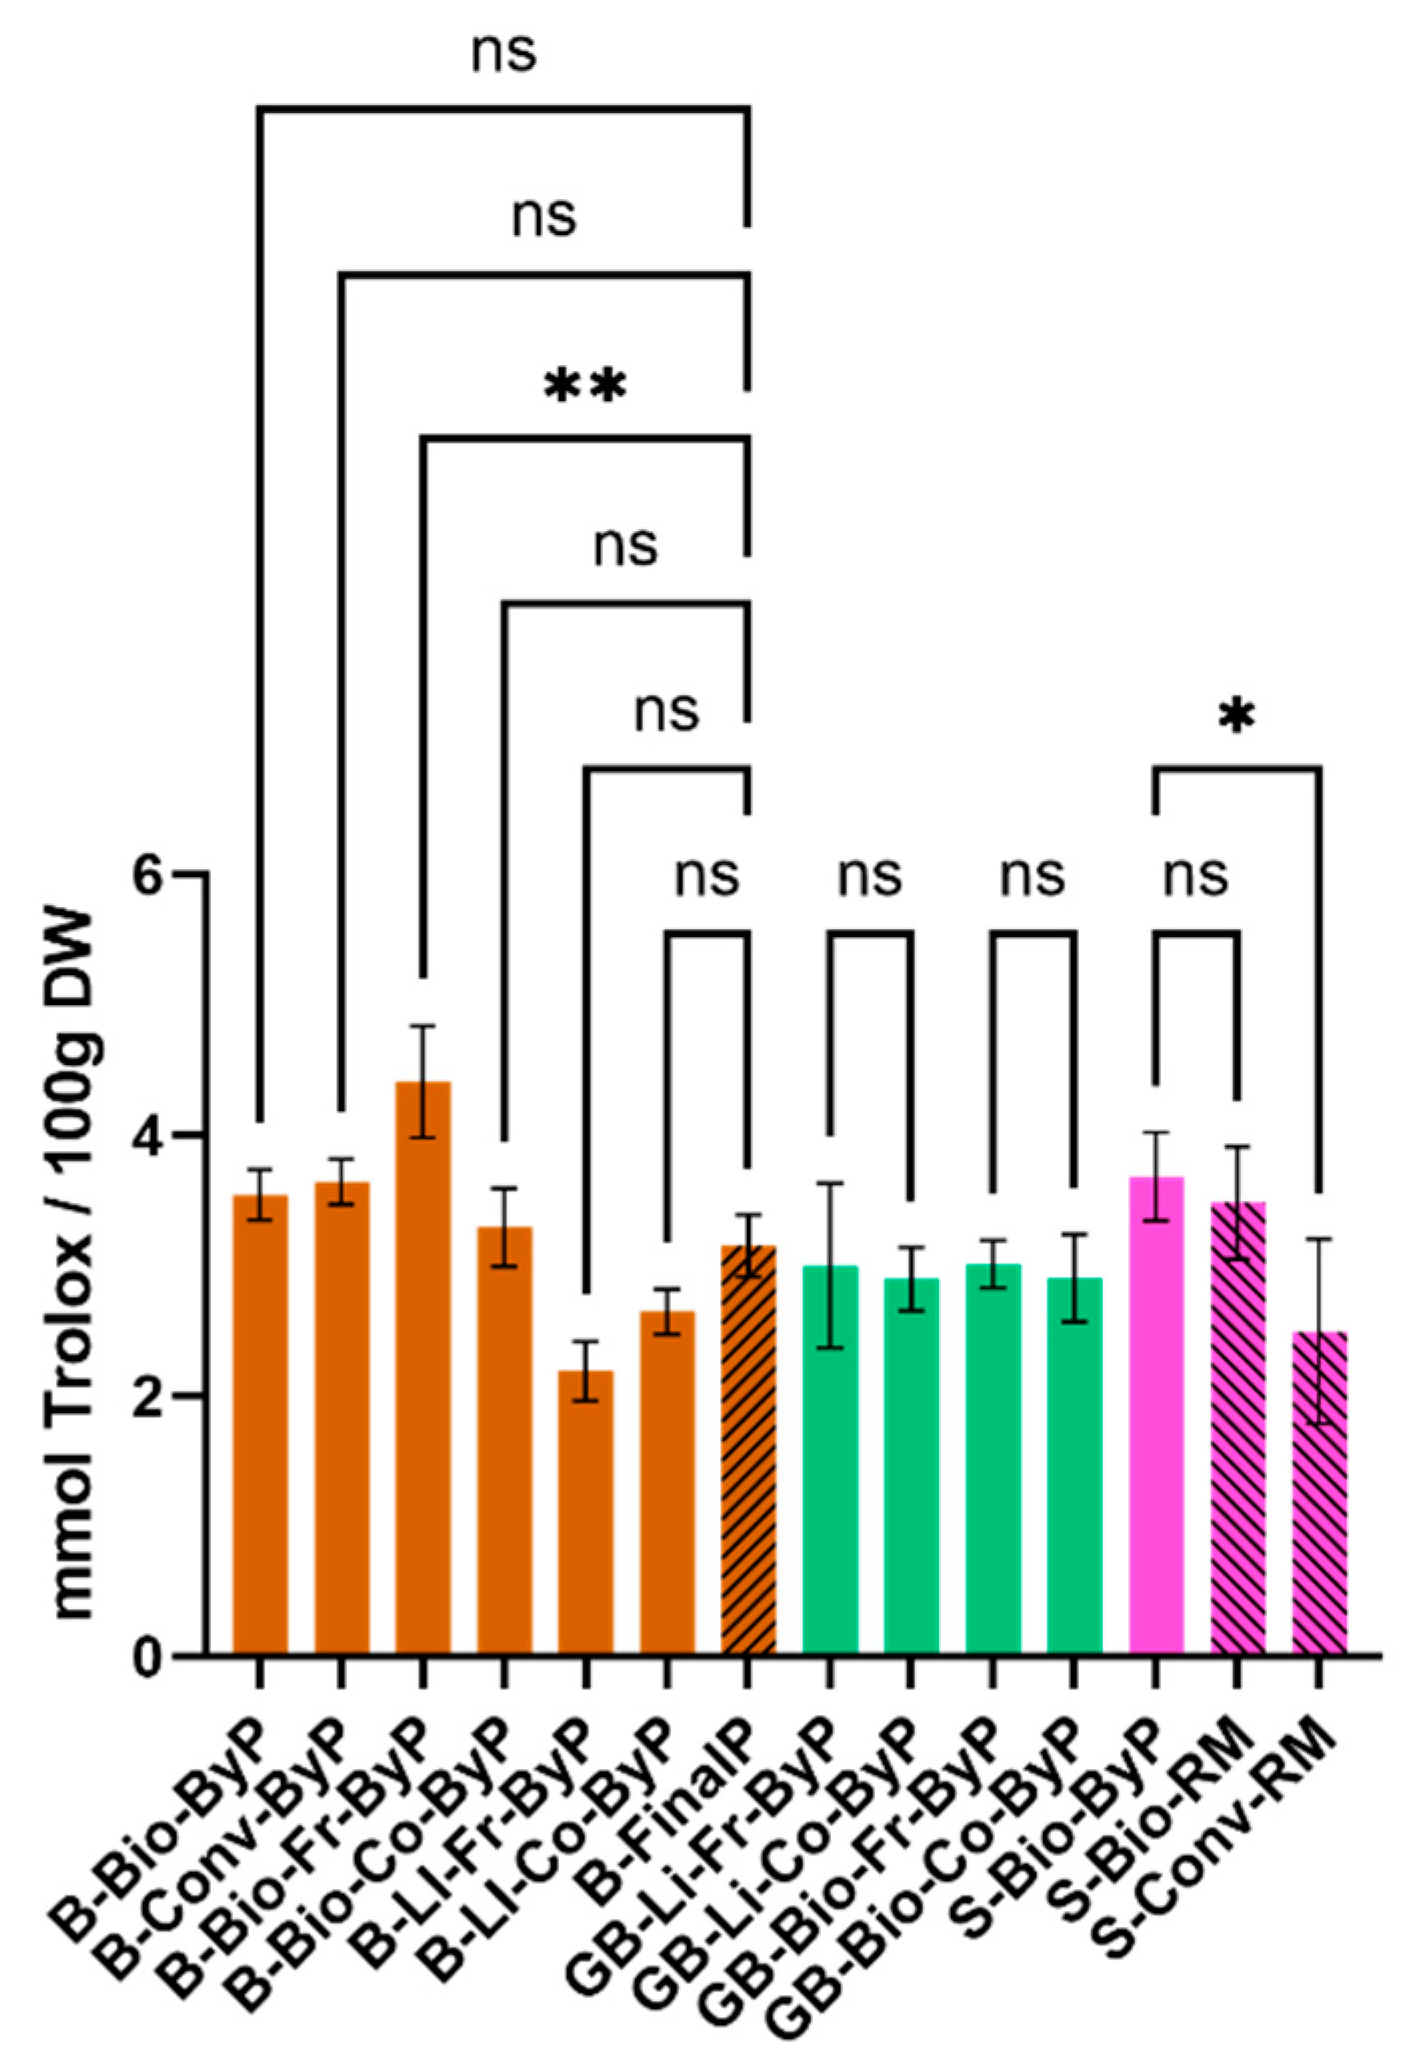
Figure 4.
The protein content was determined using the Kjeldahl method reported by Terenzi et al. 9 for both legume ByP and FinalP. The results are presented as the mean value of two experiments ± SD each analysed in duplicate. *** p < 0.005 * p < 0.05.
Figure 4.
The protein content was determined using the Kjeldahl method reported by Terenzi et al. 9 for both legume ByP and FinalP. The results are presented as the mean value of two experiments ± SD each analysed in duplicate. *** p < 0.005 * p < 0.05.
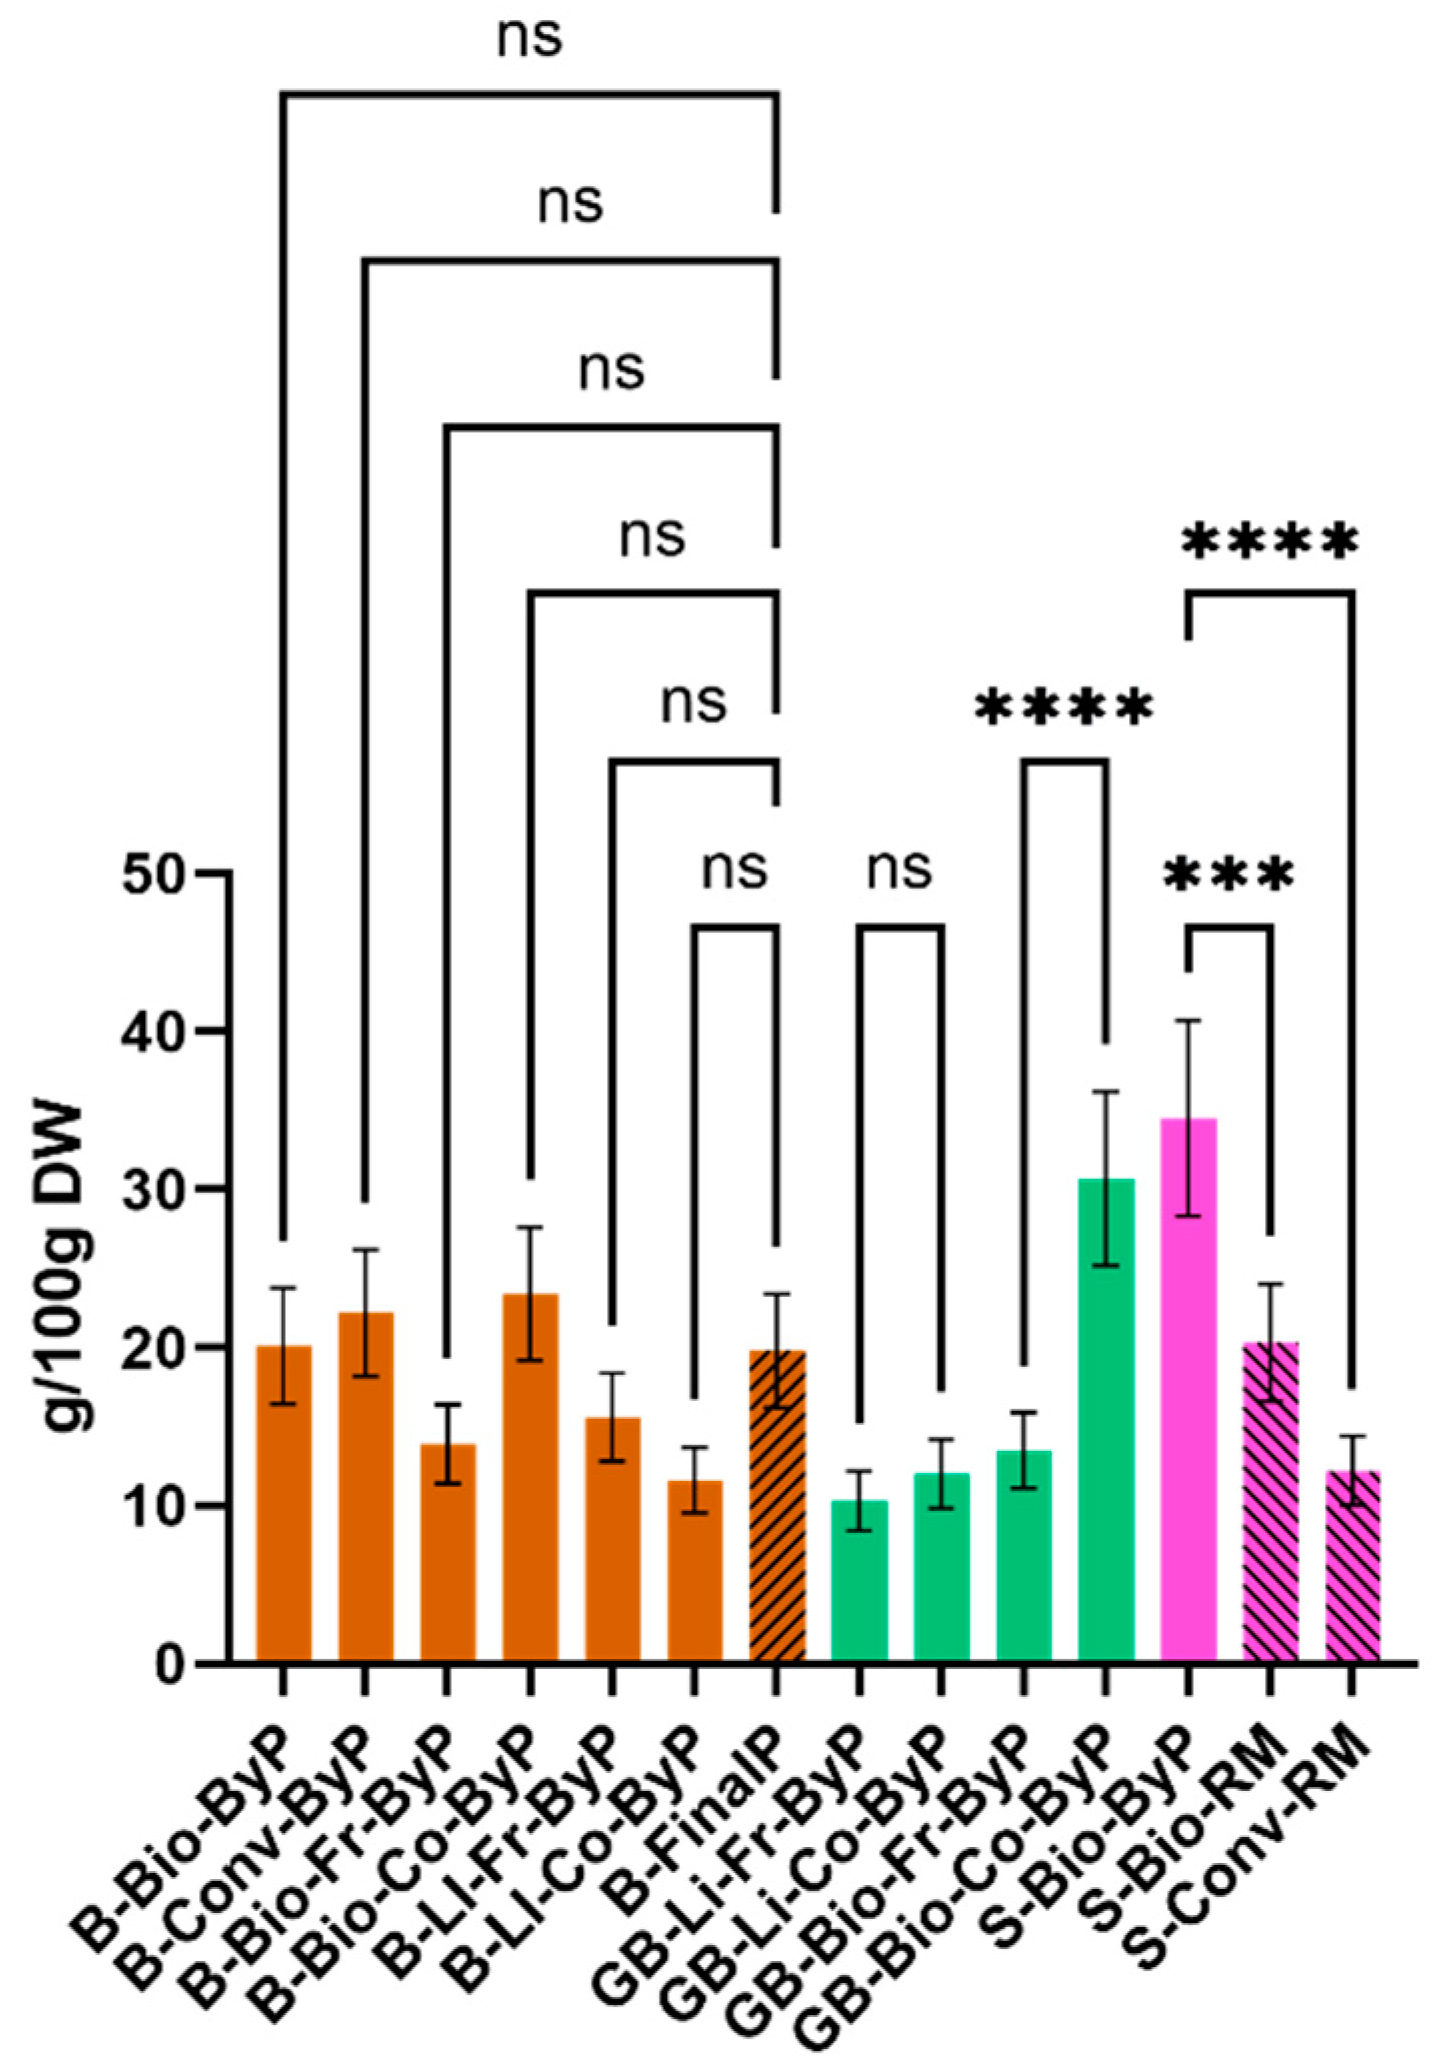
Figure 6.
Comparison of the UHPLC-DAD-ESI-MSn chromatograms recorded at λ= 330 nm of the green bean by-products obtained by following the method reported in par. 2.5; zoom of retention times in the range of 13.98 and 19.42 min; A) GB-Fr-LI-ByP; B) GB-Co-LI-ByP; C) GB-Fr-Bio-ByP; D) GB-Co-Bio-ByP; 1= Quercetin 3-O-xylosylrutinoside; 2= Quercetin 3-O-vicianoside; 3= Kaempferol 3-O-xylosylrutinoside; 4= Quercetin 3-O-glucuronide; 5= Quercetin 3-O-rutinoside (Rutin); 6= Kaempferol 3-O-sambubioside; 7= Kaempferol 3-O-rutinoside; 8= Kaempferol 3-O-glucuronide
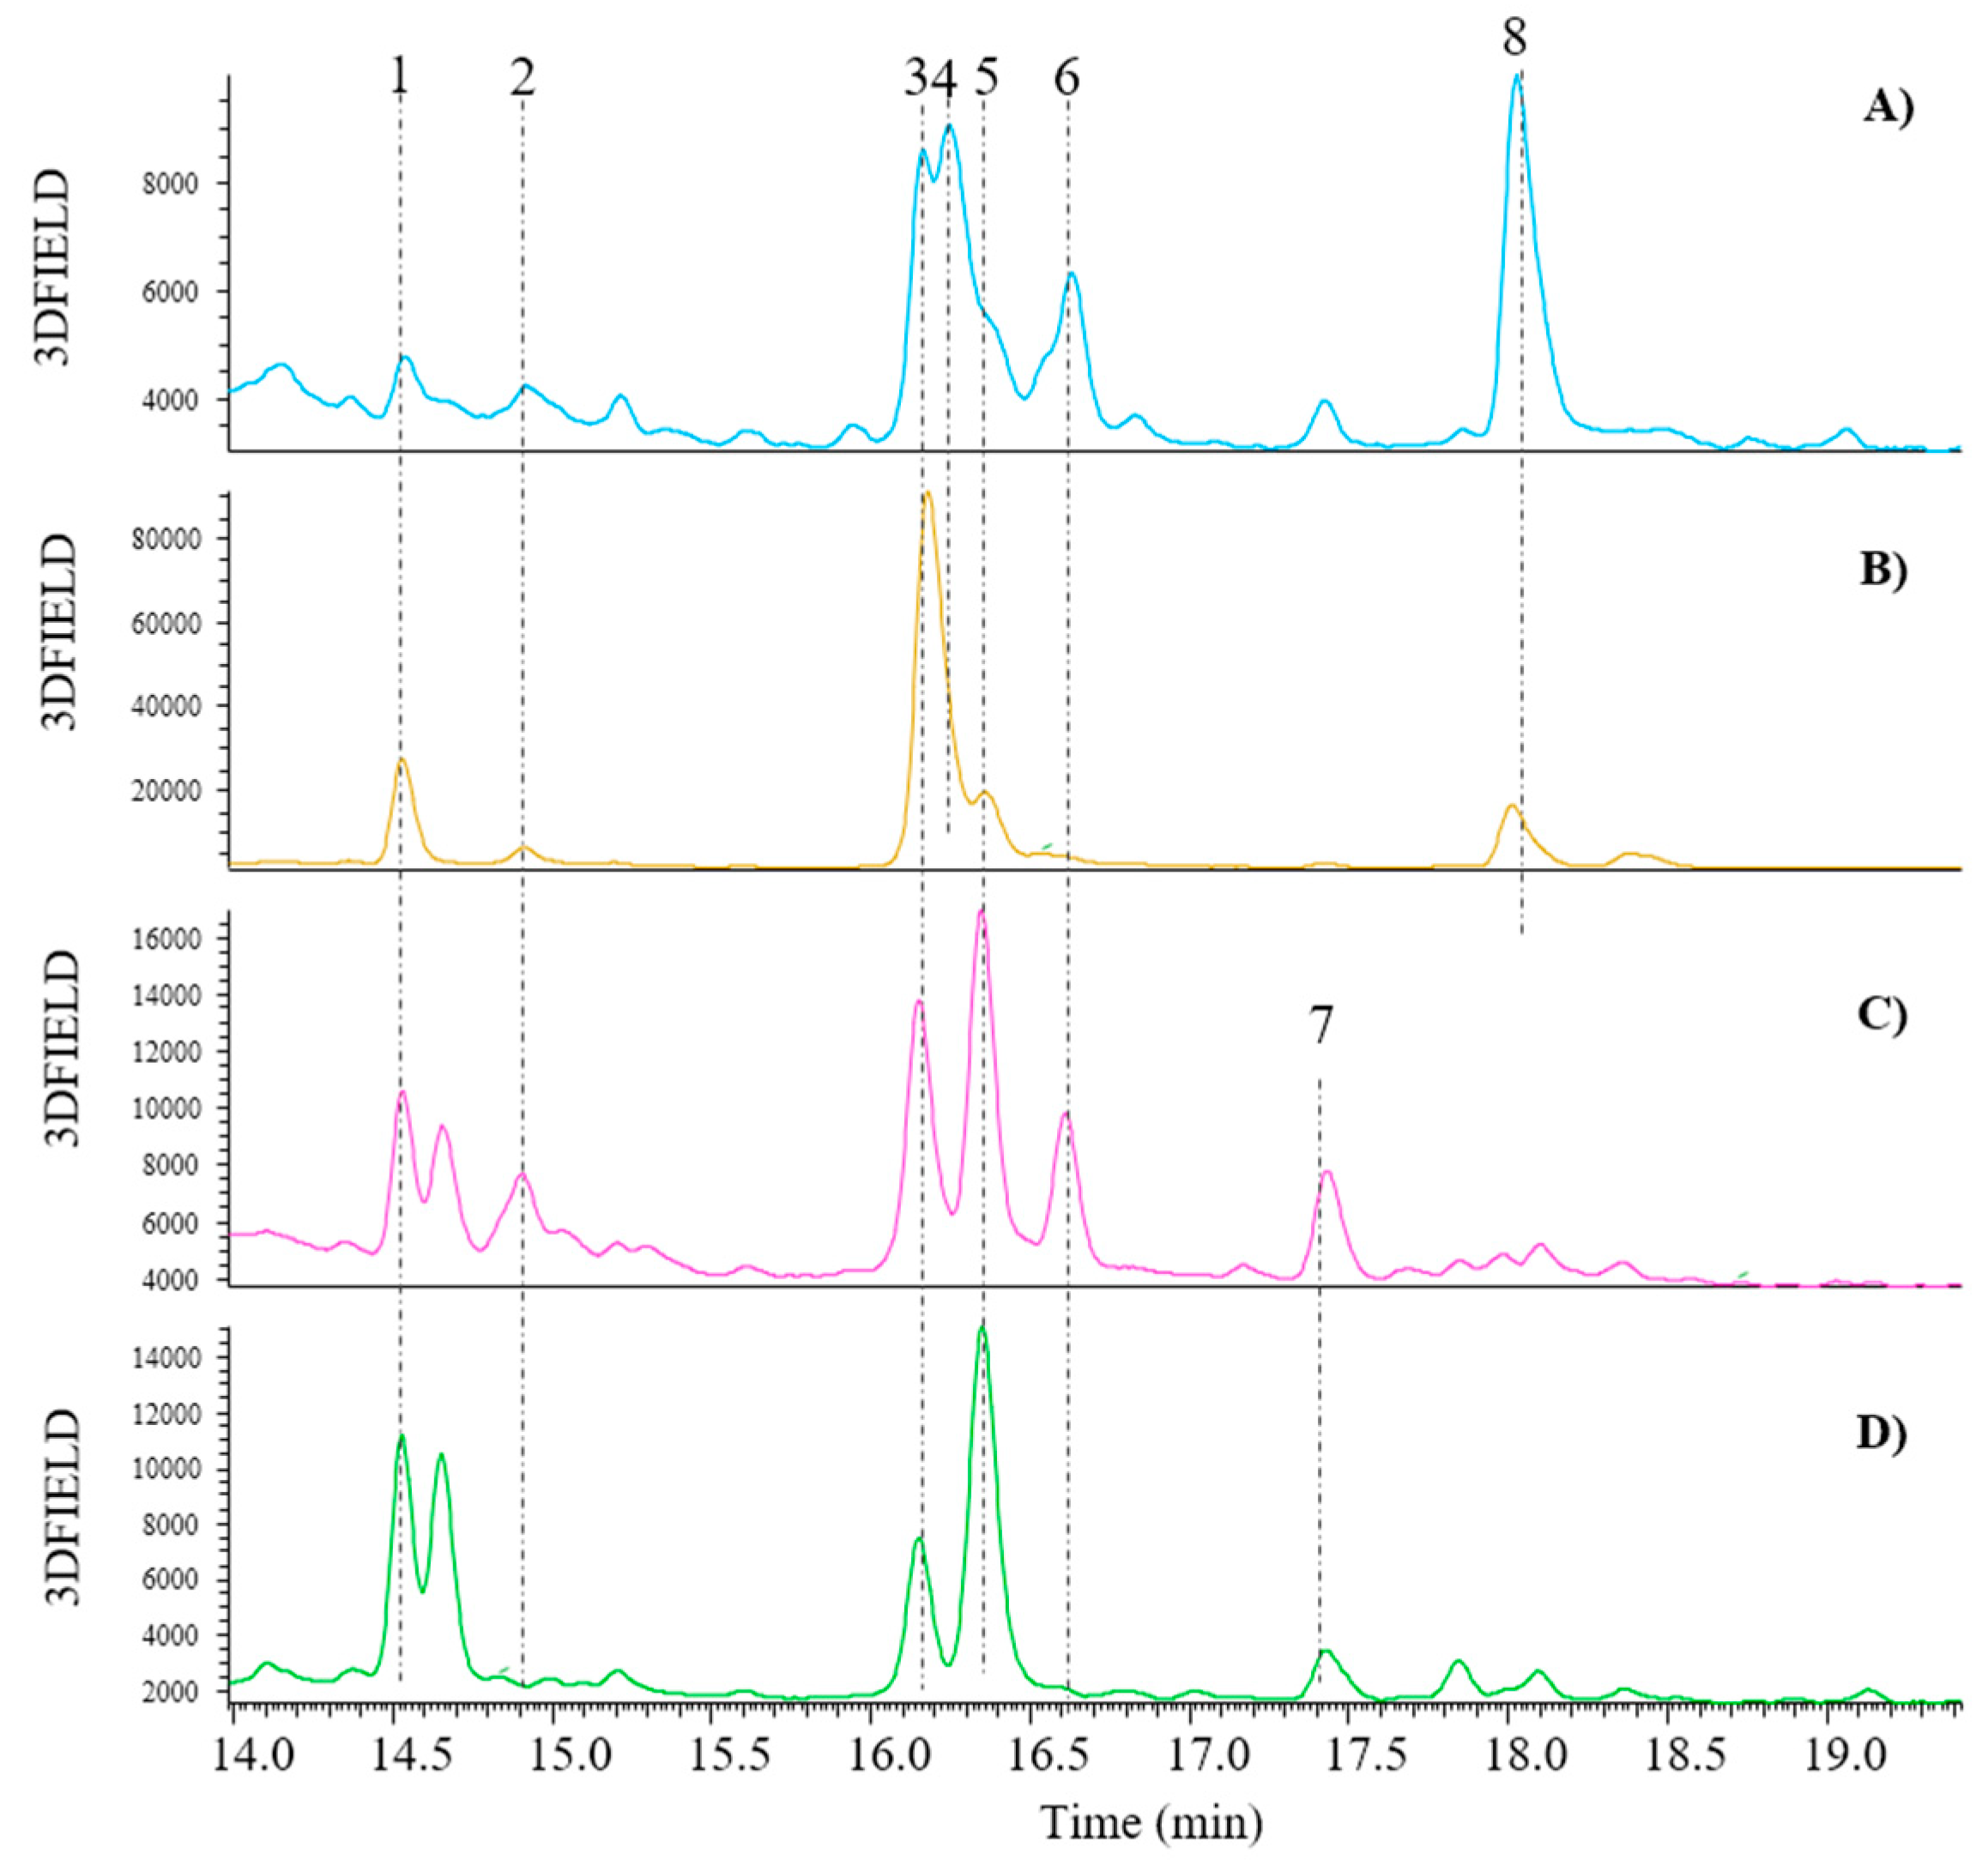
Figure 7.
The bar graph illustrates the polyphenolic profile of green bean by-products, determined by semi-quantitative UHPLC-DAD analysis using DAD total scan chromatograms (see method in par. 2.5). A comparison between biological (blue) and LI (green) by-products is presented, as well as a comparison between fresh (full bars) and cooked (striped bars) by-products. Co = Cooked, Fr = Fresh.
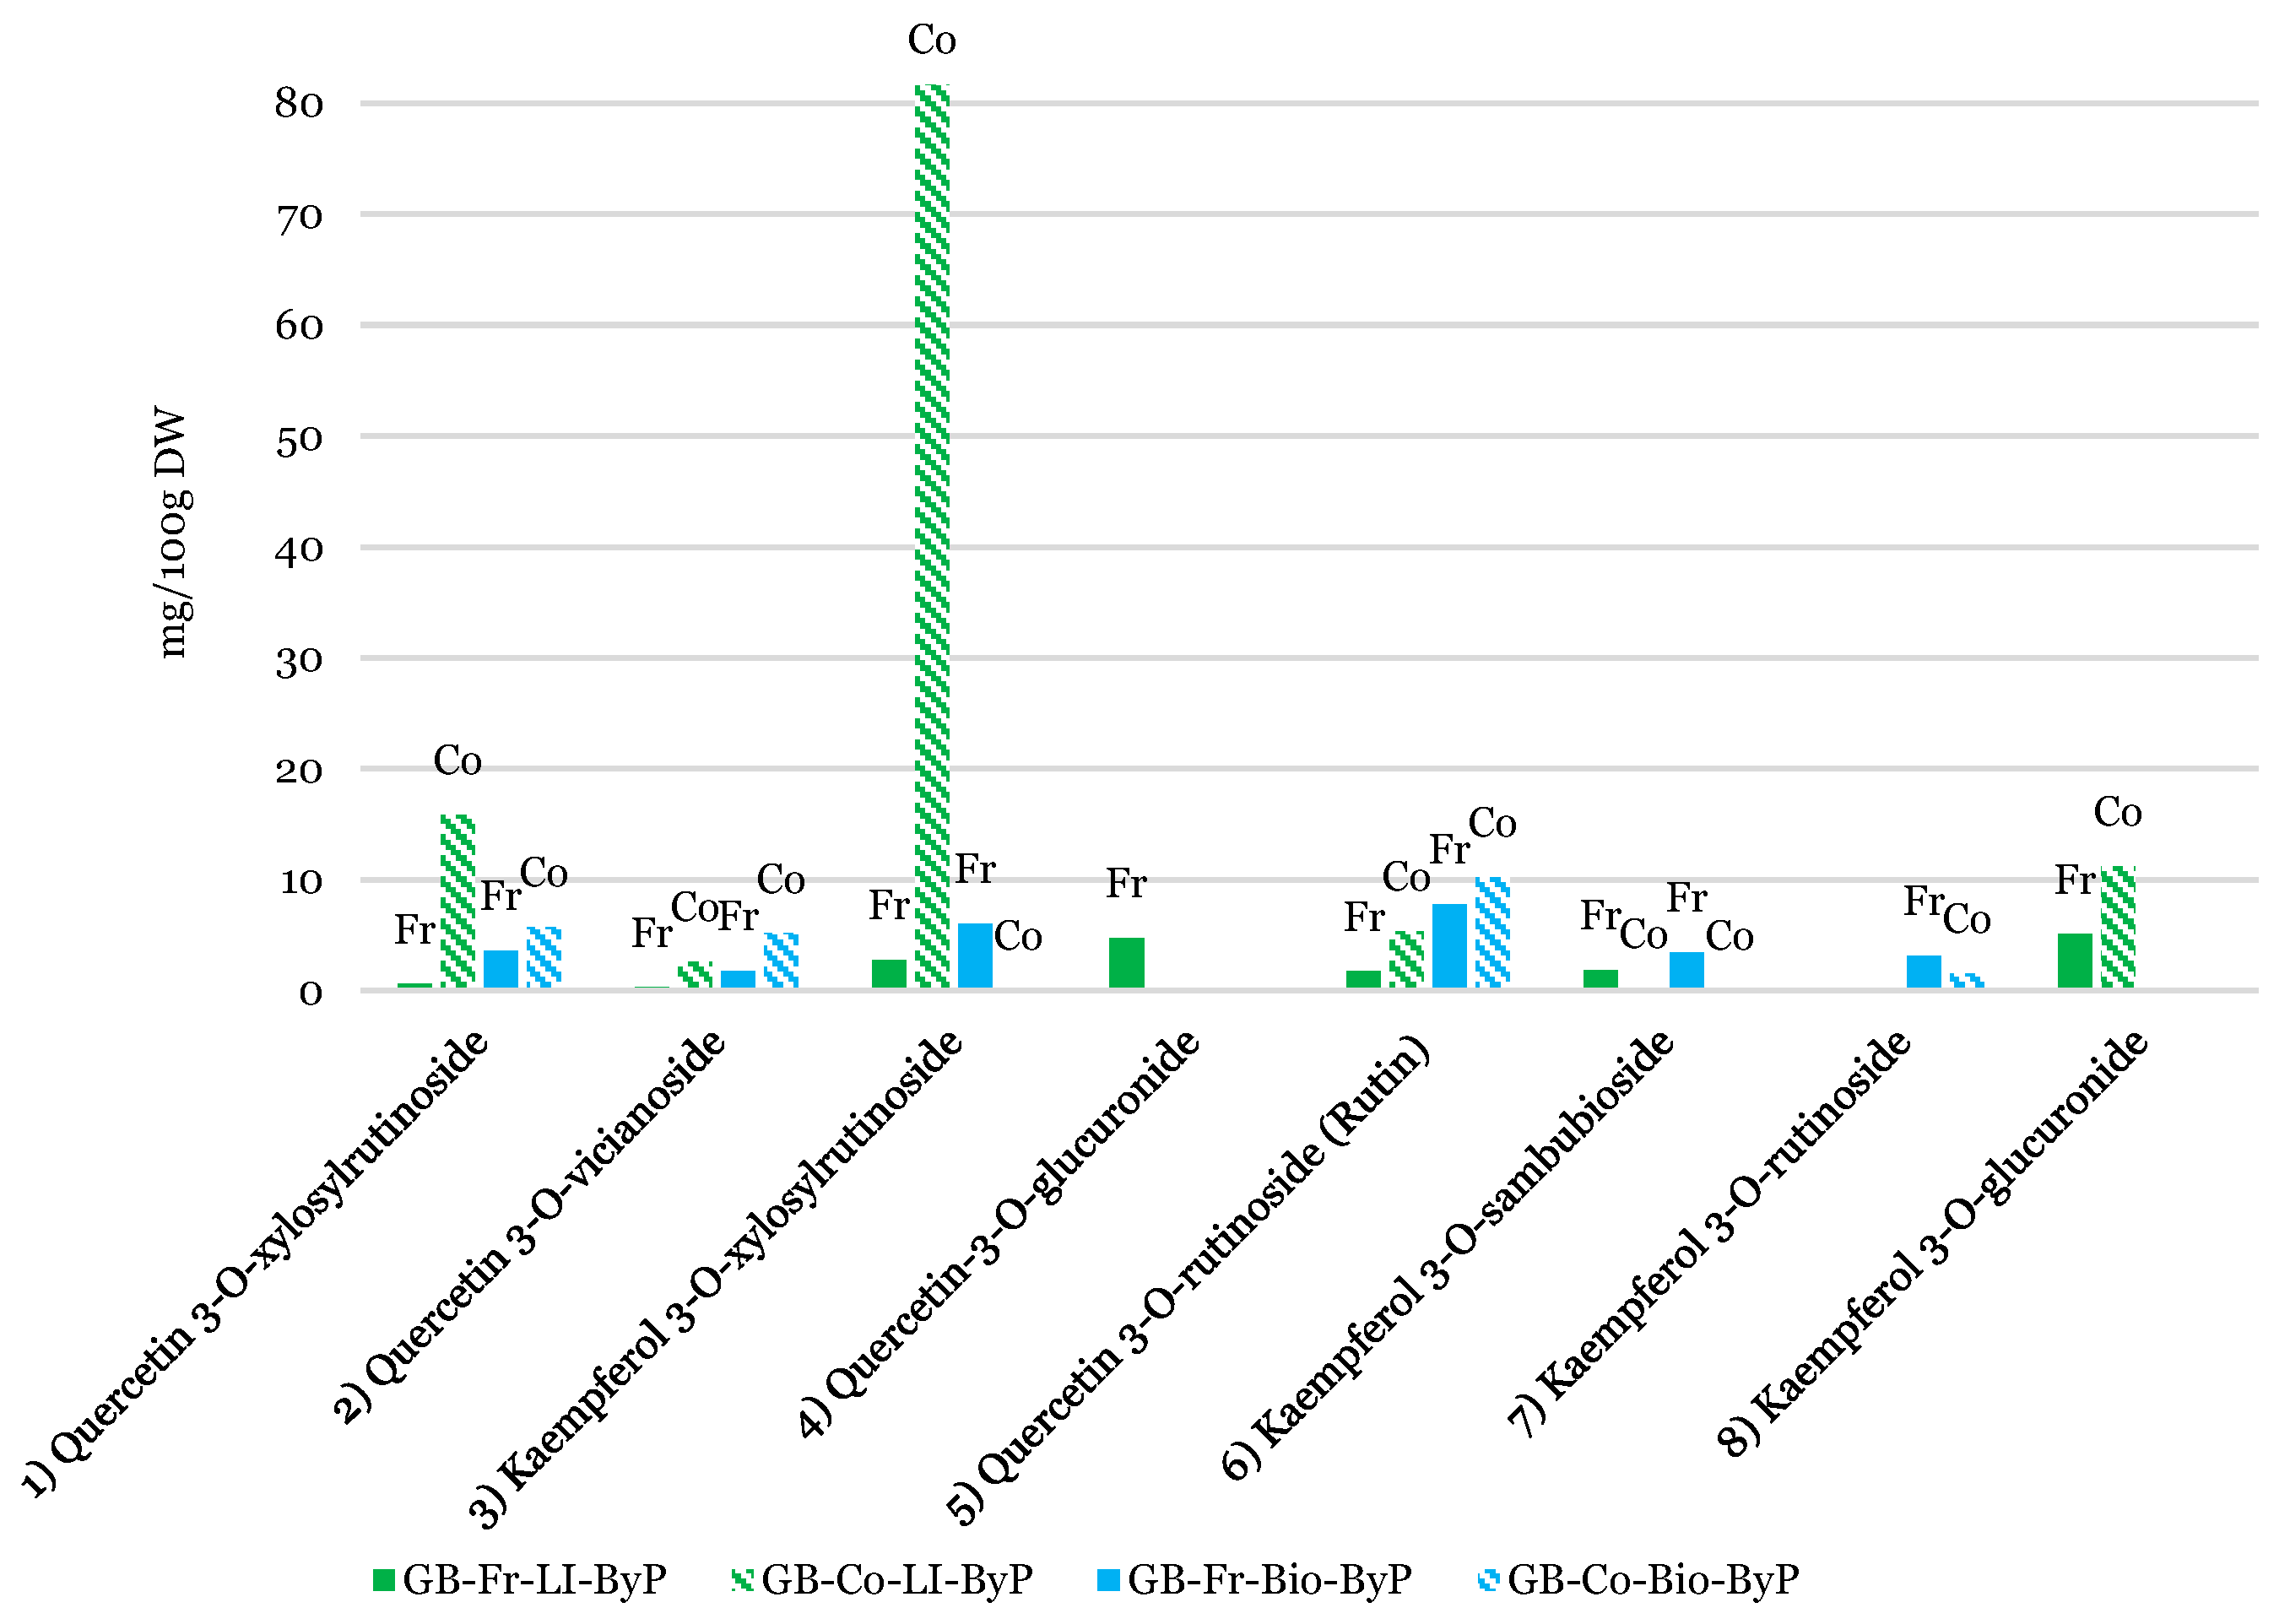
Figure 9.
The bar graph illustrates the polyphenolic profile of bean samples, determined by semi-quantitative UHPLC-DAD analysis using DAD total scan chromatograms (see method in par. 2.5). A comparison is made between the biological, conventional, and LI cultivation methods. A comparison between the fresh (full bars) and cooked (striped bars) by-products is presented. A comparison is provided between the by-products and the final product. Co = Cooked, Fr = Fresh.
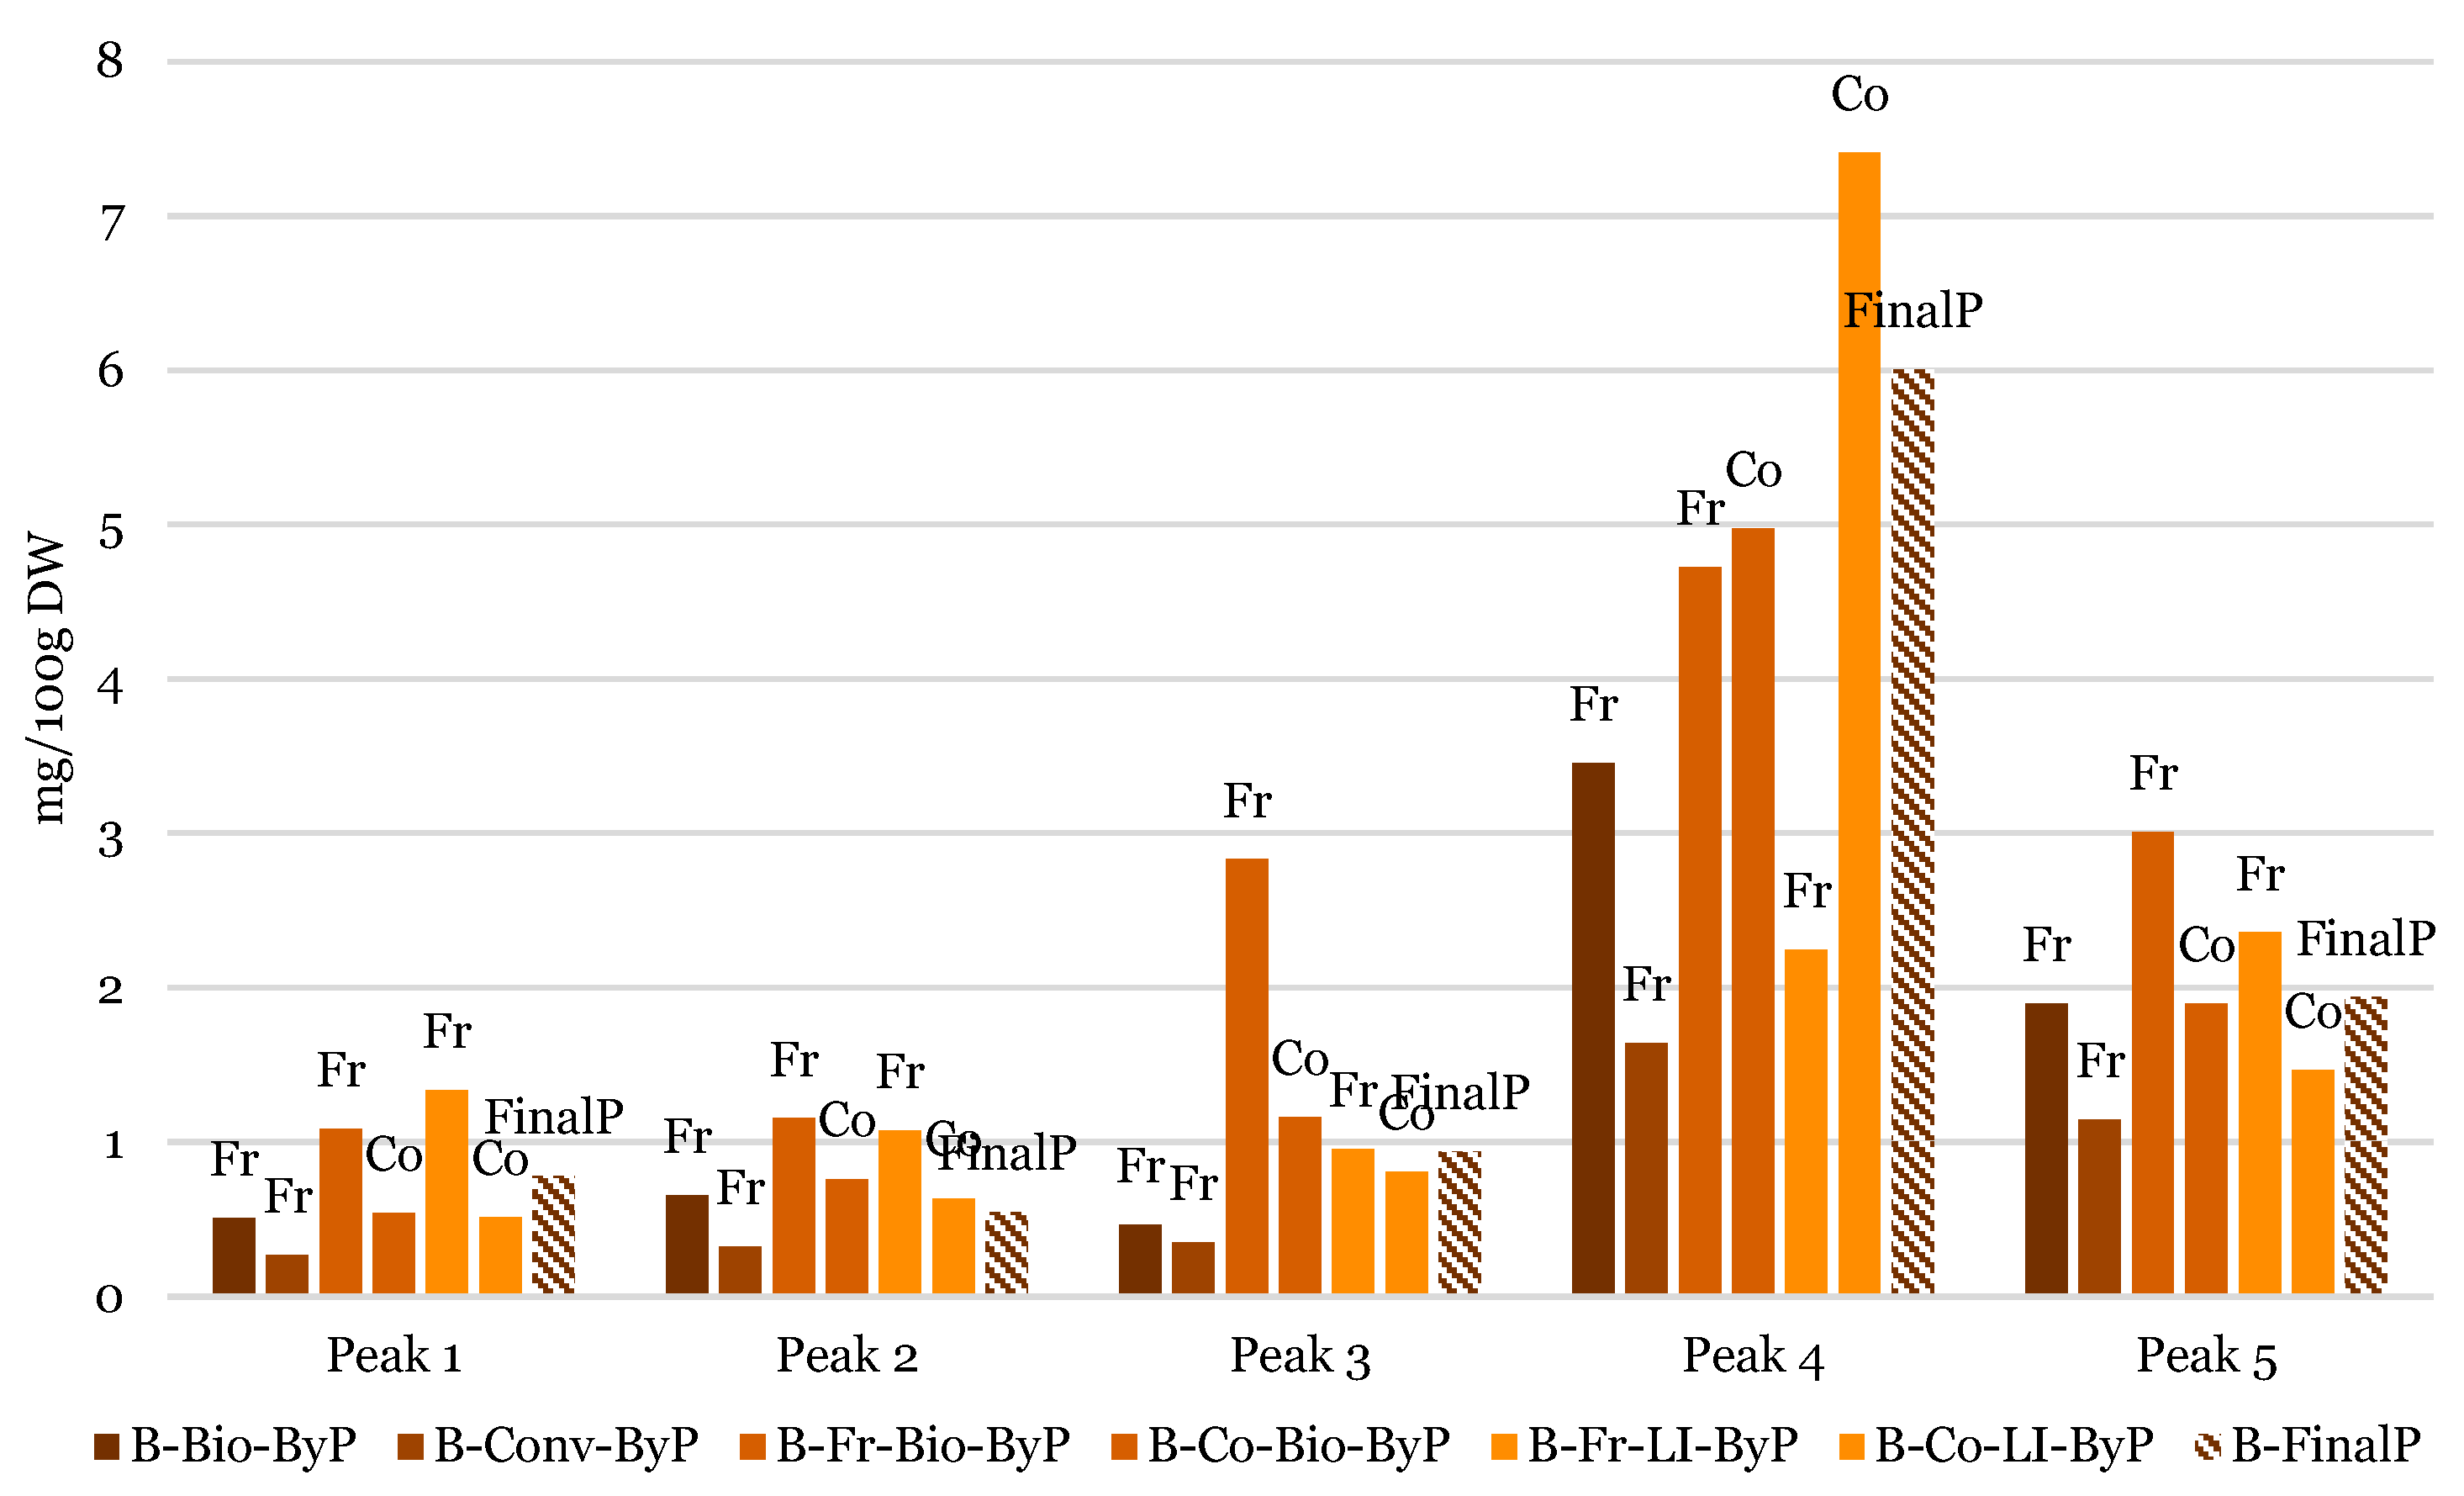
Figure 11.
The bar graph illustrates the polyphenolic profile of soy samples, determined by semi-quantitative UHPLC-DAD analysis using DAD total scan chromatograms (see method in par. 2.5). A comparison is made between the biological and conventional seeds (striped bars) and soy by-products (full bars).
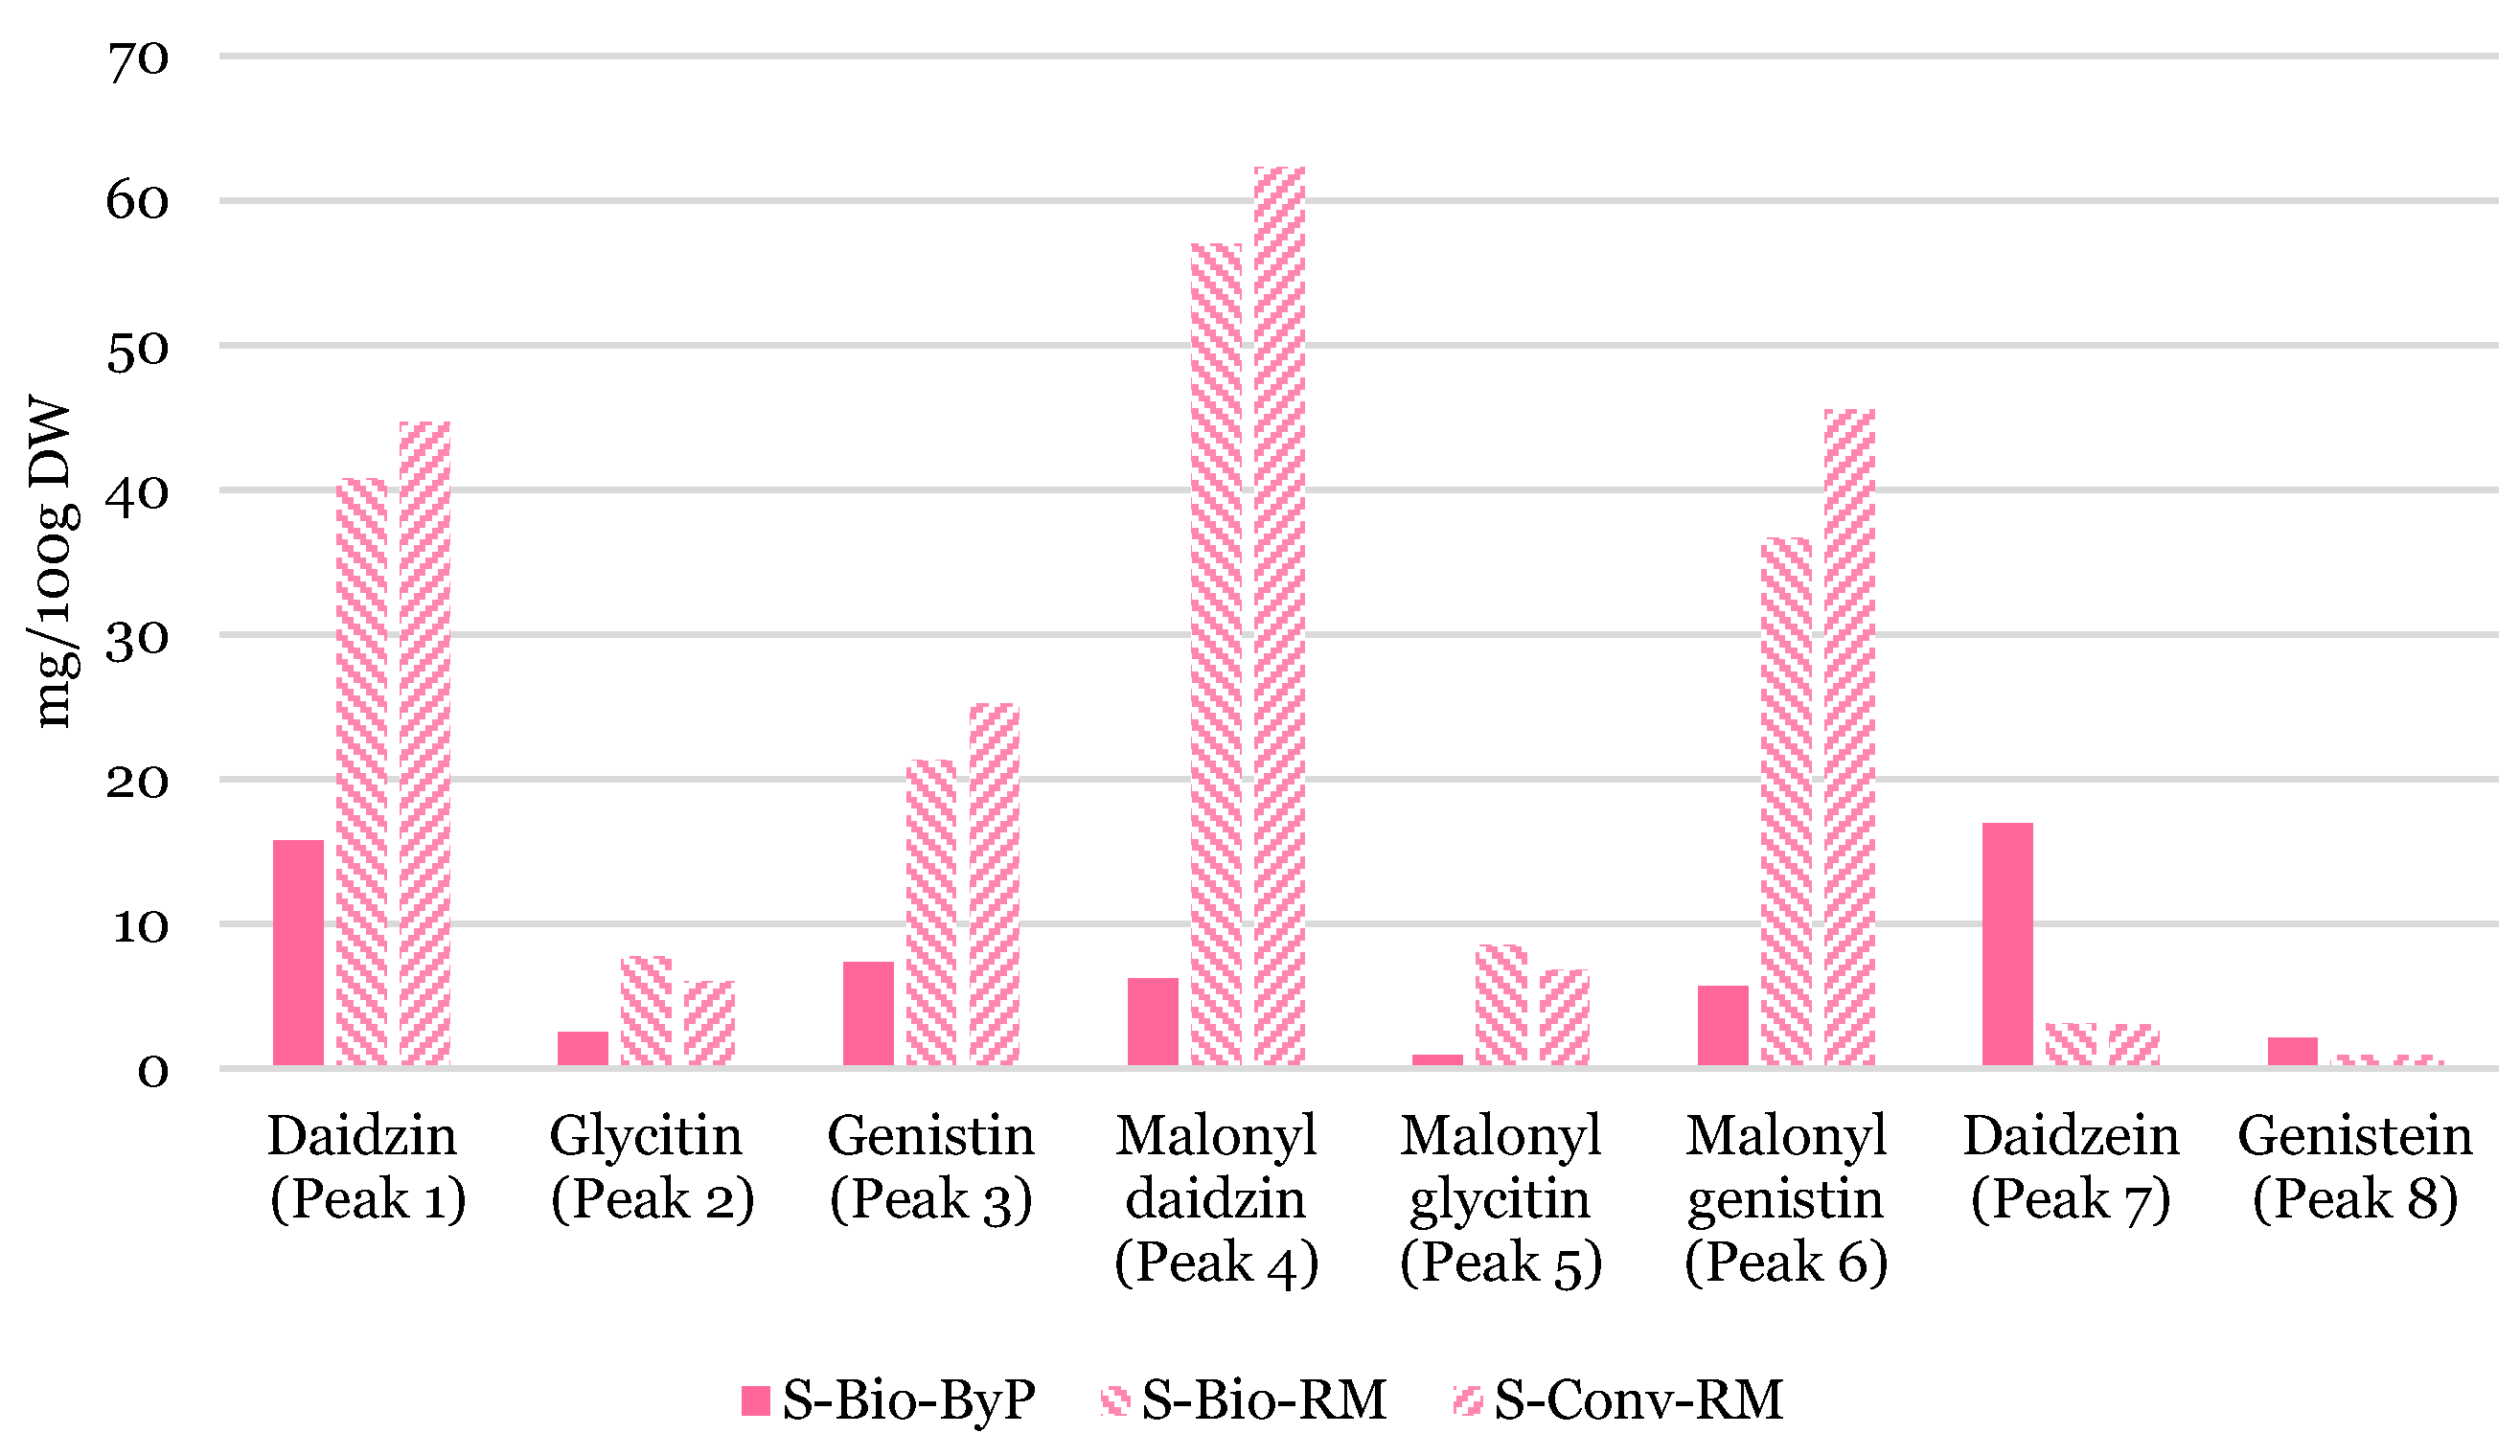

Table 1.
Agri-food samples.
| Sample | Acronym | |
| Beans | Biological by-product | B-Bio-ByP |
| Conventional by-product | B-Conv-ByP | |
| Final product | B-FinalP | |
| Biological fresh by-product | B-Fr-Bio-ByP | |
| Biological cooked by-product | B-Co-Bio-ByP | |
| LI fresh by-product | B-Fr-LI-ByP | |
| LI cooked by-product | B-Co-LI-ByP | |
| Green Beans | LI fresh by-product | GB-Fr-LI-ByP |
| LI cooked by-product | GB-Co-LI-ByP | |
| Biological fresh by-product | GB-Fr-Bio-ByP | |
| Biological cooked by-product | GB-Co-Bio-ByP | |
| Soy | Biological raw material | S-Bio-RM |
| Conventional raw material | S-Conv-RM | |
| Biological by-product | S-Bio-ByP | |
Table 2.
Polyphenol standards.
| Substance | RT [min] | Molecular Ion [m/z] | MSn [m/z], rel. int. (%) | Molecular Weight [g/mol] | Compound | µg mL-1 | |
| 1 | 1.98 | 169 [M-H]- | MS2[169]: 125 (100) MS3[125]: 81 (100), 125 (65), 97 (60) |
170 | Gallic acid | 28.13 | |
| 2 | 4.25 | 153 [M-H]- | MS2[153]: 109 (100) MS3[109]: 109 (100), 112 (55) |
154 | Protocatechuic acid | 11.25 | |
| 3 | 11.16 | 289 [M-H]- | MS2[289]: 245 (100), 205 (35), 179 (15) MS3[245]: 203 (100), 227 (30), 187 (20) |
290 | (+)-Catechin | 62.50 | |
| 4 | 11.51 | 179 [M-H]- | MS2[179]: 135 (100) MS3[135]: 90 (100) |
180 | Caffeic acid | 9.38 | |
| 5 | 11.57 | 353 [M-H]- | MS2[353]: 191 (100), 179 (48), 173 (30) MS3[191]: 127 (100), 173 (90), 85 (60), 93 (45), 110 (35) |
354 | Chlorogenic acid | 3.75 | |
| 6 | 12.09 | 289 [M-H]- | MS2[289]: 245 (100), 205 (35), 179 (15) MS3[245]: 203 (100), 227 (30), 187 (20) |
290 | (-)-Epicatechin | 28.13 | |
| 7 | 12.84 | 163 [M-H]- | MS2[163]: 119 (100) | 164 | p-coumaric acid | 3.50 | |
| 8 | 13.42 | 193 [M-H]- | MS2[193]: 149 (100), 178 (55), 134 (20) MS3[149]: 134 (100) |
194 | Ferulic acid | 5.63 | |
| 9 | 16.08 | 463 [M-H]- | MS2[463]: 301 (100) MS3[301]: 179 (100), 273 (15) |
464 | Isoquercitrin | 18.75 | |
| 10 | 16.29 | 609 [M-H]- | MS2[609]: 301 (100) MS3[301]: 179 (100), 273 (15) |
610 | (+)-Rutin trihydrate | 37.50 | |
| 11 | 16.57 | 463 [M-H]- | MS2[463]: 301 (100) MS3[301]: 179 (100), 273 (15) |
464 | Hyperoside | 37.50 | |
| 12 | 16.79 | 481 [M+HCOO]- 435 [M-H]- |
MS2[435]: 273 (100) | 472 | Phloridzin dihydrate | 28.13 | |
| 13 | 17.47 | 317 [M-H]- | MS2[317]: 179 (100), 191 (15) MS3[179]: 151 (100) |
318 | Myricetin | 19.80 | |
| 14 | 17.78 | 447 [M-H]- | MS2[447]: 301 (100) MS3[301]: 179 (100), 151 (65) |
448 | Quercitrin | 56.25 | |
| 15 | 18.49 | 253 [M-H]- | MS2[253]: 253 (100), 209 (25), 197 (10) MS3[253]: 253 (100), 209 (30), 181 (25), 169 (10) |
254 | Daidzein | 17.00 | |
| 16 | 19.65 | 271 [M-H]- | MS2[271]: 151 (100) MS3[151]: 107 (100) |
272 | Naringenin | 7.50 | |
| 17 | 20.39 | 269 [M-H]- | MS2[269]: 225 (100), 269 (50), 201 (35), 149 (25) MS3[225]: 181 (100), 197 (40), 169 (15), 225 (10) |
270 | Genistein | 14.58 | |
| 18 | 20.56 | 301 [M-H]- | MS2[301]: 286 (100), 242 (45), 257 (35), 125 (20), 199 (10) MS3[286]: 242 (100), 258 (85), 199 (40), 174 (15), 268 (15) |
302 | Hesperetin | 28.20 | |
| 19 | 21.08 | 271 [M-H]- | MS2[271]: 151 (100), 176 (20) MS3[151]: 107 (100) |
272 | Naringenin chalcone | 16.50 | |
| 20 | 22.05 | 285 [M-H]- | MS2[285]: 285 (100), 243 (55), 151 (40) | 286 | Kaempferol | 12.00 | |
| 21 |
22.43 | 269 [M-H]- | MS2[269]: 225 (100), 269 (55), 201 (35), 149 (25) MS3[225]: 181 (100), 197 (40), 169 (15) |
270 | Apigenin | 13.20 |
Table 3.
Qualitative LC-MS analysis of polyphenols in green beans by-products.
| Substance | RT [min] | Molecular Ion [m/z] | MSn [m/z], rel. int. (%) | Molecular Weight [g/mol] | Tentative Identification |
| 1 | 14.53 | 741 [M-H]- | MS2[741]: 253 (100) MS3[253]: 235 (100) |
742 | Quercetin 3-O-xylosylrutinoside [11] |
| 2 | 14.91 | 595 [M-H]- | MS2[595]: 300 (100), 445 (40), 463 (25), 475 (15), MS3[300]: 271 (100), 255 (50) |
596 | Quercetin 3-O-vicianoside [11] |
| 3 | 16.16 | 725 [M-H]- | MS2[725]: 575 (100), 285 (40), 593 (35) MS3[575]: 339 (100), 393 (90), 429 (70), 547 (25) |
726 | Kaempferol 3-O-xylosylrutinoside 11 |
| 4 | 16.27 | 477 [M-H]- | MS2[477]: 301 (100) MS3[301]: 179 (100), 150 (60) |
478 | Quercetin 3-O-glucuronide [11] |
| 5 | 16.38 | 609 [M-H]- | MS2[609]: 301 (100) MS3[301]: 179 (100), 273 (15) |
610 | Quercetin 3-O-rutinoside |
| 6 | 16.63 | 579 [M-H]- | MS2[579]: 285 (100), 429 (60), 447 (20), 257 (15) MS3[285]: 257 (100), 151 (50), 267 (45) |
580 | Kaempferol 3-O-sambubioside 1[11]1 |
| 7 | 17.43 | 593 [M-H]- | MS2[593]: 285 (100) MS3[285] 257 (100), 267 (55), 241 (45), 213 (25) |
594 | Kaempferol 3-O-rutinoside [11] |
| 8 | 18.04 | 461 [M-H]- | MS2[461]: 285 (100) MS3[285]: 257 (100), 267 (55), 229 (40), 213 (25), 197 (20) |
462 | Kaempferol 3-O-glucuronide [11] |
Table 4.
Qualitative LC-MS analysis of polyphenols in bean products.
| Substance | RT [min] | Molecular Ion [m/z] | MSn [m/z], rel. int. (%) | Molecular Weight [g/mol] | Tentative Identification |
| 1 | 9.47 | 385 [M-H]- | MS2[385]: 191 (100) MS3[191]: 84 (100), 146 (30), 173 (10) |
386 | Feruloyl glucaric/galactaric acid derivative [13] |
| 2 | 9.96 | 385 [M-H]- | MS2[385]: 191 (100) MS3[191]: 84 (100), 146 (30), 173 (10) |
386 | Feruloyl glucaric/galactaric acid derivative [13] |
| 3 | 10.58 | 385 [M-H]- | MS2[385]: 191 (100) MS3[191]: 84 (100), 146 (30), 173 (10) |
386 | Feruloyl glucaric/galactaric acid derivative [13] |
| 4 | 11.14 | 385 [M-H]- | MS2[385]: 191 (100) MS3[191]: 84 (100), 146 (30), 173 (10) |
386 | Feruloyl glucaric/galactaric acid derivative [13] |
| 5 | 11.69 | 385 [M-H]- | MS2[385]: 191 (100) MS3[191]: 84 (100), 146 (30), 173 (10) |
386 | Feruloyl glucaric/galactaric acid derivative [13] |
Table 5.
Qualitative LC-MS analysis of polyphenols in soy products.
| Substance | RT [min] | Molecular Ion [m/z] | MSn [m/z], rel. int. (%) | Molecular Weight [g/mol] | Tentative Identification |
| 1 | 12.9 | 417 [M+H]+ | MS2[417]: 255 (100) MS3[255]: 199 (100), 136 (70), 227 (55), 237 (30), 255 (15) |
416 | Daidzin [15] |
| 2 | 13.3 | 447 [M+H]+ | MS2[447]: 285 (100) MS3[285]: 270 (100), 229 (20), 144 (10), 285 (5) |
446 | Glycitin [15] |
| 3 | 14.3 | 433 [M+H]+ | MS2[433]: 271 (100) MS3[271]: 152 (100), 215 (80), 243 (70), 253 (40), 271 (10) |
432 | Genistin [15] |
| 4 | 16.1 | 503 [M+H]+ | MS2[503]: 255 (100) MS3[255]: 199 (100), 136 (70), 237 (30), 255 (15) |
502 | Malonyl daidzin [15] |
| 5 | 16.8 | 533 [M+H]+ | MS2[533]: 271 (100), 285 (60) MS3[271]: 215 (100), 152 (70), 243 (45), 253 (30), 271 (10) |
532 | Malonyl glycitin [15] |
| 6 | 17.9 | 519 [M+H]+ | MS2[519]: 271 (100) MS3[271]: 215 (100), 152 (50), 243 (35), 253 (25), 271 (10) |
518 | Malonyl genistin [15] |
| 7 | 18.4 | 255 [M+H]+ | MS2[255]: 199 (100), 136 (70), 227 (55), 237 (30), 255 (15) MS3[199]: 191 (100), 171 (30), 153 (15) |
254 | Daidzein [15] |
| 8 | 20.5 | 271 [M+H]+ | MS2[271]: 152 (100), 215 (75), 243 (65), 253 (55), 271 (10) MS3[152]: 153 (100), 110 (45), 66 (40) |
270 | Genistein [15] |
Disclaimer/Publisher’s Note: The statements, opinions and data contained in all publications are solely those of the individual author(s) and contributor(s) and not of MDPI and/or the editor(s). MDPI and/or the editor(s) disclaim responsibility for any injury to people or property resulting from any ideas, methods, instructions or products referred to in the content. |
© 2024 by the authors. Licensee MDPI, Basel, Switzerland. This article is an open access article distributed under the terms and conditions of the Creative Commons Attribution (CC BY) license (http://creativecommons.org/licenses/by/4.0/).
Copyright: This open access article is published under a Creative Commons CC BY 4.0 license, which permit the free download, distribution, and reuse, provided that the author and preprint are cited in any reuse.


