
Submitted:
08 November 2024
Posted:
12 November 2024
You are already at the latest version
Abstract
This study investigates the trends and characteristics of heatwaves in mainland Portugal from 1980/1981 to 2022/2023 using ERA5-Land reanalysis data. This research uses the Heatwave Magnitude Index (HWMI) to identify heatwave days for minimum (Tmin) and maximum (Tmax) temperatures across 15 grid-points representing Portugal’s diverse geography and climate. Three key annual parameters are analysed: the number of heatwave days (ANDH), the average temperature during heatwaves (AATW), and the intensity of heatwave events (AIHD). Results reveal a consistent increase in heatwave persistence throughout mainland Portugal, with more pronounced trends observed for Tmax compared to Tmin. ANDH Tmin shows upward trends across all grid-points, with increases ranging from 0.8 to 4.2 days per decade. ANDH Tmax exhibits even more significant increases, with 11 out of 15 grid-points showing statistically significant rises, ranging from 2.2 to 4.4 days per decade. Coastal areas, particularly in the south, demonstrate the most substantial increases in heatwave persistence. The intensity of heatwaves, as measured by AIHD, also shows positive trends across all grid-points for both Tmin and Tmax, with southern locations experiencing the most significant increases. The study also discusses decadal trends in annual averages of Tmin and Tmax, as well as extreme measures such as annual minimum (AMIN) and annual maximum (AMAX), daily temperatures spatially represented across mainland Portugal. These analyses reveal widespread warming trends, with more pronounced increases in Tmax compared to Tmin. The AMIN and AMAX trends further corroborate the overall warming pattern from the heatwave analyses, with notable spatial variations observed. The findings indicate a substantial worsening in the occurrence, duration, and intensity of heatwave events. This increased persistence of heatwaves, especially evident from the early 2000s onwards, suggests a potential climate regime shift in mainland Portugal. The results underscore the need for adaptive strategies to address the growing challenges posed by more frequent and intense heatwaves in the region.
Keywords:
heatwaves
; Portugal
; ERA5-Land reanalysis
; temperature extremes
; trends
1. Introduction
Heatwaves are increasingly frequent and severe, posing significant challenges to societies and ecosystems worldwide [1,2]. Mainland Portugal has experienced a notable rise in extreme heat events [3,4], which can lead to the occurrence of heatwaves [5], having severe repercussions for human health, economic activities, and natural environments. Addressing this problem requires a comprehensive evaluation of some of the most relevant heatwave characteristics, focusing on their temporal and spatial dimensions. This study aims to provide such an evaluation by analysing heatwave trends using the dense gridded ERA5-Land temperature dataset [6], thereby addressing the lack of consistent and comprehensive ground-based weather data in the country, with a focus on key urbanised areas in mainland Portugal (Figure 1). However, the lack of a standardised global definition of heatwaves presents a significant challenge, necessitating region-specific studies to understand and mitigate their impacts effectively.
Prolonged periods of excessive heat, commonly referred to as heatwaves, are among the most detrimental natural hazards. They significantly impact human health, sometimes leading to increased morbidity and mortality rates [7], as well as affecting infrastructure, the economy, and natural ecosystems [8]. The Intergovernmental Panel on Climate Change (IPCC) [9,10] describes a heatwave as "a period of abnormally hot weather, often defined with reference to a relative temperature threshold, lasting from two days to months." The precise definition of a heatwave varies by region due to differing normal temperature ranges [11], but key elements include an extended period (at least two days) of unusually hot weather and temperatures surpassing a relative threshold. The IPCC has concluded that strong evidence exists indicating that hot days—i.e., days when daily temperatures exceed a specific threshold [12]—and heatwaves have become more frequent from the 1950s [13]. Since then, heatwaves have also become more intense and prolonged across most land regions, driven by climate change [14]. According to Perkins-Kirkpatrick and Lewis [14], Perkins et al. [15], Perkins-Kirkpatrick and Gibson [16], many regions have experienced significant increases in the number of heatwave days. Some areas, such as the Mediterranean and parts of Africa, have seen particularly pronounced changes, with heatwave days increasing by approximately 2.5 to 5.5 days per decade. This trend highlights the alarming acceleration of extreme heat events [14,17].
Recent research—e.g. [3,4]—indicates that over the past few decades, heatwaves in mainland Portugal have become more frequent, intense, and longer-lasting. Additionally, Portugal has seen a statistically significant increase in extreme heat events, particularly during spring and summer. The frequency of very hot days (daily maximum temperature above 35°C) and tropical nights (daily minimum temperature above 20°C) has risen across the country [18,19]. Heatwaves are projected to become more frequent, severe, and longer-lasting, especially in northern and inland regions [20]. Even under high mitigation scenarios, studies in Environmental Science & Policy predict that the number of heatwaves in Portugal will more than double compared to historical records [21,22,23]. The impacts of heatwaves extend well beyond just rising temperatures, e.g. notably increasing the risk of wildfires: in recent years, extreme heat combined with prolonged drought conditions has led to severe fires. A study published in Agricultural and Forest Meteorology journal found that 97% of extreme wildfires in Portugal occurred during heatwaves, with 90% of extreme wildfire days coinciding with heatwave days [24]. For example, in July 2022, Portugal experienced its longest and most intense July heatwave since 1941, with the northern region of Pinhão (Douro River) registering a record high temperature of 47°C [25]. This extreme heat contributed to significant wildfires, particularly in central (Leiria) and southern (Algarve) regions, where over 30,000 ha were burned, resulting in substantial injuries and fatalities [26]. Such events have far-reaching socio-economic effects, including extensive property damage, loss of life, and increased strain on healthcare and emergency services [27].
The heatwave extreme phenomenon can be assessed using various metrics, including frequency (number of heatwave days), intensity (mean and maximum daily temperatures during heatwaves), and duration. According to Russo et al. [12], a heatwave can be defined by the cumulative exceedances of a specified temperature threshold over consecutive days. This study utilises similar metrics to analyse heatwave characteristics in Portugal comprehensively. Heatwaves can also be quantified using the Heatwave Magnitude Index (HWMI), which combines intensity and duration into a single metric [28], allowing for comparison between different events. Another approach is the Heat Wave Severity Index (HWSI), which incorporates both temperature and humidity effects [29], providing a more holistic measure of heat stress by accounting for heat and moisture. Additionally, extreme value theory can estimate the return periods and probabilities of heatwaves surpassing certain thresholds [30], enabling an assessment of the likelihood and severity of rare and extreme heatwave events. These metrics offer complementary perspectives on heatwave characteristics, facilitating a thorough investigation of their impacts and changes over time.
Similar to many other regions, Portugal faces challenges due to its relatively sparse weather station network, leading to significant data gaps and inconsistencies in record series [31,32]. These limitations hinder comprehensive climate studies that rely solely on weather station data. To address these challenges, researchers increasingly use reanalysis datasets such as ERA5-Land [6,33], which offer continuous and homogenised data for a range of variables, including daily minimum and maximum temperatures (Tmin and Tmax), at various timescales for global land areas, covering mainland Portugal [34]. The high spatial resolution of ERA5-Land enables detailed analyses of temperature extremes at both local and regional levels, offering a more reliable data source compared to individual weather stations [6,35,36]. Recent studies evaluating ERA5 and ERA5-Land reanalysis air temperature in Portugal—e.g. [4,34]—validate the effectiveness of ERA5-Land data in accurately reproducing average and extreme temperatures across the country. Although ERA5-Land data extends back to 1950, researchers predominantly utilise the period from 1981 or 1980 onwards due to enhanced data quality, consistency, and accessibility [6]. These findings demonstrate that ERA5-Land accurately captures the spatial variability of temperature, closely aligns with observed data, and establishes its reliability for climate research, highlighting the dataset’s suitability for studying heatwave trends and supporting robust long-term analyses spanning decades. The high spatial resolution of the ERA5-Land reanalysis (0.1° × 0.1°, ca. 9 km in Portugal) facilitates the assessment of climate change impacts [36], particularly regarding increasing temperature extremes and the occurrence and intensity of heatwaves in mainland Portugal. This dataset provides a more robust source of information compared to ground-based records [34,37]. The use of these datasets in climate studies is essential for formulating effective adaptation strategies and policies to address climate variability. Such research can guide targeted climate adaptation and mitigation efforts, ultimately protecting human health, infrastructure, and ecosystems from the escalating threat of extreme heat.
Given the aforementioned heatwave trends and their impacts, it is crucial to undertake detailed localised studies to understand the specific characteristics and evolution of this phenomenon in different regions. Thus, the primary objective of this study is to evaluate the temporal changes in various heatwave characteristics, including the number of heatwave days, mean heatwave temperature, and heatwave intensity, at selected reanalysis grid-points across mainland Portugal over the past few decades, focusing on a period from 1980 to 2023. By employing widely used statistical methods in climate research, such as Sen’s slope and the Sequential Mann-Kendall test, on the ERA5-Land temperature dataset, this research provides valuable insights into the evolving trends of extreme temperatures in mainland Portugal’s changing climate, revealing an increasing occurrence and severity of heatwaves, particularly in coastal and southern regions. These findings support the development of effective climate adaptation and mitigation strategies, which are crucial for addressing the growing challenges posed by more frequent and intense heatwave events.
2. Study Area and Data Preparation
Mainland Portugal (Figure 1a), situated on the southwestern periphery of Europe, covers approximately 89,000 km2 and is bordered by Spain to the north and east, and the North Atlantic Ocean to the west and south [38]. The country features a diverse topography, ranging from mountainous regions in the north and central areas to rolling plains in the south. Its extensive coastline, stretching over 1,700 km [39], also plays a significant role in shaping local climate conditions. This geographic diversity, combined with the influence of the North Atlantic Ocean, results in distinct climatic features across the country, making it an ideal region for studying spatial and temporal patterns in temperature extremes.
The climate of mainland Portugal is predominantly Mediterranean, characterised by mild, wet winters and hot, dry summers, though significant variation exists between coastal and inland areas. Coastal regions tend to experience more moderate temperatures due to the maritime influence, whereas interior areas, particularly those at higher altitudes, face more extreme temperature conditions, with hotter summers and colder winters [5,40]. In some southern inland regions, summer temperatures frequently exceed 40°C, while winter temperatures in mountainous areas (e.g. Serra da Estrela) can drop below freezing [39].
The main dataset used in this study is continuous series of minimum (Tmin) and maximum (Tmax) daily temperatures from the openly accessible, regularly updated ERA5-Land reanalysis [6], covering 1,012 grid-points evenly distributed, as shown in Figure 1a. This also addresses the limitations of Portugal’s relatively sparse ground-based weather station network [31,32,41], providing high-resolution, continuous, and homogenised temperature data, thereby enabling a more comprehensive analysis of temperature extremes at both local and regional levels [6,34]. The ERA5-Land Tmin and Tmax series cover 43 hydrological years, from 1 October 1980 to 30 September 2023. For calculation purposes (explained in the next section), an additional 15 days were included before and after the reference period. Although the dataset is extensive (with a length of [43×365+30]×1,012) this study focuses on analysing heatwave trends at 15 selected grid-points (out of 1,012) to represent the country’s diverse geography and climate, including both coastal and inland urban centres. The actual names of these locations are shown in Figure 1b, while their corresponding codes adopted in the study are presented in Figure 1c. The inclusion of diverse climate locations facilitates a comprehensive examination of temperature extremes in both maritime-influenced regions and those subject to more continental climate patterns.
Using ERA5-Land reanalysis data for 43 hydrological years (1980/1981 to 2022/2023), temperature trends across Portugal were analysed. This includes the averages of minimum, Tmin, and maximum, Tmax, daily temperatures (Figure 1b and c), as well as of the annual extremes in the 43 years of these variables—AMIN for the annual daily minimum (Figure 2a and b) and AMAX for the annual daily maximum (Figure 3a and b). This description provides a complete view of the thermal conditions in Portugal over the past four decades, forming a basis for the study of heatwaves in the 15 regions of interest.
During the 43-year hydrological period, Tmin across mainland Portugal had an overall mean of 10.3°C, with significant spatial variation. Northern high-altitude regions, such as Bragança (BGCA), exhibited lower temperatures compared to southern lowland areas, such as Faro (FARO), where temperatures were generally milder. The lowest mean of Tmin was 5.6°C, while the highest reached 15.6°C, as shown in Figure 1b. In contrast, Tmax for the same period revealed an overall mean value of 20.0°C, with the hottest locations predominantly concentrated in the Alentejo region, including Beja (BEJA) and Évora (EVRA). The mean of Tmax ranged from a low of 14.3°C to a high of 23.4°C, as illustrated in Figure 1c.
Regarding the annual minima (AMIN), the overall mean for Tmin (Figure 2a) was -1.6°C, with colder temperatures observed in the north. The lowest mean AMIN Tmin was estimated at -8.1°C, while the highest was 6.5°C. For AMIN Tmax (Figure 2b), the mean was 22.1°C, with the lowest value of 18.3°C and the highest of 25.3°C. In contrast, the annual maxima (AMAX) series followed a distinct pattern. The overall mean for AMAX Tmin (Figure 3a) was 22.1°C, with values ranging from a low of 18.3°C to a high of 25.3°C. From Figure 3b, AMAX Tmax showed a more pronounced variation, with a mean of 36.7°C. The highest mean values of AMAX Tmax were found in the eastern Alentejo region, while lower ones were observed in some coastal areas, such as Lisbon (LISB) and Lagos (LGOS). The AMAX Tmax ranged from 27.3°C to a maximum of 41.0°C.
As illustrated in the preceding figures, temperature extremes in mainland Portugal exhibit significant spatial diversity, influenced by a complex interplay of geographical factors. The variation between the cooler northern highlands and the warmer southern lowlands, coupled with the contrast between temperate coastal areas and more extreme inland regions, underscores the importance of altitude, latitude and proximity to the North Atlantic Ocean in shaping local climatic conditions. Characterising this spatial heterogeneity is crucial for understanding the regional distribution of extreme events, such as heatwaves, and other temperature trends.
3. Methods
This study aimed to evaluate temporal changes in heatwave characteristics at the 15 selected reanalysis grid-points across mainland Portugal. These grid-points, representing key urban areas in different climatic contexts, were analysed over the 43-year hydrological reference period, from 1980/1981 to 2022/2023.
3.1. Heat Wave Magnitude Index
For this study, heatwave events were identified and quantified using the Heatwave Magnitude Index (HWMI) developed by Russo et al. [12]. This index defines a heatwave as an episode lasting a minimum of three consecutive days, during which the daily temperature exceeds a calculated threshold. The threshold was established based on the reference period, encompassing 43 hydrological years, with an additional 15-day buffer on either side, i.e., from 16 September 1980 to 15 October 2023. The threshold is derived as the 90th percentile of daily temperatures, calculated in this research for both Tmin and Tmax, using a 31-day moving window centred on each day of the hydrological year (1 October to 30 September). For any particular day d, the threshold is determined by calculating the 90th percentile of a dataset , which is mathematically expressed as:
where ⋃ represents the union of sets, denotes the temperature recorded on day i of year y, and Y encompasses all years within the reference period. The annual number of heatwave days is computed by summing the total days that meet the heatwave criteria within a given year:
where is the number of heatwave days in each year, and is an indicator function defined as:
The annual intensity of heatwaves is defined as the highest daily temperature observed during heatwave conditions in a given year:
where represents the peak temperature on the i-th day classified as part of a heatwave, and n is the total number of heatwave days in the year. This adapted methodology, based on the work of Russo et al. [12], provides a robust approach for quantifying and comparing heatwaves across different years and locations. By analysing both the occurrence, or persistence, and peak temperatures of heatwave events, the characteristics of extreme temperature episodes can be comprehensively assessed. This approach enables the identification of heatwave events and the calculation of a series of 43 values (series length) for the following three key variables:
- Annual number of days experiencing heatwaves, denoted as ANDH
- Annual average temperature of days experiencing heatwaves, denoted as AATW
- Annual intensity of heatwave days, denoted as AIHD
Although the HWMI was initially developed for maximum temperatures (Tmax), its application in this study has been extended to include minimum temperatures (Tmin), as mentioned at the beginning of this subsection. This extension is justified by the growing recognition of the crucial role that nighttime temperatures play in heatwave impacts and their potential for a more pronounced increase compared to daytime temperatures [42]. By analysing both Tmax and Tmin, a more comprehensive assessment of heatwave events is provided, capturing not only daytime extremes but also the persistence of high temperatures throughout the diurnal cycle. This approach aligns with established recommendations that advocate for the consideration of both daytime and nighttime temperatures to achieve a fuller understanding of heatwave dynamics and impacts [43], a perspective that continues to be supported by current research [42].
3.2. Trend Analysis
Sen’s slope estimator and the Mann-Kendall test [44,45] were applied to the three aforementioned variables (i.e., ANDH, AATW, and AIHD) to assess temporal trends. The significance level, , was set at 0.05. It is important to note that for some years within the 43-year hydrological period (max length of the series was 43), no heatwave days were identified. Consequently, the values of the other two variables for those years were recorded as NA (Not Available). The subroutines implemented in R [46] were capable of handling these cases during trend calculations.
3.3. Sequential Mann-Kendall Test
The Sequential Mann-Kendall test, also known as the Mann-Kendall-Sneyers (MKS) test [47,48], was applied to the same three variables to obtain the evolution of trends throughout the studied period, providing a more comprehensive analysis than the single ratio offered by Sen’s slope. Only the progressive trend of the Sequential Mann-Kendall test was considered, as breakpoint analysis was not part of this study. The Sequential Mann-Kendall test statistic is calculated as follows:
where t is the cumulative number of times a data point in the time series is greater than the previous data points, is the expected value of t, and is the variance of t.
This analysis provides insight into the temporal evolution of trends in heatwave characteristics across the study area, allowing for a more nuanced understanding of climate change impacts on extreme temperature events in mainland Portugal.
4. Results
This section presents the outcomes of an analysis conducted on heatwave characteristics across selected 15 grid-points in mainland Portugal, encompassing the 43-year hydrological period from October 1980 to September 2023. The investigation focuses on trends in three key annual parameters: the number of heatwave days (ANDH), the average temperature during heatwaves (AATW), and the intensity of heatwave events (AIHD). Statistical evaluations were performed utilising Sen’s slope estimator and the Mann-Kendall-Sneyers (MKS) test to address the significance of these trends.
The Heatwave Magnitude Index (HWMI) was applied to identify heatwave days for both minimum (Tmin) and maximum (Tmax) temperatures. The thresholds () used for heatwave identification, as defined in Equation 1, are illustrated in Figure 4a for Tmin and Figure 4b for Tmax. These thresholds were subsequently smoothed using Locally Weighted Scatterplot Smoothing [49] (LOWESS), with a smoothing factor of . LOWESS smoothing was applied to reduce noise and capture the underlying seasonal patterns whilst preserving local variations. These thresholds were established using a 31-day moving window based on a reference period spanning 43 hydrological years, from 16 September 1980 to 15 October 2023, including the additional 15-day buffer on either side of the period.
Analysis of the threshold patterns reveals distinct seasonal variations for both Tmin and Tmax. Tmin thresholds show a smooth seasonal variation, with summer peaks generally between 15°C and 20°C, and winter lows typically between 5°C and 10°C. In contrast, Tmax thresholds exhibit a more pronounced seasonal amplitude, with summer peaks generally between 25°C and 35°C, and winter lows typically between 15°C and 20°C. Notably, geographical variations are evident, with coastal areas often displaying higher Tmin thresholds, especially in winter, likely due to maritime influences. Conversely, coastal locations tend to have lower Tmax thresholds compared to inland areas.
These threshold patterns provide a nuanced basis for identifying heatwaves across different regions of mainland Portugal, accounting for both geographical and seasonal variations in temperature norms. A comprehensive quantitative assessment of heatwave trends for Tmin and Tmax is presented in subsequent tables and figures, encompassing diverse climatic locations across mainland Portugal. This analysis enables the identification of spatial variations and long-term changes in heatwave characteristics, providing a comprehensive overview of heatwave patterns across the studied geographical areas, which represent both coastal and inland environments.
4.1. Trends in Tmin Heatwave Characteristics
The annual number of heatwave days (ANDH) for Tmin shows a consistent upward trend across all grid-points, with increases ranging from 0.8 days per decade in Nazaré (NZRE) to 4.2 days per decade in Faro (FARO), as reported in Table 1. The most substantial rise is observed in Faro (FARO), indicating a notable intensification of heatwave occurrences in this southern region. Statistically significant trends (p < 0.05) are identified in Portalegre (PTLG), Beja (BEJA), Lagos (LGOS), and Faro (FARO), suggesting that these areas are experiencing a robust increase in heatwave frequency. The average ANDH for Tmin varies across locations, with Nazaré (NZRE) recording the lowest average at 15.5 days and Lisbon (LISB) the highest at 18.0 days, highlighting spatial variability in heatwave occurrences.
In terms of the annual average temperature during heatwave days (AATW) for Tmin, most grid-points exhibit slight warming trends; however, Aveiro (AVRO) is an exception with a negligible cooling trend of -0.02°C per decade. Beja (BEJA) shows the most pronounced warming trend at 0.72°C per decade, although none of these trends reach statistical significance. The average AATW values span from 12.05°C in Bragança (BGCA) to 18.63°C in Faro (FARO), reflecting diverse climatic conditions across the study area.
The annual intensity of heatwave days (AIHD) for Tmin also indicates positive trends across all grid-points, regardless of the , ranging from 0.02°C per decade in Nazaré (NZRE) to 0.90°C per decade in Beja (BEJA). Beja (BEJA) and Faro (FARO) demonstrate the highest increases at 0.90°C and 0.77°C per decade, respectively, with statistically significant trends observed in these locations. The average AIHD ranges from 17.24°C in Bragança (BGCA) to 22.82°C in Faro (FARO), further underscoring the spatial variability of heatwave intensity.
4.2. Trends in Tmax Heatwave Characteristics
The results for Tmax heatwave characteristics are outlined in Table 2. Overall, the trends are more pronounced and widespread compared to those for Tmin. The ANDH for Tmax shows positive trends across all grid-points, with increases ranging from 2.2 days per decade in Nazaré (NZRE) to 4.4 days per decade in Lagos (LGOS). Lagos (LGOS) exhibits the highest increase with an additional 4.4 heatwave days per decade, followed closely by Lisbon (LISB) and Faro (FARO), both showing increases of 4.2 days per decade. Statistically significant trends are found in 11 out of the 15 grid-points, indicating a robust increase in Tmax heatwave occurrences across mainland Portugal. The average ANDH for Tmax ranges from 17.9 days in Lagos (LGOS) to 22.5 days in Santarém (STRM).
The AATW trends for Tmax present a mixed picture; while most grid-points show warming trends, five locations—Braga (BRGA), Porto (PRTO), Nazaré (NZRE), Santarém (STRM), and Lisbon (LISB)—exhibit slight cooling trends. Beja (BEJA) and Évora (EVRA) stand out with significant warming trends of 0.96°C and 0.81°C per decade respectively; however, only Évora’s (EVRA) trend is statistical significant (). The average AATW values range from 23.97°C in Guarda (GRDA) to 30.12°C in Beja (BEJA).
The AIHD for Tmax also shows positive trends across all grid-points, ranging from 0.23°C per decade in Nazaré (NZRE) to 1.23°C per decade in Évora (EVRA). The highest increases are noted in Évora (EVRA, 1.23°C/decade), Beja (BEJA, 1.19°C/decade), and Faro (FARO, 1.18°C/decade). Statistically significant trends are identified in eight out of fifteen grid-points, indicating widespread intensification of Tmax heatwaves.
These findings indicate a general trend towards more persistent, hotter, and intense heatwaves across mainland Portugal over the study period. While all three heatwave characteristics show increasing trends, the most striking and potentially impactful change is observed in the persistence of heatwave occurrences. The annual number of heatwave days exhibits the most consistent and statistically significant increases across the studied 15 grid-points, particularly for Tmax. This trend towards more persistent heatwaves is especially pronounced in southern and coastal regions, with locations such as Lagos (LGOS), Faro (FARO), and Lisbon (LISB) experiencing some of the highest increases in heatwave days per decade. Presumably, the prolonged exposure to elevated temperatures by persistent heatwaves may pose greater risks to human health, ecosystems, and infrastructure than shorter, more intense heat events. Notably, while increases in average temperature during heatwaves and intensity are observed, they are generally less pronounced and less consistently significant across locations compared to the increases in persistence. The evolution of these trends is explored in the next subsection using the MKS test, which provides additional insights.
4.3. Temporal Evolution of Heatwave Characteristics
The Mann-Kendall-Sneyers (MKS) test was applied to analyse the temporal evolution of the three key heatwave characteristics (ANDH, AATW, and AIHD) for both Tmin and Tmax across the 15 grid-points, with results presented in Figure 5, Figure 6, and Figure 7. As mentioned, only the progressive statistic was represented in these figures. This decision was taken to focus on the forward evolution of trends and to simplify the visual interpretation of the results, as the progressive statistic offers sufficient information to identify significant trend changes over time. The MKS test yields standardised, dimensionless statistics indicating trend strength and direction over time, with positive values suggesting upward trends and negative values indicating downward trends. When these plots are interpreted, focus should be placed on areas where lines exceed significance thresholds (usually for confidence). Since the MKS calculations require a minimum number of data points [47,48], the initial years are excluded, leading to plots that start a few years after the beginning of the time series. In this application, the year 1980/1981 was excluded from the plots, and attention was given to the consistently upward trends observed from the 1990s onward.
Figure 5 illustrates the temporal evolution of annual number of heatwave days (ANDH) for (a) Tmin and (b) Tmax. For Tmin (Figure 5a), a gradual increase in ANDH is observed across most grid-points, with the trend becoming more pronounced in recent years. The southern locations, particularly FARO and LGOS, exhibit the most significant and consistent upward trends throughout the study period. These locations show values exceeding the significance threshold earlier and more consistently than other areas, indicating a robust warming signal. For instance, FARO’s values cross the significance threshold around 2005/2006 and remain consistently above it, suggesting a sustained increase in Tmin heatwave days. FARO shows a sharp increase in ANDH from approximately 12 days in the early 1980s to over 37 days by 2020/2021. In contrast, some northern and central locations, such as BGCA and CMBR, show more variable patterns with less pronounced trends, often not crossing the significance threshold. These locations exhibit fluctuations between 10 and 25 annual heatwave days of Tmin throughout much of the study period, with an upward trend only becoming apparent after 2019/2020. The ANDH trends for BGCA and CMBR culminate in notable peaks, reaching as high as 55 and 35 heatwave days per year, respectively. The values for BGCA, correspondingly, fluctuate around zero for the majority of the reference period, only showing a consistent positive trend in the last few years, aligning with the observed increase in heatwave days. This variability suggests regional differences in the evolution of Tmin heatwave frequency.
For Tmax (Figure 5b), the increase in ANDH is more evident and widespread across all grid-points. A notable acceleration in the upward trend is observed from the early 2000s onwards for most locations. The year 2002/2003, known for its severe heatwave in some parts of the Iberian Peninsula [50], marks a clear turning point in many locations, after which the ANDH values consistently exceed the long-term average. The coastal locations, including LGOS, FARO, and LISB, demonstrate the most substantial increases, with their values crossing the significance threshold earlier and remaining consistently above it. For example, LGOS shows a sharp increase in values from around 2000/2001, crossing the significance threshold around 2005/2006 and continuing to rise steeply thereafter. This suggests a more pronounced and sustained increase in Tmax heatwave days in these coastal locations compared to inland grid-points. By 2020/2021, these coastal locations (LGOS, FARO, and LISB) frequently experience over 45 annual heatwave days of Tmax, compared to 15-20 days per year in the 1980s.
Interestingly, even locations that showed less pronounced trends for Tmin, such as BGCA and CMBR, exhibit significant upward trends for Tmax. This discrepancy between Tmin and Tmax trends suggests that daytime temperatures are increasing more rapidly than nighttime temperatures in terms of heatwave frequency.
Figure 6 depicts the temporal evolution of annual average temperature during heatwaves (AATW) for (a) Tmin and (b) Tmax. For Tmin (Figure 6a), the trends are generally less pronounced and more variable across grid-points compared to ANDH. Some locations, such as BEJA and EVRA, show a gradual warming trend, with values approaching or occasionally exceeding the significance threshold in recent years—these locations with AATW Tmin values increasing by approximately 2.5°C over the 43-year hydrological reference period. For instance, BEJA’s values show a consistent upward trend from the mid-1990s, crossing the significance threshold briefly in the early 2010s. This suggests a gradual but significant increase in nighttime temperatures during warm periods in these southern inland locations. Other locations, such as AVRO and NZRE, exhibit more stable or slightly declining patterns, with values rarely crossing the significance thresholds. AVRO, for example, shows values fluctuating around zero throughout the study period, indicating little change in Tmin AATW. This stability in coastal locations could be attributed to the moderating influence of the North Atlantic Ocean on nighttime temperatures [40].
For Tmax (Figure 6b), the AATW trends are more distinct, with a majority of grid-points showing an upward trend, particularly from the late 1990s onwards. The inland southern locations, notably BEJA and EVRA, demonstrate the most significant warming trends, with their values consistently exceeding the significance threshold in recent years. In these locations, AATW values for Tmax have increased by approximately 4°C over the reference period, with particularly high values recorded in recent years such as 2017/2018 and 2022/2023. EVRA, for instance, shows a sharp increase in values from the early 2000s, crossing the significance threshold around 2010/2011 and continuing to rise thereafter. This indicates a substantial and sustained increase in daytime temperatures during warm periods in these areas. Coastal locations generally show less pronounced or more variable AATW trends for Tmax, with values fluctuating around the significance thresholds. LISB, for example, exhibits periods of both increasing and decreasing trends, with values crossing the significance threshold in both positive and negative directions at different times. This variability could be related to complex interactions between land and sea temperatures in coastal areas.
Figure 7 presents the temporal evolution of annual intensity of heatwave events (AIHD) for (a) Tmin and (b) Tmax. As with the previous figures, interpretation should focus on where values exceed the significance thresholds. For Tmin (Figure 7a), the trends in AIHD are generally positive but show considerable variability across grid-points. Southern locations, particularly BEJA and FARO, exhibit the most consistent and significant upward trends, with their values crossing and remaining above the significance threshold in recent years. In these locations, AIHD values for Tmin have increased by approximately 3.5°C over the study period. BEJA, for instance, shows a steady increase in values from the mid-1990s, crossing the significance threshold around 2010/2011 and continuing to rise. This indicates a significant intensification of nighttime heatwaves in these southern regions. Northern and central locations show more variable patterns, with values often fluctuating around the significance thresholds. BGCA, for example, exhibits periods of both increasing and decreasing trends, with values rarely exceeding the significance thresholds. This variability suggests that the intensity of nighttime heatwaves in these regions is less consistently increasing compared to southern areas.
The AIHD trends for Tmax (Figure 7b) are more pronounced and widespread compared to Tmin. A clear acceleration in the upward trend is observed from the early 2000s for most grid-points, with values consistently exceeding the significance thresholds. The inland southern locations, such as EVRA and BEJA, show the most substantial increases in AIHD, with their values crossing the significance threshold earlier and remaining consistently above it. By the end of the study period, these locations frequently record AIHD values 5°C higher than in the 1980s. EVRA, for example, demonstrates a sharp rise in values from the late 1990s, crossing the significance threshold around 2005/2006 and continuing to increase steeply thereafter. This indicates a dramatic intensification of daytime heatwaves in these inland southern regions. Coastal areas also demonstrate significant upward trends, albeit with some variability in the timing and consistency of threshold exceedance. FARO and LGOS, for instance, show strong upward trends in values, crossing the significance threshold in the early 2000s and remaining above it. However, the rate of increase is generally less steep compared to inland southern locations, possibly due to the moderating influence of the ocean on extreme temperatures [40].
These analyses reveal a consistent increase in the persistence of heatwave events for both Tmin and Tmax, with more pronounced trends for Tmax from 1980/1981 to 2022/2023. For Tmin, ANDH shows upward trends, particularly in southern locations, with Faro (FARO) experiencing an increase of 4.2 days per decade. The persistence of Tmax heatwaves demonstrates even greater increases, with 11 out of 15 grid-points exhibiting statistically significant rises in ANDH. Lagos (LGOS) shows the highest increase at 4.4 days per decade, followed closely by Lisbon (LISB) and Faro (FARO) at 4.2 days per decade. Therefore, it appears that coastal locations experience the most pronounced increases for both temperature variables. AIHD further supports this trend, with significant increases observed in southern regions. In contrast, AATW exhibits less change compared to ANDH and AIHD, indicating that the primary shift is occurring in the occurrence and intensity of heatwaves rather than their average temperature. These findings indicate a new pattern in heatwave occurrence and duration across Portugal, particularly in coastal and southern locations, signifying growing persistence of heatwave conditions. This increased persistence, particularly from the early 2000s onwards, suggests a potential climate regime shift in mainland Portugal.
5. Discussion
The analysis of heatwave characteristics across mainland Portugal from 1980/1981 to 2022/2023 reveals significant trends in the persistence and intensity of heatwave events, particularly for maximum temperatures (Tmax). These findings align with broader European and global trends of increasing heatwave frequency and severity [14].
5.1. Persistence of Heatwave Days
The consistent upward trend in the annual number of heatwave days (ANDH) for both Tmin and Tmax across all studied grid-points clearly indicates more days under heatwave conditions. This trend is particularly pronounced in coastal and southern Portugal, with Lisbon, Lagos, and Faro experiencing the most substantial increases for Tmax. These findings are consistent with observations across the Mediterranean region, where climate change is amplifying heatwave occurrences [51]. Interestingly, some grid-points show unexpected trends. For instance, Bragança (BGCA), located in the northern interior, exhibits a statistically significant increase in ANDH Tmax (3.0 days/decade, ), despite its inland location. This suggests that the intensification of heatwaves is not limited to coastal areas and may be influenced by local topography [52]. The spatial variability in heatwave persistence, with coastal areas showing more significant increases, suggests a potential influence of land-sea temperature contrasts on heatwave dynamics. This pattern may be related to changes in atmospheric circulation patterns, such as the strengthening of the Azores High, which has been linked to increased heatwave frequency in southwestern Europe [53].
5.2. Intensity of Heatwave Events
The increasing trends in the annual intensity of heatwave days (AIHD), particularly for Tmax, indicate that heatwaves are becoming hotter, although randomly. This intensification is especially evident in southern inland locations such as Évora (EVRA) and Beja (BEJA). The combination of increased frequency and intensity poses significant challenges for various sectors, including agriculture, public health, and energy demand [54]. Notably, some grid-points with less pronounced ANDH trends show significant increases in AIHD. For example, Guarda (GRDA), despite its moderate increase in ANDH Tmax (3.6 days/decade), shows a significant rise in AIHDT max (1.03°C/decade, . This highlights the importance of considering both frequency and intensity metrics when assessing heatwave trends [55].
5.3. Implications of Nighttime Temperature Trends
While Tmax trends are more pronounced, the increasing trends in Tmin heatwave characteristics, particularly in southern regions—exemplified by Faro (FARO)—are equally concerning. Elevated nighttime temperatures reduce the opportunity for nocturnal relief during heatwave events, potentially exacerbating health risks, especially for vulnerable populations [56]. Interestingly, some northern and central coastal locations such as Porto (PRTO) and Aveiro (AVRO) show contrasting trends. While both have similar, non-significant increases in ANDH Tmin, AVRO shows a significant increase in ANDH Tmax (3.6 days/decade, ), while PRTO’s increase is not statistically significant (2.9 days/decade, ). This difference suggests that local factors, such as urban heat island effects or specific coastal dynamics, may be influencing heatwave trends [57].
5.4. Statistical Significance and Climate Signals
The interpretation of statistical significance in climate trend analysis requires careful consideration. While traditional approaches might lead to discarding results that do not meet the arbitrary threshold, recent literature suggests a more nuanced approach [58]. In the context of this study, even trends that do not meet conventional significance thresholds may represent meaningful climate signals, especially when considered alongside statistically significant results and broader regional patterns. This approach aligns with that of Portela et al. [59], who mapped rainfall trends regardless of statistical significance, whilst highlighting locations meeting the selected significance level threshold. For instance, while Nazaré (NZRE) shows the lowest increases in both ANDH Tmin and ANDH Tmax, these trends still align with the overall pattern of increasing heatwave frequency across Portugal. The lack of statistical significance in these trends should not necessarily lead to their dismissal, but rather prompt further investigation into local factors that might be moderating heatwave intensification in this coastal location.
5.5. Spatial Patterns of Temperature Trends Across Mainland Portugal
The analysis of annual temperature and extreme values (AMIN and AMAX) trends across 1,012 grid-points in mainland Portugal from 1980/1981 to 2022/2023 reveals a complex spatial pattern of warming, corroborating and extending findings from the heatwave characteristics analysis. Examining the temperature trends offers a nuanced understanding of climate change impacts across different regions, highlighting the spatial variability of warming patterns. The use of high-resolution gridded data allows for a detailed assessment of local and regional variations.
Figure 8 illustrates a widespread warming trend in the annual means of both temperatures, with Tmax generally exhibiting more pronounced increases. This figure is particularly significant as it provides a clear visual representation of the spatial distribution of warming trends across mainland Portugal. Tmin trends range from 0.07°C to 0.29°C per decade, whilst Tmax trends are slightly higher, typically ranging from 0.07°C to 0.35°C per decade. The spatial pattern revealed in Figure 8 shows a clear west-east gradient in warming trends, with western regions experiencing more unnoticeable warming compared to eastern ones. For Tmax trends from north to south, northern coastal areas exhibit more moderate warming of around 0.13°C per decade, while southern regions show trends exceeding 0.30°C per decade. Notably, inland regions, e.g. Bragança (BGCA), show some of the highest warming rates, with the annual mean of Tmin increasing by 0.25°C per decade and that of Tmax by 0.27°C per decade. Overall, the results show pronounced warming in interior regions suggesting a potential amplification of continental climate effects under global warming. Coastal areas, particularly along the western coast, exhibit a more moderate warming trend. However, even these coastal regions are experiencing significant warming, with most grid points showing positive trends for both Tmin and Tmax.
Trends in annual mean temperatures also reveal interesting local variations that warrant further investigation. For instance, some mountainous regions in central Portugal, such as Serra da Estrela near Guarda (GRDA) and Castelo Branco (CABO), show slightly lower warming rates compared to surrounding lowlands, possibly due to altitude effects on temperature trends. Additionally, these trends align with the increasing frequency and intensity of heatwaves observed in the previous analysis, particularly for Tmax. The more rapid warming of Tmax compared to Tmin suggests an increase in daily temperature ranges.
The trends in the annual minimum (AMIN) temperatures, depicted in Figure 9, exhibit considerable variability across Portugal with a somewhat west-east gradient (from cooling on the coast to warming inland). AMIN Tmin trends range from approximately -0.20°C to 0.50°C per decade (Figure 9a), whilst AMIN Tmax trends are positive, ranging from about 0.05°C to 0.60°C per decade (Figure 9b). Interestingly, some coastal locations show moderate warming in AMIN Tmin but lower or even slight cooling trends in AMIN Tmax. For instance, Nazaré (NZRE), near the western coast, show positive trends for AMIN Tmin but negative trends for AMIN Tmax. Differently, eastern inland locations such as Bragança (BGCA) demonstrate warming trends in AMIN for both Tmin (0.34°C per decade) and Tmax (0.34°C per decade). These patterns suggest complex local factors influencing minimum temperatures, related to land-sea interactions and topographical features.
Figure 10, illustrating trends in the annual maximum (AMAX) temperatures, reveals consistently positive trends across Portugal, particularly for AMAX Tmax. The trends in AMAX Tmin range from slightly negative, localised values to approximately 0.55°C per decade, whereas AMAX Tmax trends are more pronounced, varying from about -0.14°C (also highly localised) to 0.61°C per decade. Notably, the strongest warming trends in AMAX Tmax occur in inland and southern regions. For instance, grid points in the northeast display robust increases exceeding 0.40°C per decade in Tmax AMAX. These substantial increases align with the observed intensification of heatwaves, particularly in inland Portugal.
The spatial patterns revealed by these analyses underscore the complexity of identifying climate change impacts on temperature trends in Portugal. Regional variability in heatwave characteristics highlights the need for tailored adaptation strategies, as different areas experience varying temperature changes. The strong warming trends in both AMIN and AMAX indicate a shift towards a warmer climate regime, emphasising the importance of comprehensive monitoring to inform effective adaptation and mitigation efforts.
6. Conclusions
The increasing persistence and intensity of heatwaves in Portugal, as revealed by this study, underscore the urgent need to identify climate change effects to develop robust climate adaptation strategies. These findings can inform policy decisions related to urban planning, public health preparedness, and agricultural practices. For instance, the pronounced trends in coastal areas highlight the need for specific adaptation measures in these densely populated regions, such as improved urban green spaces and building designs that mitigate heat stress [60]. In conclusion, this study provides robust evidence of increasing heatwave persistence and intensity across mainland Portugal, with particularly pronounced trends in inland southern regions, which are already experiencing water scarcity. The spatial variability in these trends, including very specific and local occurrences, underscores the complex interplay of geographical, meteorological, and anthropogenic factors in shaping local extreme temperature patterns. The mention of water scarcity is pertinent as heatwaves and water availability are intrinsically linked; prolonged high temperatures can exacerbate water stress through increased evapotranspiration and higher demand, potentially creating compound events with more severe socio-economic and environmental impacts than temperature extremes alone. This interconnection highlights the need for integrated climate adaptation strategies that address both heat and fresh water-related challenges in vulnerable regions. These findings emphasise the importance of targeted adaptation strategies and further research to mitigate the impacts of increasingly frequent and severe heatwaves in a changing climate, particularly in areas prone to water scarcity, thereby enhancing resilience to compound climate extremes and their cascading effects on different sectors.
Author Contributions
Conceptualization, L.A.E. and M.M.P; methodology, L.A.E.; software, L.A.E..; validation, L.A.E. and M.M.P.; formal analysis, L.A.E.; investigation, L.A.E.; resources, L.A.E.; data curation, L.A.E.; writing—original draft preparation, L.A.E.; writing—review and editing, M.M.P. and N.O.; visualization, L.A.E.; supervision, M.M.P. All authors have read and agreed to the published version of the manuscript.
Funding
This research received no external funding.
Institutional Review Board Statement
Not applicable.
Data Availability Statement
The data presented in this study are available on request from the corresponding author L.A.E. The data are not publicly available due to restrictions related to ongoing collaborative research projects and commitments to maintain the confidentiality of certain datasets.
Acknowledgments
This research was supported by the Foundation for Science and Technology (FCT) through funding UIDB/04625/2020 from the research unit CERIS and by the European Union’s Horizon 2020 research and innovation programme SCORE under grant agreement No 101003534.
Conflicts of Interest
The authors declare no conflicts of interest.
References
- Marx, W.; Haunschild, R.; Bornmann, L. Heat waves: a hot topic in climate change research. Theoretical and applied climatology 2021, 146, 781–800. [Google Scholar] [CrossRef] [PubMed]
- Klingelhöfer, D.; Braun, M.; Brüggmann, D.; Groneberg, D.A. Heatwaves: does global research reflect the growing threat in the light of climate change? Globalization and Health 2023, 19, 56. [Google Scholar] [CrossRef] [PubMed]
- Parente, J.; Pereira, M.; Amraoui, M.; Fischer, E.M. Heat waves in Portugal: Current regime, changes in future climate and impacts on extreme wildfires. Science of the total environment 2018, 631, 534–549. [Google Scholar] [CrossRef]
- Espinosa, L.A.; Portela, M.M.; Moreira Freitas, L.M.; Gharbia, S. Addressing the Spatiotemporal Patterns of Heatwaves in Portugal with a Validated ERA5-Land Dataset (1980–2021). Water 2023, 15, 3102. [Google Scholar] [CrossRef]
- Andrade, C.; Fraga, H.; Santos, J. Climate change multi-model projections for temperature extremes in Portugal. Atmospheric Science Letters 2014, 15, 149–156. [Google Scholar] [CrossRef]
- Muñoz-Sabater, J.; Dutra, E.; Agustí-Panareda, A.; Albergel, C.; Arduini, G.; Balsamo, G.; Boussetta, S.; Choulga, M.; Harrigan, S.; Hersbach, H.; others. ERA5-Land: A state-of-the-art global reanalysis dataset for land applications. Earth system science data 2021, 13, 4349–4383. [Google Scholar] [CrossRef]
- Andrade, H.; Nogueira, H. Climate change and heat-related mortality in six cities in Portugal: A warning to public health services. International Journal of Biometeorology 2014, 58, 1455–1460. [Google Scholar]
- Lee, V.; Zermoglio, F.; Ebi, K.; others. Heat waves and human health–emerging evidence and experience to inform risk management in a warming world; United States Agency for International Development, 2019. [Google Scholar]
- Kikstra, J.S.; Nicholls, Z.R.; Smith, C.J.; Lewis, J.; Lamboll, R.D.; Byers, E.; Sandstad, M.; Meinshausen, M.; Gidden, M.J.; Rogelj, J.; others. The IPCC Sixth Assessment Report WGIII climate assessment of mitigation pathways: from emissions to global temperatures. Geoscientific Model Development 2022, 15, 9075–9109. [Google Scholar] [CrossRef]
- IPCC. Annex II: Glossary [Möller, V., R. van Diemen, J.B.R. Matthews, C. Méndez, S. Semenov, J.S. Fuglestvedt, A. Reisinger (eds.)]. Climate Change 2022: Impacts, Adaptation and Vulnerability 2022.
- Coughlan de Perez, E.; Arrighi, J.; Marunye, J. Challenging the universality of heatwave definitions: gridded temperature discrepancies across climate regions. Climatic Change 2023, 176, 167. [Google Scholar] [CrossRef]
- Russo, S.; Dosio, A.; Graversen, R.G.; Sillmann, J.; Carrao, H.; Dunbar, M.B.; Singleton, A.; Montagna, P.; Barbola, P.; Vogt, J.V. Magnitude of extreme heat waves in present climate and their projection in a warming world. Journal of Geophysical Research: Atmospheres 2014, 119, 12–500. [Google Scholar] [CrossRef]
- IPCC. Climate Change 2013: The Physical Science Basis. Contribution of Working Group I to the Fifth Assessment Report of the Intergovernmental Panel on Climate Change. Agenda 2013, 6, 333. [Google Scholar]
- Perkins-Kirkpatrick, S.; Lewis, S. Increasing trends in regional heatwaves. Nature communications 2020, 11, 3357. [Google Scholar] [CrossRef] [PubMed]
- Perkins, S.E.; Alexander, L.; Nairn, J. Increasing frequency, intensity and duration of observed global heatwaves and warm spells. Geophysical Research Letters 2012, 39. [Google Scholar] [CrossRef]
- Perkins-Kirkpatrick, S.E.; Gibson, P.B. Changes in regional heatwave characteristics as a function of increasing global temperature. Scientific Reports 2017, 7, 12256. [Google Scholar] [CrossRef] [PubMed]
- Waha, K.; Krummenauer, L.; Adams, S.; Aich, V.; Baarsch, F.; Coumou, D.; Fader, M.; Hoff, H.; Jobbins, G.; Marcus, R.; others. Climate change impacts in the Middle East and Northern Africa (MENA) region and their implications for vulnerable population groups. Regional Environmental Change 2017, 17, 1623–1638. [Google Scholar] [CrossRef]
- Ramos, A.M.; Trigo, R.M.; Santo, F.E. Evolution of extreme temperatures over Portugal: recent changes and future scenarios. Climate Research 2011, 48, 177–192. [Google Scholar] [CrossRef]
- Cardoso, R.M.; Soares, P.M.; Lima, D.C.; Miranda, P.M. Mean and extreme temperatures in a warming climate: EURO CORDEX and WRF regional climate high-resolution projections for Portugal. Climate Dynamics 2019, 52, 129–157. [Google Scholar] [CrossRef]
- Medeiros, E.J.R. EU Funding to Promote Climate Change Adaptation and Risk Prevention and Management in Portugal: Potential Effects on Mitigating Health Hazards. In Climate Change and Health Hazards: Addressing Hazards to Human and Environmental Health from a Changing Climate; Springer, 2023; pp. 331–348. [Google Scholar]
- Change, I.P.O.C. Climate change 2007: The physical science basis. Agenda 2007, 6, 333. [Google Scholar]
- Gouveia, C.; Bastos, A.; Trigo, R.; DaCamara, C. Drought impacts on vegetation in the pre-and post-fire events over Iberian Peninsula. Natural Hazards and Earth System Sciences 2012, 12, 3123–3137. [Google Scholar] [CrossRef]
- Gaupp, F.; Hall, J.; Hochrainer-Stigler, S.; Dadson, S. Changing risks of simultaneous global breadbasket failure. Nature Climate Change 2020, 10, 54–57. [Google Scholar] [CrossRef]
- Pereira, M.G.; Others. The impact of heatwaves on extreme wildfire events in Portugal. Agricultural and Forest Meteorology 2020, 284, 107876. [Google Scholar] [CrossRef]
- IPMA. Instituto Português do Mar e da Atmosfera. Boletim Climático Portugal Continental Julho 2022, 2022. Available at: https://www.ipma.pt/resources.www/docs/im.publicacoes/edicoes.online/20221215/VshAWFnRwypDAtUBOCCn/cli_20220701_20220731_pcl_mm_co_pt.pdf.
- IPMA. Instituto Português do Mar e da Atmosfera. Relatório Sobre os Incêndios Rurais: Análise Meteorológica & Índices de Perigo e de Risco Julho 2022, 2022. Available at: https://www.ipma.pt/resources.www/docs/im.publicacoes/edicoes.online/20220920/aLPaHsIyJXBPjLidMnfC/met_20220701_20220731_fog_mm_co_pt.pdf.
- Viegas, D.X.; Pereira, M.G.; Ferreira, M.G.; Silva, I.; Dias, M.; Oliveira, T.; Moreira, J.; Tarantola, S. Climate change and the increasing risk of wildfires in Portugal. Environmental Research Letters 2022, 17, 044003. [Google Scholar] [CrossRef]
- Russo, S.; Sillmann, J.; Sterl, A. Country-level risk factors for the incidence of non-communicable diseases in rural India. Environmental Research Letters 2015, 10, 124003. [Google Scholar] [CrossRef]
- Nairn, J.; Fawcett, R. Establishing the Heat Wave Index in the NWS Grid in the United States; NOAA/National Weather Service, 2015. [Google Scholar]
- Coles, S. An introduction to statistical modeling of extreme values; Springer, 2001; Vol. 208. [Google Scholar]
- Soares, A.; Vieira, J. Climate variability and change in Portugal: A review. Climatic Change 2012, 112, 1–21. [Google Scholar]
- Mora, C.; Vieira, J. Climate change impacts on the Portuguese climate: A review. Atmosphere 2020, 11, 1281. [Google Scholar]
- Davy, R.; Esau, I. The role of reanalysis data in climate research: A review. Earth-Science Reviews 2019, 193, 1–15. [Google Scholar]
- Almeida, M.; Coelho, P. A first assessment of ERA5 and ERA5-Land reanalysis air temperature in Portugal. Climate Dynamics 2022, 59, 1234–1250. [Google Scholar] [CrossRef]
- Zittis, G.; Dandou, A. Evaluation of ERA5 reanalysis data for temperature extremes in the Mediterranean region. International Journal of Climatology 2020, 40, 1561–1574. [Google Scholar]
- European Centre for Medium-Range Weather Forecasts (ECMWF). ERA5-Land: A new dataset for land surface temperature and other variables. Technical Memorandum 877, ECMWF, 2021.
- Espinosa, L.A.; Portela, M.M.; Matos, J.P. ERA5-Land Reanalysis Temperature Data Addressing Heatwaves in Portugal. International Congress on Engineering and Sustainability in the XXI Century; Springer, 2023; pp. 81–94. [Google Scholar]
- Belo-Pereira, M.; Dutra, E.; Viterbo, P. Climate in Portugal during the 20th century: A brief overview. Revista Portuguesa de Meteorologia e Geofísica 2009, 5, 1–17. [Google Scholar]
- Santos, F.D.; Forbes, K.; Moita, R. Climate change in Portugal. Scenarios, impacts and adaptation measures - SIAM Project; Gradiva: Lisbon, Portugal, 2002. [Google Scholar]
- Miranda, P.M.A.; Coelho, F.E.S.; Tomé, A.R.; Valente, M.A. Climate change in Portugal: Scenarios, impacts, and adaptation measures. Project SIAM: Gradiva, Lisbon, 2002. [Google Scholar]
- Santos, J.A.; Malheiro, A.C.; Pinto, J.G.; Jones, G.V. Homogenization of Portuguese long-term temperature data series: Lisbon, Coimbra and Porto. Earth System Science Data 2012, 4, 187–213. [Google Scholar] [CrossRef]
- Chen, Y.; Zhai, P.; Zhou, B.; Zeng, Z.; Jiang, T. Local mechanisms for global daytime, nighttime, and compound heatwaves. npj Climate and Atmospheric Science 2023, 6, 26. [Google Scholar] [CrossRef]
- Copernicus European Drought Observatory. Heat and Cold Wave Index (HCWI). Edo indicator factsheet, European Commission, 2018.
- Mann, H.B. Nonparametric tests against trend. Econometrica: Journal of the Econometric Society 1945, 245–259. [Google Scholar] [CrossRef]
- Sen, P.K. Estimates of the regression coefficient based on Kendall’s tau. Journal of the American Statistical Association 1968, 63, 1379–1389. [Google Scholar] [CrossRef]
- R Core Team. Mann-Kendall trend test and the Sen slope; R Foundation for Statistical Computing, 2024. [Google Scholar]
- Sneyers, R. On the statistical analysis of series of observations; Number 143 in WMO Technical Note,; World Meteorological Organization: Geneva, Switzerland, 1990. [Google Scholar]
- Chen, X.; Wang, H.; Lyu, W.; Xu, R. The Mann-Kendall-Sneyers test to identify the change points of COVID-19 time series in the United States. BMC Medical Research Methodology 2022, 22, 233. [Google Scholar] [CrossRef]
- Cleveland, W.S. Robust locally weighted regression and smoothing scatterplots. Journal of the American statistical association 1979, 74, 829–836. [Google Scholar] [CrossRef]
- Garc’ıa-Herrera, R.; Hern’andez, E.; Barriopedro, D.; Paredes, D.; Trigo, R.M.; Trigo, I.F.; Mendes, M.A. The impact of the 2003 heat wave and the 2005 drought on electricity consumption in Spain. Energy Policy 2010, 38, 6855–6865. [Google Scholar]
- Diffenbaugh, N.S.; Giorgi, F.; Pal, J.S. Mediterranean climate change during the Holocene: Evidence from global and regional climate modelling. The Holocene 2007, 17, 1167–1179. [Google Scholar]
- Miralles, D.G.; Teuling, A.J.; van Heerwaarden, C.C.; de Arellano, J.V.G. Mega-heatwaves in the future: projections for Southern Europe. Environmental Research Letters 2014, 9, 034009. [Google Scholar]
- Sousa, P.M.; Ramos, A.M.; Trigo, R.M.; Liberato, M.L.; Nieto, R. Projected changes in atmospheric rivers affecting Europe in CMIP5 models. Geophysical Research Letters 2018, 45, 12–255. [Google Scholar]
- Russo, S.; Sillmann, J.; Fischer, E.M. Top ten European heatwaves since 1950 and their occurrence in the coming decades. Environmental Research Letters 2015, 10, 124003. [Google Scholar] [CrossRef]
- Russo, E.; Domeisen, D.I. Increasing intensity of extreme heatwaves: the crucial role of metrics. Geophysical Research Letters 2023, 50, e2023GL103540. [Google Scholar] [CrossRef]
- Roy’e, D.; Codesido, R.; Tobías, A.; Taracido, M. Increasing temperatures, increasing risks: Nighttime temperature and the risk of cardiovascular mortality in Spain. Environmental Research 2021, 195, 110793. [Google Scholar]
- Fenner, D.; Meier, F.; Bechtel, B.; Otto, M.; Scherer, D. Intra and inter ’local climate zone’variability of air temperature as observed by crowdsourced citizen weather stations in Berlin, Germany. Meteorologische Zeitschrift 2017, 26, 525–547. [Google Scholar] [CrossRef]
- Stahel, W.A. New relevance and significance measures to replace p-values. PLoS One 2021, 16, e0252991. [Google Scholar] [CrossRef] [PubMed]
- Portela, M.M.; Espinosa, L.A.; Zelenakova, M. Long-term rainfall trends and their variability in mainland Portugal in the last 106 years. Climate 2020, 8, 146. [Google Scholar] [CrossRef]
- Santamouris, M. Recent progress on urban overheating and heat island research. Integrated assessment of the energy, environmental, vulnerability and health impact. Synergies with the global climate change. Energy and Buildings 2020, 207, 109482. [Google Scholar] [CrossRef]
Figure 1.
Geographical distribution and temperature data across mainland Portugal: (a) topography and the ERA5-Land 1,012 grid-points used for analysis; (b) average of minimum daily temperatures, Tmin, over the 43 hydrological years from 1980/1981 to 2022/2023, with the names of the 15 focal grid-points indicated; (c) average of maximum daily temperatures, Tmax, for the same period, with the corresponding location codes shown. Maps in (b) and (c) were produced using the 1,012 grid-points and Inverse Distance Weighting with a power of 2 (IDW2).
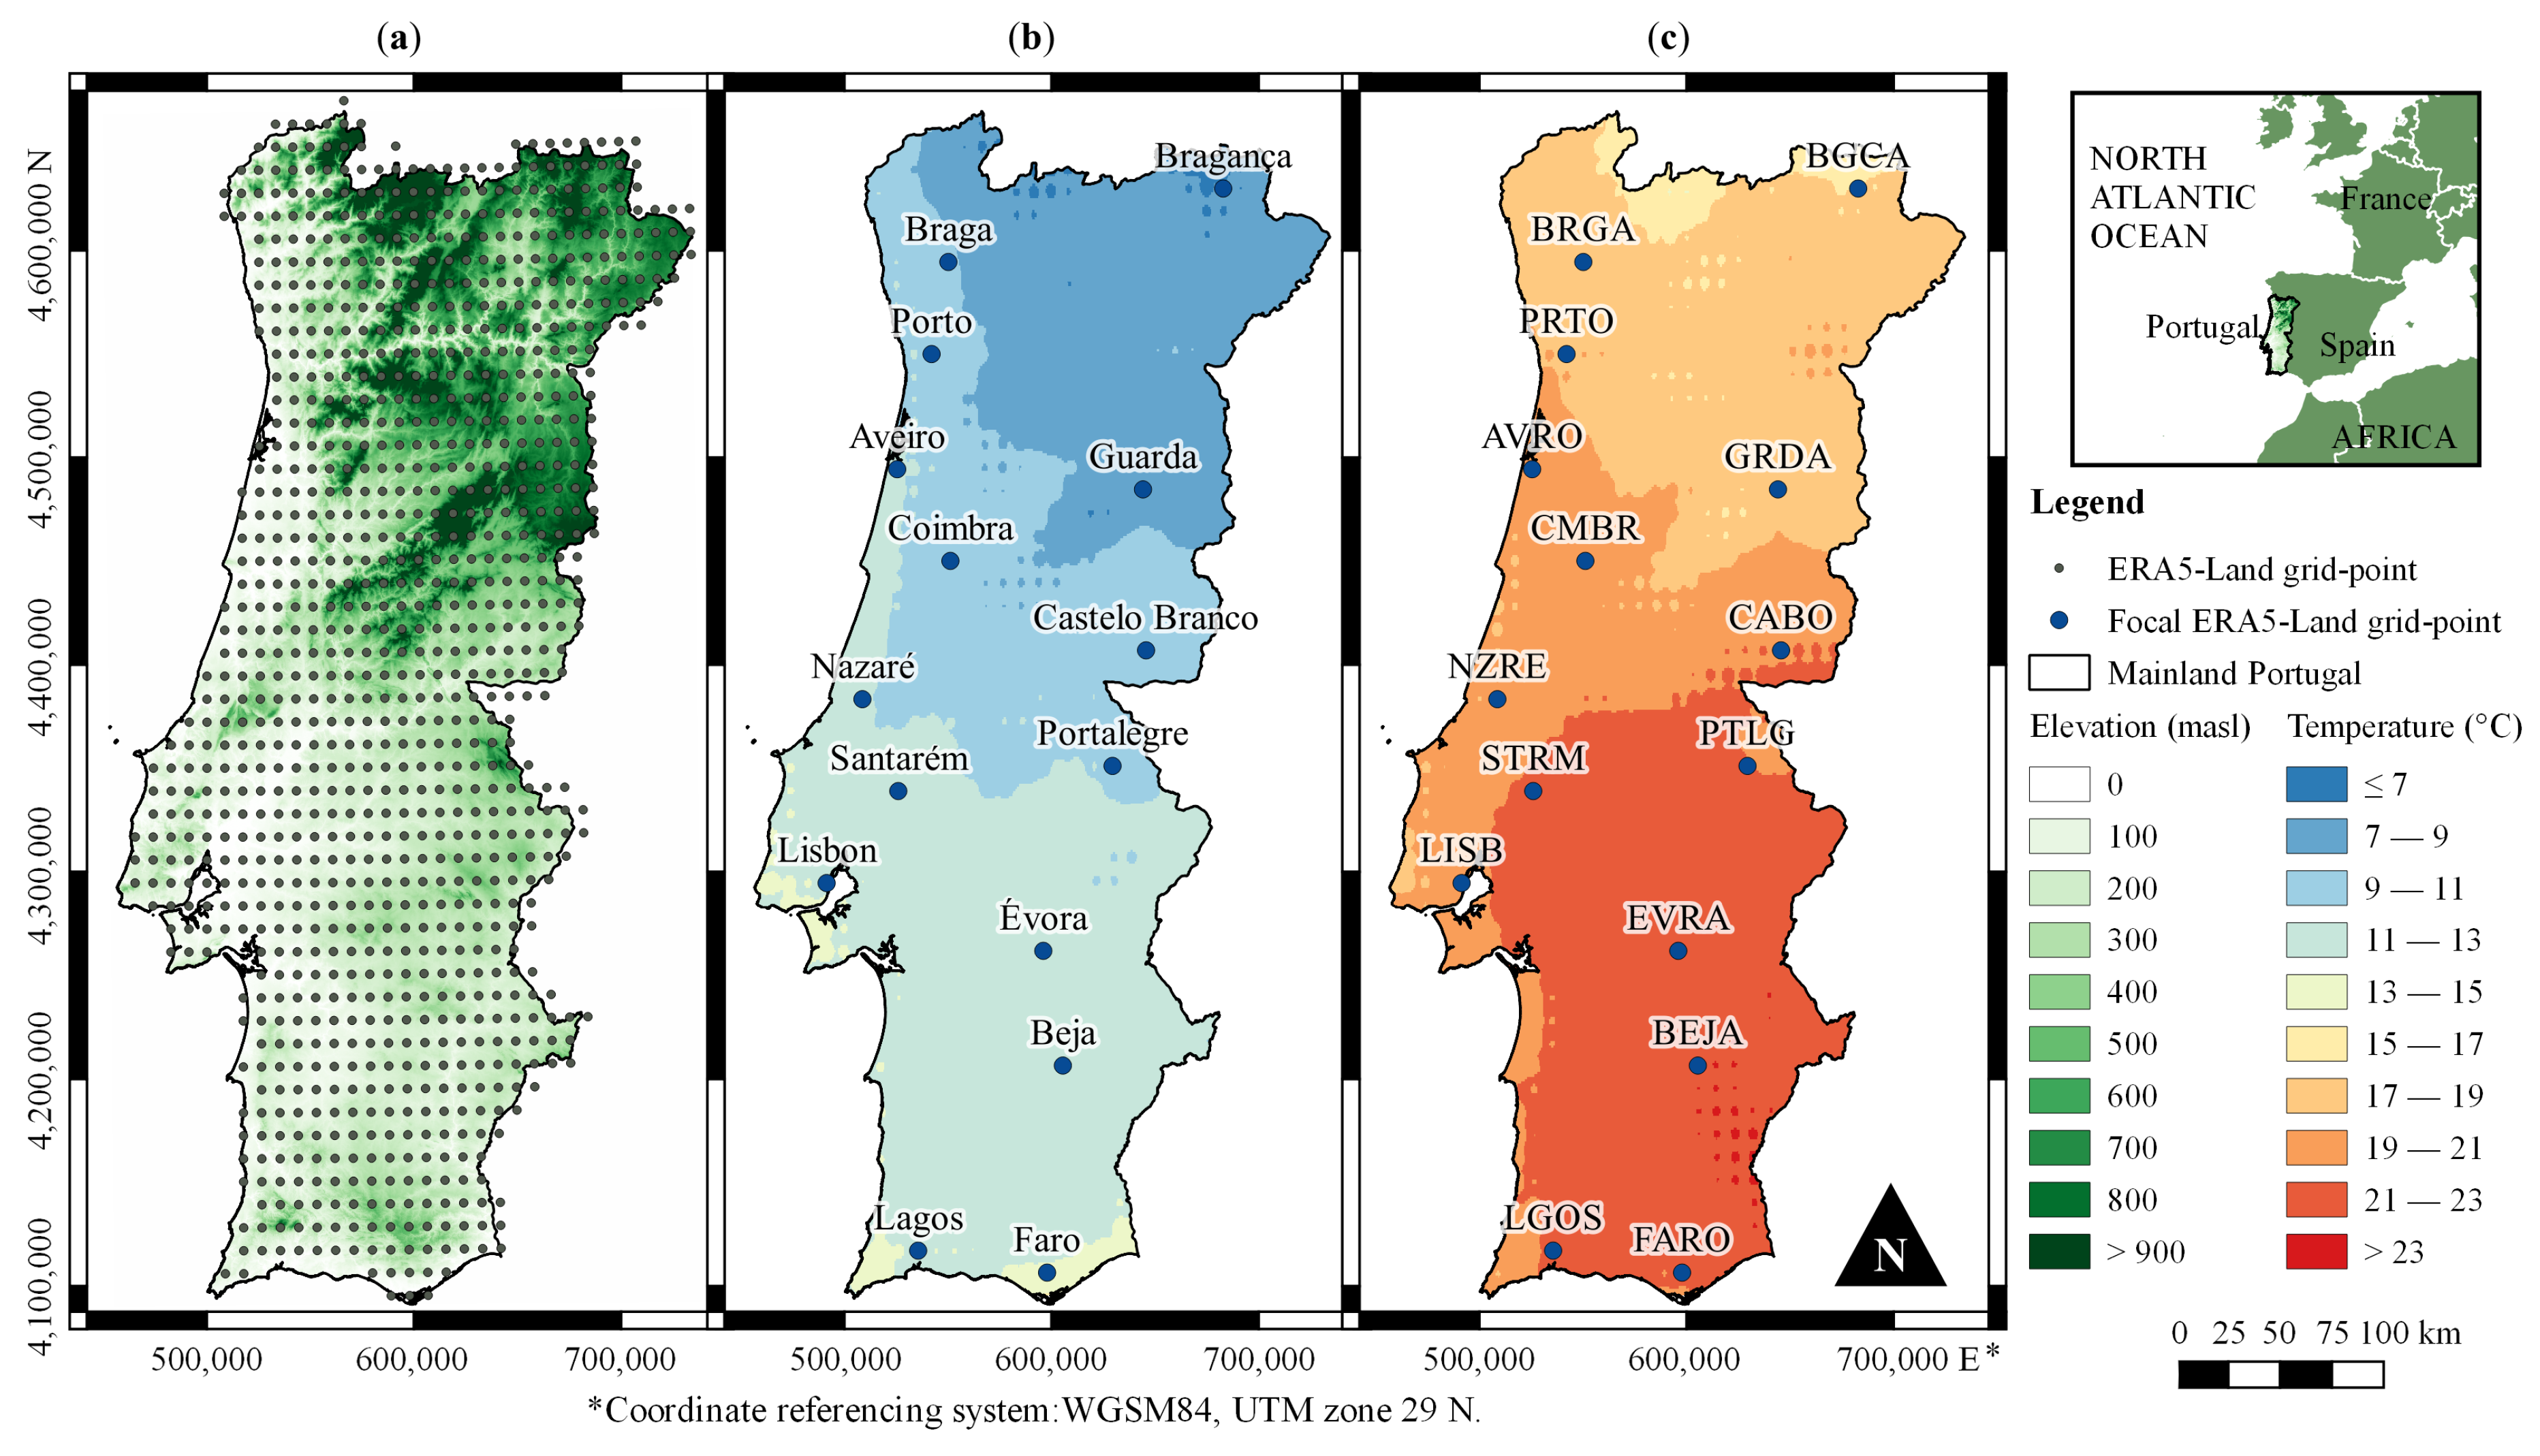
Figure 2.
Averages of annual minimum daily temperatures from 1980/1981 to 2022/2023: (a) for the minimum temperatures (AMIN Tmin), with the names of the 15 focal Portuguese locations indicated; (b) for the maximum temperatures (AMIN Tmax) for the same period, with corresponding location codes shown. Maps were produced using the 1,012 grid-points and IDW2.
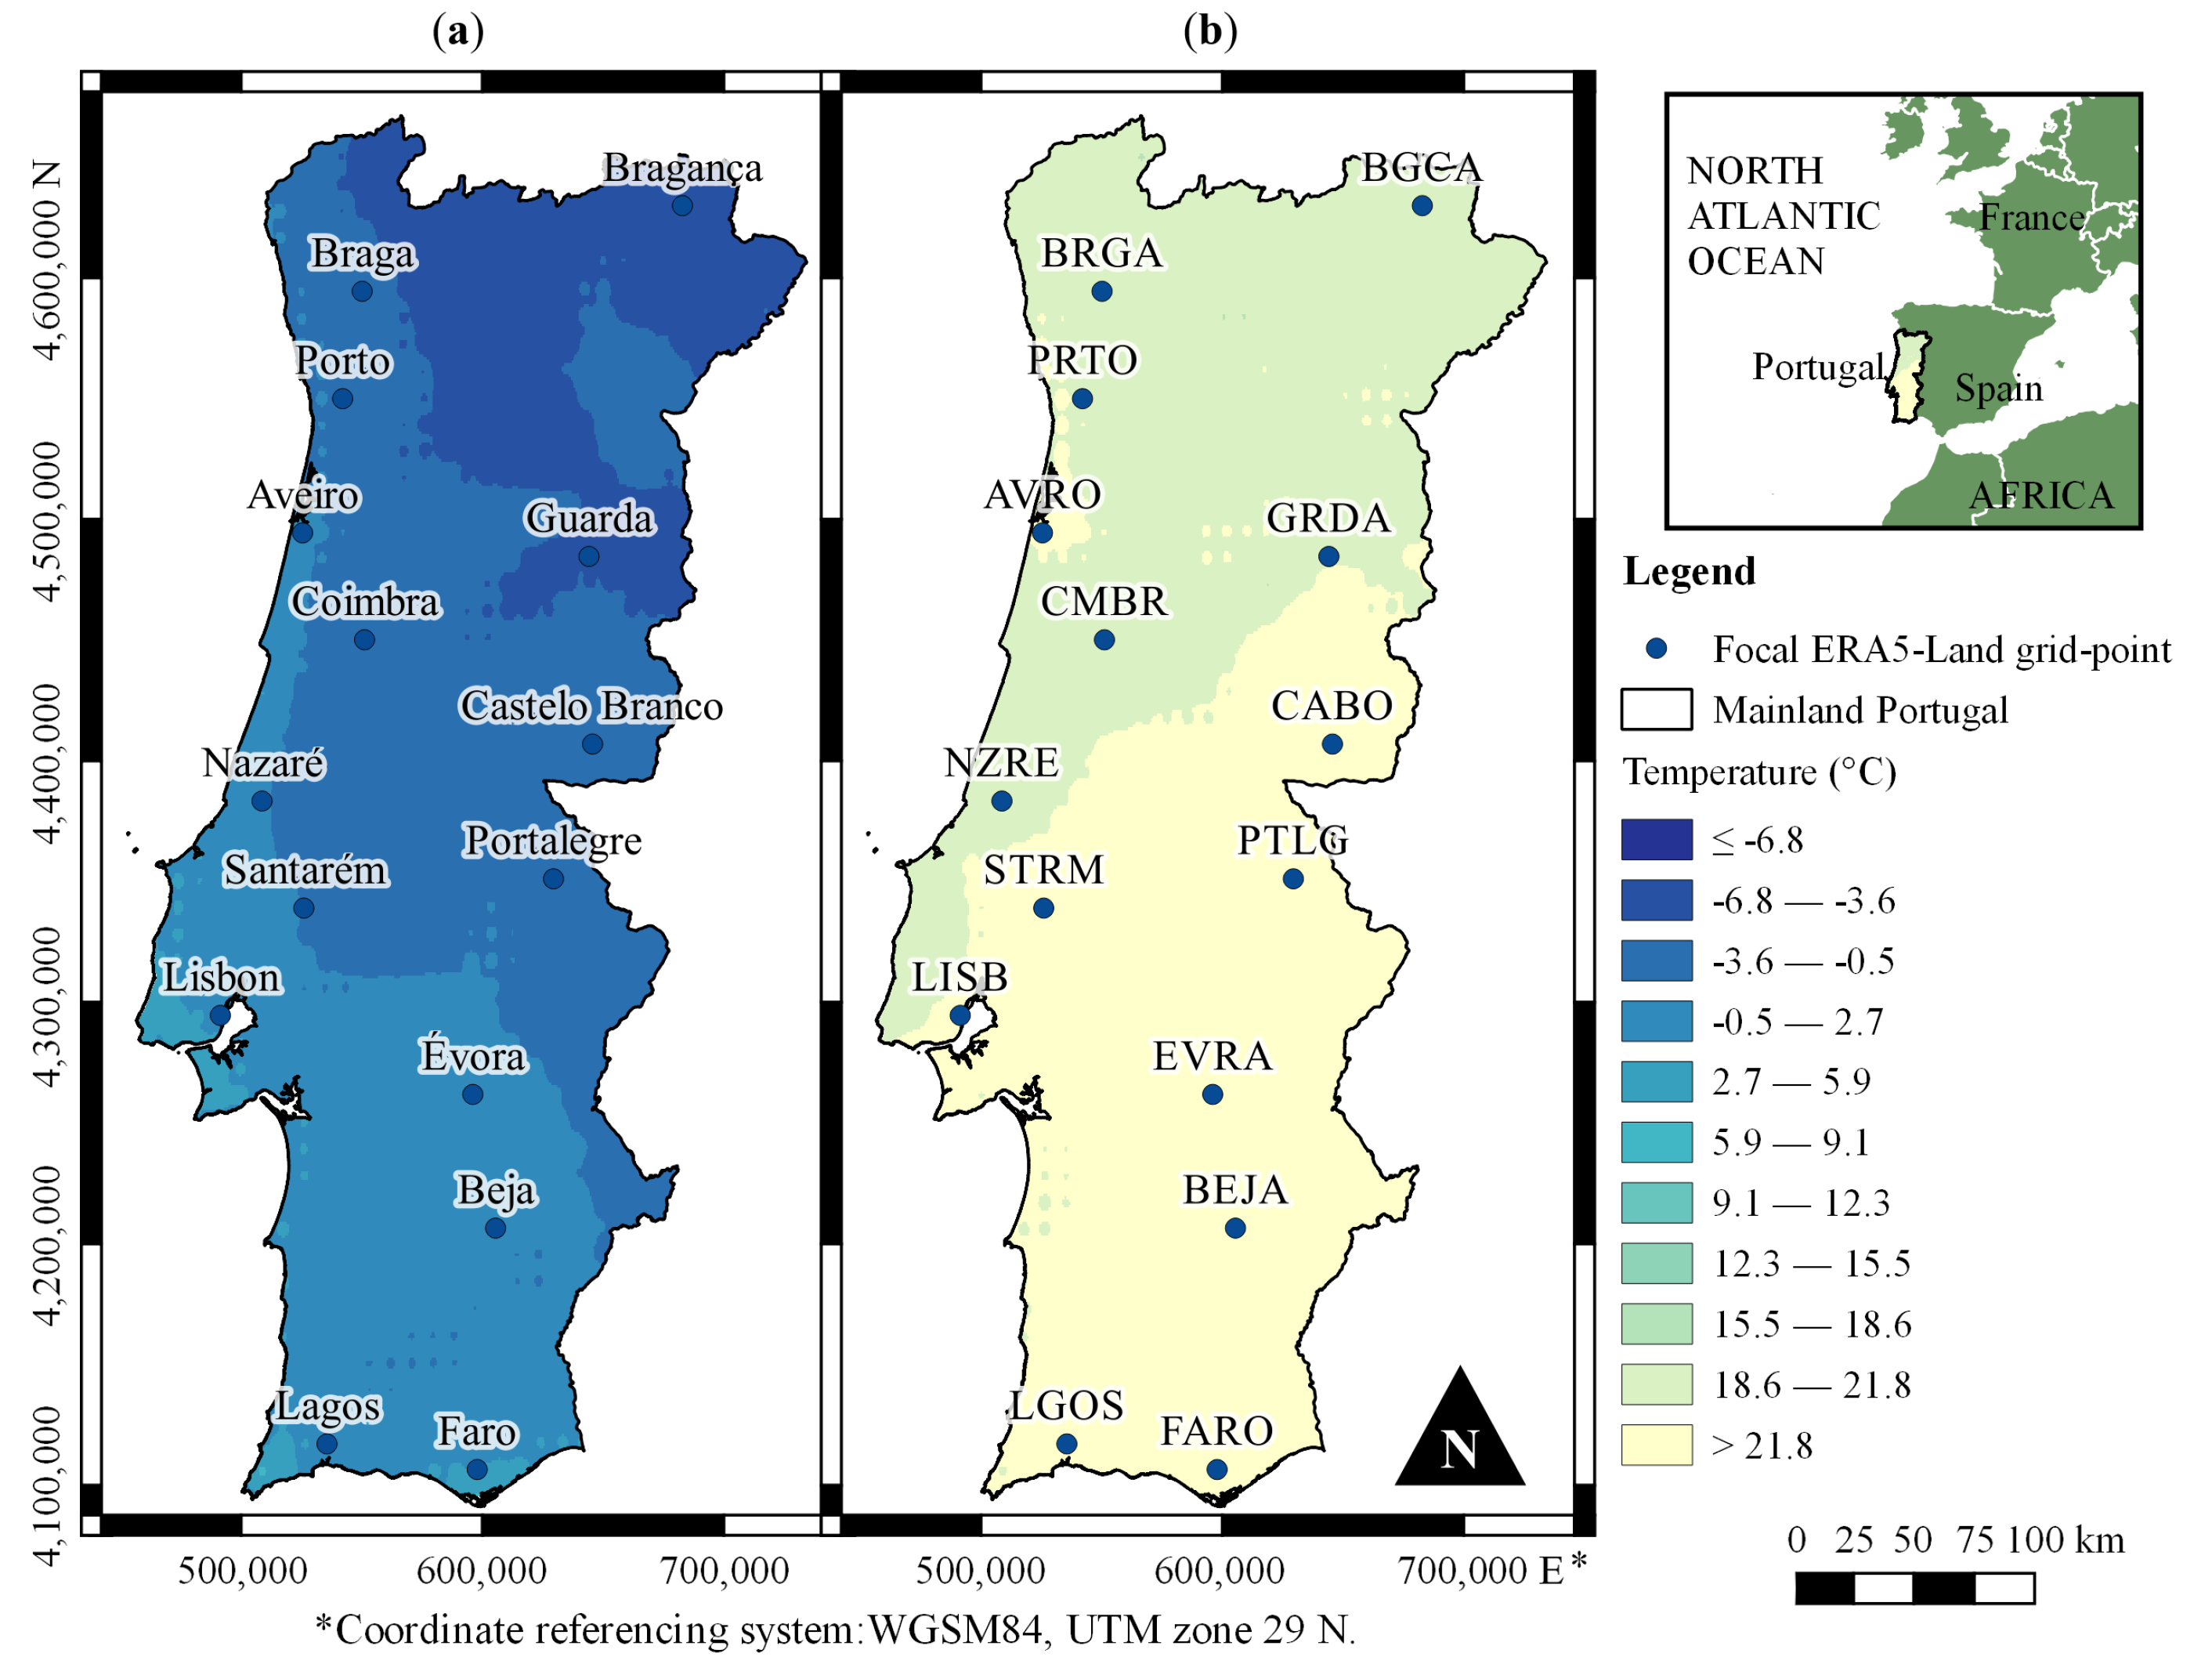
Figure 3.
Averages of annual maximum daily temperatures from 1980/1981 to 2022/2023: (a) for the minimum temperatures (AMAX Tmin), with the names of the 15 focal Portuguese locations indicated; (b) for the maximum temperatures (AMAX Tmax) for the same period, with corresponding location codes shown. Maps were produced using the 1,012 grid-points and IDW2.
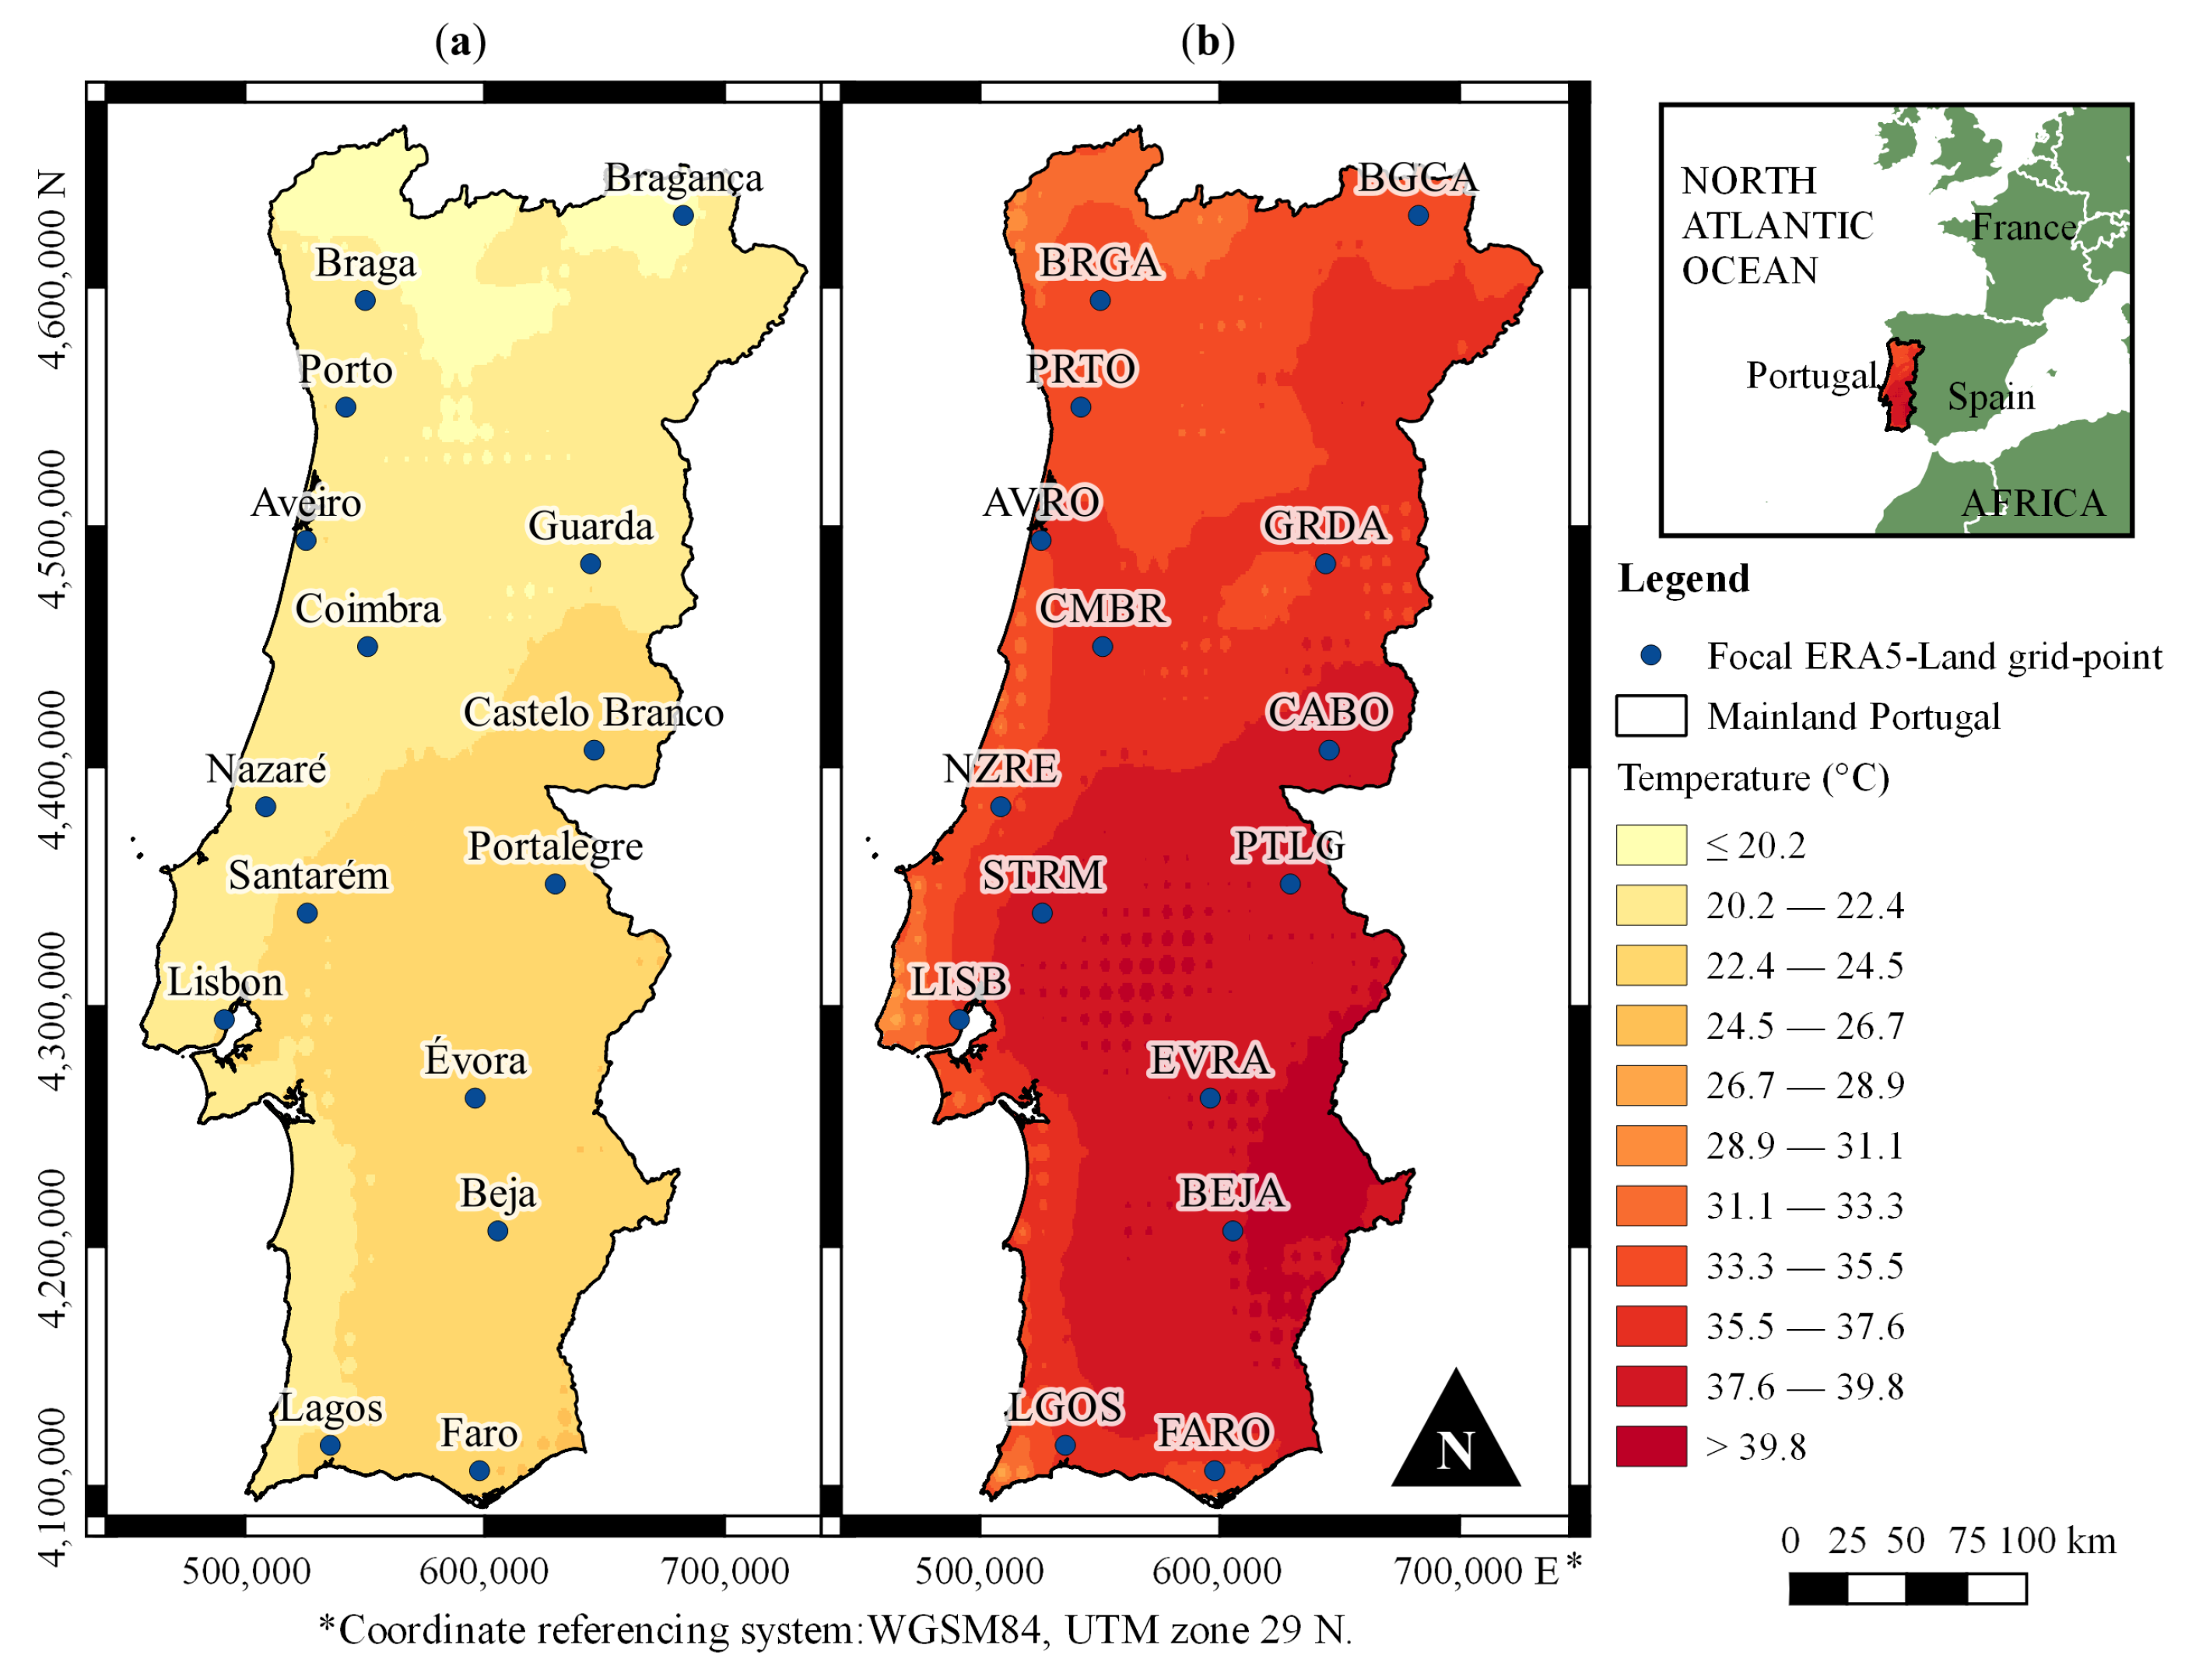
Figure 4.
Heatwave thresholds () for (a) Tmin and (b) Tmax across 15 focal grid-points in mainland Portugal. Thresholds were calculated as the 90th percentile of daily temperatures for the hydrological years 1980/1981 to 2022/2023. The grid-points, listed from north to south and west to east, include (codes between brackets): Bragança (BGCA), Braga (BRGA), Porto (PRTO), Aveiro (AVRO), Guarda (GRDA), Coimbra (CMBR), Castelo Branco (CABO), Nazaré (NZRE), Portalegre (PTLG), Santarém (STRM), Lisbon (LISB), Évora (EVRA), Beja (BEJA), Lagos (LGOS), and Faro (FARO).
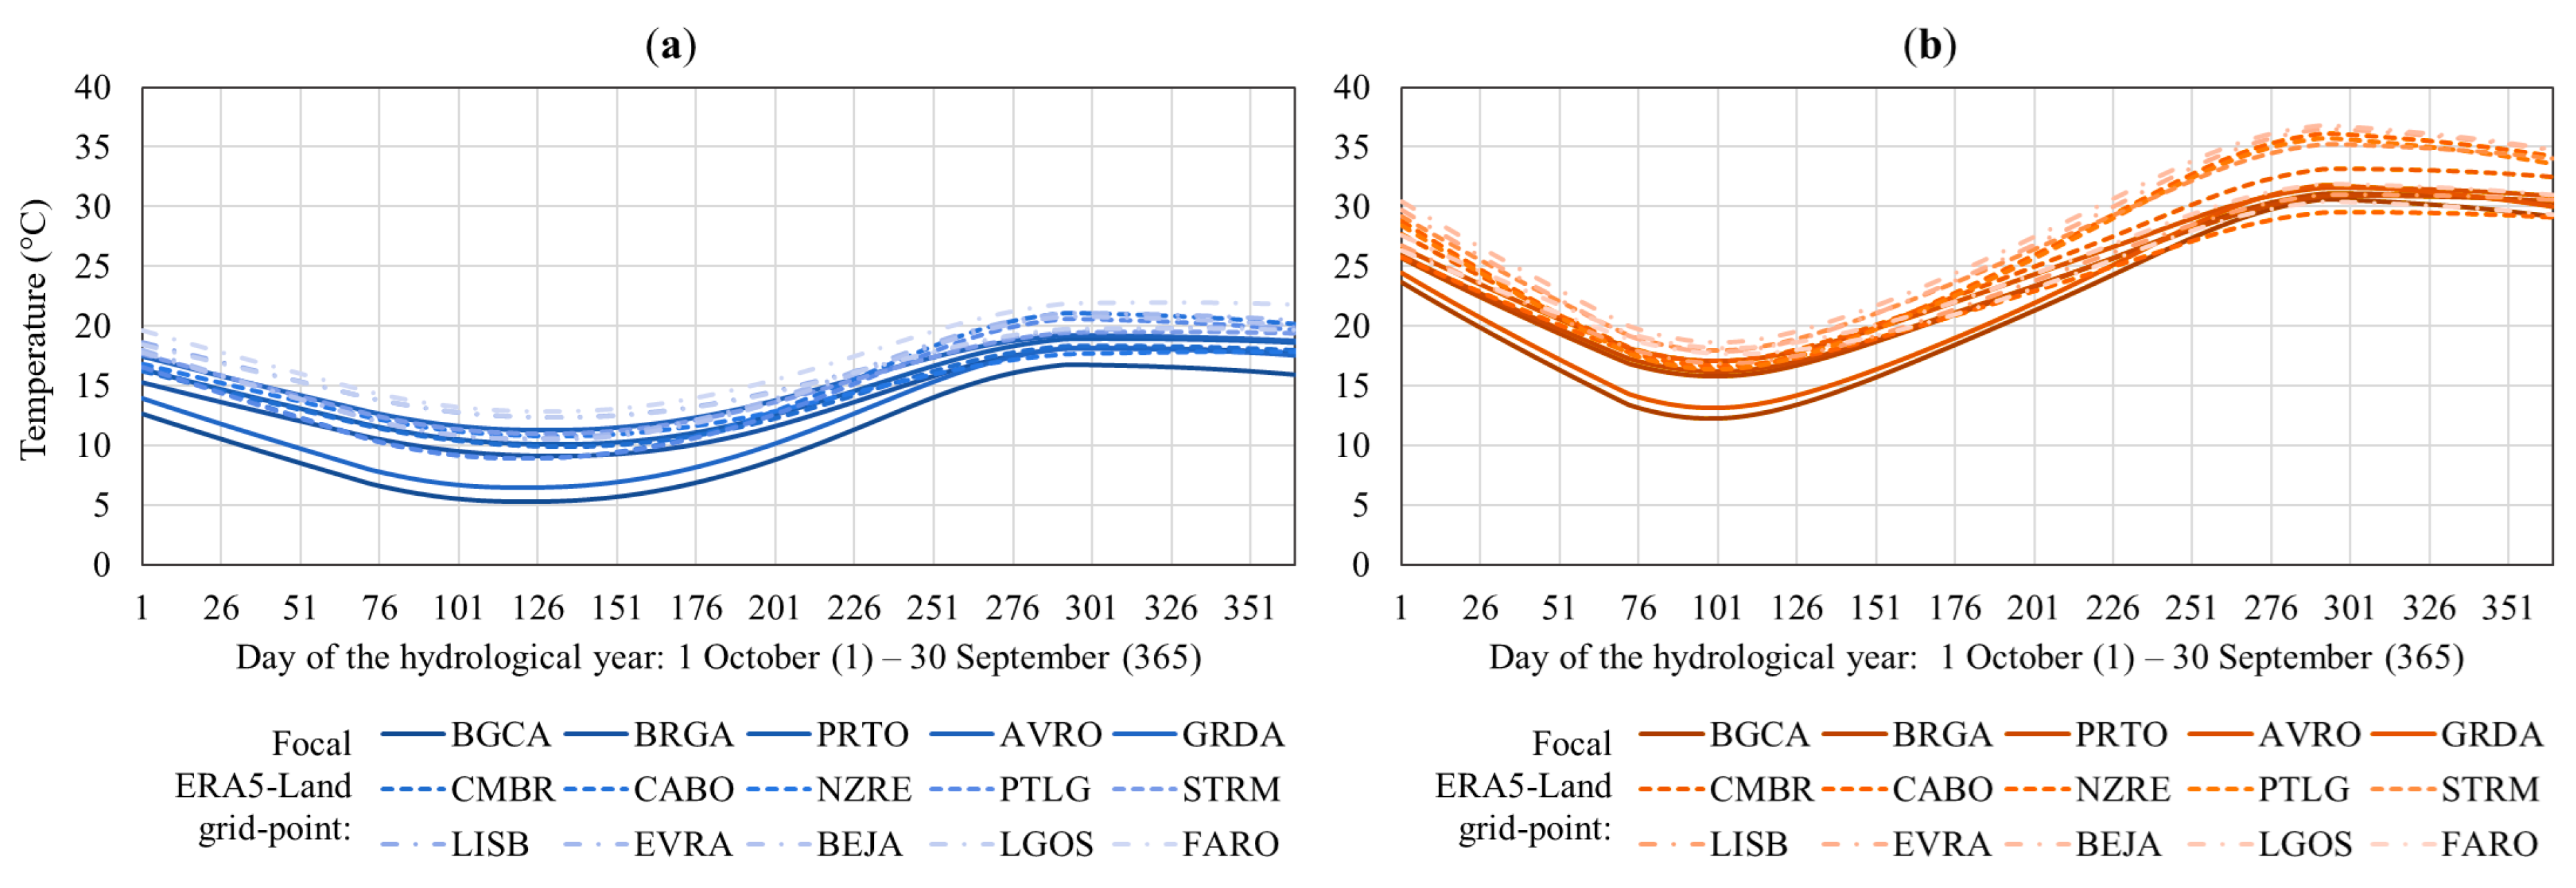
Figure 5.
Temporal evolution of annual number of heatwave days (ANDH) for (a) Tmin and (b) Tmax across 15 focal grid-points in mainland Portugal, based on the Mann-Kendall-Sneyers (MKS) test. The progressive statistic is shown, with Kendall’s normalised tau on the y-axis. Tau values outside the range indicate statistically significant trends at the confidence level.
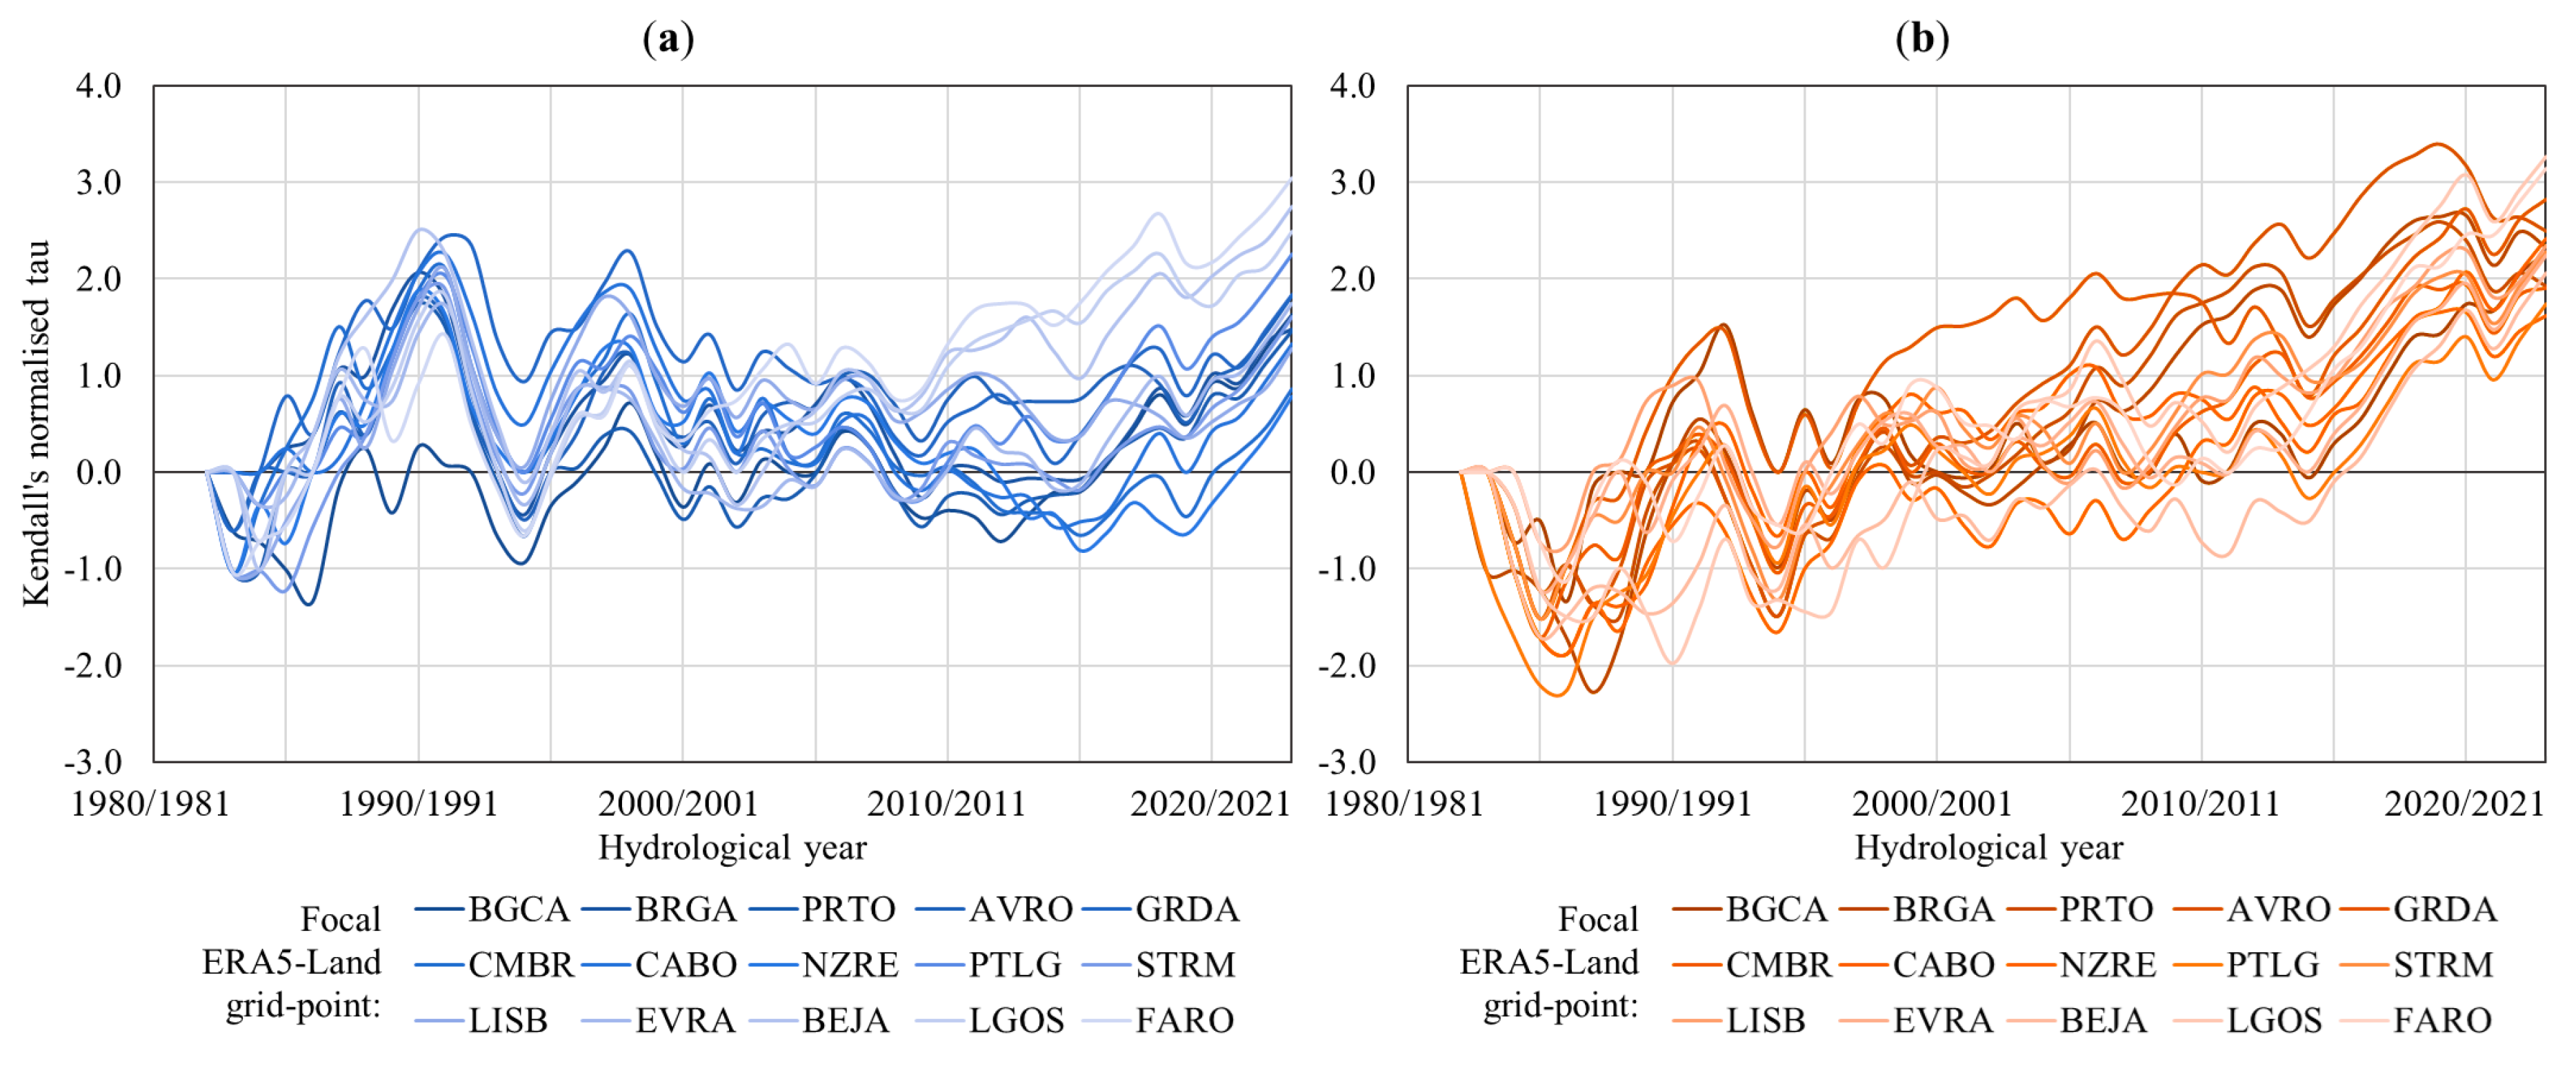
Figure 6.
Temporal evolution of annual average temperature during heatwaves (AATW) for (a) Tmin and (b) Tmax across 15 focal grid-points in mainland Portugal, based on the Mann-Kendall-Sneyers (MKS) test. The progressive statistic is shown, with Kendall’s normalised tau on the y-axis. Tau values outside the range indicate statistically significant trends at the confidence level.
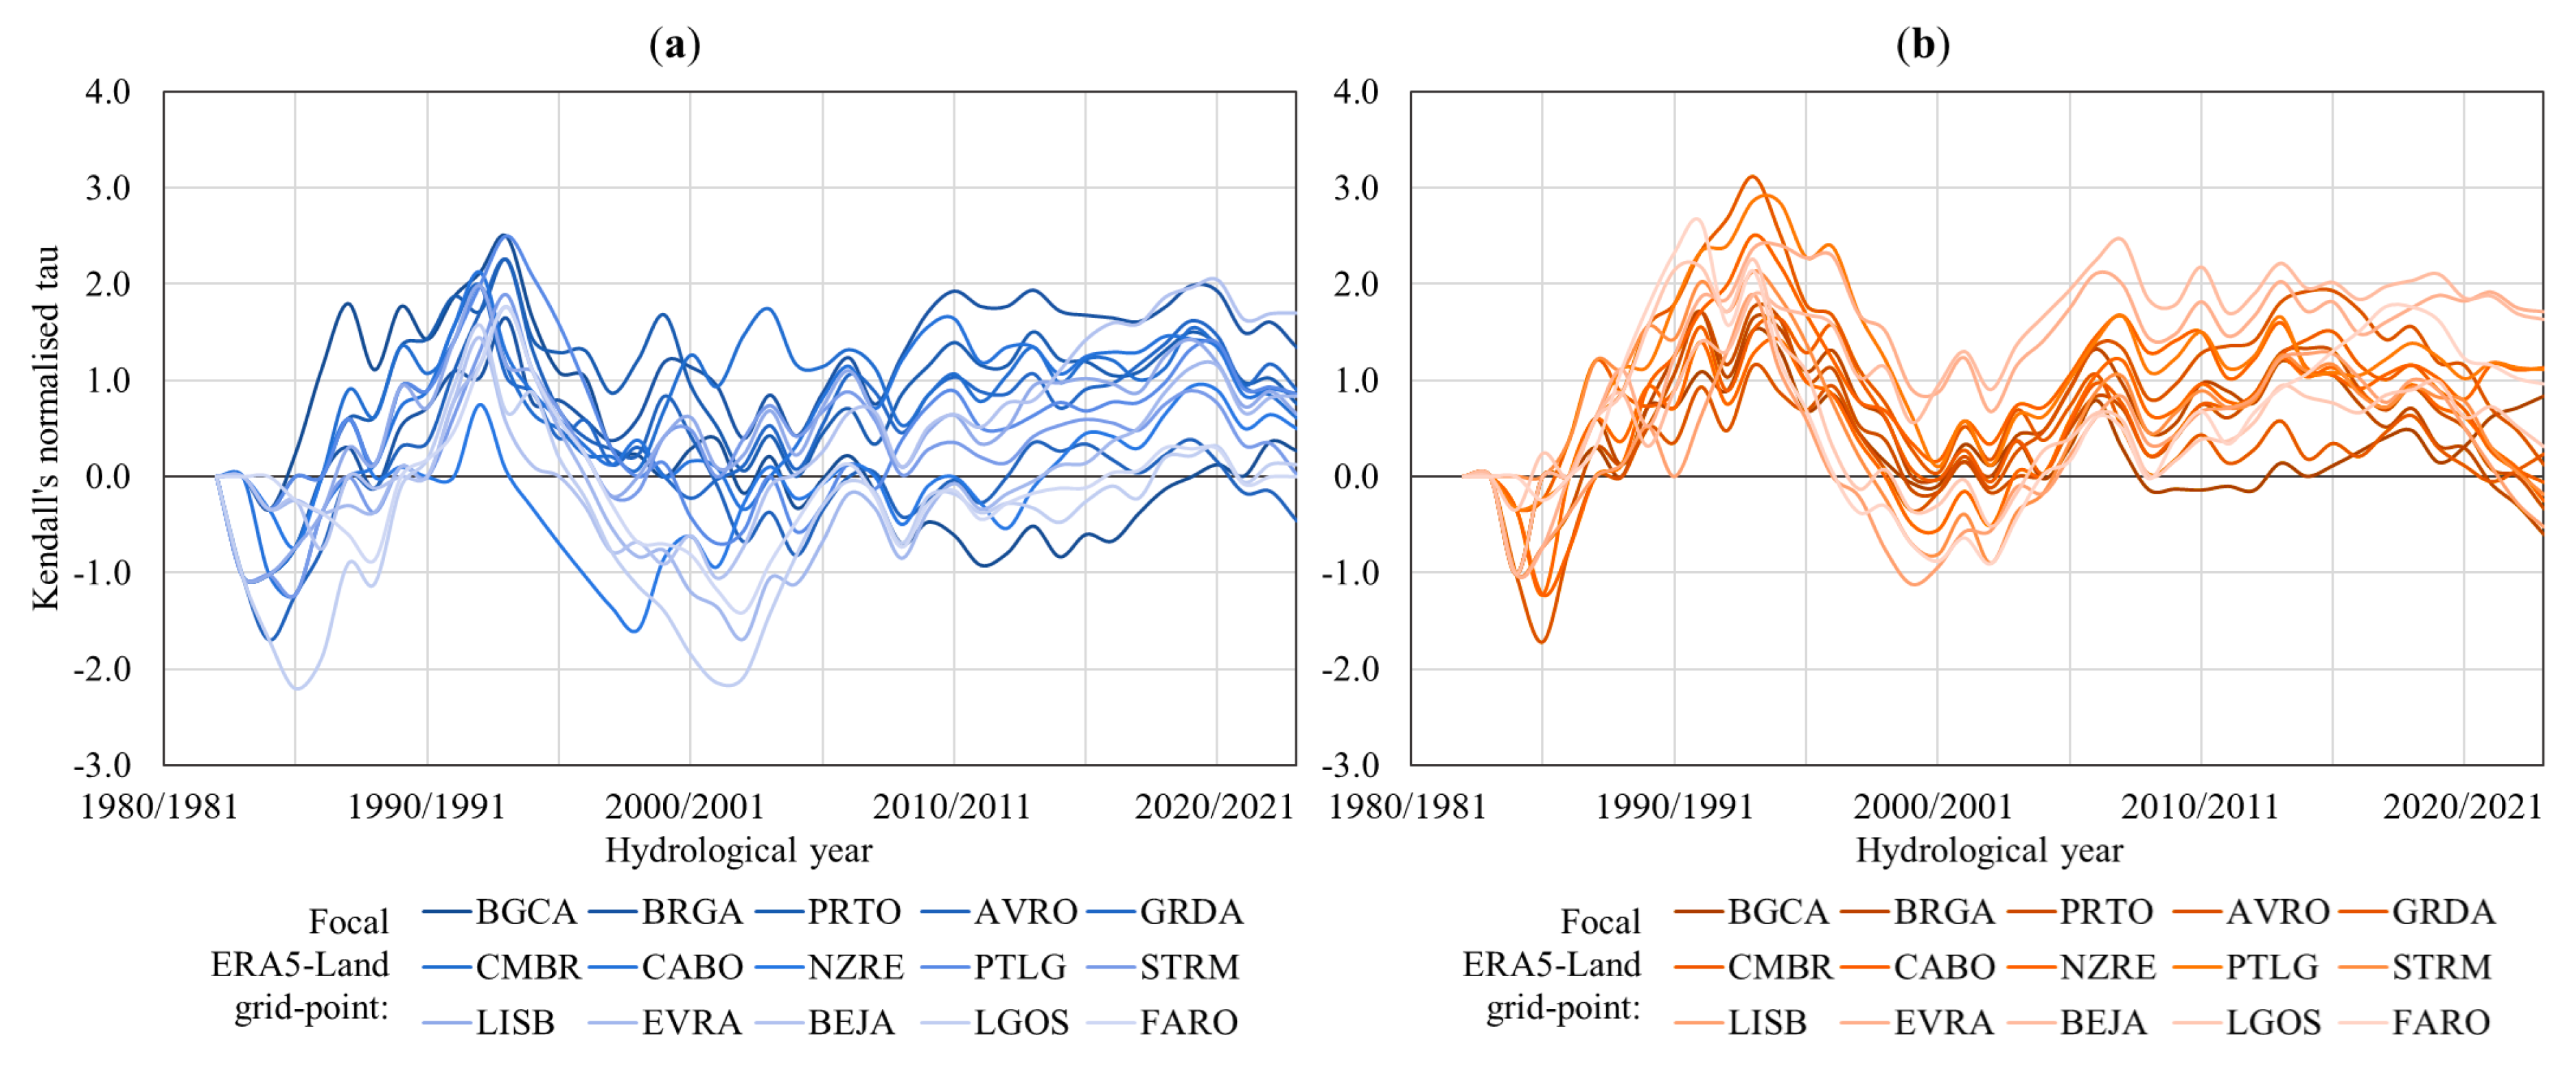
Figure 7.
Temporal evolution of annual intensity of heatwave events (AIHD) for (a) Tmin and (b) Tmax across 15 focal grid-points in mainland Portugal, based on the Mann-Kendall-Sneyers (MKS) test. The progressive statistic is shown, with Kendall’s normalised tau on the y-axis. Tau values outside the range indicate statistically significant trends at the confidence level.
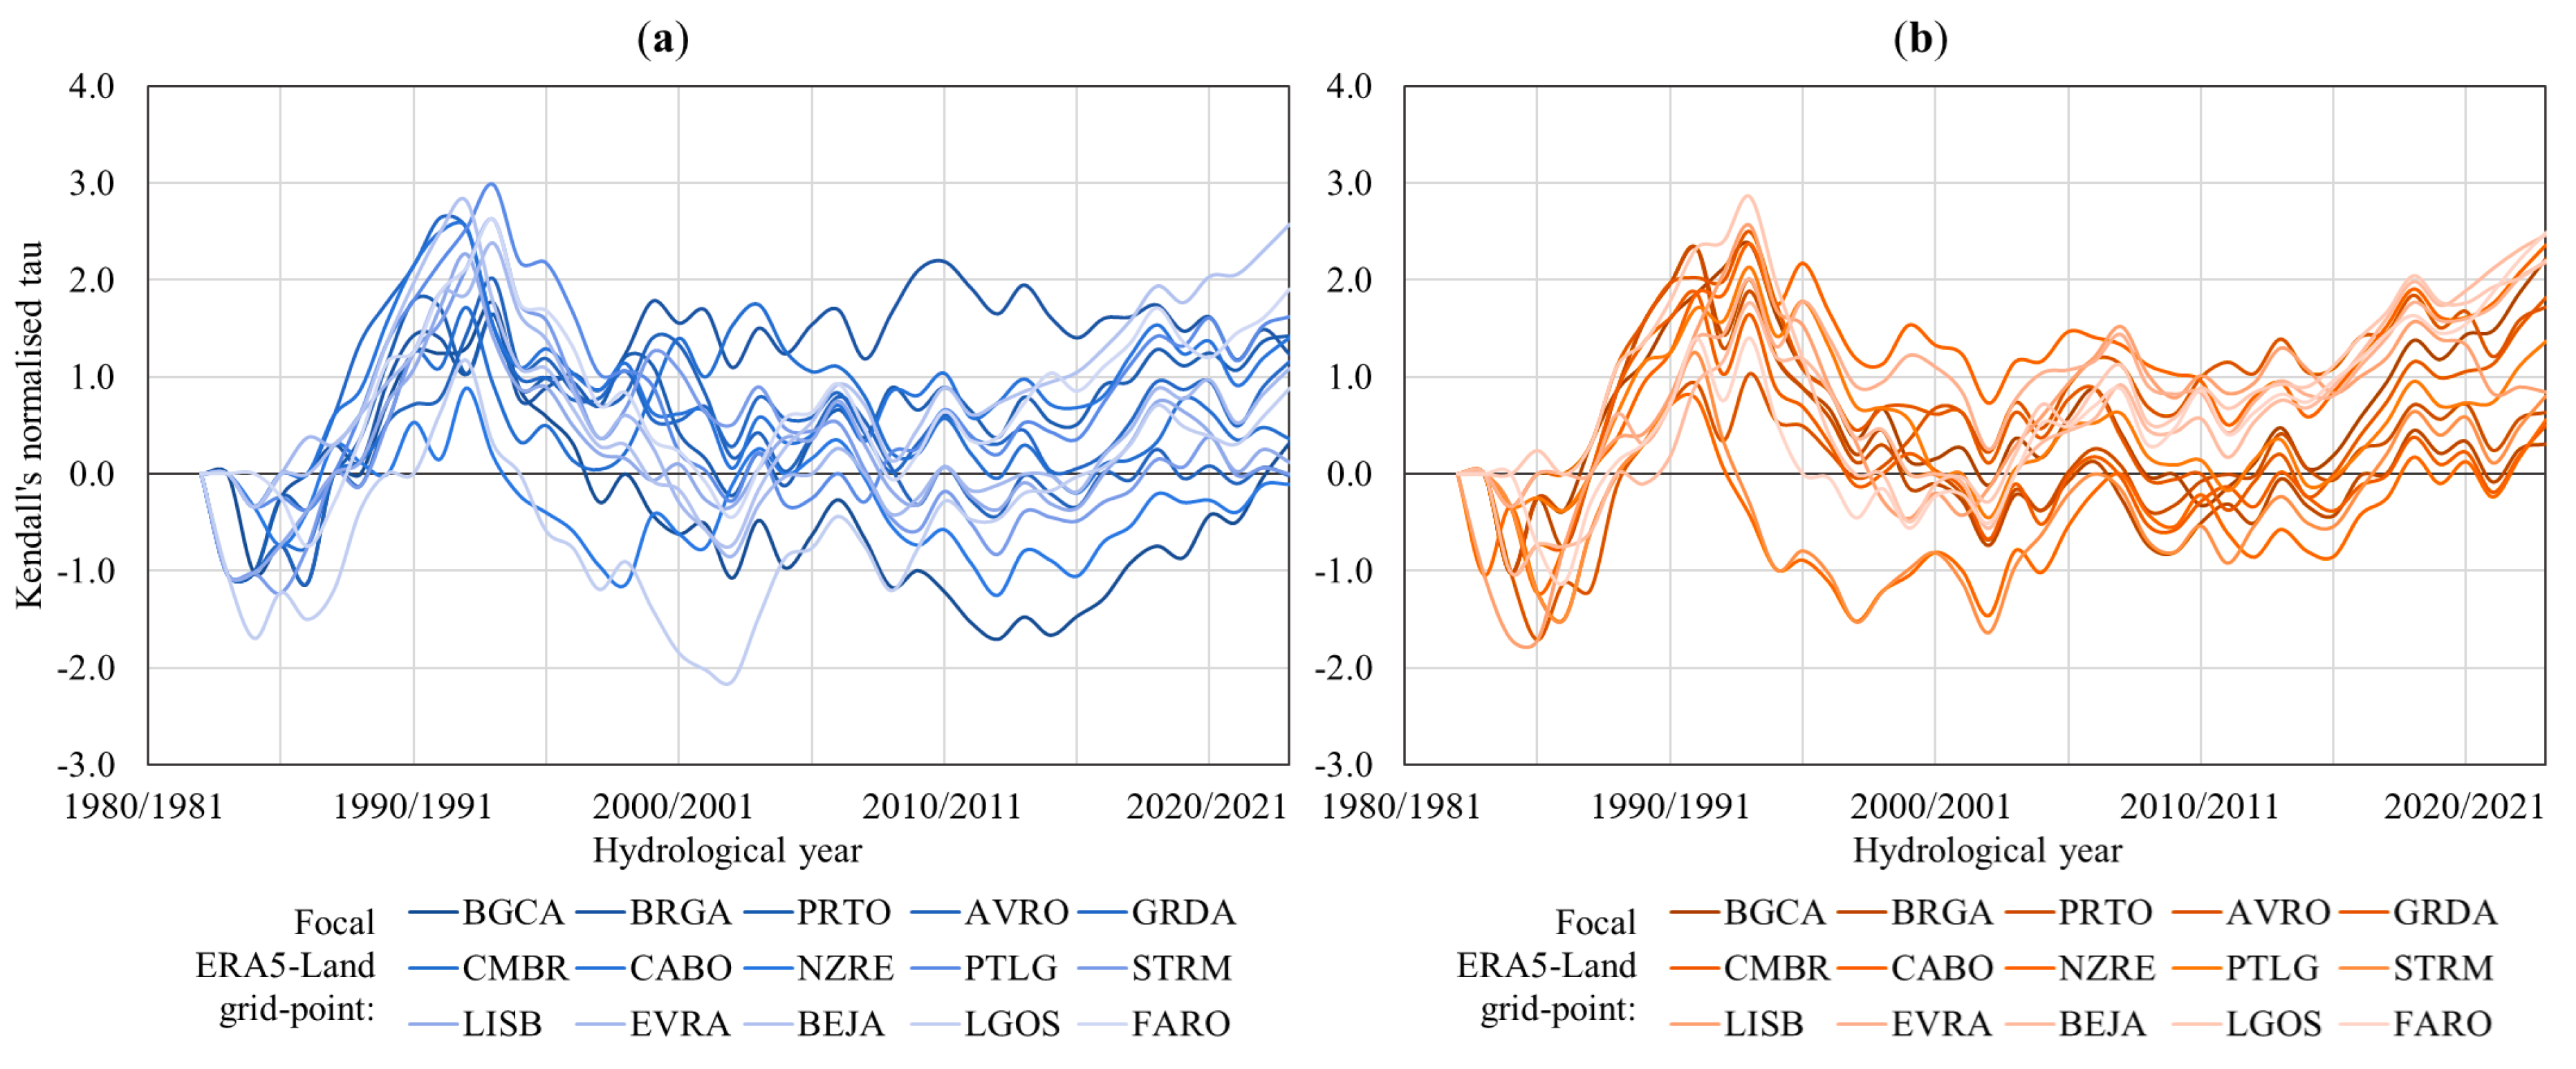
Figure 8.
Decadal trends based on Sen’s slope and 43 annual means, from 1980/1981 to 2022/2023, of (a) Tmin, with the names of 15 focal grid-points indicated; and (b) Tmax, with corresponding region codes shown. Maps were produced using 1,012 grid-points and IDW2 interpolation.
Figure 8.
Decadal trends based on Sen’s slope and 43 annual means, from 1980/1981 to 2022/2023, of (a) Tmin, with the names of 15 focal grid-points indicated; and (b) Tmax, with corresponding region codes shown. Maps were produced using 1,012 grid-points and IDW2 interpolation.
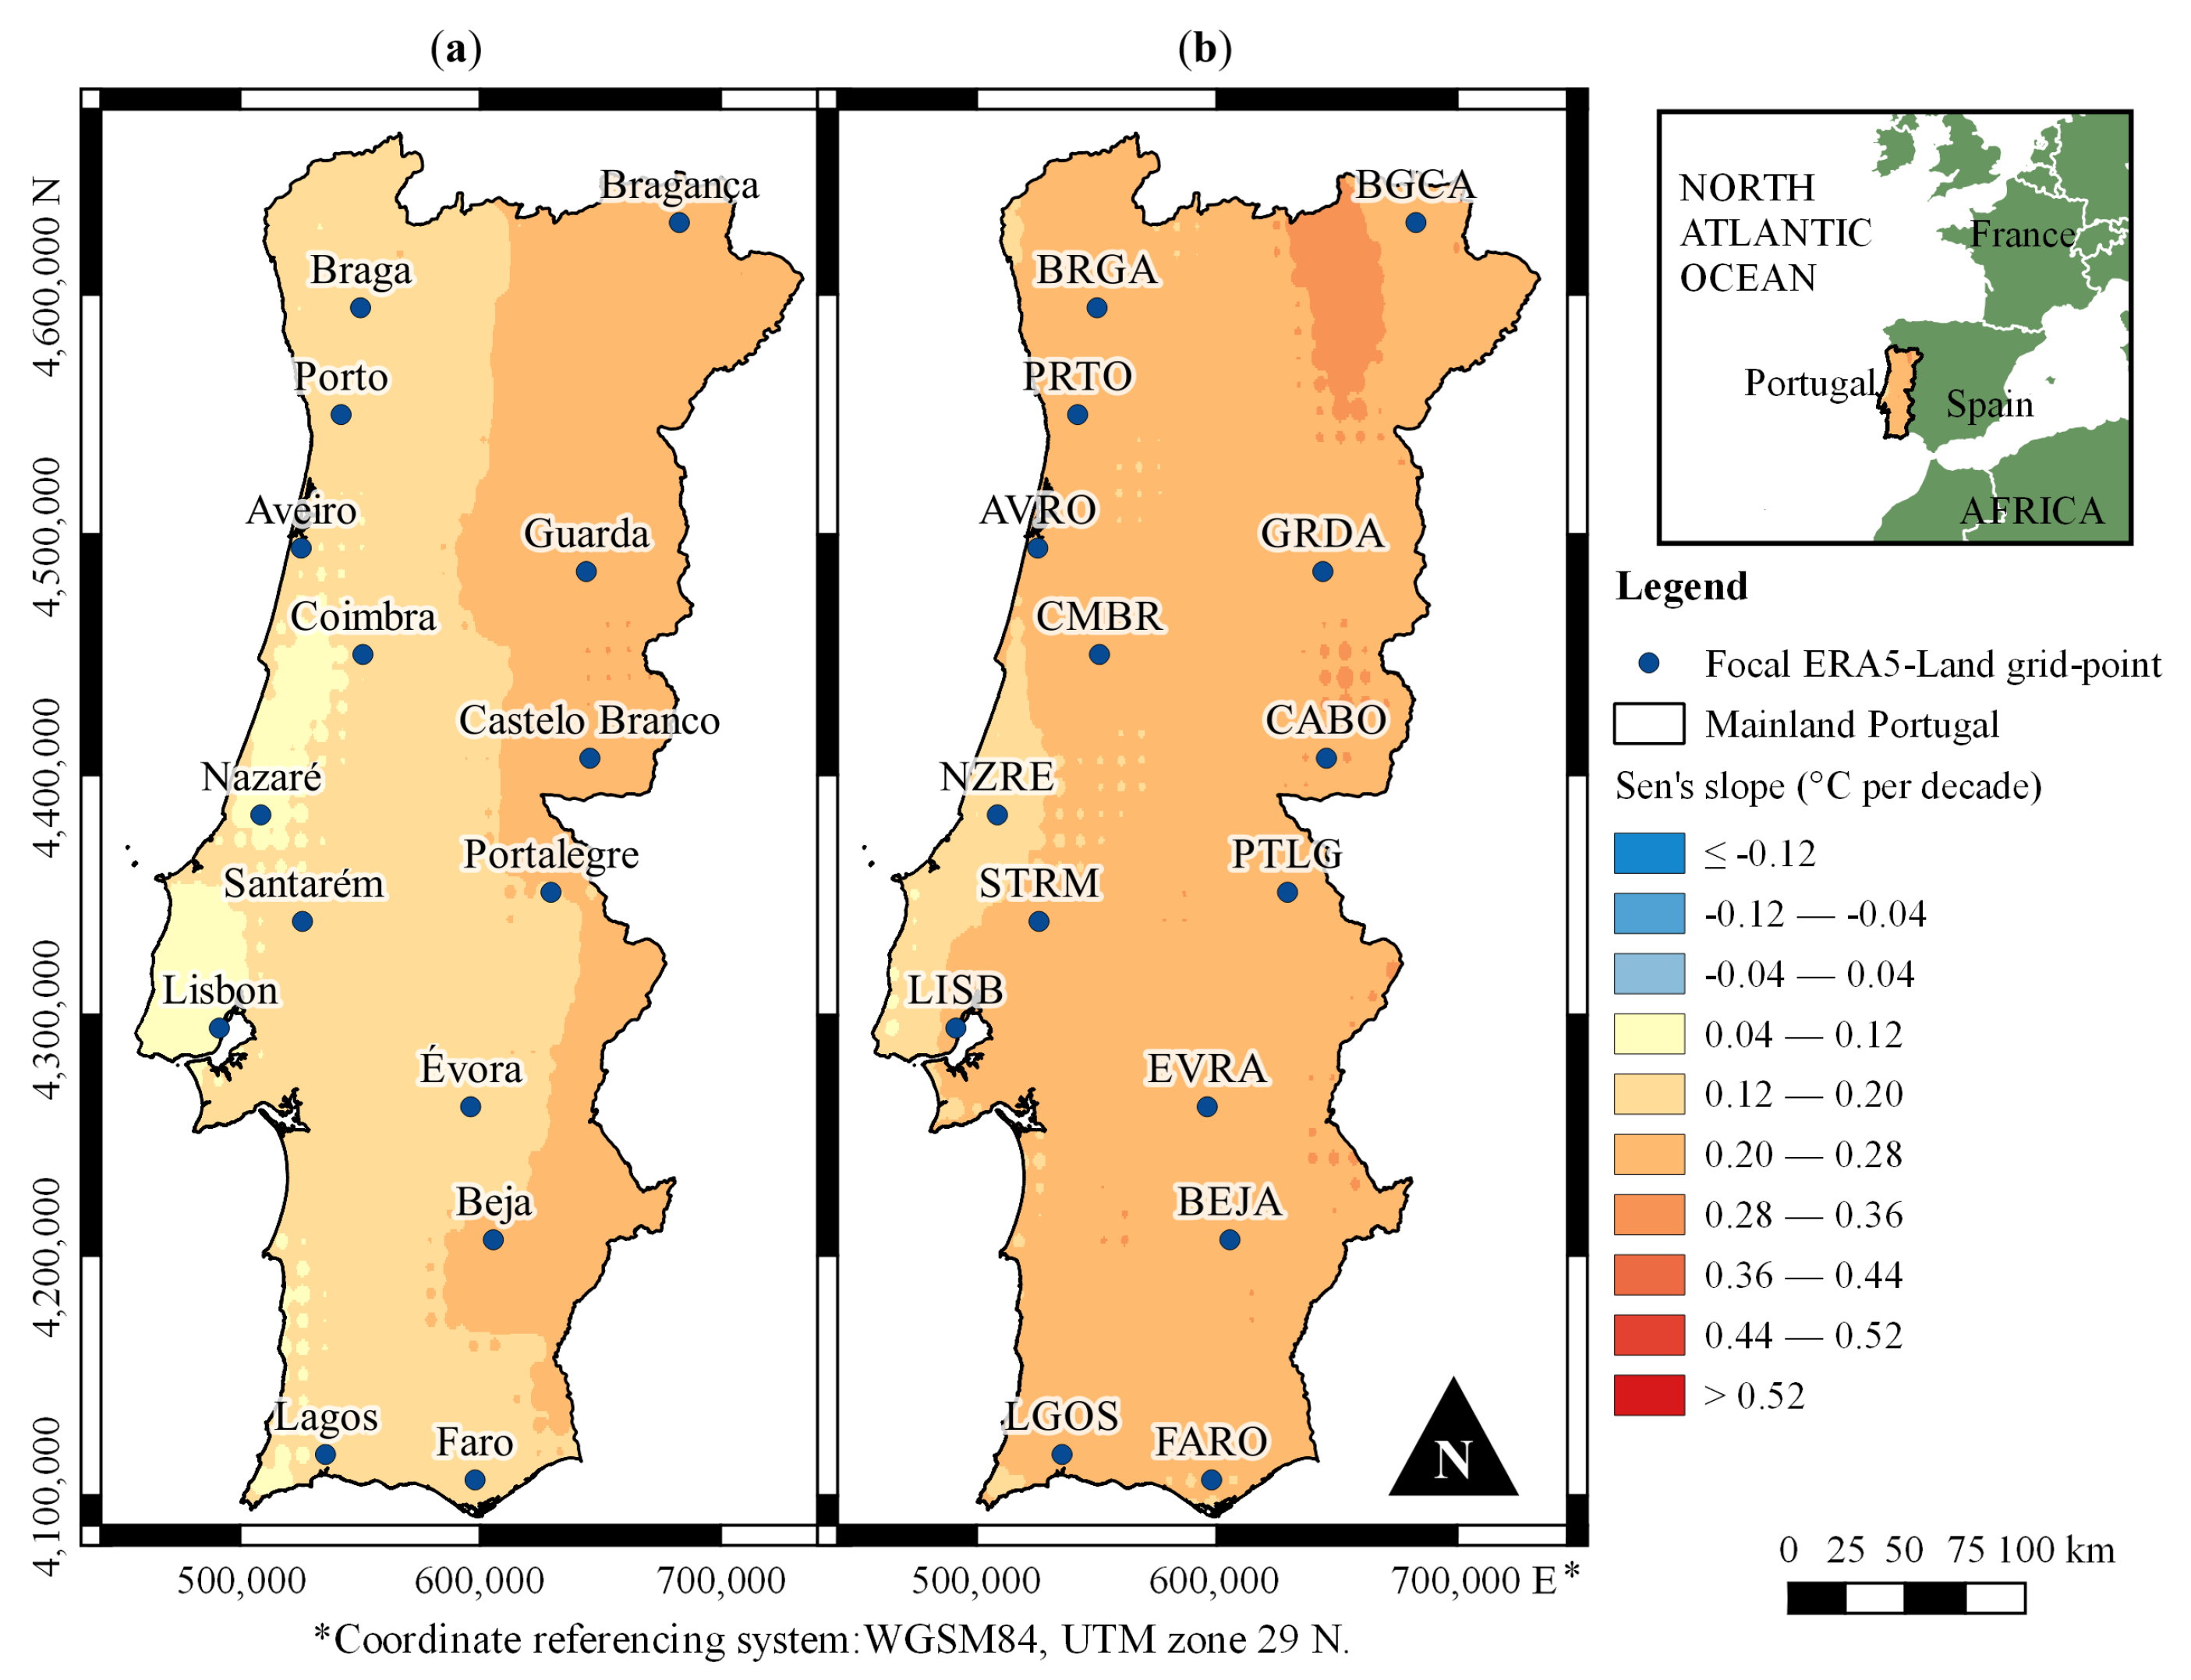
Figure 9.
Decadal trends based on Sen’s slope and 43 annual values, from 1980/1981 to 2022/2023, in (a) AMIN Tmin, with the names of 15 focal grid-points indicated; and (b) AMIN Tmax, with corresponding region codes shown. Maps were produced using 1,012 grid-points and IDW2 interpolation.
Figure 9.
Decadal trends based on Sen’s slope and 43 annual values, from 1980/1981 to 2022/2023, in (a) AMIN Tmin, with the names of 15 focal grid-points indicated; and (b) AMIN Tmax, with corresponding region codes shown. Maps were produced using 1,012 grid-points and IDW2 interpolation.
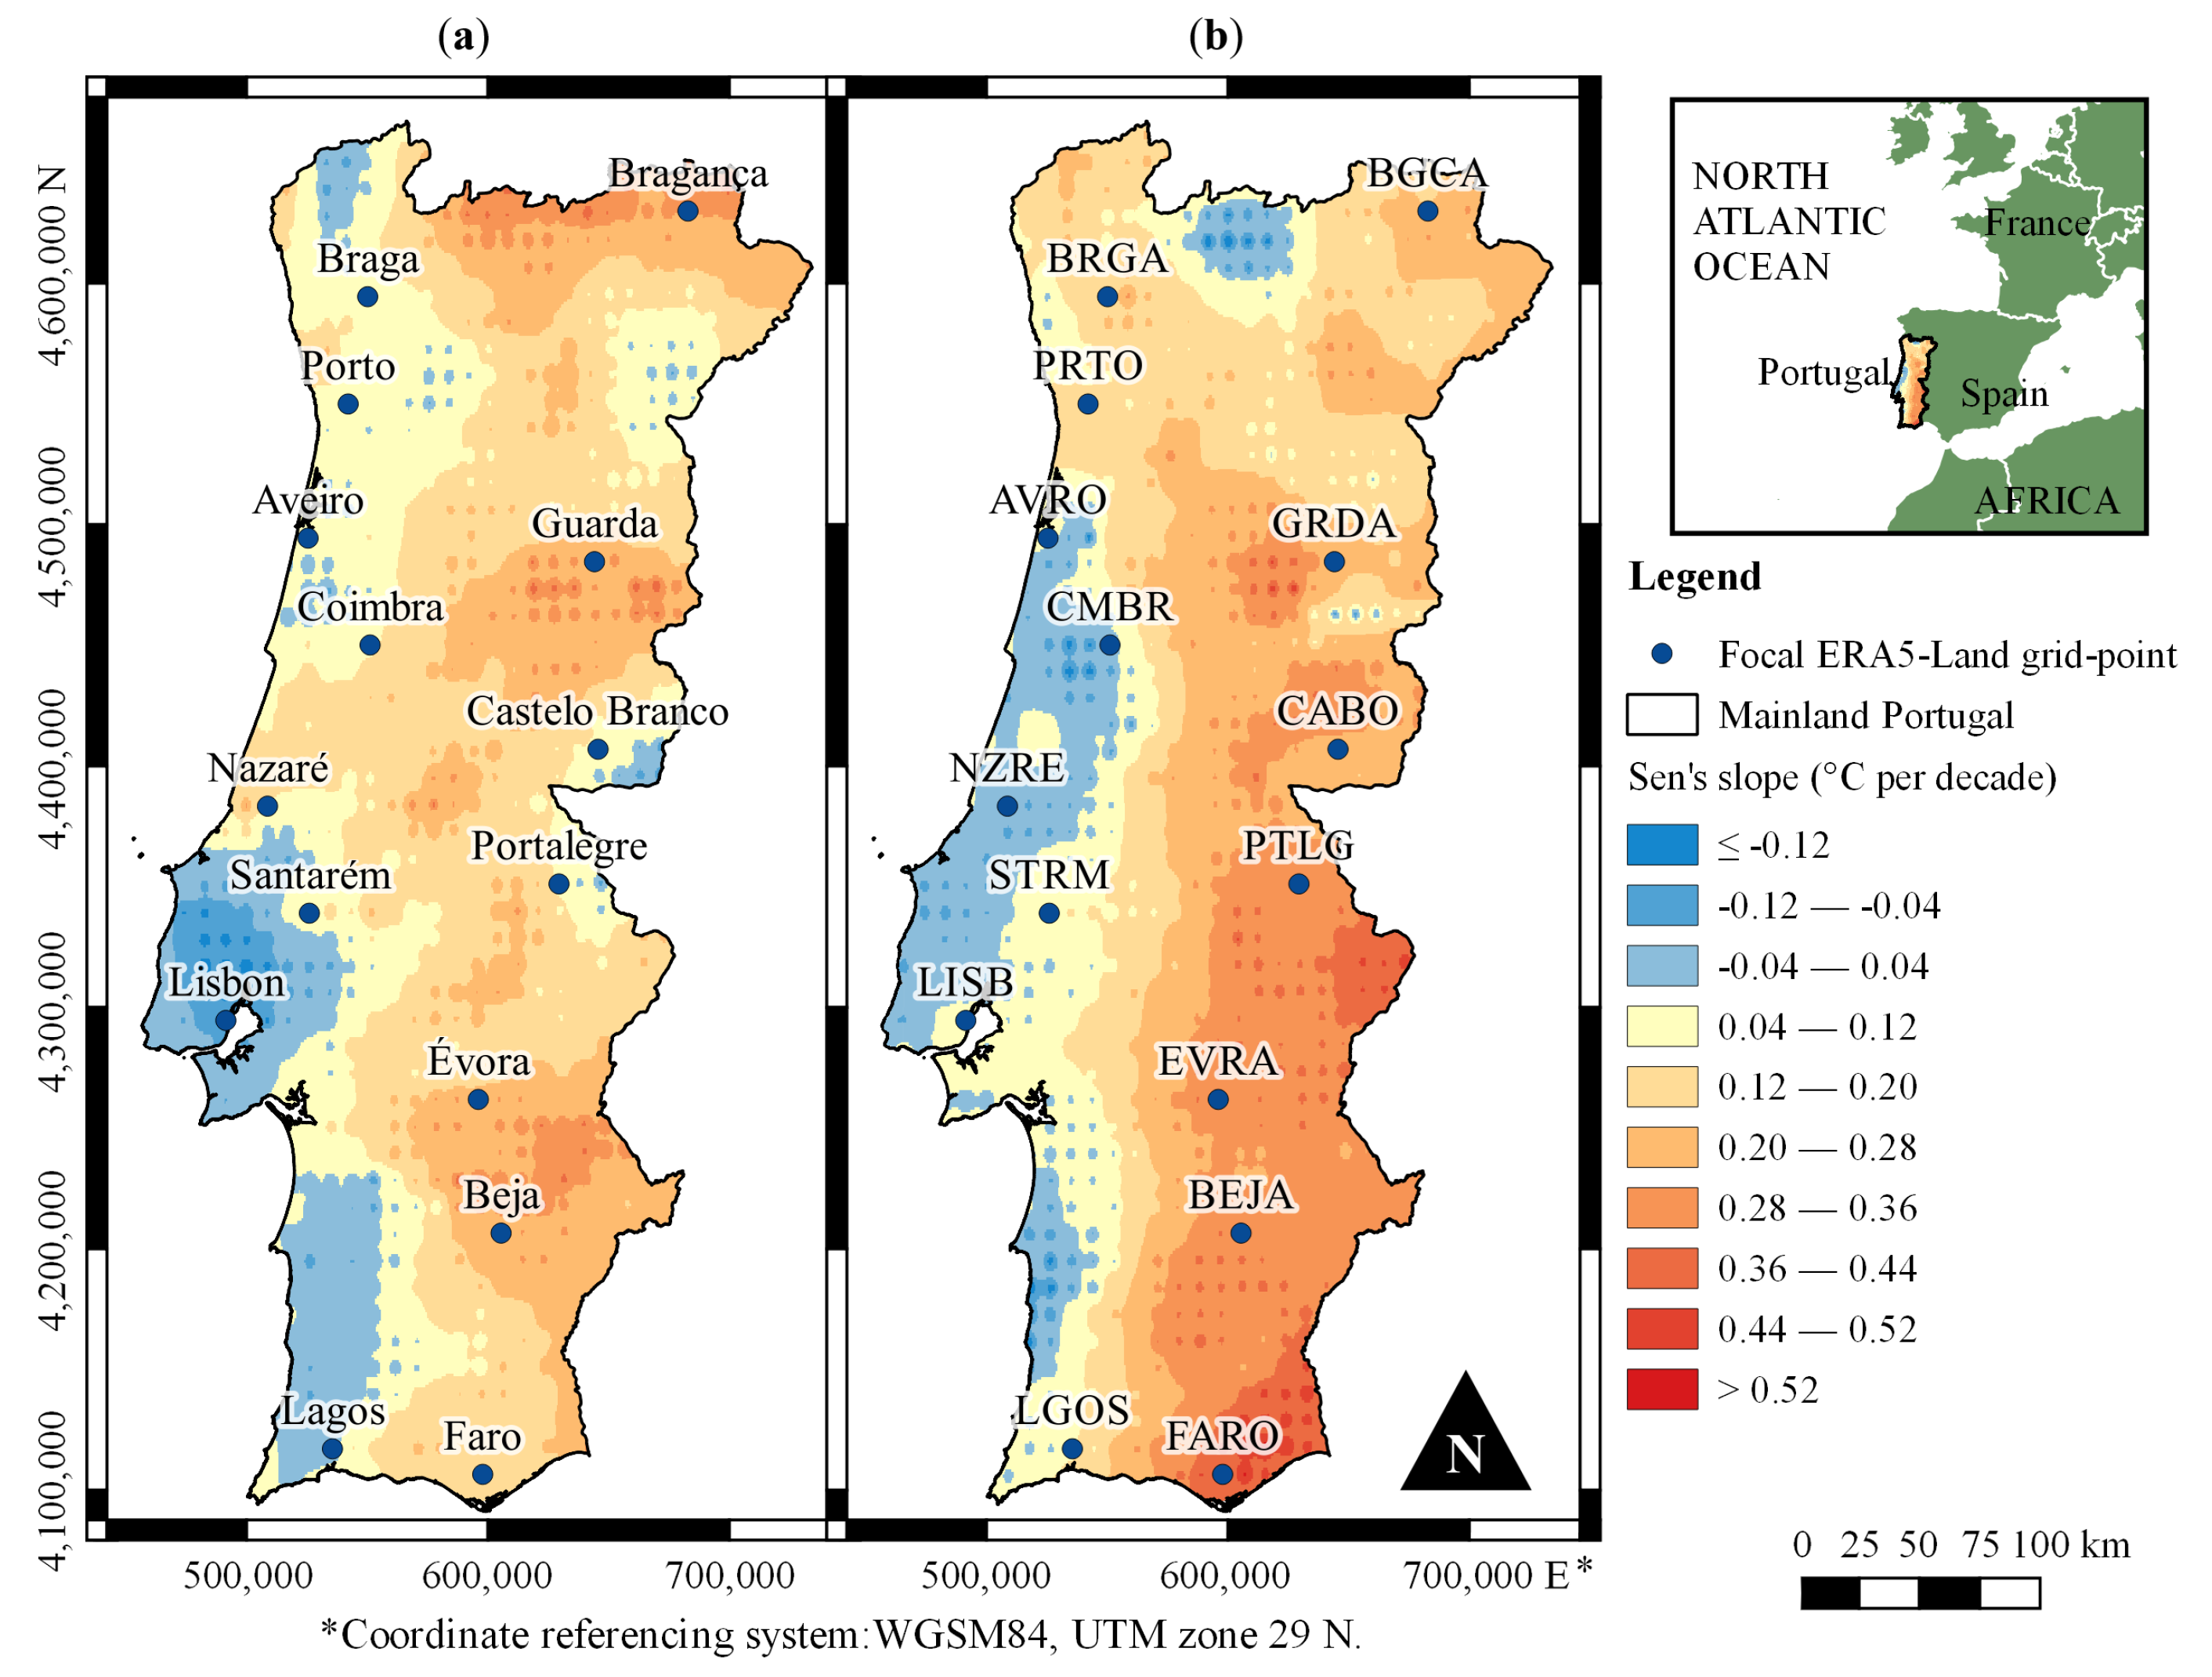
Figure 10.
Decadal trends based on Sen’s and the 43 annual values, from 1980/1981 to 2022/2023, in (a) AMAX Tmin, with the names of 15 focal grid-points indicated; and (b) AMAX Tmax, with corresponding region codes shown. Maps were produced using 1,012 grid-points and IDW2 interpolation.
Figure 10.
Decadal trends based on Sen’s and the 43 annual values, from 1980/1981 to 2022/2023, in (a) AMAX Tmin, with the names of 15 focal grid-points indicated; and (b) AMAX Tmax, with corresponding region codes shown. Maps were produced using 1,012 grid-points and IDW2 interpolation.
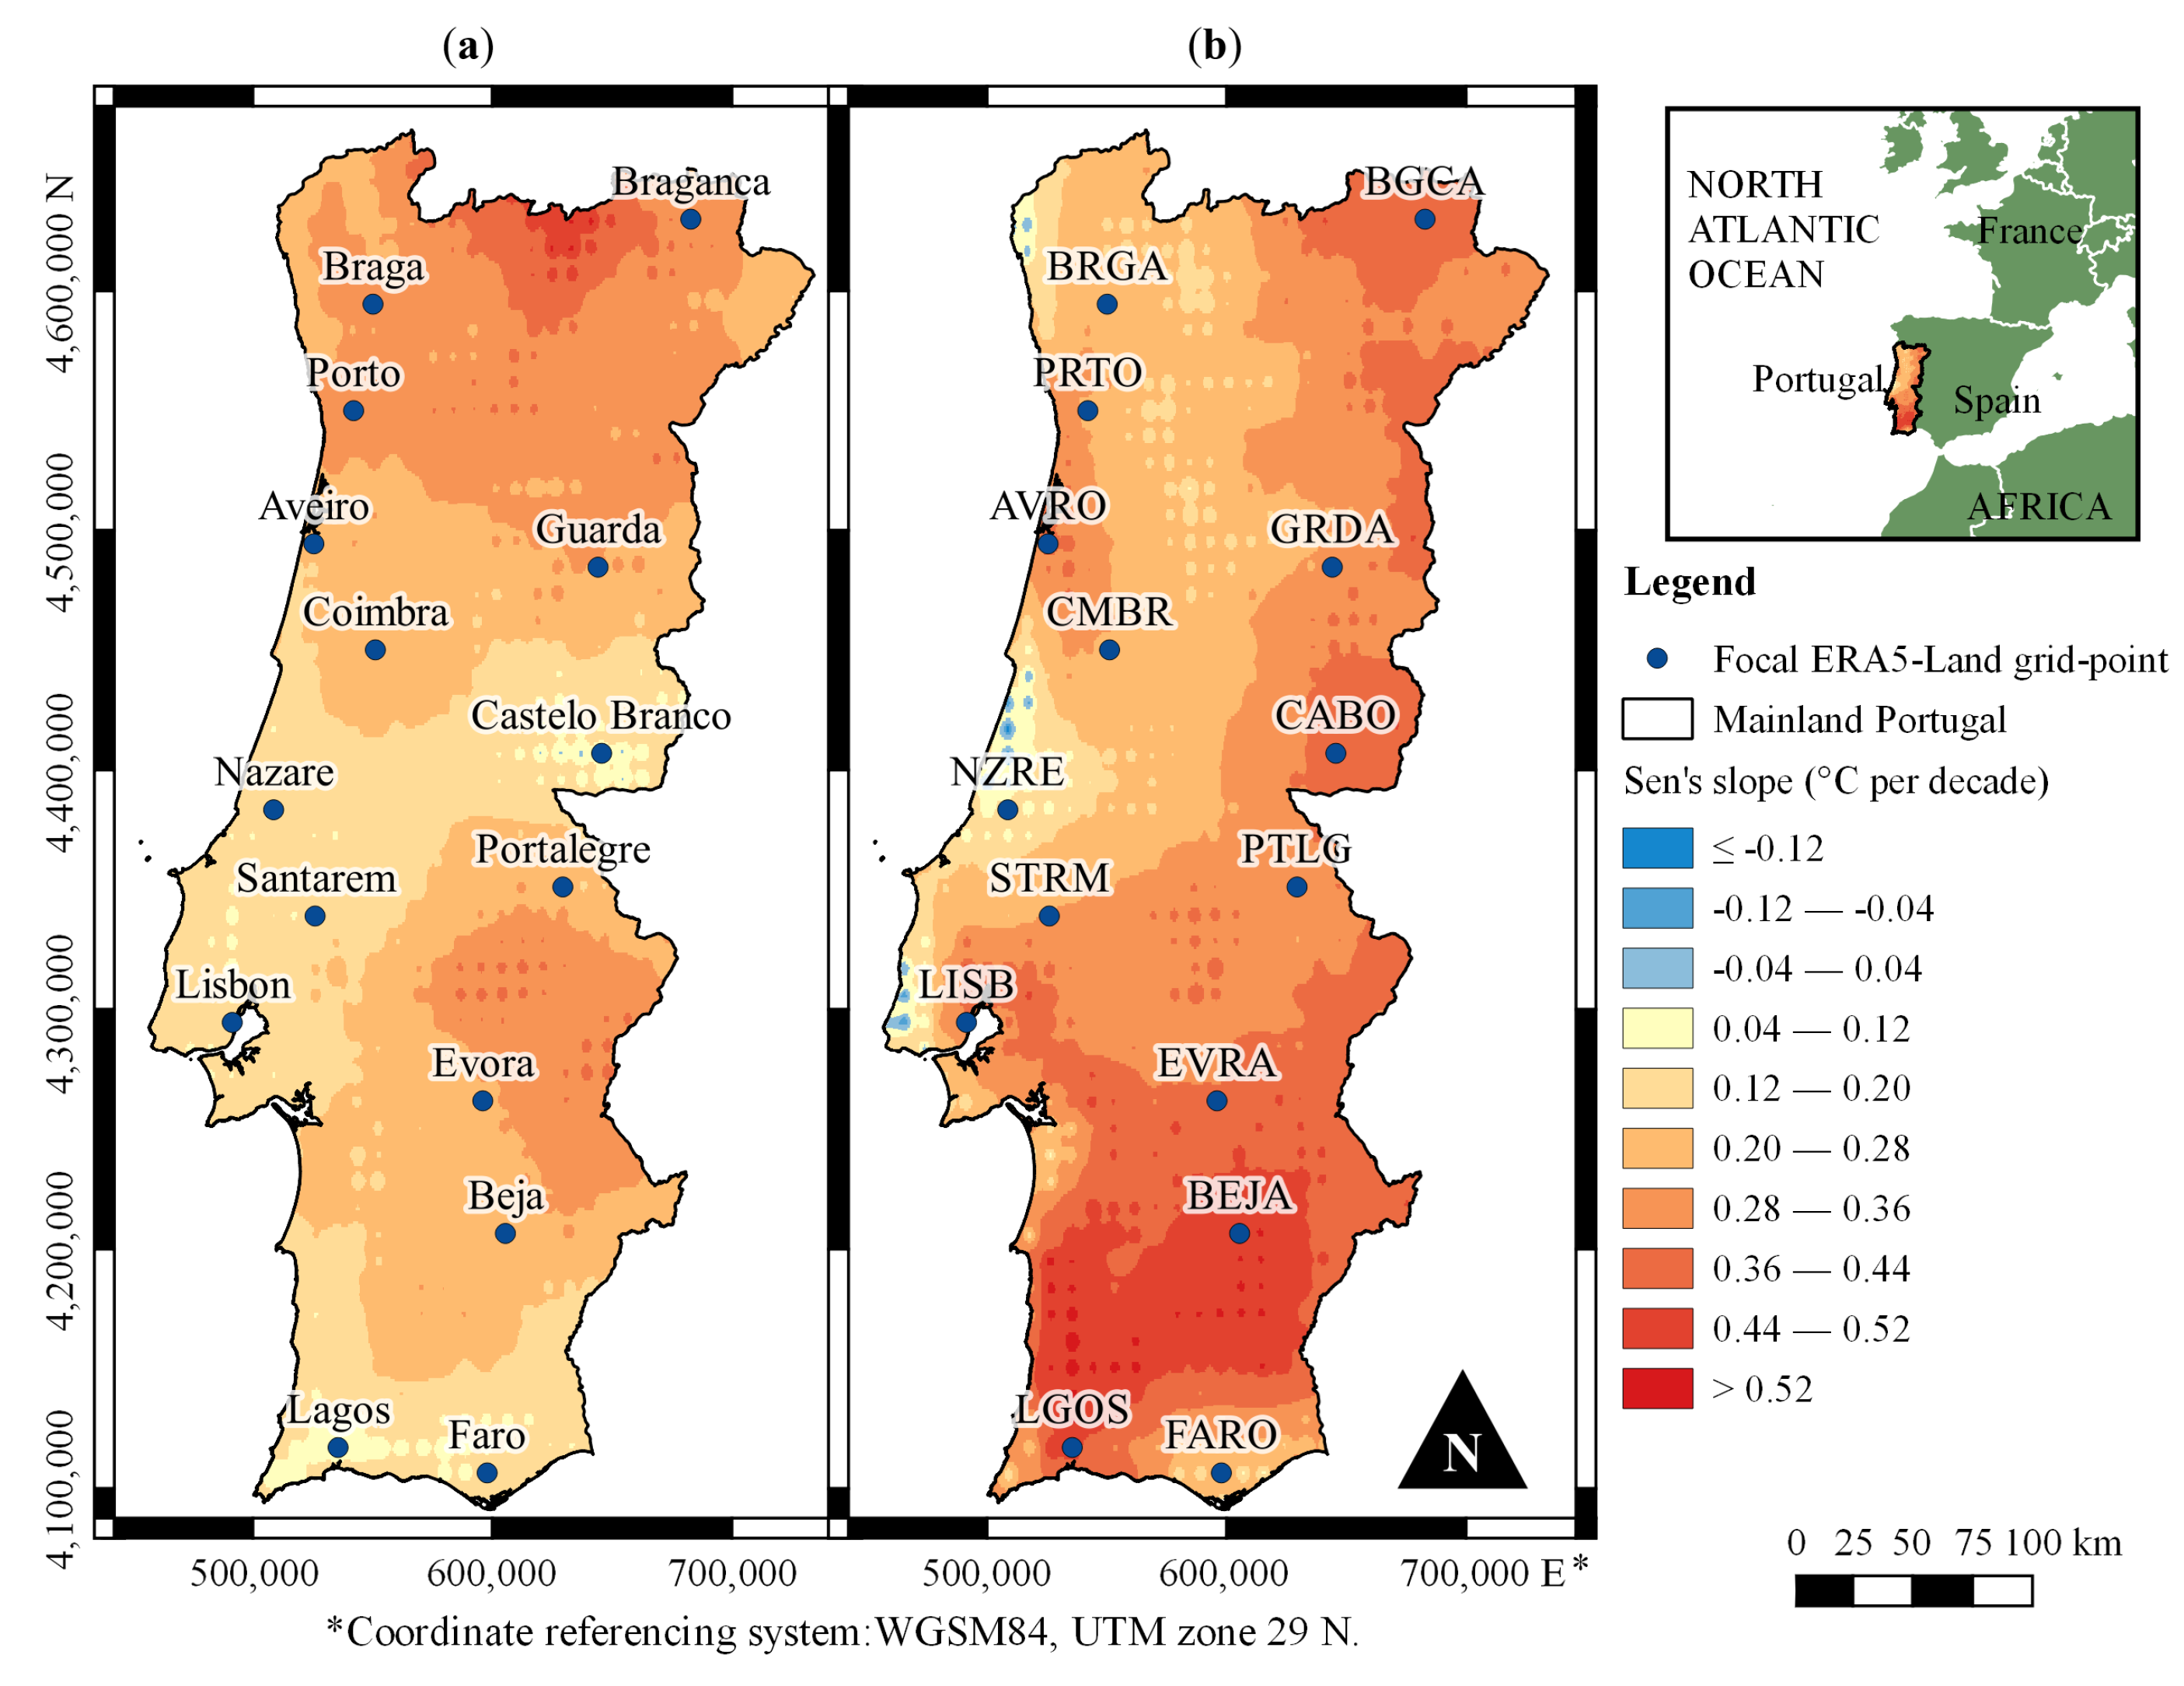

Table 1.
Trends in Tmin heatwave characteristics—the number of heatwave days (ANDH), the average temperature during heatwaves (AATW), and the intensity of heatwave events (AIHD)—across the focal Portuguese grid-points from 1980/1981 to 2022/2023, based on Sen’s slope estimator and the Mann-Kendall test. Bold indicate statistical significance at the 0.05 level.
| Grid-point | ANDH Tmin | AATW Tmin | AIHD Tmin | ||||||
|---|---|---|---|---|---|---|---|---|---|
| 43-year avg | Trend | 43-year avg | Trend | 43-year avg | Trend | ||||
| (days) | (days/decade) | (°C) | (°C/decade) | (°C) | (°C/decade) | ||||
| BGCA | 16.2 | 2.1 | 0.102 | 12.05 | 0.14 | 0.786 | 17.24 | 0.14 | 0.746 |
| BRGA | 15.6 | 1.9 | 0.139 | 14.72 | 0.44 | 0.147 | 19.07 | 0.71 | 0.183 |
| PRTO | 16.3 | 1.9 | 0.145 | 15.80 | 0.36 | 0.387 | 20.17 | 0.51 | 0.113 |
| AVRO | 17.2 | 2.3 | 0.068 | 16.75 | -0.02 | 0.972 | 21.64 | 0.18 | 0.666 |
| GRDA | 17.0 | 2.4 | 0.066 | 13.54 | 0.35 | 0.368 | 18.84 | 0.52 | 0.245 |
| CMBR | 17.4 | 1.2 | 0.390 | 15.28 | 0.15 | 0.580 | 20.39 | 0.08 | 0.801 |
| CABO | 16.2 | 2.1 | 0.183 | 16.41 | 0.46 | 0.448 | 21.39 | 0.48 | 0.186 |
| NZRE | 15.5 | 0.8 | 0.432 | 15.72 | 0.19 | 0.408 | 19.49 | 0.02 | 0.898 |
| PTLG | 16.9 | 2.7 | 0.024 | 16.55 | 0.51 | 0.328 | 21.34 | 0.75 | 0.072 |
| STRM | 16.2 | 1.8 | 0.109 | 17.18 | 0.17 | 0.616 | 21.78 | 0.19 | 0.633 |
| LISB | 18.0 | 1.9 | 0.201 | 17.55 | 0.31 | 0.374 | 21.65 | 0.14 | 0.737 |
| EVRA | 17.9 | 2.0 | 0.080 | 17.27 | 0.44 | 0.288 | 22.46 | 0.55 | 0.186 |
| BEJA | 17.2 | 2.9 | 0.006 | 17.20 | 0.72 | 0.090 | 21.53 | 0.90 | 0.010 |
| LGOS | 16.7 | 2.3 | 0.013 | 17.71 | 0.03 | 0.900 | 21.62 | 0.25 | 0.379 |
| FARO | 16.7 | 4.2 | 0.002 | 18.63 | 0.10 | 0.862 | 22.82 | 0.77 | 0.030 |
Table 2.
Trends in Tmax heatwave characteristics—the number of heatwave days (ANDH), the average temperature during heatwaves (AATW), and the intensity of heatwave events (AIHD)—across the focal Portuguese grid-points from 1980/1981 to 2022/2023, based on Sen’s slope estimator and the Mann-Kendall test. Bold indicate statistical significance at the 0.05 level.
| Grid-point | ANDH Tmax | AATW Tmax | AIHD Tmax | ||||||
|---|---|---|---|---|---|---|---|---|---|
| 43-year avg | Trend | 43-year avg | Trend | 43-year avg | Trend | ||||
| (days) | (days/decade) | (°C) | (°C/decade) | (°C) | (°C/decade) | ||||
| BGCA | 20.0 | 3.0 | 0.024 | 24.06 | 0.46 | 0.402 | 30.83 | 0.90 | 0.026 |
| BRGA | 20.9 | 3.3 | 0.020 | 25.61 | -0.27 | 0.665 | 32.17 | 0.26 | 0.603 |
| PRTO | 20.8 | 2.9 | 0.054 | 25.82 | -0.11 | 0.879 | 33.04 | 0.34 | 0.392 |
| AVRO | 21.2 | 3.6 | 0.013 | 26.74 | 0.21 | 0.745 | 33.88 | 0.74 | 0.047 |
| GRDA | 20.8 | 3.6 | 0.005 | 23.97 | 0.19 | 0.665 | 32.03 | 1.03 | 0.037 |
| CMBR | 21.3 | 3.1 | 0.056 | 27.36 | 0.07 | 0.914 | 35.20 | 0.33 | 0.474 |
| CABO | 20.6 | 3.8 | 0.016 | 28.61 | 0.79 | 0.172 | 36.60 | 1.14 | 0.008 |
| NZRE | 22.4 | 2.2 | 0.104 | 25.57 | -0.07 | 0.802 | 33.06 | 0.23 | 0.572 |
| PTLG | 21.1 | 3.0 | 0.082 | 27.45 | 0.68 | 0.179 | 36.02 | 0.80 | 0.106 |
| STRM | 22.5 | 3.6 | 0.022 | 29.35 | -0.08 | 0.851 | 37.93 | 0.38 | 0.420 |
| LISB | 20.0 | 4.2 | 0.019 | 26.56 | -0.15 | 0.884 | 34.07 | 0.46 | 0.185 |
| EVRA | 20.3 | 3.3 | 0.025 | 29.22 | 0.81 | 0.049 | 37.99 | 1.23 | 0.014 |
| BEJA | 19.4 | 3.5 | 0.040 | 30.12 | 0.96 | 0.059 | 37.68 | 1.19 | 0.006 |
| LGOS | 17.9 | 4.4 | 0.001 | 27.31 | 0.34 | 0.603 | 33.44 | 0.98 | 0.013 |
| FARO | 18.2 | 4.2 | 0.002 | 25.58 | 0.64 | 0.233 | 30.79 | 1.18 | 0.006 |
Disclaimer/Publisher’s Note: The statements, opinions and data contained in all publications are solely those of the individual author(s) and contributor(s) and not of MDPI and/or the editor(s). MDPI and/or the editor(s) disclaim responsibility for any injury to people or property resulting from any ideas, methods, instructions or products referred to in the content. |
© 2024 by the authors. Licensee MDPI, Basel, Switzerland. This article is an open access article distributed under the terms and conditions of the Creative Commons Attribution (CC BY) license (http://creativecommons.org/licenses/by/4.0/).
Copyright: This open access article is published under a Creative Commons CC BY 4.0 license, which permit the free download, distribution, and reuse, provided that the author and preprint are cited in any reuse.


