
Submitted:
10 November 2024
Posted:
11 November 2024
You are already at the latest version
Abstract
Glioblastoma (GBM) is the most common and deadly type of brain cancer in adults. Dysregulation of receptor tyrosine kinase pathways, such as the epidermal growth factor receptor (EGFR), contributes to therapeutic resistance. Drugs that inhibit tyrosine kinase activity and monoclonal an-tibodies against EGFR are strategies used in clinical trials. Photodynamic therapy (PDT) is a tumor treatment that involves the administration of a photosensitizing drug, followed by its activation with visible light, which causes cell death due to oxidative stress. Although PDT helps prolong median survival in patients with GBM, complete remission has not been achieved. Populations of GBM cells have been obtained from the T98G line resistant to PDT with methyl-5-aminolevulinic acid (Me-ALA) for characterization, comparing them with the original parental population. In order to understand the response of PDT-resistant GBM cells to the EGFR inhibitor erlotinib, cell viability was measured (MTT) after PDT combined with erlotinib in parental and resistant cells. Also, protoporphyrin IX (PpIX) content was measured (flow cytometry) combining Me-ALA with erlotinib. Spheroid growth and migration assays were performed when parental and resistant cells were incubated with erlotinib. It has been observed that the administration of the EGFR inhibitor drug in combination with PDT reduced viability in resistant populations compared to PDT alone. Furthermore, the PpIX content was increased in the resistant population when cells were incubated with Me-ALA and erlotinib. Erlotinib prevented cell proliferation of parental and resistant spheroids. Wound closure was reduced in both parental and PDT-resistant populations. Our results indicate that EGFR activation would be relevant in the resistance of GBM cells to PDT.
Keywords:
glioblastoma
; photodynamic therapy
; resistance
; EGFR
; erlotinib
1. Introduction
Glioblastoma multiforme (GBM) is one of the most aggressive malignancies and the most common malignant primary tumor of the central nervous system. GBM patients have a median survival of less than 15 months from initial diagnosis. GBM originates from astrocytic glial cells and it is a high-grade malignant glioma (grade IV) [1]. Standard therapy for GBM consists of surgical resection followed by radiotherapy and chemotherapy with temozolomide (TMZ). Despite maximal surgical resection and adjuvant therapy, almost all GBM tumors locally recur after treatment. Current challenges for the treatment of GBM include its incomplete resection, a high degree of genetic heterogeneity, the blood-brain barrier, and an immunosuppressive microenvironment. The highly infiltrative nature of GBM makes complete resection at the cellular level almost impossible. Although tumor margins can be roughly determined by imaging, GBM grows with microscopic finger-like projections, imperceptible to presurgical or even intraoperative imaging techniques [2]
Fluorescence-guided surgery allows for better visualization of tumor tissue and prolongs patient survival. 5-aminolevulinic acid (ALA) is a precursor metabolized in the heme biosynthesis pathway to protoporphyrin IX (PpIX), an endogenous photosensitizer. Finally, the enzyme ferrochelatase incorporates iron into PpIX to form heme. PpIX accumulates in cancer cells after ALA administration due to abnormalities in the heme pathway, such as the poor ferrochelatase activity. ALA administration results in the PpIX fluorescence of high-grade gliomas [3].
Photodynamic therapy (PDT) is based on light-excited photosensitizers to generate lethal reactive oxygen species (ROS), such as singlet oxygen (1O2), superoxide radicals (·O2-) and hydroxyl radicals (·OH). The resultant ROS can cause irreversible damage to cancer cells and lead to cell death, immune response, and microvascular damage. ALA and its derivatives (such as methyl aminolevulinate and hexyl aminolevulinate) are not photosensitive, but they are converted endogenously into PpIX photosensitizer by the heme biosynthesis pathway. PpIX tends to accumulate in malignant cells and can be activated by light to generate ROS, causing cancer cell damage [4]. In recent years, PDT studies have increased for several cancers, including GBM. The United States Food and Drug Administration (FDA) has approved ALA for fluorescence-guided resection of high-grade gliomas. Consequently, the interest in using this PpIX precursor to administer PDT in these tumors has been renewed [5].
The first well-established molecular alterations in GBM were relative to isocitrate dehydrogenase IDH1/2 mutations, which became a factor for categorization and prognostication of these tumors. Other alterations in primary GBMs were recognized comprising the proto-oncogenes EGFR, PDGFR, MET, CDK4, CDK6, CCND1, CCDN3, MDM2, MDM4, and MYCC and the tumor suppressor genes TP53, RB1, CDKN2A (p16INKA4/p14ARF), and PTEN [6]. Epidermal growth factor receptor (EGFR) is a transmembrane tyrosine kinase encoded by a gene located on chromosome band 7p12. EGFR is a membrane of the ErbB receptors family. The amplification and over-expression of EGFR have shown to be associated with tumor cell proliferation, angiogenesis, tumor invasion and resistance to therapeutic approaches such as chemotherapy and radiotherapy [7]. EGFR has a kinase domain composed of the N and C lobes and an adenosine triphosphate (ATP) binding cleft between the two lobes. When a ligand binds to its EGFR receptor, an asymmetric dimer is formed and the phosphate of ATP is transferred to the tyrosine residue of the regulatory domain. Various proteins are bound to this phosphorylated tyrosine and signals are transmitted downstream through the rat sarcoma (RAS)-rapidly accelerated fibrosarcoma (RAF)-mitogen-activated protein kinase (MAPK) and phosphatidylinositol 3-kinase (PI3K)-protein kinase B (PKB/AKT) pathways. EGFR tyrosine kinase inhibitors (TKIs) competitively inhibit ATP with cleft of the kinase domain [8]. For GBM, clinical trials have been developed inhibiting EGFR using drugs, peptide vaccines and antibodies [9].
Populations of GBM cells were obtained from the T98G line resistant to PDT with a methylated derivative of ALA (Me-ALA) for characterization compared with the original parental population. We had previously determined by RT-qPCR that the resistant cells have increased EGFR mRNA levels compared to the parental populations [10]. The objective of this work was to evaluate the general response of T98G GBM cells resistant to PDT when EGFR activity is inhibited with the drug erlotinib.
2. Materials and Methods
2.1. Bioinformatic Analysis of EGFR Expression in Human Samples
For a bioinformatic analysis of EGFR expression in human samples GEPIA 2 (Gene Expression Profiling Interactive Analysis 2) platform was used (http://gepia2.cancer-pku.cn/). GEPIA uses the databases The Cancer Genome Atlas (TCGA) and Genotype-Tissue Expression (GTEx) [11]. EGFR gene expression in human tumor samples and normal tissues and the GBM patients’ survival based on the expression status of EGFR gene were analyzed.
2.2. Cell Culture
T98 G (ATCC) cells were cultured in high glucose Dulbecco’s Modified Eagle medium (DMEM; Gibco), supplemented with 10 % v/v fetal bovine serum (Internegocios S.A.) and 1% v/v antibiotic-antimicotic (penicillin 10,000 units/mL, streptomycin 10,000 μg/mL, amphotericin B 25 μg/mL; Gibco). Cells were incubated at 37°C in an atmosphere containing 5% CO2.
2.3. Photosensitizer
The compound used in this study was the methyl-5-aminolevulinic acid (Me-ALA; Sigma-Aldrich), as a precursor of the photosensitizer PpIX. A stock solution of 100 mM Me-ALA was made in sterile phosphate buffered saline (PBS), from which 1 mM work solution was made employing DMEM without serum.
2.4. Light Source
For PDT treatment, cells were irradiated employing a monochromatic light source (635 nm ± 17 nm) with a multi-LED system (coherent light) at an irradiation intensity of 16.9 mW/cm2 (as measured by Coherent Lasermate power meter).
2.5. Obtainment of PDT-Me-ALA Resistant Cells
T98 G resistant to PDT/Me-ALA cells were obtained as described in Vilchez et al., 2021 [10]. The irradiation dose that caused cellular death rate of 70–90 % in parental cells (8.60 J/cm2) was employed with the aim of obtaining resistant cells. T98G cells were cultured in 35 mm plates and incubated with Me-ALA 1 mM for 4 h. Thereafter, cells were exposed to red light. The surviving cells were harvested and replated at 24-48 h after PDT. After proliferation, cells were submitted to a new PDT treatment. As the number of rounds of PDT increased, less cell death was observed. The final population received a total of 8 cycles of PDT, at which time no death was observed. The initial population, not subjected to PDT, was called parental population; the cellular population submitted to one PDT treatment was called first resistant generation and so the following generations were named consecutively. Once resistant cells were obtained, they were kept in frozen stocks. To check the resistance abilities of 8th resistant generation respect to parental population, cells were defrosted and cell viability assay (3-[4,5-dimethylthiazol-2-yl]2, 5-diphenyltetrazolium bromide; MTT) was made after PDT treatment with several irradiation doses as indicated in the next section.
2.6. Viability Assay by MTT
2.6.1. Resistance Determination
The grade of resistance to PDT was measured in TG98 8th generation cells (resistant cells), with respect to parental cells. 12 × 104 cells/ml of each population were seeded in multiwell-96 plates (P96). After 24 h, cells were incubated with Me-ALA 1 mM for 4 h at 37°C and then irradiated at several light doses: 5.07, 6.08 and 8.11 J/cm2 (n = 8). Cells with drug, but without light were employed as drug controls and cells with light (at 8.60 J/cm2), but without drug were employed as light controls. Cells without drug and without light were employed as controls and they were expressed as 100 % of viability. After treatments, culture medium was replaced by complete medium. After 24 h of PDT, the cell viability was analyzed by MTT assay. 10 μL of MTT (Sigma-Aldrich) solution (5 mg/ml PBS) was added to the cells in each well and it was incubated for 3− 4 h. The culture medium was removed and formazan crystals were suspended in DMSO (Cicarelli). Measures of the absorbance were taken at 540 nm with a spectrophotometer (Thermo Scientific, Multiskan FC). Results are reported as the mean ± standard error of mean (SEM). The experiment was made 3 times. Results of a representative experiment are shown.
2.6.2. Cell Viability After Combined Treatment of PDT and Erlotinib
Parental and resistant T98G cells were seeded on P96 plates (12 × 104 cells/ml). The next day the cells were incubated with erlotinib at doses of 9.20, 25 and 50 µM (n=8) [12]. Cells without drugs were used as controls. DMSO vehicle control groups were included. At 24 h the cell viability was analyzed by MTT assay, as described in the previous section. Also, cell viability was determined after combined treatment of PDT with erlotinib (50 µM). Cells were incubated with Me-ALA (1 mM) and erlotinib (50 µM) for 4 hours and then irradiated at 6.08 and 8.11 J/cm2. After irradiation, the medium was replaced by a complete medium. Erlotinib was added in erlotinib and erlotinib+PDT groups. After 24 h, cell viability was measured by MTT. Results are reported as the mean ± standard error of mean (SEM). The experiment was made 3 times. Results of a representative experiment are shown.
2.7. Flow Cytometry
The fluorescence of the photosensitizer PpIX was measured by flow cytometry in parental and resistant T98G populations after incubation with Me-ALA and erlotinib. Cells (20 × 104 cells/ml) were seeded in Petri dishes (35 mm plates) (n = 6). After 24 h, cells were incubated with Me-ALA (1 mM) and erlotinib (50 µM) for 4 h, washed with PBS three times, trypsinized, resuspended in complete medium (to stop the effect of trypsin) and centrifuged. The pellet was resuspended in PBS and the cellular PpIX fluorescence was measured by flow cytometry (Guava® easyCyte; Cytek® Biosciences, USA). Excitation wavelength of 488 nm (blue laser) was used and the emission at 670 nm was determined (Red B). Flow cytometry data were analyzed employing FlowJo 7.6 and PpIX fluorescence histograms were compared. The percentage of positive cells for the photosensitizer fluorescence and the media fluorescence intensity were determined. Results are reported as the mean ± SEM. The experiment was made 3 times. Results of a representative experiment are shown.
2.8.3. D-Cultures Proliferation
T98G parental and resistant cells were seeded in P96 U-bottom wells coated with agarose (1% in deionized H2O) [13]. A total of 2,000 cells/well were seeded in DMEM medium 10% serum with erlotinib (50 µM; n=12). Controls without drug and vehicle controls with DMSO were included. The spheroids were photographed (Nikon DS-Qi1MC) 3 days after seeded and the number of cells by spheroids was counted employing a Neubauer chamber. Results are reported as the mean ± SEM. The experiments were made 3 times. Results of a representative experiment are shown.
2.9. Wound Healing Assay
Parental and resistant T98G cells were seeded (24 x 104 cells/ml) in P24. The next day, with a confluence of 100%, wounds were made in the cell monolayer using a micropipette tip (2 wounds per well). The cells were rinsed 3 times with a complete medium to remove lifted cells. Then, the cells were cultured with erlotinib at doses of 25 and 50 µM using culture medium with 1 and 10% serum (n=6 wells). Cells without erlotinib and without DMSO were used as controls. Vehicle-control groups with DMSO were included. When the control group closed the wounds, the cells were fixed with cold methanol and stained with toluidine blue (0.05%) for a better image visualization. Photographs were taken (Nikon DS-Qi1MC) at day 0 (t0) and final time (tf). The wound area was measured using ImageJ (n=8 wound areas). The percentage of wound closure was calculated using the formula: % migration= [100 - (wound area tf / wound area t0)] x 100. Results are reported as the mean ± SEM. The experiments were made 3 times. Results of a representative experiment are shown.
2.10. Statistical Analysis
The values in the figures are expressed as mean ± SEM. The R and R Studio software was used to carry out the statistical analyses. The statistical significance of the differences between the means was determined with the analysis of variance (ANOVA). When the means were found to be significantly different (with a p-value less than 0.05) multiple pairwise comparisons were performed using the Tukey HSD test.
3. Results
3.1. High Expression of EGFR in GBM Patients Is Related to Poorer Patient Survival and EGFR Expression Is Higher in GBM Tumor Tissue Than in Normal Tissue
The Figure 1A shows a survival analysis based on the expression status of the EGFR gene and the Kaplan-Meier curve. A relationship is observed between EGFR expression and patient survival: while given the high expression of the EGFR gene, GBM patients had a less encouraging prognosis. Also, Figure 1B shows the expression profile of EGFR in tumoral samples and their corresponding normal tissues. A high expression of the gene is observed in low-grade brain glioma (LGG), kidney renal cell carcinoma (KIRC), head and neck squamous cell carcinoma, among others. The highest expression of EGFR is found in GBM compared to other types of cancer. A higher expression of EGFR is observed in GBM (red box-plot), compared to the low expression in its corresponding normal tissues (black box-plot) (Figure 1C). The EGFR presents a higher expression associated with GBM, with a median of 82.35 against 3.99 in matched normal tissue.
3.2. T98G Cells Exposed to Eight Cycles of PDT/Me-ALA Had a High Degree of Resistance to Treatment
In order to obtain PDT-resistant GBM populations to perform the experiments, T98G cells were exposed to eight rounds of PDT with Me-ALA (similar to our publication Vilchez et al., 2021 [10]). Cell viability around 80-90 % was observed in resistant cells at 5.07, 6.08 and 8.11 J/cm2 irradiation doses (Figure 2), while the parental populations present viability of around 80, 50 and 20% at these doses respectively.
3.3. PDT in Combination with Erlotinib Reduced Viability in Resistant Populations Compared to PDT Alone
The EGFR inhibitor drug erlotinib and its vehicle (DMSO) did not affect the cell viability of parental and resistant T98G populations at the analyzed doses of 9.20, 25 and 50 µM at 24 h (Figure 3A). Dose of 50 µM was used to analyze cell viability when PDT was combined with erlotinib. The resistant population viability was reduced from values of around 100% with PDT (1 mM Me-ALA; 6.08 and 8.11 J/cm2) to around 60% when PDT was combined with erlotinib. In the parental population, a slight reduction in viability was observed when the cells were incubated with the EGFR inhibitor drug, but it was not statistically significant (Figure 3B).
3.4. Erlotinib Reduces the PpIX Content from Me-ALA in Resistant Populations
In order to know if erlotinib has an effect on the PpIX content in parental and resistant cells when incubated with Me-ALA, the cells were seeded in 35 mm dishes. The next day they were incubated with erlotinib and Me-ALA for 4 hours. The content of the photosensitizer PpIX was determined by flow cytometry. In the groups with Me-ALA and without erlotinib, the amount of photosensitizer was lower in the resistant populations compared to the parental cells, as it was previously determined in our publication [10]. Erlotinib increased the content of PpIX from Me-ALA in the resistant population, but not in the parental cells (Figure 4 A and B). With the incubation of the EGFR inhibitor drug, the content of the photosensitizer PpIX in resistant populations was equal to the PpIX content found in parental cells (Figure 4 C, D, E).
3.5. Erlotinib Inhibits Proliferation of 3D Cultures in Parental and Resistant T98G Populations
In order to know the proliferation capacity of T98G parental and resistant cells when EGFR is inhibited, 3D cultures were performed (2,000 cells/ spheroid) and the number of cells per spheroid was counted 3 days after plating. The resistant spheroids had twice the proliferation compared to the parental spheroids (16,458 ± 4,066 cells/ spheroid in parental population; 36,612 ± 7,141 cells/spheroid in resistant population). Parental and resistant spheroids did not proliferate when they were incubated with erlotinib 50 µM (2,187 ± 1,362 cells/ spheroid in parental population; 1,770 ± 650 cells/spheroid in resistant population) (Figure 5 B). The proliferation of spheroids from both populations was reduced when incubated with erlotinib at 25 μM, with less effect than with the highest dose of the drug (Figure 5 A). At the erlotinib dose of 50 µM, the DMSO vehicle showed some inhibition effect on proliferation, although this was not statistically significant (Figure 5 B). At the erlotinib dose of 25 µM, no effect of the vehicle was observed (Figure 5 A).
3.6. Erlotinib Reduced Wound Closure in Parental and Resistant T98G
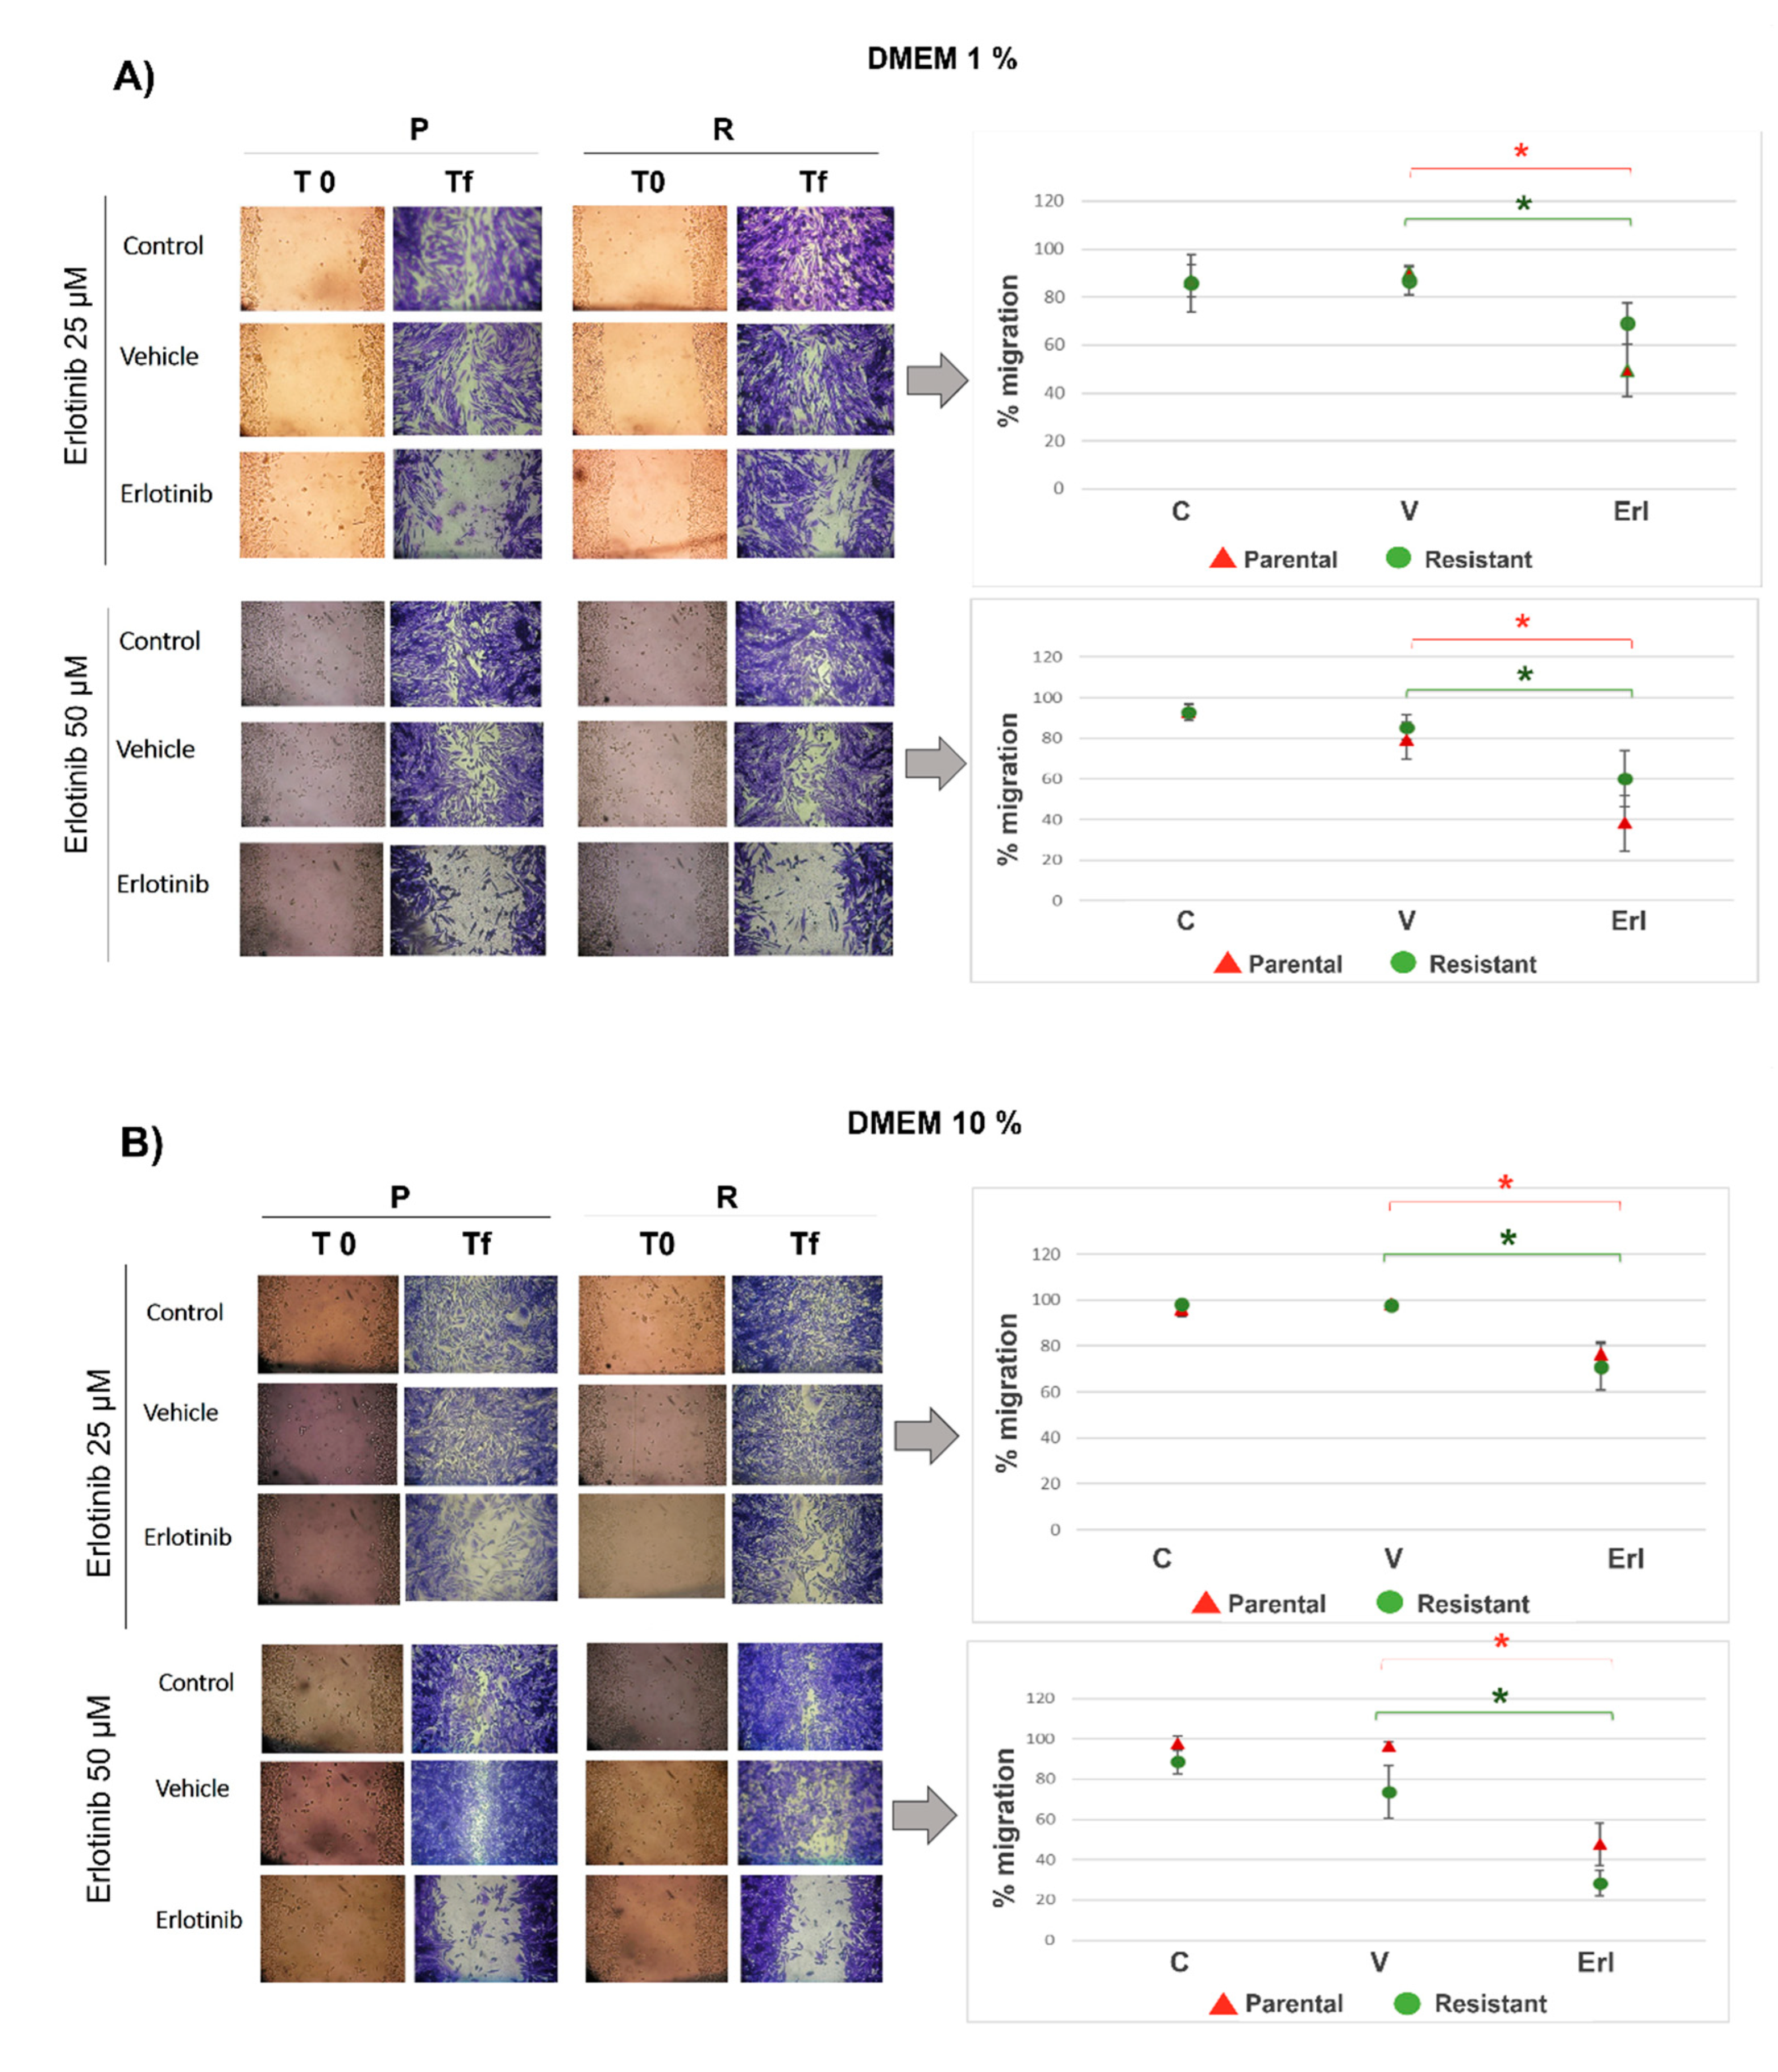
To determine the effect of erlotinib on wound closure capacity, wounds were made on confluent monolayers of parental and resistant T98G populations. DMEM medium with 1% serum was used to analyze cell migration. Trials with DMEM at 10% serum were also included to understand the effect of erlotinib on proliferation + migration (employing high percentages of serum the cells have a high proliferation rate). Erlotinib reduced wound closure similarly in parental and resistant T98G, both when 1% DMEM was used (Figure 6 A) and when 10% DMEM was used (Figure 6 B). The percentage of wound closure was lower for the 50 µM dose compared to the 25 µM dose. At the 50 µM dose, a slight effect on wound closure was observed due to the DMSO vehicle, although this was not statistically significant (except for 1% DMEM-parental cells).
Using 1% DMEM, when the migration percentage reached 90% in the control group (at 4 days), the parental populations treated with 25 µM erlotinib had 70% migration and the resistant cells had 50% migration (without statistically significant differences). Parental populations treated with 50 µM erlotinib had 60% migration and resistant cells 40% (no statistically significant differences) (Figure 6 A). Using 10% DMEM, when the migration percentage reached 90-100% in the control group (at 2 days), the parental and resistant populations treated with 25 µM erlotinib had around 70% migration. Parental populations treated with 50 µM erlotinib had 30% migration and resistant cells 50% (Figure 6 B).
4. Discussion
GBM is a grade IV brain tumor which represents one of the most lethal human cancers. Standard therapy for GBM encompasses surgical resection followed by chemotherapy and radiotherapy [2]. A meta-analysis reported by Ren et al., including 1,294 patients from 31 articles shows that the fluorescence guided resection (FGR) and PDT employing ALA are feasible for glioma treatment allowing a significant increase in the maximum resection rate and prolonging the survival after PDT [14].
Advancement in precision oncology has renewed attention to the study of the receptor tyrosine kinase (RTK) EGFR as an important therapeutic target for GBM [15]. Amplifications in the EGFR gene are detected in 57.4% of primary GBM patients, leading to high levels of EGFR protein and it has been observed that amplifications of EGFR are retained in recurrent gliomas [16]. Repeated cycles of oncological treatments and cell growth in vitro can be performed in order to amplify the biochemical changes associated with cell resistance and to identify a selective target on surviving cells [17]. We have found that PDT-resistant GBM cells from the T98G line have high levels of mRNA of EGFR, form spheroids with a greater number of cells in vitro and are more tumorigenic when injected into mice, compared to the parental population [10].
Through the bioinformatics analysis by GEPIA that was shown in this work, it can be observed that high expression of EGFR in GBM patients can be related to poorer patient survival. It is known that EGFR is activated by ligands (EGF, EREG and EPGN) which induce dimerization structures and activates downstream effector pathways, including MAPK, PI3K, and STAT3, by auto-phosphorylation of tyrosine residues in its cytoplasmic domain [15]. In GBM the activation of these pathways leads to tumor growth, invasion, angiogenesis and drug resistance to radio- and chemotherapy [16].
GEPIA analysis also shows that compared to other cancer types, the highest expression of EGFR is observed in GBM and a high expression of this gene is found in GBM tumors compared to the low expression in its corresponding normal tissues. It has been described that the expression of EGFR in normal cells is about 4 × 10⁴–10 × 104 receptors/cell, whereas, in cancer cells, more than 106 receptors/cell are observed. Except for hematopoietic cells, the majority of cell types express ErbB family members [16]. It is important to consider the expression of tumor markers in normal cells for planning selective therapeutic strategies, which constitutes a fundamental challenge in oncology. Currently, there is a great impulse in the development of methods of selective drug delivery to tumors taking advantage of the differences in the microenvironment and morphology of tumor and healthy cells: effects on ion channels and the use of pH-sensitive intelligent formulations that allow selectively accumulating drug molecules in tumor cells, including the pH, membrane permeability, and ion channels [18]. Using this approach, nanoparticles containing drugs can reduce side effects caused by drugs by encapsulating these drugs and releasing them at the target site. Researchers have examined different nanoparticle carrier categories such as polymers, lipids, and inorganic materials [19].
In this work we evaluated the general response of T98G GBM cells resistant to PDT when EGFR activity is inhibited with the drug erlotinib. PDT in combination with erlotinib reduced viability in resistant populations compared to PDT alone, reaching viability levels similar to the parental cells. These results were related to an increase in the content of the photosensitizer PpIX in the resistant population when the cells were incubated with Me-ALA in combination with erlotinib. Fontana et al. found that EGFR inhibition increases the PpIX in GBM cells incubated with ALA because the expression of the enzyme heme oxygenase-1 (HO-1) is reduced. They showed that increased EGFR activity results in upregulation of HO-1-mediated heme clearance and ultimately reduced PpIX fluorescence. HO-1 accelerated heme depletion and thus a shift in enzymatic activity occurs in favor of increased PpIX metabolism by ferrochelatase. It is known that the expression of the HO-1 is primarily regulated at the transcriptional level by activating transcription factors such as NF-kβ, AP-2, and the heat shock-responsive element (HSE). EGF induces NF-kB activation through multiple EGFR dependent signaling molecules, including PI3K, protein kinase C (PKC), and IKK signaling pathways. So, EGF/EGFR signaling promotes HO-1 expression and activity in GBM cells through activation of the PI3K/AKT/NF-κB cascade [20]. We could hypothesize that this axis which leads to a lower accumulation of the photosensitizer PpIX has been favored in the selective obtaining of resistant populations, among other resistance mechanisms. Then, the inhibition of EGFR activity by erlotinib leads to the increase of PpIX in resistant populations and to the consequent decrease in cell viability after PDT.
As we can see in the T98G 3D cultures, erlotinib inhibited the proliferation of both the parental T98G populations and the resistant populations. Also, erlotinib reduced wound closure in parental and resistant T98G using culture medium with low and high content of fetal bovine serum, suggesting that the decrease in EGFR activity affects cell migration and proliferation. A large body of work shows that EGFR inhibition reduces GBM cell migration, invasion, and proliferation. Half of GBMs that have EGFR amplifications overexpress the variant EGFRvIII, and expression of both receptors, EGFR and EGFRvIII, confers a worse prognosis. EGFR and EGFRvIII cooperate to promote tumor progression and invasion, in part, through activation of the Stat signaling pathway. Roos et al. showed that EGFRvIII activates Stat5 and GBM invasion by inducing the expression of a mediator of glioma cell invasion and survival: fibroblast growth factor-inducible 14 (Fn14). EGFRvIII-mediated induction of Fn14 expression is Stat5 dependent and requires activation of Src, whereas EGFR regulation of Fn14 is dependent upon Src–MEK/ERK–Stat3 activation. Treatment of EGFRvIII-expressing GBM cells with the FDA-approved Stat5 inhibitor pimozide blocked Stat5 phosphorylation, Fn14 expression, cell migration and survival. Because EGFR inhibitors display limited therapeutic efficacy in GBM patients, the EGFRvIII–Stat5–Fn14 signaling pathway represents a node of vulnerability in the invasive GBM cell populations [21]. Ji et al. found that miR-615 expression was downregulated in GBM tissues and cells, and was inversely correlated with overall survival, relapse-free survival, tumor malignancy grade, and EGFR expression. They identified that miR-615 plays a tumor suppressor role in GBM cell proliferation, migration and invasion by targeting EGFR expression, and miR-615 may act as a novel biomarker for early diagnosis or therapeutic targets of GBM [22]. Liu et al. evaluated the anti-tumor activity and effectiveness of the third-generation EGFR-targeted drug AZD9291 in vitro and in an orthotopic GBM model. AZD9291 inhibited significantly colony formation, migration, and invasion of GBM cells and reduced tumor growth and prolonged animal survival [23].
Similar to T98G cells, in our work on PDT-resistant squamous cell carcinoma populations we found that PDT-resistant populations of the SCC-13 line accumulated less PpIX and were more tumorigenic than the parental cells [24]. Furthermore, we determined that resistant SCC-13 populations have amplifications in the gene that encodes the mitogen-activated kinase MAPK/ERK, while these amplifications are not found in the parental SCC-13 population. These DNA changes were also observed at the mRNA and protein expression level and correlated with an increase in the expression and activation of EGFR. These results agree with those obtained by immunohistochemistry of human biopsies of squamous cell carcinomas resistant to two sessions of PDT with Me-ALA. Thus, our studies in squamous carcinoma propose that genomic imbalances related to EGFR and MAP3K1 may be an important factor in resistance to PDT [25].
There are three generations of tyrosine kinase inhibitors (TKIs) approved for clinical use. First-generation TKIs (erlotinib, gefitinib, lapatinib and vandetanib) inhibit the receptor by reversible competitive binding with ATP in the tyrosine kinase domain. Subsequent generations of TKIs were created to overcome drug resistance. Second-generation TKIs (Afatinib, dacomitinib, tesevatinib) irreversibly inhibit all four ERBB receptors [16]. The third-generation TKI (Almonertinib, Lazertinib, Furmonertinib, Osimertinib) is specifically designed to target the T790M resistance mutation [26]. Efforts to target EGFR in glioblastoma continue to be investigated. Clinical trials currently active and in development for EGFR in GBM include the study of several novel agents, including the TKI epitinib, bi-armed activated T cells against EGFR/CD3, EGFR(V)-EDV-Dox, the monoclonal antibody GC1118, doxorubicin-loaded anti-EGFR immunoliposomes, and the anti-EGFRvIII/CD3 bispecific T-cell engager (BiTE) AMG 596, among others. Studies on the EGFR receptor in GBM are expected to lead to improved outcomes in this highly vulnerable patient population [8].
5. Conclusions
In this work we have observed that the inhibition of EGFR activity using the small molecule erlotinib reduced the viability of GBM populations of the T98G line resistant to PDT with Me-ALA. This could be explained, at least in part, by the increase in the PpIX content in those resistant populations when EGFR is inhibited. When erlotinib is used in resistant populations, they behave similarly to the parental cells without erlotinib in terms of viability in response to PDT and PpIX content. Also, erlotinib reduced the proliferation of 3D cultures and cell migration, in both parental and resistant cells. In GBM, inhibition of EGFR could be important, not only to reduce proliferation and migration, but also to improve FGR and PDT results by increasing the amount of the photosensitizer in groups of cells that accumulate low less PpIX.
Author Contributions
K. Olthoff, A. Nigra and L. Milla Sanabria have carried out the experiments. L Milla Sanabria directed the work and wrote the manuscript. Olthoff has performed statistical analyses.
Funding
This work was supported by Agencia Nacional de Promoción Científica y Tecnológica under Grant PICT.SerieA.03217/2020 and Secretaría de Ciencia y Técnica-UNRC.
Informed Consent Statement
Not applicable.
Acknowledgments
We thank Fernanda Parborell from Instituto de Biología y Medicina Experimental (IBYME) and Verónica Santander and Fernando Ibánez from UNRC.
Conflicts of Interest
The authors declare no conflicts of interest.
References
- Grochans, S.; Cybulska, A.M.; Siminska, D.; Korbecki, J.; Kojder, K.; Chlubek, D.; Baranowska-Bosiacka, I. Epidemiology of Glioblastoma Multiforme–Literature Review. Cancers. 2022, 14, 2412. [Google Scholar] [CrossRef] [PubMed]
- Wu, W.; Klockow, J.L.; Zhang, M.; Lafortune, F.; Chang, E.; Jin, L.; Wu, Y.; Daldrup-Link, H.E. Glioblastoma multiforme (GBM): An overview of current therapies and mechanisms of resistance. Pharmacological Research. 2021, 171, 105780. [Google Scholar] [CrossRef] [PubMed]
- Schupper, A.J.; Rao, M.; Mohammadi, N.; Baron, R.; Lee, J.Y.K.; Acerbi, F.; Hadjipanayis, C.G. Fluorescence-Guided Surgery: A Review on Timing and Use in Brain Tumor Surgery. Frontiers in Neurology. 2021, 12, 682151. [Google Scholar] [CrossRef] [PubMed]
- Hu, T.; Wang, Z.; Shen, W.; Liang, R. , Yan D.; Wei M. Recent advances in innovative strategies for enhanced cancer photodynamic therapy. Theranostics. 2021, 11, 3278–3300. [Google Scholar] [CrossRef]
- Miretti, M.; González Graglia, M.A.; Suárez, A.I.; Prucca, C.G. Photodynamic therapy for glioblastoma: A light at the end of the tunnel. Journal of Photochemistry and Photobiology. 2023, 13, 100161. [Google Scholar] [CrossRef]
- Vilar, J.B.; Christmann, M.; Tomicic, M.T. Alterations in Molecular Profiles Affecting Glioblastoma Resistance to Radiochemotherapy: Where Does the Good Go? Cancers. 2022, 14, 2416. [Google Scholar] [CrossRef] [PubMed]
- Miratashi Yazdi, S.A.; Bakhshi, N.; Nazar, E.; Tabriz, H.M.; Gorji, R. Epidermal growth factor receptor (EGFR) expression in high grade glioma and relationship with histopathologic findings, a cross sectional study. International Journal of Surgery Open. 2022, 46, 100527. [Google Scholar] [CrossRef]
- Nagano, T.; Tachihara, M.; Nishimura, Y. Mechanism of Resistance to Epidermal Growth Factor Receptor-Tyrosine Kinase Inhibitors and a Potential Treatment Strategy. Cells. 2018, 7, 212. [Google Scholar] [CrossRef]
- Pan, P.C.; Magge, R.S. Mechanisms of EGFR Resistance in Glioblastoma. International Journal of Molecular Sciences. 2020, 21, 8471. [Google Scholar] [CrossRef]
- Vilchez, M.L.; Rodríguez, L.B.; Palacios, R.E.; Prucca, C.G.; Caverzán, M.D.; Caputto, B.L.; Rivarola, V.A.; Milla Sanabria, L.N. Isolation and initial characterization of human glioblastoma cells resistant to photodynamic therapy. Photodiagnosis and Photodynamic Therapy. 2021, 33, 102097. [Google Scholar] [CrossRef]
- Tang, Z.; Kang, B.; Chenwei Li; Tianxiang Chen; Zemin Zhang. GEPIA2: an enhanced web server for large-scale expression profiling and interactive analysis. Nucleic Acids Research. 2019, 47, W556–W560. [Google Scholar] [CrossRef] [PubMed]
- Bagherian, A.; Roudi, B.; Masoudian, N.; Mirzaei, H. Anti-glioblastoma effects of nanomicelle-curcumin plus erlotinib. Food Funct. 2021, 12, 10926–10937. [Google Scholar] [CrossRef] [PubMed]
- Lamberti, M.J.; Pansa, M.F.; Vera, R.E.; Fernández-Zapico, M.E.; Rumie Vittar, N.B.; Rivarola V., A. Transcriptional activation of HIF-1 by a ROS-ERK axis underlies the resistance to photodynamic therapy. PLoS One. 2017, 12, e0177801. [Google Scholar] [CrossRef]
- Ren, Z.; Wen, J.; Mo, Y.; Zhang, P.; Chen, H.; Wen, J. A systematic review and meta-analysis of fluorescent-guided resection and therapy-based photodynamics on the survival of patients with glioma. Lasers in Medicine Science. 2022, 37, 789–797. [Google Scholar] [CrossRef] [PubMed]
- Lin, B.; Ziebro, J. , Smithberger E.; Skinner K.R; Zhao E.; Cloughesy T.F.; Binder Z.A; O’Rourke D.M.; Nathanson D.A; Furnari F.B., Miller C.R. EGFR, the Lazarus target for precision oncology in glioblastoma. Neuro-Oncology. 2022, 24, 2035–2062. [Google Scholar] [CrossRef]
- Oprita, A.; Baloi, S.-C.; Staicu, G.-A.; Alexandru, O.; Tache, D.E.; Danoiu, S.; Micu, E.S.; Sevastre, A.-S. Updated Insights on EGFR Signaling Pathways in Glioma. International Journal of Molecular Science. 2021, 22, 587. [Google Scholar] [CrossRef]
- Casas, A.; Perotti, C.; Di Venosa, G. , Batlle A. Resistance to Photodynamic Therapy in Cancer. V. Rapozzi, G. Jori (Eds.). Publisher: Springer, Cham. Chapter: Mechanisms of resistance to photodynamic therapy: an update. 2015, pp. 29–63. [CrossRef]
- Zlotnikov, I.D.; Dobryakova, N.V.; Ezhov, A.A.; Kudryashova, E.V. Achievement of the Selectivity of Cytotoxic Agents against Cancer Cells by Creation of Combined Formulation with Terpenoid Adjuvants as Prospects to Overcome Multidrug Resistance. International Journal of Molecular Science. 2023, 24, 8023. [Google Scholar] [CrossRef]
- Eslami Moghadam, M. , Sadeghi M.; Mansouri-Torshizi H., Saidifar M. High cancer selectivity and improving drug release from mesoporous silica nanoparticles in the presence of human serum albumin in cisplatin, carboplatin, oxaliplatin, and oxalipalladium treatment. European Journal of Pharmaceutical Sciences. 2023, 187, 106477. [Google Scholar] [CrossRef]
- Fontana, A.O.; Piffaretti, D.; Marchi, F.; Burgio, F.; Faia-Torres, A.B.; Paganetti, P.; Pinton, S.; Pieles, U.; Reinert, M. Epithelial growth factor receptor expression influences 5-ALA induced glioblastoma fluorescence. Journal of Neurooncology. 2017, 133, 497–507. [Google Scholar] [CrossRef]
- Roos, A.; Dhruv, H.D.; Peng, S.; Inge, L.J.; Tuncali, S.; Pineda, M. , Millard N.; Mayo Z.; J.M. Eschbacher; Loftus J.C; Winkles J.A.; Tran. N.L. Molecular Cancer Research. 2018, 16, 1185–1195. [Google Scholar] [CrossRef]
- Ji, Y.; Sun, Q.; Zhang, J.; Hu, H. MiR-615 inhibits cell proliferation, migration and invasion by targeting EGFR in human glioblastoma. Biochemical and Biophysical Research Communications. 2018, 499, 719–726. [Google Scholar] [CrossRef] [PubMed]
- Liu, X.; Chen, X. , Shi, L. et al. The third-generation EGFR inhibitor AZD9291 overcomes primary resistance by continuously blocking ERK signaling in glioblastoma. Journal of Experimental and Clinical Cancer Research. 2019, 38, 219. [Google Scholar] [CrossRef] [PubMed]
- Milla, L.N.; Cogno, I.S.; Rodríguez, M.E.; Sanz-Rodríguez, F.; Zamarrón, A.; Gilaberte, Y.; Juarranz Á; Rivarola V. A. Isolation and characterization of squamous carcinoma cells resistant to photodynamic therapy. Journal of Cellular Biochemistry. 2011, 112, 2266–2278. [Google Scholar] [CrossRef] [PubMed]
- Gilaberte, Y.; Milla, L.; Salazar, N.; Vera-Alvarez, J.; Kourani, O.; Rivarola, V.; Roca, M.; Espada, J.; González, S.; Damian, A.; Juarranz, Á. Cellular Intrinsic Factors Involved in the Resistance of Squamous Cell Carcinoma to Photodynamic Therapy. Journal of Investigative Dermatology. 2014, 134, 2428–2437. [Google Scholar] [CrossRef]
- Cheng, Z.; Cui, H.; Wang, Y.; Yang, J.; Lin, C.; Shi, X.; Zou, Y.; Chen, J.; Jia, X.; Su, L. The advance of the third-generation EGFR-TKI in the treatment of non-small cell lung cancer (Review). Oncology Reports. 2024, 51, 16. [Google Scholar] [CrossRef]
Figure 1.
A) Overall survival (OS) of glioblastoma (GBM) patients as a function of EGFR gene expression and Kaplan-Meier curve. While given the high expression of the EGFR gene (red curve), GBM patients had a less encouraging prognosis. B) EGFR expression profile across all tumor samples and paired normal tissues. The height of the bar represents the median expression of a certain type of tumor or normal tissue. The data is expressed on a logarithmic scale of transcripts per million (TPM). The highest expression of EGFR is observed in GBM compared to other types of cancer. C) EGFR expression pattern in GBM samples and normal tissues. Tumor (T) (red box-plot) and normal tissues (N) (black box-plot). The data is expressed on a logarithmic scale of transcripts per million (log2 [TPM+1]). A higher expression of EGFR is observed in GBM, compared to the expression in its corresponding normal tissues. Data was obtained from GEPIA 2.
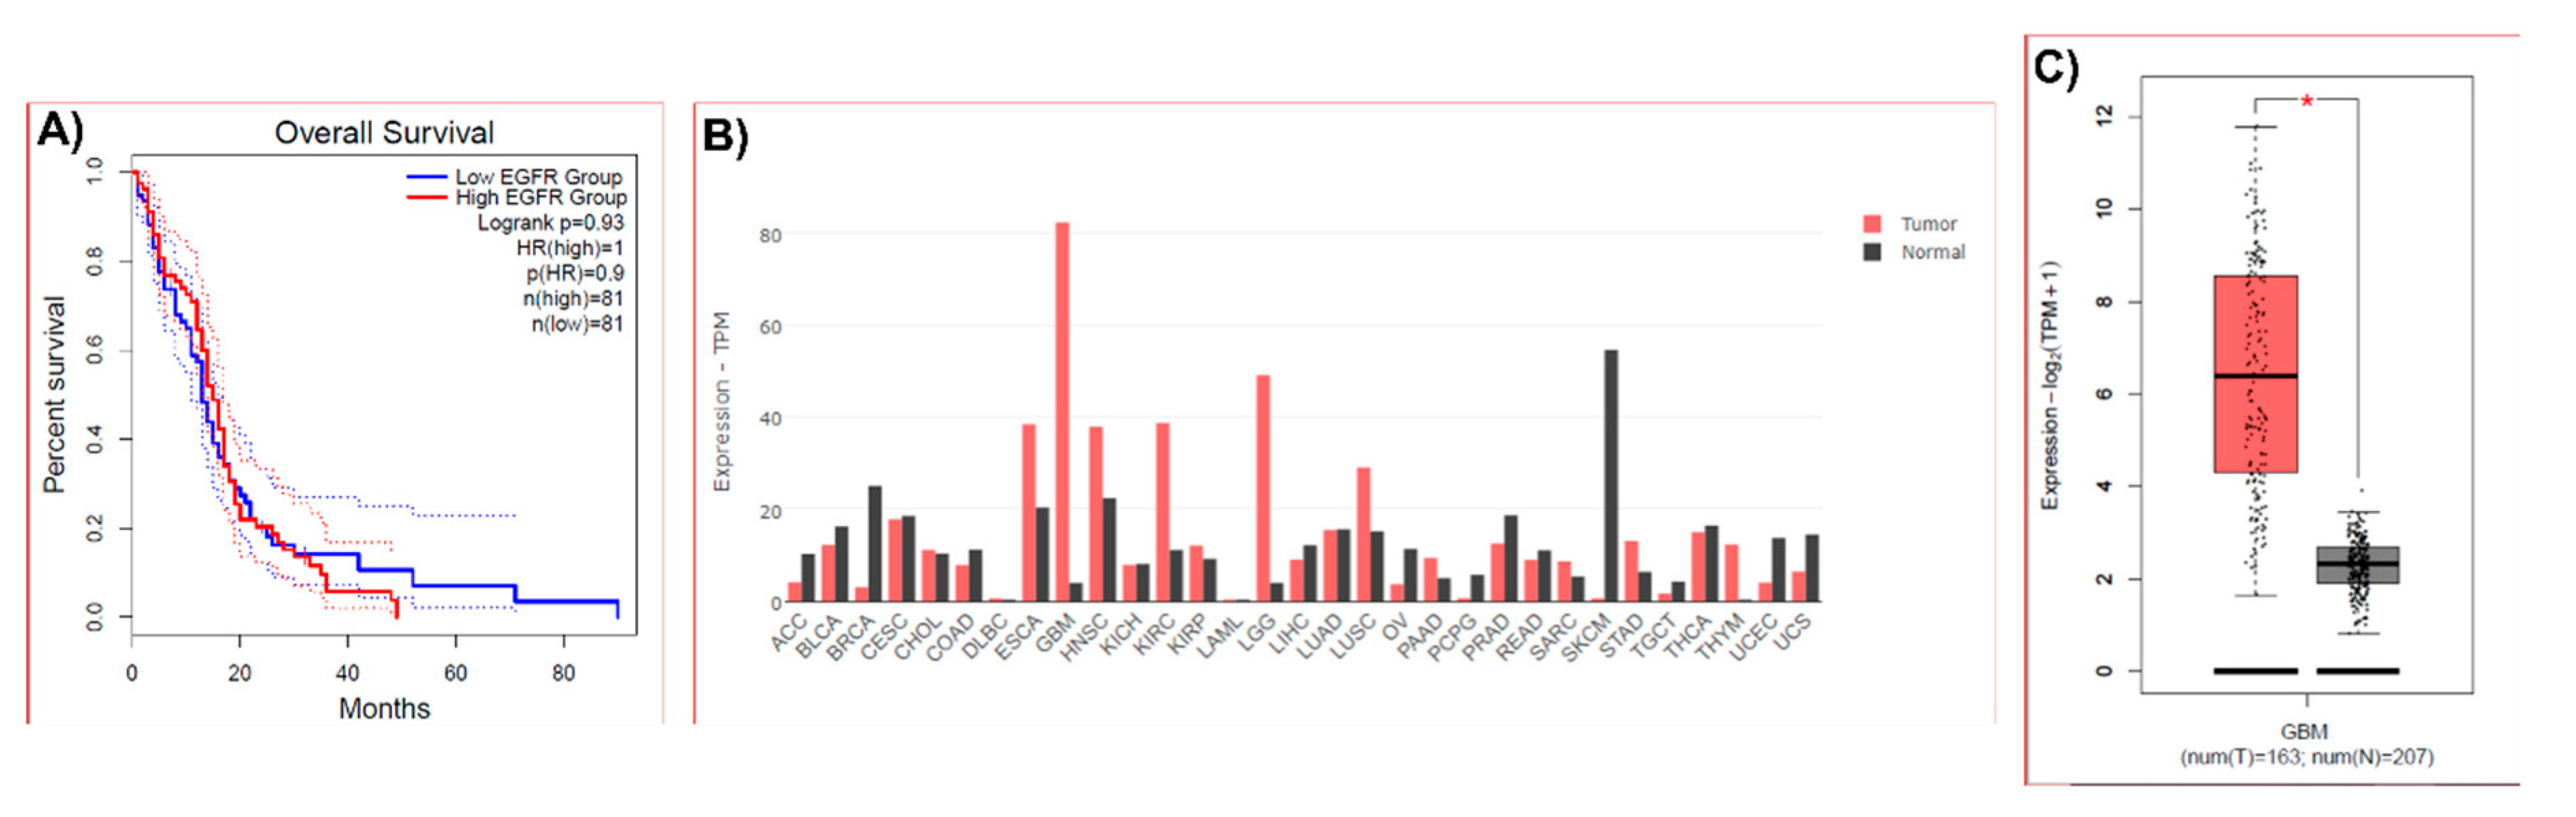
Figure 2.
Percentages of cell viability by MTT after PDT in T98G parental and PDT-resistant populations. Parental and resistant T98G cells were incubated with Me-ALA for 4 hours and irradiated at 5.07, 6.08 and 8.11 J/cm2. Resistant populations had high viability at irradiation doses lethal to the parental populations. PDT= photodynamic therapy; C=control; DC= drug control; LC= 8.11 J/cm2 light control. * p < 0.05 (compared with C).
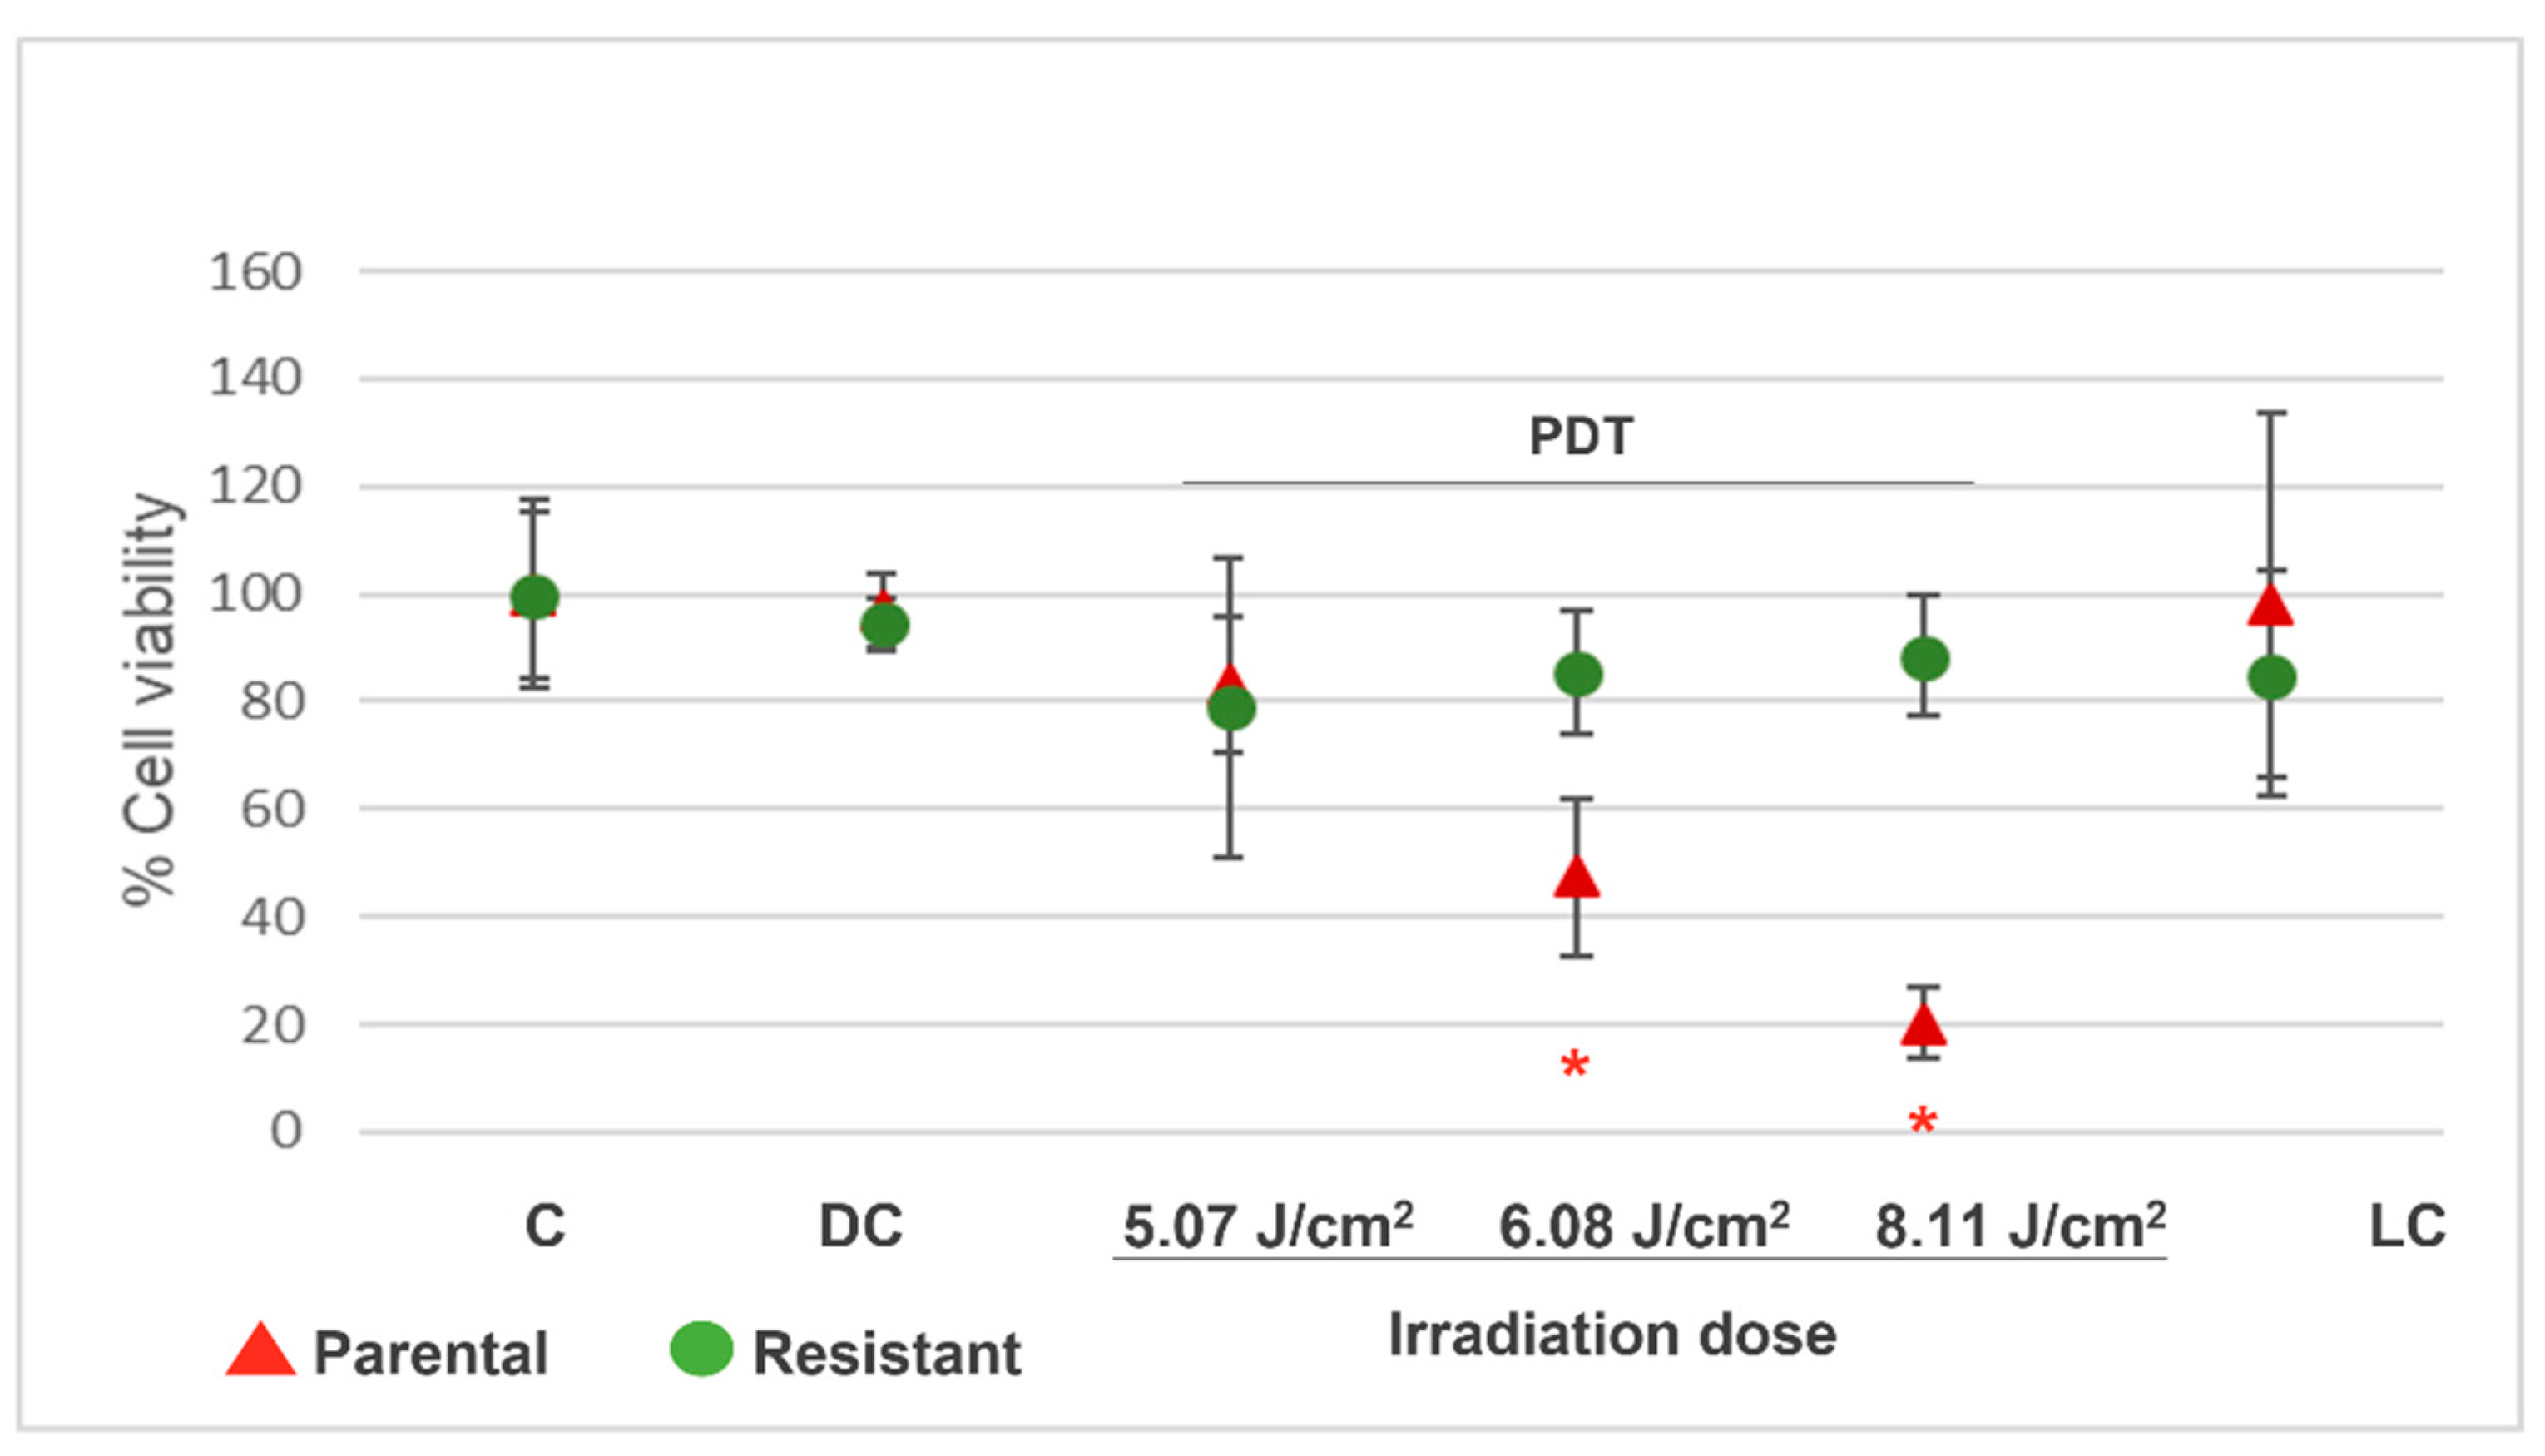
Figure 3.
A) Percentages of cell viability by MTT in parental and resistant T98G cells incubated with erlotinib. Parental and resistant T98G cells were incubated with erlotinib (Erl) for 24 hours at doses of 9.2, 25 and 50 µM. Erlotinib and its vehicle DMSO (V) did not affect the cell viability of parental and resistant T98G populations. B) Cell viability by MTT after PDT and erlotinib combination in parental and resistant T98G cells. Cells were incubated with Me-ALA (1 mM) and erlotinib (50 uM) for 4 hours and then irradiated at 6.08 and 8.11 J/cm2. After 24 h, cell viability was measured by MTT. PDT in combination with erlotinib reduced viability in resistant populations compared to PDT alone. PDT= photodynamic therapy. * p < 0.05 (compared with PDT alone).
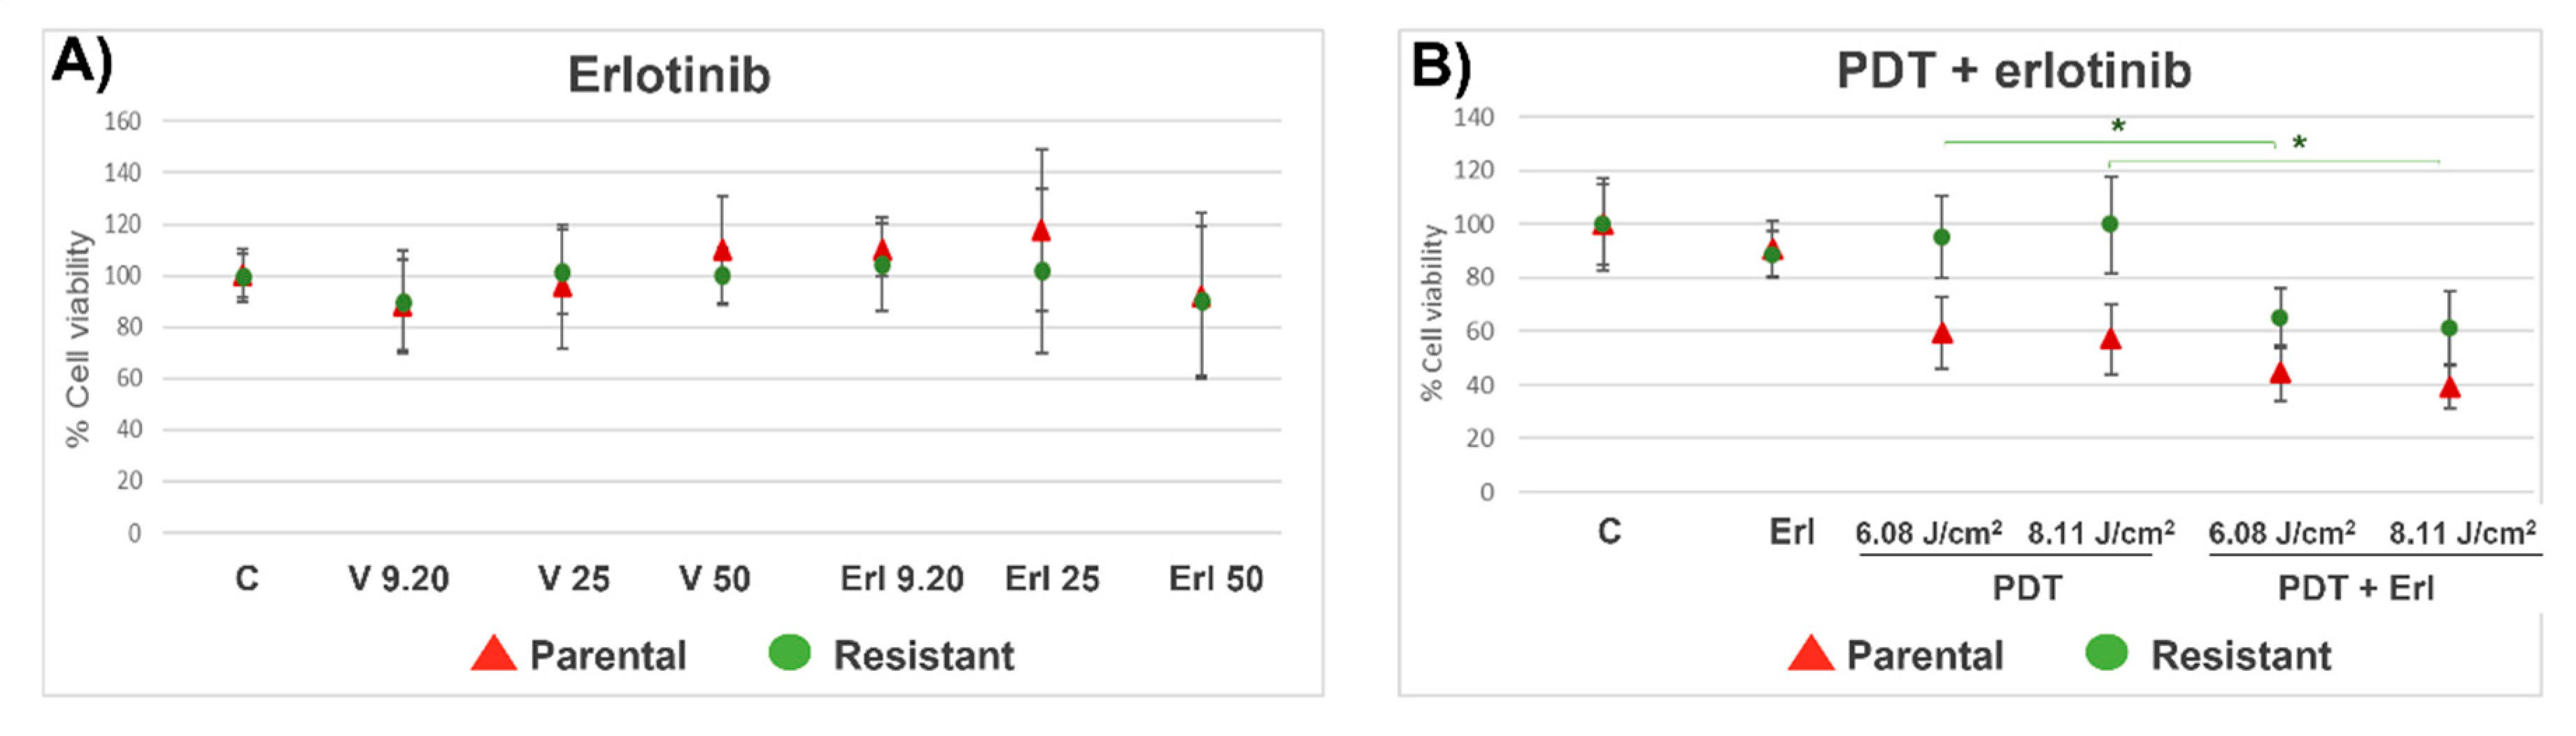
Figure 4.
Flow cytometry of PpIX content after Me-ALA and erlotinib incubation. Parental (A) and resistant cells (B) were incubated with Me-ALA (1 mM) and erlotinib (50 µM) for 4 hours. PpIX fluorescence was measured by flow cytometry. Erlotinib increased the content of PpIX in the resistant population (B, C, D, E). A.U.= arbitrary units. Erl= erlotinib. * p < 0.05 (compared with Me-ALA+DMSO).
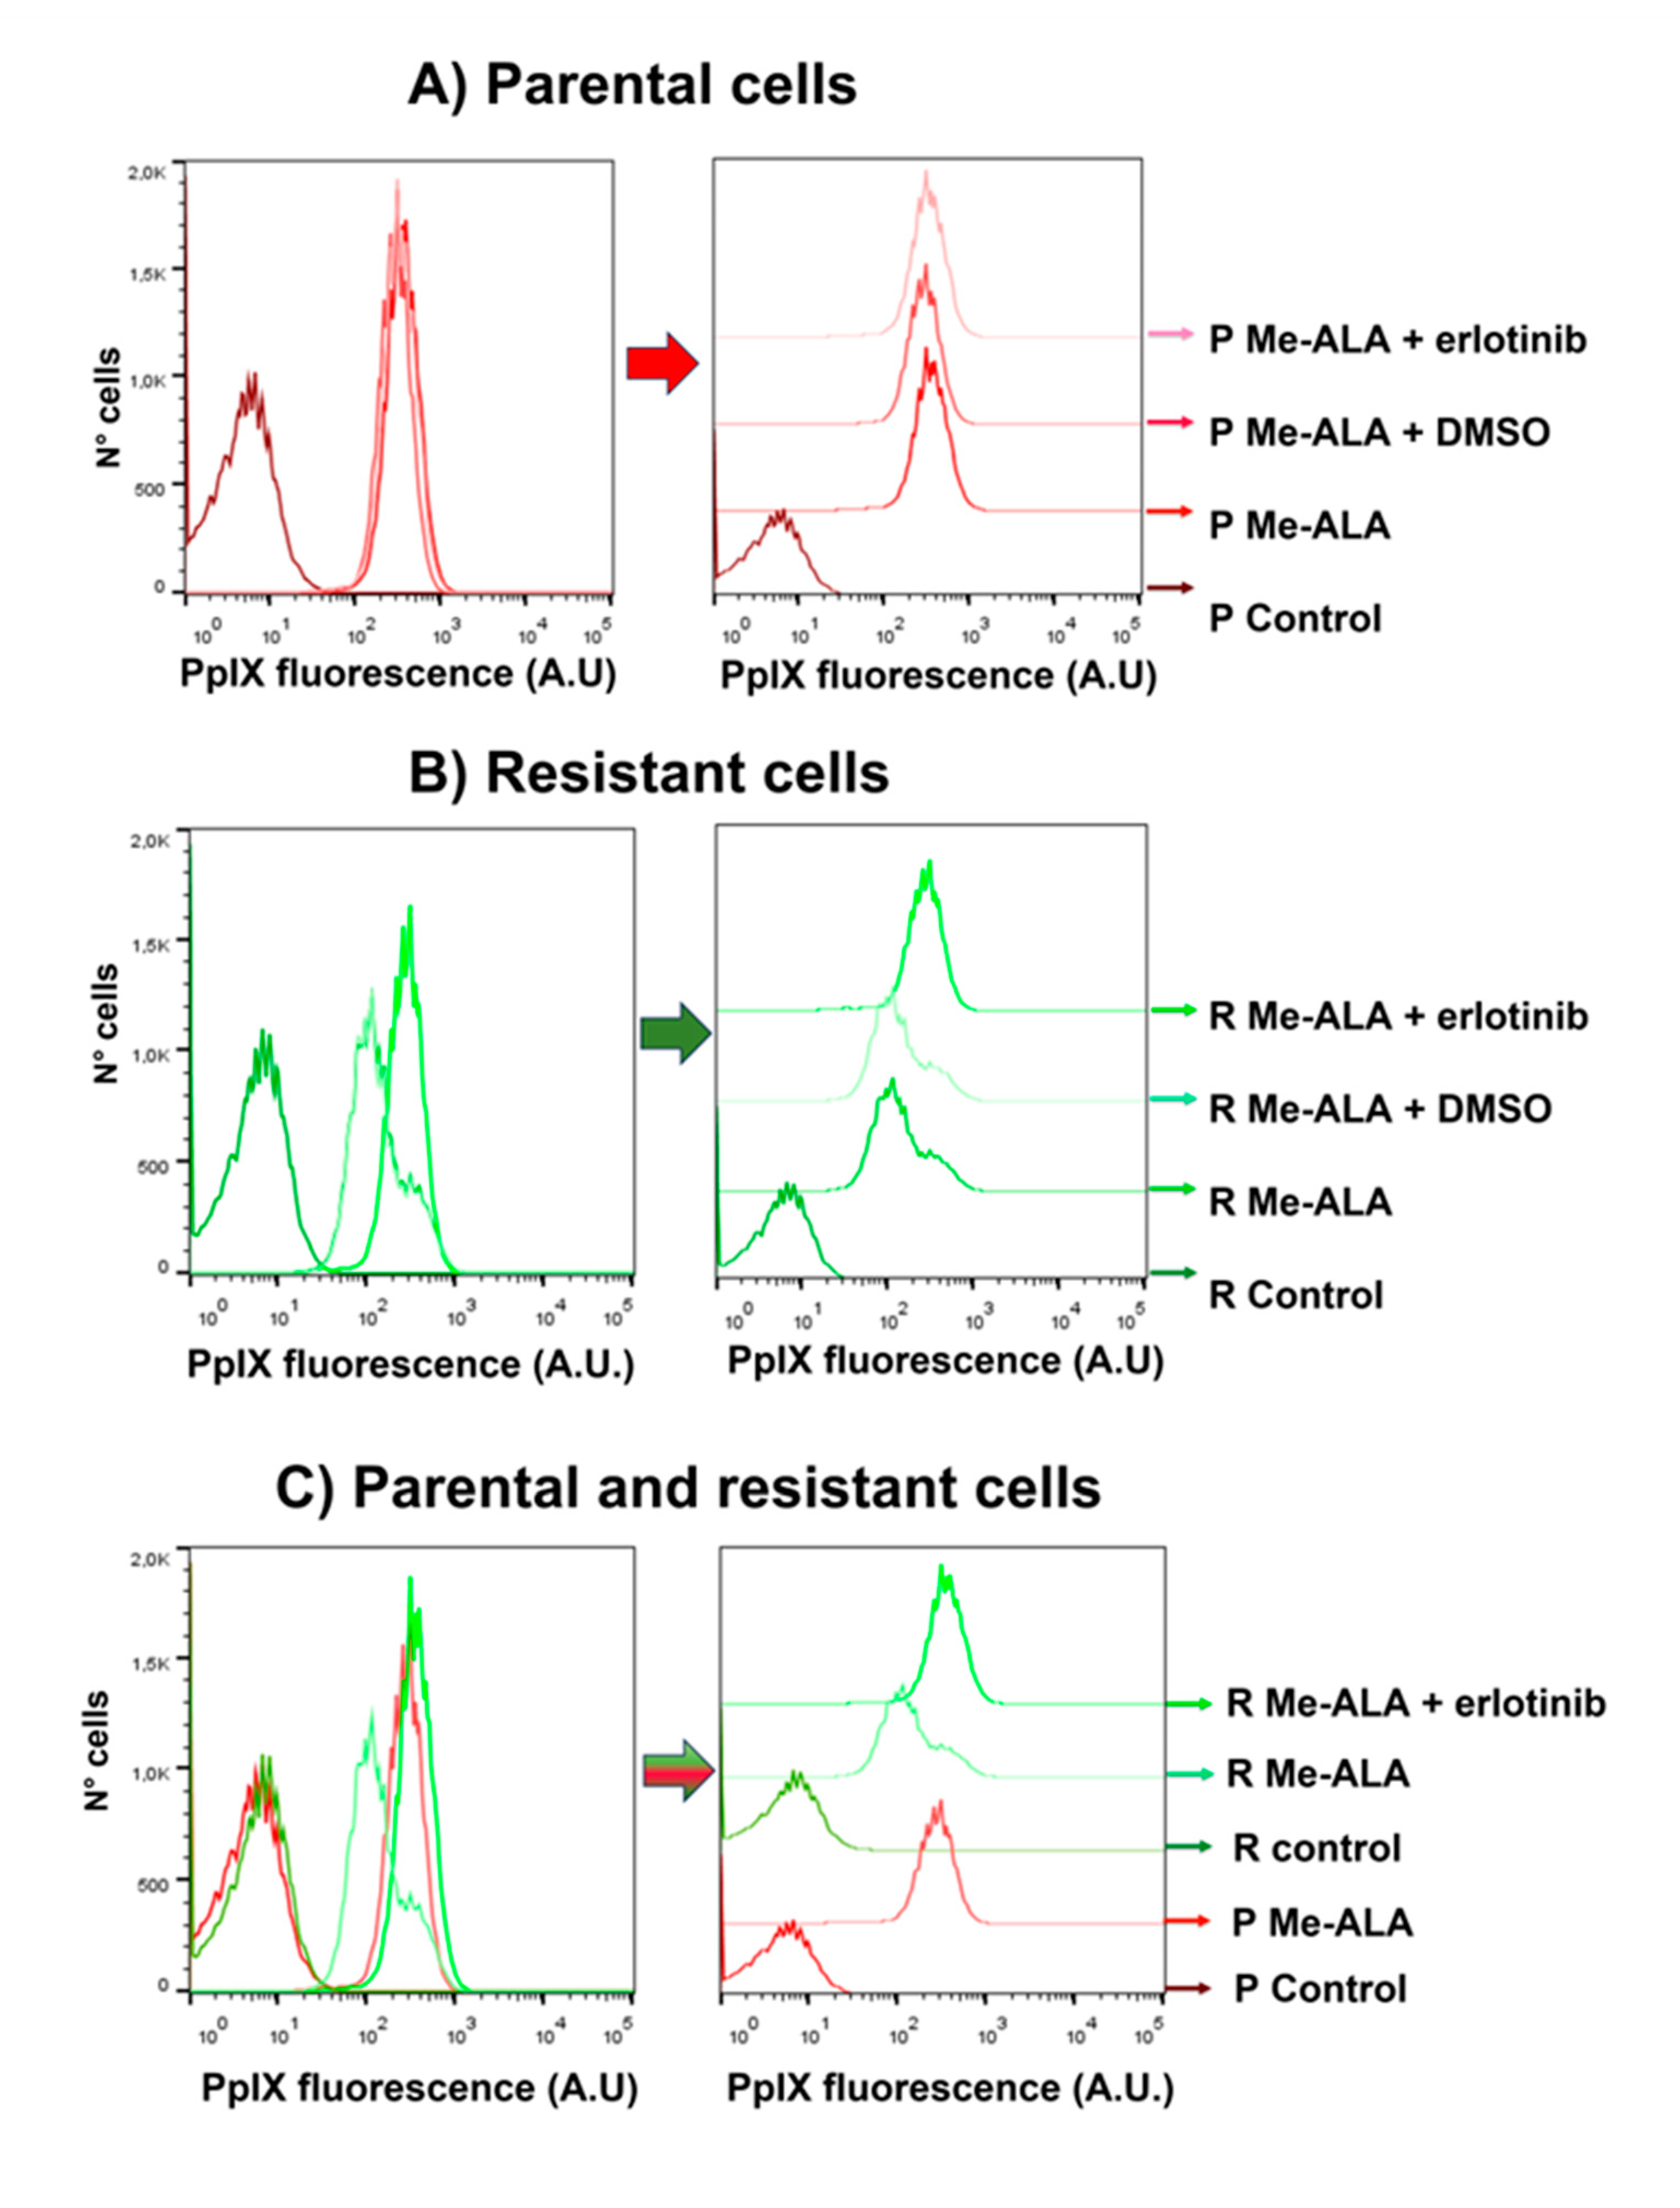
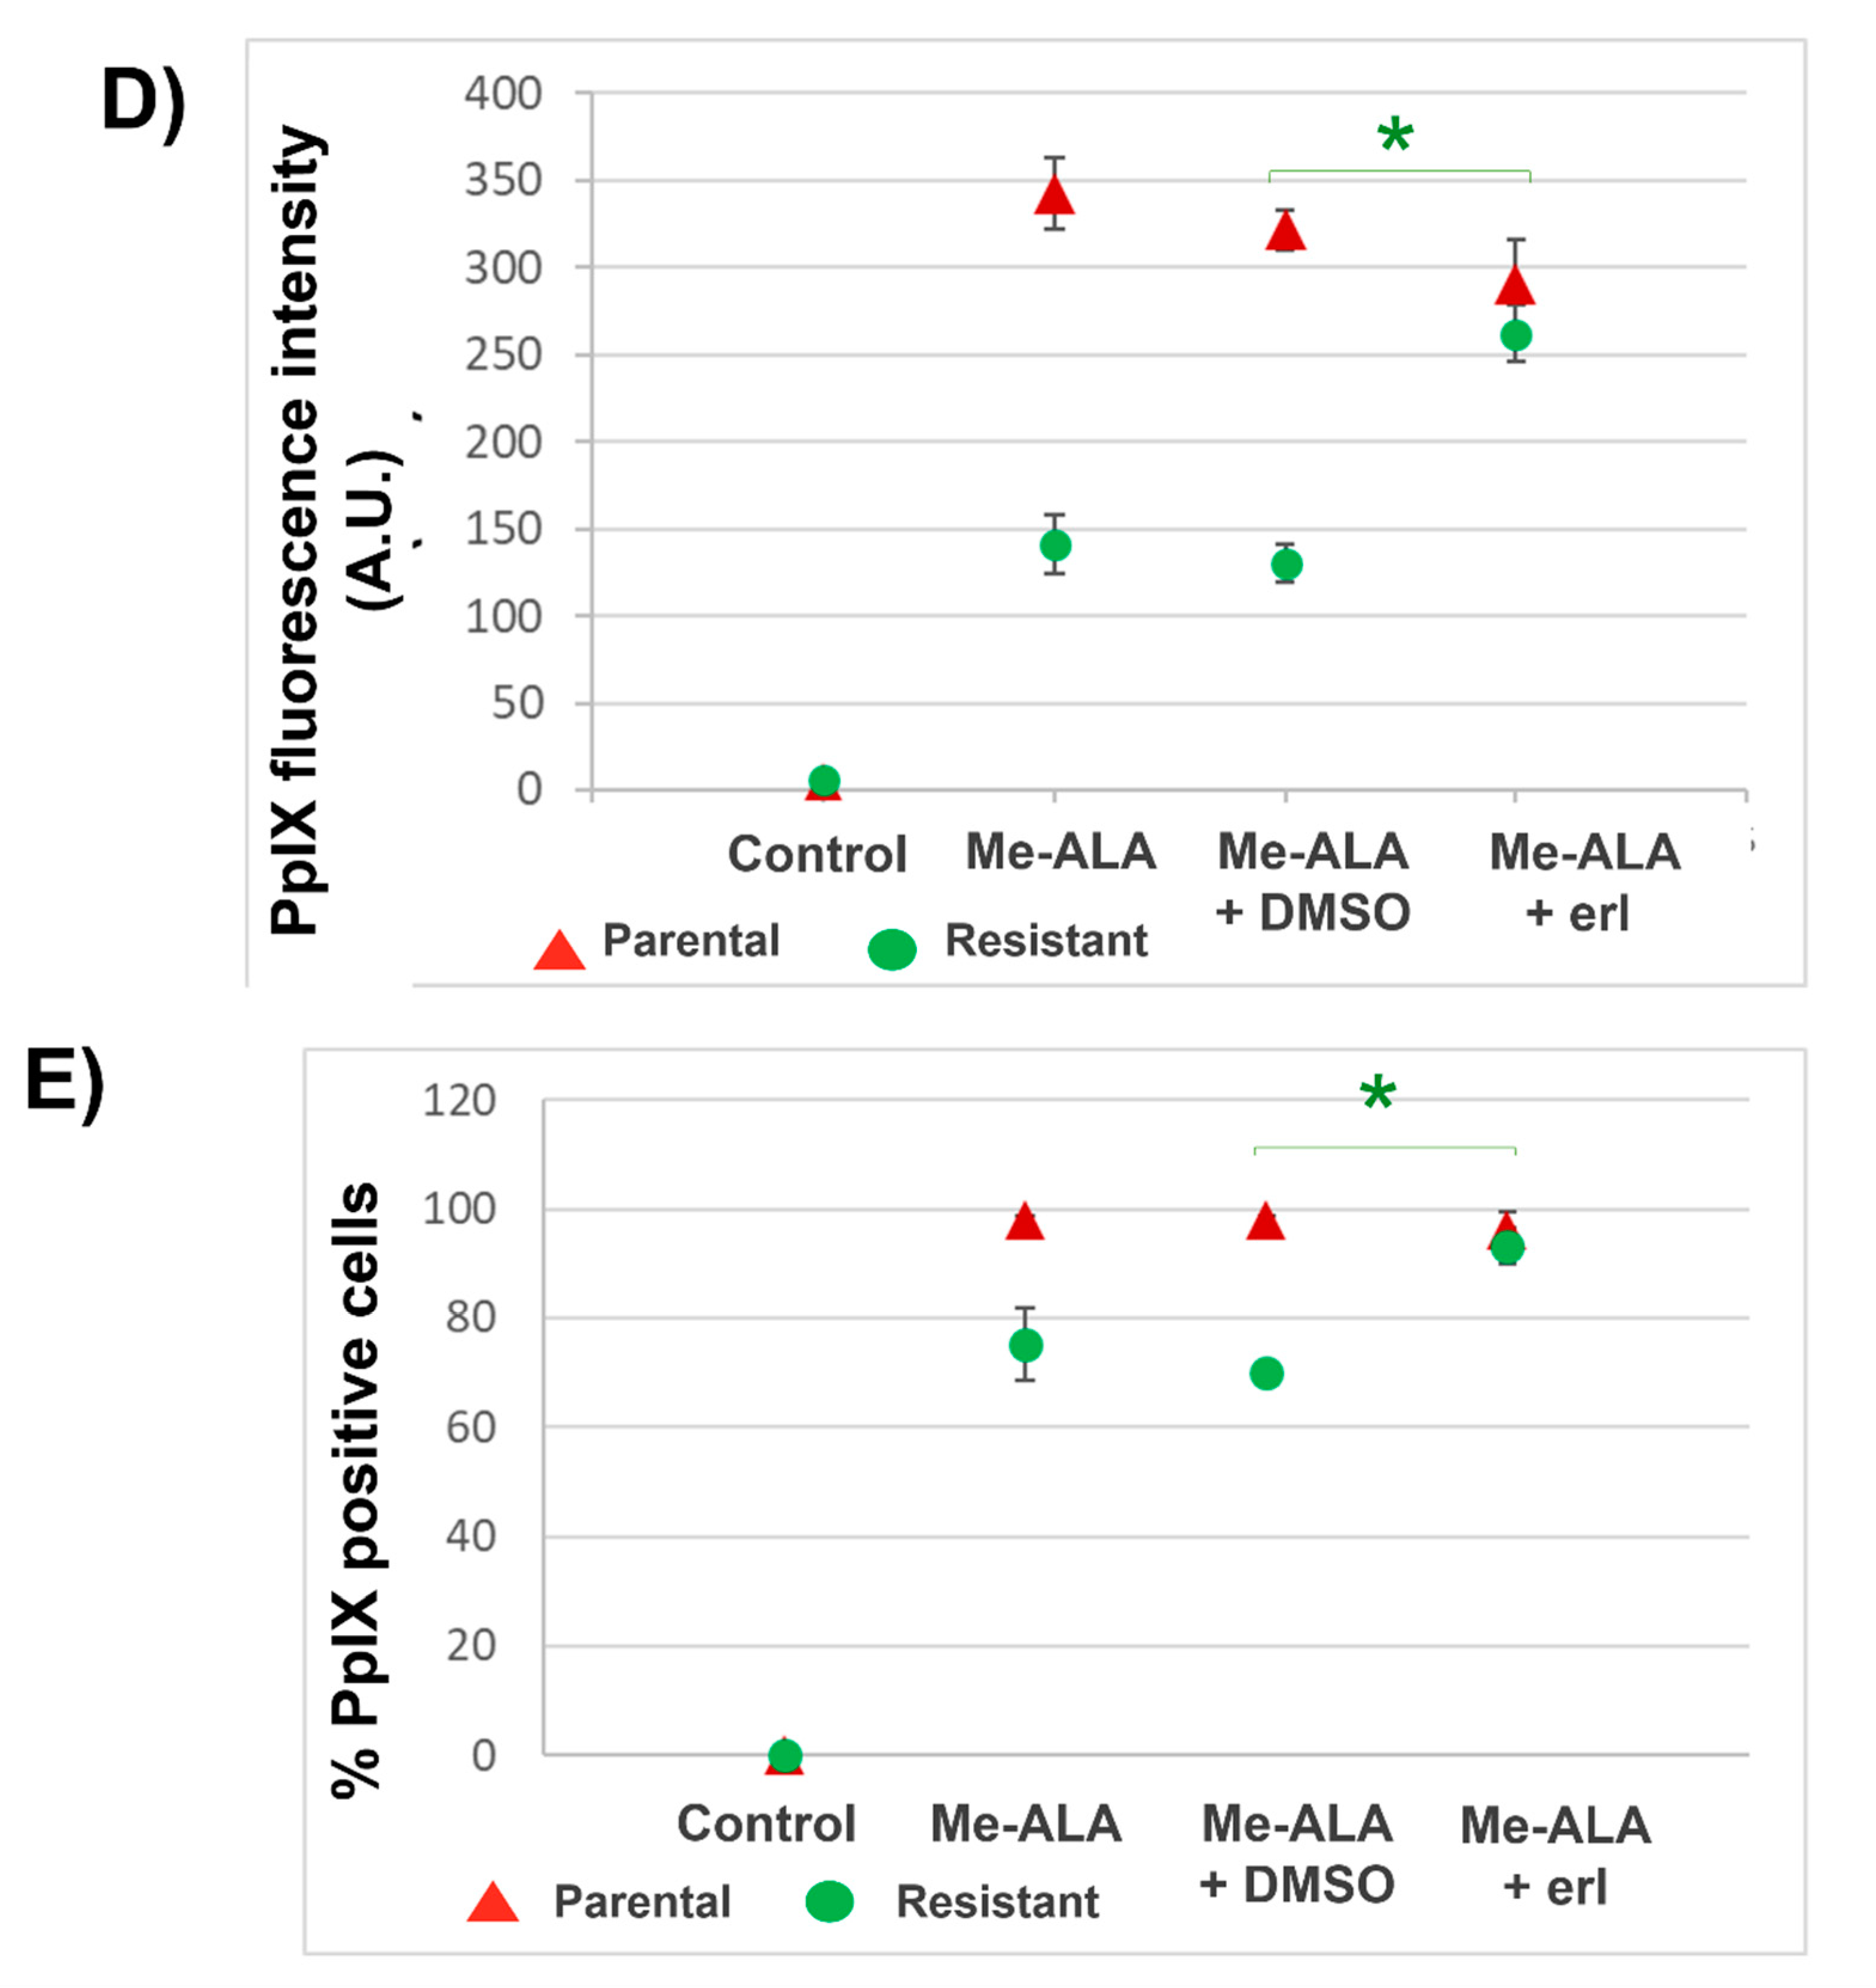
Figure 5.
Parental and resistant T98G spheroids incubated with erlotinib. Photographs and cell number count per spheroid 3 days after seeding 2,000 cells per well in U-bottom plates with agarose. Cells were seeded with erlotinib (Erl) at the dose of 25 µM (A) and 50 µM (B). Erlotinib inhibited the proliferation of parental and resistant T98G 3D cultures. C=control, V= vehicle, Erl= erlotinib. * p < 0.05 (compared with V).
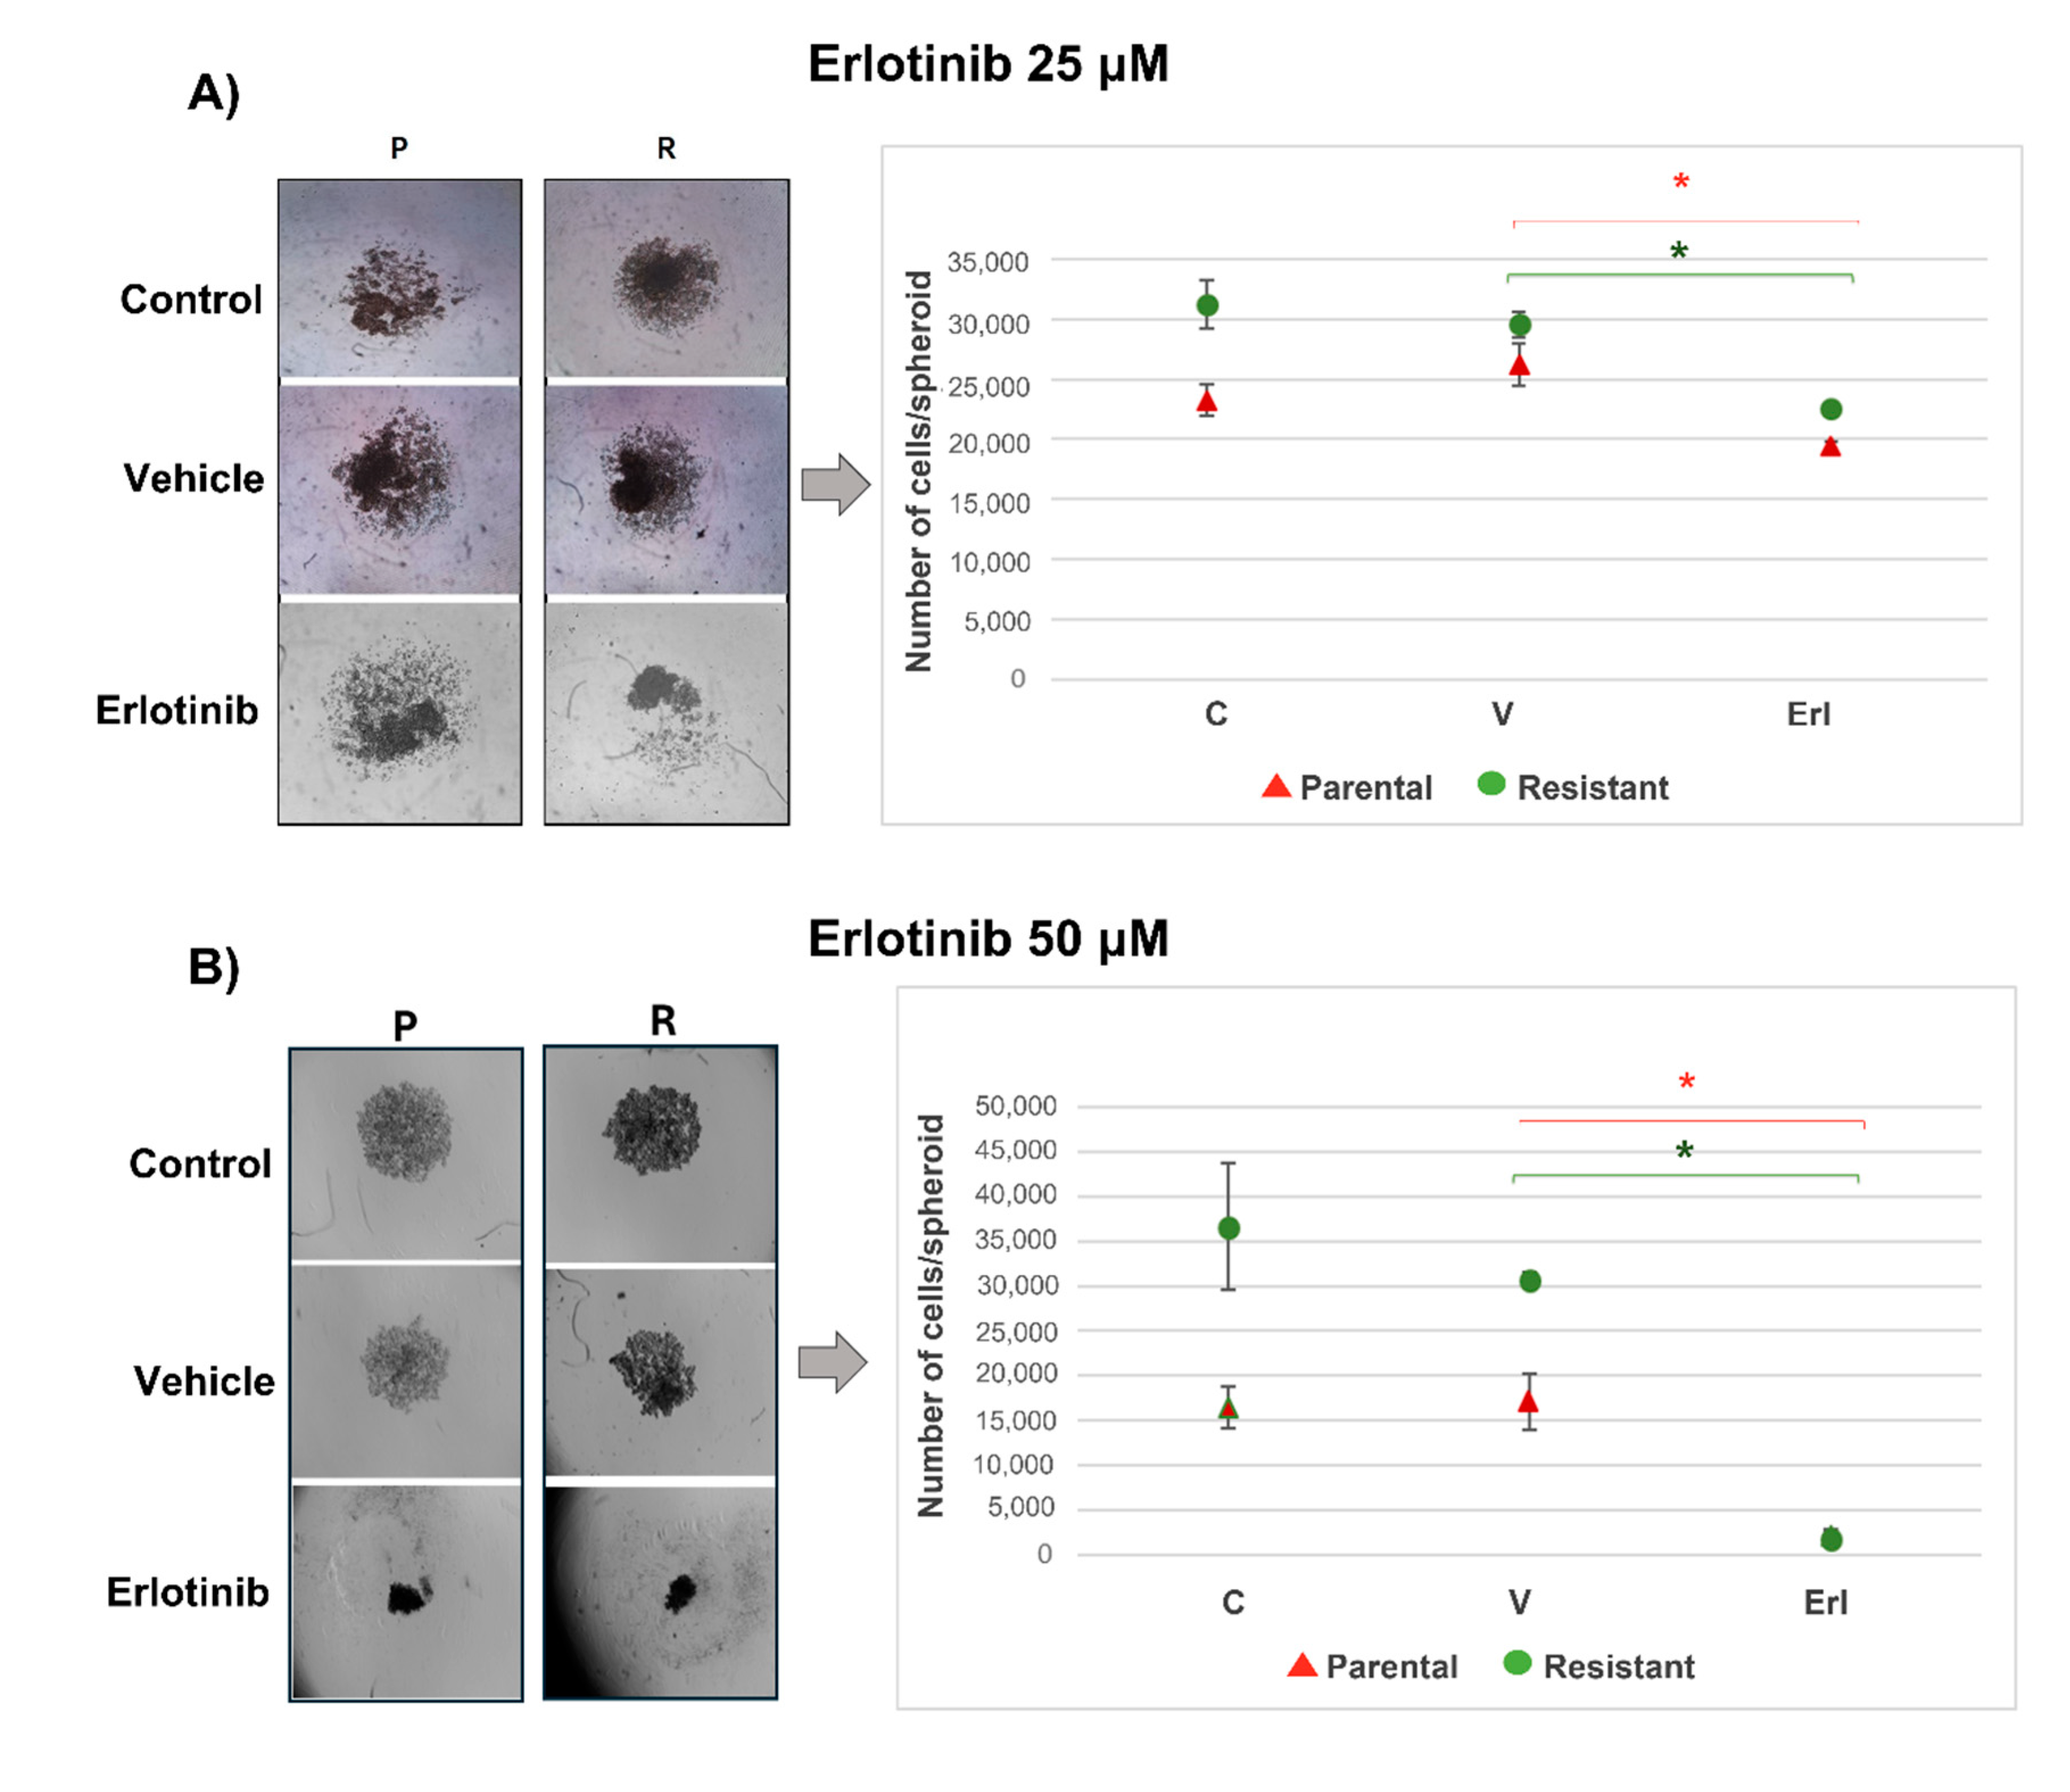
Figure 6.
Wound closure in parental and resistant T98G populations incubated with erlotinib. Immediately after opening the wounds, cells were incubated with erlotinib (Erl) at the dose of 25 µM in DMEM 1% (A) and DMEM 10 % (B) and at the dose of 50 µM in DMEM 1% (A) and DMEM 10 % (B). Photographs of the wounds were taken at day 0 and at the final time. A quantification of the percentage of wound closure was performed using ImageJ. Erlotinib reduced wound closure similarly in parental and resistant T98G, both when 1% DMEM was used and when 10% DMEM was used. C=control, V= vehicle, Erl= erlotinib. * p < 0.05 (compared with V).
Disclaimer/Publisher’s Note: The statements, opinions and data contained in all publications are solely those of the individual author(s) and contributor(s) and not of MDPI and/or the editor(s). MDPI and/or the editor(s) disclaim responsibility for any injury to people or property resulting from any ideas, methods, instructions or products referred to in the content. |
© 2024 by the authors. Licensee MDPI, Basel, Switzerland. This article is an open access article distributed under the terms and conditions of the Creative Commons Attribution (CC BY) license (http://creativecommons.org/licenses/by/4.0/).
Copyright: This open access article is published under a Creative Commons CC BY 4.0 license, which permit the free download, distribution, and reuse, provided that the author and preprint are cited in any reuse.


