
Submitted:
07 November 2024
Posted:
07 November 2024
You are already at the latest version
Abstract
The escalating use of plastic materials in agricultural practices has substantially increased the amount of plastic waste directed to landfills, leading to significant environmental and ecological challenges. Conventional disposal methods have been found to release hazardous pollutants, including microplastics and toxic chemicals, exacerbating these concerns. This study aims to address the environmental impact of agricultural plastic waste by exploring advanced reprocessing technologies and characterising the processed waste to assess its physical, mechanical and thermal properties. Synthetic polymer-based bale twine (BT) waste, commonly used in livestock farming, was processed using an economically viable melting machine developed by Ritchie Technology. The BT and processed bale twine (PBT) were analysed to understand their properties. Fourier transmission infrared spectroscopy revealed that the waste primarily consisted of polypropylene (PP). Thermal analysis indicated that the melting temperature of the PBT was 162.49 °C, similar to virgin PP. Additionally, tensile testing revealed that the PBT had a strength of 13.06 MPa and Young's modulus of 434.07 MPa. The PBT was further transformed into a bench that can be applicable in outdoor applications. Furthermore, PBT was extruded into 3D printable filament. Therefore, it is evident that bale twine waste can be given a second life through an economically viable technology.
Keywords:
Bale twine waste
; recycling
; agricultural plastic waste
; extrusion
1. Introduction
Plastic waste generated in the agricultural sector has become a significant environmental concern, as the widespread use of plastic materials such as mulch films, irrigation tubing, greenhouse covers, and bale twine has led to substantial accumulation of plastic debris in the environment [1]. This continuous increase is expected to persist, creating environmental challenges that must be addressed. Although plastics are essential for specific farming tasks, their environmental impact is increasingly concerning [1]. These plastics, often termed "agroplastics," have revolutionised modern farming practices [2]. As of 2024, the global agriculture sector generates millions of tons of agroplastic waste annually, posing risks to soil health, water quality, and broader ecological systems [3,4].
The management and disposal of agroplastic waste are not just environmental issues but potential health hazards [4,5]. Conventional disposal methods, such as landfill burial and incineration, often release hazardous pollutants [1]. These pollutants, including microplastics [6] and toxic chemicals [7], seep into the soil and water systems [8,9], leading to contamination [10]. This contamination can infiltrate the food chain, posing direct threats to the health of plants, animals, and humans. Moreover, the persistent nature of plastics means they remain in the environment for extended periods, exacerbating the global plastic pollution crisis, which is both an environmental concern and a potential health crisis.
Recycling offers a practical and economically viable solution to mitigate the environmental impact of agroplastics [11]. Effective recycling procedures can convert waste into significant secondary raw materials, conserving resources and reducing ecological footprints. Various methods, including mechanical [12,13], chemical [14], and energy recovery [15], are employed for recycling agricultural plastics. Each method has its unique advantages and limitations, but all contribute to the economic sustainability of farming practices.
Despite the potential advantages, recycling agroplastics is fraught with significant challenges. Contaminants such as soil, pesticides, and organic matter complicate the recycling process, driving up costs and diminishing the quality of the recycled materials [16,17]. Furthermore, the diversity of agricultural plastic types, spanning from polyethylene (PE) to polyvinyl chloride (PVC), necessitates sophisticated sorting and processing technologies [16]. Economic factors, including the volatile market value of recycled plastics and the high costs of collection and transportation, further impede the widespread adoption of recycling practices.
Bale twine plays a crucial role in livestock farming by providing the means to package and secure agricultural products, mainly hay and straw. Traditionally, bale twine has been produced from natural fibres such as sisal or hemp [18]. However, in recent decades, the increased use of fossil fuel products has led to the manufacturing of bale twines using synthetic polymers like polypropylene (PP). Each material offers its own set of advantages and disadvantages. For example, natural fibre twines are biodegradable and digestible, making them an environmentally friendly choice that reduces the ecological footprint associated with disposal [19]. On the other hand, natural fibre twines tend to have lower tensile strength than their synthetic counterparts. This reduced strength can result in product loss during transportation and packaging, as the twine may break or degrade prematurely. PP twines offer high strength and durability [20]. They also provide a smooth binding system, minimising friction under adverse conditions. These twines are often manufactured with UV stabilisers and pigments, significantly improving their resistance to sunlight and weathering, thus extending their usability [21]. Despite their advantages, PP-based twines raise notable environmental concerns. Due to their non-biodegradable nature, disposing of them in landfills or burning them after use poses significant ecological risks. PP twines can survive in the ecosystem for a long time, contributing to the growing issue of plastic pollution and challenging waste management systems. Alternatively, farmers often burn the waste bale twines in fields, releasing harmful pollutants such as dioxins and furans, which can contaminate air, soil, and water, posing hazards to human health and ecosystems.
Recycling PP-based twines is crucial to reduce the ecological footprint of livestock farming and ensure a sustainable future for agricultural operations [22]. However, recycling baling twines is challenging due to their high contamination with soil and other residues, such as animal skin or feces. Additionally, the cost of accepting agricultural waste at waste management facilities leads the farmers to burn the waste in fields rather than dispose of it at waste centres. Addressing these challenges requires a multifaceted approach integrating technological innovations and policy interventions.
Advancements in recycling technologies, such as developing of more efficient reprocessing, cleaning, and sorting systems, can enhance the viability of recycling agroplastic waste [1,10,23,24]. While biodegradable and photodegradable plastics offer alternative solutions, their environmental benefits are not yet fully understood. Additionally, implementing technologies or equipment for on-site waste collection and processing could improve the efficiency of recycling methods and reduce landfill waste [25]. This study aims to introduce new equipment developed by Ritchie Technology (Rtec™) to address significant challenges and opportunities in the field and improve the efficiency of recycling efforts. It also involves processing BT waste using Rtec equipment and analysing the thermal and mechanical properties before and after processing. Furthermore, products were developed using the extruded bars from the BT waste to create opportunities for a cradle-to-cradle approach. This innovative technology promises to significantly reduce the environmental impact of agroplastics and bale twines, making recycling more efficient and cost-effective.
2. Results and Discussion
2.1. Fourier Transform Infrared Spectroscopy (FTIR)
Quantitative and qualitative analyses of BT, PBT and pure PP is shown in Figure 1. The commercial PP spectrum was used as a reference to confirm the BT and PBT spectra. The spectra peaks of the all the samples were significantly similar. Bending and stretching vibrations assigned to CH, CH2 and CH3 groups that were observed in the 3000 to 2000 cm−1 and 1500 to 1000 cm−1 ranges for all the samples [26]. Similarly, all samples exhibited comparable vibrations in the 900 to 750 cm−1, indicating the presence of double bonds and alcoholic or phenolic groups. However, the presence of a few smaller peaks in the range of 800 to 700 cm−1 suggests the oxidative degradation of the samples or the existence of additives with such functional groups. BT displayed a peak of around 3500 to 3000 cm−1 that is corresponding to moisture content (hydrogen bonding functional group) [27,28,29]. This peak was slightly smaller in the PBT and pure PP due to lower moisture content compared to the BT. The transmittance peaks at 2952 cm-1, 2917 cm-1, 2870 cm-1 and 2839 cm-1 were related to the C–H stretching functional group [28,30,31]. The peak at 1457 cm-1 corresponded to bending vibration mode of the CH2 functional group. FTIR peaks displayed at 1376 cm-1 were related to the symmetrical formation of the CH3 group [32]. Furthermore, the peaks observed at 973 cm-1 and 841 cm-1 were attributed to isotactic PP bonds [27,28,29,32,33] . In addition, the BT and PBT spectra were compared with supplementary FTIR library data for qualitative analysis using Agilent’s polymer library and Open Specy spectra analysis tool [34]. The quantitative and qualitative search indicated that the obtained spectra were similar to those of polypropylene (PP) pellets. Therefore, it is evident that the samples are composed of PP and are recyclable based on their melting temperatures.
2.2. Thermogravimetric Analysis (TGA)
The TGA curves of the pure PP, BT and PBT are shown in Figure 2a. The graphs displayed a one-step degradation with 100% weight loss for all the samples. The initial decomposition of the pure PP began at around 350 °C. Similarly, PBT exhibited a comparable initial thermal decomposition starting point. However, BT showed s slightly higher decomposition temperature compared to both pure PP and PBT (Figure 2a inset). The maximum degradation rate was observed at 480 ± 5 °C for all the samples with the process completing at 500 ± 5 °C. As the temperature increased further, the high molecular weight molecules broke down into lower molecules weight compounds, which then evaporated, leaving almost no char once temperature exceeded 500 °C. According to Jung et al. [35], the active degradation in the samples was primarily due to the fact that half of the carbons in a PP chain are tertiary carbons, which can lead to the formation of tertiary carbonation during degradation. This phenomenon contributes to faster degradation in PP, as confirmed by the current study, where PP degraded faster compared to BT and PBT [35]. Additionally, the complete degradation of PBT and BT occurred at 509 °C and 513 °C, respectively. This suggests a minimal presence of inorganic compounds in the samples and indicates the presence of contaminates or fillers.
In line with the TGA analysis, the DTG curves (Figure 2b) of pure PP, BT and PBT are shown in Figure 2b, indicating that the major decomposition appeared within the range of 350 to 400 °C for all the samples. The sharp peaks demonstrated the rapid degradation and breakdown of the molecules in the samples. As reported in the literature [33,36,37,38,39], recycled PP may contain varying percentages of impurities, which significantly affect its properties. Therefore, it is evident that the thermal stability behaviour of BT and PBT slightly varies from that of pure PP.
2.3. Differential Scanning Calorimetry (DSC)
The thermograms were obtained for pure PP, BT and PBT are shown in Figure 3 and summarised in Table 1. The endothermic heat flow curves of the samples resulting from the second heating run are shown in Figure 3a, while the curves from the cooling run are presented in Figure 3b. The results demonstrated that the melting temperature of pure PP was recorded at 152 °C. However, the melting temperature of BT and PBT were up to 10 °C higher compared to pure PP. This increase could be due to the higher molecular mass of polymers in the recycled samples. This was confirmed by the broader peak observed in pure PP, indicating a lower molecular mass, compared to the sharper peaks in recycled polymers. According to literature reports [40,41], industrial PP, virgin PP or stable PP typically melts around 150 to 160 °C.
For the melting enthalpy, the results showed that pure PP and PBT had values of 54 J/g and 76 J/g. In contrast, the post-consumer product BT exhibited a higher melting enthalpy of 149 J/g compared to both pure PP and PBT. Moreover, BT and PBT displayed a small melting event at high temperatures of 132 °C and 125 °C, respectively, as highlighted by the red circle in Figure 5a. The smaller peaks in BT and PBT corresponded to a small melting enthalpy of 1± 0.5 J/g. These smaller peaks in the recycled samples may result from contaminants such as fillers or additives, a phenomenon frequently reported in post-consumer plastics [28].
The crystallisation data is shown in Figure 3b. All samples exhibited similar crystallisation patterns. The crystallisation of pure PP was determined to be around 113.49 °C while BT and PBT crystallised at 118.15 °C and 116.03 °C, respectively. The higher crystallisation temperatures in BT and PBT compared to pure PP suggests the presence of nucleating agents [42]. Vidakis et al. [43] reported that recycled PP typically crystallises around 116 °C, which is similar to PBT in the current study. The degree of crystallinity for pure PP and PBT was 26.2% and 36.7%, respectively, whereas BT showed a higher degree of crystallinity at 72.4%. The increased crystallinity can be attributed to the lower molecular weight of BT, which acts as a nucleating agent [36,37,42]. According to Mihelčič et al., [36] the presence of nucleating agents enhances the crystallisation of semicrystalline polymers by facilitating chain unfolding and forming larger crystal structures. The current study confirms that reprocessing polymers can lead to decreased molecular weight, crystallisation temperature and degree of crystallinity.
2.4. Melt Flow Index (MFI) Analysis
MFI analysis measures polymer flow through a die for 10 min at a set temperature and load [44]. Figure 4a represents the MFI values at varying temperatures from 180 to 230 °C for pure PP, BT and PBT. As depicted in Figure 6a, pure PP exhibits a higher MFI compared to BT and PBT at 230 °C, with an MFI of 8.3 ± 0.5 g/10 min. In contrast, the MFI for BT and PBT were 6.0 ± 0.12 g/10 min and 7.8 ± 0.1 g/min, respectively, at 230 °C. MFI increased with temperature across all samples. According to Ferg et al. [45], MFI values for virgin PP ranged from 4.14 ± 0.04 to 16.80 ± 0.12 g/10 min at 230 °C, with variations depending on the molecular weight distribution of different virgin PP samples. Luna et al., [46] demonstrated that lower MFI values indicate higher molecular weight and viscosity. In this study, BT showed the lowest MFI compared to pure PP and PBT, indicating it has the highest viscous and molecular weight. Conversely, PBT did not demonstrated significant changes in molecular weight and polydispersity compared to pure PP. This suggests that the post-consumer product BT may contain polar contaminants or fillers used during its manufacturing. Additionally, the Arrhenius relationship (Figure 4b), determined via Eq. 1, was used to compute the flow activation energy of PBT. The activation energy (Eα) was approximately 34.72 kJ/mol, reflecting the thermal stability of the recycled plastic. Considering the obtained MFI of PBT is within the range of standard MFI values for commercially available PP, PBT is suitable for processing via injection moulding, compression moulding and other extrusion-based applications.
2.5. Mechanical Properties
The stress-strain curve of PBT is shown in Figure 5 and the compressed PBT tensile samples are shown in the inset of the Figure 5. From the graph, the tensile strength and Young's modulus of PBT were calculated to be 13.9 MPa and 434.07 MPa. According to Gall et al. [33], the tensile strength of virgin PP is typically around 20 MPa. In this study, PBT exhibited lower tensile strength compared to the virgin PP. Similarly, literature reports indicate that the Young’s modulus of virgin PP was approximately 600 MPa [47,48]. The observed lower tensile strength and Young's modulus for PBT distinct to literature values may be due to the deterioration of molecular chains, leading to increased brittleness [33,49,50]. Additionally, studies by Zdiri et al., [51] and Bourmaud et al. [52] have demonstrated that recycling polymers often displayed a minimal reduction in mechanical properties, which may be attributed to physical ageing and a decrease in molecular weight . In this context, the thermograms and melt flow data indicate that PBT has a lower melting point compared to BT, reflecting changes in molecular weight.
Figure 5.
Stress-strain curve of PBT (the inset shows the hot-pressed tensile test samples, n=3).
The hardness of the PBT indicates its ability to resist deformation. The hardness value of the processed plastic waste was determined to be 98 ± 2 MPa, based on the average of three tested samples. Krishna Satya et al. [49], reported a hardness of 107 MPa for recycled PP while Berdjane et al. [53] demonstrated hardness of 83 MPa for recycled PP. In the present study, the hardness value for PBT indicates greater brittleness compared to these literature reports. This brittleness could potentially be mitigated with further surface treatments or coatings to enhance the microhardness of the material.
2.6. Creep Analysis
The creep compliance over time at elevated temperatures is shown in Figure 6a. Figure 6b and Figure 6c show the unshifted short-term creep compliance and corresponding master curve of processed BT at all the tested temperatures, plotted against the test time on a logarithmic scale. The shift factor for the PBT was obtained using the William–Landel–Ferry (WLF) and the Arrhenius equations [54]. Therefore, the WLF method was applied to determine the shift-factor according to the Equations 1, 2 and 3.
where denoted the horizontal shift-factor, represents the temperature reference, T denotes the test temperature, C1g and C2g are constants. The shift factor for the PBT at 45 °C was 3.025 x 10⁻³, calculated using C1 (10.5 °C) and C2 (85.70 °C). According to this calculation, the creep curves were shifted to the right along the time axis as the temperature increased from 45 to 90 °C. Higher creep strain was observed with increasing temperature due to the greater macromolecular flexibility of the PBT at elevated temperatures.
Figure 6.
(a) creep compliance of PBT, (b) unshifted and shifted creep compliance curves of PBT, and (c) master curve of PBT at a reference temperature of 40 °C.
Figure 6.
(a) creep compliance of PBT, (b) unshifted and shifted creep compliance curves of PBT, and (c) master curve of PBT at a reference temperature of 40 °C.
Many empirical power-law models have been used to describe the nonlinear creep deformation behaviour of plastic materials. Among these, the Burger's [55,56,57] and Findely power law models are the most commonly used. Burger's model, which combines elements of the Maxwell and Kelvin-Voigt models [58]. The model effectively illustrates the quantitative correlation between the effects of material matrix interfaces and its relative creep behaviour as stated in Equation 4 [58].
The symbol denotes the strain. Em and EK are indicates the elastic moduli. ηk and ηm define the viscoelastic of the materials. While t represents the creep time and σ denotes the applied stress [58].
Nonlinear creep behaviour is often described using empirical mathematical models such as the Findley power law. The power law has been effectively applied to theoretically the TTSP-predicted creep behaviour for various polymers and polymer composite materials [54,59]. The Findley power law is expressed in the form of Equation 5 [60].
In this equation, S(t) represents the time-dependent compliance, where signifies the instantaneous elastic compliance, and a and b denote constant parameters, t represents the elapsed time.
Table 2 presents the parameters for the Findley power law and Burger's models. For Burger's model, the EM and EK values for PBT are 1.0 and 2.3, respectively. Additionally, the viscosity ηK is approximately 70.159, as noted in the literature [61]. These findings suggest increased polymer chain mobility in PBT. Furthermore, the results indicates that the spring reaches its balance length in a shorter delay time [61]. Similarly, the other viscosity (ηM) increased upto 3.55 × 10³. This occurrence demonstrated that PBT has promising creep resistance because of its lower creep rate [62,63]. According to the Findley power law, the elastic compliance and the viscous creep response parameters were recorded 15.9 and 0.25, respectively. The results from both theoretical predications indicated that the PBT exhibited superior creep resistance [64].
2.7. Water Contact Angle
The surface wettability of the PBT was analysed to assess its hydrophobic characteristics. The PBT demonstrated a hydrophilic nature, with a contact angle of approximately 72.17 ± 5 C°. According to Choi et al. [65], PP shows a contact angle of 104.9°, indicating the polymer's hydrophobic nature. In contrast, the contact angle in the current study was less than 90°, indicating an increase in the wettability of the recycled PP waste. This suggests that recycled plastics may have increased wettability due to factors such as moisture adsorption, aging or the presence of polar fillers.
2.8. Scanning Electron Microscopy (SEM)
The SEM micrographs of the fractured surfaces of the tensile samples are presented in Figure 7a. The images reveal significant formation and expansion of voids due to cavitation. Furthermore, the EDX analysis indicated that the sample contains a high concentration of carbon elements and small amount of oxygen elements (Figure 7b and c). Furthermore, Figure 7d demonstrates the amount of the carbon and oxygen atom counts. This suggests that the plastic pieces with holes and cracks may undergo further deterioration during recycling process.
2.9. Production of 3D Printing Filament and Park Bench Using PBT
The recycling of post-consumer agricultural plastics, such as those used for packing hay bales with bale twines, remains limited. This type of consumer plastic waste poses a significant challenge to the circular economy. However, these recycled agricultural plastic wastes are more manageable due to their ease of identification, concentrated locations, and lower contamination levels. This study aims to develop and characterise these agricultural wastes to create a second life for end-of-life plastic products with unique properties.
This study successfully recycled BT waste into PBT using cost-effective Rtec melting technology. A park bench made from PBT has been developed (Figure 7e), and durable fencing posts have also been created (Figure 7g). Furthermore, the PBT granules were melted and extruded using a filament extruder to produce a 3D printing filament (Figure 7f). The filament was extruded with an approximate diameter of 2.85 ± 0.5 mm, closely matching the nozzle diameter of the 3D printer. The findings suggest that recycling BT into PBT provides a visible way to give these materials a second life. PBT can be recycled multiple times before the plastic is thoroughly degraded.
3. Materials and Methods
3.1. Materials
The bale twine (BT) waste (Figure 8) used for securing hay bales in Victoria, Australia was collected from farmlands. Commercially available pure polypropylene (PP) purchased from Neo Polymers Pty Ltd, Braeside, Victoria, Australia.
3.2. Preparation of Bale Twine and Processed Bale Twine
The BT waste gathered from various farmlands was processed using the Ritchie Technology (Rtec™) low-cost melting machine (Figure 9a). This machine offers a cost-effective alternative for processing plastic waste. It consists of a drum compactor and homogenising melter. The BT waste was fed into the drum compactor at 200 ± 5 °C. Consistent compression was applied to the BT in the drum compactor from the top to prevent the formation of voids in the melted plastic during compaction. The drum compactor is connected to an outlet as shown in Figure 9b, to allow the molten processed bale twine (PBT) to flow out. Finally, the produced PBT can be moulded into various shapes, such as long bars or ingots. For this study, the obtained PBT was shredded into granules (Figure 9c) using a plastic crusher (Zhongli Instrument Technology Co., Ltd, Dongguan city, Guangdong province, China). These granules were then utilised to develop the characterisation samples.
3.3. Fourier Transform Infrared Spectroscopy (FTIR)
Fourier-transform infrared spectroscopy (Cary 630 FTIR (Santa Clara, CA, USA)) provided with an attenuated total reflectance accessory was utilised to perform spectra analysis. The spectra of the bale twine and processed bale twine were obtained using an average of 64 scans between 4000 and 600 cm−1 with a resolution of 4 cm−1.
3.4. Melt Flow Index
MFI of the samples was analysed using the TMA-400A-XNR equipped with an Ohaus Adventure AX analytical NMI-approved weighing scale, supplied by Test Machines Australia. The test was conducted according to the ASTM D1238. BT, PBT and pure PP were tested at temperatures varying from 180 to 230 °C with a dead load of 2.16 kg. The molten material was flown through the orifice with a diameter of 2.0 mm and a length of 8.0 mm. The MFI values were reported in g/10 min. Furthermore, the activation energy (Eα) was calculated using the Arrhenius Equation shown in Equation 6.
where B = constant, R = universal gas constant (8.314 J/mol), T = the absolute temperature in Kelvin (K), and Eα = slope of ln (MFI) vs 1/T.
3.5. Thermogravimetric Analysis (TGA)
The thermal properties of the BT, PBT and pure PP were investigated using a TGA 4000, Perkin Elmer, Waltham, MA, USA in a nitrogen gas atmosphere. The analysis was carried out at temperatures ranging from 35 to 850 °C at 20 °C/min.
3.6. Differential Scanning Calorimetry (DSC)
The melting temperature and crystallinity of the BT, PBT and pure PP were analysed using a DSC 6000, Perkin Elmer, Waltham, MA, USA. Crucibles were aluminium pans with lids. 3 mg of samples were pressed in the crucibles. The analysis was conducted in two heating cycles (30 to 300 °C) and one cooling cycle (300 to 30 °C). The initial heating cycle step was used to erase the previous thermal history. In the second step, the samples were cooled down to obtain crystallinity. Finally, the second heating step was carried out to get the melting data of the samples. All heating and cooling runs were performed in a nitrogen atmosphere (20 °C/min) to prevent oxidation . Furthermore, the percentage of crystallinity was calculated using the melting enthalpy and crystallisation enthalpy data obtained through DSC graphs and Equation 7.
where are the empirically determined melting enthalpy, and denotes theoretically determined melting enthalpy of 100% crystalline PP (207.1 J/g) [66,67].
3.7. Tensile Properties
The PBT granules were compressed into dumbbell shapes according to ASTM D638 Type IV (10 × 15 mm2) using a compression moulding technique. The compressed moulded PBT samples were tested using a Universal Testing Machine (Instron 5980, Norwood, MA, USA). The tests were performed at a 1 mm/min crosshead speed with 50 kN load cell to determine the tensile properties. Three samples were utilised to obtain the data.
3.8. Creep Test
Dynamic mechanical analyser (DMA 8000, Perkin Elmer, Waltham, MA, USA) was used to conduct the creep recovery tests in creep extension mode. The PBT samples with dimensions of 10 × 4 mm (t = 2mm) were prepared using injection moulding. The short-term creep response was recorded in real-time at 1 Hz. Creep and creep recovery cycles were performed isothermally with elevated temperatures ranging from 40 to 90 °C at intervals of 10 °C. For each isotherm, 20% of the average tension was applied for 30 min, followed by a 30 min recovery period In addition, the creep compliance was determined using Equation 8 [68]:
where S = creep compliance, Tref =reference temperature, t = time, Telev = elevated temperature, and ∝T =shift factor.
3.9. Hardness Testing
The hardness of the PBT samples was analysed using a Vickers hardness testing machine (DuraScan G5, Kuchl, Austria). A load of HV 0.3 was applied for 10s, and the hardness value was recorded. Three samples were tested to determine the average hardness of PBT.
3.10. Contact Angle
The wettability of the PBT samples was analysed using the Attention Theta Flex instrument (Biolin Scientific, Västra Frölunda, Sweden). The wettability was observed using the sessile drop technique. A 2 µL dewdrop was disposed on the PBT flat surface via a Hamilton syringe and results were recorded. Three different samples were analysed to determine the average wettability of PBT.
3.11. Morphology
The PBT fractured cross-sectional surface morphology was examined using an scanning electron microscope (Hitachi TM3030Plus, Tokyo, Japan). The sample was sputter-coated with gold to enhance conductivity. In addition, EDX analyses were carried out for the PBT sample, and each analysis had an acquisition time of 120 s.
3.12. 3D Printing Filament Production
The PBT granules were melted and extruded into a 3D printable filament using an EX2 extruder (Filabot, Barre, Vermont, USA). The single-screw extruder has a length/diameter ratio of 12, a pitch of 1.27 and a screw diameter of 1.5 cm. The temperature was kept at 187 °C with constant extrusion speed. Before starting the extrusion, purge PP was extruded to clean the extruder. Afterwards, the processed bale twine granules were added to the hooper, and the filament was extruded.
3.13. Assembly of a Park Bench
BT was extruded into a long bar with dimensions of 2000 mm in length and 50 mm in thickness using an Rtec melting machine. The bars were then used to construct a park bench.
4. Conclusions
Thermal, mechanical, and chemical analyses of BT waste and PBT were conducted to assess contamination and reprocessing parameters. New products were developed to give end-of-life plastic waste a second life, adhering to a cradle-to-cradle approach. Based on the obtained physical and chemical properties, it was estimated that the BT could be recycled with only slight variations in processing temperatures depending on the manufacturing process. The melting point and crystallinity peaks indicated that BT and PBT are significantly similar to pure PP. In addition, the strength of PBT was slightly lower compared to literature reports, suggesting that the addition of fillers or surface coatings could reduce its brittleness. However, this study is limited to mechanical and thermal analyses. Further research on weathering conditions will be necessary to better understand the product’s durability across a wide range of environmental conditions. This development represents a closed-loop for recycling plastics from agricultural lands. Moreover, the cost effective Rtec melter was successfully used to process BT into a wide range of plastic products suitable for household applications as part of commercialisation efforts. The current study demonstrates that agricultural plastic waste, particularly BT, can be recycled and transformed into innovative, value-added products with material properties similar to virgin polymers.
Author Contributions
Conceptualisation: A.B.K and I.K.; methodology: AB.K., I.K., and W.R.; formal analysis: A.B.K., and I.K.; investigation: A.B.K. and I.K.; resources: A.B.K., I.K. and W.R.; data curation: A.B.K., and I.K.; writing—original draft preparation: A.B.K.; writing—review and editing: I.K.; funding acquisition: I.K., and W.R. All authors have read and agreed to the published version of the manuscript.
Funding
This research was funded by Circular Economy Markets Funds: Materials, Stream 1: Research, Development and Demonstration Grant (C-12714), funded by the Sustainability Victoria, Australia.
Acknowledgments
The authors thank the La Trobe University Bioimaging Facility for the scanning electron microscopy support.
Conflicts of Interest
The authors declare no conflicts of interest
References
- Briassoulis, D. Agricultural plastics as a potential threat to food security, health, and environment through soil pollution by microplastics: Problem definition. Sci. Total Environ. 2023, 892, 164533. [CrossRef]
- Siwek, P.; Domagala-Swiatkiewicz, I.; Bucki, P.; Puchalski, M. Biodegradable agroplastics in 21st century horticulture. Polimery 2019, 64, 480–486. [CrossRef]
- Steinmetz, Z.; Wollmann, C.; Schaefer, M.; Buchmann, C.; David, J.; Tröger, J.; Muñoz, K.; Frör, O.; Schaumann, G.E. Plastic mulching in agriculture. Trading short-term agronomic benefits for long-term soil degradation? Sci. Total Environ. 2016, 550, 690–705. [CrossRef]
- Shen, M.; Song, B.; Zeng, G.; Zhang, Y.; Huang, W.; Wen, X.; Tang, W. Are biodegradable plastics a promising solution to solve the global plastic pollution? Environ. Pollut. 2020, 263, 114469. [CrossRef]
- Zhang, G.S.; Hu, X.B.; Zhang, X.X.; Li, J. Effects of plastic mulch and crop rotation on soil physical properties in rain-fed vegetable production in the mid-Yunnan plateau, China. Soil Tillage Res. 2015, 145, 111–117. [CrossRef]
- Chandra, S.; Walsh, K.B. Microplastics in water: Occurrence, fate and removal. J. Contam. Hydrol. 2024, 264, 104360. [CrossRef]
- Coblentz, W.K.; Akins, M.S. Silage review: Recent advances and future technologies for baled silages. J. Dairy Sci. 2018, 101, 4075–4092. [CrossRef]
- Fu, X.; Du, Q. Uptake of Di-(2-ethylhexyl) Phthalate of Vegetables from Plastic Film Greenhouses. J. Agric. Food Chem. 2011, 59, 11585–11588. [CrossRef]
- Sintim, H.Y.; Bandopadhyay, S.; English, M.E.; Bary, A.I.; DeBruyn, J.M.; Schaeffer, S.M.; Miles, C.A.; Reganold, J.P.; Flury, M. Impacts of biodegradable plastic mulches on soil health. Agric. Ecosyst. Environ. 2019, 273, 36–49. [CrossRef]
- Bostan, N.; Ilyas, N.; Akhtar, N.; Mehmood, S.; Saman, R.U.; Sayyed, R.Z.; Shatid, A.A.; Alfaifi, M.Y.; Elbehairi, S.E.I.; Pandiaraj, S. Toxicity assessment of microplastic (MPs); a threat to the ecosystem. Environ. Res. 2023, 234, 116523. [CrossRef]
- Hopewell, J.; Dvorak, R.; Kosior, E. Plastics recycling: challenges and opportunities. Philos. Trans. R. Soc. B Biol. Sci. 2009, 364, 2115–2126. [CrossRef]
- Briassoulis, D.; Hiskakis, M.; Babou, E. Technical specifications for mechanical recycling of agricultural plastic waste. Waste Manag. 2013, 33, 1516–1530. [CrossRef]
- Ramos-Hernández, T.; Robledo-Ortíz, J.R.; González-López, M.E.; del Campo, A.S.M.; González-Núñez, R.; Rodrigue, D.; Pérez Fonseca, A.A. Mechanical recycling of <scp>PLA</scp> : Effect of weathering, extrusion cycles, and chain extender. J. Appl. Polym. Sci. 2023, 140. [CrossRef]
- Thiounn, T.; Smith, R.C. Advances and approaches for chemical recycling of plastic waste. J. Polym. Sci. 2020, 58, 1347–1364. [CrossRef]
- Adegoke, S.O.; Adeleke, A.A.; Ikubanni, P.P.; Nnodim, C.T.; Balogun, A.O.; Falode, O.A.; Adetona, S.O. Energy from biomass and plastics recycling: a review. Cogent Eng. 2021, 8. [CrossRef]
- Hahladakis, J.N.; Velis, C.A.; Weber, R.; Iacovidou, E.; Purnell, P. An overview of chemical additives present in plastics: Migration, release, fate and environmental impact during their use, disposal and recycling. J. Hazard. Mater. 2018, 344, 179–199. [CrossRef]
- de Sá Teles, B.A.; Cunha, I.L.C.; da Silva Neto, M.L.; Wiebeck, H.; Valera, T.S.; de Souza, S.S.; de Oliveira Schmitt, A.F.; Oliveira, V.; Kulay, L. Effect of Virgin PP Substitution with Recycled Plastic Caps in the Manufacture of a Product for the Telephony Sector. Recycling 2023, 8, 51. [CrossRef]
- K. J. Shinners; B. M. Huenink; R. E. Muck; K. A. Albrecht Storage Characteristics of Large Round Alfalfa Bales: Dry Hay. Trans. ASABE 2009, 52, 409–418. [CrossRef]
- Kostic, S.; Kocovic, V.; Petrovic Savic, S.; Miljanic, D.; Miljojkovic, J.; Djordjevic, M.; Vukelic, D. The Influence of Friction and Twisting Angle on the Tensile Strength of Polypropylene Baling Twine. Appl. Sci. 2024, 14, 3046. [CrossRef]
- McAfee, J.R.; Shinners, K.J.; Friede, J.C. Twine Tension in High-Density Large Square Bales. Appl. Eng. Agric. 2018, 34, 515–525. [CrossRef]
- Zrida, M.; Laurent, H.; Grolleau, V.; Rio, G.; Khlif, M.; Guines, D.; Masmoudi, N.; Bradai, C. High-speed tensile tests on a polypropylene material. Polym. Test. 2010, 29, 685–692. [CrossRef]
- Alsabri, A.; Tahir, F.; Al-Ghamdi, S.G. Environmental impacts of polypropylene (PP) production and prospects of its recycling in the GCC region. Mater. Today Proc. 2022, 56, 2245–2251. [CrossRef]
- Hou, R.; Zhang, J.; Fu, Q.; Li, T.; Gao, S.; Wang, R.; Zhao, S.; Zhu, B. The boom era of emerging contaminants: A review of remediating agricultural soils by biochar. Sci. Total Environ. 2024, 931, 172899. [CrossRef]
- Chen, X.-Y.; Rodrigue, D. Conversion of Polypropylene (PP) Foams into Auxetic Metamaterials. Macromol 2023, 3, 463–476. [CrossRef]
- Yüksel, S.; Dinçer, H. Sustainability analysis of digital transformation and circular industrialization with quantum spherical fuzzy modeling and golden cuts. Appl. Soft Comput. 2023, 138, 110192. [CrossRef]
- Stoian, S.A.; Gabor, A.R.; Albu, A.-M.; Nicolae, C.A.; Raditoiu, V.; Panaitescu, D.M. Recycled polypropylene with improved thermal stability and melt processability. J. Therm. Anal. Calorim. 2019, 138, 2469–2480. [CrossRef]
- Nandiyanto, A.B.D.; Putri, A.R.; Pratiwi, V.A.; Ilhami, V.I.N.; Kaniawati, I.; Kurniawan, T.; Farobie, O.; Bilad, M.R. Fourier transform infrared spectroscopy (FTIR) of pyrolysis of polypropylene microparticles and its chemical reaction mechanism completed with computational bibliometric literature review to support sustainable development goals (SDGs). J. Eng. Sci. Technol. 2024, 19, 1090–1104.
- Gopanna, A.; Mandapati, R.N.; Thomas, S.P.; Rajan, K.; Chavali, M. Fourier transform infrared spectroscopy (FTIR), Raman spectroscopy and wide-angle X-ray scattering (WAXS) of polypropylene (PP)/cyclic olefin copolymer (COC) blends for qualitative and quantitative analysis. Polym. Bull. 2019, 76, 4259–4274. [CrossRef]
- Riaz, U.; Ashraf, S.M. Characterization of Polymer Blends with FTIR Spectroscopy. In Characterization of Polymer Blends; Wiley, 2014; pp. 625–678. [CrossRef]
- Polypropylene; Karger-Kocsis, J., Ed.; Polymer Science and Technology Series; Springer Netherlands: Dordrecht, 1999; Vol. 2; ISBN 978-94-010-5899-5.
- Mylläri, V.; Ruoko, T.; Syrjälä, S. A comparison of rheology and FTIR in the study of polypropylene and polystyrene photodegradation. J. Appl. Polym. Sci. 2015, 132. [CrossRef]
- Bonelli, C.M.C.; Martins, A.F.; Mano, E.B.; Beatty, C.L. Effect of recycled polypropylene on polypropylene/high-density polyethylene blends. J. Appl. Polym. Sci. 2001, 80, 1305–1311. [CrossRef]
- Gall, M.; Steinbichler, G.; Lang, R.W. Learnings about design from recycling by using post-consumer polypropylene as a core layer in a co-injection molded sandwich structure product. Mater. Des. 2021, 202, 109576. [CrossRef]
- Cowger, W.; Steinmetz, Z.; Gray, A.; Munno, K.; Lynch, J.; Hapich, H.; Primpke, S.; De Frond, H.; Rochman, C.; Herodotou, O. Microplastic Spectral Classification Needs an Open Source Community: Open Specy to the Rescue! Anal. Chem. 2021, 93, 7543–7548. [CrossRef]
- Jung, S.-H.; Cho, M.-H.; Kang, B.-S.; Kim, J.-S. Pyrolysis of a fraction of waste polypropylene and polyethylene for the recovery of BTX aromatics using a fluidized bed reactor. Fuel Process. Technol. 2010, 91, 277–284. [CrossRef]
- Mihelčič, M.; Oseli, A.; Huskić, M.; Slemenik Perše, L. Influence of Stabilization Additive on Rheological, Thermal and Mechanical Properties of Recycled Polypropylene. Polymers (Basel). 2022, 14, 5438. [CrossRef]
- Kashi, S.; De Souza, M.; Creighton, C.; Al-Assafi, S.; Varley, R. Degradation of Polyalkylene Glycol: Application of FTIR, HPLC, and TGA in Investigating PAG Oil Thermal Stability and Antioxidant Reaction Kinetics. Ind. Eng. Chem. Res. 2023, 62, 19638–19648. [CrossRef]
- Najafi, S.K.; Mostafazadeh-Marznaki, M.; Chaharmahali, M.; Tajvidi, M. Effect of Thermomechanical Degradation of Polypropylene on Mechanical Properties of Wood-Polypropylene Composites. J. Compos. Mater. 2009, 43, 2543–2554. [CrossRef]
- Wijerathne, D.; Gong, Y.; Afroj, S.; Karim, N.; Abeykoon, C. Mechanical and thermal properties of graphene nanoplatelets-reinforced recycled polycarbonate composites. Int. J. Light. Mater. Manuf. 2023, 6, 117–128. [CrossRef]
- Freudenthaler, P.J.; Fischer, J.; Liu, Y.; Lang, R.W. Polypropylene Post-Consumer Recyclate Compounds for Thermoforming Packaging Applications. Polymers (Basel). 2023, 15, 345. [CrossRef]
- Baltes, L.; Costiuc, L.; Patachia, S.; Tierean, M. Differential scanning calorimetry—a powerful tool for the determination of morphological features of the recycled polypropylene. J. Therm. Anal. Calorim. 2019, 138, 2399–2408. [CrossRef]
- Ehrenstein, G.W.; Riedel, G.; Trawiel, P. Thermal analysis of plastics : theory and practice; Hanser ; Hanser Gardner Publications [distributor]: Munich, Cincinnati SE - xxix, 368 pages : illustrations (some color) ; 25 cm, 2004; ISBN 156990362X; 9781569903629; 3446226737; 9783446226739.
- Vidakis, N.; Petousis, M.; Tzounis, L.; Maniadi, A.; Velidakis, E.; Mountakis, N.; Papageorgiou, D.; Liebscher, M.; Mechtcherine, V. Sustainable Additive Manufacturing: Mechanical Response of Polypropylene over Multiple Recycling Processes. Sustainability 2020, 13, 159. [CrossRef]
- Tratzi, P.; Giuliani, C.; Torre, M.; Tomassetti, L.; Petrucci, R.; Iannoni, A.; Torre, L.; Genova, S.; Paolini, V.; Petracchini, F.; et al. Effect of Hard Plastic Waste on the Quality of Recycled Polypropylene Blends. Recycling 2021, 6, 58. [CrossRef]
- Ferg, E.E.; Bolo, L.L. A correlation between the variable melt flow index and the molecular mass distribution of virgin and recycled polypropylene used in the manufacturing of battery cases. Polym. Test. 2013, 32, 1452–1459. [CrossRef]
- Luna, C.B.B.; da Silva, W.A.; Araújo, E.M.; da Silva, L.J.M.D.; de Melo, J.B. da C.A.; Wellen, R.M.R. From Waste to Potential Reuse: Mixtures of Polypropylene/Recycled Copolymer Polypropylene from Industrial Containers: Seeking Sustainable Materials. Sustainability 2022, 14, 6509. [CrossRef]
- Ladhari, A.; Kucukpinar, E.; Stoll, H.; Sängerlaub, S. Comparison of Properties with Relevance for the Automotive Sector in Mechanically Recycled and Virgin Polypropylene. Recycling 2021, 6, 76. [CrossRef]
- Handayani, S.U.; Fahrudin, M.; Mangestiyono, W.; Hadi Muhamad, A.F. Mechanical Properties of Commercial Recycled Polypropylene from Plastic Waste. J. Vocat. Stud. Appl. Res. 2021, 3, 1–4. [CrossRef]
- Satya, S.K.; Sreekanth, P.S.R. An experimental study on recycled polypropylene and high-density polyethylene and evaluation of their mechanical properties. Mater. Today Proc. 2020, 27, 920–924. [CrossRef]
- Hariprasad, K.; Ravichandran, K.; Jayaseelan, V.; Muthuramalingam, T. Acoustic and mechanical characterisation of polypropylene composites reinforced by natural fibres for automotive applications. J. Mater. Res. Technol. 2020, 9, 14029–14035. [CrossRef]
- Zdiri, K.; Elamri, A.; Hamdaoui, M.; Harzallah, O.; Khenoussi, N.; Brendlé, J. Reinforcement of recycled PP polymers by nanoparticles incorporation. Green Chem. Lett. Rev. 2018, 11, 296–311. [CrossRef]
- Bourmaud, A.; Le Duigou, A.; Baley, C. What is the technical and environmental interest in reusing a recycled polypropylene–hemp fibre composite? Polym. Degrad. Stab. 2011, 96, 1732–1739. [CrossRef]
- Berdjane, K.; Berdjane, Z.; Rueda, D.R.; Bénachour, D.; Baltá-Calleja, F.J. Microhardness of ternary blends of polyolefins with recycled polymer components. J. Appl. Polym. Sci. 2003, 89, 2046–2050. [CrossRef]
- Nukala, S.G.; Kong, I.; Kakarla, A.B.; Tshai, K.Y.; Kong, W. Preparation and Characterisation of Wood Polymer Composites Using Sustainable Raw Materials. Polymers (Basel). 2022, 14, 3183. [CrossRef]
- Nuñez, A.J.; Marcovich, N.E.; Aranguren, M.I. Analysis of the creep behavior of polypropylene-woodflour composites. Polym. Eng. Sci. 2004, 44, 1594–1603. [CrossRef]
- Xu, Y.; Wu, Q.; Lei, Y.; Yao, F. Creep behavior of bagasse fiber reinforced polymer composites. Bioresour. Technol. 2010, 101, 3280–3286. [CrossRef]
- Homkhiew, C.; Ratanawilai, T.; Thongruang, W. Time–temperature and stress dependent behaviors of composites made from recycled polypropylene and rubberwood flour. Constr. Build. Mater. 2014, 66, 98–104. [CrossRef]
- Houshyar, S.; Shanks, R.A.; Hodzic, A. Tensile creep behaviour of polypropylene fibre reinforced polypropylene composites. Polym. Test. 2005, 24, 257–264. [CrossRef]
- Yang, T.-C.; Wu, T.-L.; Hung, K.-C.; Chen, Y.-L.; Wu, J.-H. Mechanical properties and extended creep behavior of bamboo fiber reinforced recycled poly(lactic acid) composites using the time–temperature superposition principle. Constr. Build. Mater. 2015, 93, 558–563. [CrossRef]
- Zhang, G.; Zhao, L.; Zhao, K.; Chen, L. Short term creep properties of WPC at different temperatures—An experimental and numerical investigation at different stress levels. Polym. Compos. 2024. [CrossRef]
- Yang, T.-C.; Chien, Y.-C.; Wu, T.-L.; Hung, K.-C.; Wu, J.-H. Effects of Heat-Treated Wood Particles on the Physico-Mechanical Properties and Extended Creep Behavior of Wood/Recycled-HDPE Composites Using the Time–Temperature Superposition Principle. Materials (Basel). 2017, 10, 365. [CrossRef]
- Hung, K.-C.; Wu, T.-L.; Chen, Y.-L.; Wu, J.-H. Assessing the effect of wood acetylation on mechanical properties and extended creep behavior of wood/recycled-polypropylene composites. Constr. Build. Mater. 2016, 108, 139–145. [CrossRef]
- Landel, R.F.; Nielsen, L.E. Mechanical properties of polymers and composites; CRC press, 1993; ISBN 1482277433.
- Ferry, J.D. Viscoelastic properties of polymers; John Wiley & Sons, 1980; ISBN 0471048941.
- Choi, H.-J.; Kim, M.S.; Ahn, D.; Yeo, S.Y.; Lee, S. Electrical percolation threshold of carbon black in a polymer matrix and its application to antistatic fibre. Sci. Rep. 2019, 9, 6338. [CrossRef]
- Monasse, B.; Haudin, J.M. Growth transition and morphology change in polypropylene. Colloid Polym. Sci. 1985, 263, 822–831. [CrossRef]
- Kong, Y.; Hay, J.N. The measurement of the crystallinity of polymers by DSC. Polymer (Guildf). 2002, 43, 3873–3878. [CrossRef]
- Hung, K.-C.; Wu, T.-L.; Chen, Y.-L.; Wu, J.-H. Assessing the effect of wood acetylation on mechanical properties and extended creep behavior of wood/recycled-polypropylene composites. Constr. Build. Mater. 2016, 108, 139–145. [CrossRef]
Figure 1.
FTIR spectra of the pure PP, BT and PBT (the insert shows the peaks of 3000 to 2800 cm-1).
Figure 1.
FTIR spectra of the pure PP, BT and PBT (the insert shows the peaks of 3000 to 2800 cm-1).
Figure 2.
(a) TGA curves of pure PP, BT and PBT samples (inset: the thermograms during total degradation) and (b) DTG graphs of pure PP, BT and PBT samples.
Figure 2.
(a) TGA curves of pure PP, BT and PBT samples (inset: the thermograms during total degradation) and (b) DTG graphs of pure PP, BT and PBT samples.
Figure 3.
DSC curves of pure PP, BT and PBT: (a) melting temperature curves (the small peak identified with red circle) (b) crystallisation curves.
Figure 3.
DSC curves of pure PP, BT and PBT: (a) melting temperature curves (the small peak identified with red circle) (b) crystallisation curves.
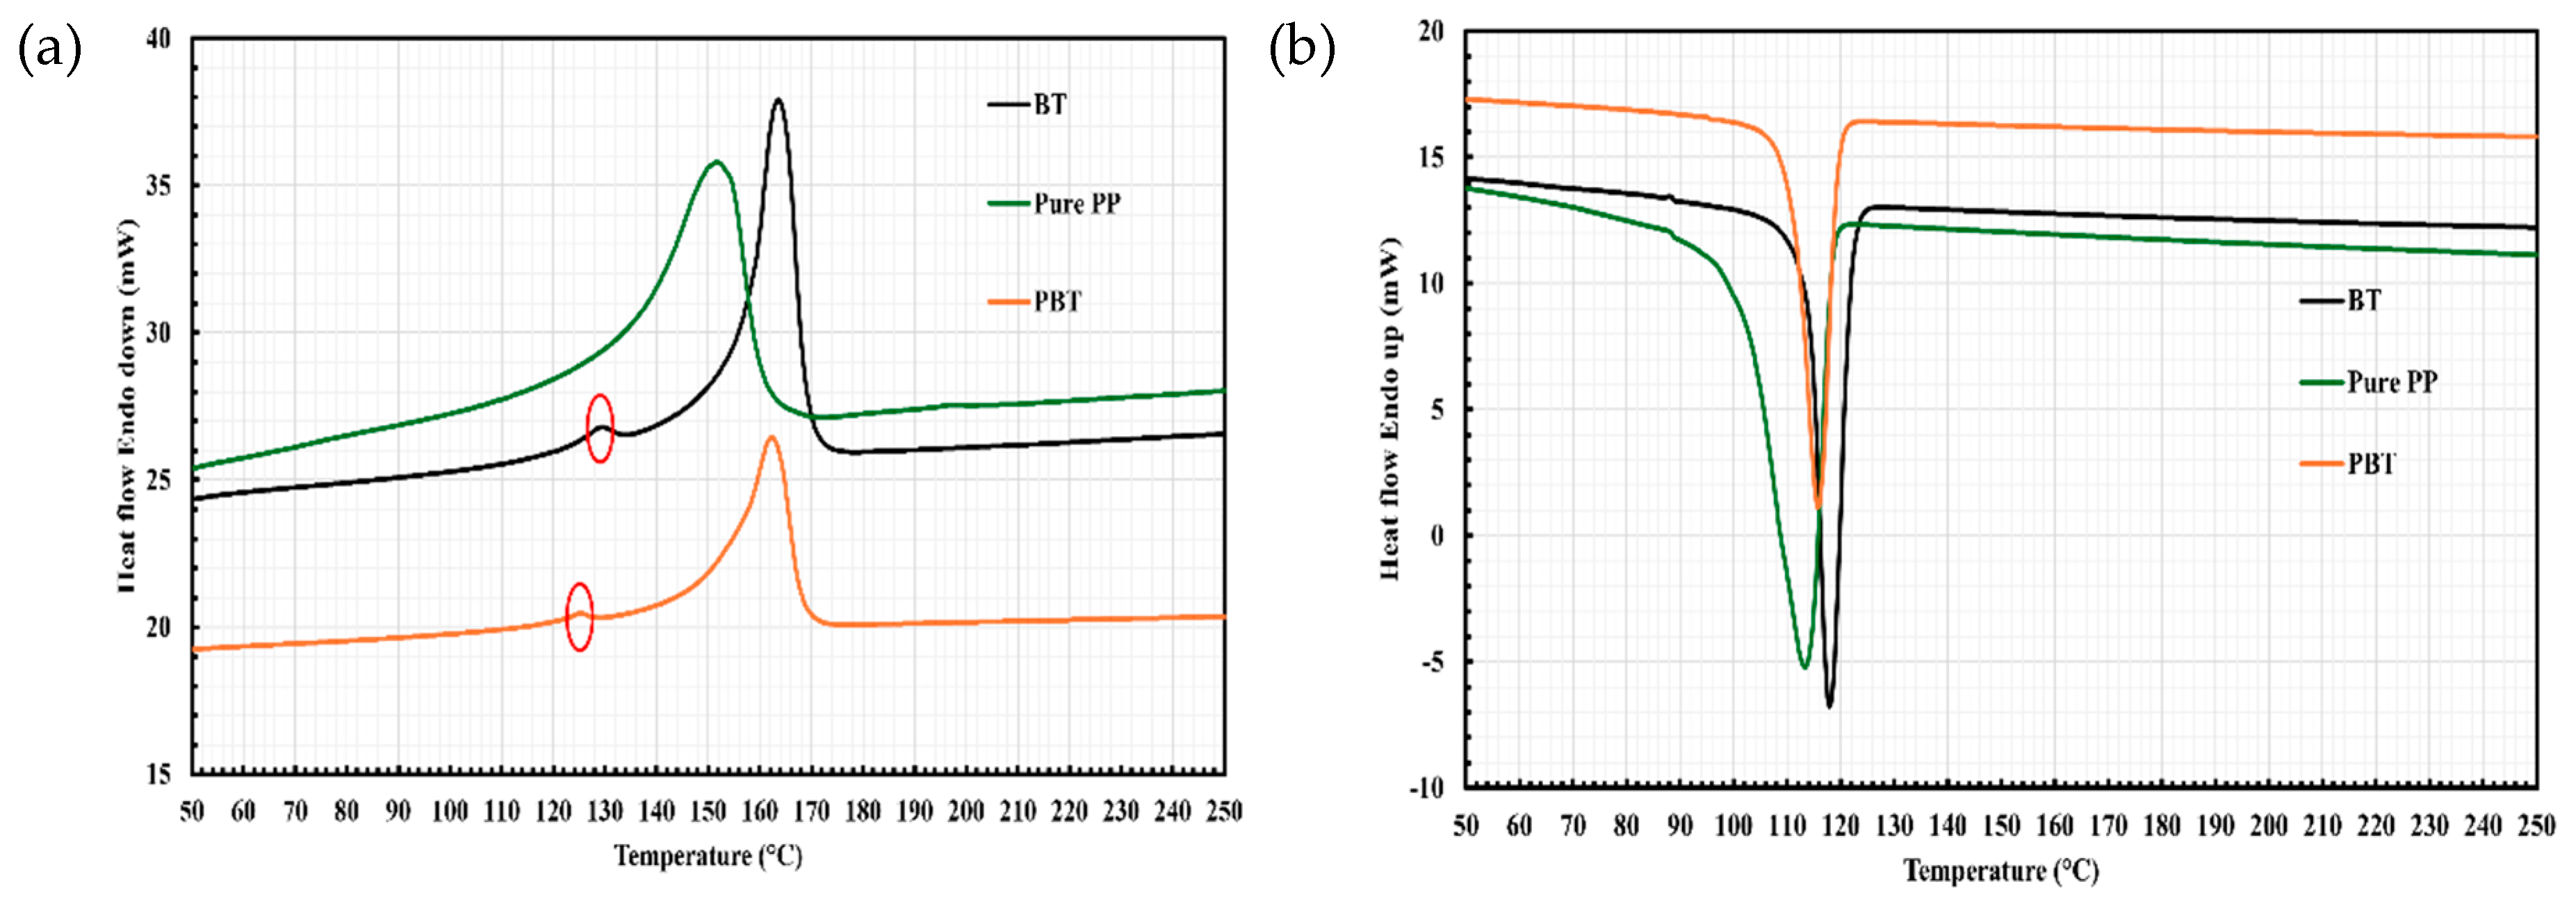
Figure 4.
(a) MFI values of pure PP, BT and PBT and (b) ln MFI vs 1/T of PBT MFI values.
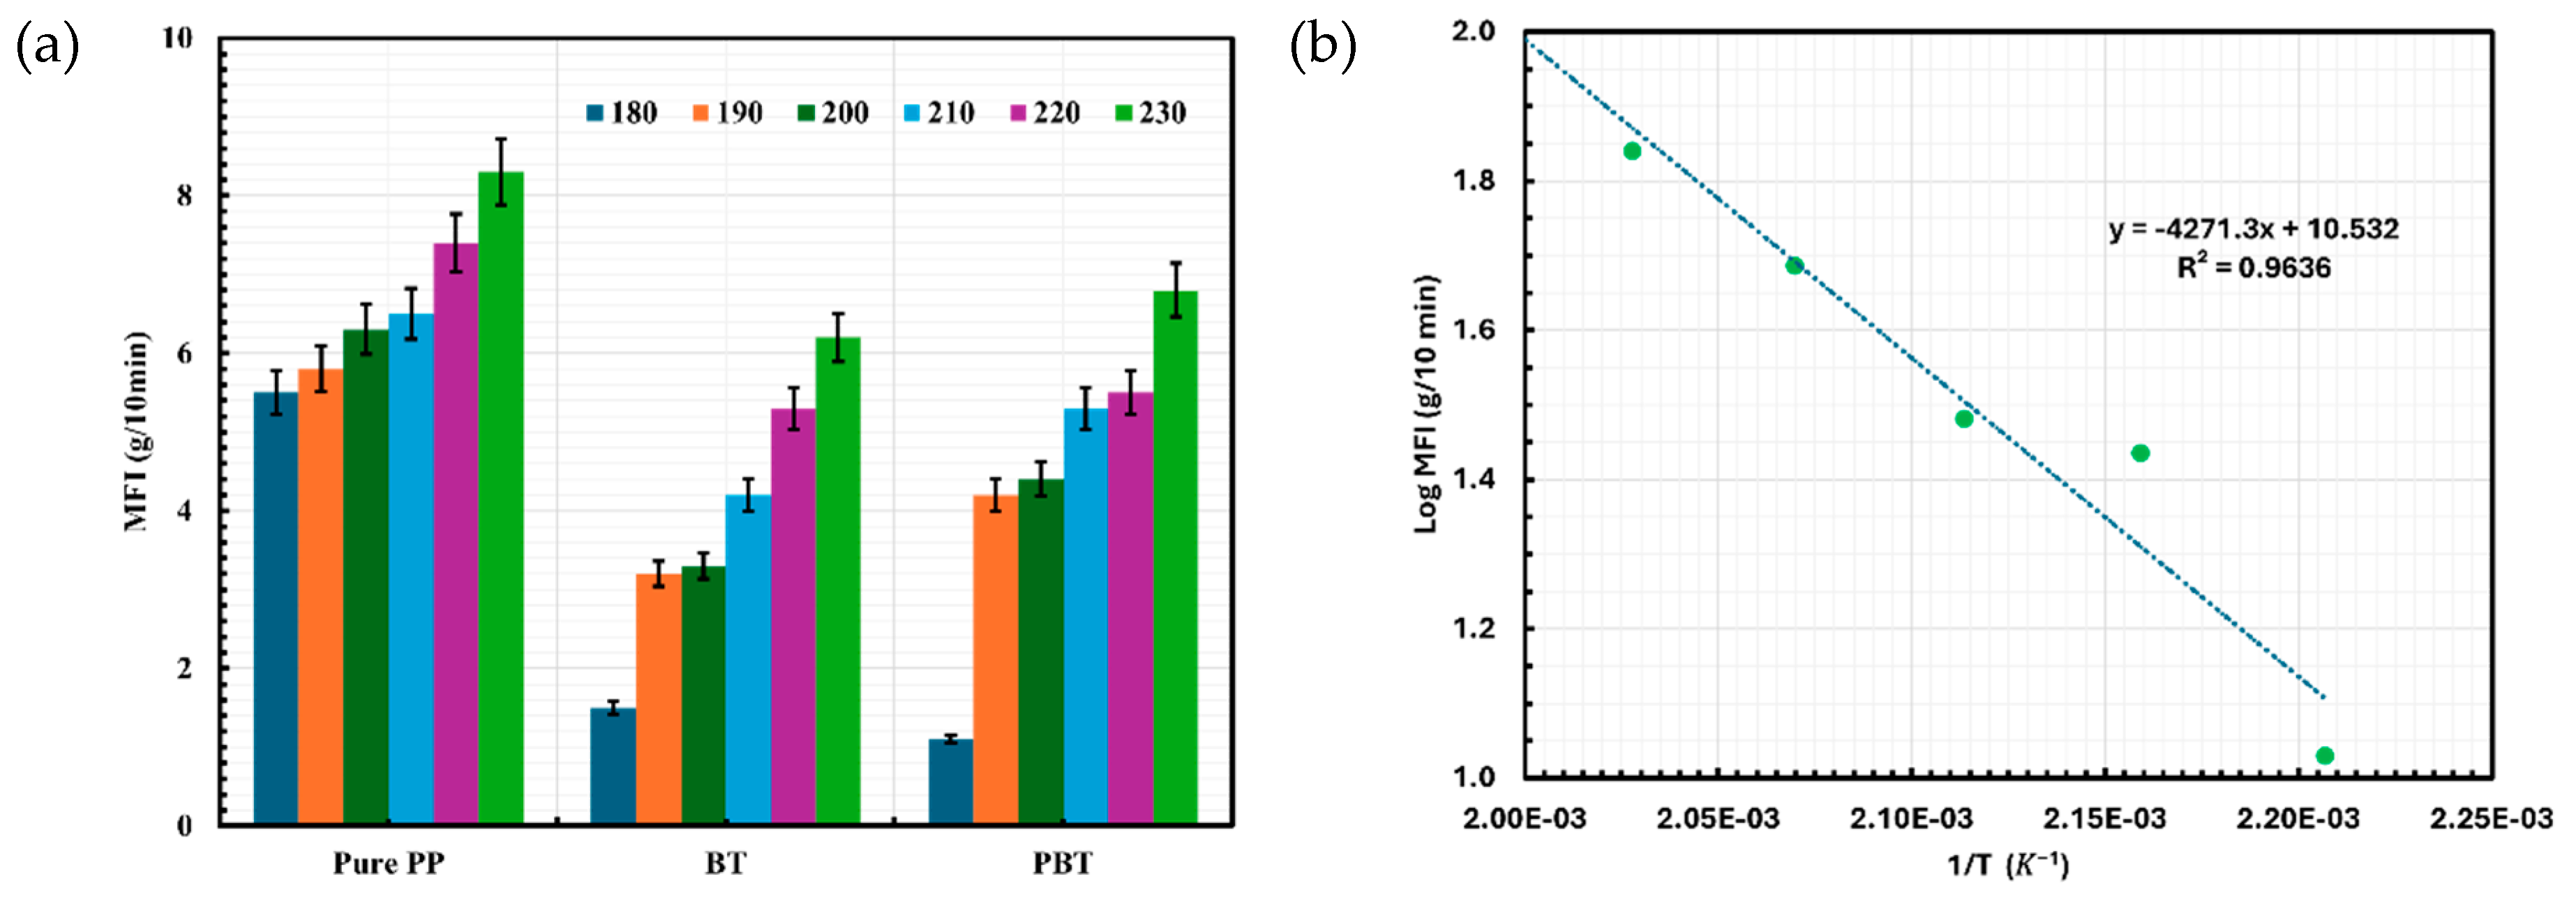
Figure 7.
(a) SEM micrograph of PBT, (b) elemental mapping analysis of PBT (pink: carbon elements, blue: oxygen elements), (c) EDX spectra analysis of PBT and (d) element analysis with total atomic % in PBT, (e) plastic bench developed using PBT (f) 3D printable filament produced using PBT and (g) fencing posts extruded using PBT.
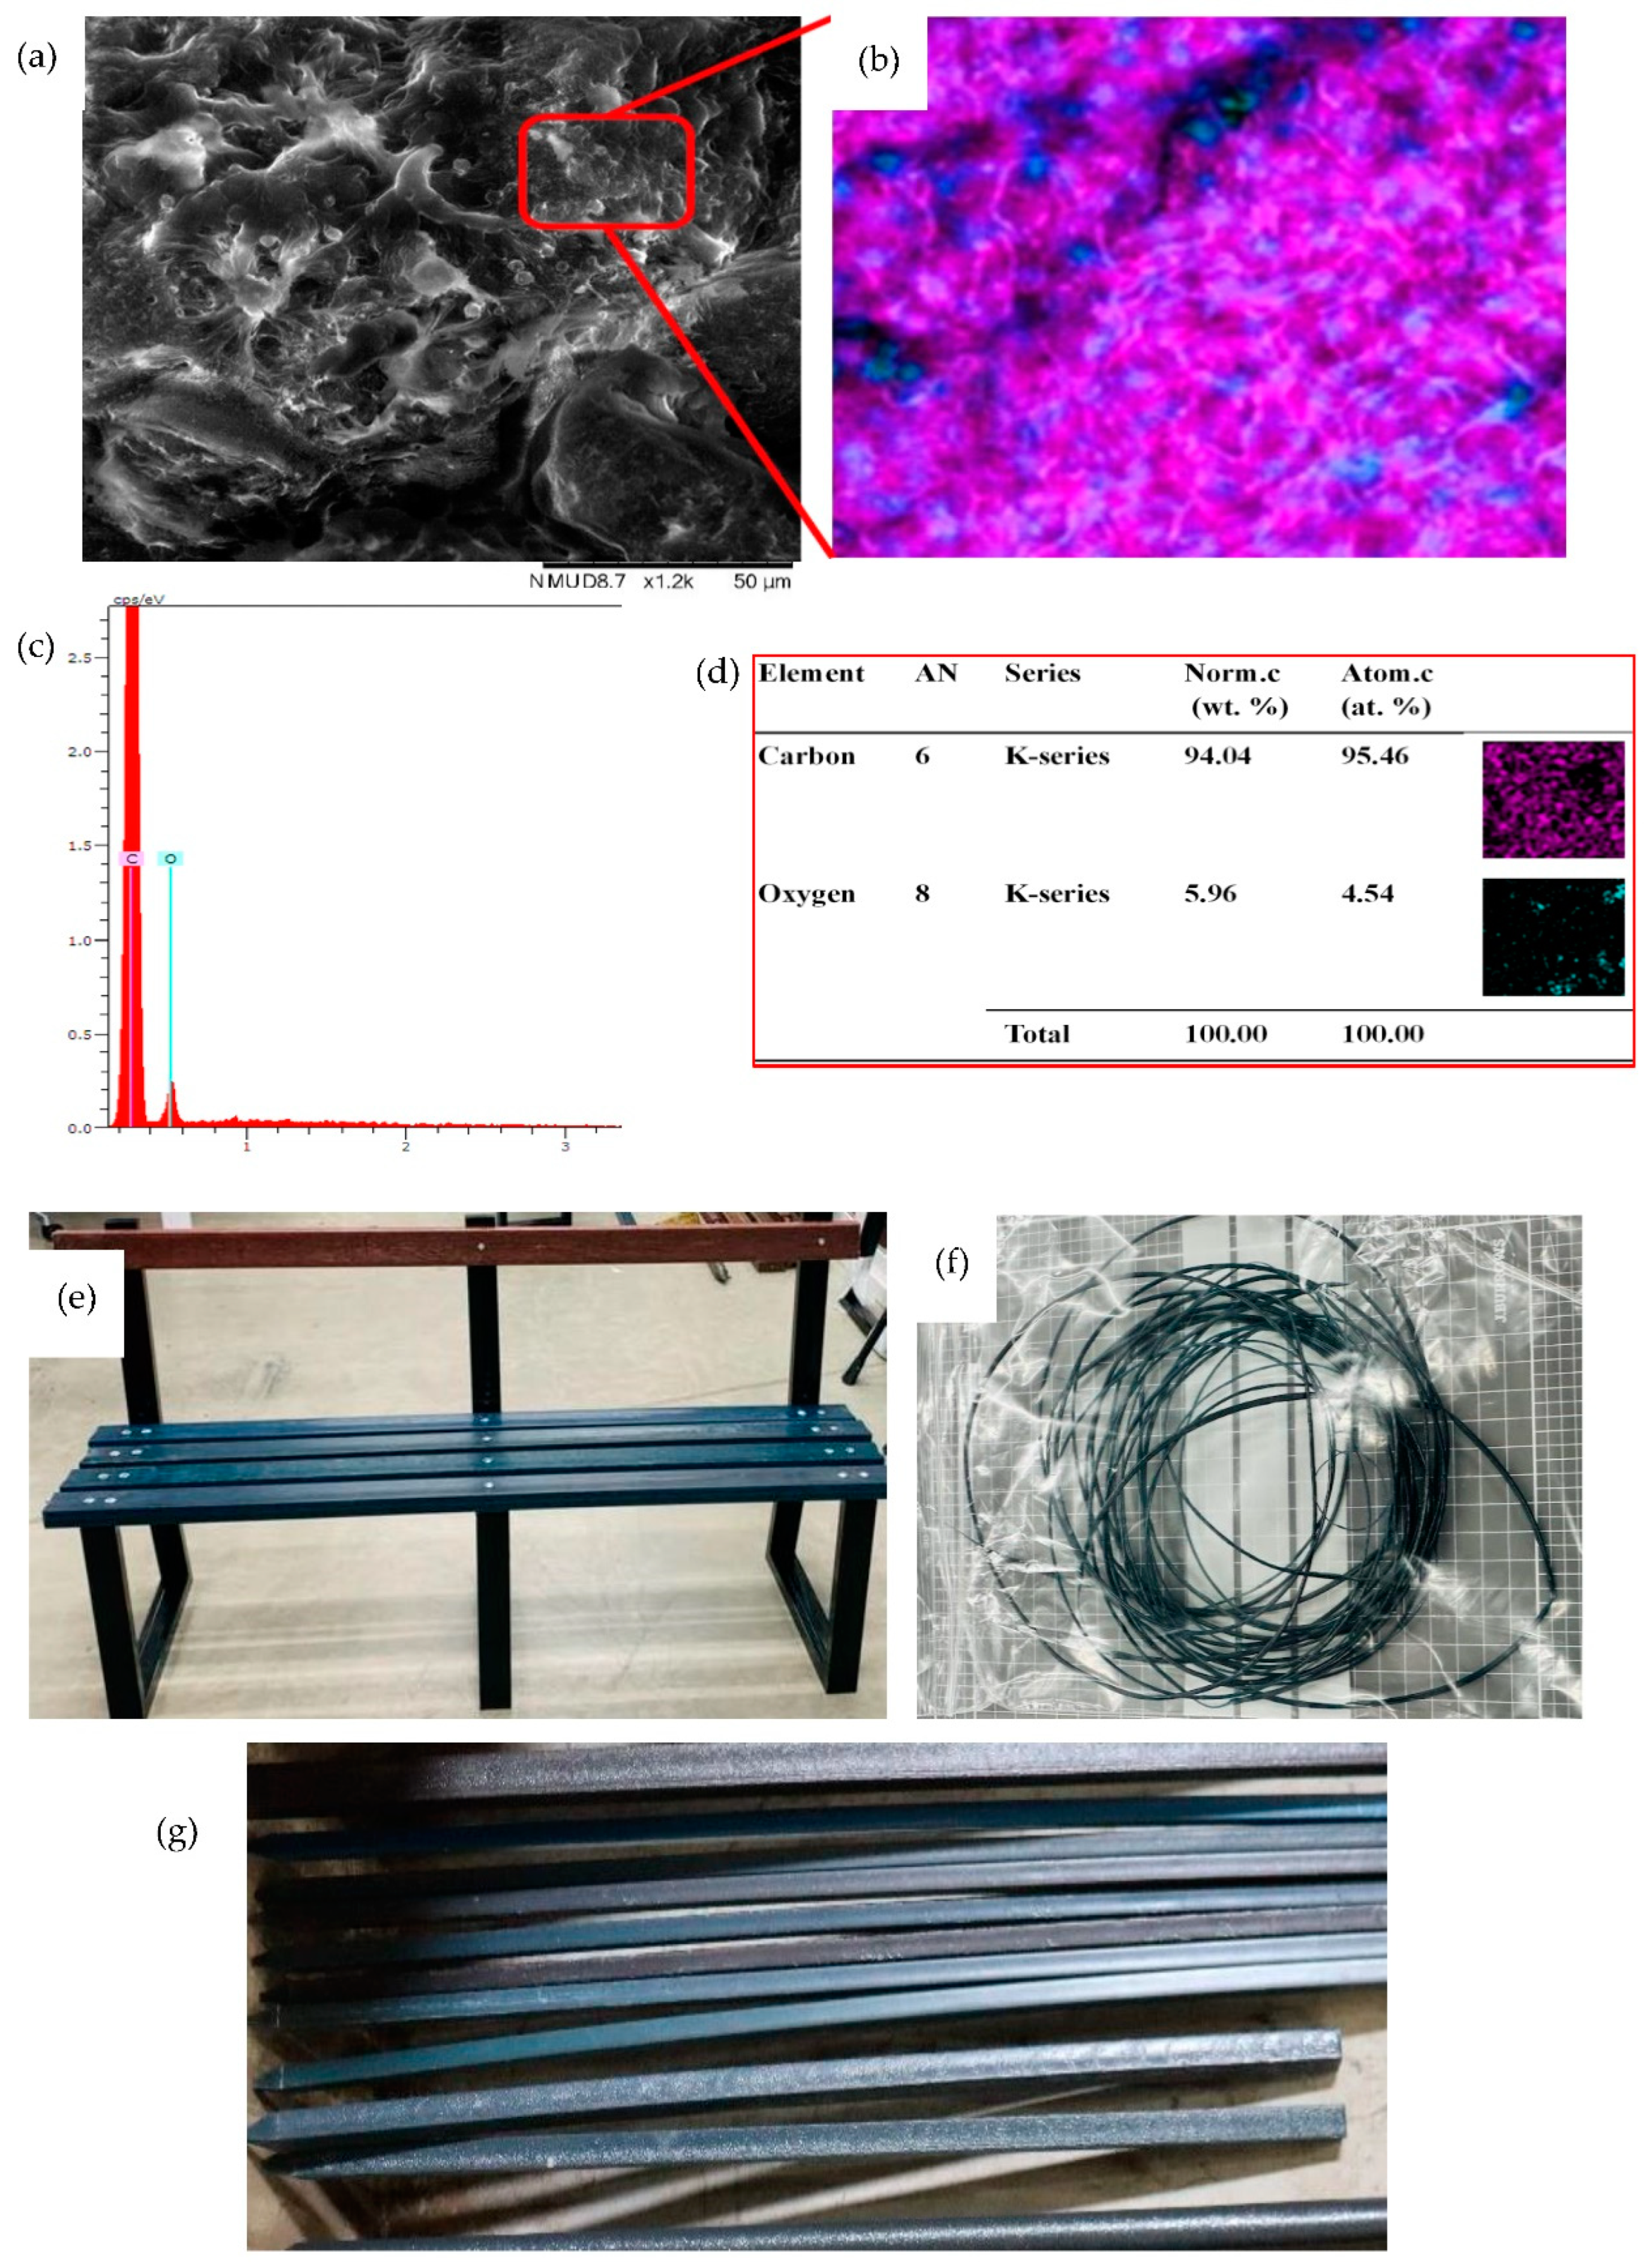
Figure 8.
Bale twine waste.
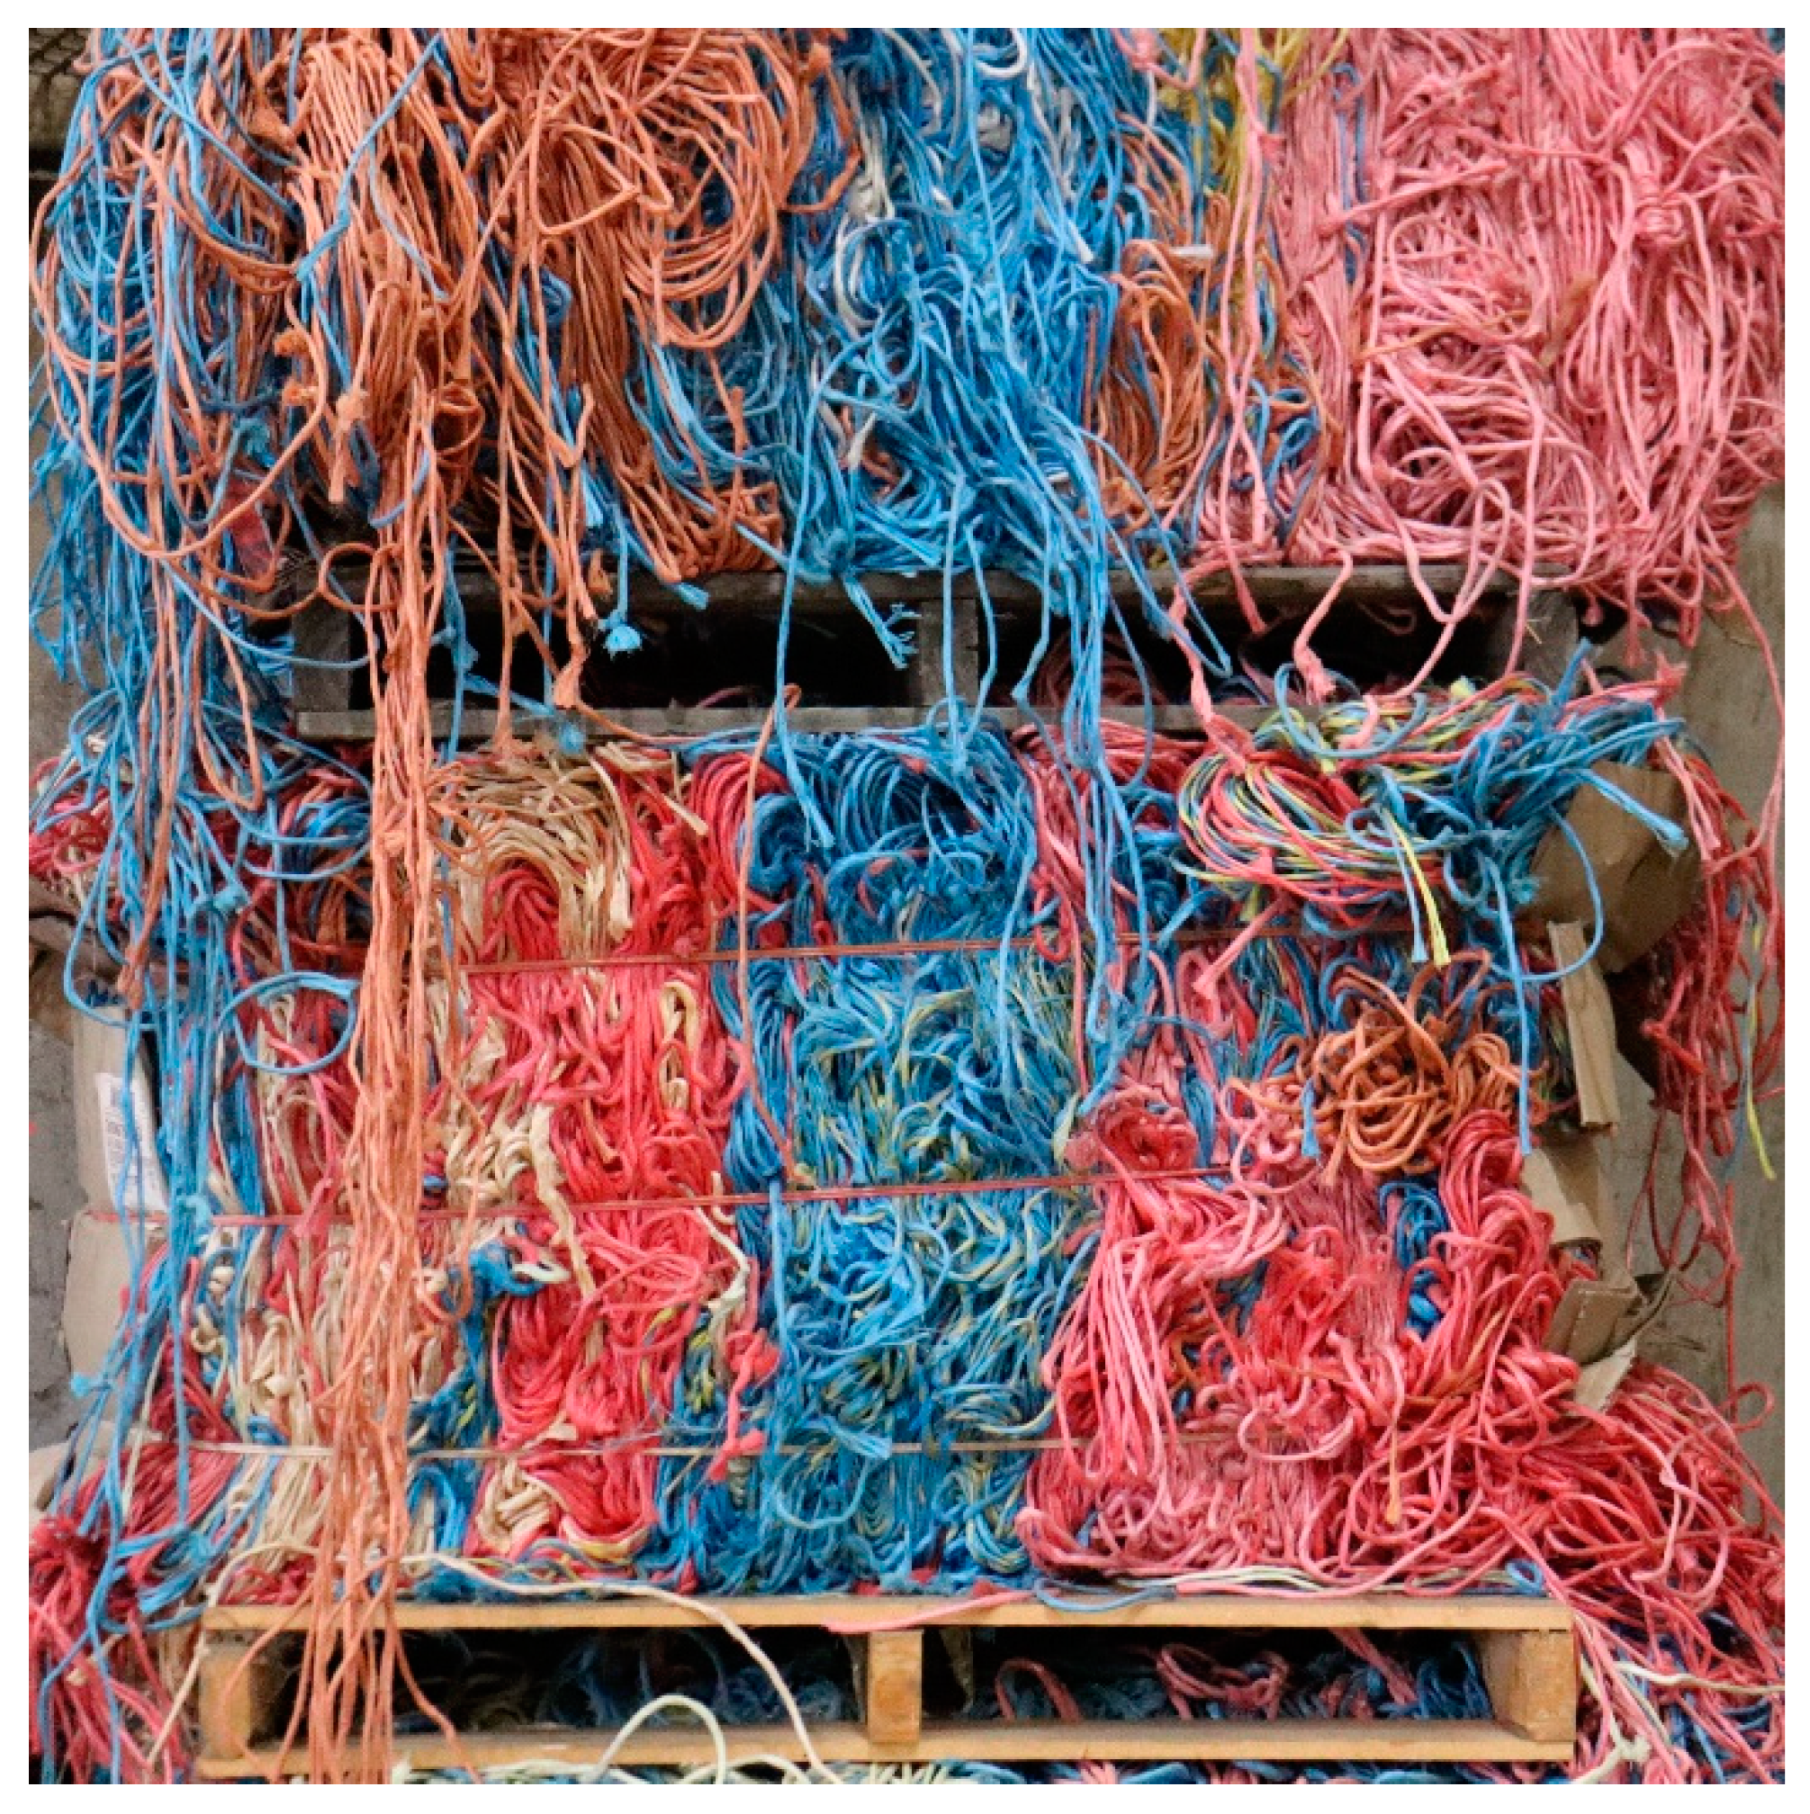
Figure 9.
(a) Rtec™ low-cost melting machine, (b) molten BT waste and (c) PBT in granule form.
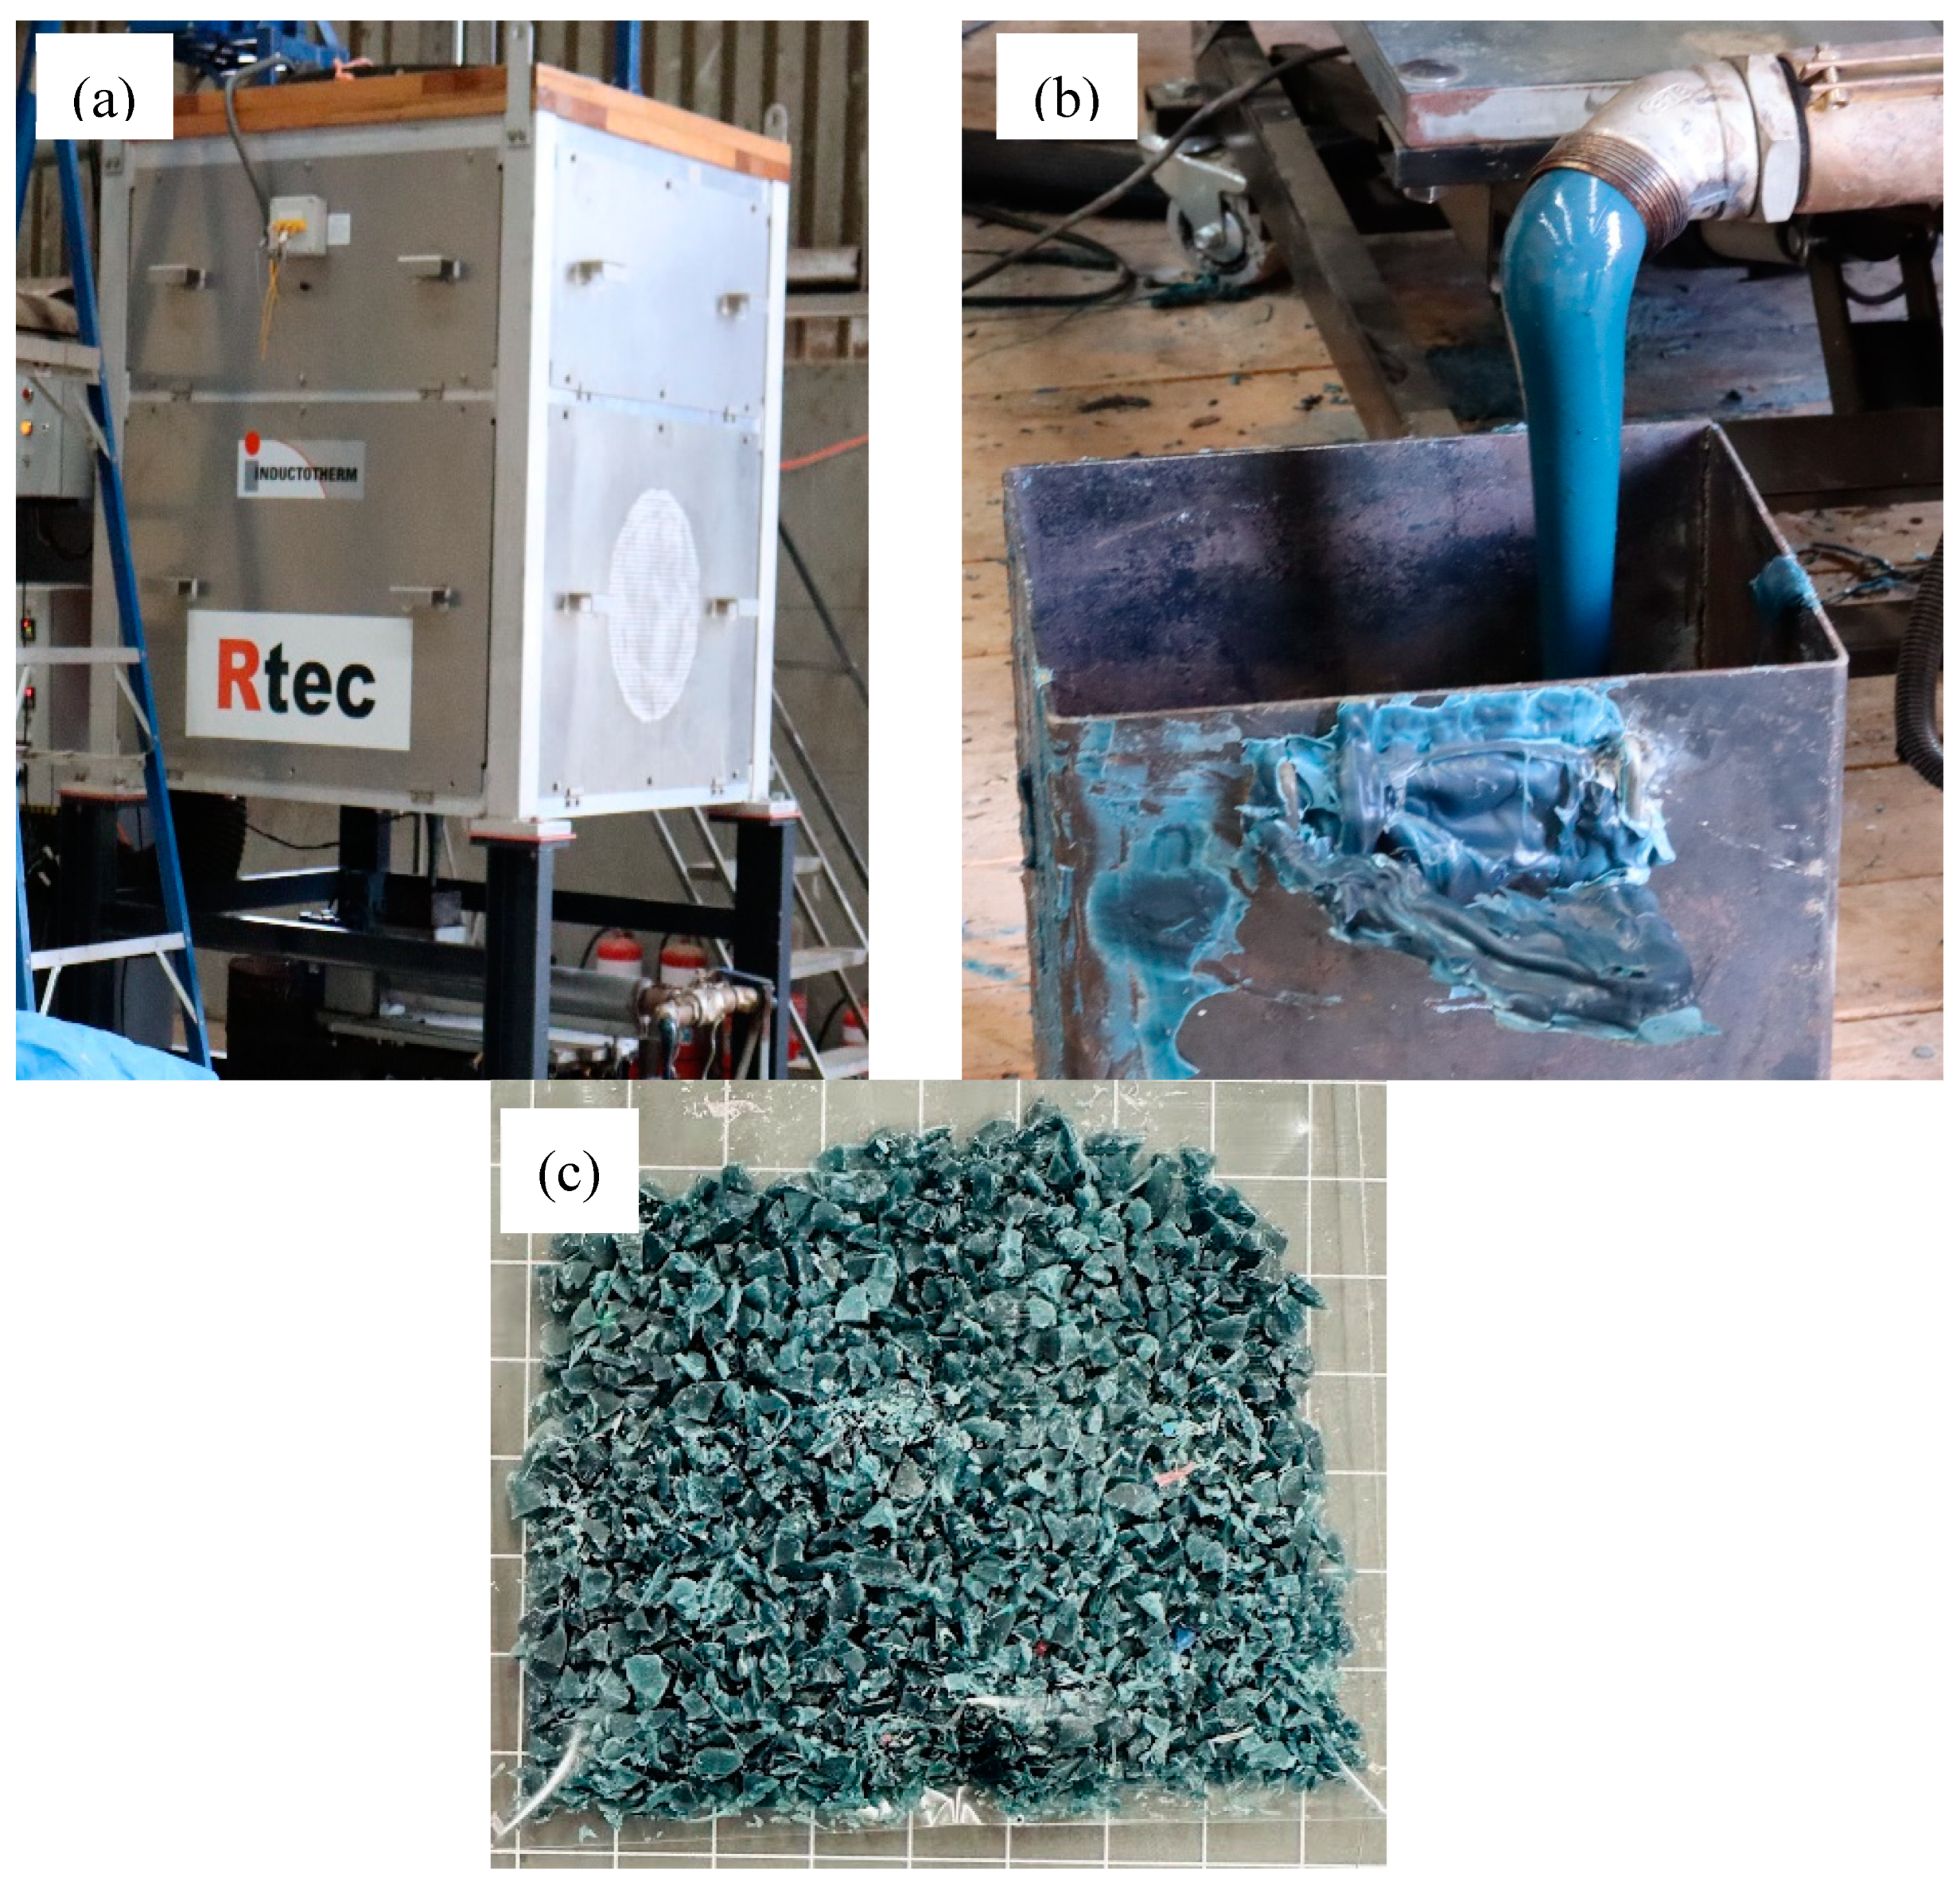

Table 1.
Thermal properties of pure PP, BT and PBT.
| Sample | Tm (°C) | Tc (°C) | ΔHm (J/g) | Xc (%) |
|---|---|---|---|---|
| Pure PP | 152.00 | 113.49 | 54.24 | 26.6 |
| BT | 164.04 | 118.15 | 149.57 | 72.2 |
Table 2.
PBT power model parameters obtained using theoretical predictions.
| Model | Parameter | Processed ET |
|---|---|---|
| Burger's Model | Em | 1.0 GPa |
| Ek | 2.322 GPa | |
| ηk | 70.159 GPa | |
| ηm | 3.55 × 10³ GPa | |
| τ | 15.9 | |
| R2 | 0.75 | |
| Findley power-law model | S0 | 0.32 /GPa |
| a | 0.25 | |
| b | 1.0 | |
| R2 | 2.322 |
Disclaimer/Publisher’s Note: The statements, opinions and data contained in all publications are solely those of the individual author(s) and contributor(s) and not of MDPI and/or the editor(s). MDPI and/or the editor(s) disclaim responsibility for any injury to people or property resulting from any ideas, methods, instructions or products referred to in the content. |
© 2024 by the authors. Licensee MDPI, Basel, Switzerland. This article is an open access article distributed under the terms and conditions of the Creative Commons Attribution (CC BY) license (http://creativecommons.org/licenses/by/4.0/).
Copyright: This open access article is published under a Creative Commons CC BY 4.0 license, which permit the free download, distribution, and reuse, provided that the author and preprint are cited in any reuse.


