
Submitted:
07 April 2025
Posted:
07 April 2025
You are already at the latest version
Abstract
This work aims to analyze the responses of eight floating wind turbines. From this perspective, this paper will compare the response offset regarding the motions of the six degrees of freedom of the respective floating wind turbines. The applied forces these analyses consider mainly come from constant wind forces applied on the wind turbines’ blades, as well as forces from waves and currents. Different response offset values are considered and compared regarding the different constant wind speeds, as well as the different velocities of waves and currents. This paper also considers a wide range of innovative references related to floating wind turbine analyses and software. Validation and verification studies are left for future work due to the complexity of the data provided in this paper. However, some comparisons will be made between the obtained analysis results and some external references. These references may have floating wind turbines with different wind and wave environmental conditions, power capacities, and dimensional characteristics.
Keywords:
renewable energy
; offshore wind
; floating platforms
; marine environment
1. Introduction
Wind energy is essential socially and economically to increase the sustainability and development in many countries around the world [1]. From this perspective, wind energy sources including floating wind turbines have become an essential electricity generation source [2].
To achieve zero carbon emissions, implementing offshore including floating wind energy in deep water areas has become a requirement [3,4,5,6,7,8].
Floating wind energy represents 80% of offshore wind energy resources due to its feasibility in high water depths [9,10].
The main two advantages of floating wind energy are the generation of electricity in deep waters, as well as the elimination of the global warming (climate change) threats that are due to excessive carbon emissions according to the Paris Agreement [11,12,13,14,15,16,17,18,19]. This applies especially in Europe, the US, and Japan which have limited shallow water depth offshore areas. This will necessitate cost reduction of floating wind levelized cost of energy compared to that of onshore and offshore bottom-fixed wind to facilitate implementation of such turbines [20,21,22,23,24,25].
Floating wind turbines are implemented in harsh environments such as high wave and high wind speed areas which makes their design and maintenance challenging [26,27]. Moreover, floating wind fatigue numerical analyses are challenging due to the complexity of wind and ocean environmental conditions [28]. A solution for this could be real-time monitoring in terms of mooring line fatigue computation for example [29].
The increasing floating wind sizes and their corresponding harsh environmental load conditions in deep water made it essential to carry out dynamic analyses for such systems [30].
A main challenge for implementing floating wind turbines is the instability resulting from the floating support structure and the controller [31]. A further difficulty in implementing TLP floating wind turbines for example is the necessity of pre-tensioned vertical mooring lines and a reliable anchor design which makes it difficult to implement such turbines [32].
Bottom-fixed offshore wind turbines currently have competitive costs as compared to onshore wind turbines in terms of electricity production [33]. A suggestion for reducing floating wind implementation costs is to implement floating wind farms with shared mooring lines [34]. This suggestion has the potential to be one of the most effective solutions for reducing such costs [35].
As of 2019, the European offshore wind capacity has been reported to be 22 GW, and it is expected to reach 300 GW in 2030 which will necessitate implementing floating wind turbines in deep water areas [36,37].
Knowledge of offshore wind environmental loading conditions is essential in designing such turbines [38]. A challenge of floating wind turbines is resonant motions which will influence their costs, performance, and lifespan and it needs to be studied and prevented [39].
Integrated analysis using aero-hydro-servo-elastic tools is essential for accurate numerical results of floating wind turbines [40]. Software for determining the global responses of such turbines implements numerically generated wind using aero-hydro-servo-elastic analyses [41,42].
Floating wind turbines have recently become the topic of interest in the fields of naval architecture and renewable energy. Therefore, conducting an analysis illustrating their response offsets is very important. From this perspective, this paper will cover the six-degree-of-freedom motion amplitudes for each of the eight floating wind turbines considered in the study throughout this paper.
Figure 1 shows the four floating wind turbine types from which three of them are analyzed throughout the eight concepts covered in the floating wind turbine analyses carried out in this paper.
The eight floating wind turbines considered in the study were also included in a previously published paper by the authors covering a complete and up-to-date literature review and aspects of relevance to modern floating wind turbines [43].
Table 1, Table 2, Table 3, Table 4, Table 5, Table 6, Table 7 and Table 8 show the characteristics of the different floating wind turbine models studied throughout this paper and implemented in the Sima 4.6.4 software. Figure 2, Figure 3, Figure 4, Figure 5, Figure 6, Figure 7, Figure 8 and Figure 9 and Table 1, Table 2, Table 3, Table 4, Table 5, Table 6, Table 7 and Table 8 show the eight floating wind turbines covered throughout these analyses, as well as their characteristics that are implemented in SIMA software.
Figure 2 and Table 1 illustrate the layout and the characteristics of the OO-Star floating wind turbine implemented in SIMA software.
Figure 3 and Table 2 illustrate the layout and the characteristics of the CSC floating wind turbine implemented in SIMA software.
Figure 4 and Table 3 illustrate the layout and the characteristics of the WindFloat floating wind turbine implemented in SIMA software.
Figure 5 and Table 4 illustrate the layout and the characteristics of the DTU Spar 1 floating wind turbine implemented in SIMA software.
Figure 6 and Table 5 illustrate the layout and the characteristics of the DTU Spar 2 floating wind turbine implemented in SIMA software.
Figure 7 and Table 6 illustrate the layout and the characteristics of the TLPWT floating wind turbine implemented in SIMA software.
Figure 8 and Table 7 illustrate the layout and the characteristics of the INO-WINDMOOR floating wind turbine implemented in SIMA software.
Figure 9 and Table 8 illustrate the layout and the characteristics of the VolturnUS-S floating wind turbine implemented in SIMA software.
Figure 2, Figure 3, Figure 4, Figure 8 and Figure 9 presented above show five semi-submersible floating wind turbine concepts (OO-Star, CSC, WindFloat, INO-WINDMOOR, and U-Maine Volturn-US). The first three floating wind turbines have a power capacity of 10 MW each. While the latter two have 12 and 15 MW power capacity respectively. It is to be noted that floating wind turbines with a power capacity of 10 MW throughout this paper have a rated wind speed of 11.4 m/s each. While the other floating wind turbines with 12 and 15 MW respectively have a rated wind speed of 10.6 m/s. It is also to be noted that all the presented floating wind turbines throughout this study implement upwind turbines except the INO-WINDMOOR semi-submersible which implements a downwind turbine. This means that the latter floating wind turbine generates energy by allowing the wind to hit the backside of its blades (See Figure 8 which illustrates the directions of wind and wave by arrows).
Figure 5 and Figure 6 show floating wind turbines with a spar type. Both turbines have the same power capacity of 10 MW and share most characteristics including water depth with a slight modification in the height of their support structures (See Figure 5 and Figure 6 and Table 4 and Table 5 for further details).
Figure 7 shows a floating wind turbine with a TLP type. This turbine has a conventional power capacity of 10 MW.
The models of the analyzed eight floating wind turbines in this paper were taken from Reference [46]. These Sima 4.6.4 models were used to carry out the constant wind analyses and their output data are presented in Section 3 of this paper.
Further state-of-the-art tools and external references related to floating wind turbines are as follows.
References [47,48,49] present innovative aspects of relevance to floating wind turbines’ building and classing standards and dynamic responses.
References [50,51,52,53,54,55,56] show innovative aspects related to floating wind inter-array dynamic power cables’ analyses, design, software, and information relevant to floating wind mooring systems.
References [57,58,59] present innovative aspects relevant to floating wind turbines' operations, and structural design tools.
References [60,61,62,63,64,65,66,67] present floating wind turbine analysis software such as SESAM (including GeniE, HydroD, Sima, etc.), Bladed, OrcaFlex, Riflex, and DeepC.
Reference [68] presents bottom-fixed and floating wind turbine failure analyses concerning their components.
References [69,70] present floating wind turbines’ design aspects, response, and reliability analyses.
Reference [71] presents bottom-fixed and floating wind turbines' response analyses, software, and numerical tools.
Reference [72] presents floating wind farms and array-level floating wind turbines' innovative designs and challenges.
References [73,74] present innovative aspects of relevance to floating wind turbine verification and design tools. As well as the design of installation vessels that are specialized in installing floating wind turbines.
References [75,76] present floating wind turbines' redundant components. The main considered components are the blades and drivetrain components including the nacelle, generator, and gearbox. As well as floating wind turbines' hydrodynamic challenges relevant to their implementation in shallow water depths.
Reference [77] presents information relevant to floating wind turbines' station-keeping mooring system design, and anchoring.
References [78,79,80] present dynamic and fatigue analyses related to the power cables of connected floating wind turbines using OrcaFlex software. As well as dynamic power cables' fatigue analyses of relevance to floating wind turbines. As well as floating wind turbines' probabilistic fatigue design using Monte Carlo simulation.
References [81,82] present the Norwegian perspective on the European and global wind energy situation. As well as the positive stability effects controllers have on floating wind turbines implemented in high water depths.
References [83,84] present the positive effects of relevance to the repositioning of some floating wind turbines to enhance their electricity power output. These references also present bottom-fixed and floating wind turbines' power performance as well as extreme load analyses. As well as predictions and challenges relevant to huge floating wind turbines.
References [85,86] show offshore wind certification requirements and standards in different countries worldwide. They also present vortex-induced vibration (VIV) fatigue analyses of floating wind dynamic power cables.
The next section will present the materials and methods of relevance to the different floating wind analyses carried out in this paper.
2. Materials and Methods
This section will present some aspects of the mathematical background behind the Sima 4.6.4 software that is used to carry out the constant wind analyses of the eight floating wind turbines studied in this paper.
Sima software is used to carry out these analyses. This software is dedicated to floating wind turbines due to their computational capabilities that allow fully coupled dynamic analyses that are based on aero-hydro-servo-elastic theory. Sima software has the capability of calculating aerodynamic and hydrodynamic loads. It has the capability of controlling dynamic loads using control theory. It has the capability of calculating structural dynamics loads using elastic theory of relevance to the mooring system.
According to Reference [87], Sima software implements SIMO and Riflex models. The SIMO model is used to design the rigid floating support structure. The Riflex model on the other hand is used to design the wind turbine that is coupled to the floating wind support structures using a flexible tower. The RIFLEX model is also used to design the mooring lines that are coupled to the floating wind support structure.
The wind turbine is implemented in RIFLEX based on Blade Element Momentum (BEM) theory. The tower is modeled using tens of beam elements. The mooring lines are designed using bar elements with master super nodes at the support structure’s origin and slave super modes at the fairleads. A further reference related to mooring line design is the following [88]. Controller-related aspects can be found in Reference [89]. This reference especially focuses on the VolturnUS-S floating wind turbine.
The support structure modeled in SIMO is subjected to wave loads and subjected to loads that come from the finite element structures designed in RIFLEX.
According to [87], the implemented time-domain equation of motion in SIMA software is the following.
Where:
m: Inertia matrix obtained from platforms steel and ballast masses
: Added mass of infinite frequency
: External linear damping matrix
: Restoring hydrostatic matrix
: Retardation matrix
: Vector with external loads which includes first and second-order loads, viscous loads (Morison terms), tower loads, and mooring-induced forces
As was mentioned above, Sima is a software that is dedicated to marine operations and floating wind turbines. It is an aero-hydro-servo-elastic software that uses potential flow theory for generating the sea surface.
According to Reference [90], SIMA software implements potential flow theory that is based on the velocity potential concept which has the assumptions of incompressible and inviscid fluid and irrotational flow. The velocity potential in potential flow theory will satisfy the Laplace equation based on the above assumptions mathematically as follows:
The constant wind analyses of the eight floating wind turbines analyzed in this paper using Sima software are divided into three types. Only wind analyses, Wind and wave analyses, and Wind, wave, and current analyses. This is to compare the response offsets of the different analysis types.
When carrying out the analyses, 10 thousand seconds was allocated to each analysis to ensure convergence. A time step of 0.005 seconds was selected to ensure accurate results. The time increment of wave/body response was set to 0.1 seconds. The mean values of the time series excluding the transients were used to generate the table values presented in Section 3.
In terms of the analyses concerning no contribution from wave forces (Only wind analyses), the significant wave height was set to 0.001 meters (Hs=0.001 m) and the peak period was set to 20 seconds (Tp=20 s) to ensure no contribution of waves to these analyses.
Furthermore, the three-parameter spectra was implemented in the analyses for generating the waves. The stationary uniform (constant) wind type was implemented in the software for generating the wind.
The next section will present the results of the analyses of the eight floating wind turbines studied in this paper.
3. Results
This section will present the results outputted from the Sima 4.6.4 software regarding the six degrees of freedom of the eight floating wind turbines studied in this paper.
Subsection 3.1 will consider only wind analyses. Meanwhile, Subsection 3.2 will consider wind, wave, and current analyses.
Subsection 3.1 will only study three degrees of freedom (Surge, Roll, and Pitch) in terms of 12 different wind speeds (2-24 m/s). Subsection 3.2 will study the six degrees of freedom in terms of the rated wind speed (11.4 m/s for 10 MW and 10.6 m/s for 12 and 15 MW floating wind turbines respectively).
3.1. Only Wind Analyses
Table 9, Table 10, Table 11, Table 12, Table 13, Table 14, Table 15, Table 16 and Table 17 and Figure 10, Figure 11, Figure 12, Figure 13, Figure 14, Figure 15, Figure 16, Figure 17 and Figure 18 show the only wind constant wind analysis results of the eight floating wind turbines studied in this paper.
Table 9 and Figure 10 show that the OO-Star only-wind Surge offset is 4.7-29.18-12.8 m for the wind speeds 4-11.4-24 m/s. Note that the maximum response offset is reached at the rated wind speed (11.6 m/s for 10 MW and 10.6 m/s for 12 and 15 MW floating wind turbines) which is between the maximum and minimum wind speeds. This is the reason for listing three wind speeds and three corresponding response offsets in presenting the tables of this subsection.
CSC Surge offset is 1.5-11.74-4.4 m for wind speeds 4-11.4-24 m/s respectively.
WindFloat Surge response offset is 1.8-13.36-5.06 m for wind speeds 4-11.4-24 m/s respectively.
TLPWT Surge response offset is 0.4-2.2-1.18 m for wind speeds 4-11.4-24 m/s respectively.
Table 10 and Figure 11 show only wind Roll response offset for OO-Star, CSC, WindFloat, and TLPWT floating wind turbines.
OO-Star Roll response offset is 0.02-0.36-0.29° for wind speeds 4-11.4-24 m/s respectively.
CSC Roll response offset is 0.01-0.34-0.38° for wind speeds 4-11.4-24 m/s respectively.
WindFloat Roll response offset is 0.009-0.3003-0.33° for wind speeds 4-11.4-24 m/s respectively.
TLPWT Roll response offset is 0.000014-0.00164-0.002° for wind speeds 4-11.4-24 m/s respectively.
Table 11 and Figure 12 show the only wind Pitch response offset for OO-Star, CSC, WindFloat, and TLPWT floating wind turbines.
OO-Star only wind Pitch response offset is 0.6-5.9-2.2° for wind speeds 4-11.4-24 m/s respectively.
CSC only wind Pitch response offset is 0.7-6.7-2.5° for wind speeds 4-11.4-24 m/s respectively.
WindFloat Pitch response offset is 6.09-12.4-7.9° for wind speeds 4-11.4-24 m/s respectively.
TLPWT Pitch response offset is 0.0007-0.005-0.002° for wind speeds 4-11.4-24 m/s respectively.
Table 12 and Figure 13 show only the Surge response offset of VolturnUS-S and INO-WINDMOOR floating wind turbines.
VolturnUS-S Surge response offset is 4.2-15.9-9.9 m for wind speeds 4-10.6-24 m/s respectively.
INO-WINDMOOR Surge response offset is 3.3-10.3-7.5 m for wind speeds 4-10.6-24 m/s respectively.
Table 13 and Figure 14 show only wind Roll response offset of VolturnUS-S and INO-WINDMOOR floating wind turbines.
VolturnUS-S has only wind Roll response offset is 0.02-0.334-0.337° for wind speeds 4-10.6-24 m/s respectively.
INO-WINDMOOR only wind Roll response offset is 0.07-0.5-0.37° for wind speeds 4-10.6-24 m/s respectively.
Table 14 and Figure 15 show only wind Pitch response offset of VolturnUS-S and INO-WINDMOOR floating wind turbines.
VolturnUS-S Pitch response offset is 0.6-2.6-0.8° for wind speeds 4-10.6-24 m/s respectively.
INO-WINDMOOR Pitch response offset is 0.7-4.4-1.5° for wind speeds 4-10.6-24 m/s respectively.
Table 15 and Figure 16 show only wind Surge response offset of DTU Spar 1 and DTU Spar 2 floating wind turbines.
DTU Spar 1 only wind Surge response offset is 6.1-37.9-16.8 m for wind speeds 4-11.4-24 m/s respectively.
DTU Spar 2 only wind Surge response offset is 4.64-26.3-13.5 m for wind speeds 4-11.4-24 m/s respectively.
Table 16 and Figure 17 show only wind Roll response offset of DTU Spar 1 and DTU Spar 2 floating wind turbines.
DTU Spar 1 only wind Roll response offset is 0.0102-0.24-0.19° for wind speeds 4-11.4-24 m/s respectively.
DTU Spar 2 only wind Roll response offset is 0.017-0.35-0.28° for wind speeds 4-11.4-24 m/s respectively.
Table 17 and Figure 18 show only wind Pitch response offset for DTU Spar 1 and DTU Spar 2 floating wind turbines.
DTU Spar 1 only wind Pitch response offset is 1.08-7.57-3.2° for wind speeds 4-11.4-24 m/s respectively.
DTU Spar 2 only wind Pitch response offset is 1.46-10.27-4.42° for wind speeds 4-11.4-24 m/s respectively.
3.2. Wind, Wave, and Current Analyses
This subsection will show wind, wave, and current constant wind analyses of the eight floating wind turbines studied in this paper. External references with corresponding analysis results will also be cited and compared.
Table 18, Table 19, Table 20, Table 21, Table 22, Table 23, Table 24 and Table 25 show wind, wave, and current six-degrees-of-freedom response offset for OO-Star, CSC, WindFloat, TLPWT, VolturnUS-S, INO-WINDMOOR, DTU Spar 1, and DTU Spar 2 floating wind turbines. As mentioned above, unlike Subsection 3.1 which covered 12 different wind speeds 92-24 m/s) for each response offset simulation, this subsection will only consider the rated wind speed (11.4 m/s for the 10 MW and 10.6 m/s for the 12 and 15 MW floating wind turbines respectively). This is due to the complexity of the analyzed data.
Table 18, Table 19, Table 20, Table 21, Table 22, Table 23, Table 24 and Table 25 only present analysis results with two different sea states (Hs = 2.5 m, Tp = 10 s and Hs = 4 m, Tp=12 s). These two sea states are analyzed with and without current effects as illustrated in the tables. The implemented current speed in these analyses is 2 m/s and it is only applied at the sea surface (z=0).
Table 18 shows that the OO-Star Surge response offset is 29.18-58.3 m.
Paper [91] has analyzed the OO-Star Surge motion and concluded that it is 20 m. Note that the input data of both analyses is different.
OO-Star Sway response offset ranges between 0.1514-0.222 m.
OO-Star Heave response offset ranges between 0.47-0.59 m.
Paper [91] has analyzed the OO-Star Heave motion and concluded that it is 0.4 m. Note that the input data of both analyses is different.
OO-Star Roll response offset ranges between 0.3684-0.3853°.
OO-Star Pitch response offset ranges between 3.6-5.9°.
Paper [91] has analyzed the OO-Star Surge offset and concluded that it is 5.9°. Note that the input data of both analyses is different.
OO-Star Yaw response offset ranges between 0.1213-0.1253°.
Reference [92] present aspects regarding OO-Star Semi-submersible floating wind turbines, as well as further predictions on the future of 20 MW floating wind turbines.
Table 19 shows that the CSC Surge response offset is 11.7-39.08 m.
Paper [35] has analyzed CSC Surge motion and concluded that it is 8.5-10 m. Note that the input data of both analyses is different.
CSC Sway response offset ranges between 0.019 and 0.1 m.
Paper [35] has analyzed CSC Sway motion and concluded that it is 4.5-9 m. Note that the input data of both analyses is different.
CSC Heave response offset ranges between 0.17 and 0.619 m.
Paper [35] has analyzed CSC Heave motion and concluded that it is 3.5-5.5 m. Note that the input data of both analyses is different.
CSC Roll response offset ranges between 0.301 and 0.347°.
Paper [35] has analyzed CSC Roll offset and concluded that it is 3°. Note that the input data of both analyses is different.
CSC Pitch response offset ranges between 4.51 and 6.76°.
Paper [35] has analyzed CSC Pitch offset and concluded that it is 4.2-6.8°. Note that the input data of both analyses is different.
CSC Yaw response offset ranges between 0.082 and 0.105°.
Paper [35] has conducted an analysis for CSC Yaw offset and concluded that it is 1.8-1.9°. Note that the input data of both analyses is different.
Reference [93] reports natural period values for the CSC floating wind turbine as 25.57 s for heave, 35.47 s for roll, and 35.47 s for pitch. Note that the input data of both analyses is different.
Reference [94] presents a 5 MW CSC Semi-submersible floating wind turbine's design and response reduction analyses using SESAM software.
Table 20 shows that the WindFloat Surge response offset is 13.2-34.9 m.
Paper [95] has analyzed WindFloat Surge motion and concluded that it is 15 m. Note that the input data of both analyses is different.
WindFloat Sway response offset ranges between 0.016 and 0.14 m.
WindFloat Heave response offset ranges between 1.37 and 1.44 m.
Paper [95] has analyzed WindFloat Heave motion and concluded that it is 1.7 m. Note that the input data of both analyses is different.
WindFloat Roll response offset ranges between 0.255 and 0.3009°.
WindFloat Pitch response offset ranges between 11.2 and 12.4°.
Paper [95] has analyzed WindFloat Pitch offset and concluded that it is 2°. Note that the input data of both analyses is different.
WindFloat Yaw response offset ranges between 0.02 and 0.05°.
Table 21 shows that the TLPWT Surge response offset is 2.2-4.83 m.
TLPWT Sway response offset ranges between 0.002 and 0.0075 m.
TLPWT Heave response offset ranges between 0.068 and 0.17 m.
TLPWT Roll response offset ranges between 0.0015 and 0.002°.
TLPWT Pitch response offset ranges between 0.0053 and 0.00576°.
TLPWT Yaw response offset ranges between 0.0832 and 0.0949°.
References [96,97] present a review of multidisciplinary design optimization of relevance to Spar, Semi-submersible, and TLP floating wind turbines. As well as guidelines relevant to the design of floating wind turbines.
Reference [98] presents 5 MW Tension-Leg-Buoy (TLB) validation using tank tests and coupled aero-hydro-servo-elastic numerical tools.
Table 22 shows that the VolturnUS-S Surge response offset is 15.9-24.29 m.
Paper [99] has reported VolturnUS-S Surge motion as 8.8 m. Note that the input data of both analyses is different.
VolturnUS-S Sway response offset ranges between 0.0803 and 0.1004 m.
VolturnUS-S Heave response offset ranges between 0.12 and 0.201 m.
VolturnUS-S Roll response offset ranges between 0.334 and 0.397°.
VolturnUS-S Pitch response offset ranges between 2.607 and 4.03°.
Paper [99] has reported VolturnUS-S Pitch offset as 2.7-5.2°. Note that the input data of both analyses is different.
VolturnUS-S Yaw response offset ranges between 0.241 and 0.31°.
Papers [100,101] report frequency-domain analyses for the VolturnUS floating wind turbine in contrast to our work considering time-domain analyses. These papers also present structural analyses of relevance to the 15 MW VolturnUS-S Semi-submersible floating wind turbine using Bladed and SESAM software.
Table 23 shows that the INO-WINDMOOR Surge response offset is 10.3-41.07 m.
INO-WINDMOOR Sway response offset ranges between 0.031 and 0.0604 m.
INO-WINDMOOR Heave response offset ranges between 0.077 and 0.453 m.
INO-WINDMOOR Roll response offset ranges between 0.5053 and 0.5266°.
INO-WINDMOOR Pitch response offset ranges between 2.362 and 4.464°.
INO-WINDMOOR Yaw response offset ranges between 0.051 and 0.589°.
Papers [39,102] report the six degrees of freedom of INO-WINDMOOR and other floating wind turbines, but as a function of natural period, and not as a function of response offset as is the case in our work in this paper.
References [39,103] present WINDMOOR 12 MW floating wind turbine hydrostatic stability and hydrodynamics analyses using SIMA, SIMO, RFLEX, and WAMIT software.
Reference [104] present 15 MW Semi-submersible floating wind turbine time-domain stress analyses.
Table 24 shows that the DTU Spar 1 Surge response offset is 37.6-62.18 m.
DTU Spar 1 Sway response offset ranges between 0.309 and 0.324 m.
DTU Spar 1 Heave response offset ranges between 1.34 and 3.38 m.
DTU Spar 1 Roll response offset ranges between 0.217 and 0.224°.
DTU Spar 1 Pitch response offset ranges between 7.57 and 8.24°.
Paper [30] reported a Spar pitch offset as 7-14°. Note that the input data of both analyses is different.
DTU Spar 1 Yaw response offset ranges between 0.31 and 0.35°.
References [105,106,107] present state-of-the-art aspects relevant to the OC3-Hywind Spar floating wind turbine aero-hydro-servo-elastic analyses, and multidisciplinary design optimization analyses. They also present relevant numerical simulations and experiments.
References [108,109,110,111,112,113] present the 10 MW DTU wind turbine mounted on bottom-fixed turbines. They also present the designs and dynamic responses of Spar, Semi-submersible, and TLP floating wind support structures.
References [114,115] present a study of selecting suitable floating wind support structures from the point of view of their hydrodynamic and aerodynamic performances. They also present wind models' sensitivity analyses of relevance to the dynamic response of floating wind turbines.
Table 25 shows that the DTU Spar 2 Surge response offset is 26.3-50.7 m.
Paper [115] reports Spar Surge motion as 24 m. Note that the input data of both analyses is different.
DTU Spar 2 Sway response offset ranges between 0.28 and 0.302 m.
Paper [115] reports Spar Sway motion as 0.5-4 m. Note that the input data of both analyses is different.
DTU Spar 2 Heave response offset ranges between 1.302 and 3.34 m.
Paper [115] reports Spar Heave motion as 1.8-6 m. Note that the input data of both analyses is different.
DTU Spar 2 Roll response offset ranges between 0.313 and 0.35°.
Paper [115] reports Spar Roll offset as 0.3-3.5°. Note that the input data of both analyses is different.
DTU Spar 2 Pitch response offset ranges between 10.2 and 10.9°.
Paper [115] reports Spar Pitch offset as 2.5-8.5°. Note that the input data of both analyses is different.
DTU Spar 2 Yaw response offset ranges between 0.26 and 0.31°.
Paper [115] reports Spar Yaw offset as 0.5-5°. Note that the input data of both analyses is different.
Paper [6] reports two-bladed spar floating wind turbine degrees of freedom as 8-18 m for surge, 0.5-0.75 m for heave, and 3-5° for pitch. Note that the input data and the floating wind concepts of both analyses are different.
5. Conclusions
This paper has considered only wind constant wind analyses. As well as wind, wave, and current constant wind analyses of eight floating wind turbines.
Due to the complexity of the presented results, this section will only present the minimum and maximum response offset of each of the presented degrees of freedom along with their corresponding floating wind turbine concepts (See Table 26 below).
Section 3.1 has considered only wind response offset analyses in terms of 12 different wind speeds (2-24 m/s) for three degrees of freedom (Surge, Roll, and Pitch). These analyses have shown the maximum response offsets correspond to the rated wind speeds (11.4 m/s for 10 MW and 10.6 m/s for 12 and 15 MW).
Section 3.2 has considered wind, wave, and current constant wind analyses for all the degrees of freedom in terms of the corresponding rated wind speeds. According to Table 26 below, the minimum Surge response offset is 4.834 m and corresponds to the TLPWT floating wind turbine. The maximum Surge response offset is 62.18 m and corresponds to DTU Spar 1 floating wind turbine.
The minimum Sway response offset is 0.007561 m and corresponds to the TLPWT floating wind turbine. The maximum Sway response offset is 0.3243 m and corresponds to DTU Spar 1 floating wind turbine.
The minimum Heave response offset is 0.1718 m and corresponds to the TLPWT floating wind turbine. The maximum Heave response offset is 3.384 m and corresponds to DTU Spar 1 floating wind turbine.
The minimum Roll response offset is 0.002142° and corresponds to the TLPWT floating wind turbine. The maximum Roll response offset is 0.5266° and corresponds to the INO-WINDMOOR floating wind turbine.
The minimum Pitch response offset is 0.005766° and corresponds to the TLPWT floating wind turbine. The maximum Pitch response offset is 10.93° and corresponds to DTU Spar 2 floating wind turbine.
The minimum Yaw response offset is 0.05138° and corresponds to WindFloat floating wind turbine. The maximum Yaw response offset is 0.58993° and corresponds to the INO-WINDMOOR floating wind turbine.
Author Contributions
Conceptualization, M.M. and E.R.; methodology, M.M. and E.R.; software, M.M..; formal analysis, M.M.; investigation, M.M.; resources, M.M. and E.R.; data curation, M.M.; writing—original draft preparation, M.M.; writing—review and editing, M.M. and E.R.; supervision, E.R.; project administration, E.R. All authors have read and agreed to the published version of the manuscript.
Funding
This research received no external funding
Conflicts of Interest
The authors declare no conflicts of interest.
References
- Zhou, Y., Feng, S., Guo, X., Tian, F., Han, X., Shi, W., Li, X. 2023. Initial Design of a Novel Barge-Type Floating Offshore Wind Turbine in Shallow Water. J. Mar. Sci. Eng. 11, 464. [CrossRef]
- Chen, J., Hu, Z., Liu, G., Wan, D. 2019. Coupled aero-hydro-servo-elastic methods for floating wind turbines. Renewable Energy, Volume 130, Pages 139-153, ISSN 0960-1481. [CrossRef]
- Edwards, E. C., Holcombe, A., Brown, S., Ransley, E., Hann, M., Greaves, D. 2024. Trends in floating offshore wind platforms: A review of early-stage devices. Renewable and Sustainable Energy Reviews, Volume 193, 114271, ISSN 1364-0321. [CrossRef]
- Ojo, M., Collu, M., Coraddu, A. 2022. Multidisciplinary design analysis and optimization of floating offshore wind turbine substructures: A review. Ocean Engineering, Volume 266, Part 1, 112727, ISSN 0029-8018. [CrossRef]
- Goupee, A. J., Koo, B., Kimball, R. W., Lambrakos, K. F., Dagher, H. J. 2012. Experimental Comparison of Three Floating Wind Turbine Concepts. Proceedings of the ASME 2012 31st International Conference on Ocean, Offshore and Arctic Engineering. Volume 7: Ocean Space Utilization; Ocean Renewable Energy. Rio de Janeiro, Brazil. pp. 467-476. ASME. [CrossRef]
- Wu, Z., Wang, K., Jie, T., Wu, X. 2024. Coupled Dynamic Characteristics of a Spar-Type Offshore Floating Two-Bladed Wind Turbine with a Flexible Hub Connection. J. Mar. Sci. Eng. 12, 547. [CrossRef]
- Ramzanpoor, I. Ramzanpoor, I., Nuernberg, M., Tao, L. 2023. Coupled aero-hydro-servo-elastic analysis of 10MW TLB floating offshore wind turbine. Journal of Ocean Engineering and Science, ISSN 2468-0133. [CrossRef]
- Guo, X., Zhang, Y., Yan, J., Zhou, Y., Yan, S., Shi, W., & Li, X. 2022. Integrated Dynamics Response Analysis for IEA 10-MW Spar Floating Offshore Wind Turbine. Journal of Marine Science and Engineering, 10(4), 542. [CrossRef]
- Tillenburg, D. 2021. Technical challenges of floating offshore wind turbines - An overview. EGU Master Journal of Re-newable Energy Short Reviews. [CrossRef]
- Lin, J., Wu, W., Peng, Z. 2023. Overall Strength Analysis of Floating Offshore Wind Turbine Foundation. Journal of Physics: Conference Series. [CrossRef]
- Beier, D., Schnepf, A., Van Steel, S., Ye, N., Ong, M. C. 2023. Fatigue Analysis of Inter-Array Power Cables between Two Floating Offshore Wind Turbines Including a Simplified Method to Estimate Stress Factors. J. Mar. Sci. Eng. 11, 1254. [CrossRef]
- Yang, Y., Bashir, M., Michailides, C., Li, C., Wang, J. 2020. Development and application of an aero-hydro-servo-elastic coupling framework for analysis of floating offshore wind turbines. Renewable Energy. 161. [CrossRef]
- Elobeid, M., Tao, L., Ingram, D., Pillai., A. C., Mayorga, P., Hanssen, J. E. 2022. Hydrodynamic Performance of an Innovative Semisubmersible Platform With Twin Wind Turbines. Proceedings of the ASME 41st International Conference on Ocean, Offshore and Arctic Engineering. Volume 8: Ocean Renewable Energy. Hamburg, Germany. June 5–10, 2022. V008T09A032. ASME. [CrossRef]
- Wang, S., Moan, T., Gao, Z. 2023. Methodology for global structural load effect analysis of the semi-submersible hull of floating wind turbines under still water, wind, and wave loads. Marine Structures, Volume 91, 103463, ISSN 0951-8339. [CrossRef]
- Velarde, J., Bachynski, E. E. 2017. Design and fatigue analysis of monopile foundations to support the DTU 10 MW offshore wind turbine. Energy Procedia,Volume 137, Pages 3-13, ISSN 1876-6102. [CrossRef]
- Hegseth, J. M., Bachynski, E. E. 2019. A semi-analytical frequency domain model for efficient design evaluation of spar floating wind turbines. Marine Structures, Volume 64, Pages 186-210, ISSN 0951-8339. [CrossRef]
- Stockhouse, D., Phadnis, M., Henry, A., Abbas, N., Sinner, M., Pusch, M., Pao, L. Y. 2023. Sink or Swim: A Tutorial on the Control of Floating Wind Turbines. American Control Conference (ACC). [CrossRef]
- Li, M., Jiang, X. Carroll, J., Negenborn, R. R. 2024. Operation and maintenance management for offshore wind farms in-tegrating inventory control and health information. Renewable Energy, Volume 231, 120970. ISSN 0960-1481. Available online: https://www.sciencedirect.com/science/article/pii/S0960148124010383. [CrossRef]
- Pustina, L., Biral, F., Bertolazzi, E., Serafini, J. 2024. A multi-objective Economic Nonlinear Model Predictive Controller for Power and Platform Motion on Floating Offshore Wind Turbines. Wind Energ. Sci. Discuss. [preprint]. in review, 2024. [CrossRef]
- Li, H., Guedes Soares, C. 2022. Assessment of failure rates and reliability of floating offshore wind turbines. Reliability Engineering & System Safety, Volume 228, 108777, ISSN 0951-8320. [CrossRef]
- Li, H., Peng, W., Huang, C. G., Guedes Soares, C. 2022. Failure Rate Assessment for Onshore and Floating Offshore Wind Turbines. J. Mar. Sci. Eng. 10, 1965. [CrossRef]
- Fadaei, S., Afagh, F. F., Langlois, R. G. 2024. A Survey of Numerical Simulation Tools for Offshore Wind Turbine Systems. Wind 4, 1-24. [CrossRef]
- Gao, Z., Merino, D., Han, K. J., Li, H., Fiskvik, S. 2023. Time-domain floater stress analysis for a floating wind turbine. Journal of Ocean Engineering and Science, Volume 8, Issue 4, Pages 435-445, ISSN 2468-0133. [CrossRef]
- Hong, S. McMorland, J., Zhang, H., Collu, M., Halse, K. H. 2024. Floating offshore wind farm installation, challenges and opportunities: A comprehensive survey. Ocean Engineering, Volume 304, 117793, ISSN 0029-8018. [CrossRef]
- Ramzanpoor, I., Nuernberg, M., Tao, L. 2024. Benchmarking study of 10 MW TLB floating offshore wind turbine. J. Ocean Eng. Mar. Energy 10, 1–34. [CrossRef]
- Chitteth Ramachandran, R., Desmond, C., Judge, F., Serraris, J. J., Murphy, J. 2022. Floating wind turbines: marine operations challenges and opportunities. WES. Review Article. [CrossRef]
- Lamei, A., Hayatdavoodi, M., Riggs, H. R. 2024. Hydro- and aero-elastic response of floating offshore wind turbines to combined waves and wind in frequency domain. J. Ocean Eng. Mar. Energy 10, 399–424. [CrossRef]
- Müller, K., Cheng, P. W. 2018. Application of a Monte Carlo procedure for probabilistic fatigue design of floating offshore wind turbines. Wind Energ. Sci., 3, 149–162, 2018. [CrossRef]
- Kumar, R., Sen, S., Keprate, A. 2025. Real-time fatigue assessment of Floating Offshore Wind Turbine Mooring employing sequence-to-sequence-based deep learning on indirect fatigue response. Ocean Engineering, Volume 315, 119741. ISSN 0029-8018. Available online: https://www.sciencedirect.com/science/article/pii/S0029801824030798. [CrossRef]
- De Souza, C. E. S., Bachynski-Polić, E. E. 2022. Design, structural modeling, control, and performance of 20 MW spar floating wind turbines. Marine Structures, Volume 84, 103182, ISSN 0951-8339. [CrossRef]
- Hegseth, J. M., Bachynski, E. E., Martins, R. R. A. 2020. Design Optimization of Spar Floating Wind Turbines Considering Different Control Strategies . J. Phys.: Conf. Ser. 1669-012010. [CrossRef]
- Kim, T., Madsen, F. J., Bredmose, H., Pegalajar-Jurado, A. 2023. Numerical analysis and comparison study of the 1:60 scaled DTU 10 MW TLP floating wind turbine. Renewable Energy, Volume 202, Pages 210-221, ISSN 0960-1481. [CrossRef]
- Moan, T., Gao, Z., Bachynski, E., Nejad, A. 2020. Recent Advances in Integrated Response Analysis of Floating Wind Turbines in a Reliability Perspective. Journal of Offshore Mechanics and Arctic Engineering. [CrossRef]
- Liang, G., Jiang, Z., Merz, K. 2021. Mooring Analysis of a Dual-Spar Floating Wind Farm With a Shared Line. ASME. J. Offshore Mech. Arct. Eng. 143(6): 062003. [CrossRef]
- Munir, H., Lee, C., Ong, M. 2021. Global analysis of floating offshore wind turbines with shared mooring system. IOP Conference Series: Materials Science and Engineering, 1201, 012024. [CrossRef]
- Manolas, D. I., Riziotis, V. A., Papadakis, G. P., Voutsinas, S.G. 2020. Hydro-Servo-Aero-Elastic Analysis of Floating Offshore Wind Turbines. Fluids, 5, 200. [CrossRef]
- Shafiee, M. Failure analysis of spar buoy floating offshore wind turbine systems. 2023. Innov. Infrastruct. Solut. 8, 28. [CrossRef]
- Myrtvedt, M. H., Nybø, A., Nielsen, F. G. 2020. The dynamic response of offshore wind turbines and their sensitivity to wind field models. J. Phys.: Conf. Ser. 1669-012013. [CrossRef]
- Aboutalebi, P., Garrido, A. J., Garrido, I., Nguyen, D. T., Gao, Z. 2024. Hydrostatic stability and hydrodynamics of a floating wind turbine platform integrated with oscillating water columns: A design study. Renewable Energy, Volume 221, 119824, ISSN 0960-1481. [CrossRef]
- Campaña-Alonso, G., Martín-San-Román, R., Méndez-López, B., Benito-Cia, P., Azcona-Armendáriz, J. 2023. OF2: coupling OpenFAST and OpenFOAM for high-fidelity aero-hydro-servo-elastic FOWT simulations. Wind Energ. Sci. (WES). [CrossRef]
- Bachynski, E. E., Eliassen L. 2019. The effects of coherent structures on the global response of floating offshore wind tur-bines. Wind Energy. 22: 219–238. [CrossRef]
- Wang, S., Xing, Y., Karuvathil, A., Gaidai, O. 2023. A comparison study of power performance and extreme load effects of large 10-MW offshore wind turbines. IET Renew. Power Gener. 17, 2195–2214. [CrossRef]
- Maktabi, M., Rusu, E. 2024. A Review of Perspectives on Developing Floating Wind Farms. Inventions 9, 24. [CrossRef]
- Maktabi, M., Rusu, E. 2024. Constant Wind Analyses on Eight Floating Wind Turbines. SCIENTIFIC CONFERENCE OF DOCTORAL SCHOOLS - Perspectives and challenges in doctoral research (UDJG). Powerpoint presentation.
- DNV - Digital Solutions. N. A. Sima Software (Sima-4.2.0-Windows).
- Bachynski, E. E. 2022. TMR4505 - Marine Structures, Specialization Course: Integrated Dynamic Analysis of Wind Turbines (Course module (Course Project)). Department of Marine Technology (NTNU).
- American Bureau of Shipping (ABS). 2012. Floating Wind Turbines. Report.
- American Bureau of Shipping (ABS). 2020. Guide for building and classing FLOATING OFFSHORE WIND TURBINES.
- BVG Associates. 2023. Guide to a Floating Offshore Wind Farm.
- Corewind. 2020. D3.1 Review of the state of the art of dynamic cable system design.
- DNV. 2023. Optimizing mooring and dynamic cable design requirements for floating wind. Available online: https://www.dnv.com/news/optimizing-mooring-and-dynamic-cable-design-requirements-for-floating-wind-238299 (accessed on 17 June 2024).
- Grøva, M. N. A. UFLEX – Stress Analysis of Power Cables and Umbilicals. Sintef. Available online: https://www.sintef.no/en/software/uflex-stress-analysis-of-power-cables-and-umbilicals (accessed on 17 June 2024).
- Guo, Z., Zhao, X., Ma, Q., Li, J., Wu., Z. 2024. Simulation Study on Methods for Reducing Dynamic Cable Curvature in Floating Wind Power Platforms. Journal of Marine Science and Engineering. 12. 334. [CrossRef]
- Okpokparoro, S., Sriramula, S. 2023. Reliability analysis of floating wind turbine dynamic cables under realistic environ-mental loads. Ocean Engineering, 278. [CrossRef]
- Sobhaniasl, M., Petrini, F., Karimirad, M., Bontempi, F. 2020. Fatigue Life Assessment for Power Cables in Floating Offshore Wind Turbines. Energies. 13. 3096. [CrossRef]
- Young, D., Ng, C., Oterkus, S., Li, Q., Johanning, L. 2018. Predicting failure of dynamic cables for floating offshore wind.
- Collu, M., Borg, M. 2016. Design of floating offshore wind turbines. Book: Offshore Wind Farms, Chapter 15. [CrossRef]
- Cordle, A., Jonkman, J. 2011. State-of-the-art in Floating Wind Turbine Design Tools. Proceedings of the International Offshore and Polar Engineering Conference.
- DNV. 2022. FIXED OFFSHORE WIND STRUCTURE DESIGN. White Paper.
- DNV. N. A. Floating Foundations. Available online: https://www.dnv.com/software/services/software-for-offshore-wind/floating-offshore-wind (accessed on 17 October 2024).
- DNV. N. A. Floating structure design and modification - Sesam for floating structures. Available online: https://www.dnv.com/services/floating-structure-design-and-modification-sesam-for-floating-structures-2410 (accessed on 17 October 2024).
- DNV. N. A. Marine operations and mooring analysis software - Sima. Available online: https://www.dnv.com/services/marine-operations-and-mooring-analysis-software-sima-2324 (accessed on 17 October 2024).
- DNV. N. A. SE-28 Integrated analysis for floating offshore wind. Available online: https://www.dnv.com/training/se-28-integrated-analysis-for-floating-offshore-wind (accessed on 17 October 2024).
- Mathias, T. 2022. Design and Numerical Analysis of Mooring Systems for Floating Wind Turbines – Comparison of Con-cepts for European Waters. Master Thesis. NTNU.
- Rønning, T., Bero, L. 2023. Installation analysis of a long floating pontoon bridge. Master Thesis. OsloMet University.
- SINTEF. N. A. SIMA. 2024. Available online: https://www.sima.sintef.no (accessed on 15 September 2024).
- SINTEF. N. A. SIMA. 2024. Available online: https://www.sintef.no/en/software/sima (accessed on 15 September 2024).
- Li, H., Díaz, H., Guedes Soares, C. 2021. A failure analysis of floating offshore wind turbines using AHP-FMEA method-ology. Ocean Engineering, Volume 234, 109261, ISSN 0029-8018. [CrossRef]
- Marcollo, H., Efthimiou, L. 2024. Floating Offshore Wind Dynamic Cables: Overview of Design and Risks. World Forum Offshore Wind (WFO).
- Moan, T., Gao, Z., Bachynski, E. E., Nejad, A. R. 2019. Recent Advances in Response Analysis of Floating Wind Turbines in a Reliability Perspective. IOWTC. Draft.
- Etemaddar, M., Blanke, M., Gao, Z., Moan, T. 2016. Response analysis and comparison of a spar-type floating offshore wind turbine and an onshore wind turbine under blade pitch controller faults. Wind Energ., 19: 35–50. [CrossRef]
- Hall, M., Lozon, E., McAuliffe, F. D., Bessone, M. B., Bayati, I., Bowie, M., Bozonnet, P., Castagné, M., Feng, J., Housner, S., Janocha, M. J., Jiang, Z., Kim, Y. Y., Ko, D., Kölle, K., Lee, C. F., Lekkala, M. R., Liang, G., Mahfouz, M. Y., Mohan, M., O'Connell, D., Ong, M. C., Prieur, J., Rajasree, V. R. N., Schnepf, A., Snedker, T., Thurston-Keller, J., Wright, C.. 2024. IEA Wind TCP Task 49 - The IEA Wind Task 49 Reference Floating Wind Array Design Basis. NREL.
- Halse, K. H., Hong, S., Ataei, B., Liu, T., Yuan, S., Hildre, H. P. 2024. Design of Floating Installation Vessel for Offshore Installation of Floating Offshore Wind Turbines. International Marine Design Conference. [CrossRef]
- SINTEF. N. A. Design and Verification of Offshore Wind Turbines. Available online: https://www.sintef.no/en/expertise/ocean/design-and-verification-of-offshore-wind-turbines (accessed on 17 October 2024).
- Galle, K. 2023. Major Component Replacement on Floating Wind Turbines. KTH. Master Thesis.
- Haga, M. S. B. 2019. Hydrodynamic Challenges of Floating Wind Turbines in Shallower Water Depth. Master Thesis. NTNU.
- WFO. 2023. CRASH COURSE – Floating Offshore Wind, a blog series (PART 3). Available online: https://wfo-global.org/crash-course-floating-offshore-wind-a-blog-series-part-3 (accessed on 17 October 2024).
- Beier, D. 2023. Dynamic and Fatigue Analyses of Suspended Power Cables for Multiple Floating Offshore Wind Turbines. Master thesis. University of Stavanger.
- University of Stuttgart. 2018. Qualification of innovative floating substructures for 10MW wind turbines and water depths greater than 50m. LIFES50+ project.
- CIGRE Colombia. N. A. Fatigue analysis of installed dynamic cable system for offshore floating wind farm. Available online: http://www.cigrecolombia.org/Documents/Memorias/Paris%20CIGRE%20Session%202022/2.Presentations/2.GDM/SC%20B1%20Presentations%20Text%20Version/B1_PS1_Q4.03_KOYAMA_JP.pdf (accessed on 10 June 2024).
- Pharindra, P. 2022. Fatigue Methodology for Floating Offshore Wind Power Platform and Turbine Tower in Composite Materials. Master Thesis. University of Liège.
- Statkraft. N. A. Vindkraft. Available online: https://www.statkraft.no/var-virksomhet/vindkraft/?gad_source=1&gclid=EAIaIQobChMIxJPCyv2thwMVmFSRBR05UAtFEAMYASAAEgKn3_D_BwE (accessed on 17 October 2024).
- FastCompany. 2024. Floating, skyscraper-size wind turbines are the future—and an engineering challenge. (Further description of floating wind turbine types future size). Available online: https://www.fastcompany.com/91067685/floating-wind-turbines-design-types (accessed on 17 October 2024).
- Saadallah, N., Randeberg, E. 2020. Dynamic repositioning in floating wind farms. NORCE Energy.
- DNVGL. 2020. Overview of offshore wind standards and certification requirements in selected countries. Report: 2020-1194, Rev. 01.
- Boru, M. E. 2021. VIV Fatigue of dynamic power cables applied in offshore wind turbines. Master thesis. NTNU.
- Souza, C. E., Engebretsen, E., Bachynski-Polić, E., Lene, E., Berthelsen, P. A., Haslum, H. 2021. Definition of the INO WINDMOOR 12 MW base case floating wind turbine.
- Chrolenko, M. 2013. Dynamic Analysis and Design of Mooring Lines. Master thesis (NTNU).
- IEA WIND. 2020. Definition of the UMaine VolturnUS-S Reference Platform Developed for the IEA Wind 15 Megawatt Offshore Reference Wind Turbine. Technical Report.
- Tian, Z., Shi, W., Li, X., Park, Y., Jiang, Z., Wu, J. 2025. Numerical simulations of floating offshore wind turbines with shared mooring under current-only conditions. Renewable Energy, Volume 238, 121918, ISSN 0960-1481. [CrossRef]
- Pegalajar-Jurado, A. Pegalajar-Jurado, A., Bredmose, H., Borg, M., Straume, J. G., Landbø, T., Andersen, H. S., Yu, W., Müller, K., Lemmer, F. 2018. State-of-the-art model for the LIFES50+ OO-Star Wind Floater Semi 10MW floating wind turbine. J. Phys.: Conf. Ser. 1104 012024. [CrossRef]
- Landbø, T. 2018. "OO-STAR WIND FLOATER THE FUTURE OF OFFSHORE WIND?". EERA DEEPWIND 2018. Presentation.
- Vittori, F. E. 2015. Design and Analysis of Semi-submersible Floating Wind Turbines with focus on Structural Response Reduction. Master Thesis. NTNU.
- Stenlund, T. 2018. Mooring System Design for a Large Floating Wind Turbine in Shallow Water. Master Thesis. NTNU.
- Gao, S., Zhang, L., Shi, W.,Wang, B., Li, X. 2021. Dynamic Responses for WindFloat Floating Offshore Wind Turbine at Intermediate Water Depth Based on Local Conditions in China. Journal of Marine Science and Engineering 9, no. 10: 1093. [CrossRef]
- DNV and Risø. 2002. Guidelines for design of wind turbines. Second Edition.
- DNV. 2021. Floating Offshore Wind Turbine Analysis. Sesam Workshop.
- Myhr, A. 2016. Developing Offshore Floating Wind Turbines: The Tension-Leg-Buoy Design. PhD Thesis. NMBU.
- Fowler, M., Lenfest, E., Viselli, A., Goupee, A., Kimball, R., Bergua, R., Wang, L., Zalkind, D., Wright, A., & Robertson, A. 2023. Wind/Wave Testing of a 1:70-Scale Performance-Matched Model of the IEA Wind 15 MW Reference Wind Turbine with Real-Time ROSCO Control and Floating Feedback. Machines, 11(9), 865. [CrossRef]
- Alexandre, A., Pan, Z. 2024. Frequency domain structural analysis for early design of floating wind systems using Sesam and Bladed. EERA DeepWind conference. 2024. Available online: https://www.sintef.no/globalassets/project/eera-deepwind-2024/presentasjoner/substructures_dnv_pan_new.pdf (accessed on 17 October 2024).
- Christopher, A., Viselli, A., Dagher, H., Goupee, A., Gaertner, E., Abbas, N., Hall, M., Barter, G. 2020. Definition of the UMaine VolturnUS-S Reference Platform Developed for the IEA Wind 15-Megawatt Offshore Reference Wind Turbine. Golden, CO: National Renewable Energy Laboratory. NREL/TP-5000-76773. Available online: https://www.nrel.gov/docs/fy20osti/76773.pdf.
- Leimeister, M., Bachynski-Polić, E., Muskulus, M., Thomas, P. 2016. Design optimization and upscaling of a semi-submersible floating platform. WindEurope Summit Conference.
- SINTEF Ocean AS. 2021. Definition of the INOWINDMOOR 12MW base case floating wind turbine. OC2020 A-044- Unrestricted. Report.
- Gaertner, E., Rinker, J., Sethuraman, L., Zahle, F., Anderson, B., Barter, G., Abbas, N., Meng, F., Bortolotti, P., Skrzypinski, W., Scott, G., Feil, R., Bredmose, H., Dykes, K., Shields, M., Allen, C., Viselli, A. 2020. Definition of the IEA 15-Megawatt Offshore Reference Wind. Golden, CO: National Renewable Energy Laboratory. NREL/TP-5000-75698. Available online: https://www.nrel.gov/docs/fy20osti/75698.pdf.
- Bussemakers, P. J. M. 2020. Validation of aero-hydro-servo-elastic load and motion simulations in BHawC/OrcaFlex for the Hywind Scotland floating offshore wind farm. Master thesis. NTNU. 2024. Available online: https://ntnuopen.ntnu.no/ntnu-xmlui/handle/11250/2780185 (accessed on 17 October 2024).
- Jonkman, J., Matha, D. 2010. A Quantitative Comparison of the Responses of Three Floating Platforms. Conference Paper NREL/CP-500-46726.
- Ojo, A., Collu, M., Coraddu, A. 2022. Parametrisation Scheme for Multidisciplinary Design Analysis and Optimisation of a Floating Offshore Wind Turbine Substructure – OC3 5MW Case Study. Phys.: Conf. Ser. 2265-042009. [CrossRef]
- DTU Wind Energy. 2013. Description of the DTU 10 MW Reference Wind Turbine. Report-I-0092.
- Johannessen, M. 2018. Concept Study and Design of Floating Offshore Wind Turbine Support Structure. DEGREE PROJECT MECHANICAL ENGINEERING.
- Tian, X. 2016. Design, Numerical Modelling and Analysis of TLP Floater Supporting the DTU 10MW Wind Turbine. Master thesis. NTNU.
- Wang, Q. 2014. Design of a Steel Pontoon-type Semi-submersible Floater Supporting the DTU 10MW Reference Turbine. TU Delft. Master thesis.
- Xue, W. 2016. Design, numerical modelling and analysis of a spar floater supporting the DTU 10MW wind turbine. Master thesis. NTNU.
- Xuwen, W. 2019. Dynamic Analysis of Floating Wind Turbines Subjected to Deterministic Wind Gust. Master Thesis. NTNU.
- Boge, S. N., Ekerhovd, D. W. 2022. A Hydro-Aerodynamic Analysis of a Floating Offshore Wind Turbine to Assist in Floater Selection. Master Thesis. NTNU.
- Neuenkirchen Godø, S. 2013. Dynamic Response of Floating Wind Turbines. Master thesis. NTNU.
Figure 1.
Four main floating wind turbine concepts. From left to right: barge, semi-submersible, spar, and TLP. The authors designed the figure in accordance with the information presented in [43,44].
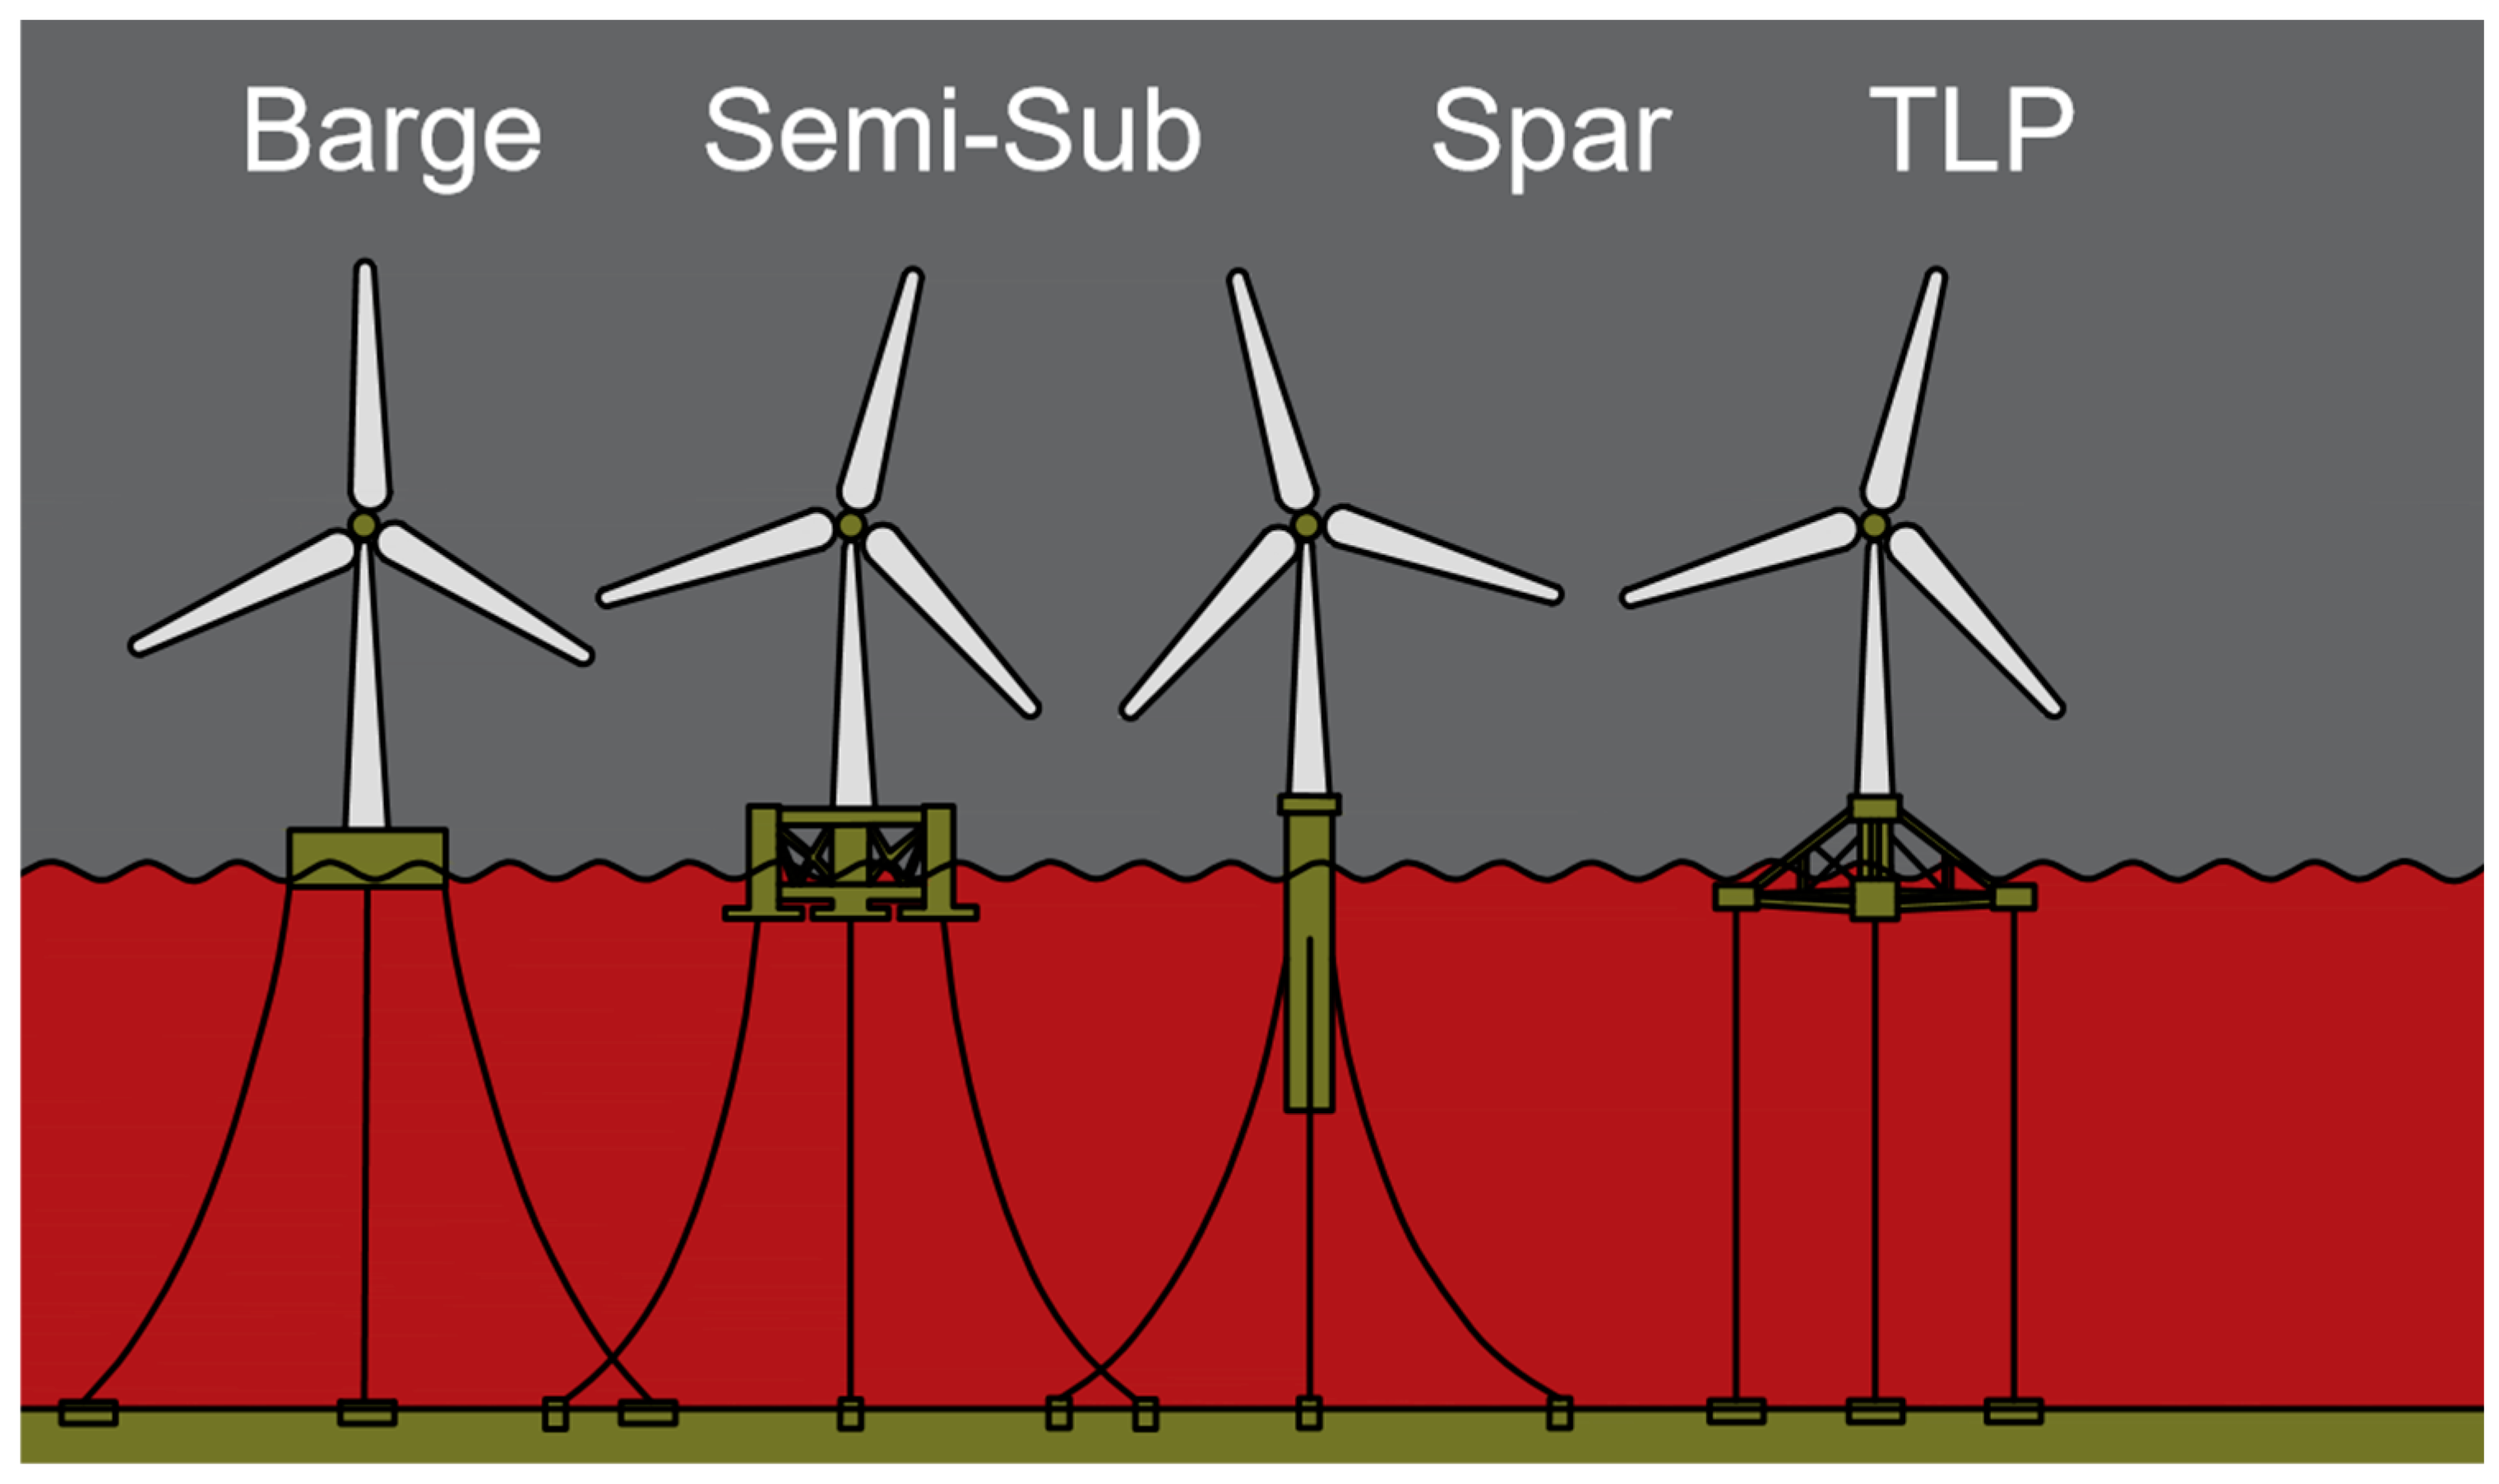
Figure 2.
OO-Star upwind semi-submersible floating wind turbine with 10 MW power capacity and 130 m water depth. The authors processed the figure in accordance with the information presented in [45].
Figure 2.
OO-Star upwind semi-submersible floating wind turbine with 10 MW power capacity and 130 m water depth. The authors processed the figure in accordance with the information presented in [45].
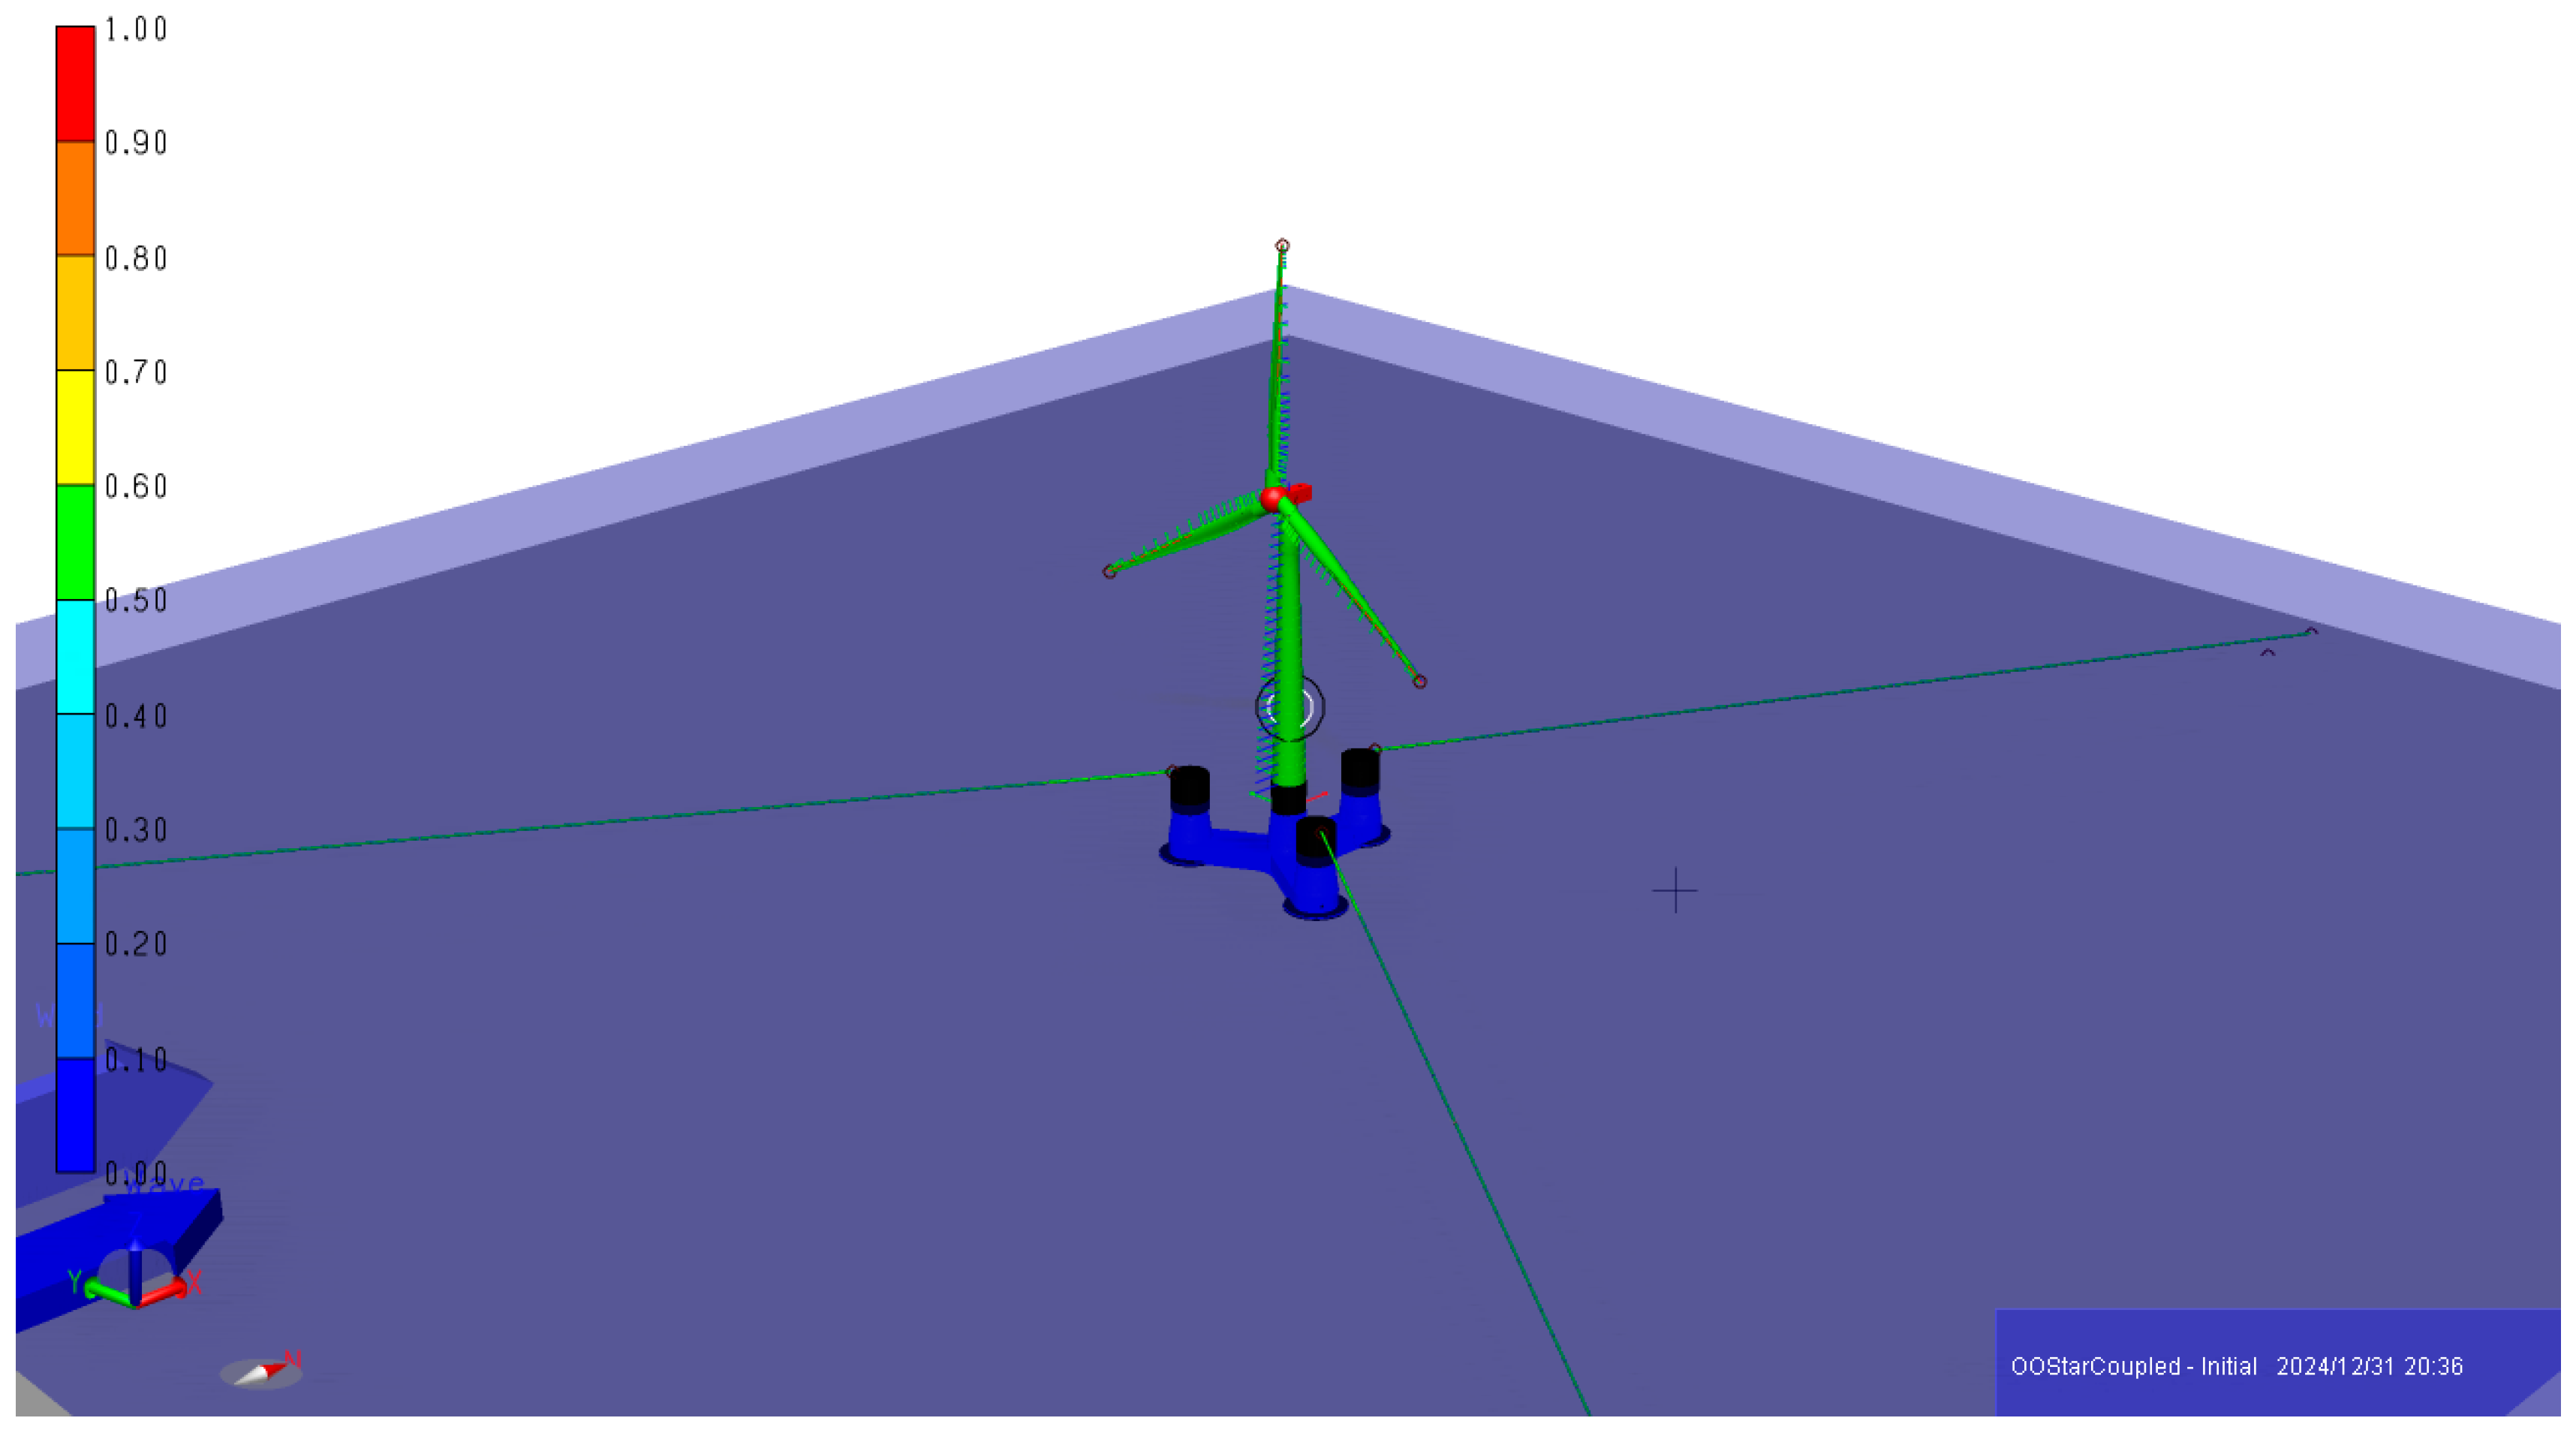
Figure 3.
CSC upwind semi-submersible floating wind turbine with 10 MW power capacity and 200 m water depth. The authors processed the figure in accordance with the information presented in [45].
Figure 3.
CSC upwind semi-submersible floating wind turbine with 10 MW power capacity and 200 m water depth. The authors processed the figure in accordance with the information presented in [45].
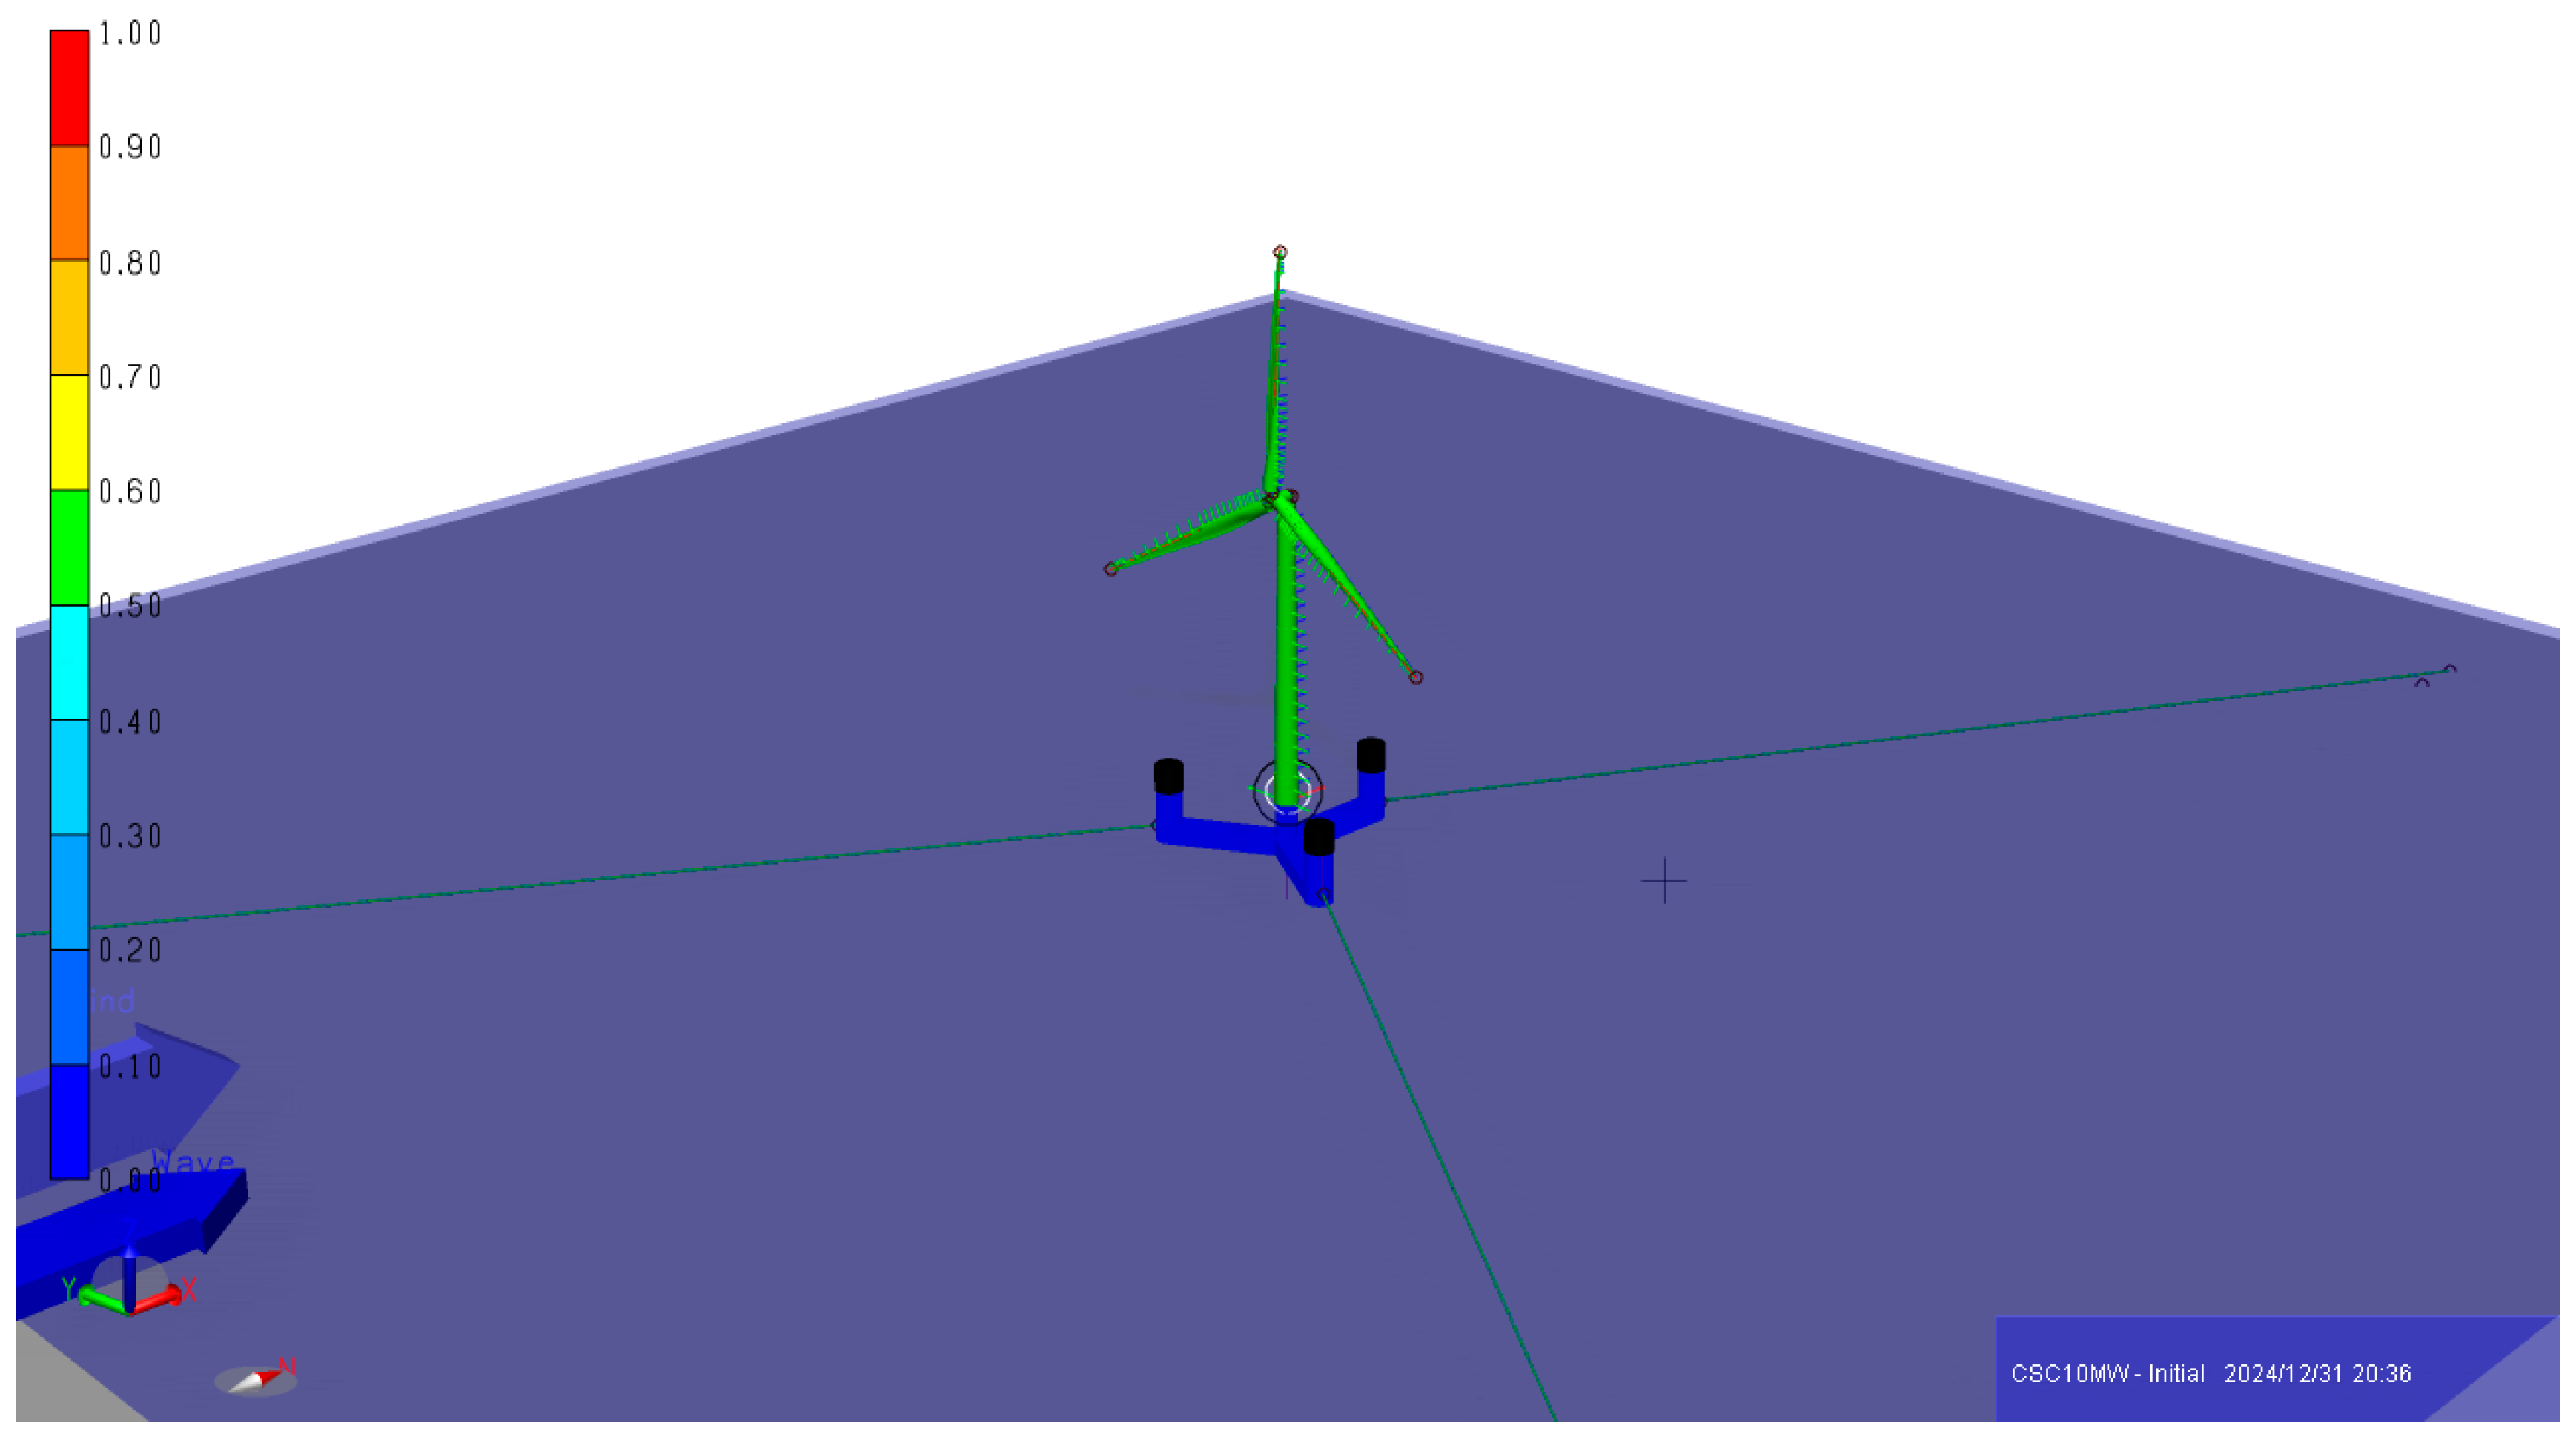
Figure 4.
WindFloat upwind semi-submersible floating wind turbine with 10 MW power capacity and 200 m water depth. The authors processed the figure in accordance with the information presented in [45].
Figure 4.
WindFloat upwind semi-submersible floating wind turbine with 10 MW power capacity and 200 m water depth. The authors processed the figure in accordance with the information presented in [45].
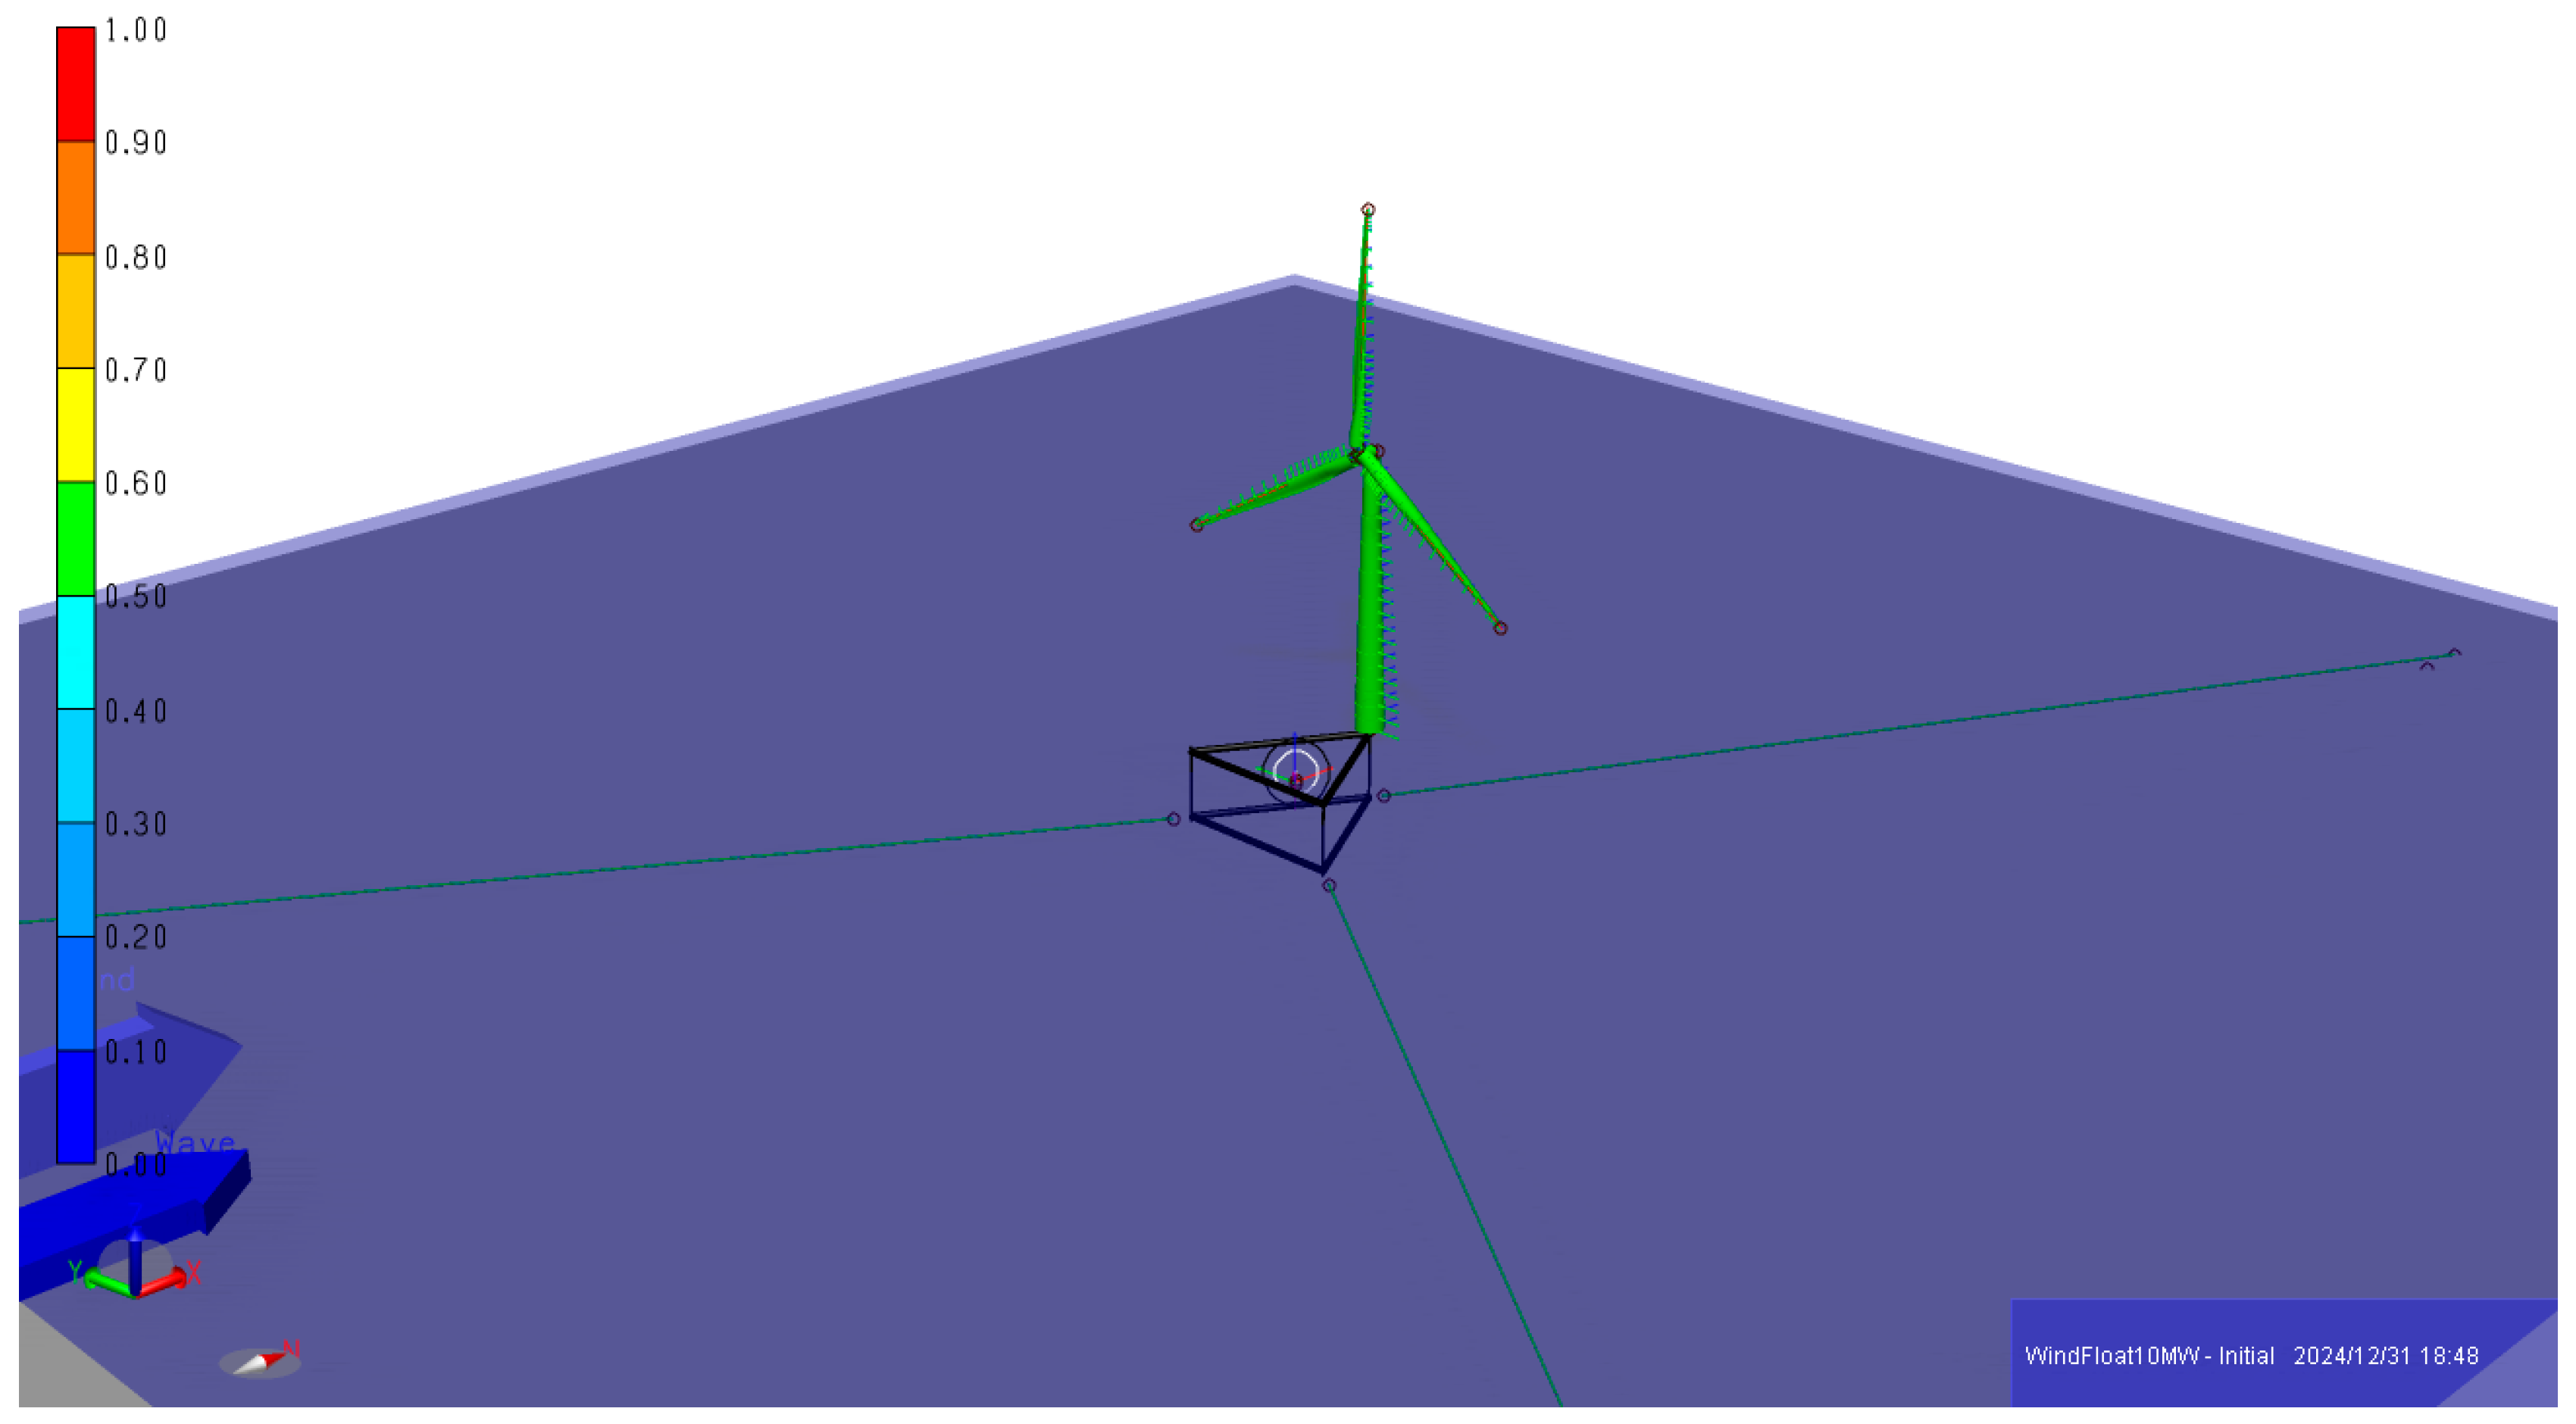
Figure 5.
DTU Spar 1 upwind floating wind turbine with 10 MW power capacity and 320 m water depth and support structure’s height of 108 m. The authors processed the figure in accordance with the information presented in [45].
Figure 5.
DTU Spar 1 upwind floating wind turbine with 10 MW power capacity and 320 m water depth and support structure’s height of 108 m. The authors processed the figure in accordance with the information presented in [45].
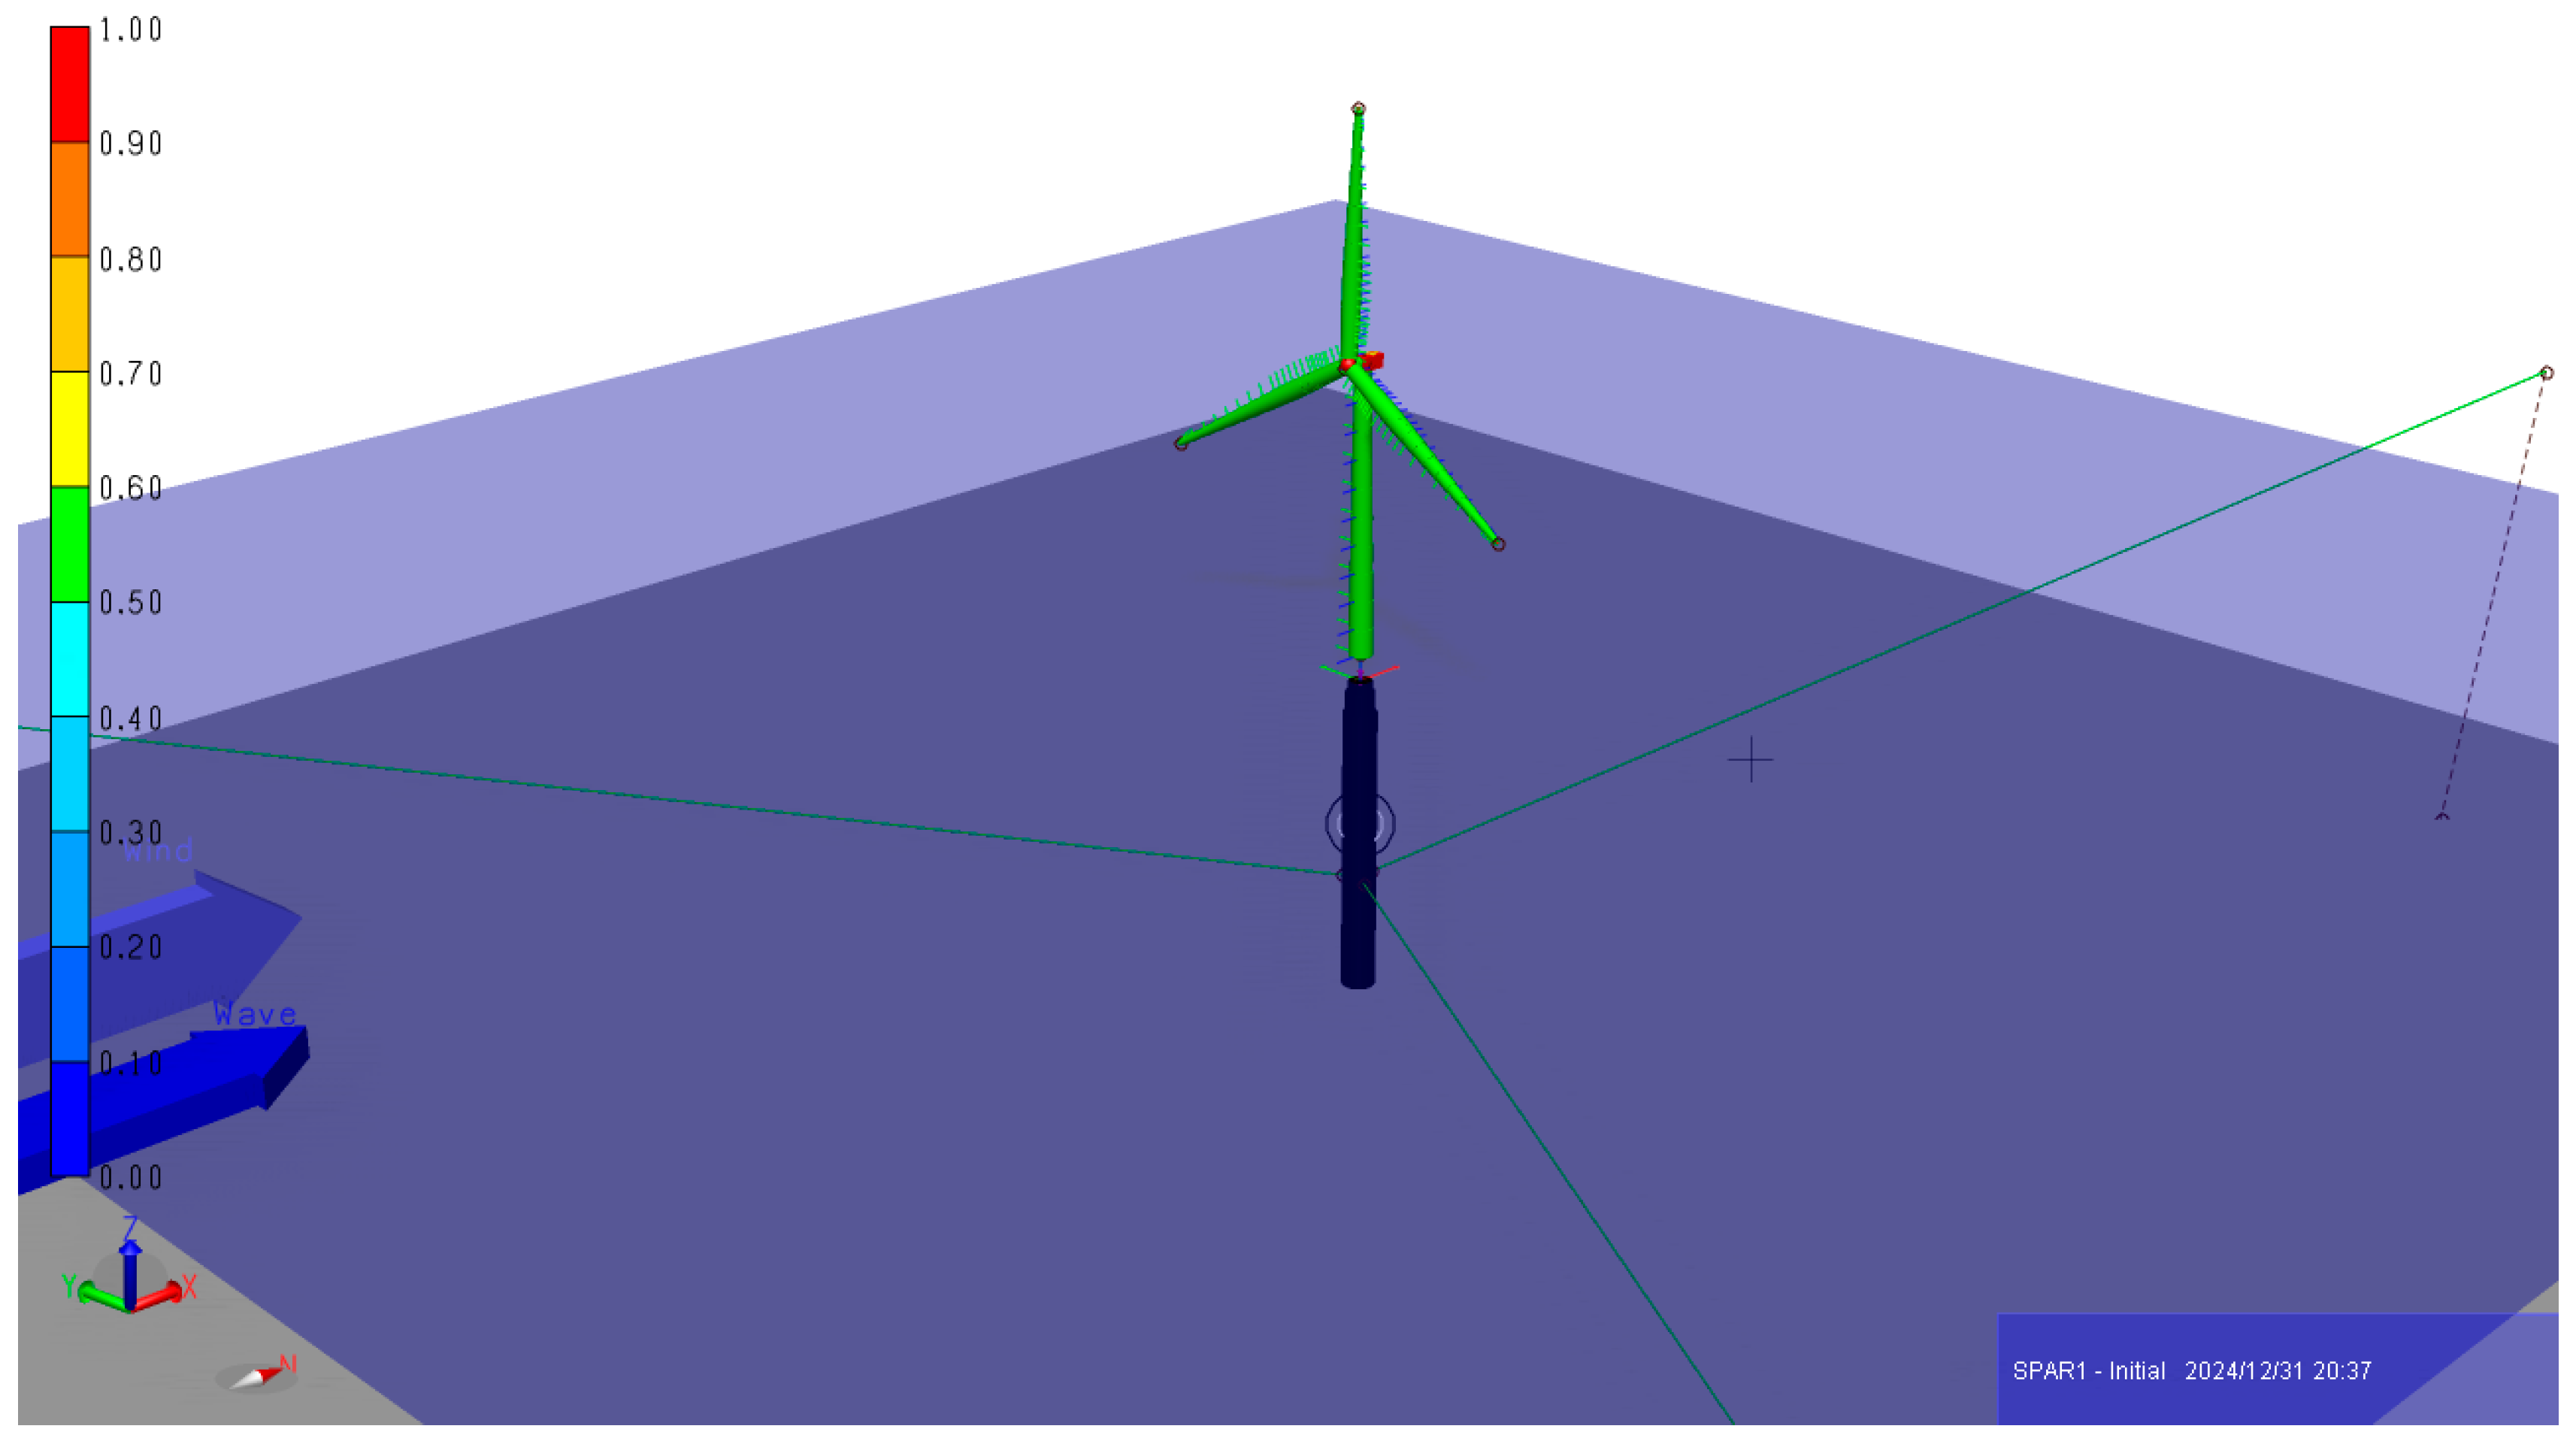
Figure 6.
DTU Spar 2 upwind floating wind turbine with 10 MW power capacity and 320 m water depth and support structure’s height of 78 m. The authors processed the figure in accordance with the information presented in [45].
Figure 6.
DTU Spar 2 upwind floating wind turbine with 10 MW power capacity and 320 m water depth and support structure’s height of 78 m. The authors processed the figure in accordance with the information presented in [45].
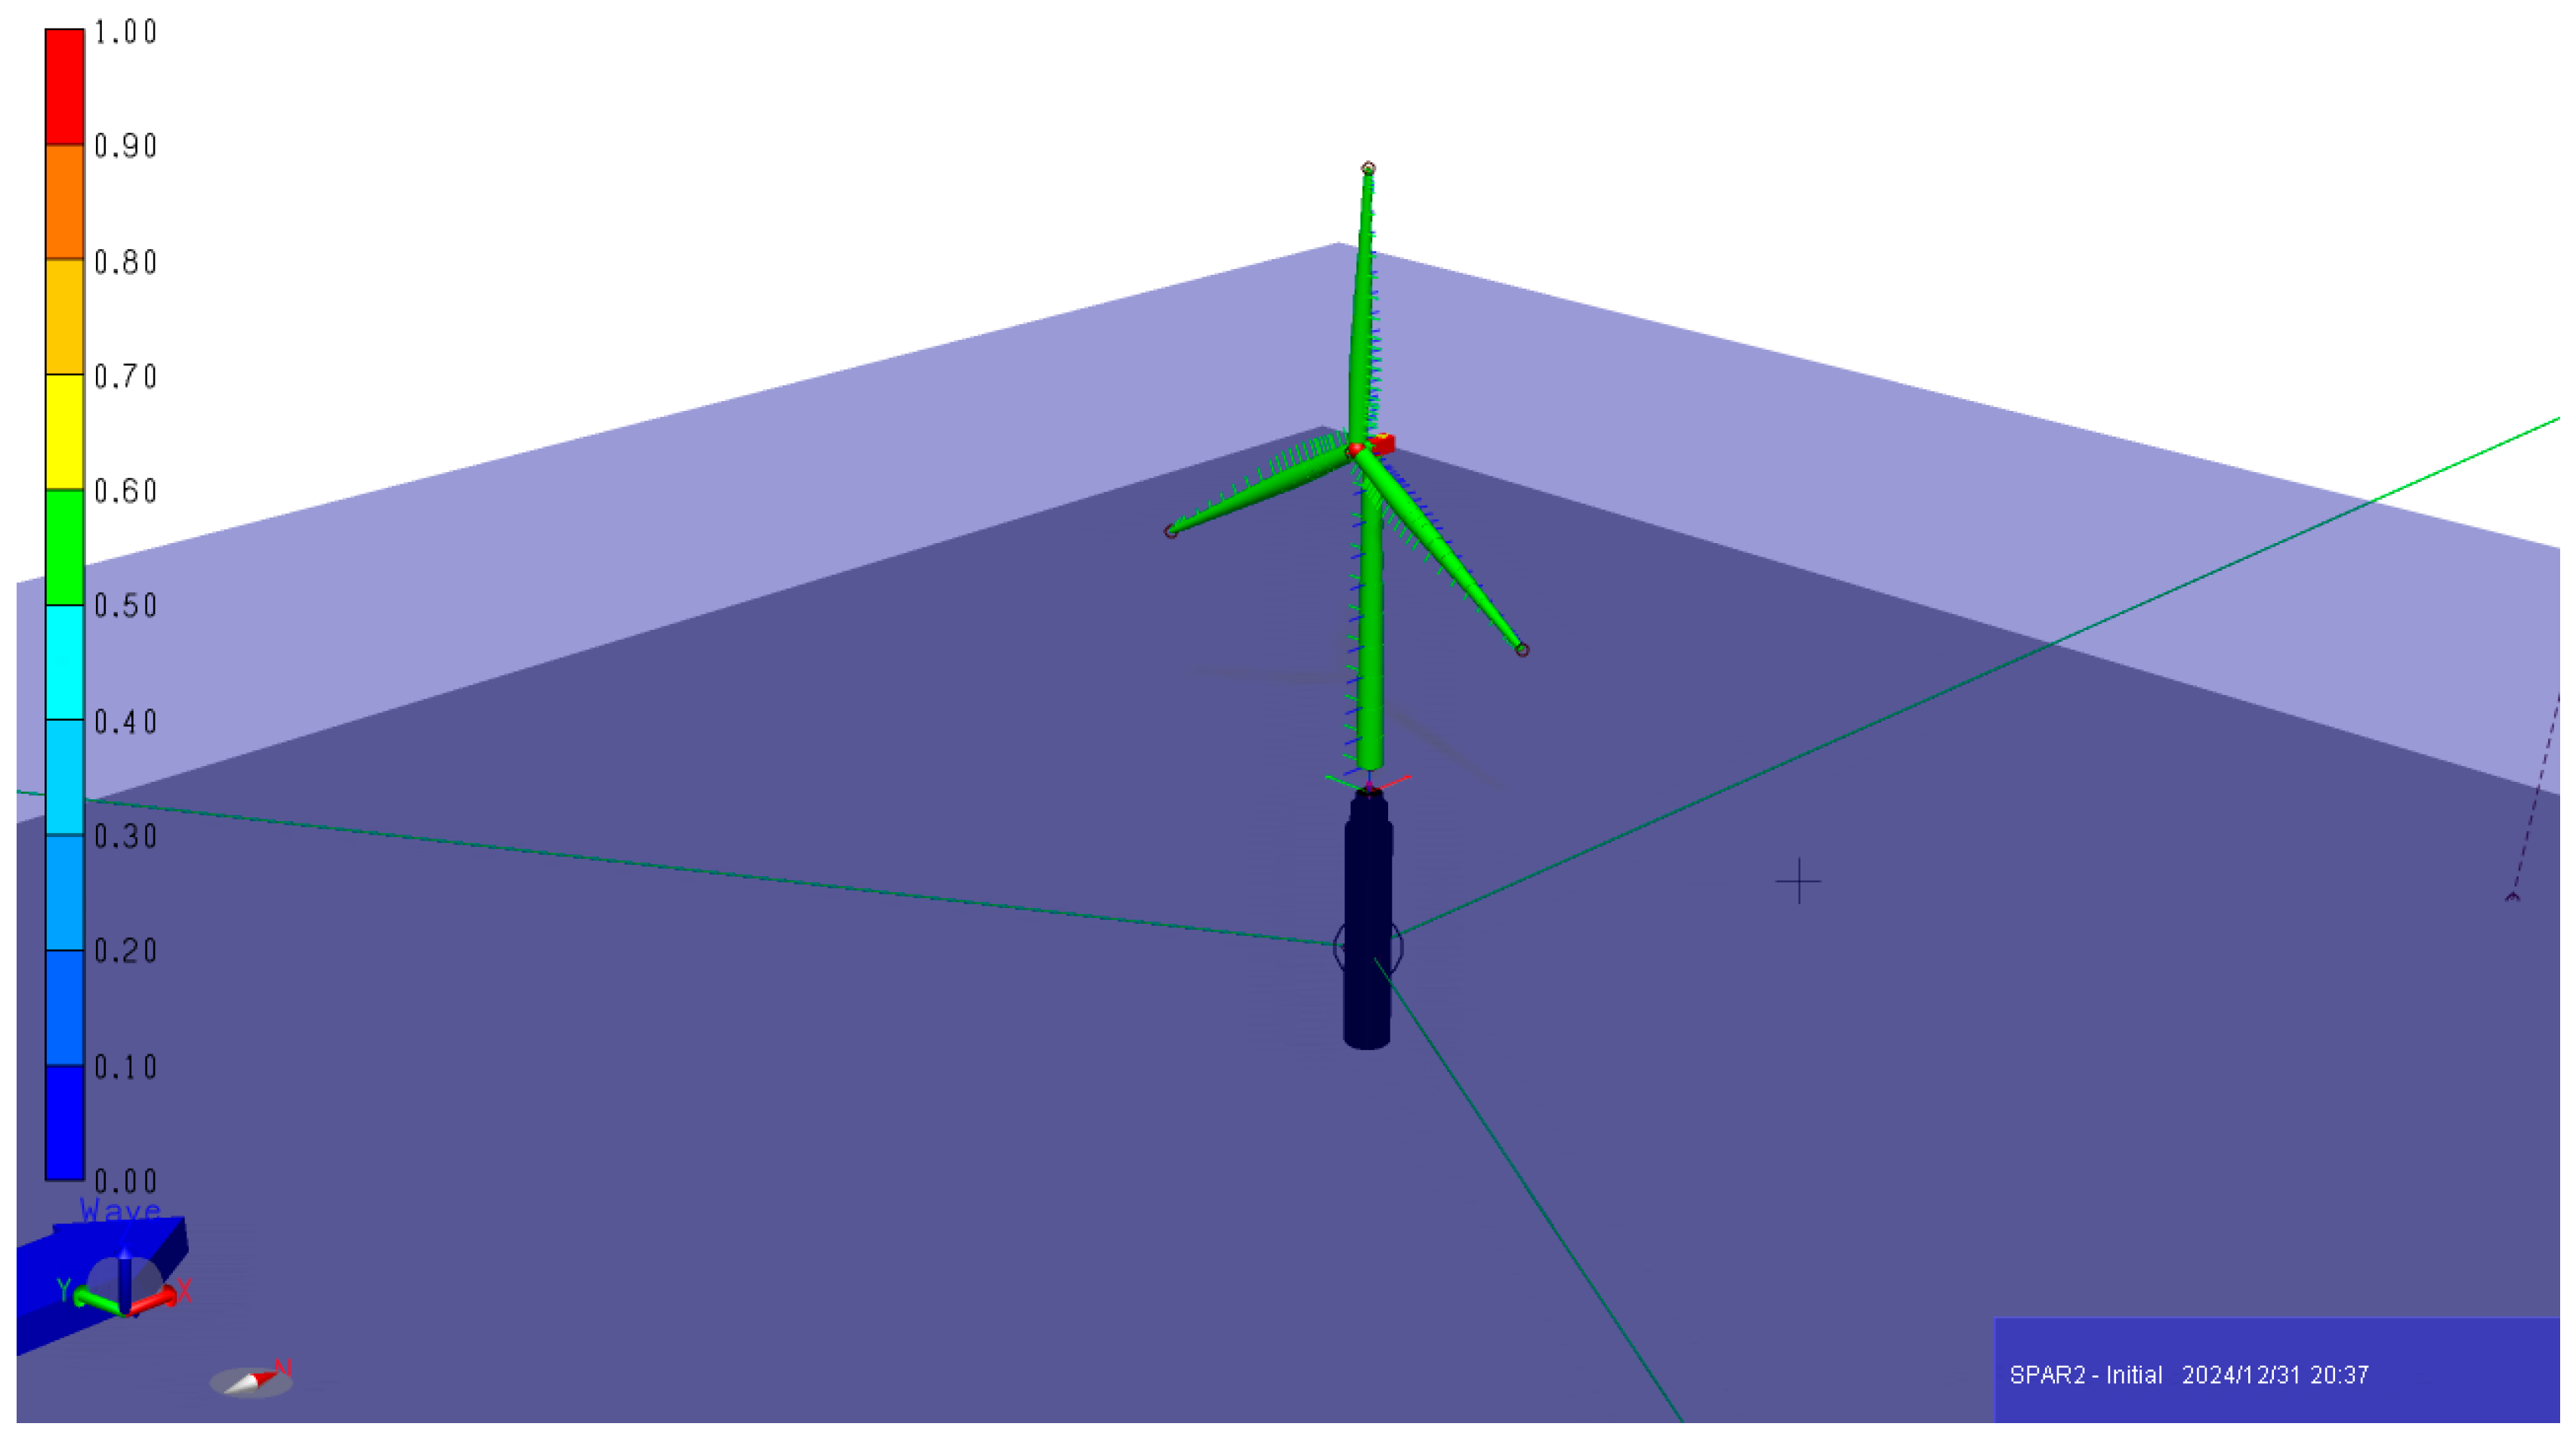
Figure 7.
TLPWT upwind floating wind turbine with 10 MW power capacity and 200 m water depth. The authors processed the figure in accordance with the information presented in [45].
Figure 7.
TLPWT upwind floating wind turbine with 10 MW power capacity and 200 m water depth. The authors processed the figure in accordance with the information presented in [45].
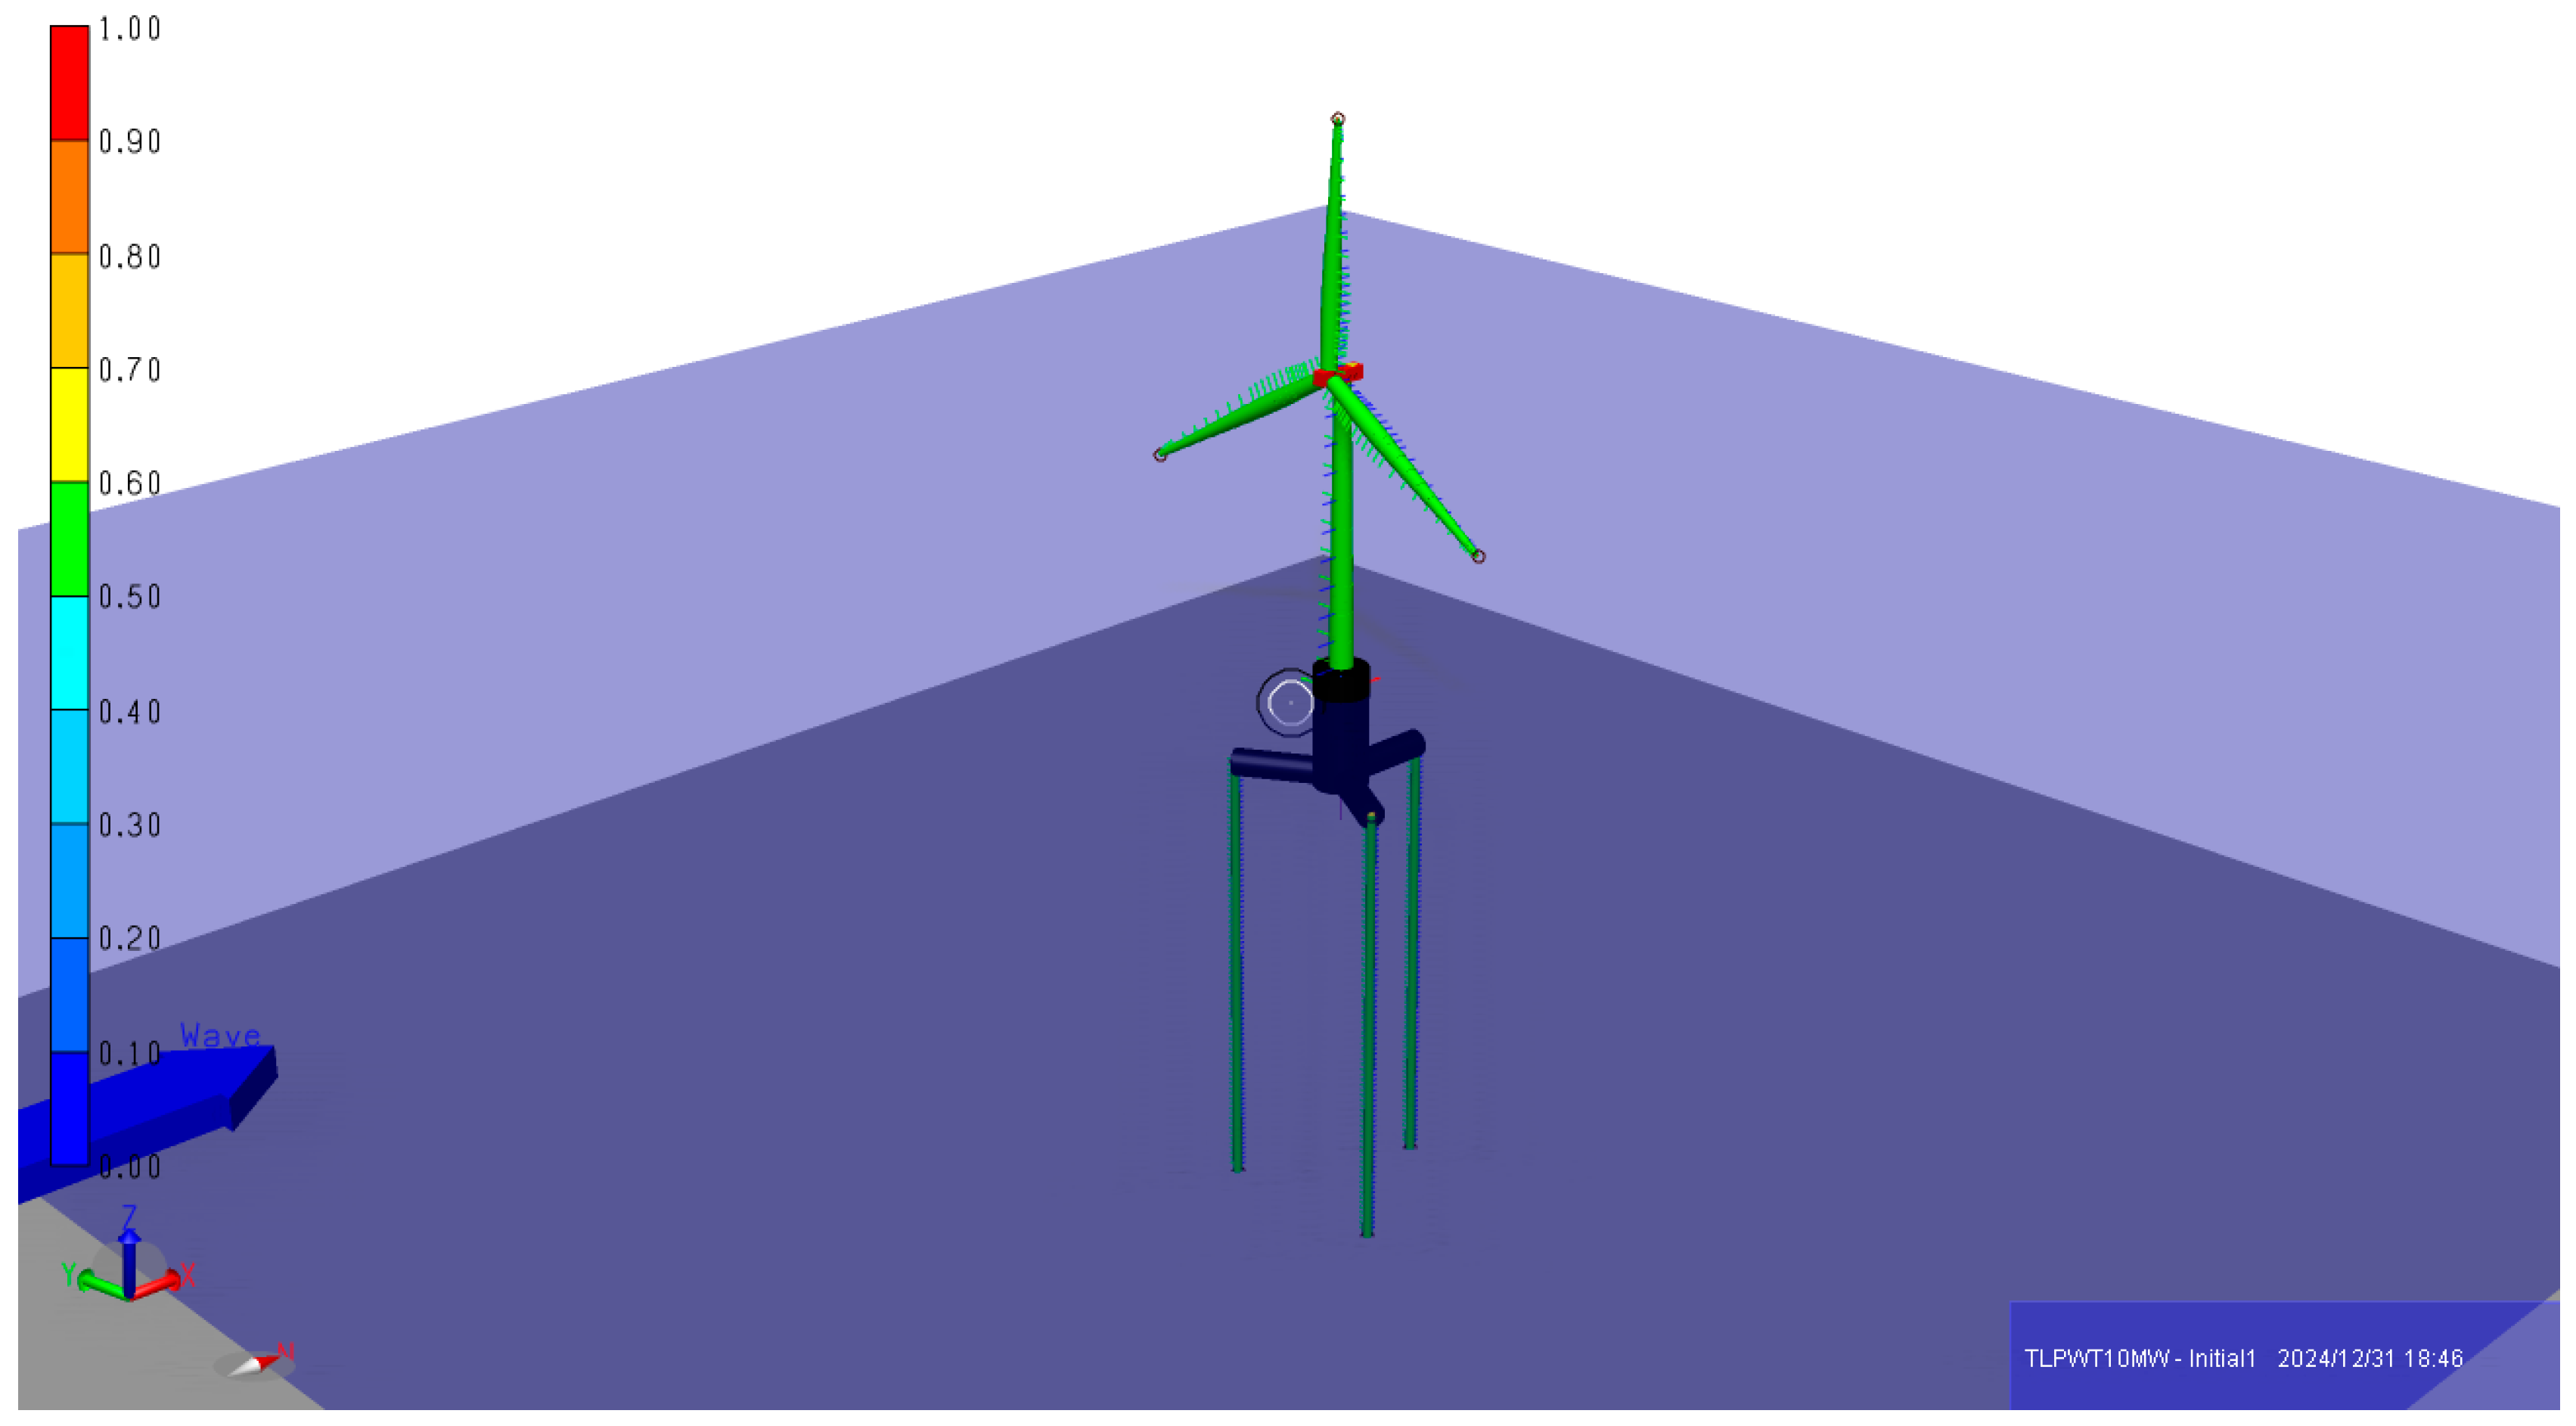
Figure 8.
INO-WINDMOOR downwind semi-submersible floating wind turbine with 12 MW power capacity and 150 m water depth. The authors processed the figure in accordance with the information presented in [45].
Figure 8.
INO-WINDMOOR downwind semi-submersible floating wind turbine with 12 MW power capacity and 150 m water depth. The authors processed the figure in accordance with the information presented in [45].
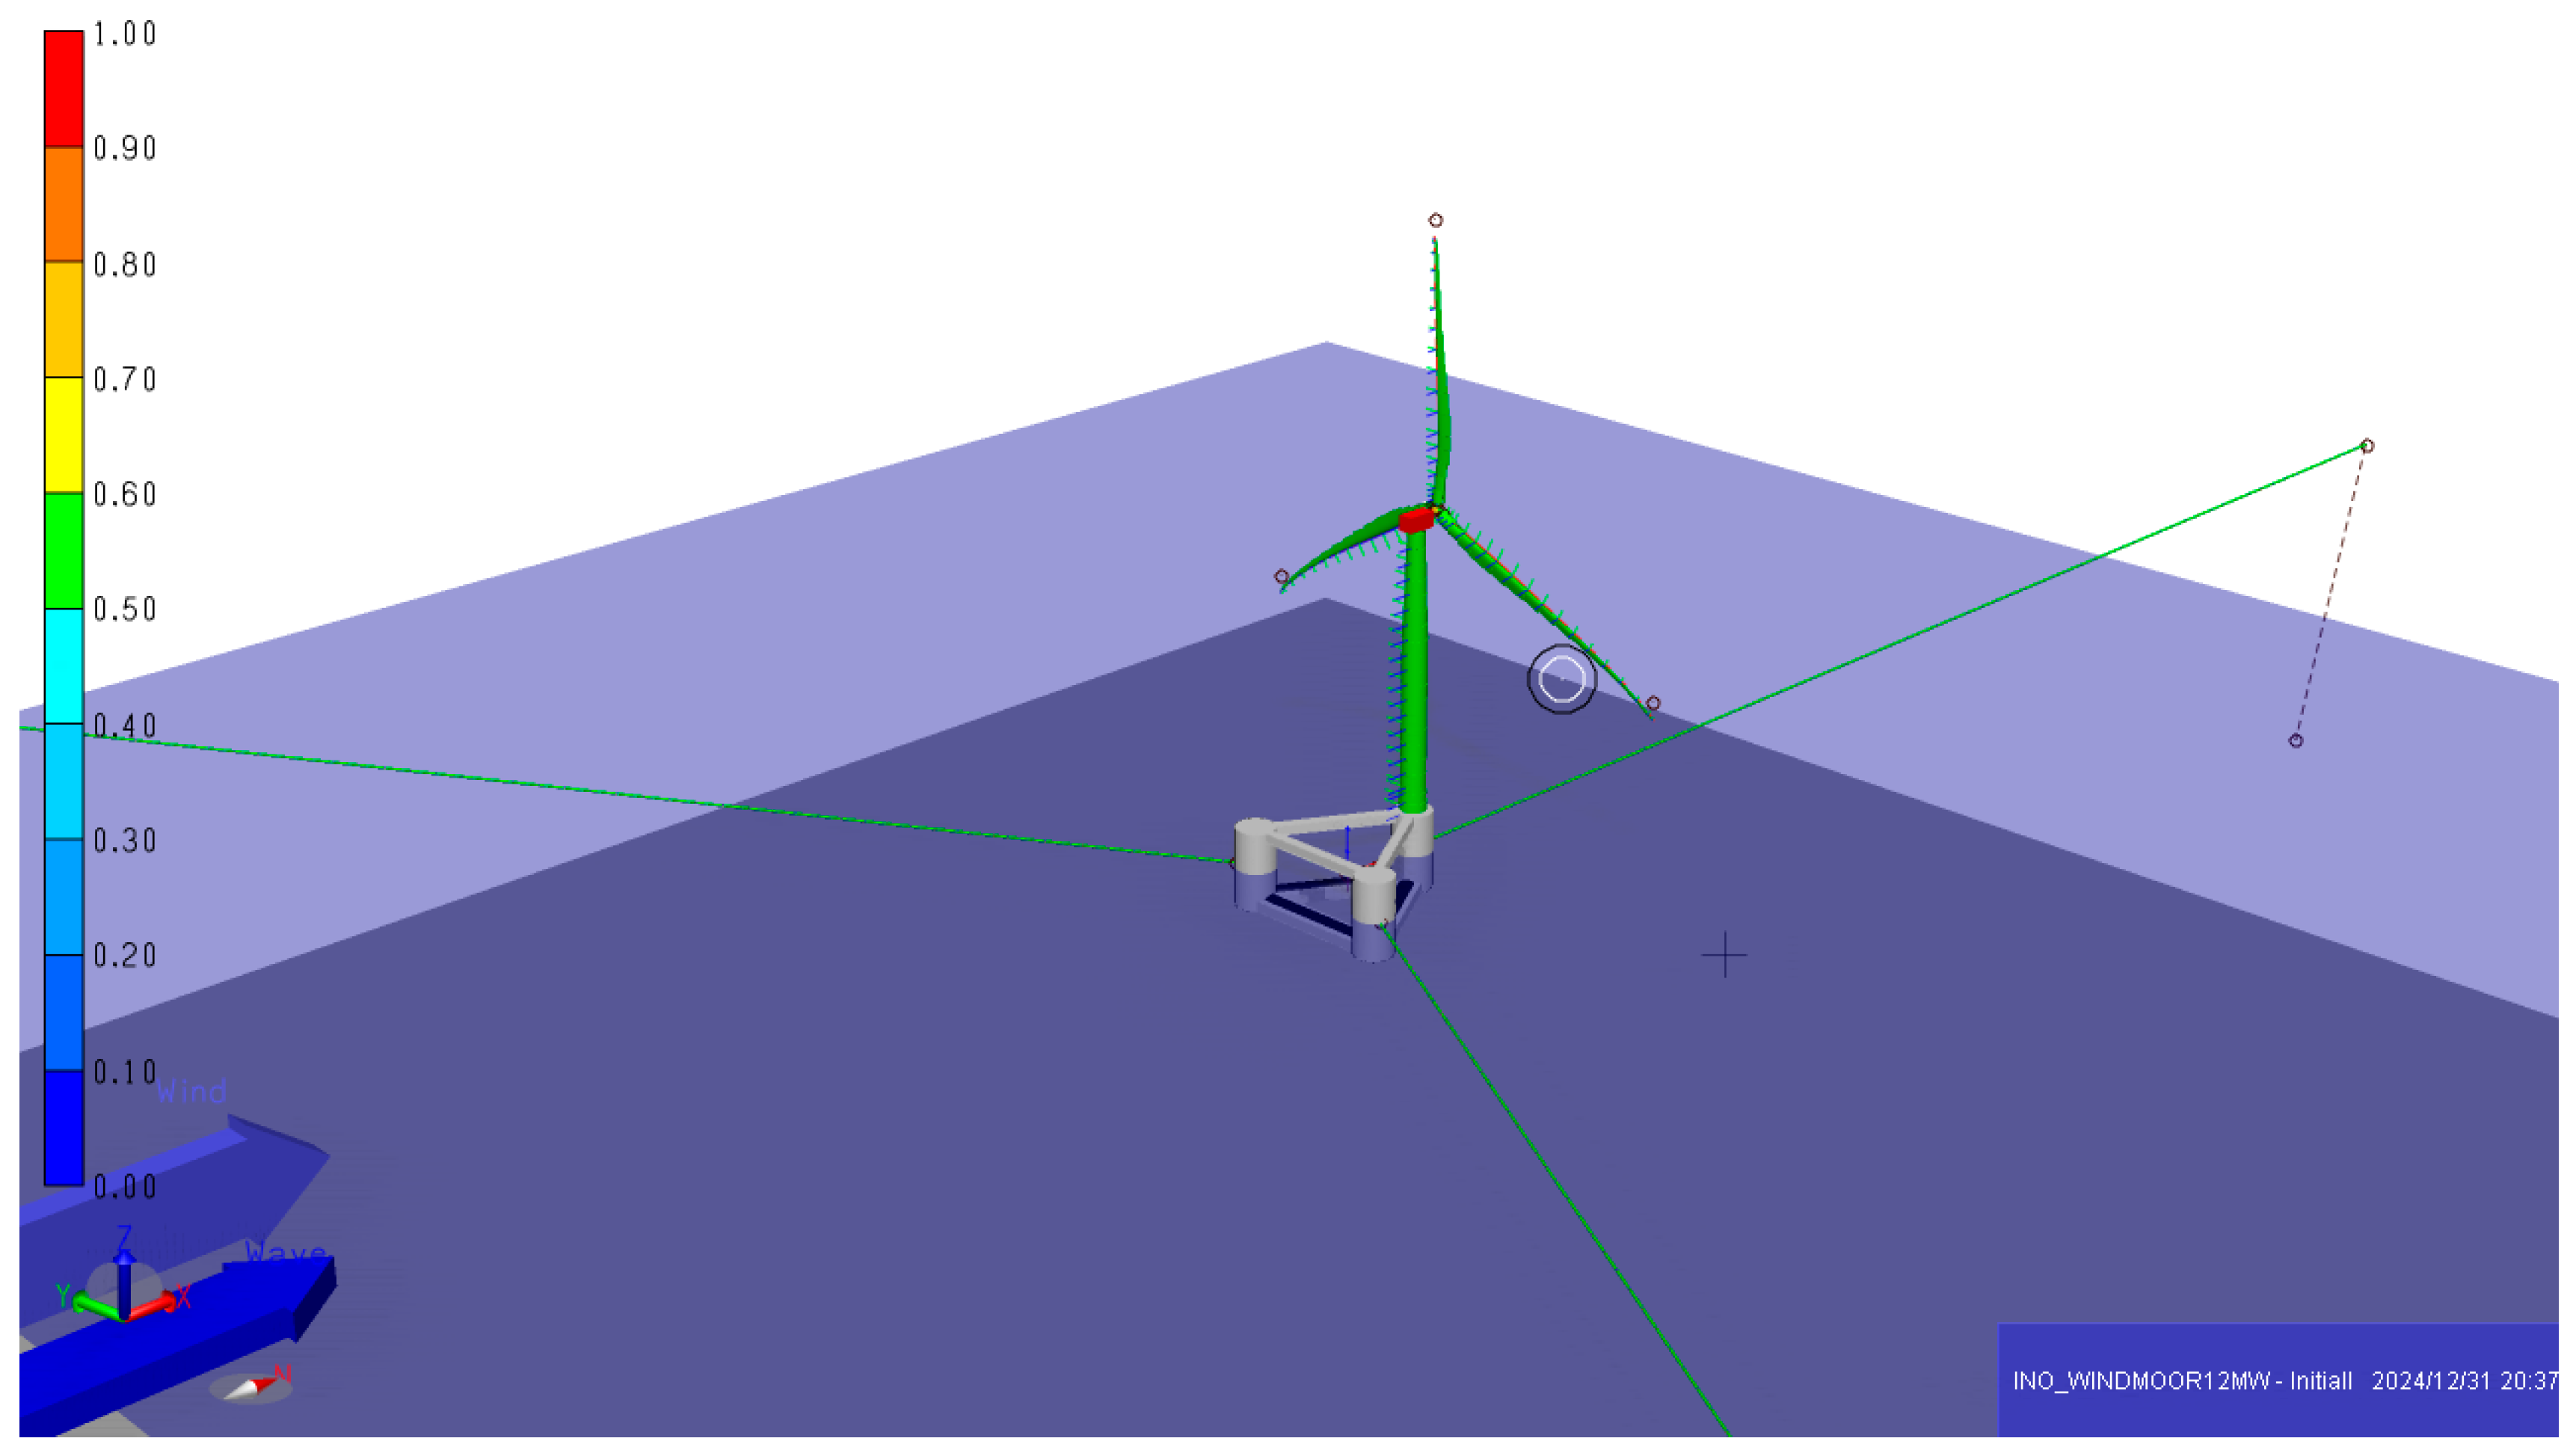
Figure 9.
UMaine VolturnUS-S upwind semi-submersible floating wind turbine with 15 MW power capacity and 200 m water depth. The authors processed the figure in accordance with the information presented in [45].
Figure 9.
UMaine VolturnUS-S upwind semi-submersible floating wind turbine with 15 MW power capacity and 200 m water depth. The authors processed the figure in accordance with the information presented in [45].
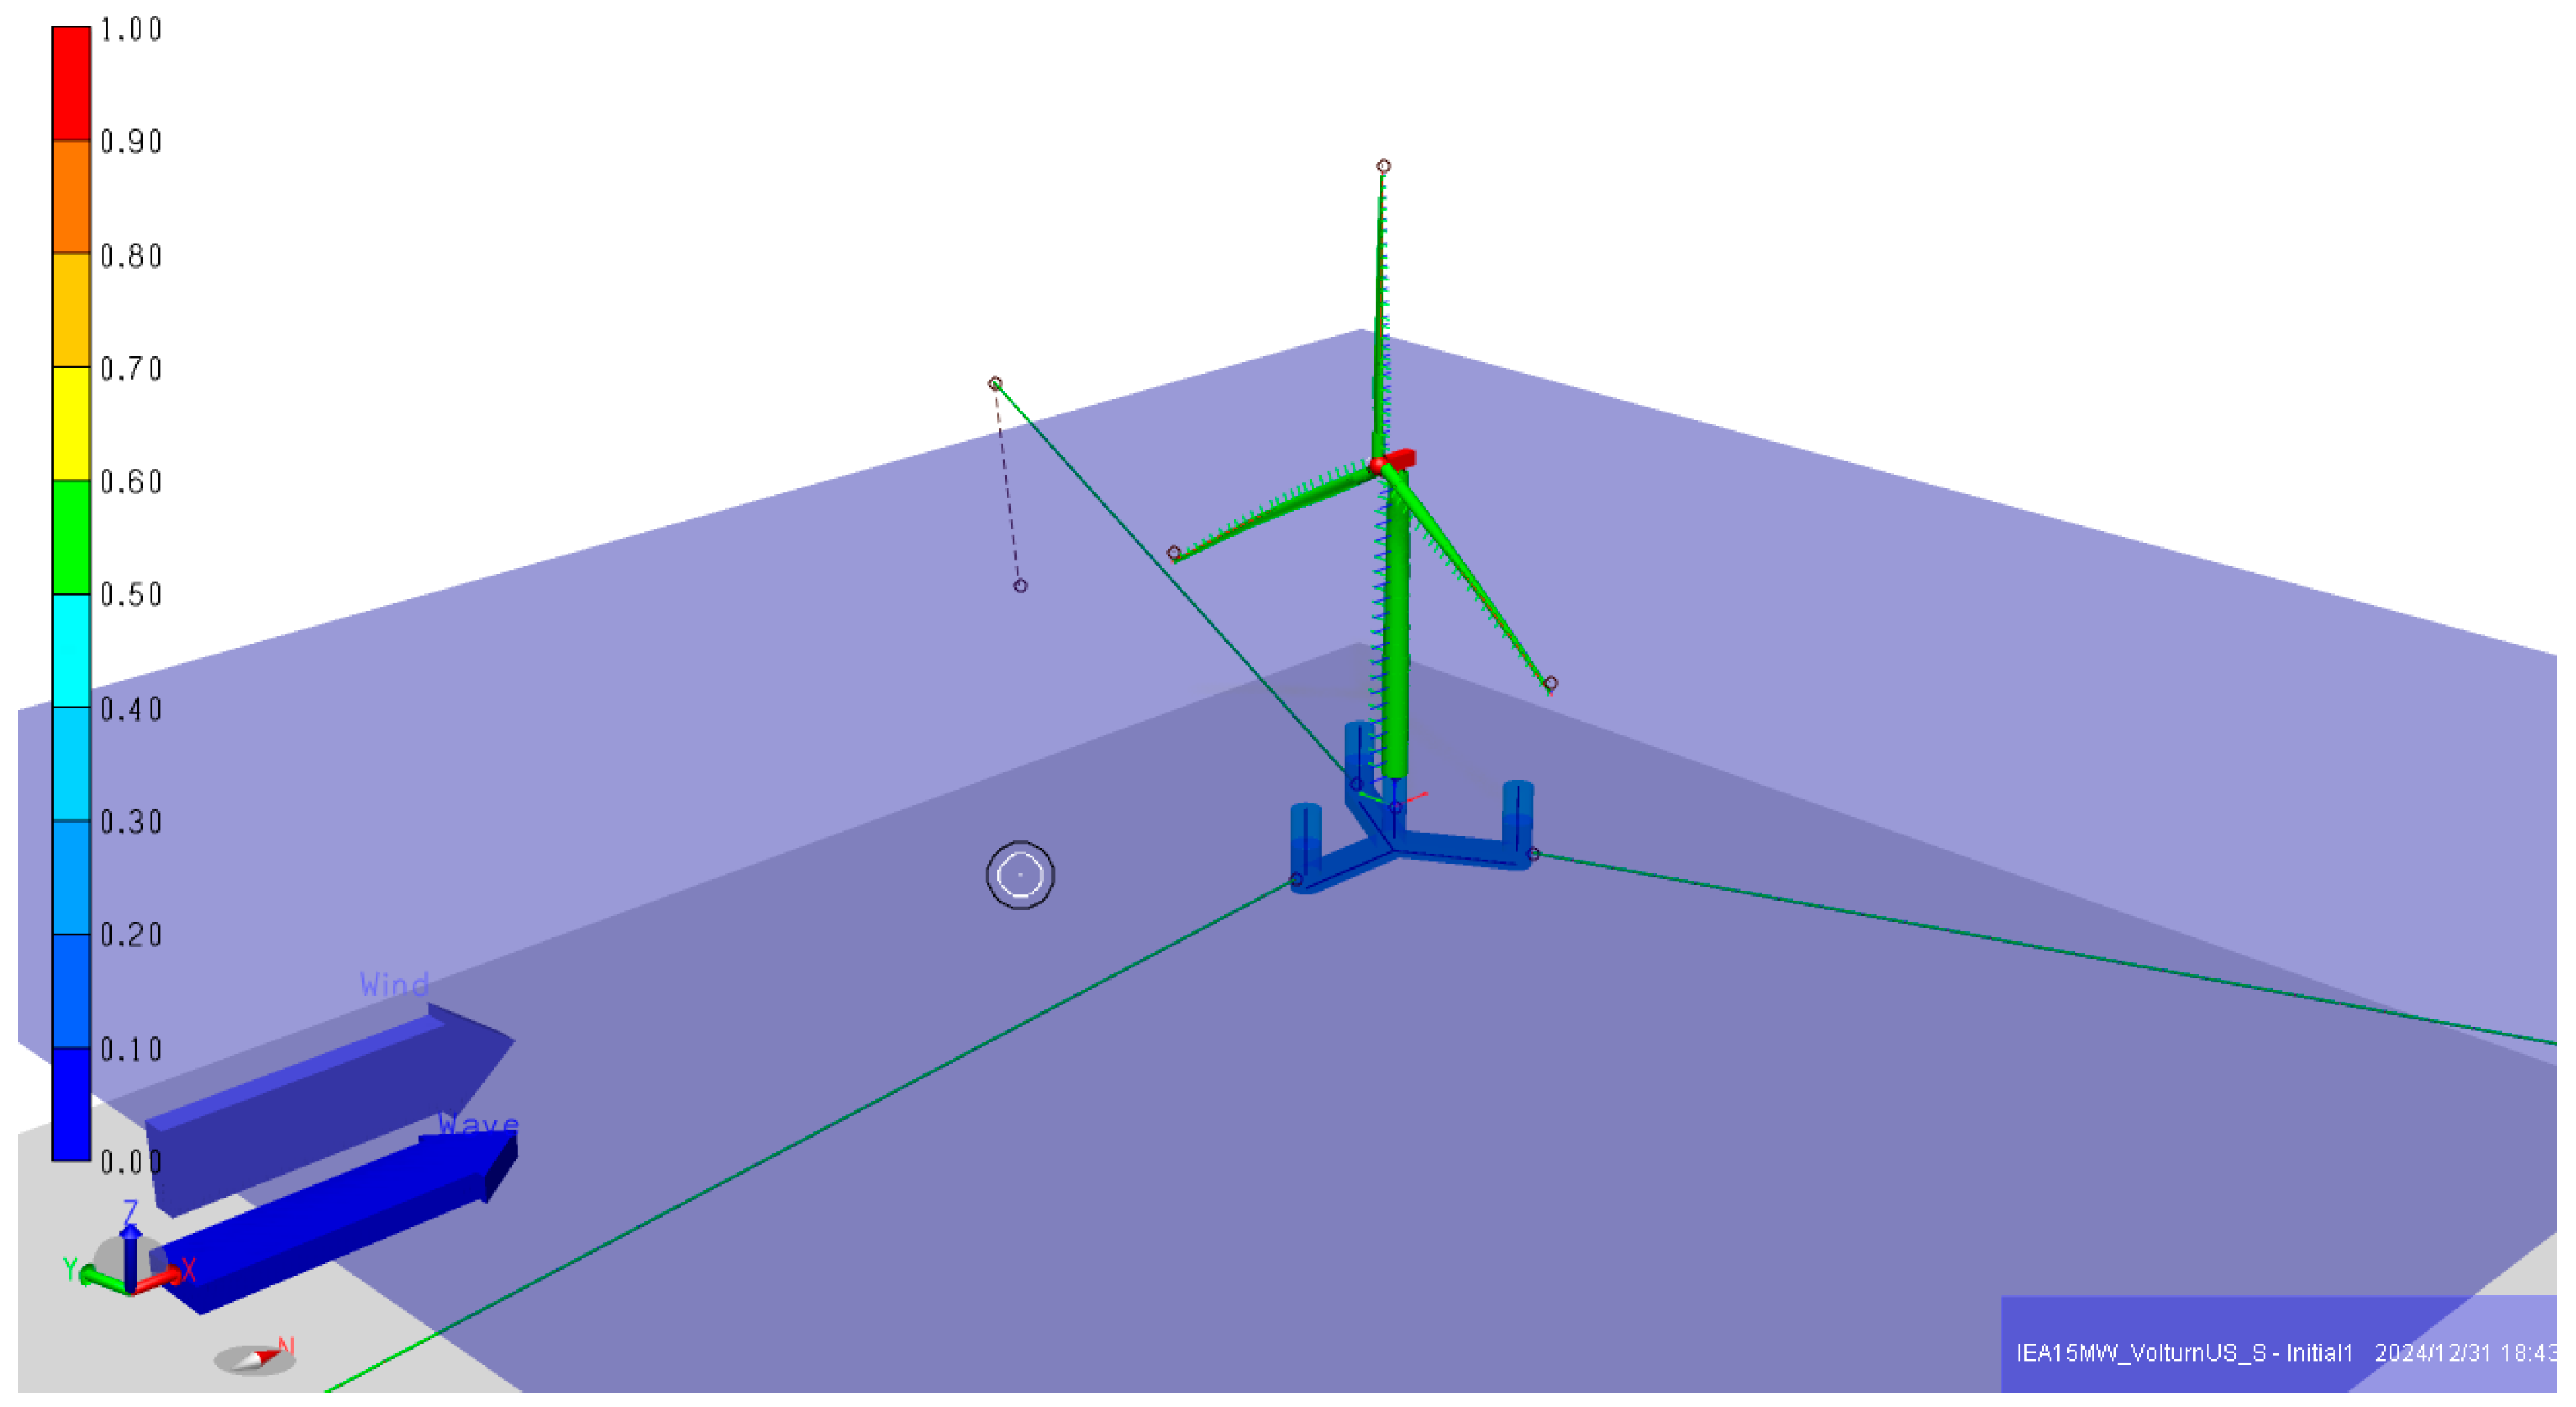
Figure 10.
10 MW Surge graph representing the data presented in Table 2 (x-axis: different wind speeds (m/s), y-axis: Surge offset (m)).
Figure 10.
10 MW Surge graph representing the data presented in Table 2 (x-axis: different wind speeds (m/s), y-axis: Surge offset (m)).
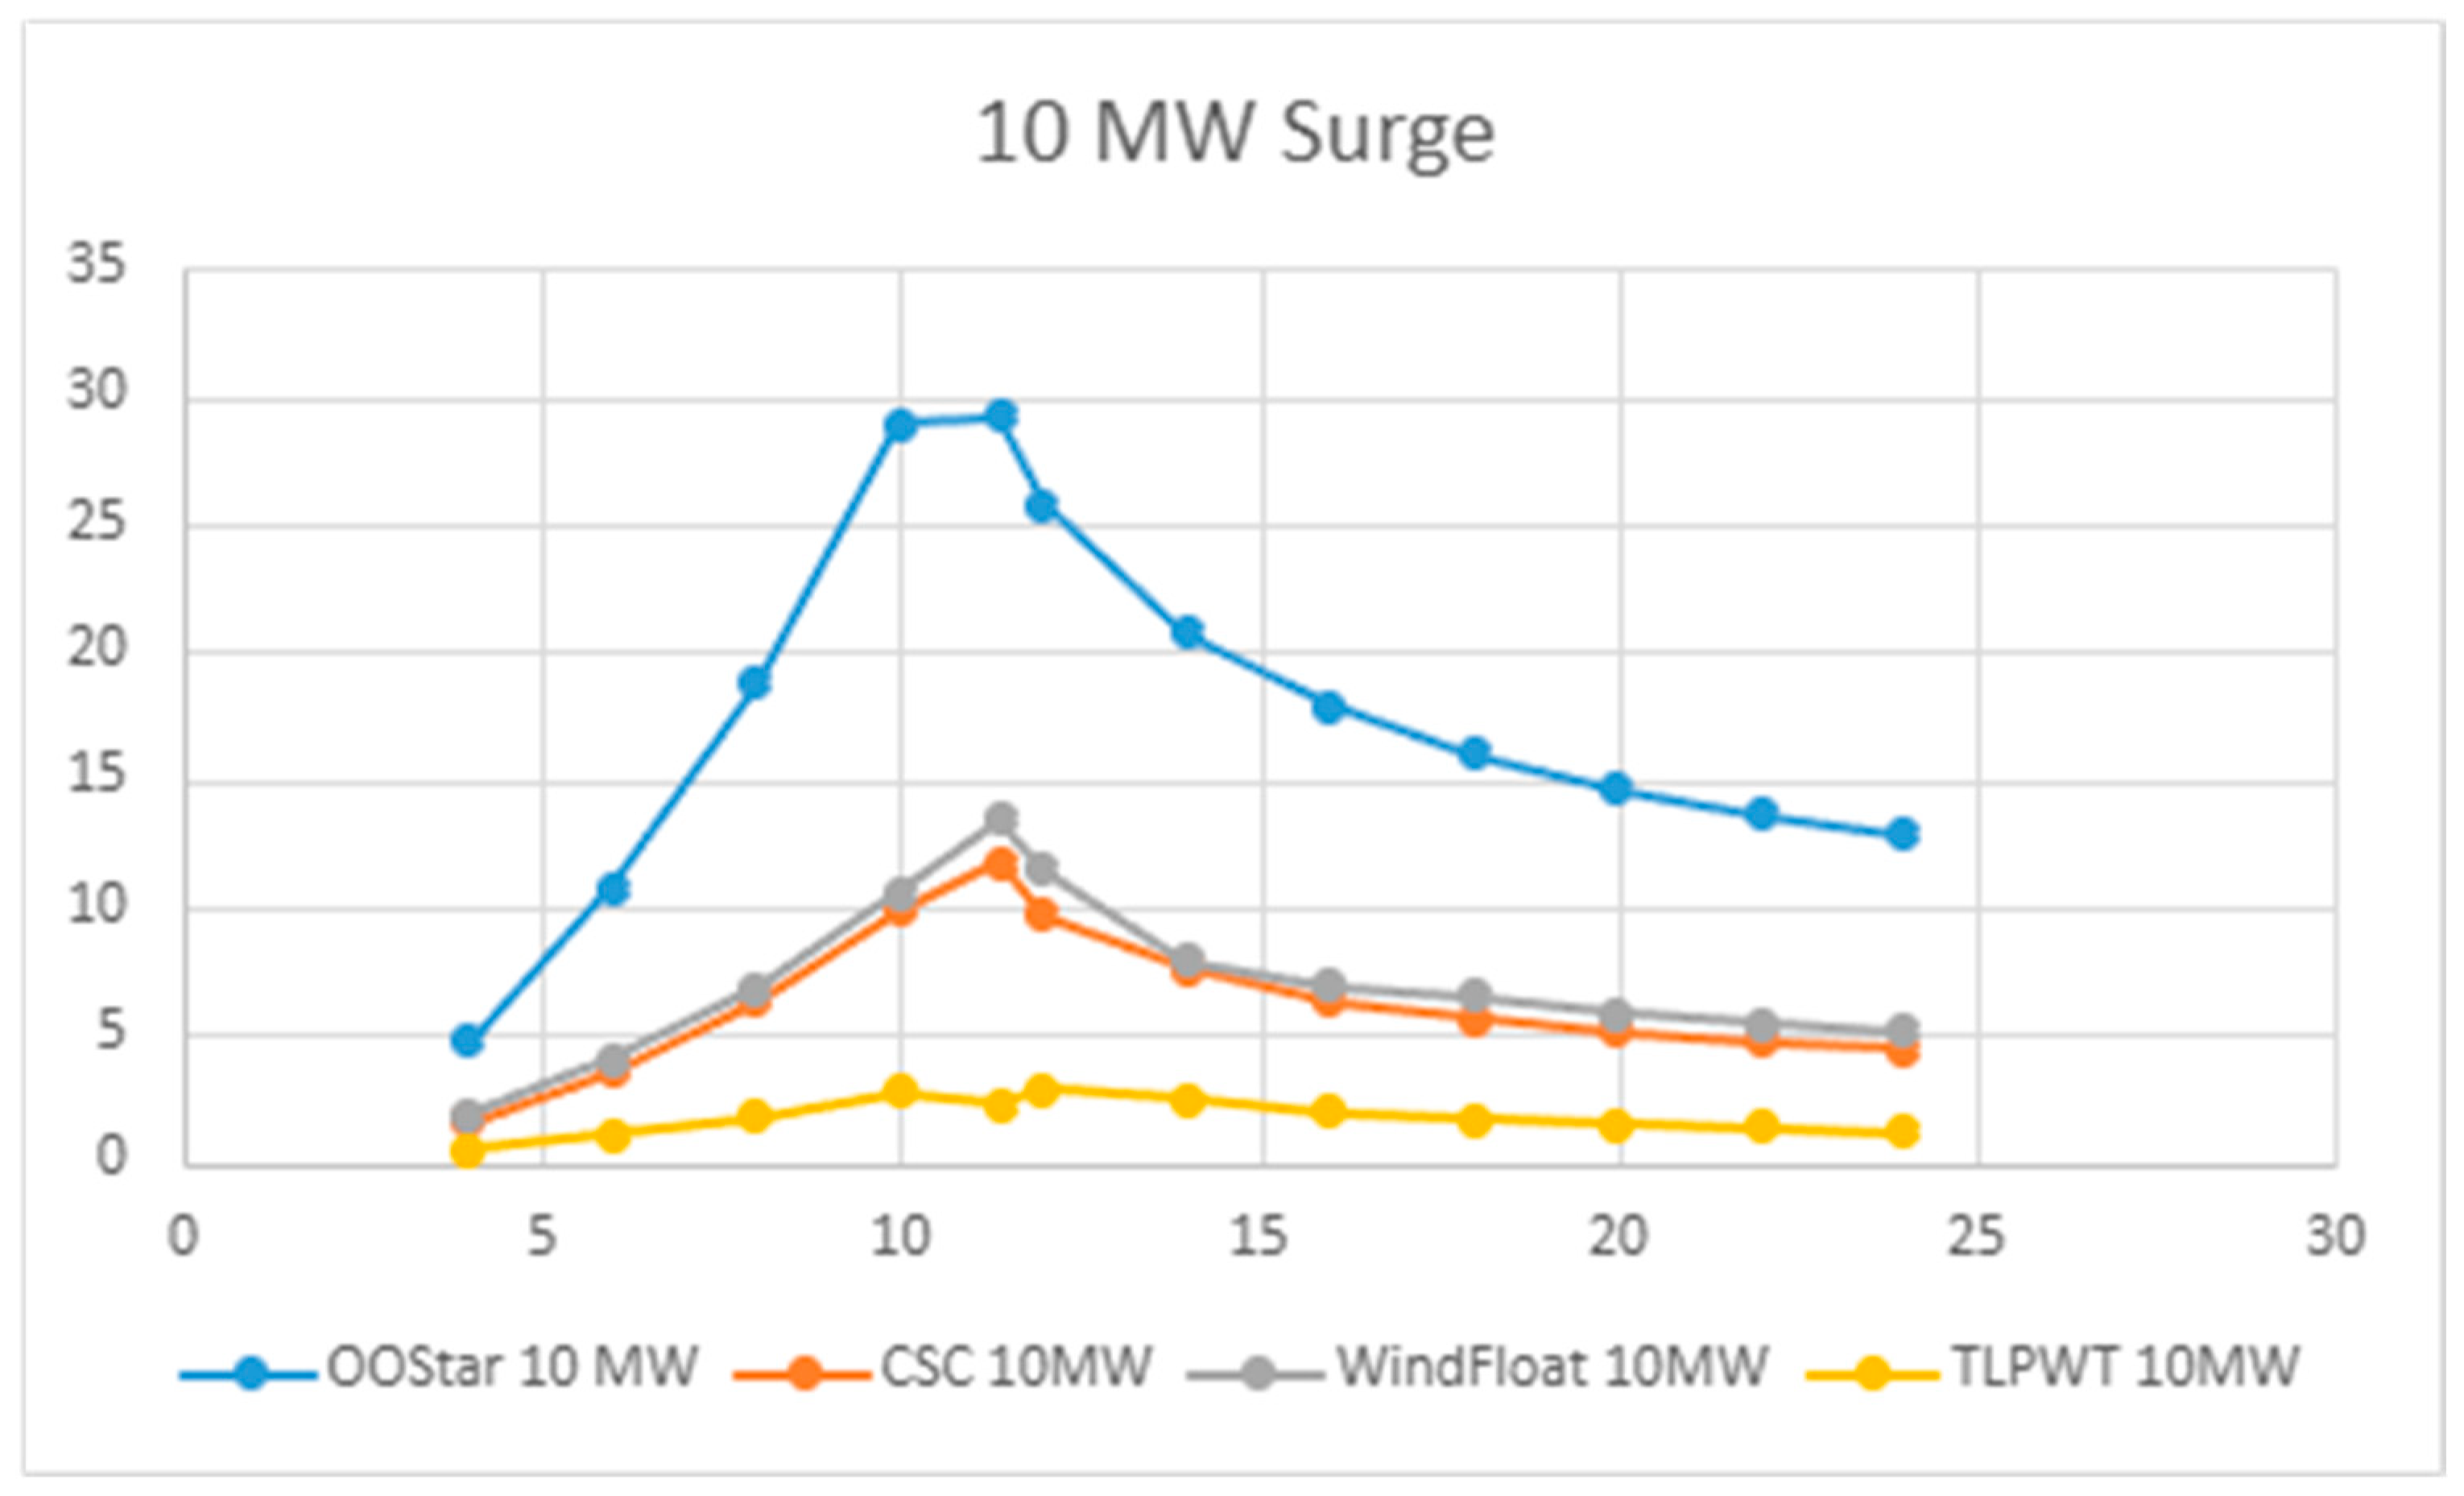
Figure 11.
10 MW Roll graph representing the data presented in Table 3 (x-axis: different wind speeds (m/s), y-axis: Roll offset (°)).
Figure 11.
10 MW Roll graph representing the data presented in Table 3 (x-axis: different wind speeds (m/s), y-axis: Roll offset (°)).
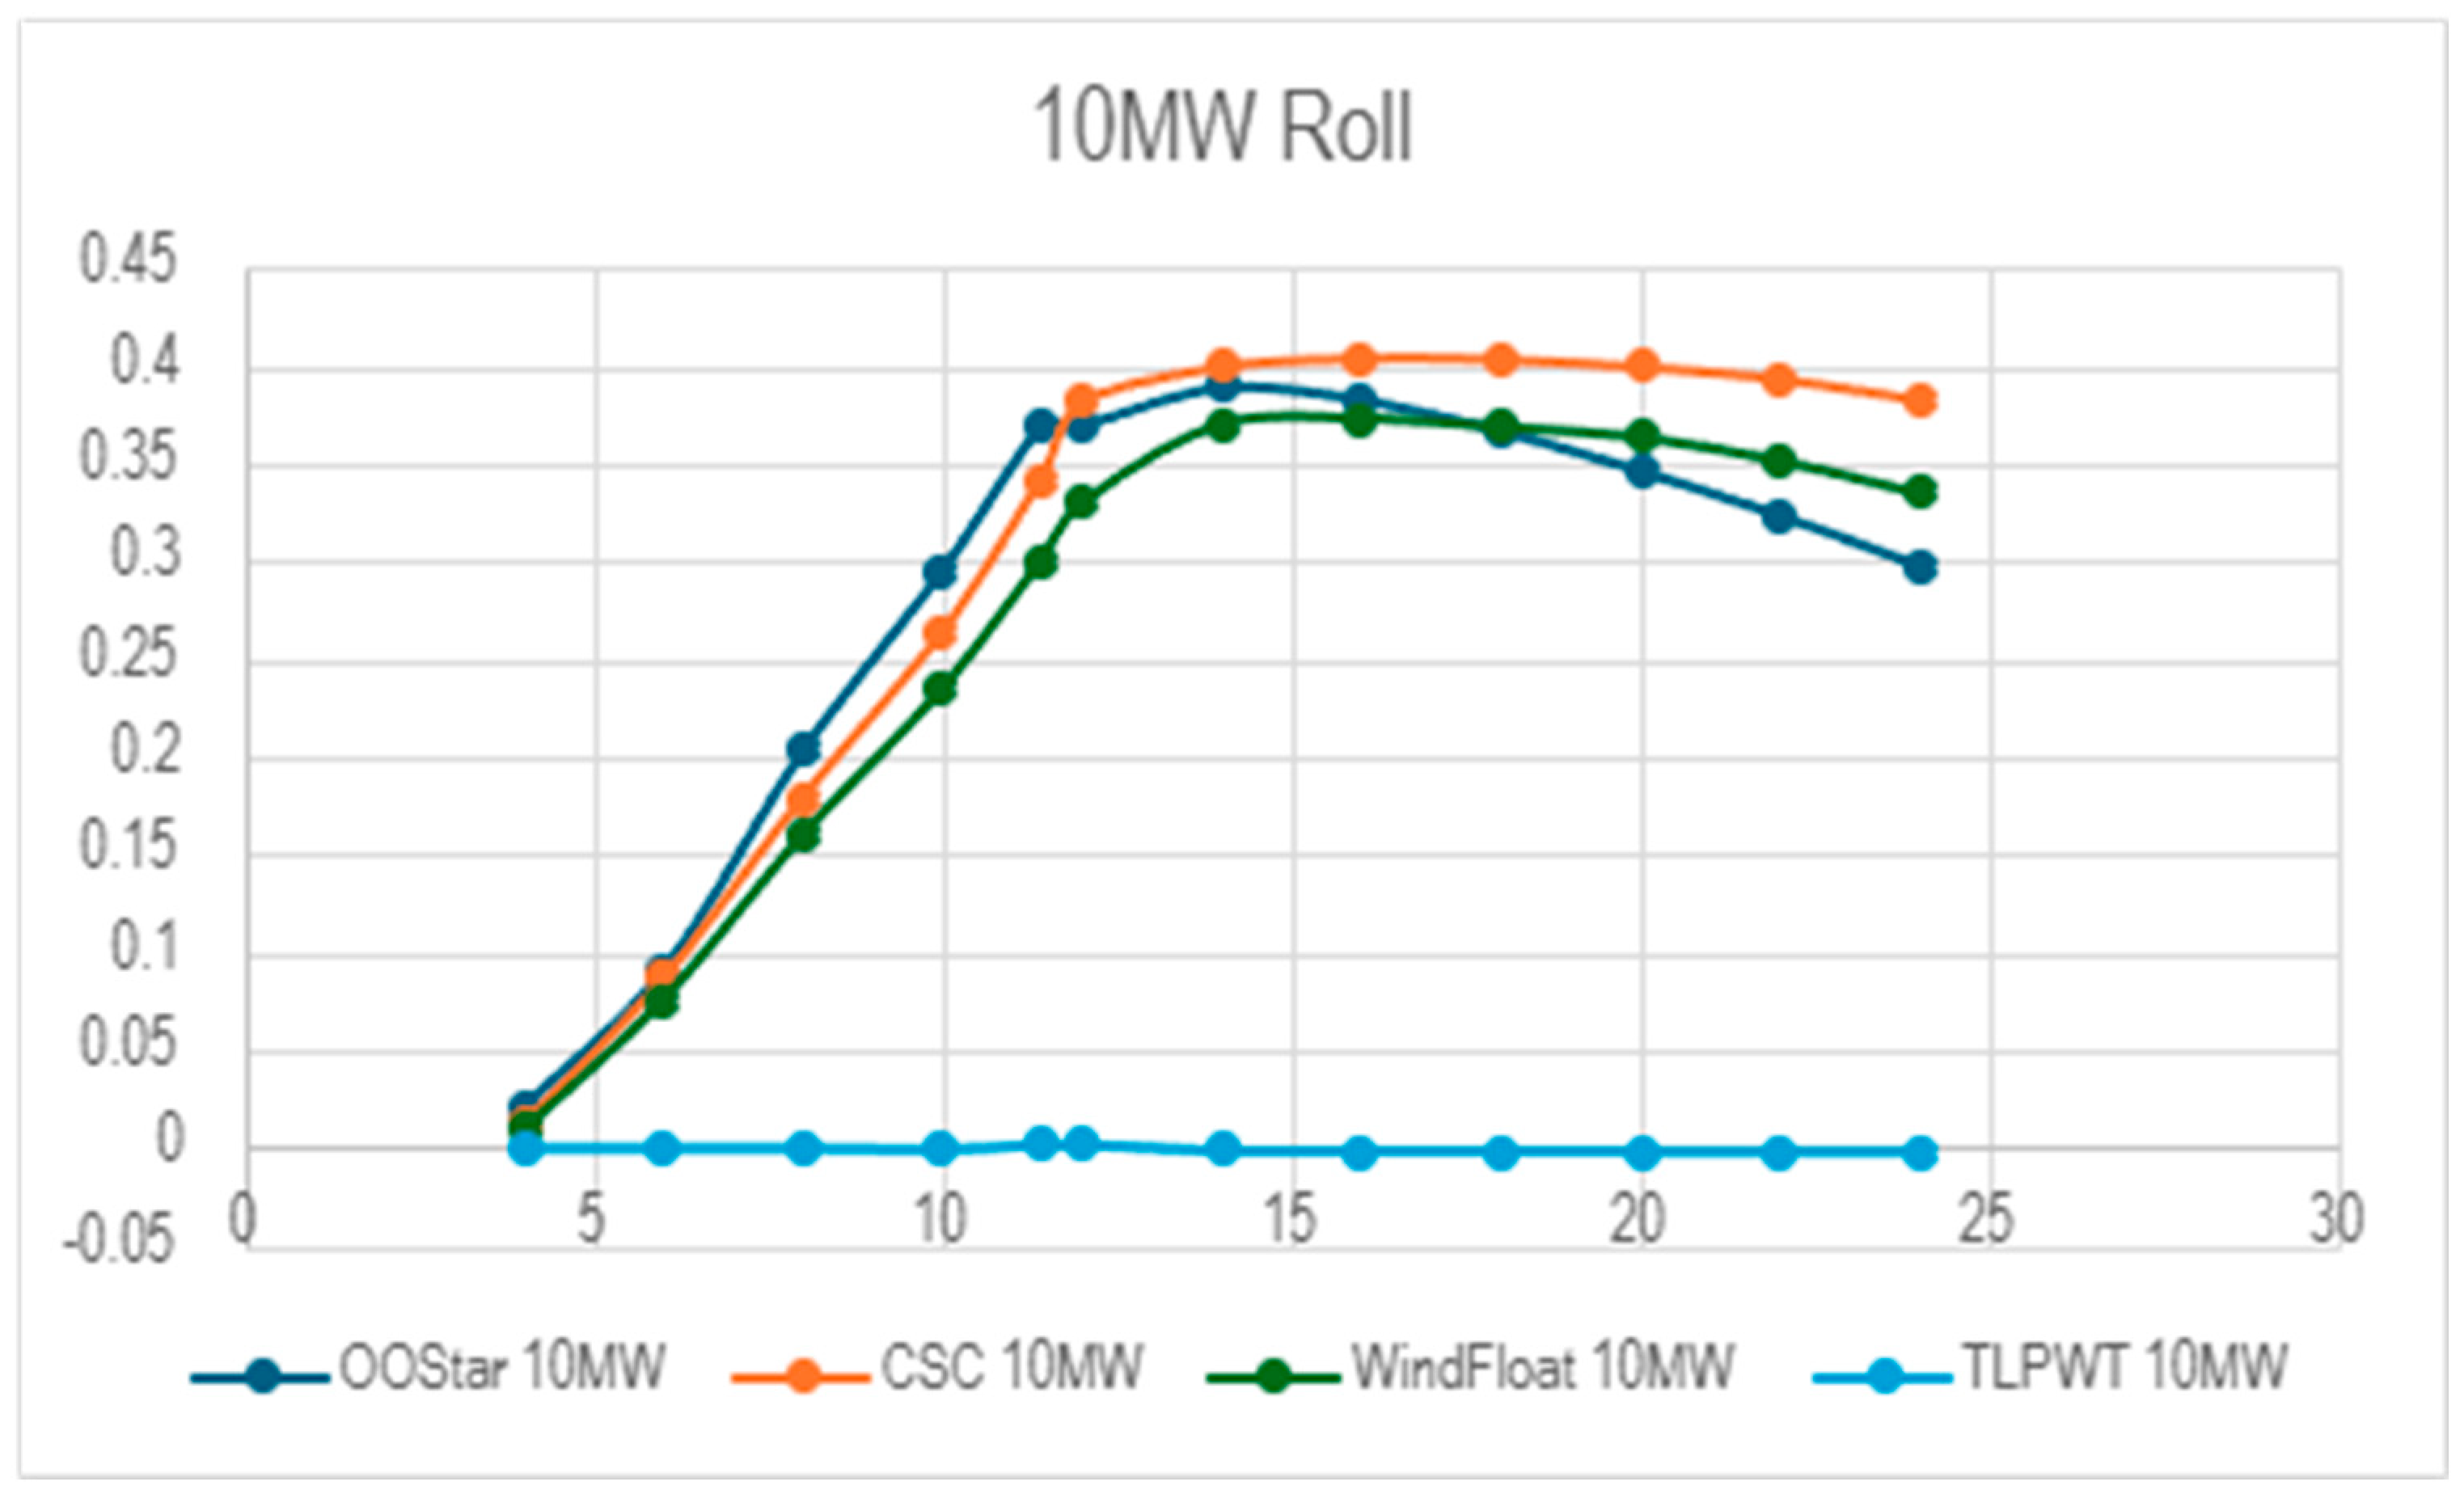
Figure 12.
10 MW Pitch graph representing the data presented in Table 4 (x-axis: different wind speeds (m/s), y-axis: Pitch offset (°)).
Figure 12.
10 MW Pitch graph representing the data presented in Table 4 (x-axis: different wind speeds (m/s), y-axis: Pitch offset (°)).
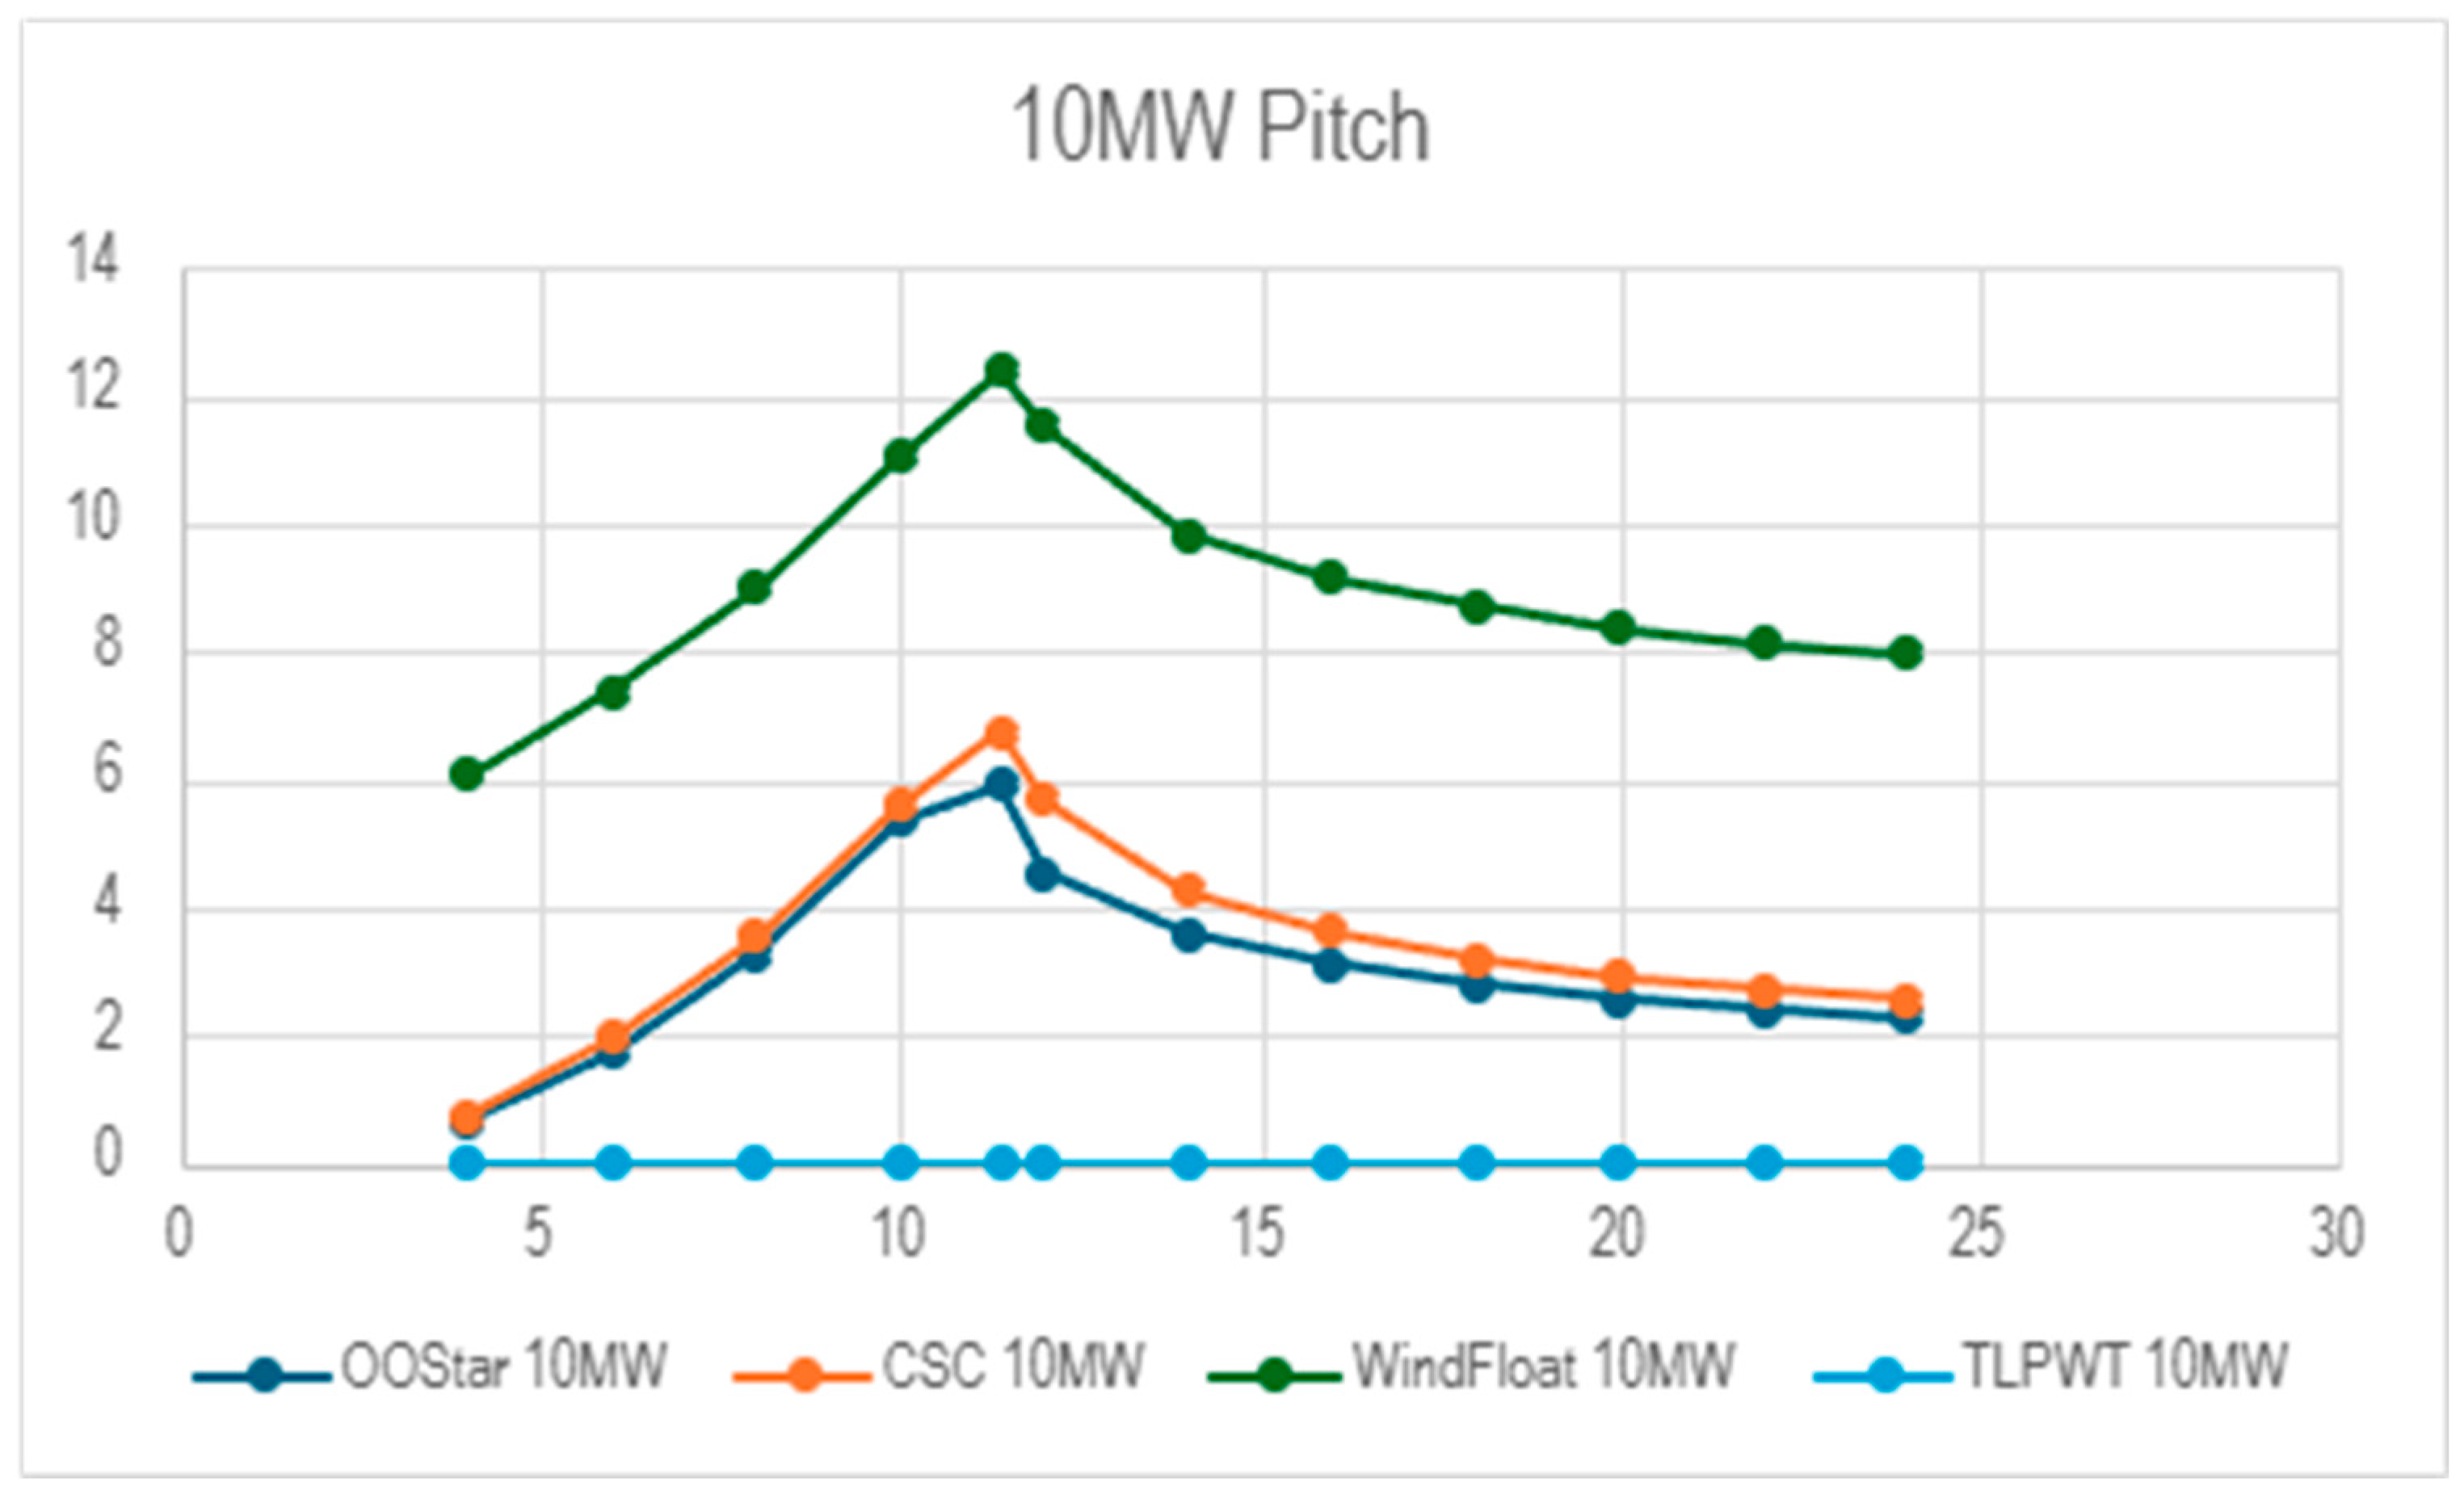
Figure 13.
15 MW and 12 MW Surge graph representing the data presented in Table 5 (x-axis: different wind speeds (m/s), y-axis: Surge offset (m)).
Figure 13.
15 MW and 12 MW Surge graph representing the data presented in Table 5 (x-axis: different wind speeds (m/s), y-axis: Surge offset (m)).
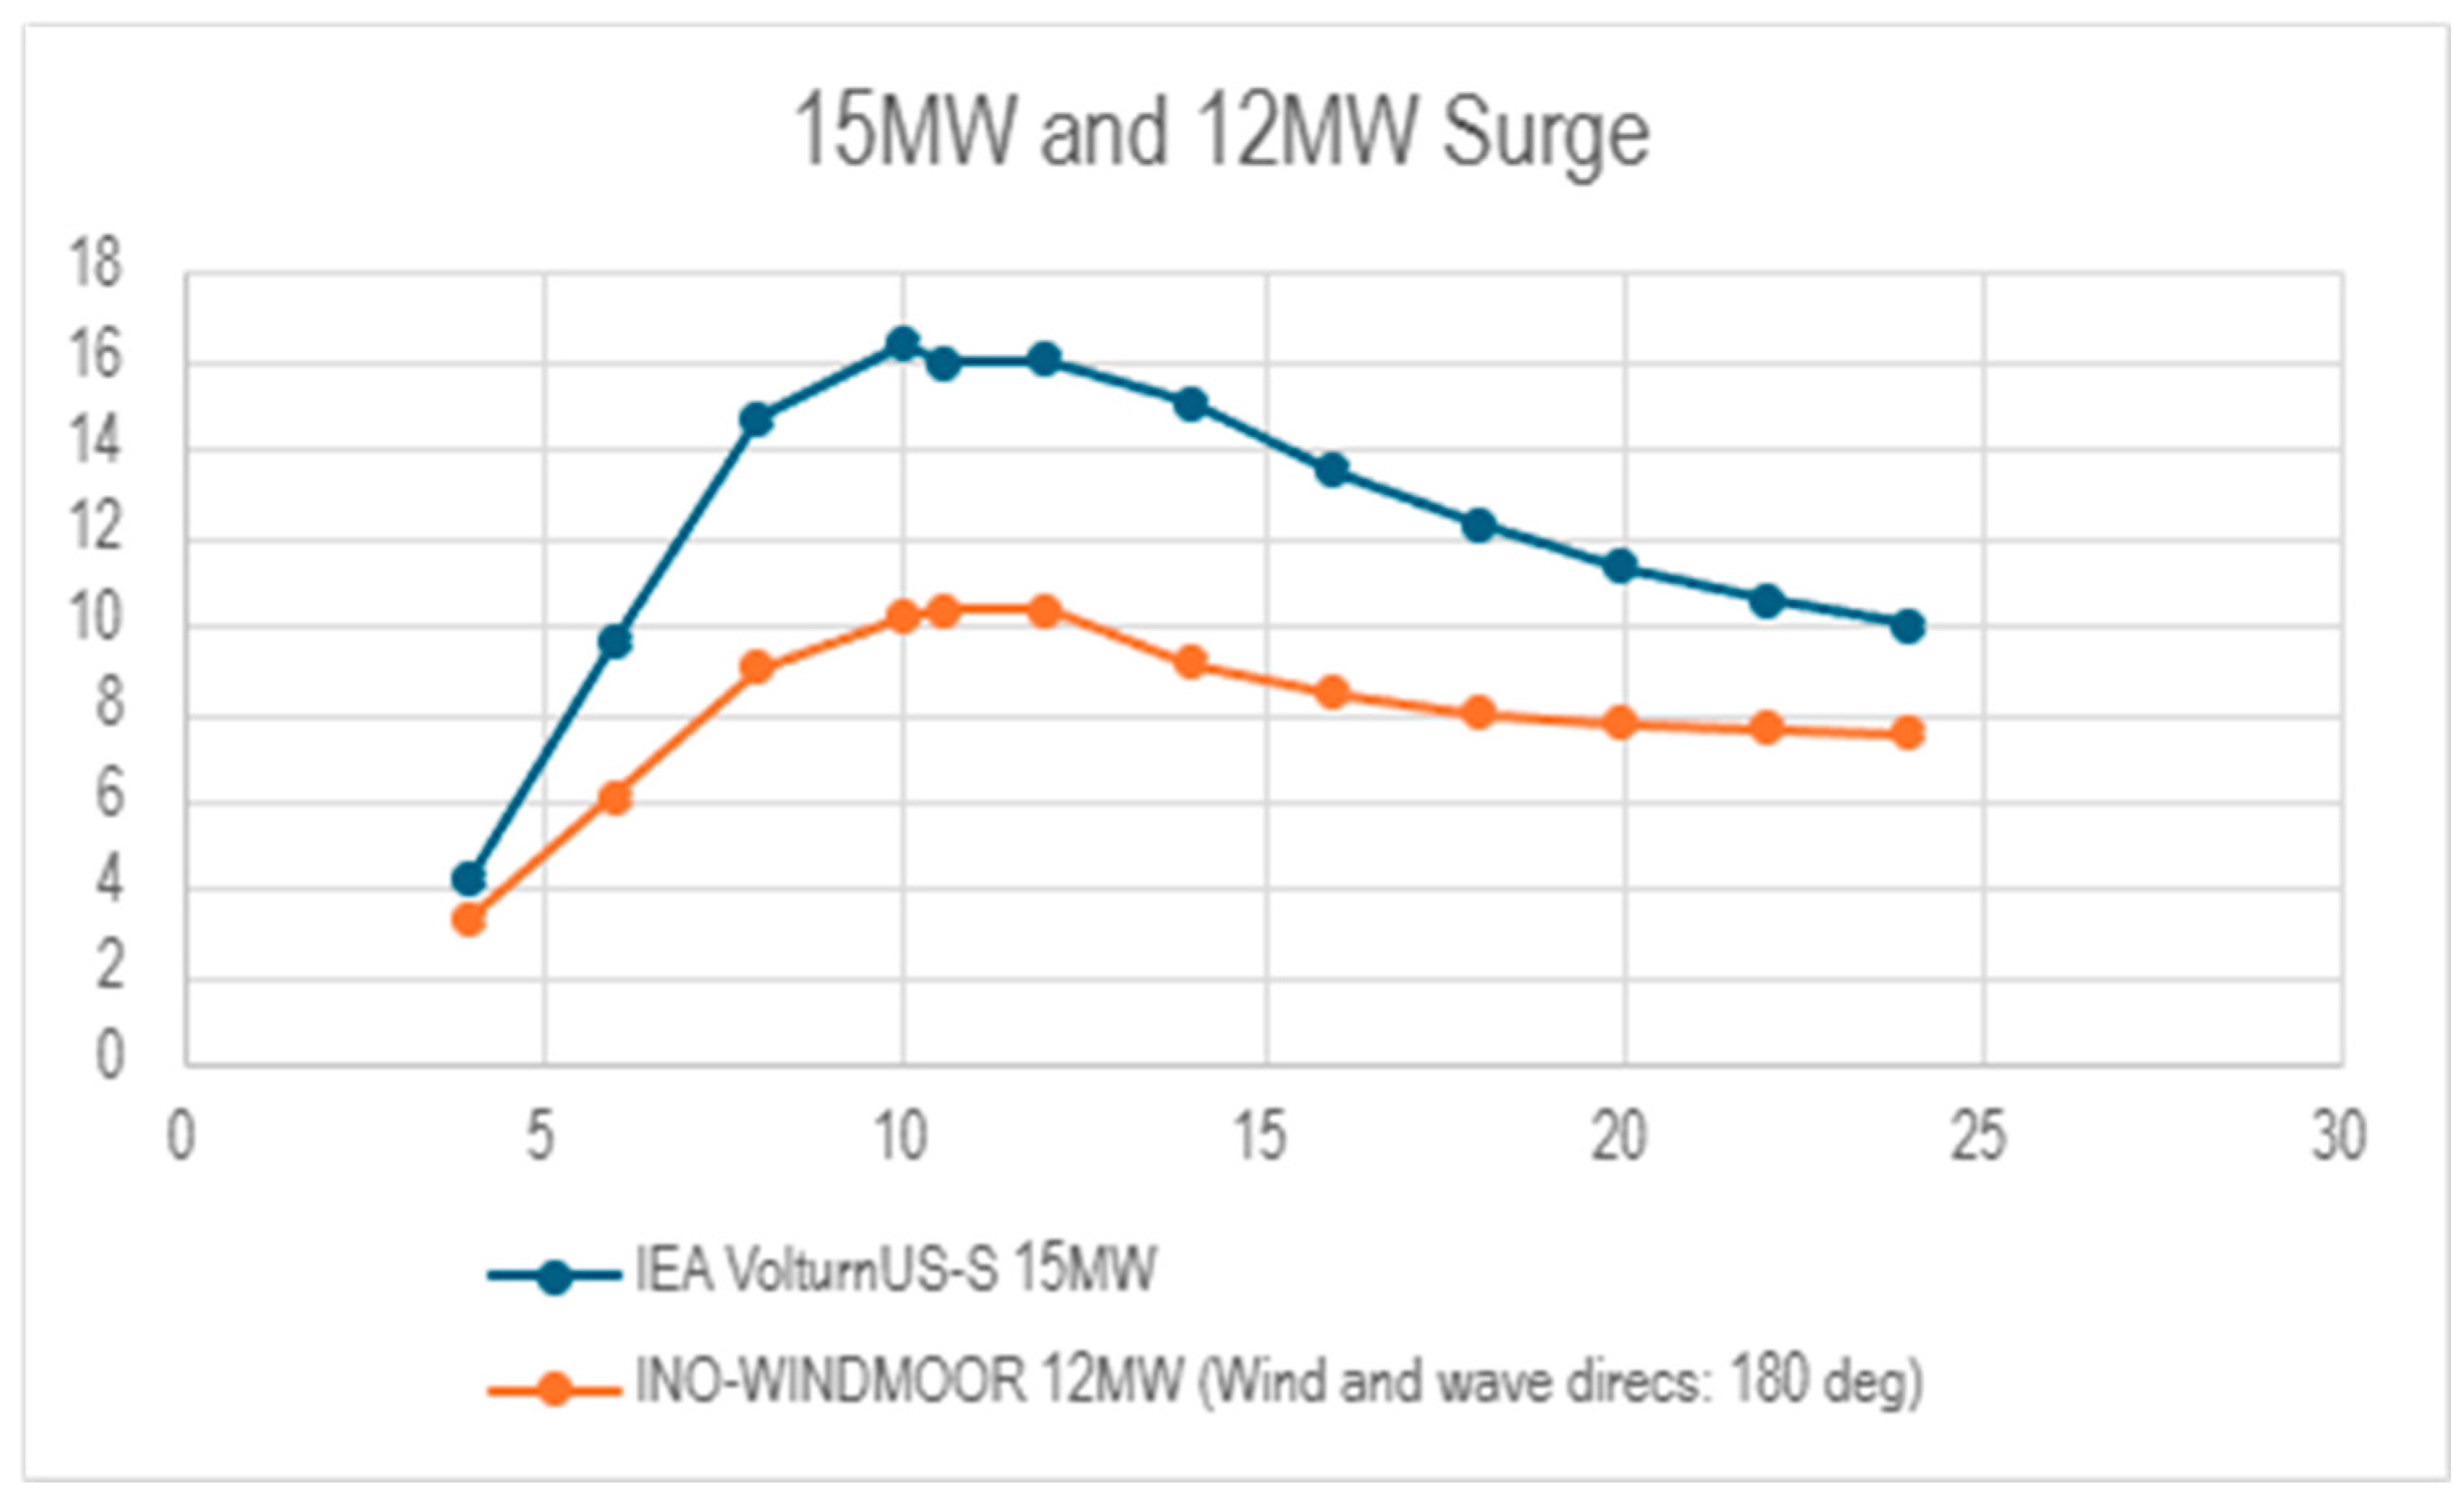
Figure 14.
15 MW and 12 MW Roll graph representing the data presented in Table 6 (x-axis: different wind speeds (m/s), y-axis: Roll offset (m)).
Figure 14.
15 MW and 12 MW Roll graph representing the data presented in Table 6 (x-axis: different wind speeds (m/s), y-axis: Roll offset (m)).
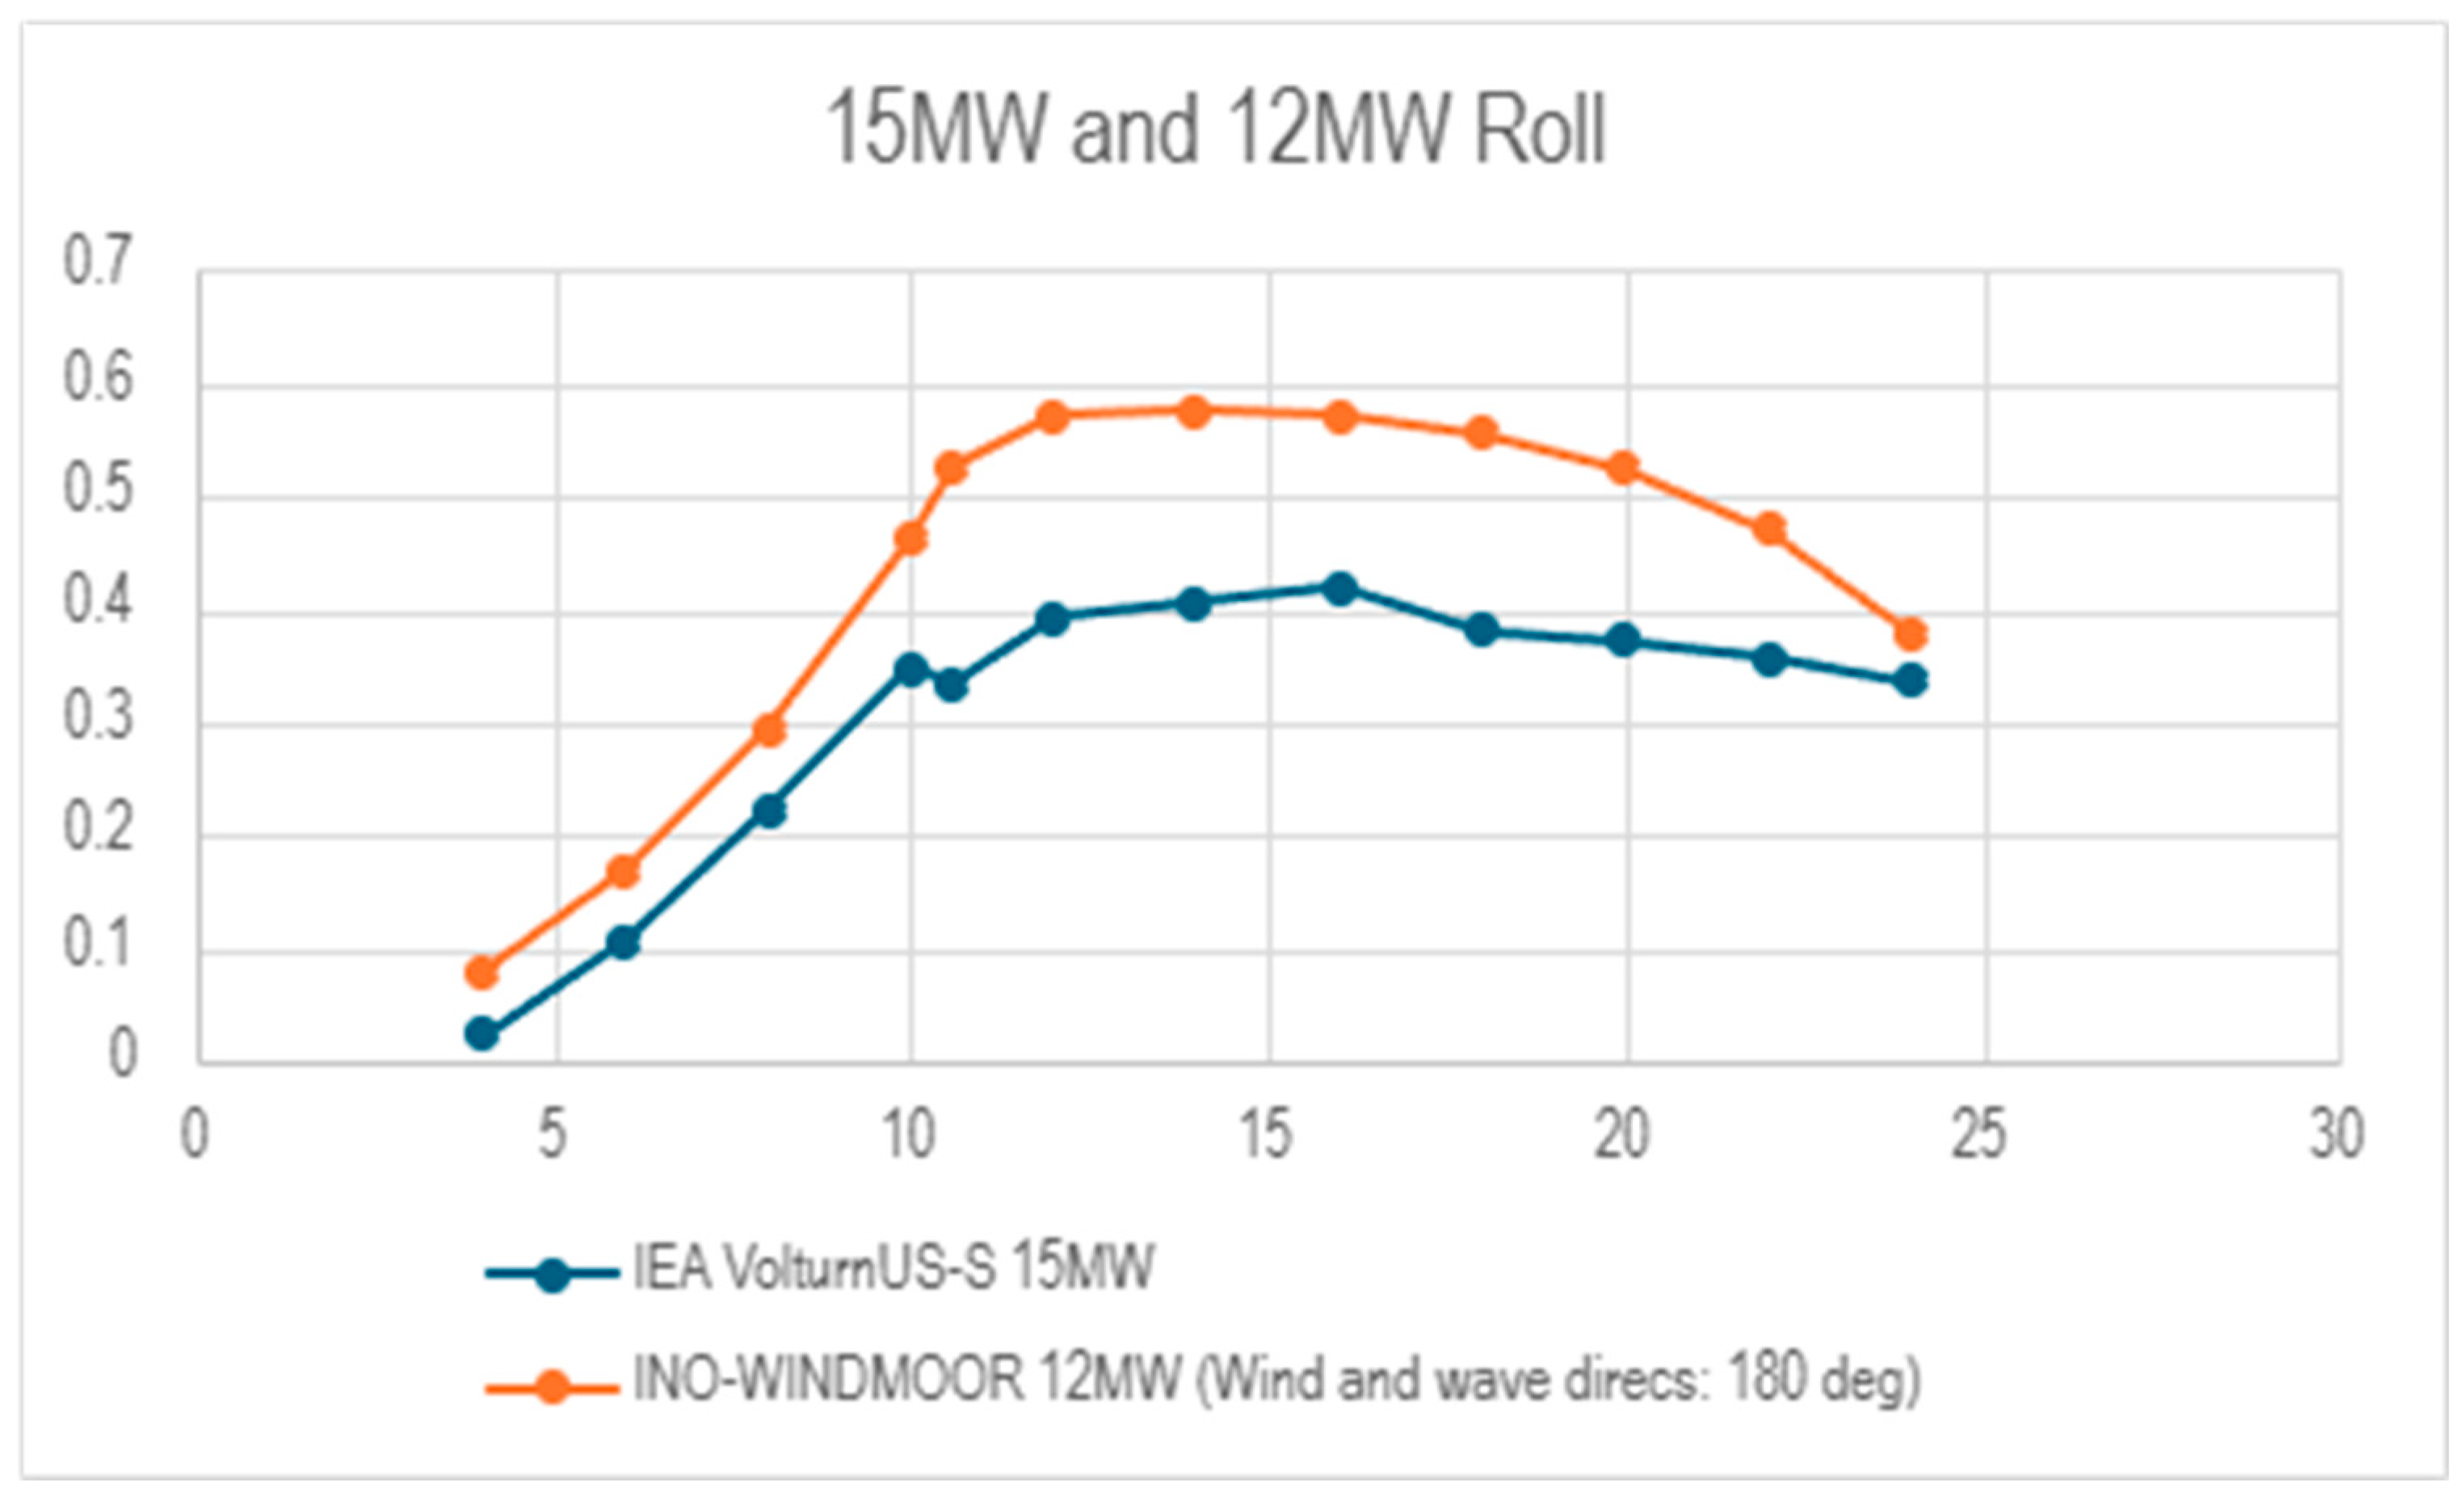
Figure 15.
15 MW and 12 MW Pitch graph representing the data presented in Table 7 (x-axis: different wind speeds (m/s), y-axis: Pitch offset (m)).
Figure 15.
15 MW and 12 MW Pitch graph representing the data presented in Table 7 (x-axis: different wind speeds (m/s), y-axis: Pitch offset (m)).
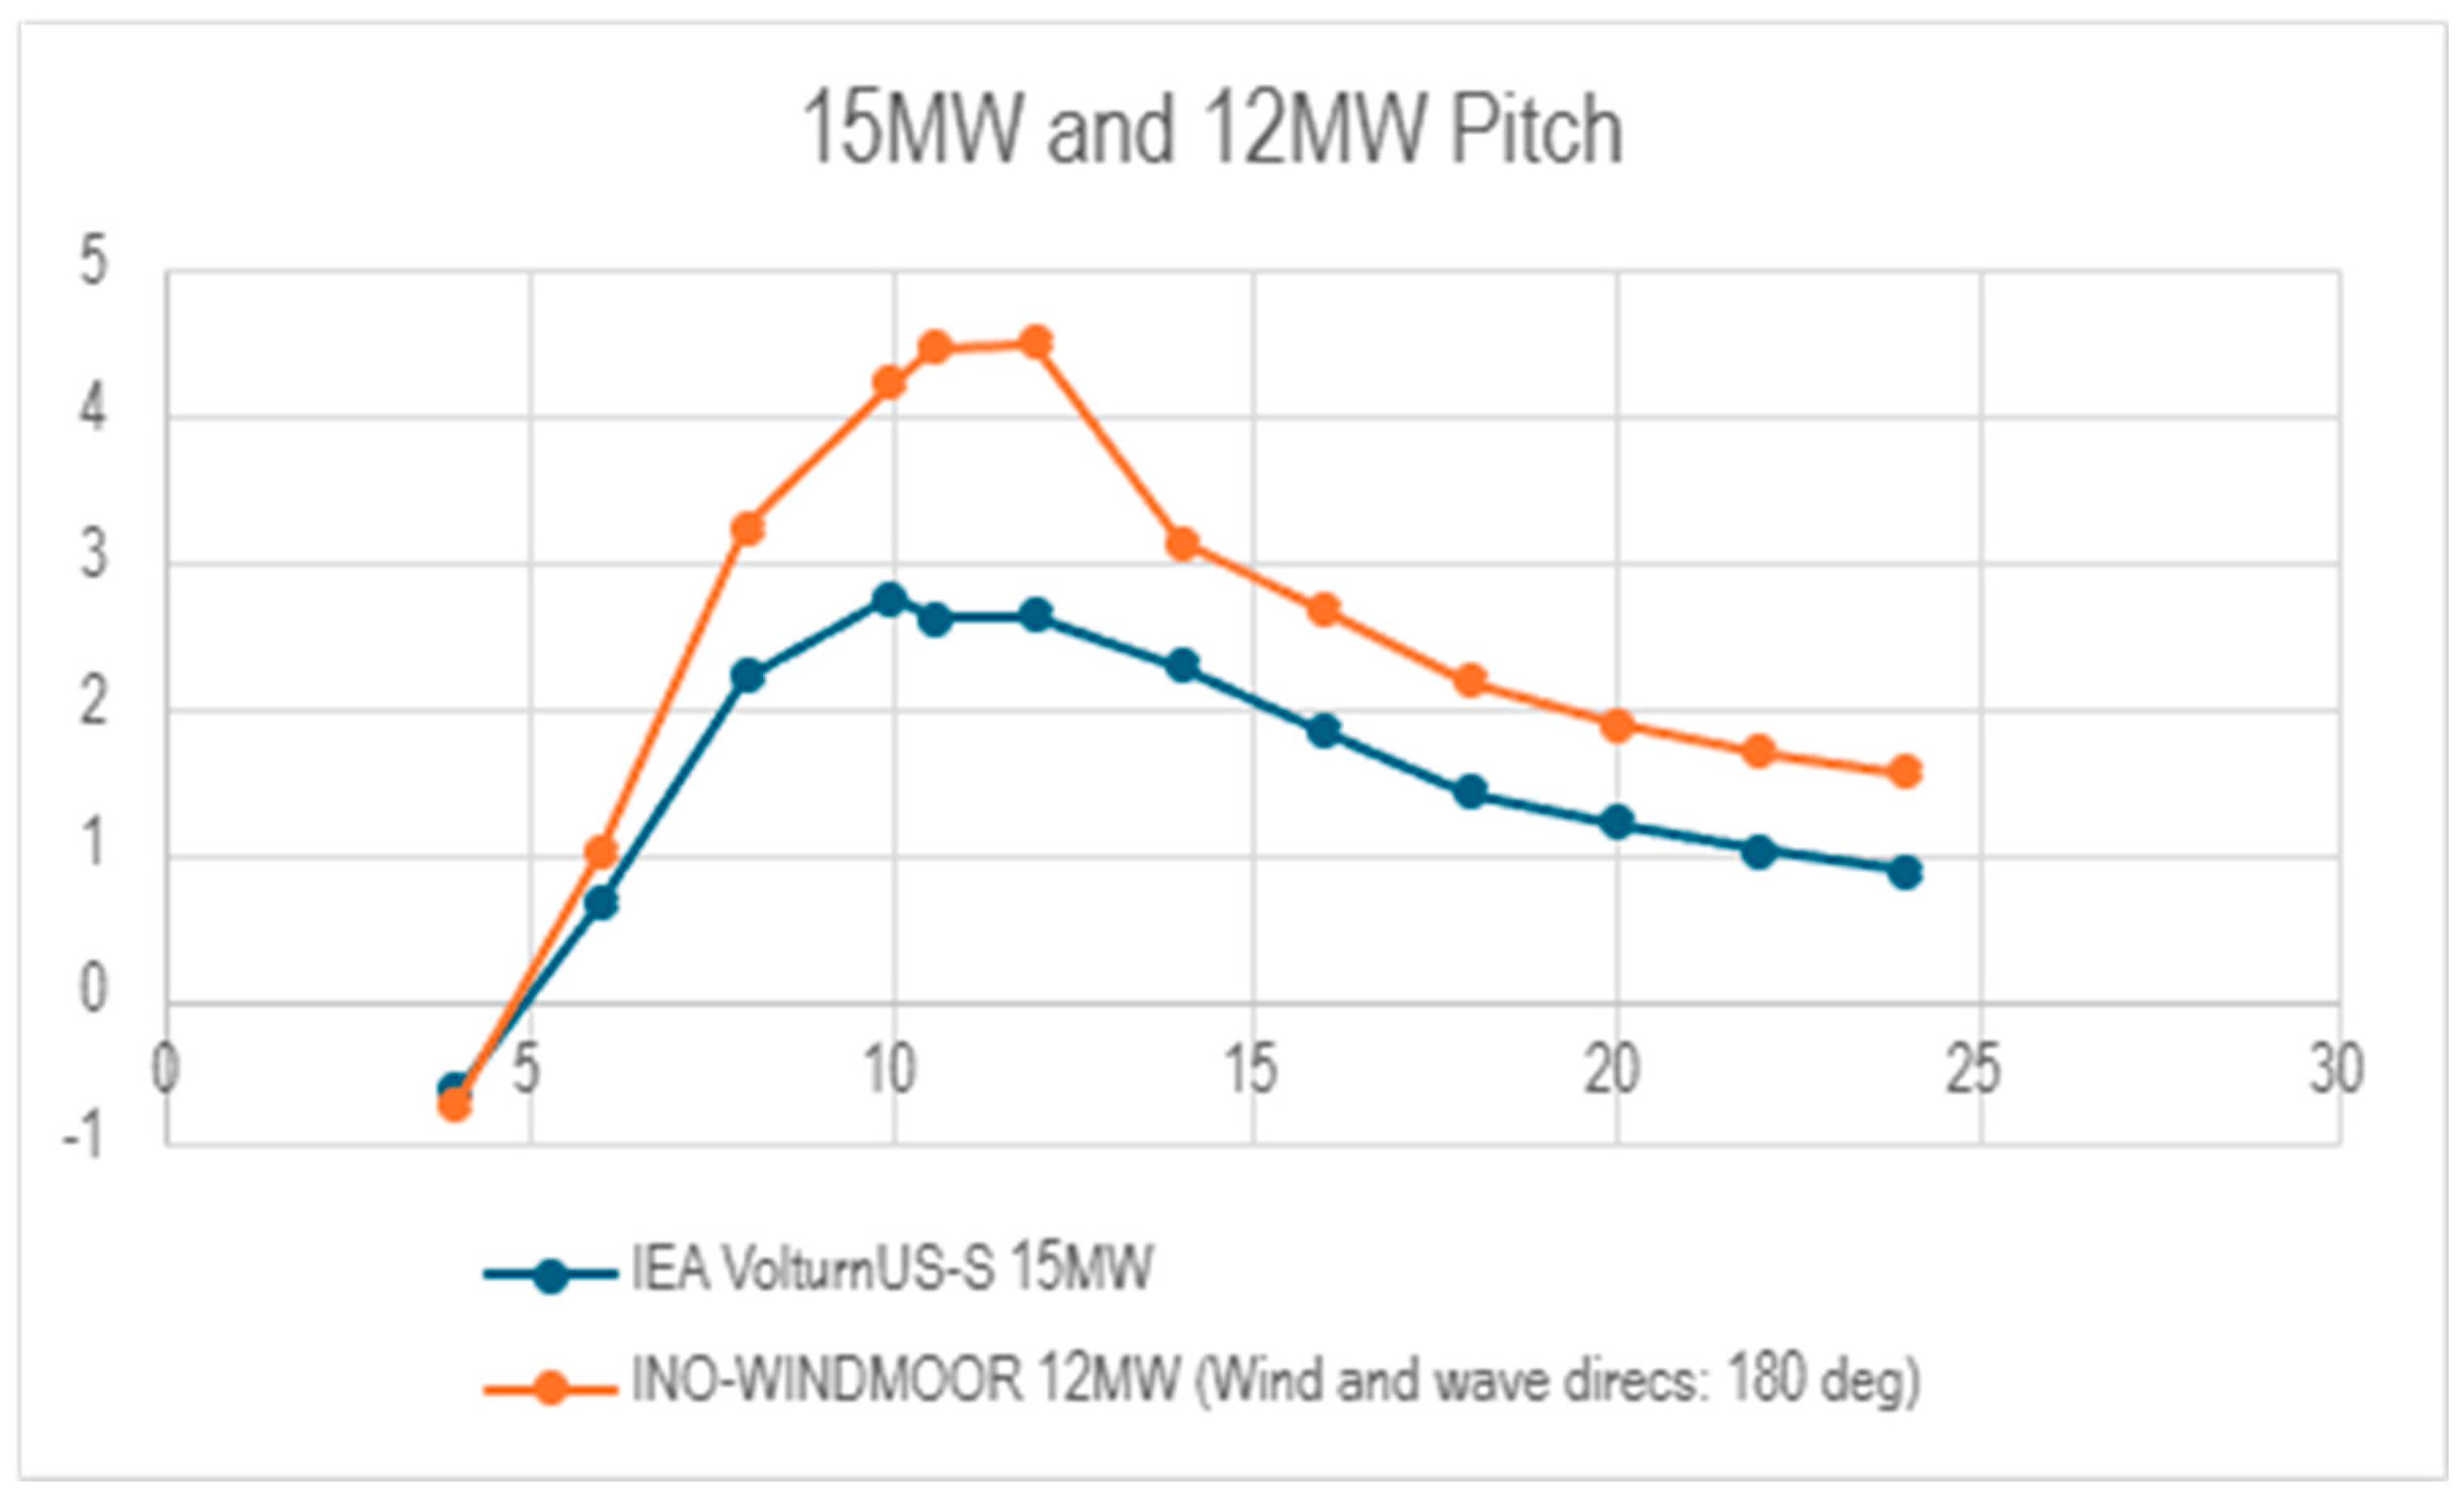
Figure 16.
10 MW Surge graph representing the data presented in Table 8 (x-axis: different wind speeds (m/s), y-axis: Surge offset (m)).
Figure 16.
10 MW Surge graph representing the data presented in Table 8 (x-axis: different wind speeds (m/s), y-axis: Surge offset (m)).
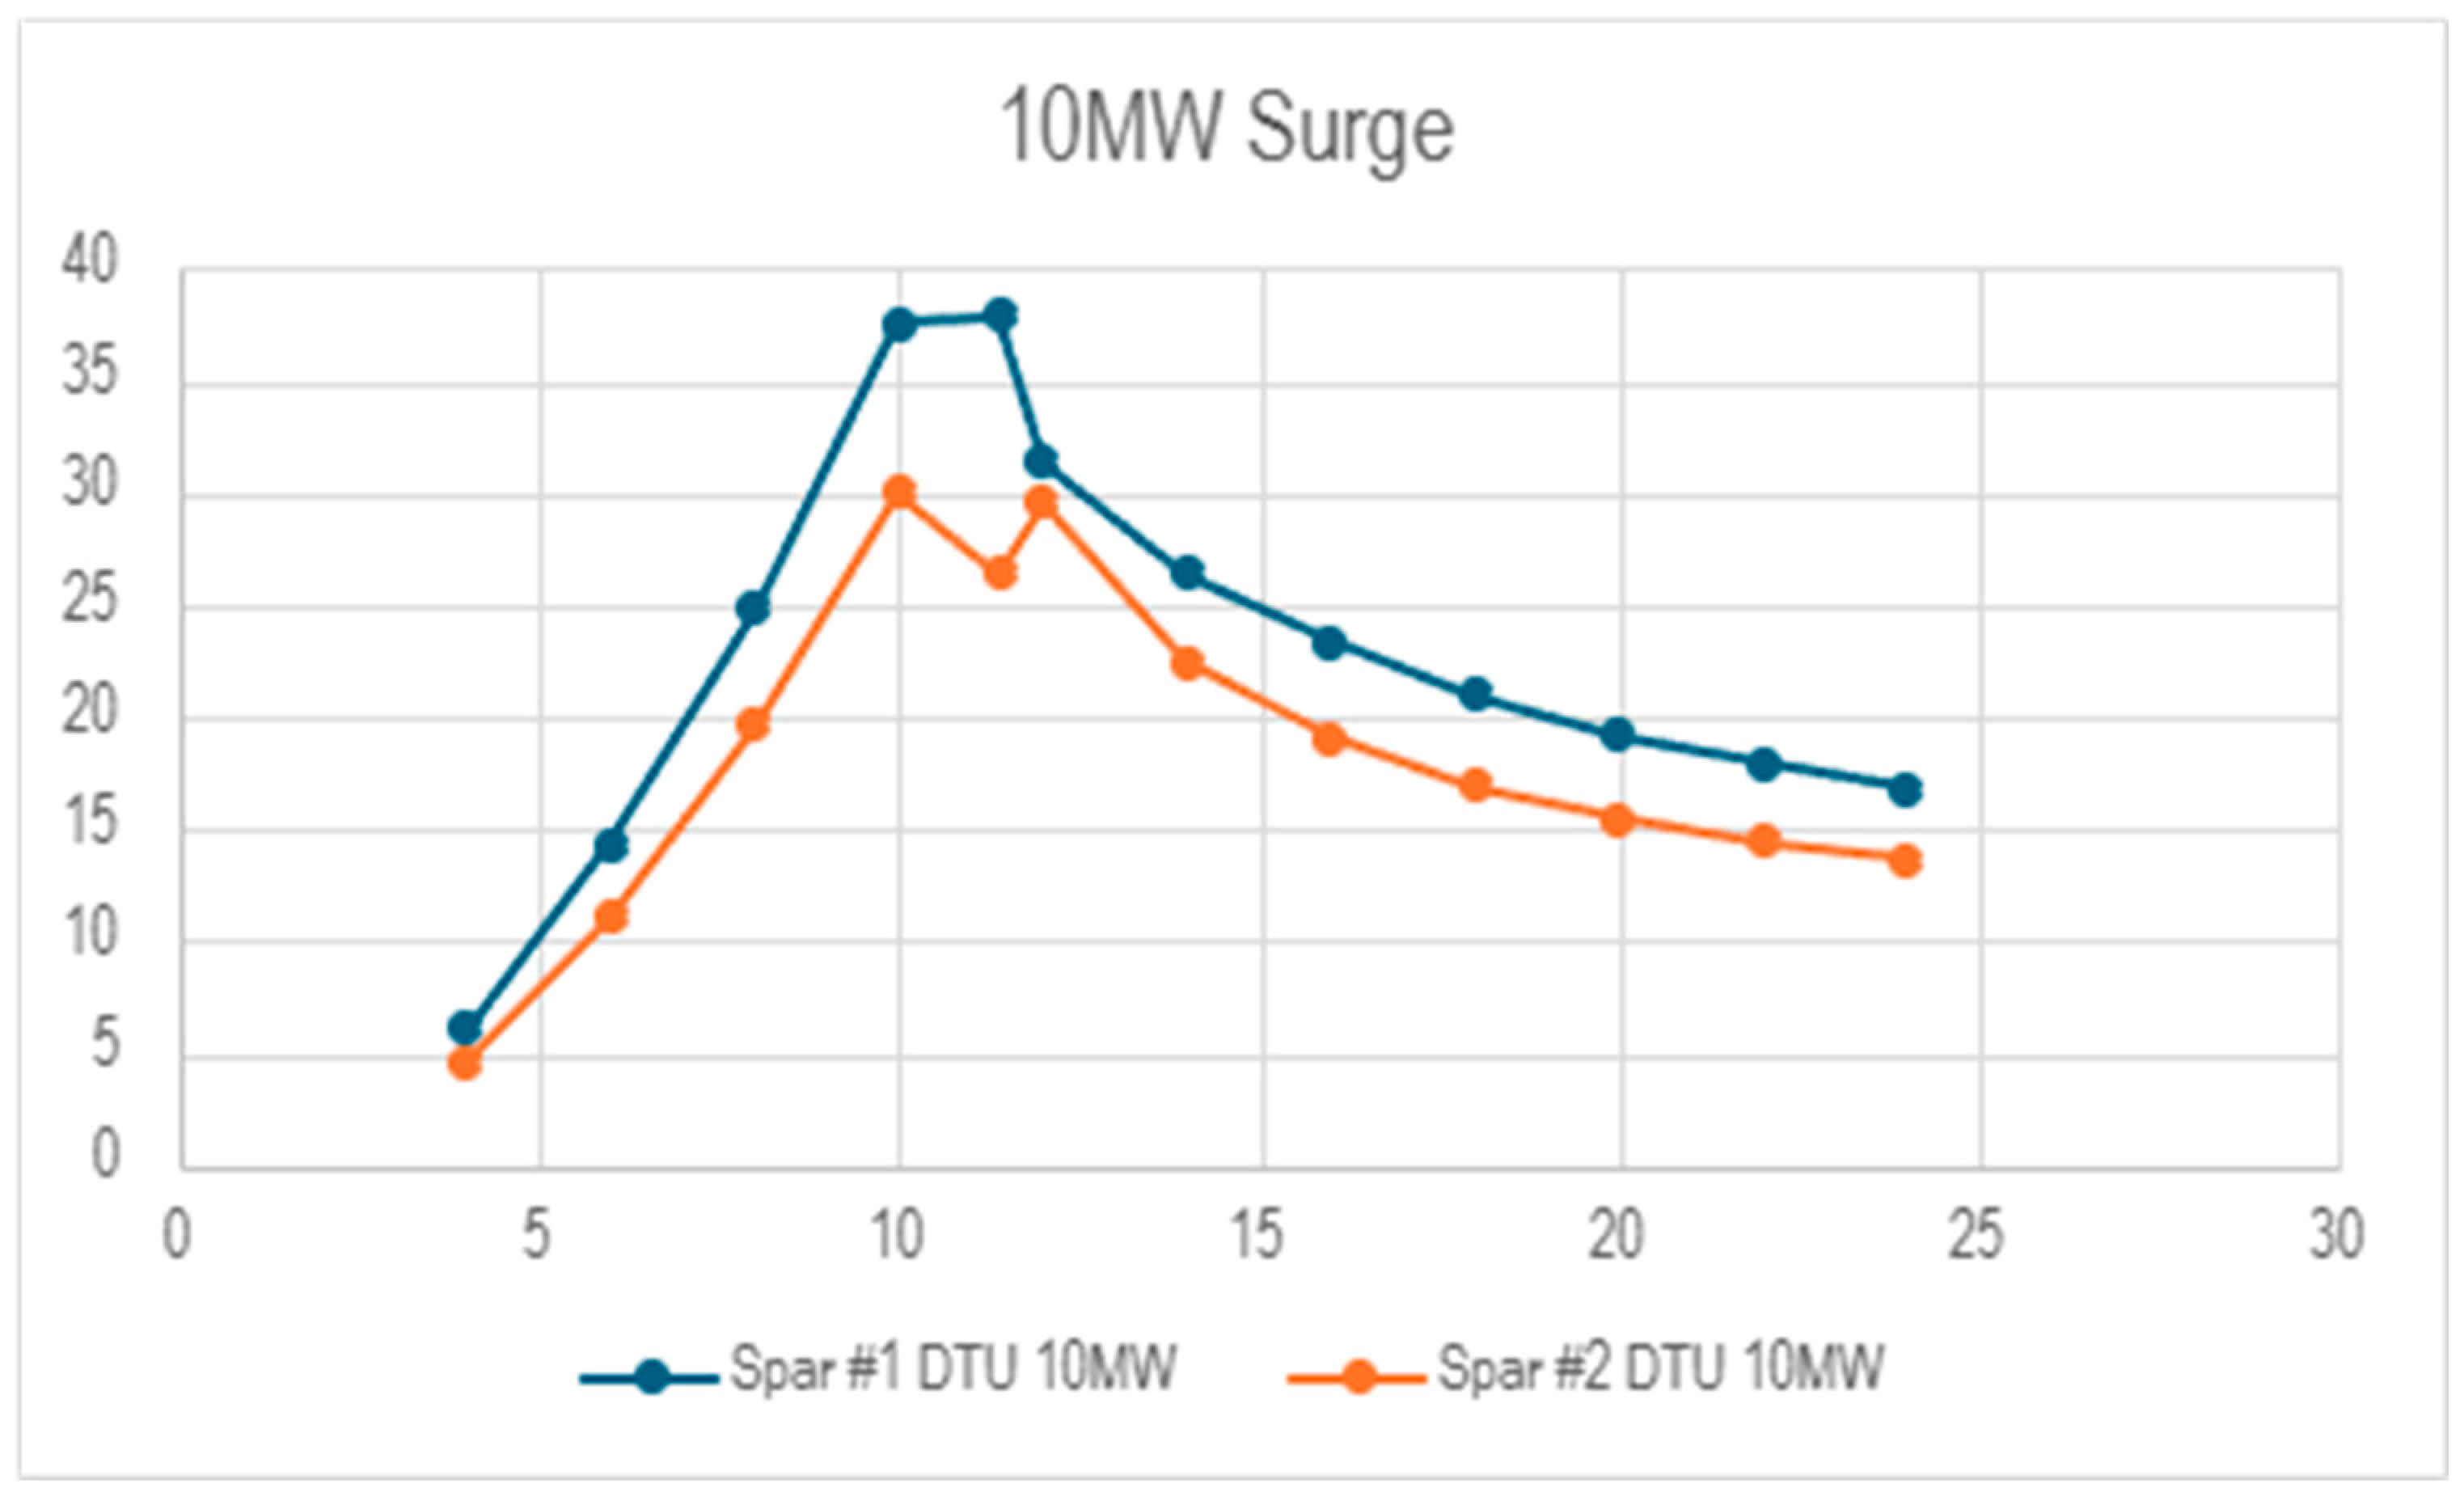
Figure 17.
10 MW Roll graph representing the data presented in Table 9 (x-axis: different wind speeds (m/s), y-axis: Roll offset (m)).
Figure 17.
10 MW Roll graph representing the data presented in Table 9 (x-axis: different wind speeds (m/s), y-axis: Roll offset (m)).
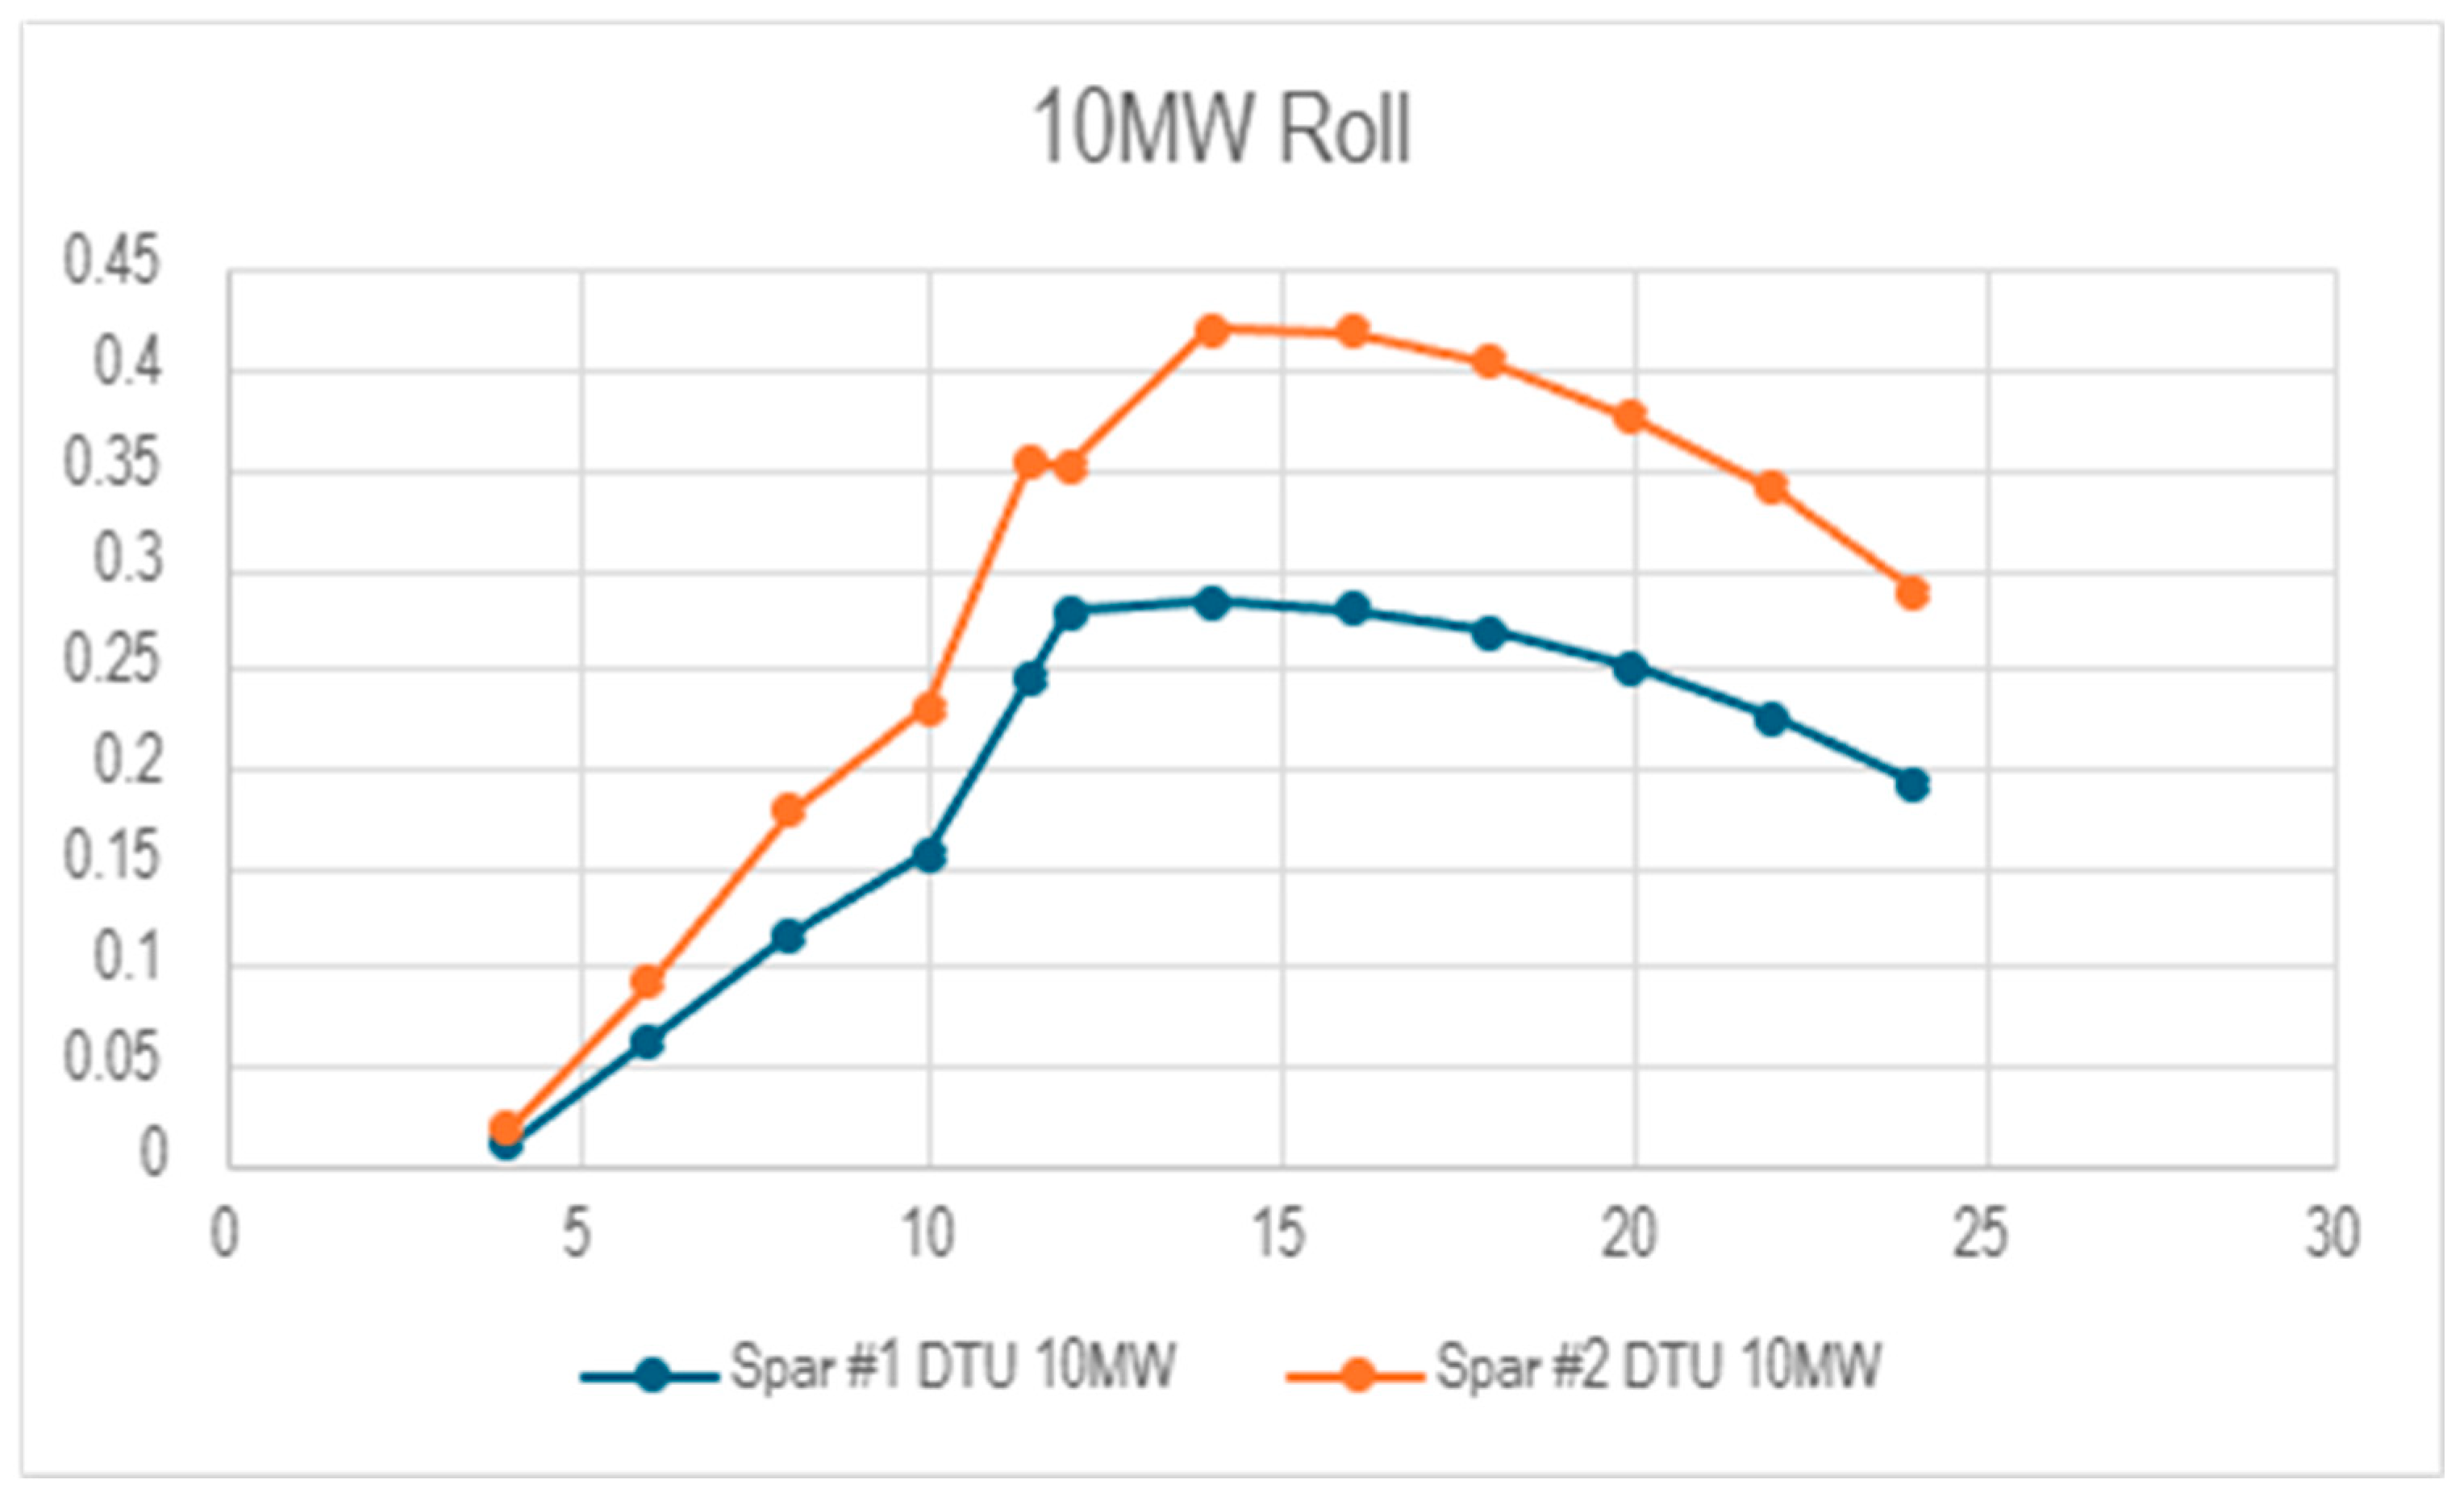
Figure 18.
10 MW Pitch graph representing the data presented in Table 10 (x-axis: different wind speeds (m/s), y-axis: Pitch offset (m)).
Figure 18.
10 MW Pitch graph representing the data presented in Table 10 (x-axis: different wind speeds (m/s), y-axis: Pitch offset (m)).
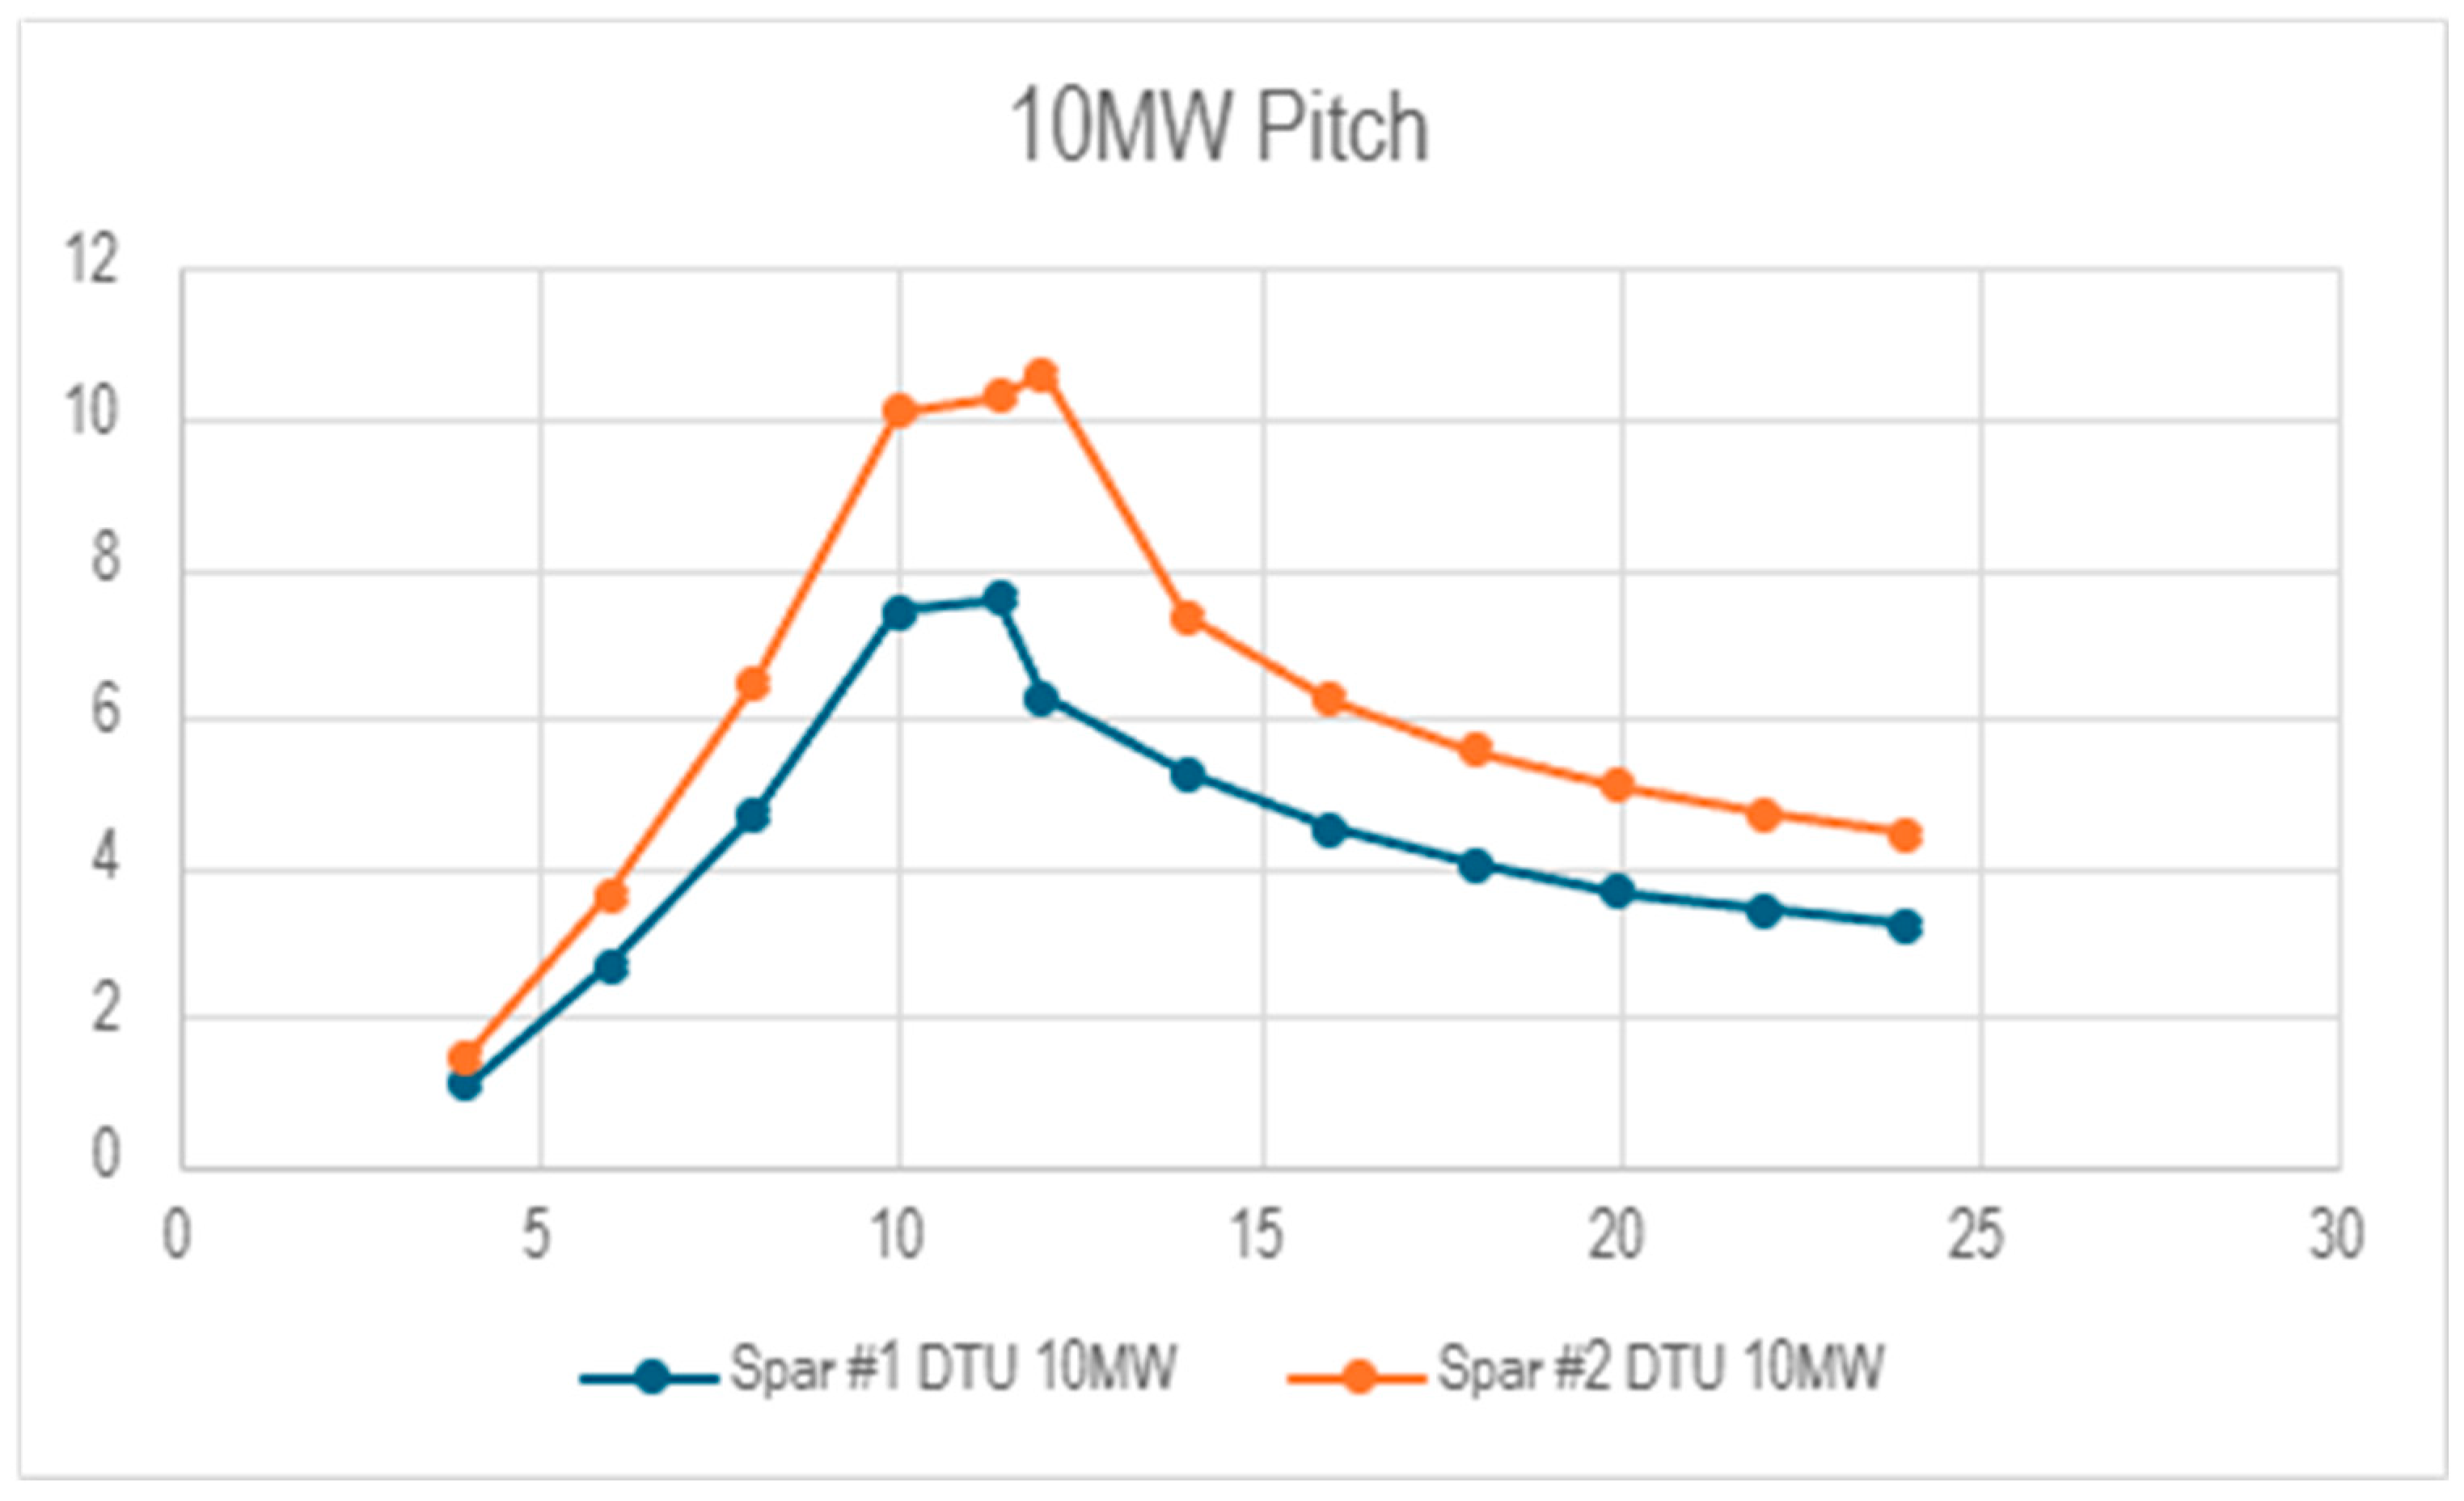

Table 1.
Characteristics of OO-Star floating wind turbine implemented in Sima 4.6.4 software.
| OO-Star | |
| Support structure’s height [m] | Total height until the hub [m] |
| 27 | 131.63 |
| Accumulated mass of support structure [kg] | |
| 2.1709 × 10⁷ | |
| Support structure’s accumulated volume [m3] | |
| 8199.1 | |
| Length of each blade [m] | |
| 86.365 | |
| Additional masses at hub [kg] | |
| Nacelle: 1 , Hub: 1.0502 × 10⁵ | |
| Stress-free length of each mooring line [m] | |
| 703 | |
| Water depth [m] | |
| 130 | |
Table 2.
Characteristics of CSC floating wind turbine implemented in Sima 4.6.4 software.
| CSC | |
| Support structure's height [m] | Total height [m] (without hub and blades) |
| 30 | 135.63 |
| Support structure's accumulated mass [kg] | |
| 1.2642 × 10⁷ | |
| Support structure's accumulated volume [m3] | |
| 2355.9 | |
| Length of each blade [m] | |
| 86.365 | |
| Additional masses at hub [kg] | |
| Nacelle: 4.4604 × 10⁵ , Hub: 1.0552 × 10⁵ | |
| Stress-free length of each mooring line [m] | |
| 880 | |
| Water depth [m] | |
| 200 | |
Table 3.
Characteristics of WindFloat floating wind turbine implemented in Sima 4.6.4 software.
| WindFloat | |
| Support structure's height [m] | Total height [m] (without hub and blades) |
| 30 | 135.63 |
| Support structure's accumulated mass [kg] | |
| 6.35 × 10⁶ | |
| Support structure's accumulated volume [m3] | |
| 1300.2 | |
| Length of each blade [m] | |
| 86.365 | |
| Additional masses at hub [kg] | |
| Nacelle: 4.4604 × 10⁵ , Hub: 1.0552 × 10⁵ | |
| Stress-free length of each mooring line [m] | |
| 882 | |
| Water depth [m] | |
| 200 | |
Table 4.
Characteristics of DTU Spar 1 floating wind turbine implemented in Sima 4.6.4 software.
| DTU Spar 1 | |
| Support structure's height [m] | Total height [m] (without hub and blades) |
| 120 | 235.63 |
| Support structure's accumulated mass [kg] | |
| 1.1822 × 10⁷ | |
| Support structure's accumulated volume [m3] | |
| 13086 | |
| Length of each blade [m] | |
| 86.365 | |
| Additional masses at hub [kg] | |
| Nacelle: 4.4604 × 10⁵ , Hub: 1.0552 × 10⁵ | |
| Stress-free length of each mooring line [m] | |
| 902 | |
| Water depth [m] | |
| 320 | |
Table 5.
Characteristics of DTU Spar 2 floating wind turbine implemented in Sima 4.6.4 software.
| DTU Spar 2 | |
| Support structure's height [m] | Total height [m] (without hub and blades) |
| 90 | 205.63 |
| Support structure's accumulated mass [kg] | |
| 1.333 × 10⁷ | |
| Support structure's accumulated volume [m3] | |
| 14876 | |
| Length of each blade [m] | |
| 86.365 | |
| Additional masses at hub [kg] | |
| Nacelle: 4.4604 × 10⁵ , Hub: 1.0552 × 10⁵ | |
| Stress-free length of each mooring line [m] | |
| 902 | |
| Water depth [m] | |
| 320 | |
Table 6.
Characteristics of TLPWT floating wind turbine implemented in Sima 4.6.4 software.
| TLPWT | |
| Support structure's height [m] | Total height [m] (without hub and blades) |
| Tethers: 168.95, Floating body: 45.3 | Without tethers: 150.93 |
| Support structure's accumulated mass [kg] | |
| 8.013 × 10⁶ | |
| Support structure's accumulated volume [m3] | |
| 20584 | |
| Length of each blade [m] | |
| 86.365 | |
| Additional masses at hub [kg] | |
| Nacelle: 4.4604 × 10⁵ , Hub: 1.0552 × 10⁵ | |
| Stress-free length of each mooring line [m] | |
| 168.95 | |
| Water depth [m] | |
| 200 | |
Table 7.
Characteristics of INO-WINDMOOR floating wind turbine implemented in Sima 4.6.4 software.
| INO-WINDMOOR | |
| Support structure's height [m] | Total height [m] (without hub and blades) |
| 31 | 141.2 |
| Support structure's accumulated mass [kg] | |
| 1.1974 × 10⁷ | |
| Support structure's accumulated volume [m3] | |
| 21954 | |
| Length of each blade [m] | |
| 105.4 | |
| Additional masses at hub [kg] | |
| Nacelle: 6.0 × 10⁵ | |
| Stress-free length of each mooring line [m] | |
| 694.8 | |
| Water depth [m] | |
| 150 | |
Table 8.
Characteristics of VolturnUS-S floating wind turbine implemented in Sima 4.6.4 software.
| UMaine VolturnUS-S | |
| Support structure's height [m] | Total height [m] (without hub and blades) |
| 30 | 159.5 |
| Support structure's accumulated mass [kg] | |
| 1.7854 × 10⁷ | |
| Support structure's accumulated volume [m3] | |
| 0.00032002 | |
| Length of each blade [m] | |
| 117 | |
| Additional masses at hub [kg] | |
| Nacelle: 6.3089 × 10⁵ , Hub: 1.9 × 10⁵ | |
| Stress-free length of each mooring line [m] | |
| 850 | |
| Water depth [m] | |
| 200 | |
Table 9.
Surge offset for four 10 MW floating wind turbines (No wave and current).
| Surge (m) – No wave and current | ||||
|---|---|---|---|---|
| Wind speeds (m/s) | OO-Star 10 MW | CSC 10 MW | WindFloat 10 MW | TLPWT 10 MW |
| 4 | 4.752 | 1.5711603 | 1.8570507 | 0.46218206 |
| 6 | 10.74 | 3.5589209 | 4.0161631 | 1.02183122 |
| 8 | 18.77 | 6.2407331 | 6.8134159 | 1.7443877 |
| 10 | 28.94 | 9.8146428 | 10.548928 | 2.7244958 |
| 11.4 | 29.18 | 11.7479565 | 13.367154 | 2.220202805 |
| 12 | 25.76 | 9.6410925 | 11.4158108 | 2.797775841 |
| 14 | 20.69 | 7.5495877 | 7.8324015 | 2.41575734 |
| 16 | 17.84 | 6.2701501 | 6.8532543 | 1.937335402 |
| 18 | 15.94 | 5.597804 | 6.438483 | 1.653312834 |
| 20 | 14.58 | 5.1229164 | 5.773129 | 1.467435292 |
| 22 | 13.58 | 4.7424055 | 5.4126289 | 1.325892473 |
| 24 | 12.82 | 4.4414538 | 5.0632492 | 1.186015891 |
Table 10.
Roll offset for four 10 MW floating wind turbines (No wave and current).
| Roll (°) - No wave and current | ||||
|---|---|---|---|---|
| Wind speeds (m/s) | OO-Star 10 MW | CSC 10 MW | WindFloat 10 MW | TLPWT 10 MW |
| 4 | 0.021196109 | 0.012586148 | 0.009501893 | -0.000014721580608 |
| 6 | 0.090533626 | 0.086641684 | 0.075987935 | -0.00000424099874 |
| 8 | 0.203026412 | 0.17955046 | 0.16041037 | -0.000072903915 |
| 10 | 0.29546251 | 0.26440143 | 0.23532584 | -0.00064384837 |
| 11.4 | 0.36856523 | 0.34193188 | 0.30039516 | 0.0016448749575 |
| 12 | 0.36976521 | 0.38156656 | 0.33008676 | 0.00175761643986 |
| 14 | 0.38924902 | 0.39964313 | 0.37065293 | -0.0012924914032 |
| 16 | 0.38267845 | 0.4039469 | 0.37340145 | -0.0015577809242 |
| 18 | 0.36671632 | 0.40334986 | 0.36903562 | -0.0016854162823 |
| 20 | 0.34632571 | 0.39955874 | 0.36356557 | -0.0018066855772 |
| 22 | 0.32359103 | 0.39325279 | 0.35156244 | -0.00192823478212 |
| 24 | 0.29778638 | 0.38253466 | 0.33492764 | -0.0020314286011 |
Table 11.
Pitch offset for four 10 MW floating wind turbines (No wave and current).
| Pitch (°) – No wave and current | ||||
|---|---|---|---|---|
| Wind speeds (m/s) | OO-Star 10 MW | CSC 10 MW | WindFloat 10 MW | TLPWT 10 MW |
| 4 | 0.67548305 | 0.72509617 | 6.0928229 | 0.00078066 |
| 6 | 1.7481751 | 1.9576922 | 7.3798083 | 0.001928665 |
| 8 | 3.2628353 | 3.5483993 | 8.9984904 | 0.003392921 |
| 10 | 5.3801791 | 5.6086633 | 11.057268 | 0.005418572 |
| 11.4 | 5.9357121 | 6.7623588 | 12.404409 | 0.005398305 |
| 12 | 4.5190515 | 5.6938586 | 11.5299299 | 0.005354787 |
| 14 | 3.5857863 | 4.2698229 | 9.8150873 | 0.003985467 |
| 16 | 3.1088003 | 3.6212972 | 9.1584622 | 0.003325698 |
| 18 | 2.7952024 | 3.2123087 | 8.7218381 | 0.002915725 |
| 20 | 2.5692443 | 2.9274001 | 8.3823518 | 0.002627699 |
| 22 | 2.4008846 | 2.7218655 | 8.1495079 | 0.002408272 |
| 24 | 2.2684396 | 2.574747 | 7.9690933 | 0.002237857 |
Table 12.
Surge offset for 15 MW and 12 MW floating wind turbines (No wave and current).
| Surge (m) - No wave and current | ||
|---|---|---|
| Wind speeds (m/s) | UMaine VolturnUS-S 15 MW | INO-WINDMOOR 12 MW (Wind and wave directions: 180°) |
| 4 | 4.2283157 | -3.3250485 |
| 6 | 9.5842102 | -6.0535959 |
| 8 | 14.687909 | -9.0343912 |
| 10 | 16.34325 | -10.1549682 |
| 10.6 | 15.957914 | -10.335691 |
| 12 | 16.035105 | -10.3091443 |
| 14 | 15.027325 | -9.1472944 |
| 16 | 13.466089 | -8.4195947 |
| 18 | 12.257901 | -7.9835125 |
| 20 | 11.3005219 | -7.7267096 |
| 22 | 10.5738875 | -7.6005481 |
| 24 | 9.9958327 | -7.5361433 |
Table 13.
Roll offset for 15 MW and 12 MW floating wind turbines (No wave and current).
| Roll (°) – No wave and current | ||
|---|---|---|
| Wind speeds (m/s) | UMaine VolturnUS-S 15 MW | INO-WINDMOOR 12 MW (Wind and wave directions: 180°) |
| 4 | 0.024738216 | -0.079730354 |
| 6 | 0.106482107 | -0.16951409 |
| 8 | 0.222529991 | -0.29386765 |
| 10 | 0.349024831 | -0.46293545 |
| 10.6 | 0.334377681 | -0.52665062 |
| 12 | 0.39369416 | -0.57149777 |
| 14 | 0.40640224 | -0.57558037 |
| 16 | 0.419718715 | -0.57208878 |
| 18 | 0.38150479 | -0.55544239 |
| 20 | 0.37371751 | -0.52424408 |
| 22 | 0.35727372 | -0.47040723 |
| 24 | 0.33781389 | -0.37925695 |
Table 14.
Pitch offset for 15 MW and 12 MW floating wind turbines (No wave and current).
| Pitch (°) – No wave and current | ||
|---|---|---|
| Wind speeds (m/s) | UMaine VolturnUS-S 15 MW | INO-WINDMOOR 12 MW (Wind and wave directions: 180°) |
| 4 | -0.6392493 | 0.72673546 |
| 6 | 0.64665182 | -0.9931595 |
| 8 | 2.2079926 | -3.2339473 |
| 10 | 2.7428275 | -4.2336455 |
| 10.6 | 2.6074107 | -4.4647282 |
| 12 | 2.6377763 | -4.4955361 |
| 14 | 2.2840643 | -3.12880719 |
| 16 | 1.833806158 | -2.6687901 |
| 18 | 1.41787403 | -2.1777331 |
| 20 | 1.203695 | -1.8891515 |
| 22 | 1.01479135 | -1.6857855 |
| 24 | 0.86969624 | -1.5455255 |
Table 15.
Surge offset for two 10 MW Spar floating wind turbines (No wave and current).
| Surge (m) – No wave and current | ||
|---|---|---|
| Wind speeds (m/s) | DTU Spar 1 (10 MW) | DTU Spar 2 (10 MW) |
| 4 | 6.1057331 | 4.6477189 |
| 6 | 14.320404 | 11.083265 |
| 8 | 24.83606 | 19.629442 |
| 10 | 37.565531 | 29.982764 |
| 11.4 | 37.911017 | 26.397656 |
| 12 | 31.3961 | 29.590691 |
| 14 | 26.412795 | 22.484385 |
| 16 | 23.291997 | 19.040911 |
| 18 | 20.952164 | 16.888591 |
| 20 | 19.204944 | 15.45742 |
| 22 | 17.876814 | 14.398339 |
| 24 | 16.822756 | 13.591669 |
Table 16.
Roll offset for two 10 MW Spar floating wind turbines (No wave and current).
| Roll (°) – No wave and current | ||
|---|---|---|
| Wind speeds (m/s) | DTU Spar 1 (10 MW) | DTU Spar 2 (10 MW) |
| 4 | 0.010289095 | 0.017350745 |
| 6 | 0.061706686 | 0.091092209 |
| 8 | 0.1152114 | 0.17795539 |
| 10 | 0.15603373 | 0.22974965 |
| 11.4 | 0.24329654 | 0.352566277 |
| 12 | 0.27734861 | 0.35101414 |
| 14 | 0.28256566 | 0.42017851 |
| 16 | 0.27873283 | 0.4182093 |
| 18 | 0.26759476 | 0.40352433 |
| 20 | 0.24943737 | 0.37523083 |
| 22 | 0.22411391 | 0.34027319 |
| 24 | 0.19116734 | 0.2877506 |
Table 17.
Pitch offset for two 10 MW Spar floating wind turbines (No wave and current).
| Pitch (°) – No wave and current | ||
|---|---|---|
| Wind speeds (m/s) | DTU Spar 1 (10 MW) | DTU Spar 2 (10 MW) |
| 4 | 1.0800594 | 1.4607542 |
| 6 | 2.6590329 | 3.6323676 |
| 8 | 4.7144675 | 6.4514713 |
| 10 | 7.4134843 | 10.096216 |
| 11.4 | 7.5776964 | 10.2703087 |
| 12 | 6.2698139 | 10.5926203 |
| 14 | 5.2402478 | 7.3503991 |
| 16 | 4.5053967 | 6.2380533 |
| 18 | 4.0210779 | 5.5411869 |
| 20 | 3.660919 | 5.0702994 |
| 22 | 3.4151146 | 4.6954448 |
| 24 | 3.2138405 | 4.4253116 |
Table 18.
OO-Star All degrees of freedom at rated wind speed (11.4 m/s).
| OO-Star Surge at rated wind speed (11.4 m/s) | |
|---|---|
| No waves and current sea state | 29.18 m |
| (Hs=2.5m, Tp=10s, no current) sea state | 30.25 m |
| (Hs=2.5m, Tp=10s, with current) sea state | 57.81 m |
| (Hs=4m, Tp=12s, no current) sea state | 30.81 m |
| (Hs=4m, Tp=12s, with current) sea state | 58.3 m |
| OO-Star Sway at rated wind speed (11.4 m/s) | |
| (Hs=2.5m, Tp=10s, no current) sea state | 0.222 m |
| (Hs=2.5m, Tp=10s, with current) sea state | 0.1538 m |
| (Hs=4m, Tp=12s, no current) sea state | 0.2193 m |
| (Hs=4m, Tp=12s, with current) sea state | 0.1514 m |
| OO-Star Heave at rated wind speed (11.4 m/s) | |
| (Hs=2.5m, Tp=10s, no current) sea state | 0.4908 m |
| (Hs=2.5m, Tp=10s, with current) sea state | 0.5906 m |
| (Hs=4m, Tp=12s, no current) sea state | 0.4756 m |
| (Hs=4m, Tp=12s, with current) sea state | 0.5785 m |
| OO-Star Roll at rated wind speed (11.4 m/s) | |
| No waves and current sea state | 0.3685° |
| (Hs=2.5m, Tp=10s, no current) sea state | 0.3843° |
| (Hs=2.5m, Tp=10s, with current) sea state | 0.3704° |
| (Hs=4m, Tp=12s, no current) sea state | 0.3853° |
| (Hs=4m, Tp=12s, with current) sea state | 0.3684° |
| OO-Star Pitch at rated wind speed (11.4 m/s) | |
| No waves and current sea state | 5.9357° |
| (Hs=2.5m, Tp=10s, no current) sea state | 5.658° |
| (Hs=2.5m, Tp=10s, with current) sea state | 3.701° |
| (Hs=4m, Tp=12s, no current) sea state | 5.637° |
| (Hs=4m, Tp=12s, with current) sea state | 3.652° |
| OO-Star Yaw at rated wind speed (11.4 m/s) | |
| (Hs=2.5m, Tp=10s, no current) sea state | 0.1253° |
| (Hs=2.5m, Tp=10s, with current) sea state | 0.1226° |
| (Hs=4m, Tp=12s, no current) sea state | 0.1229° |
| (Hs=4m, Tp=12s, with current) sea state | 0.1213° |
Table 19.
CSC All degrees of freedom at rated wind speed (11.4 m/s).
| CSC Surge at rated wind speed (11.4 m/s) | |
|---|---|
| No waves and current sea state | 11.76 m |
| (Hs=2.5m, Tp=10s, no current) sea state | 11.7 m |
| (Hs=2.5m, Tp=10s, with current) sea state | 39 m |
| (Hs=4m, Tp=12s, no current) sea state | 11.79 m |
| (Hs=4m, Tp=12s, with current) sea state | 39.08 m |
| CSC Sway at rated wind speed (11.4 m/s) | |
| (Hs=2.5m, Tp=10s, no current) sea state | 0.09758 m |
| (Hs=2.5m, Tp=10s, with current) sea state | 0.01952 m |
| (Hs=4m, Tp=12s, no current) sea state | 0.1001 m |
| (Hs=4m, Tp=12s, with current) sea state | 0.02102 m |
| CSC Heave at rated wind speed (11.4 m/s) | |
| (Hs=2.5m, Tp=10s, no current) sea state | 0.183 m |
| (Hs=2.5m, Tp=10s, with current) sea state | 0.6194 m |
| (Hs=4m, Tp=12s, no current) sea state | 0.1704 m |
| (Hs=4m, Tp=12s, with current) sea state | 0.6144 m |
| CSC Roll at rated wind speed (11.4 m/s) | |
| No waves and current sea state | 0.3419° |
| (Hs=2.5m, Tp=10s, no current) sea state | 0.347° |
| (Hs=2.5m, Tp=10s, with current) sea state | 0.301° |
| (Hs=4m, Tp=12s, no current) sea state | 0.3476° |
| (Hs=4m, Tp=12s, with current) sea state | 0.3013° |
| CSC Pitch at rated wind speed (11.4 m/s) | |
| No waves and current sea state | 6.7623° |
| (Hs=2.5m, Tp=10s, no current) sea state | 6.7° |
| (Hs=2.5m, Tp=10s, with current) sea state | 4.569° |
| (Hs=4m, Tp=12s, no current) sea state | 6.739° |
| (Hs=4m, Tp=12s, with current) sea state | 4.513° |
| CSC Yaw at rated wind speed (11.4 m/s) | |
| (Hs=2.5m, Tp=10s, no current) sea state | 0.08643° |
| (Hs=2.5m, Tp=10s, with current) sea state | 0.103° |
| (Hs=4m, Tp=12s, no current) sea state | 0.08226° |
| (Hs=4m, Tp=12s, with current) sea state | 0.105° |
Table 20.
WindFloat All degrees of freedom at rated wind speed (11.4 m/s).
| WindFloat Surge at rated wind speed (11.4 m/s) | |
|---|---|
| No waves and current sea state | 13.4 m |
| (Hs=2.5m, Tp=10s, no current) sea state | 13.26 m |
| (Hs=2.5m, Tp=10s, with current) sea state | 34.8 m |
| (Hs=4m, Tp=12s, no current) sea state | 13.15 m |
| (Hs=4m, Tp=12s, with current) sea state | 34.97 m |
| WindFloat Sway at rated wind speed (11.4 m/s) | |
| (Hs=2.5m, Tp=10s, no current) sea state | 0.1426 m |
| (Hs=2.5m, Tp=10s, with current) sea state | 0.01635 m |
| (Hs=4m, Tp=12s, no current) sea state | 0.1302 m |
| (Hs=4m, Tp=12s, with current) sea state | 0.02374 m |
| WindFloat Heave at rated wind speed (11.4 m/s) | |
| (Hs=2.5m, Tp=10s, no current) sea state | 1.399 m |
| (Hs=2.5m, Tp=10s, with current) sea state | 1.44 m |
| (Hs=4m, Tp=12s, no current) sea state | 1.379 m |
| (Hs=4m, Tp=12s, with current) sea state | 1.411 m |
| WindFloat Roll at rated wind speed (11.4 m/s) | |
| No waves and current sea state | 0.30039° |
| (Hs=2.5m, Tp=10s, no current) sea state | 0.2995° |
| (Hs=2.5m, Tp=10s, with current) sea state | 0.2557° |
| (Hs=4m, Tp=12s, no current) sea state | 0.3009° |
| (Hs=4m, Tp=12s, with current) sea state | 0.2578° |
| WindFloat Pitch at rated wind speed (11.4 m/s) | |
| No waves and current sea state | 12.4044° |
| (Hs=2.5m, Tp=10s, no current) sea state | 12.23° |
| (Hs=2.5m, Tp=10s, with current) sea state | 11.44° |
| (Hs=4m, Tp=12s, no current) sea state | 12.12° |
| (Hs=4m, Tp=12s, with current) sea state | 11.29° |
| WindFloat Yaw at rated wind speed (11.4 m/s) | |
| (Hs=2.5m, Tp=10s, no current) sea state | 0.05104° |
| (Hs=2.5m, Tp=10s, with current) sea state | 0.03536° |
| (Hs=4m, Tp=12s, no current) sea state | 0.0223° |
| (Hs=4m, Tp=12s, with current) sea state | 0.05138° |
Table 21.
TLPWT All degrees of freedom at rated wind speed (11.4 m/s).
| TLPWT Surge at rated wind speed (11.4 m/s) | |
|---|---|
| No waves and current sea state | 2.2 m |
| (Hs=2.5m, Tp=10s, no current) sea state | 2.648 m |
| (Hs=2.5m, Tp=10s, with current) sea state | 4.834 m |
| (Hs=4m, Tp=12s, no current) sea state | 2.642 m |
| (Hs=4m, Tp=12s, with current) sea state | 4.823 m |
| TLPWT Sway at rated wind speed (11.4 m/s) | |
| (Hs=2.5m, Tp=10s, no current) sea state | 0.003266 m |
| (Hs=2.5m, Tp=10s, with current) sea state | 0.007036 m |
| (Hs=4m, Tp=12s, no current) sea state | 0.002409 m |
| (Hs=4m, Tp=12s, with current) sea state | 0.007561 m |
| TLPWT Heave at rated wind speed (11.4 m/s) | |
| (Hs=2.5m, Tp=10s, no current) sea state | 0.1718 m |
| (Hs=2.5m, Tp=10s, with current) sea state | 0.06889 m |
| (Hs=4m, Tp=12s, no current) sea state | 0.1687 m |
| (Hs=4m, Tp=12s, with current) sea state | 0.06962 m |
| TLPWT Roll at rated wind speed (11.4 m/s) | |
| No waves and current sea state | 0.001644° |
| (Hs=2.5m, Tp=10s, no current) sea state | 0.001755° |
| (Hs=2.5m, Tp=10s, with current) sea state | 0.002103° |
| (Hs=4m, Tp=12s, no current) sea state | 0.001585° |
| (Hs=4m, Tp=12s, with current) sea state | 0.002142° |
| TLPWT Pitch at rated wind speed (11.4 m/s) | |
| No waves and current sea state | 0.005398° |
| (Hs=2.5m, Tp=10s, no current) sea state | 0.005472° |
| (Hs=2.5m, Tp=10s, with current) sea state | 0.005766° |
| (Hs=4m, Tp=12s, no current) sea state | 0.005455° |
| (Hs=4m, Tp=12s, with current) sea state | 0.005739° |
| TLPWT Yaw at rated wind speed (11.4 m/s) | |
| (Hs=2.5m, Tp=10s, no current) sea state | 0.09487° |
| (Hs=2.5m, Tp=10s, with current) sea state | 0.08323° |
| (Hs=4m, Tp=12s, no current) sea state | 0.09493° |
| (Hs=4m, Tp=12s, with current) sea state | 0.08369° |
Table 22.
UMaine VolturnUS-S 15 MW All degrees of freedom at rated wind speed (10.6 m/s).
| UMaine VolturnUS-S Surge at rated wind speed (10.6 m/s) | |
|---|---|
| No waves and current sea state | 15.95 m |
| (Hs=2.5m, Tp=10s, no current) sea state | 19.74 m |
| (Hs=2.5m, Tp=10s, with current) sea state | 24.29 m |
| (Hs=4m, Tp=12s, no current) sea state | 19.71 m |
| (Hs=4m, Tp=12s, with current) sea state | 24.25 m |
| UMaine VolturnUS-S Sway at rated wind speed (10.6 m/s) | |
| (Hs=2.5m, Tp=10s, no current) sea state | 0.08863 m |
| (Hs=2.5m, Tp=10s, with current) sea state | 0.1004 m |
| (Hs=4m, Tp=12s, no current) sea state | 0.08035 m |
| (Hs=4m, Tp=12s, with current) sea state | 0.09051 m |
| UMaine VolturnUS-S Heave at rated wind speed (10.6 m/s) | |
| (Hs=2.5m, Tp=10s, no current) sea state | 0.131 m |
| (Hs=2.5m, Tp=10s, with current) sea state | 0.2013 m |
| (Hs=4m, Tp=12s, no current) sea state | 0.1223 m |
| (Hs=4m, Tp=12s, with current) sea state | 0.1941 m |
| UMaine VolturnUS-S Roll at rated wind speed (10.6 m/s) | |
| No waves and current sea state | 0.3343° |
| (Hs=2.5m, Tp=10s, no current) sea state | 0.395° |
| (Hs=2.5m, Tp=10s, with current) sea state | 0.3978° |
| (Hs=4m, Tp=12s, no current) sea state | 0.3941° |
| (Hs=4m, Tp=12s, with current) sea state | 0.3968° |
| UMaine VolturnUS-S Pitch at rated wind speed (10.6 m/s) | |
| No waves and current sea state | 2.6074° |
| (Hs=2.5m, Tp=10s, no current) sea state | 4.032° |
| (Hs=2.5m, Tp=10s, with current) sea state | 3.719° |
| (Hs=4m, Tp=12s, no current) sea state | 3.978° |
| (Hs=4m, Tp=12s, with current) sea state | 3.658° |
| UMaine VolturnUS-S Yaw at rated wind speed (10.6 m/s) | |
| (Hs=2.5m, Tp=10s, no current) sea state | 0.3112° |
| (Hs=2.5m, Tp=10s, with current) sea state | 0.2486° |
| (Hs=4m, Tp=12s, no current) sea state | 0.3039° |
| (Hs=4m, Tp=12s, with current) sea state | 0.2418° |
Table 23.
INO-WINDMOOR All degrees of freedom at rated wind speed (10.6 m/s).
| INO-WINDMOOR Surge at rated wind speed (10.6 m/s) | |
|---|---|
| No waves and current sea state | 10.33 m |
| (Hs=2.5m, Tp=10s, no current) sea state | 10.51 m |
| (Hs=2.5m, Tp=10s, with current) sea state | 40.84 m |
| (Hs=4m, Tp=12s, no current) sea state | 10.55 m |
| (Hs=4m, Tp=12s, with current) sea state | 41.07 m |
| INO-WINDMOOR Sway at rated wind speed (10.6 m/s) | |
| (Hs=2.5m, Tp=10s, no current) sea state | 0.03549 m |
| (Hs=2.5m, Tp=10s, with current) sea state | 0.06047 m |
| (Hs=4m, Tp=12s, no current) sea state | 0.03101 m |
| (Hs=4m, Tp=12s, with current) sea state | 0.05433 m |
| INO-WINDMOOR Heave at rated wind speed (10.6 m/s) | |
| (Hs=2.5m, Tp=10s, no current) sea state | 0.07974 m |
| (Hs=2.5m, Tp=10s, with current) sea state | 0.4506 |
| (Hs=4m, Tp=12s, no current) sea state | 0.07713 m |
| (Hs=4m, Tp=12s, with current) sea state | 0.4539 |
| INO-WINDMOOR Roll at rated wind speed (10.6 m/s) | |
| No waves and current sea state | 0.5266° |
| (Hs=2.5m, Tp=10s, no current) sea state | 0.5262° |
| (Hs=2.5m, Tp=10s, with current) sea state | 0.5053° |
| (Hs=4m, Tp=12s, no current) sea state | 0.5265° |
| (Hs=4m, Tp=12s, with current) sea state | 0.5056° |
| INO-WINDMOOR Pitch at rated wind speed (10.6 m/s) | |
| No waves and current sea state | 4.46472° |
| (Hs=2.5m, Tp=10s, no current) sea state | 4.45183° |
| (Hs=2.5m, Tp=10s, with current) sea state | 2.362333° |
| (Hs=4m, Tp=12s, no current) sea state | 4.44786° |
| (Hs=4m, Tp=12s, with current) sea state | 2.37938° |
| INO-WINDMOOR Yaw at rated wind speed (10.6 m/s) | |
| (Hs=2.5m, Tp=10s, no current) sea state | 0.58993° |
| (Hs=2.5m, Tp=10s, with current) sea state | 0.05136° |
| (Hs=4m, Tp=12s, no current) sea state | 0.58756° |
| (Hs=4m, Tp=12s, with current) sea state | 0.0542622° |
Table 24.
DTU Spar 1 All degrees of freedom at rated wind speed (11.4 m/s).
| DTU Spar 1 Surge at rated wind speed (11.4 m/s) | |
|---|---|
| No waves and current sea state | 37.91 m |
| (Hs=2.5m, Tp=10s, no current) sea state | 38 m |
| (Hs=2.5m, Tp=10s, with current) sea state | 62.18 m |
| (Hs=4m, Tp=12s, no current) sea state | 37.67 m |
| (Hs=4m, Tp=12s, with current) sea state | 62.09 m |
| DTU Spar 1 Sway at rated wind speed (11.4 m/s) | |
| (Hs=2.5m, Tp=10s, no current) sea state | 0.309 m |
| (Hs=2.5m, Tp=10s, with current) sea state | 0.3219 m |
| (Hs=4m, Tp=12s, no current) sea state | 0.3186 m |
| (Hs=4m, Tp=12s, with current) sea state | 0.3243 m |
| DTU Spar 1 Heave at rated wind speed (11.4 m/s) | |
| (Hs=2.5m, Tp=10s, no current) sea state | 1.365 m |
| (Hs=2.5m, Tp=10s, with current) sea state | 3.384 m |
| (Hs=4m, Tp=12s, no current) sea state | 1.345 m |
| (Hs=4m, Tp=12s, with current) sea state | 3.374 m |
| DTU Spar 1 Roll at rated wind speed (11.4 m/s) | |
| No waves and current sea state | 0.2197° |
| (Hs=2.5m, Tp=10s, no current) sea state | 0.2222° |
| (Hs=2.5m, Tp=10s, with current) sea state | 0.2177° |
| (Hs=4m, Tp=12s, no current) sea state | 0.2241° |
| (Hs=4m, Tp=12s, with current) sea state | 0.2181° |
| DTU Spar 1 Pitch at rated wind speed (11.4 m/s) | |
| No waves and current sea state | 7.577696° |
| (Hs=2.5m, Tp=10s, no current) sea state | 7.789° |
| (Hs=2.5m, Tp=10s, with current) sea state | 8.243° |
| (Hs=4m, Tp=12s, no current) sea state | 7.708° |
| (Hs=4m, Tp=12s, with current) sea state | 8.201° |
| DTU Spar 1 Yaw at rated wind speed (11.4 m/s) | |
| (Hs=2.5m, Tp=10s, no current) sea state | 0.3432° |
| (Hs=2.5m, Tp=10s, with current) sea state | 0.3169° |
| (Hs=4m, Tp=12s, no current) sea state | 0.3598° |
| (Hs=4m, Tp=12s, with current) sea state | 0.3229° |
Table 25.
DTU Spar 2 All degrees of freedom at rated wind speed (11.4 m/s).
| DTU Spar 2 Surge at rated wind speed (11.4 m/s) | |
|---|---|
| No waves and current sea state | 26.39 m |
| (Hs=2.5m, Tp=10s, no current) sea state | 30.72 m |
| (Hs=2.5m, Tp=10s, with current) sea state | 50.74 m |
| (Hs=4m, Tp=12s, no current) sea state | 30.58 m |
| (Hs=4m, Tp=12s, with current) sea state | 50.57 m |
| DTU Spar 2 Sway at rated wind speed (11.4 m/s) | |
| (Hs=2.5m, Tp=10s, no current) sea state | 0.2887 m |
| (Hs=2.5m, Tp=10s, with current) sea state | 0.2988 m |
| (Hs=4m, Tp=12s, no current) sea state | 0.2938 m |
| (Hs=4m, Tp=12s, with current) sea state | 0.302 m |
| DTU Spar 2 Heave at rated wind speed (11.4 m/s) | |
| (Hs=2.5m, Tp=10s, no current) sea state | 1.313 m |
| (Hs=2.5m, Tp=10s, with current) sea state | 3.349 m |
| (Hs=4m, Tp=12s, no current) sea state | 1.302 m |
| (Hs=4m, Tp=12s, with current) sea state | 3.326 m |
| DTU Spar 2 Roll at rated wind speed (11.4 m/s) | |
| No waves and current sea state | 0.35256° |
| (Hs=2.5m, Tp=10s, no current) sea state | 0.3202° |
| (Hs=2.5m, Tp=10s, with current) sea state | 0.3134° |
| (Hs=4m, Tp=12s, no current) sea state | 0.3225° |
| (Hs=4m, Tp=12s, with current) sea state | 0.3147° |
| DTU Spar 2 Pitch at rated wind speed (11.4 m/s) | |
| No waves and current sea state | 10.2703° |
| (Hs=2.5m, Tp=10s, no current) sea state | 10.7° |
| (Hs=2.5m, Tp=10s, with current) sea state | 10.93° |
| (Hs=4m, Tp=12s, no current) sea state | 10.63° |
| (Hs=4m, Tp=12s, with current) sea state | 10.83° |
| DTU Spar 2 Yaw at rated wind speed (11.4 m/s) | |
| (Hs=2.5m, Tp=10s, no current) sea state | 0.2969° |
| (Hs=2.5m, Tp=10s, with current) sea state | 0.2651° |
| (Hs=4m, Tp=12s, no current) sea state | 0.3127° |
| (Hs=4m, Tp=12s, with current) sea state | 0.2753° |
Table 26.
Maximum response offset values of each degree of freedom for each floating wind turbine (Summary of Subsection 3.2).
Table 26.
Maximum response offset values of each degree of freedom for each floating wind turbine (Summary of Subsection 3.2).
| Surge [m] | |
|---|---|
| OO-Star | 58.3 |
| CSC | 39.08 |
| WindFloat | 34.97 |
| TLPWT | 4.834 |
| VolturnUS-S | 24.29 |
| INO-WINDMOOR | 41.07 |
| DTU Spar 1 | 62.18 |
| DTU Spar 2 | 50.74 |
| Sway [m] | |
| OO-Star | 0.222 |
| CSC | 0.1001 |
| WindFloat | 0.1426 |
| TLPWT | 0.007561 |
| VolturnUS-S | 0.1004 |
| INO-WINDMOOR | 0.06047 |
| DTU Spar 1 | 0.3243 |
| DTU Spar 2 | 0.302 |
| Heave [m] | |
| OO-Star | 0.5906 |
| CSC | 0.6194 |
| WindFloat | 1.44 |
| TLPWT | 0.1718 |
| VolturnUS-S | 0.2013 |
| INO-WINDMOOR | 0.4539 |
| DTU Spar 1 | 3.384 |
| DTU Spar 2 | 3.349 |
| Roll [°] | |
| OO-Star | 0.3853 |
| CSC | 0.3476 |
| WindFloat | 0.3009 |
| TLPWT | 0.002142 |
| VolturnUS-S | 0.3978 |
| INO-WINDMOOR | 0.5266 |
| DTU Spar 1 | 0.2241 |
| DTU Spar 2 | 0.35256 |
| Pitch [°] | |
| OO-Star | 5.9357 |
| CSC | 6.7623 |
| WindFloat | 12.12 |
| TLPWT | 0.005766 |
| VolturnUS-S | 4.032 |
| INO-WINDMOOR | 4.46472 |
| DTU Spar 1 | 8.243 |
| DTU Spar 2 | 10.93 |
| Yaw [°] | |
| OO-Star | 0.1253 |
| CSC | 0.105 |
| WindFloat | 0.05138 |
| TLPWT | 0.09493 |
| VolturnUS-S | 0.3112 |
| INO-WINDMOOR | 0.58993 |
| DTU Spar 1 | 0.3598 |
| DTU Spar 2 | 0.3127 |
Disclaimer/Publisher’s Note: The statements, opinions and data contained in all publications are solely those of the individual author(s) and contributor(s) and not of MDPI and/or the editor(s). MDPI and/or the editor(s) disclaim responsibility for any injury to people or property resulting from any ideas, methods, instructions or products referred to in the content. |
© 2025 by the authors. Licensee MDPI, Basel, Switzerland. This article is an open access article distributed under the terms and conditions of the Creative Commons Attribution (CC BY) license (http://creativecommons.org/licenses/by/4.0/).
Copyright: This open access article is published under a Creative Commons CC BY 4.0 license, which permit the free download, distribution, and reuse, provided that the author and preprint are cited in any reuse.


