
Submitted:
04 November 2024
Posted:
06 November 2024
You are already at the latest version
Abstract
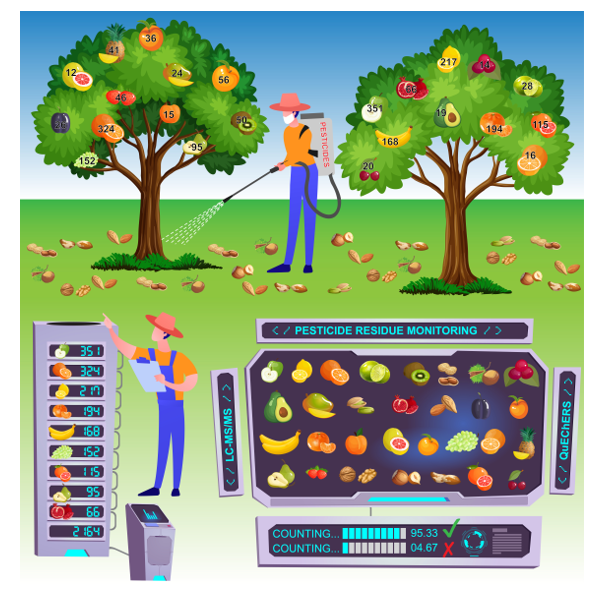
The concentrations of pesticide residues were determined in 2,164 samples of 46 fruits species, collected over a 4-year period. Fruits originated from 59 countries, including Serbia (N = 199). Pesticide residues were determined by the liquid chromatography tandem mass spectrometry (LC-MS/MS) after extraction by a modified QuEChERS protocol. A total of 173 pesticide residues were detected. 62.57% of fruit samples had pesticide residues at or above 0.01 mg/kg, and 4.67% of samples exceeded the maximum residue limits (MRLs) set by the Serbian regulation. MRL values were most often exceeded in pomegranate and citrus fruits (grapefruit and mandarin). Most frequently found pesticide was imazalil (detected in 624 samples, 28.84%) with the highest concentration (93.870 mg/kg) in a grapefruit sample. Multiple pesticides were detected in 50.92% of the fruit samples, and two grapefruit samples contained up to 44 pesticide residues.
Keywords:
fruits
; pesticide residues
; maximum residue levels
; food safety
1. Introduction
Pesticides play a significant role in food production. They protect or increase yields and may increase the number of times each year a crop can be grown on the same land. Pesticides are used to protect crops against insects, weeds, fungi and other pests. Since they are designed to be biologically active, pesticides are potentially toxic to humans and can have both acute and chronic health effects, depending on the quantity and ways in which a person is exposed [1]. For this reason, pesticide residue levels in food are regulated by national and European legislation. These comprehensive legislative frameworks define rules for the approval of active substances, their uses in plant protection products and their permissible residues in food. To ensure a high level of consumer protection, legal limits, or so-called ‘maximum residue levels’ (MRLs) are established in Regulation (EC) No 396/2005 [2]. European Union harmonized MRLs are set for more than 1,300 pesticides covering 378 food products/food groups [3]. This regulation is being continuously amended by several Regulations and Commission Regulations to update the commodities included and their residue levels, based on the most recent knowledge from the Member States, EFSA and the Commission. In Serbia, Regulation on the ’’maximum residue levels of pesticides in food’’ have changed few times over the past 10 years [4,5,6], with the aim of aligning the national legislation with the EU regulation. The latest Serbian Regulation [7] on the ’’maximum residue levels of pesticides in food’’ is fully harmonized with the European Union Regulations.
There have been many surveys of pesticide residues in fruits/food recently [3,8,9,10,11,12,13,14,15,16,17,18]. Summary of the studies published in available literature dealing with pesticide residues in fruit (from 2010 onwards) are presented in Supplementary material 1 Table S1. The overall conclusion of these studies is that there is a widespread pesticide presence currently in fruits/food in general. The pesticides are frequently detected above the LOQ, however MRL is seldom exceeded. And some of the pesticide residues were detected with concentrations above their MRL. Also, pesticides that are found in these studies are banned and/or unauthorized in many countries because of their high toxicity. Therefore, pesticide residues control is an important activity intended to prevent, reduce or eliminate the chemical hazard in food.
The objective of this study was to investigate the concentrations of pesticide residues in fruits (Table 1), which are collected as a part of the national monitoring program for pesticide residues in Serbia and to compare these levels with maximum residue levels established by the Serbian Regulation [4,5].
2. Materials and Methods
Over 4-year period, concentrations of pesticide residues were determined in 2,164 samples of fresh fruits (Table 1). The analyses were conducted by an accredited state laboratory (A BIO TECH LAB). The method for sample preparation and analysis of the concentrations of pesticide residues in the collected fresh fruits was conducted as described in detail in Kecojević et al. [19]. A total of 173 (Table 2) pesticide residues were detected in these 2,164 samples. The limit of quantitation (LOQ) for all pesticide residues was 0.005 mg/kg (LOQ for cabbage, Kecojević et al. [19]), while reporting limit (RL) was 0.01 mg/kg. Generally, Serbian as well as EU MRLs for pesticide residues in fruits are in the range of 0.01–10 mg/kg, depending on the compound. Only for a few pesticides MRLs are up to 15 and 20 mg/kg. The results were evaluated according to the RL and MRLs that have been established by Serbian regulation.
3. Results and discussion
The individual concentrations of the analyzed pesticide residues in all samples of fruits (N = 2,164) are shown in the Supplementary material 2 (individual results). All pesticide residues at or above the reporting limit (RL ≥ 0.01 mg/kg) are reported.
In this study, a total of 2,164 samples of fresh fruits were analyzed for pesticide residue. A yearly total of 136 (6.28%), 651 (30.08%), 687 (31.75%) and 690 (31.89%) of these samples were analyzed in 2016 (Serbian fruits: 57 samples; imported fruits: 79 samples), 2017 (Serbian fruits: 38 samples; imported fruits: 613 samples), 2018 (Serbian fruits: 53 samples; imported fruits: 634 samples) and 2019 (Serbian fruits: 51 samples; imported fruits: 639 samples), respectively. Detailed characteristics like common name, country of origin and number of samples (without and with pesticide residues) of the analyzed samples are shown in Table 1. The evaluation of the obtained results of 2,164 different fruit samples has shown (Table 1) that 62.57% (1,354 out of the 2,164 samples) of all samples contained pesticide residues (RL ≥ 0.01 mg/kg) and 37.43% (810 out of the 2,164 samples) of the samples contained no pesticide residues (RL < 0.01 mg/kg). All samples of aronia (N = 1), Brazil nut (N = 2), carambola (N = 2), cashew (N = 1), chestnut (N = 2), fig (N = 1), lychee (N = 1), passion fruit (N = 1), pistachio (N = 1), pitaya (N = 2) and quince (N = 1) were pesticide-free. The detection rates (when the sample size ’’N’’ is greater than 30) of pesticide residues in peach (nectarine) (N = 36), pineapple (N = 41), strawberry (N = 46), kiwi (N = 50), peach (N = 56), pomegranate (N = 66), pear (N = 95), grapefruit (N = 115), grape (N = 152), banana (N = 168), mandarin (N = 194) lemon (N = 217), orange (N = 324) and apple (N = 351) samples were 36.11%, 73.17%, 76.09%, 34.00%, 42.86%, 63.64%, 71.58%, 88.70%, 34.87%, 58.33%, 69.07%, 80.65%, 69.75% and 64.10%, respectively. All pesticide residues detected in almond (N = 6), apricot (N = 15), aronia (N = 1), banana (N = 168), blackberry (N = 2), blueberry (N = 5), Brazil nut (N = 2), carambola (N = 2), cashew (N = 1), chestnut (N = 2), clementine (N = 16), coconut (N = 1), currants (N = 2), date palm (N = 8), fig (N = 1), hazelnut (N = 5), Japanese apple (N = 9), kiwi (N = 50), kumquat (N = 4), lychee (N = 1), mango (N = 24), passion fruit (N = 1), peach (N = 56), peach (nectarine) (N = 36), peanut (N = 8), pistachio (N = 1), pitaya (N = 2), plum (N = 26), pomelo (N = 12), quince (N = 1), raspberry (N = 8), strawberry (N = 46), sweet cherry (N = 20) and walnut (N = 6) were below or at the MRLs. The MRLs for pesticide residues were exceeded in 101 out of the 2,164 (4.67%) samples: apple (12 out of the 351 samples, 3.42%; Bosnia and Herzegovina: N = 2, North Macedonia: N = 2, Poland: N = 3, Serbia: N = 5), avocado (1 out of the 19 samples, 5.26%; Peru: N = 1), grapefruit (21 out of the 115 samples, 18.26%; South Africa: N = 4; Turkey: N = 17), grapes (2 out of the 152 samples, 1.32%; North Macedonia: N = 2), lemon (4 out of the 217 samples, 1.84%; Argentina: N = 1, Turkey: N = 2), lime (4 out of the 28 samples, 14.29%; Guatemala: N = 1, Mexico: N = 2, The Netherlands: N = 1), mandarin (14 out of the 194 samples, 7.22%; Spain: N = 2, Swaziland: N = 1, Turkey: N = 11), orange (7 out of the 324 samples, 2.16%; Spain: N = 1, Turkey: N = 6), pear (6 out of the 95 samples, 6.32%; Poland: N = 2, Serbia: N = 4), pineapple (3 out of the 41 samples, 7.32%; Colombia: N = 1, Costa Rica: N = 2), pomegranate (26 out of the 66 samples, 39.39%; Turkey: N = 26) and sour cherry (1 out of the 14 samples, 7.14%; Serbia: N = 1).
The frequency of the detected pesticide residues in fruit samples are shown in Table 2. A total of 173 pesticide residues (distributed as: 49.13% insecticides, 35.84% fungicides and 15.03% herbicides) were detected in all the fruit samples (Table 2). Imazalil, thiabendazole, pyrimethanil, imidacloprid, carbendazim, acetamiprid, boscalid, fludioxonil, chlorpyrifos, prochloraz, pyriproxyfen, tebuconazole, propiconazole, prothioconazole, azoxystrobrin, methoxyfenozide and pyraclostrobin were the pesticide residues most frequently found (occurrence in more than 90 analyzed samples, > 4%) and were detected in 624 (28.84%), 337 (15.57%), 245 (11.32%), 213 (9.84%), 185 (8.55%), 171 (7.90%), 154 (7.12%), 154 (7.12%), 145 (6.70%), 143 (6.61%), 138 (6.38%), 116 (5.36%), 113 (5.22%), 97 (4.48%), 96 (4.44%), 94 (4.34%) and 93 (4.30%) samples, respectively. Of the 173 pesticide residues, 64 (36.99%) of them were detected at least once in fruit samples in level higher than MRLs. A total of 309 pesticide residues (133 in pomegranate, 43.04%; 95 in grapefruit, 30.74%; 33 in mandarin, 10.68%; 13 in apples, 4.21%; 11 in orange, 3.56%; 7 in pear, 2.27%; 5 in lime, 1.62%; 4 in lemon, 1.29%; 3 in pineapple, 0.97%; 2 in grape, 0.65%; 2 in sour cherry, 0.65; 1 in avocado, 0.32%) were found in the 101 fruit samples containing residues above MRLs. The other 109 (63.01%) pesticide residues did not exceed their MRL values. The most frequent pesticide residues found to exceed the MRL were butoxycarboxim (100%, 5 out of 5 samples), carbofuran (100%, 1 out of 1 sample), deltamethrin (60.00%, 12 out of 20 samples), fenvalerate (60.78%, 31 out of 51 samples), formothion (58.82%, 10 out of 17 samples), iprodione (66.67%, 2 out of 3 samples), mepanipyrim (61.54%, 8 out of 13 samples), mepronil (100%, 1 out of 1 sample), nuariomol (66.67%, 2 out of 3 samples), oxamyl (100%, 10 out of 10 samples), piperonyl-butoxide (50.00%, 1 out of 2 samples), pirimiphos-methyl (83.33%, 10 out of 12 samples), promecarb (71.43%, 5 out of 7 samples), prometryn (75.00%, 3 out of 4 samples), sulfentrazone (50.00%, 2 out of 4 samples), tebuthiuron (63.64%, 7 out of 11 samples), terbutryn (50.00%, 3 out of 6 samples) and tricyclazole (100%, 3 out of 3 samples). Among the mostly detected pesticide residues, imazalil was found at the highest concentration (93.349 mg/kg, 18.67 times higher than MRL) in grapefruit.
An overview of the number of residue residues per sample are shown in Table 3a and Table 3b. Many samples contained several pesticide residues. A total of 5,078 individual pesticide residues were found in the 1,354 fruit samples containing residues. Of the 2,164 samples analyzed, a single pesticide residue was detected in 252 (11.65%) samples and two, three, four, five and six pesticide residues in 278 (12.85%), 227 (10.49%), 203 (9.38%), 145 (6.70%) and 103 (4.76%) samples, respectively. Seven or more pesticide residues were detected in 6.75% of the samples. The samples with highest number of pesticide residues were two samples of grapefruit both with 44 pesticide residues.

Table 3.
a. Number of pesticide residues in an individual sample.
| No. of pesticide residues | 0 | 1 | 2 | 3 | 4 | 5 | 6 | 7 | 8 | 9 | 10 | 11 |
| No. of samples | 810 | 252 | 278 | 227 | 203 | 145 | 103 | 65 | 34 | 19 | 7 | 2 |
| % | 37.43 | 11.65 | 12.85 | 10.49 | 9.38 | 6.70 | 4.76 | 3.00 | 1.57 | 0.88 | 0.32 | 0.09 |
| No. of samples with residues above the MRL | 0 | 7 (7 with 1) | 17 (13 with 1; 4 with 2) |
10 (7 with 1; 3 with 2) |
12 (4 with 1; 6 with 2; 1 with 3; 1 with 4) |
8 (3 with 1; 2 with 2; 2 with 3; 1 with 5) |
15 (7 with 1; 6 with 2; 1 with 3; 1 with 4) |
7 (3 with 1; 1 with 2; 2 with 3; 1 with 5) |
8 (3 with 1; 3 with 2; 1 with 3; 1 with 4) |
5 (3 with 1; 1 with 2; 1 with 4) |
1 (1 with 1) | 0 |
Table 3.
b. Number of pesticide residues in an individual sample.
| No. of pesticide residues | 12 | 13 | 15 | 17 | 26 | 29 | 30 | 31 | 33 | 36 | 39 | 44 |
| No. of samples | 4 | 4 | 1 | 1 | 1 | 1 | 1 | 1 | 1 | 1 | 1 | 2 |
| % | 0.18 | 0.18 | 0.05 | 0.05 | 0.05 | 0.05 | 0.05 | 0.05 | 0.05 | 0.05 | 0.05 | 0.09 |
| No. of samples with residues above the MRL | 2 (1 with 1; 1 with 2) |
0 | 0 | 0 | 1 (1 with 16) | 1 (1 with 17) | 1 (1 with 11) | 1 (1 with 17) | 1 (1 with 18) | 1 (1 with 16) | 1 (1 with 20) | 1 (1 with 19; 1 with 22) |
4. Conclusions
In this study, pesticide residues were determined in 2,164 samples of the most popularly consumed fruits in Serbia (during 2016–2019). There were 1,354 (62.57%) samples contaminated with pesticide residues, of which 101 (4.67%) samples were higher than the MRLs. Among the 101 fruit samples with MRL exceedances, pomegranate was the fruit with the highest number of MRL exceedances (26 samples, 25.74%), followed by grapefruit with 21 samples (20.79%), mandarin with 14 samples (13.86%), apple with 12 samples (11.88%), orange with 7 samples (6.93%), pear with 6 samples (5.94%), lemon and lime with 4 samples each (3.96%), pineapple with 3 samples (2.97%), grapes with 2 samples (1.98%) and avocado and sour cherry with 1 sample each (0.99%). Pomegranate, grapefruit and mandarin showed the highest number of samples with multiple pesticide residues higher than MRLs. These results highlight the need to continuously monitor pesticide residues in fruits in order to fully protect public health.
Supplementary Materials
The following supporting information can be downloaded at the website of this paper posted on Preprints.org. Supplementary material 1 Table S1: Summary of studies dealing with detection of pesticide residue in fresh fruits/food of plant origin.; Supplementary material 2 Individual results.
Author Contributions
Methodology, Validation, Formal Analysis, Data Curation, Writing – Original Draft Preparation, I.K. and D.M.; Conceptualization, Supervision, Project Administration, Data Curation, Writing – Original Draft Preparation – Review & Editing, V.T.; Methodology, Validation, Investigation, Data Curation, B.B. M.L. and A.J.; Formal Analysis, Investigation, Data Curation, M.T., A.M. and S.S.; Supervision, Data Curation, Writing – Original Draft Preparation, D.V. and V.Đ. All authors have read and agreed to the published version of the manuscript.
Funding
This research was funded by the Ministry of Science, Technological Development and Innovation, Republic of Serbia, under grant number 451-03-66/2024-03/200134 and 451-03-65/2024-03/200134. Also, this was funded by the Ministry of Science and Technological Development, Republic of Montenegro [program “Centre of Excellence (CoE) for digitalization of microbial food safety risk assessment and quality parameters for accurate food authenticity certification (FoodHub)] under grant number 01-3660/2.
Data Availability Statement
The data that support the findings of this study are available from the corresponding author upon reasonable request.
Conflicts of Interest
The authors declare no conflicts of interest.
References
- WHO. 2022. Available online: https://www.who.int/news-room/fact-sheets/detail/pesticide-residues-in-food (accessed on 14 April 2024).
- European Commission. Regulation (EC) No 396/2005 of the European Parliament and of the Council of 23 February 2005 on maximum residue levels of pesticides in or on food and feed of plant and animal origin and amending Council Directive 91/414/EEC. Off. J. EU 2005, L70, 1–16. [Google Scholar]
- EFSA (European Food Safety Authority). Scientific report of EFSA: The 2021 European Union report on pesticide residues in food. EFSA J. 2023, 21, 7939. [Google Scholar]
- Serbian Regulation. Rulebook on the maximum allowed quantities of residues of plant protection products in food and feed and on food and feed for which the maximum permitted quantities of residues of plant protection product. Off. Gazette RS. 2014, 29, 2014, 37, 2014, 39, 2014, 72, 2015, 80, 2015, 84, 2016, 35, 2016, 81, 2017, 21 and 2017, 81 (in Serbian).
- Serbian Regulation. Rulebook on the maximum allowed quantities of residues of plant protection products in food and feed and on food and feed for which the maximum permitted quantities of residues of plant protection product. Off. Gazette RS. 2018, 22, 2018, 90, 2019, 76 and 2019, 81 (in Serbian).
- Serbian Regulation. Rulebook on the maximum allowed quantities of residues of plant protection products in food and feed. Off. Gazette RS 2020, 132. (in Serbian). [Google Scholar]
- Serbian Regulation. Rulebook on the maximum allowed quantities of residues of plant protection products in food and feed. Off. Gazette RS 2022, 91. (in Serbian). [Google Scholar]
- EFSA (European Food Safety Authority). Scientific report of EFSA: The 2016 European Union report on pesticide residues in food. EFSA J. 2018, 16, 5348. [Google Scholar]
- EFSA (European Food Safety Authority). Scientific report of EFSA: The 2017 European Union report on pesticide residues in food. EFSA J. 2019, 17, 5743. [Google Scholar]
- EFSA (European Food Safety Authority). Scientific report of EFSA: The 2018 European Union report on pesticide residues in food. EFSA J. 2020, 18, 6057. [Google Scholar]
- EFSA (European Food Safety Authority). Scientific report of EFSA: The 2019 European Union report on pesticide residues in food. EFSA J. 2021, 19, 6491. [Google Scholar]
- EFSA (European Food Safety Authority). Scientific report of EFSA: The 2020 European Union report on pesticide residues in food. EFSA J. 2022, 20, 7215. [Google Scholar]
- Philippe, V.; Neveen, A.; Marwa, A.; Basel, A.-Y.A. A. Occurrence of pesticide residues in fruits and vegetables for the Eastern Mediterranean Region and potential impact on public health. Food Control 2021, 119, 107457. [Google Scholar] [CrossRef]
- Aslantas, S.; Golge, O.; González-Curbelo, M.Á.; Kabak, B. Determination of 355 pesticides in lemon and lemon juice by LC-MS/MS and GC-MS/MS. Foods 2023, 12, 1812. [Google Scholar] [CrossRef] [PubMed]
- El-Sheikh, A.; Li, D.; Hamed, I.; Ashour, M.-B.; Hammock, B.D. Residue analysis and risk exposure assessment of multiple pesticides in tomato and strawberry and their products from markets. Foods 2023, 12, 1936. [Google Scholar] [CrossRef] [PubMed]
- Radulović, J.; Lučić, M.; Nešić, A.; Onjia, A. Multivariate assessment and risk ranking of pesticide residues in citrus fruits. Foods 2023, 12, 2454. [Google Scholar] [CrossRef] [PubMed]
- Zhang, Y.; Li, Z.; Jiao, B.; Zhao, Q.; Wang, C.; Cui, Y.; He, Y.; Li, J. Determination, quality, and health assessment of pesticide residues in kumquat in China. Foods 2023, 12, 3423. [Google Scholar] [CrossRef] [PubMed]
- Kuchheuser, P.; Birringer, M. Pesticide residues in food in the European Union: Analysis of notifications in the European Rapid Alert System for Food and Feed from 2002 to 2020. Food Control 2024, 133, 108575. [Google Scholar] [CrossRef]
- Kecojević, I.; Đekić, S.; Lazović, M.; Mrkajić, D.; Baošić, R.; Lolić, A. Evaluation of LC-MS/MS methodology for determination of 179 multi-class pesticides in cabbage and rice by modified QuEChERS extraction. Food Control 2021, 123, 107693. [Google Scholar] [CrossRef]
Table 1.
Characteristics of the analysed fruit samples and number of fruit samples without and with pesticide residues.
Table 1.
Characteristics of the analysed fruit samples and number of fruit samples without and with pesticide residues.
| Name of the fruit samples | Country of origin | No. of samples | No. of samples without residues (< 0.01 mg/kg) | % | No. of samples with residues at or above the 0.01 mg/kg | % | No. of samples with residues above the MRL | % |
| Almond | Spain (N = 4), United States of America (N = 1) | 6 | 5 | 83.33 | 1 | 16.67 | 0 | 0 |
| Apple | Albania (N = 11), Austria (N = 3), Bosnia and Herzegovina (N = 3), Bulgaria (N = 1), Chile (N = 1), Croatia (N = 13), France (N = 1), Greece (N = 4), Hungary (N = 3), Italy (N = 32), North Macedonia (N = 12), Poland (N = 171), Serbia (N = 88), Slovenia (N = 2), The Netherlands (N = 4), Turkey (N = 2) | 351 | 126 | 35.90 | 225 | 64.10 | 12 | 3.42 |
| Apricot | Bulgaria (N = 1), Greece (N = 4), Italy (N = 2), Serbia (N = 6), Spain (N = 2) | 15 | 10 | 66.67 | 5 | 33.33 | 0 | 0 |
| Aronia | Serbia (N = 1) | 1 | 1 | 100 | 0 | 0 | 0 | 0 |
| Avocado | Chile (N = 1), Colombia (N = 2), Israel (N = 1), Kenya (N = 4), Peru (N = 6), South Africa (N = 1), Tanzania (N = 2), Turkey (N = 1), Zimbabwe (N = 1) | 19 | 12 | 63.16 | 7 | 36.84 | 1 | 5.26 |
| Banana | Brazil (N = 2), Colombia (N = 41), Costa Rica (N = 35), Dominican Republic (N = 1), Ecuador (N = 47), Ghana (N = 1), Guatemala (N = 8), Honduras (N = 7), Italy (N = 1), Mexico (N = 19), Panama (N = 6) | 168 | 70 | 41.67 | 98 | 58.33 | 0 | 0 |
| Blackberry | Serbia (N = 2) | 2 | 1 | 50.00 | 1 | 50.00 | 0 | 0 |
| Blueberry | Argentina (N = 1), Serbia (N = 1), Spain (N = 1), Peru (N = 1), The Netherlands (N = 1) | 5 | 4 | 80.00 | 1 | 20.00 | 0 | 0 |
| Brazil nut | Bolivia (N = 2) | 2 | 2 | 100 | 0 | 0 | 0 | 0 |
| Carambola | Malesia (N = 2) | 2 | 2 | 100 | 0 | 0 | 0 | 0 |
| Cashew | Vietnam (N = 1) | 1 | 1 | 100 | 0 | 0 | 0 | 0 |
| Chestnut | China (N = 1), Serbia (N = 1) | 2 | 2 | 100 | 0 | 0 | 0 | 0 |
| Clementine | Egypt (N = 1), Italy (N = 5), Spain (N = 7), Turkey (N = 3) | 16 | 8 | 50.00 | 8 | 50.00 | 0 | 0 |
| Coconut | Ivory Coast (N = 1) | 1 | 0 | 0 | 1 | 100 | 0 | 0 |
| Currants | The Netherlands (N = 2) | 2 | 0 | 2 | 100 | 0 | 0 | |
| Date palm | Iran (N = 7), Israel (N = 1) | 8 | 6 | 75.00 | 2 | 25.00 | 0 | 0 |
| Fig | Turkey (N = 1) | 1 | 1 | 100 | 0 | 0 | 0 | 0 |
| Grapefruit | Cyprus (N = 2), Greece (N = 3), Israel (N = 1), Mexico (N = 2), South Africa (N = 33), Swaziland (N = 1), Turkey (N = 71), Zimbabwe (N = 2) | 115 | 13 | 11.30 | 102 | 88.70 | 21 | 18.26 |
| Grape | Bosnia and Herzegovina (N = 2), Chile (N = 1), Greece (N = 1), India (N = 2), Italy (N = 18), North Macedonia (N = 111), Serbia (N = 8), South Africa (N = 1), Turkey (N = 8) | 152 | 99 | 65.13 | 53 | 34.87 | 2 | 1.32 |
| Hazelnut | Croatia (N = 3), Georgia (N = 1), Turkey (N = 1) | 5 | 4 | 80.00 | 1 | 20.00 | 0 | 0 |
| Japanese apple | Albania (N = 1), Spain (N = 6) | 9 | 8 | 88.89 | 1 | 11.11 | 0 | 0 |
| Kiwi | Chile (N = 7), Greece (N = 21), Italy (N = 16), New Zealand (N = 4), North Macedonia (N = 2) | 50 | 33 | 66.00 | 17 | 34.00 | 0 | 0 |
| Kumquat | Israel (N = 1), Italy (N = 2), South Africa (N = 1) | 4 | 2 | 50.00 | 2 | 50.00 | 0 | 0 |
| Lemon | Argentina (N = 45), Egypt (N = 1), Greece (N = 12), Italy (N = 2), South Africa (N = 15), Spain (N = 32), Turkey (N = 107), Uruguay (N = 3) | 217 | 42 | 19.35 | 175 | 80.65 | 4 | 1.84 |
| Lime | Brazil (N = 1), China (N = 1), Guatemala (N = 2), Mexico (N = 21), South Africa (N = 1), The Netherlands (N = 1), Turkey (N = 1) | 28 | 4 | 14.29 | 24 | 85.71 | 4 | 14.29 |
| Lychee | Chile (N = 1) | 1 | 1 | 100 | 0 | 0 | 0 | 0 |
| Mandarin | Albania (N = 4), Croatia (N = 14), Cyprus (N = 4), Egypt (N = 2), Greece (N = 42), Italy (N = 3), Morocco (N = 1), Spain (N = 12), Swaziland (N = 1), Turkey (N = 111) | 194 | 60 | 30.93 | 134 | 69.07 | 14 | 7.22 |
| Mango | Brazil (N = 9), Burkina Faso (N = 1), Dominican Republic (N = 1), Israel (N = 1), Ivory Coast (N = 1), Mali (N = 2), Peru (N = 7), Senegal (N = 2) | 24 | 15 | 62.50 | 9 | 37.50 | 0 | 0 |
| Orange | Egypt (N = 32), Greece (N = 125), Morocco (N = 9), Italy (N = 3), South Africa (N = 46), Spain (N = 38), The Netherlands (N = 1), Turkey (N = 55), Uruguay (N = 3), Zimbabwe (N = 12) | 324 | 98 | 30.25 | 226 | 69.75 | 7 | 2.16 |
| Passion fruit | South Africa (N = 1) | 1 | 1 | 100 | 0 | 0 | 0 | 0 |
| Peach | France (N = 1), Greece (N = 32), Italy (N = 3), Serbia (N = 13), Spain (N = 7) | 56 | 32 | 57.14 | 24 | 42.86 | 0 | 0 |
| Peach (nectarine) | Albania (N = 2), Belgium (N = 1), Greece (N = 14), Italy (N = 4), North Macedonia (N = 3), Serbia (N = 5), Spain (N = 7) | 36 | 23 | 63.89 | 13 | 36.11 | 0 | 0 |
| Peanut | Argentina (N = 4), China (N = 4) | 8 | 7 | 87.50 | 1 | 12.50 | 0 | 0 |
| Pear | Argentina (N = 2), Belgium (N = 6), Bosnia and Herzegovina (N = 2), China (N = 3), Greece (N = 2), Italy (N = 9), Poland (N = 9), Serbia (N = 30), South Africa (N = 4), Spain (N = 3), The Netherlands (N = 24), Turkey (N = 1) | 95 | 27 | 28.42 | 68 | 71.58 | 6 | 6.32 |
| Pineapple | Colombia (N = 13), Costa Rica (N = 25), Ecuador (N = 1), Italy (N = 1), Ivory Coast (N = 1) | 41 | 11 | 26.83 | 30 | 73.17 | 3 | 7.32 |
| Pistachio | Turkey (N = 1) | 1 | 1 | 100 | 0 | 0 | 0 | 0 |
| Pitaya | Thailand (N = 1), Vietnam (N = 1) | 2 | 2 | 100 | 0 | 0 | 0 | 0 |
| Plum | Albania (N = 3), Greece (N = 3), Italy (N = 2), Moldova (N = 1), North Macedonia (N = 3), Serbia (N = 14) | 26 | 15 | 57.69 | 11 | 42.31 | 0 | 0 |
| Pomegranate | Argentina (N = 2), Egypt (N = 1), Greece (N = 7), Peru (N = 6), Turkey (N = 50) | 66 | 24 | 36.36 | 42 | 63.64 | 26 | 39.39 |
| Pomelo | China (N = 12) | 12 | 4 | 33.33 | 8 | 66.67 | 0 | 0 |
| Quince | Greece (N = 1) | 1 | 1 | 100 | 0 | 0 | 0 | 0 |
| Raspberry | Morocco (N = 2), Serbia (N = 3), Spain (N = 2), The Netherlands (N = 1) | 8 | 4 | 50.00 | 4 | 50.00 | 0 | 0 |
| Sour cherry | Hungary (N = 8), Serbia (N = 6) | 14 | 8 | 57.14 | 6 | 42.86 | 1 | 7.14 |
| Strawberry | Albania (N = 8), Germany (N = 1), Greece (N = 13), Poland (N = 3), Serbia (N = 15), Spain (N = 5), Turkey (N = 1) | 46 | 11 | 23.91 | 35 | 76.09 | 0 | 0 |
| Sweet cherry | Greece (N = 6), Hungary (N = 1), Italy (N = 1), North Macedonia (N = 1), Poland (N = 1), Romania (N = 3), Serbia (N = 6), Spain (N = 1) | 20 | 4 | 20.00 | 16 | 80.00 | 0 | 0 |
| Walnut | Bulgaria (N = 2), Russia (N = 2), Ukraine (N = 1), United States of America (N = 1) | 6 | 5 | 83.33 | 1 | 16.67 | 0 | 0 |
MRL, maximum residue level.
Table 2.
The frequency of the detected pesticide residues and their concentrations in fruit samples.
Table 2.
The frequency of the detected pesticide residues and their concentrations in fruit samples.
| Pesticide name (N = 173) | Types of pesticide | Frequency of detection in 2,164 samples | % | No. of samples with residues above MRL | % | Range min-max (mg/kg) |
| 2-Phenylphenol | Fungicide | 44 | 2.03 | 0 | 0 | 0.010 – 7.028 |
| Abamectin | Insecticide | 2 | 0.09 | 0 | 0 | 0.010 |
| Acephate | Insecticide | 5 | 0.23 | 0 | 0 | 0.010 – 0.011 |
| Acetamiprid | Insecticide | 171 | 7.90 | 21 (apple; grapefruit, N = 2; mandarin; pomegranate, N = 17) | 12.21 | 0.010 – 1.418 |
| Acetochlor | Herbicide | 2 | 0.09 | 0 | 0 | 0.010 |
| Acibenzolar-S-methyl | Fungicide | 31 | 1.43 | 4 (grapefruit, N = 3; mandarin) | 12.90 | 0.010 – 0.114 |
| Acrinathrin | Insecticide | 2 | 0.09 | 0 | 0 | 0.011 – 0.020 |
| Aldicarb | Insecticide | 27 | 1.25 | 0 | 0 | 0.010 – 0.018 |
| Aldicarb sulfone | Insecticide | 2 | 0.09 | 0 | 0 | 0.010 |
| Ametryn | Herbicide | 12 | 0.55 | 0 | 0 | 0.010 |
| Amitraz | Insecticide | 58 | 2.68 | 5 (pomegranate) | 9 | 0.010 – 1.339 |
| Atrazine | Herbicide | 10 | 0.46 | 0 | 0 | 0.010 – 0.018 |
| Azinphos-ethyl | Insecticide | 6 | 0.28 | 1 (grapefruit) | 16.67 | 0.010 – 0.982 |
| Azinphos-methyl | Insecticide | 7 | 0.32 | 0 | 0 | 0.010 – 0.042 |
| Azoxystrobin | Fungicide | 96 | 4.44 | 0 | 0 | 0.010 – 0.717 |
| Bendiocarb | Insecticide | 3 | 0.14 | 0 | 0 | 0.010 |
| Bifenazate | Insecticide | 6 | 0.28 | 0 | 0 | 0.011 – 0.020 |
| Bifenthrin | Insecticide | 18 | 0.83 | 0 | 0 | 0.010 – 0.081 |
| Biphenyl | Fungicide | 1 | 0.05 | 0 | 0 | 0.010 |
| Bitertanol | Fungicide | 5 | 0.23 | 1 (avocado) | 20.00 | 0.012 – 0.152 |
| Boscalid | Fungicide | 154 | 7.12 | 1 (pomegranate) | 0.65 | 0.010 – 2.989 |
| Buprofezin | Insecticide | 79 | 3.65 | 0 | 0 | 0.010 – 0.589 |
| Butachlor | Herbicide | 1 | 0.05 | 0 | 0 | 0.012 |
| Butoxycarboxim | Insecticide | 5 | 0.23 | 5 (grapefruit, N = 2; pomegranate, N = 3) | 100 | 0.034 – 0.037 |
| Carbaryl | Insecticide | 29 | 1.34 | 0 | 0 | 0.010 |
| Carbendazim | Fungicide | 185 | 8.55 | 15 (apple, N = 3; grapefruit; lemon; orange, N = 2; pear, n = 2; pomegranate, N = 6) | 8.06 | 0.010 – 2.670 |
| Carbofuran | Insecticide | 1 | 0.05 | 1 (mandarin) | 100 | 0.033 |
| Carboxin | Fungicide | 2 | 0.09 | 0 | 0 | 0.010 |
| Carfentrazone-ethyl | Herbicide | 6 | 0.28 | 0 | 0 | 0.010 – 0.012 |
| Chlorantraniliprole | Insecticide | 24 | 1.11 | 0 | 0 | 0.010 – 0.121 |
| Chlorothalonil | Fungicide | 5 | 0.23 | 1 (grape) | 20.00 | 0.010 – 12.500 |
| Chlorotoluron | Herbicide | 22 | 1.02 | 8 (grapefruit, N = 2; mandarin; pomegranate, N = 5) | 36.36 | 0.010 – 0.928 |
| Chlorpropham | Herbicide | 2 | 0.09 | 0 | 0 | 0.010 |
| Chlorpyrifos | Insecticide | 145 | 6.70 | 10 (grapefruit, N = 8; grape; pomegranate) | 6.90 | 0.010 – 2.338 |
| Chlorpyrifos-methyl | Insecticide | 27 | 1.25 | 1 (grapefruit) | 3.70 | 0.011 – 0.944 |
| Clethodim | Herbicide | 1 | 0.05 | 0 | 0 | 0.010 |
| Clofentezine | Insecticide | 5 | 0.23 | 0 | 0 | 0.011 – 0.084 |
| Clothianidin | Insecticide | 13 | 0.60 | 0 | 0 | 0.010 – 0.045 |
| Cyazofamid | Fungicide | 3 | 0.14 | 0 | 0 | 0.054 – 0.111 |
| Cyfluthrin | Insecticide | 1 | 0.05 | 0 | 0 | 0.012 |
| Cymoxanil | Fungicide | 8 | 0.37 | 0 | 0 | 0.010 – 0.023 |
| Cypermethrin | Insecticide | 10 | 0.46 | 2 (pomegranate) | 18.18 | 0.011 – 0.301 |
| Cyproconazole | Fungicide | 2 | 0.09 | 0 | 0 | 0.010 – 0.016 |
| Cyprodinil | Fungicide | 38 | 1.76 | 7 (mandarin; pomegranate, N = 6) | 18.42 | 0.011 – 0.606 |
| Deltamethrin | Insecticide | 20 | 0.92 | 12 (grapefruit; mandarin; pomegranate, N = 10) | 60.00 | 0.010 – 0.326 |
| Diazinon | Insecticide | 3 | 0.14 | 0 | 0 | 0.010 |
| Dicrotophos | Insecticide | 1 | 0.05 | 0 | 0 | 0.010 |
| Difenoconazole | Fungicide | 30 | 1.39 | 2 (pomegranate) | 6.67 | 0.010 – 0.174 |
| Diflubenzuron | Insecticide | 8 | 0.37 | 2 (pear) | 25.00 | 0.010 – 0.073 |
| Dimethoate | Insecticide | 8 | 0.37 | 1 (apple) | 12.50 | 0.010 – 0.047 |
| Dimethomorph | Fungicide | 65 | 3.00 | 1 (grapefruit) | 1.54 | 0.010 – 0.737 |
| Dimoxystrobin | Fungicide | 8 | 0.37 | 0 | 0 | 0.010 |
| Dinotefuran | Insecticide | 10 | 0.46 | 1 (pomegranate) | 10.00 | 0.010 – 0.038 |
| Diphenylamine | Fungicide | 1 | 0.05 | 0 | 0 | 0.010 |
| Emamectin | Insecticide | 2 | 0.09 | 0 | 0.020 – 0.044 | |
| Emamectin B1a | Insecticide | 4 | 0.18 | 0 | 0 | 0.010 – 0.025 |
| Emamectin B1b | Insecticide | 5 | 0.23 | 1 (pear) | 20.00 | 0.010 – 0.016 |
| Eprinomectin | Insecticide | 2 | 0.09 | 0 | 0 | 0.010 |
| Ethiofencarb | Insecticide | 12 | 0.55 | 3 (grapefruit) | 25.00 | 0.010 – 0.069 |
| Ethirimol | Fungicide | 5 | 0.23 | 0 | 0 | 0.010 – 0.038 |
| Ethofumesate | Herbicide | 20 | 0.92 | 0 | 0 | 0.010 – 0.038 |
| Etofenprox | Insecticide | 1 | 0.05 | 0 | 0 | 0.141 |
| Etoxazole | Insecticide | 19 | 0.88 | 1 (pomegranate) | 5.26 | 0.010 – 0.024 |
| Famoxadone | Fungicide | 3 | 0.14 | 0 | 0 | 0.040 – 0.292 |
| Fenamidone | Fungicide | 1 | 0.05 | 0 | 0 | 0.042 |
| Fenamiphos | Insecticide | 3 | 0.14 | 0 | 0 | 0.012 – 0.016 |
| Fenazaquin | Insecticide | 3 | 0.14 | 0 | 0 | 0.010 |
| Fenbuconazole | Fungicide | 4 | 0.18 | 0 | 0 | 0.010 – 0.033 |
| Fenhexamid | Fungicide | 18 | 0.83 | 0 | 0 | 0.010 – 0.645 |
| Fenoxycarb | Insecticide | 1 | 0.05 | 0 | 0 | 0.013 |
| Fenpropimorph | Fungicide | 7 | 0.32 | 0 | 0 | 0.010 – 0.067 |
| Fenpyroximate | Insecticide | 5 | 0.23 | 0 | 0 | 0.010 – 0.047 |
| Fenthion | Insecticide | 1 | 0.05 | 0 | 0 | 0.010 |
| Fenuron | Herbicide | 2 | 0.09 | 0 | 0 | 0.010 |
| Fenvalerate | Insecticide | 51 | 2.36 | 31 (lemon; mandarin, N = 9; orange, N = 3; pomegranate, N = 18) | 60.78 | 0.010 – 1.247 |
| Flonicamid | Insecticide | 9 | 0.42 | 0 | 0 | 0.010 – 0.086 |
| Fluazifop-butyl | Herbicide | 1 | 0.05 | 0 | 0 | 0.010 |
| Fludioxonil | Fungicide | 154 | 7.12 | 2 (pear; pineapple) | 1.30 | 0.010 – 5.984 |
| Flufenacet | Herbicide | 3 | 0.14 | 0 | 0 | 0.021 – 0.035 |
| Flufenoxuron | Insecticide | 2 | 0.09 | 0 | 0 | 0.015 – 0.032 |
| Fluopyram | Fungicide | 2 | 0.09 | 0 | 0 | 0.068 – 0.152 |
| Fluoxastrobin | Fungicide | 4 | 0.18 | 0 | 0 | 0.010 – 0.018 |
| Flutolanil | Fungicide | 2 | 0.09 | 0 | 0 | 0.010 |
| Flutriafol | Fungicide | 7 | 0.32 | 0 | 0 | 0.013 – 0.039 |
| Formothion | Insecticide | 17 | 0.79 | 10 (apple, N = 8; mandarin, N = 2) | 58.82 | 0.010 – 0.396 |
| Hexaconazole | Fungicide | 5 | 0.23 | 0 | 0 | 0.010 |
| Hexythiazox | Insecticide | 5 | 0.23 | 0 | 0 | 0.013 – 0.032 |
| Imazalil | Fungicide | 624 | 28.84 | 10 (grapefruit, N = 3; lemon, N = 2; mandarin, N = 2; orange, N = 2; pomegranate) | 1.60 | 0.010 – 93.349 |
| Imidacloprid | Insecticide | 213 | 9.84 | 0 | 0 | 0.010 – 0.327 |
| Indoxacarb | Insecticide | 24 | 1.11 | 4 (pomegranate) | 16.67 | 0.010 – 0.080 |
| Ipconazole | Fungicide | 1 | 0.05 | 0 | 0 | 0.010 |
| Iprodione | Fungicide | 3 | 0.14 | 2 (orange) | 66.67 | 0.019 – 0.551 |
| Iprovalicarb | Fungicide | 2 | 0.09 | 0 | 0 | 0.011 – 0.050 |
| Isoprocarb | Insecticide | 1 | 0.05 | 0 | 0 | 0.010 |
| Isoproturon | Herbicide | 1 | 0.05 | 0 | 0 | 0.010 |
| Ketoconazole | Fungicide | 19 | 0.88 | 0 | 0 | 0.010 |
| Kresoxim-methyl | Fungicide | 4 | 0.18 | 0 | 0 | 0.013 – 0.047 |
| Lambda-cyhalothrin | Insecticide | 8 | 0.37 | 0 | 0 | 0.010 – 0.098 |
| Lufenuron | Insecticide | 60 | 2.77 | 2 (grapefruit; pomegranate) | 3.33 | 0.011 – 0.787 |
| Malaoxon | Insecticide | 3 | 0.14 | 0 | 0 | 0.058 – 1.067 |
| Malathion | Insecticide | 22 | 1.02 | 0 | 0 | 0.010 – 0.707 |
| Mandipropamid | Fungicide | 4 | 0.18 | 0 | 0 | 0.038 – 0.655 |
| Mepanipyrim | Fungicide | 13 | 0.60 | 8 (grapefruit, N = 3; mandarin; pomegranate, N = 4) | 61.54 | 0.010 – 0.103 |
| Mepronil | Fungicide | 1 | 0.05 | 1 (grapefruit) | 100 | 0.026 |
| Metaflumizone | Insecticide | 3 | 0.14 | 0 | 0 | 0.010 – 0.050 |
| Metalaxyl | Fungicide | 31 | 1.43 | 0 | 0 | 0.010 – 0.580 |
| Metalaxyl-M | Fungicide | 10 | 0.46 | 0 | 0 | 0.010 – 0.347 |
| Methabenzthiazuron | Herbicide | 5 | 0.23 | 0 | 0 | 0.010 |
| Methamidophos | Insecticide | 36 | 1.66 | 15 (grapefruit, N = 3; mandarin; orange; pear; pomegranate, N = 9) | 41.67 | 0.010 – 2.048 |
| Methidathion | Insecticide | 1 | 0.05 | 0 | 0 | 0.012 |
| Methiocarb | Insecticide | 12 | 0.55 | 0 | 0 | 0.010 – 0.176 |
| Methomyl | Insecticide | 52 | 2.40 | 3 (grapefruit) | 5.77 | 0.010 – 0.593 |
| Methoxyfenozide | Insecticide | 94 | 4.34 | 0 | 0 | 0.010 – 1.129 |
| Metobromuron | Herbicide | 5 | 0.23 | 2 (grapefruit) | 40.00 | 0.010 – 0.598 |
| Metrafenone | Fungicide | 1 | 0.05 | 0 | 0 | 0.051 |
| Metribuzin | Herbicide | 42 | 1.94 | 2 (grapefruit) | 4.76 | 0.010 – 0.335 |
| Monocrotophos | Insecticide | 3 | 0.14 | 0 | 0 | 0.010 |
| Myclobutanil | Fungicide | 34 | 1.57 | 0 | 0 | 0.011 – 0.290 |
| Nitenpyram | Insecticide | 1 | 0.05 | 0 | 0 | 0.010 |
| Novaluron | Insecticide | 7 | 0.32 | 2 (mandarin; orange) | 28.57 | 0.010 – 0.013 |
| Nuarimol | Fungicide | 3 | 0.14 | 2 (grapefruit; mandarin) | 66.67 | 0.010 – 0.043 |
| Omethoate | Insecticide | 4 | 0.18 | 1 (sour cherry) | 25.00 | 0.010 – 0.060 |
| Oxadixyl | Fungicide | 13 | 0.60 | 6 (grapefruit, N = 4; mandarin; pomegranate) | 46.15 | 0.010 – 0.595 |
| Oxamyl | Insecticide | 10 | 0.46 | 10 (grapefruit; lime, N = 4; mandarin; pomegranate, N = 4) | 100 | 0.038 – 3.161 |
| Penconazole | Fungicide | 18 | 0.83 | 0 | 0 | 0.011 – 0.175 |
| Permethrin | Insecticide | 1 | 0.05 | 0 | 0 | 0.020 |
| Phenmedipham | Herbicide | 1 | 0.05 | 0 | 0 | 0.010 |
| Phosmet | Insecticide | 10 | 0.46 | 0 | 0 | 0.010 – 0.284 |
| Picoxystrobin | Fungicide | 43 | 1.99 | 19 (grapefruit, N = 16; mandarin; pomegranate, N = 2) | 44.19 | 0.010 – 2.439 |
| Piperonyl-butoxide | Insecticide | 2 | 0.09 | 1 (pineapple) | 50.00 | 0.010 – 0.130 |
| Pirimicarb | Insecticide | 32 | 1.48 | 0 | 0 | 0.010 – 0.110 |
| Pirimiphos-methyl | Insecticide | 12 | 0.55 | 10 (grapefruit, N = 3; mandarin, N = 2; pomegranate, N = 5) | 83.33 | 0.010 – 0.480 |
| Prochloraz | Fungicide | 143 | 6.61 | 2 (pomegranate; sour cherry) | 1.40 | 0.010 – 3.905 |
| Promecarb | Insecticide | 7 | 0.32 | 5 (grapefruit, N = 2; mandarin; pomegranate, N = 2) | 71.43 | 0.010 – 0.039 |
| Prometon | Herbicide | 4 | 0.18 | 0 | 0 | 0.010 |
| Prometryn | Herbicide | 4 | 0.18 | 3 (grapefruit) | 75.00 | 0.010 – 0.106 |
| Propargite | Insecticide | 4 | 0.18 | 1 (grapefruit) | 25.00 | 0.010 – 0.316 |
| Propham | Herbicide | 59 | 2.73 | 3 (lime; pomegranate, N = 2) | 5.08 | 0.010 – 0.085 |
| Propiconazole | Fungicide | 113 | 5.22 | 3 (pomegranate) | 2.65 | 0.010 – 3.143 |
| Propoxur | Insecticide | 32 | 1.48 | 2 (pomegranate) | 6.25 | 0.010 – 0.127 |
| Prothioconazole | Fungicide | 97 | 4.48 | 5 (grapefruit, N = 3; mandarin, N = 2) | 5.15 | 0.010 – 0.586 |
| Pymetrozine | Insecticide | 2 | 0.09 | 0 | 0 | 0.010 – 0.019 |
| Pyracarbolid | Fungicide | 5 | 0.23 | 1 (grapefruit) | 20.00 | 0.012 – 0.017 |
| Pyraclostrobin | Fungicide | 93 | 4.30 | 0 | 0 | 0.010 – 0.153 |
| Pyridaben | Insecticide | 23 | 1.06 | 0 | 0 | 0.010 – 0.135 |
| Pyrimethanil | Fungicide | 245 | 11.32 | 2 (pomegranate) | 0.82 | 0.010 – 6.633 |
| Pyriproxyfen | Insecticide | 138 | 6.38 | 0 | 0 | 0.010 – 0.150 |
| Quizalofop-p-ethyl | Herbicide | 1 | 0.05 | 0 | 0 | 0.034 |
| Siduron | Herbicide | 1 | 0.05 | 0 | 0 | 0.010 |
| Spinetoram B | Insecticide | 2 | 0.09 | 0 | 0 | 0.014 – 0.017 |
| Spirodiclofen | Insecticide | 16 | 0.74 | 0 | 0 | 0.010 – 0.195 |
| Spiromesifen | Insecticide | 29 | 1.34 | 9 (grapefruit, N = 3; mandarin; pomegranate, N = 5) | 31.03 | 0.010 – 0.464 |
| Spirotetramat | Insecticide | 14 | 0.65 | 0 | 0 | 0.010 – 0.226 |
| Spiroxamine | Fungicide | 9 | 0.42 | 0 | 0 | 0.010 – 0.181 |
| Sulfentrazone | Herbicide | 4 | 0.18 | 2 (grapefruit) | 50.00 | 0.010 – 0.026 |
| Tebuconazole | Fungicide | 116 | 5.36 | 1 (pineapple) | 0.86 | 0.010 – 1.000 |
| Tebufenozide | Insecticide | 34 | 1.57 | 0 | 0 | 0.010 – 0.051 |
| Tebufenpyrad | Insecticide | 9 | 0.42 | 0 | 0 | 0.010 – 0.061 |
| Tebuthiuron | Herbicide | 11 | 0.51 | 7 (grapefruit, N = 2; mandarin; pomegranate, N = 4) | 63.64 | 0.010 – 0.079 |
| Teflubenzuron | Insecticide | 50 | 2.31 | 0 | 0 | 0.010 – 0.025 |
| Terbutryn | Herbicide | 6 | 0.28 | 3 (grapefruit) | 50.00 | 0.010 – 0.044 |
| Tetraconazole | Fungicide | 17 | 0.79 | 0 | 0 | 0.010 – 0.065 |
| Thiabendazole | Fungicide | 337 | 15.57 | 0 | 0 | 0.010 – 4.814 |
| Thiacloprid | Insecticide | 63 | 2.91 | 2 (grapefruit; pomegranate) | 3.17 | 0.010 – 0.154 |
| Thiamethoxam | Insecticide | 16 | 0.74 | 0 | 0 | 0.010 – 0.034 |
| Thiophanate-methyl | Fungicide | 32 | 1.48 | 0 | 0 | 0.010 – 0.683 |
| Triadimefon | Herbicide | 1 | 0.05 | 0 | 0 | 0.016 |
| Triadimenol | Fungicide | 3 | 0.14 | 0 | 0 | 0.010 – 0.028 |
| Tricyclazole | Fungicide | 3 | 0.14 | 3 (grapefruit) | 100 | 0.049 – 0.074 |
| Trifloxystrobin | Fungicide | 24 | 1.11 | 2 (pomegranate) | 8.33 | 0.010 – 0.144 |
| Triflumuron | Insecticide | 2 | 0.09 | 0 | 0 | 0.022 – 0.048 |
| Triticonazole | Fungicide | 3 | 0.14 | 0 | 0 | 0.010 |
| Zoxamide | Fungicide | 7 | 0.32 | 3 (grapefruit) | 42.86 | 0.014 – 1.094 |
MRL, maximum residue level.
Disclaimer/Publisher’s Note: The statements, opinions and data contained in all publications are solely those of the individual author(s) and contributor(s) and not of MDPI and/or the editor(s). MDPI and/or the editor(s) disclaim responsibility for any injury to people or property resulting from any ideas, methods, instructions or products referred to in the content. |
© 2024 by the authors. Licensee MDPI, Basel, Switzerland. This article is an open access article distributed under the terms and conditions of the Creative Commons Attribution (CC BY) license (http://creativecommons.org/licenses/by/4.0/).
Copyright: This open access article is published under a Creative Commons CC BY 4.0 license, which permit the free download, distribution, and reuse, provided that the author and preprint are cited in any reuse.


