
Submitted:
18 August 2023
Posted:
22 August 2023
You are already at the latest version
Abstract
The short-term intake (ESTI) of Hungarian consumers to pesticide residues was assessed based on 2331 test results obtained during 2017-2021 monitoring program in the frequently analyzed apples, sour cherries, table grapes, peaches, nectarines, peppers and strawberries (23.5% of all samples taken from 119 crops). The age-specific consumption data were obtained from two representative national food consumption surveys (2009 and 2018-2020). The exposure was characterized with Hazard Quotient and Hazard Index considering the acute reference doses of pesticide residues detected in the samples. When ESTI was calculated with all detected “single“ residues and variability factor of 3.6, recommended for evaluation of monitoring results, the HI only exceeded 1 for children <3 years old eating grape (1.50-1.81). HI was <1 when any of the 6 foods were eaten together within one day. Between forty and fifty percent of samples contained 2-23 residues. Though, the individual residue concentrations were below the corresponding MRLs, multiple residues being present in one sample resulted in maximum HI values in apples (1.14); grapes (6.57); peaches and nectarines (2.57); strawberries (2.74); peppers (10.44). Residues with low ARfD values contributed most. Applying HI is simple, but provides only point estimates; therefore, it should only be used in first-tier risk assessment.
Keywords:
pesticide residues
; pesticide residue monitoring
; multiple residues
; acute exposure assessment
; hazard index
; food consumption surveys
1. Introduction
Food is a potential source of exposure of the general population to pesticide residues. The use of pesticides by farm workers, especially without appropriate protective clothing can be its major source. At the global level, total pesticides trade reached approximately 5.9 million tons in 2018 and showed about 5.5% annual increase in 2020-2021 with approximate value of 43.3 billion US$ [1,2,3]. The generally inherently toxic pesticide active ingredients and formulated products undergo extensive toxicological tests before introduction by the primary manufacturers according to OECD guidelines [4,5]. The competent authorities of national governments regulate the use of pesticides in various extents. The countries with advanced registration systems conduct their own evaluation of the experimental bio efficacy, toxicological and other relevant data before the authorization of a pesticide [6,7,8,9]. The countries with limited resources accept the evaluations of the advanced ones or the FAO/WHO Joint meeting on pesticide residues (JMPR) and adopt the Codex maximum residue limits (MRLs) [10,11,12].
Pesticide residues in food and environmental samples are monitored in many countries with various extents [13]. One of the main objectives of the monitoring program is to provide data for the dietary exposure assessment of the consumers. For instance, the European Food Safety Authority (EFSA) annually evaluates the acute and chronic exposure of European population [14] based on the results of the national well as the European coordinated multiannual control programs [15].
The composition of the pesticide residues that should be used for dietary exposure is often different from those defined for enforcement purposes [16,17]. The definition of residues for risk assessment includes all relevant residue components (parent compound and metabolites) which significantly contribute to the toxic effects of a pesticide. On the other hand, the residue definition for enforcement purposes includes fewer residue components to reflect the residue levels at and after harvest. It is purposely set as simple as possible to facilitate the monitoring of pesticide residues in hundreds of thousands of samples taken from marketed commodities [17]. Therefore, the results of pesticide residue monitoring programs should be used for risk assessment while noting the potential differences. Detailed explanation of the calculation of short-term (ESTI) and long-term daily intakes with deterministic [18] and probabilistic methods are well described in several publications [19,20,21,22,23].
Pesticide residue monitoring results revealed that a substantial proportion of samples contain multiple residues. In Hungary, 36-50% of samples contained multiple residues ranging from 2 to 23 during 2017-2021 [13]. The frequency of multiple residues was in the same range in European countries. The average frequencies were 29% (2018), 28% (2019), and 28.9% (2020) of the samples analyzed within the national and European coordinated residue testing programs. The maximum number of residues was found in a strawberry sample (35) in 2020 and a dried vine fruit sample (28) in 2020 [14].
The dietary exposure should be calculated from those multiple residues belonging to one cumulative assessment group (CAG). The EFSA Panel on Plant Protection Products and their Residues suggested a methodology for grouping of pesticides based on phenomenological effects and provided CAGs concerning the effects on the thyroid and nervous system [23].
Retrospective dietary exposure assessments were conducted for two groups of pesticides that have acute effects on the nervous system: brain and/or erythrocyte acetyl cholinesterase inhibition, and functional alterations of the motor division [19,20] using the 2014-2016 European monitoring data [24].
The US EPA published a guidance document on considering chemicals having common mechanism of toxicity [25], and established CAGs for group of chemicals of the same chemical structure and common mechanism/mode of action: organophosphorus compounds [26], N-methyl carbamates [27], pyrethrins/pyrethroids [28], chlorotriazines [29].
Both EFSA and USEPA apply the dose addition principle which assumes that the effects of the individual components in the mixture are independent (i.e., are additive rather than synergistic or antagonistic) and no interaction among the compounds within the mixture is expected at low levels of exposure. EFSA’s Expert Panel recommended using the dose addition also for the assessment of mixtures of dissimilarly acting chemicals, irrespective of their presumed modes of action [30].
The cumulative effect of multiple pesticide residues can be characterized, for instance, by the total margin of exposure (MOET) which extends the concept of the margin of exposure (MOE). The MOET is calculated as the sum of the reciprocals of individual margins of exposure (MOEs) to each chemical contributing to the risk. The regulatory threshold for MOET is 100 [24,25].
The US EPA normalized each compound within the CAG in relation to the indicator compound (IC) of the group, by calculating the relative potency factor [25]. The RPF of a chemical p is the ratio between the toxicity point of departure of the index compound (IC) (Benchmark dose lower confidence limit, BMDL; No-Observed-Adverse-Effect-Level, NOAEL) and that of the chemical p. The cumulative risk of organophosphorus, carbamate insecticides and triazole fungicides was assessed applying the relative potency factors, for instance, using the Brazilian, Chinese, German, Hungarian, Danish, Dutch consumption data [22,31,32,33,34,35,36,37,38].
The Hazard Index (HI) method can also be used for characterization of the cumulative risk of pesticide residues [37,39]. The HI method assumes that the effects following cumulative exposure can be predicted by the mathematical model of dose-addition. The effect of a mixture of compounds is estimated by adding up the exposures to the individual compounds corrected for their respective potencies [40]. It is designed for the risk assessment of substances which have the same kind of adverse effect or common mode of action. It is calculated as the sum of hazard quotients (HQ). The HQ is the ratio of the exposure of a pesticide to the reference value, e.g. the estimated daily intake and the corresponding ADI (TDI) for chronic or the estimated short-term intake and the ARfD for acute exposure assessment.
A potential risk is identified if the HI is higher than 1. Where the results of monitoring programs are used, the 97.5th percentile of residues can be applied to represent the high residue for the acute exposure assessment. It can be calculated ideally from ≥120 residue data that enables estimating the 97.5th percentile with 95% probability applying the Harrel-Devis (HD) method [40,41]. The HD method estimates the target percentile with the selected probability, while Excel calculates numerically the percentile value.
Dietary risk assessment is usually performed applying consumption data in the edible portion of raw or processed agricultural commodities. Composite food should be disintegrated to components in which the pesticide residues were determined. Comprehensive food composition databases are available that can be used as guidance in the lack of detailed compositions information [42,43]. The food consumption data can also be used for a variety of purposes: development of dietary guidelines, nutritional research to study the relationship between diet and health outcomes, inform product upgrading and marketing strategies, etc.
The first systematic collection of food consumption data goes back to 1795 in Great Britain [44] and 1898 in the USA [45]. By 1898, USDA investigators had made studies of food consumption over 300 families. These studies provided the basis for the collection of household expenditure data. The purpose of consumption and expenditure surveys was primarily to obtain information on the nutritional status of the families, development of dietary guidelines, assess public health and food security, etc. [44,45,46]. Survey methods have been refined during the past years with the main aim of evaluating the nutritional status of a population, i.e. the intake of energy, macronutrients, micronutrients and bioactive compounds.
Dietary surveys, based on data collection from individuals, are the only surveys that provide information on the distribution of food consumption in well-defined groups of individuals, and are therefore preferred for the estimation of dietary exposure within the risk assessment process. Survey methodologies range from recalling the intake from the previous day (24-hour recall) to keeping a record of the consumption of food and beverages over one or more days (dietary record). The number of survey days varied from 1 to 7 in European countries during the last two decades. Most frequently used methods are the 24-hour dietary recall, dietary records, household consumption and expenditure surveys, biomarker assessment [47]. The individual surveys are often complemented with food frequency or food propensity questionnaires. Survey characteristics affect the quality of the measurement of food consumption within households; thus, it is important to identify best practices for designing surveys that collect food data [48,49].
Methodological differences used in the surveys render these data unsuitable for direct country-to-country comparisons. To facilitate the uniform food consumption data collection, the EFSA issued two guidance documents [50,51]. The detailed description of the recommended methods described in the Guidance on the EU Menu Methodology [51] was elaborated by two international consortiums [52,53] and finalized with the involvement of the EU Menu Working Group. This guidance document [51] focuses on methods to harmonize and to increase the quality of the food consumption data submitted to EFSA for use in assessments of exposure to food-borne hazards and nutrients. The core target population includes all persons aged between 0 and 74 years, and resident in a given country. The minimum recommended number of participants in each age group is 260.
In Hungary two food consumption surveys were implemented by the Hungarian Food Safety Office (HFSO) in 2009 [54,55] and 2018-2020 [56] following the methodology recommended by EFSA (2009 and 2014), respectively.
Food consumption data [Fi (kg edible portion of food/kg bw)] and the estimated maximum residue levels [MRL (mg residue/kg food)] was first used to calculate the Theoretical Maximum Daily Intake for pesticide residues (TMDI=MRL×Fi) by the JMPR and then considered by the first meeting of the Codex Committee on Pesticide Residues in 1966 [57]. TMDI should not exceed the "tolerable maximum daily intake" (TDI) defined by WHO. The TDI is comparable to the ADI [Acceptable Daily Intake (mg residue/kgbw/day)]. Where detailed national food consumption data are not available, the FAO/WHO IEDI (international estimated daily intake) calculation template [58] based on the 17 cluster diets [59] can be used. Alternatively, the EFSA Primo 3 intake calculation template can be applied [60], though it will only provide intake assessment based on European food consumption data.
The objectives of our work are to evaluate the acute exposure of Hungarian consumers resulted from the single and multiple residues detected in the most frequently sampled 6 fruits and vegetables (apples, table grapes, strawberries, sour cherries, peaches and nectarines, and peppers) during 2017-2021 [13]. The exposure of consumers was estimated applying the food consumption data obtained with the national dietary surveys carried out according to the methodologies recommended by EFSA [50,51].
2. Materials and Methods
2.1. Analyses of samples
Pesticide residues were determined by the specialized analytical laboratories of the National Food Chain Safety Office in samples acquired as part of the national and EU coordinated multi-annual monitoring programs [61,62]. The samples were taken according to the European Union directive [63]. The laboratories had accreditation according to ISO EN 17025 standard [64] and performed rigorous internal quality control to comply with the European Guidance document [65]. Over 600 pesticide residues and specified metabolites were screened in the samples with 0.002-0.008 mg/kg limits of detection applying the suitable variants of the well-established QuEChERS methodology [66,67,68] in combination with GC-MS/MS and LC-MS/MS detection or specific individual methods for substances which could not be recovered with the multi-residue methods applied. The residues of the parent compound and its metabolites were determined as specified by the EC regulations for enforcement purposes. Those cases where the specified metabolites were determined and included in the reported results are indicated with “sum” in Table S1. The screened substances were divided into groups based on their physical-chemical properties and elution times in the chromatographic columns. The recoveries of all screened substances were determined regularly with the analyses of different groups of the screened substances following a rolling program. The individual recovery values and their averages were within the acceptable range [65].
Though the accuracy and reliability of residue data for evaluation of compliance with legal limits have been proven at various levels, they have two limitations in the use for dietary risk assessment. Namely, the definition of residues for enforcement purposes does not cover all toxicologically significant metabolites or degradation products that are included in the definition for risk assessment. Secondly, the residue concentration reported based on the portion of commodity analyzed [69] in monitoring programs is not the same as the residue concentration in the edible portion. The average losses in preparing the edible portions of cherries, peaches, and peppers are about 5%, 14%, and 18%, respectively [70]. For strawberries and table grapes, the loss is <5%. Since the results of monitoring programs are reported on a whole-product basis, they are about 10-20% lower than those measured in the processed portion of the commodity representing the whole crop.
2.2. Dietary surveys
The results of two Hungarian national food consumption surveys conducted by the Hungarian Food Safety Office were utilized in this article.
The 1st food consumption survey was carried out between February and June 2009 to obtain data for quantitative food safety risk assessment and for gaining information on the nutrition status of the Hungarian population [54,55]. Considering the methodology suggested by EFSA [50], the participants were recruited randomly conforming to age, gender, and residence criteria from those taking part in the annual National Household Budget Survey (HBS) of the Hungarian Central Statistical Office (HCSO) (Table 1). The skilled interviewers of HCSO who visited the recruited people at their homes had received special training on collecting food consumption information before the start of the survey. Food picture book showing different portion sizes, common household measuring tables and example record sheets assisted the participants in providing reliable information. Self-reported body weight and height data were also recorded. In addition, dietary records on 3 non-consecutive days and food frequency questionnaires were completed.
The data processing and evaluation of the results were carried out by skilled dieticians who have recorded the food items into NutriComp Diet (Étrend) software [70,71,72] specially adapted for the survey. It contained wide scale of foodstuffs, traditional Hungarian and well-known international recipes, and those used widespread in the mass catering sector too. After a thorough verification procedure, daily energy-and nutrient intakes were calculated using the weighted average of the three days [70]. Recipes were disaggregated into raw materials, and even macro- and micronutrients were calculated using the recipe composition database of the software. Valid consumption records were obtained from 1360 males and 1717 females (<1-101 years) during the 14976 consumption recording days indicating a response rate above 61.7%.
The second survey which included toddlers, other children, adolescents, adults, and the elderly was conducted between 2018 and [56] (Table 1) using to the EFSA EU MENU methodology [51]. The sampling frame was the same as that used by the HCSO for the implementation of the annual HBS. The participants were randomly selected by using a stratified sampling method based on age and gender . The survey extended to all regions of the country, covering four seasons and all days of the week. The dietary pattern of the whole year was represented, including the periodically consumed foods as well, paying attention to their seasonal variation.
Participants were asked to provide information on their food consumption for two non-consecutive days, a minimum 10 days apart. The 24-hour food diary method, followed by a computer-assisted personal or telephone interview was applied. Information on the consumption of some less frequently eaten foods and the frequencies of food supplements was collected by applying a short, self-administered Food Propensity Questionnaire. The information on the physical activity of the subjects was obtained from the completed short International Physical Activity Questionnaire. The measurement of the body mass and height of the participants was carried out during the personal interview. The fieldwork was executed by contracted dietitians using dietary software called NutriComp. Its food and recipe database was updated and pre-coded according to EFSA’s FoodEx2 food description and classification system. The response rates were between 67 and 74%.
The edible portions of food items were reported and recorded in both surveys. The age and gender distribution of the participants of the two surveys is shown in Table 1.
2.2.1. Conversion of composite food to primary components
The NutriComp programs used in the nutritional studies [54] contained the ingredients of nearly 6000 national and international recipes. If necessary, the basic recipe file could be extended or modified by adding the ingredients of specially prepared foods consumed by the study participants.
The exact weight of the cleaned edible portion of the foods consumed per meal per day was recorded for later data processing. For complex foods and recipes, the raw weight of all ingredients of the recipe prior to the food preparation technology was calculated, taking into account the portion size consumed. The sum of the raw weights of the same foods consumed alone and calculated from the composite recipes provided the final daily consumption data.
2.3. Calculation of short-term intake
The short-term intake was calculated from the large portion [LP (kg edible food item/day)] obtained from the food consumption survey and the 97.5th percentile or maximum residues detected in the samples. The LP is obtained from the average body mass of the corresponding population group and the 97.5th percentile of the edible portion of consumed food (kg/kgbw/day). The 97.5th percentile consumption was calculated with the Harrel-Davis quantiles method [40]. For ≤30 consumption data, the rounded calculated percentile values were close to the highest one. Noting the uncertainty of the estimation of the 97.5th percentile from small datasets, nevertheless making best use of available data for n<30 data points, the maximum consumed portion was used instead of the 97.5th percentile to calculate the large portion size. The same approach was used for selecting the residue data.
The method of the calculation of the short-term intake depends on the relation of the median unit mass of food item and the large portion consumed [18].
If the median unit mass is smaller than their large portion size, the following equation is used for the calculation of the short-term intakes.
where Ue is the median unit mass of the edible portion [kg], HR is the upper 97.5th percentile of residues detected in composite samples [mg/kg], LP is the large portion (97.5th percentile of eaters) in kg food per day, bw is the average body mass of the age groups of participants [kg] interviewed during surveys, ν is the so-called variability factor reflecting the unit to unit variability of residues in natural units in the composite samples [18,73]. For comparison and providing the worst-case scenario, the variability factors of 7 recommended by EFSA for medium size (25-250g) crops [74] , or 3.6 agreed by the EU Member States to use for monitoring data [30] were also applied in our calculations in addition to the generally applicable variability factor of 3 recommended by the FAO WHO Joint Meeting [17].
ESTI=(Ue×HR×v+[(LP-Ue)×HR])/bw
For small fruits and vegetables (median unit mass <25 g, e.g. cherries, strawberries), the residue measured in the composite sample represents the residues in consumed food:
IESTI=(LP×HR)/bw
However, where the mass of the edible portion of the crop unit is larger than the large portion size the variability of residues in crop units has to be considered:
IEST=(LP×HR×v)/bw
EFSA applies a variability factor of 5 in such cases [73].
The distribution of unit masses of selected food items marketed in Hungary [35] are summarized in Table 2. The size of cherries and strawberries was not measured in this study but obtained from the Internet. The typical maximum and median unit masses of strawberries are 19 and ≤12 g. Cherries are smaller (max 6-8 g). Equation 5 is used for calculation of IESTI for these crops.
2.4. Cumulative acute exposure of consumers
The hazard quotients and the hazard index were calculated applying the acute reference doses. The principle of dose addition was used for the compounds irrespective of the presumed modes of action [30]. We used the reference values published by EFSA for cumulative risk assessment groups [19,23,24].
The cumulative dietary risk was calculated for food–pesticide residues combinations that were selected from those likely to lead to the highest exposure.
3. Results
3.1. Summary of the results of pesticide residue monitoring during 2017-2021
Pesticide residues were determined in 9924 samples. Table 3 shows the summary of the number of samples, the residues tested, and their distribution in relation to the corresponding MRL values.
In view of the very large database, we selected six commodities (apple, table grape, sour cherry, peach and nectarine, strawberry, and pepper (green and red)) for the detailed evaluation of the results. To simplify the following tables, these commodities are briefly mentioned as apples, cherries, grapes, peaches, peppers and strawberries. They were relatively frequently sampled and often contained multiple residues. The maximum residues detected in selected samples, their MRLs, and ARfD values are summarized in Table S1 in the appendix. Concerning the acute exposure of consumers, specific attention was given to the samples containing multiple residues (minimum 2 residues in each sample). Summary of multiple residues detected in individual samples of all commodities is given in Table 4. Table 5 shows the maximum number of multiple residues detected in individual samples taken from the selected commodities. The number of samples and residues investigated in the selected commodities are given in Table 6.
Table 6 summarises the number of samples taken from the selected commodities that contained more than one residue in detectable concentration and the number of residues investigated in the samples.
The number of residues present in individual samples varied. Most frequently 3-6 different residues were detectable in the samples. Figure 1 shows the relative frequency of multiple residue ranges in selected food items.
3.2. Summary of consumption data
The large portion sizes of the edible part of the food consumed in a day (kg food/kgbw/day) were calculated from their 97.5th percentile except for consumption days <10. For these cases, the maximum amount of food recorded was used. For consumption days from 10 to 30 the Harrel-Davis method, while in other cases, the Excel built-in function was used for the calculation. During the 2009 survey, certain foods were not consumed; consequently, their large portions were not calculated. The large portion (LP) consumptions are presented in Table A1 and Table A2.
3.3. Estimation of acute exposure of Hungarian consumers
The short-term intakes (ESTI) of consumers were calculated for the selected commodities using the 97.5th percentile of residues determined in them, and the large portions obtained in the consumption surveys. The unit mass distribution of selected food items is given in Table 2. In the case of apple, all residues were considered which had acute reference dose (ARfD) established and were detected in a sufficient number of samples enabling the realistic calculation of their 97.5th percentile values (Table A1) with the Harrel-Davis method. For cherries (5), grapes (6), peaches (4), peppers (6), and strawberries (5) the ESTI-s were calculated with the 97.5th percentile of representative pesticide residues satisfying the above criteria and applying equations given in brackets.
The ESTI values for apple consumption calculated (equation 4) with the variability factor of 3, recommended by the JMPR [17,18], are shown in Table 7. The consumer’s exposure is characterized by the hazard quotients (HQ). Since the highest short-term intake was observed for the age group of 1-2 years, the HQ values (equation 3) are given for this group in Table 7.
The ESTI was also calculated from the results of the 2009 consumption survey. Moreover, we examined the effect of the selection of variability factor on the outcome of the estimation. Therefore, the calculations were also performed with the variability factors of 7 recommended by EFSA for general use [74, and 3.6 agreed by the EU Member States for monitoring data [30,75]. Naturally, the ESTI calculated with ν=7 instead of 3 was higher and indicated HQ>1 values for two substances. Because of the low ARfD values, the highest values obtained for age groups of 1-2 years represent the likely worst case of consumers’ exposure (Table 8).
Since the body mass of age groups and LP of apple consumption derived from the two surveys are very similar, the increase of the HQ values clearly indicates the effect of conceptual difference in the establishment of the variability factors by the two (European Commission and CODEX) bodies [74,76]. The HQ values for all age groups were less than 1 when the more realistic variability factor of 3.6 was used for all age groups and pesticide residues.
The hazard quotients were also calculated for the other selected commodities. Table 9 includes examples for HQ obtained with variability factor of 3.6, the results of the 2018-2020 consumption survey, and the 97.5th percentile of residues of three pesticides representing a wide ARfD range: acetamiprid (0.025), fluopyram (0.07) and difenoconazole (0.16). In view of the lowest ARfD values amongst the detected pesticide residues in the examined commodities, the calculated HQ values represent the worst-case scenario of the exposure of consumers based on the food containing a single pesticide residue.
3.4. Estimation of the cumulative acute exposure of consumers
Through their daily diet, consumers may be subject to the combined acute effect of pesticide residues in several ways:
- one food item contains more than one residue;
- the food items consumed within one day contain the same or different residues;
- the foods contain multiple residues.
A large proportion (40-50%) of samples contained 2-23 residues during the period of 2017-2021 (Table 4.). Up to 13 different residues (Table 5) were detected in the selected commodities. The largest numbers of residues given in brackets were detected in single apple (13), grape (12), peach and strawberry (9), and pepper (7) samples.
The acute reference doses established by EFSA [21,22,23] or JMPR [76] expert panels were considered for the calculation of cumulative exposure. Hazard quotients (HQ) and the hazard index (HI) were used to quantify the exposure which can be used for a mixture of chemicals regardless of the class, mechanism/mode of action, or target organ/system toxic effects [30,77].
3.4.1. Cumulative exposure from residues exceeding the MRL values
Of the large number of samples (>500-700) of selected commodities only six contained residues above MRL (Table 10).
ARfD values were available for 7 residues in peppers and 4 substances in strawberries. Four NOAEL values were available from CAG B2-B4 groups for residues in peppers and only one in strawberries, respectively. The critical parameters are summarized in Table 11.
The hazard index was calculated utilising the 2018-2020 dietary survey results. The short-term daily intakes were estimated based on equation 6 (LP> median unit weight) for peppers and equation 5 for strawberries. Moreover, the variability factor of 3.6 was used. The results are summarized in Table 12.
In the case of both commodities, the HI values were below 1 for all age groups indicating that the exceedance of MRLs does not necessarily raise health concerns.
3.4.2. Cumulative exposure from food items consumed within one day
The consumers may be exposed to pesticide residues by eating several foods containing the same pesticide residue(s). Evaluation of the 2018-2020 dietary survey revealed that a maximum four items of the selected six were consumed within one day. The relative frequency distribution of the number of foods consumed in one day is shown in Table 13.
Table 13 indicates that none of the selected 6 food items were consumed an about 51% of the 5229 survey days, while four were eaten only on four different days. Besides the number of food items, their total consumed amount will also affect the cumulative exposure. The highest amounts of daily consumption (g/kgbw/day) are given in Table 14.
Table 14 indicates that the major contributors to the total amount of selected foods consumed are the apple-grape or apple–peach combinations that represent the upper 99.7% tail of the sum of consumption of the selected 6 food items during the 5629 survey days (Table 15). When strawberry is consumed the apple consumption is very low which can be explained by the seasonal variation of these fruits. The cherries and pepper did not contribute substantially to the sum.
The residue content of the individual lots varied. We assumed, as the worst-case scenario, that all residues detected in each fruit were present at their average concentrations on the day of their consumption. The residues detected in the samples taken from the six commodities and have ARfD values are summarized in Table 16.
Based on the ARfD range (0.005-0.5) and the relatively large number of samples analysed for the given residues, acetamiprid, difenoconazole, fluopyram and indoxacarb were selected for the calculation of the cumulative exposure of the consumers. The ESTI was calculated with equations in brackets for apple, peach (4), grape (6), and strawberry (5). The results are summarised in Table 17.
The hazard indices are well below one for each food. Even if two foods are consumed on one day, the sum of hazard indices is below one indicating that the combined consumption of these foods is unlikely to produce acute intake risk.
3.4.3. Examples for cumulative exposure resulted from multiple residues below MRL
A large proportion of samples (30-50%) contained multiple residues. The number of residues present in the samples in detectable concentration varied. The following stepwise process was applied for selecting samples to estimate the acute cumulative exposure:
- all residues that were investigated in the given type of sample were arranged in alphabetical order, but only the first two columns were kept in the Table S1 in Appendix;
- the residue values detected in a sample were placed in the corresponding row of the sample residue matrix;
- residues that did not have acute reference dose (ARfD) were deleted;
- the residues originally present (NRal) and remained after removing those without ARfD value (NRr) were counted, and the latter concentrations [mg/kg summed (ΣRr)];
- the ratio of measured residue concentration (R) to the ARfD values (R/ARfD) and their sum (Σ(R/ARfD) were calculated;
- Samples with high ΣRr and Σ(Ri/ARfDi) were selected for calculation of ESTI, the hazard quotients (HQi), and the hazard index (HI=ΣHQi).
The process is illustrated with a simplified example using table grape residue data in Table 18.
The results of the analyses of samples containing multiple residues were screened based on the calculated values of ΣRr and Σ(R/ARfD) and taking into consideration of the number of analytes detected (NRALL) and remained (NRr). The ESTI, HQ, and HI values were calculated for various combinations using the age group which gave the largest LP/bw value derived from the 2018-2020 survey. Some examples are given in Table 19. The table also indicates the residues that mainly contributed to the cumulative exposure.
Examining the tendencies, we found that the Σ(R/ARfD) values provided the most reliable indication of high HI values, though we could not establish any direct relationship. The ΣRi and the ratio of NRall/NRr did not provide additional guidance for selection. Compared to the large number of residues that were detected in the samples, relatively few, having low ARfD values, were the major contributors to the HI (Table 19).
4. Discussion and conclusions
The results of the analyses of samples derived from the national pesticide residue monitoring programs conducted during 2017-2021 and two national food consumption surveys (2009 and 2018-2020) provided the raw data for the assessment of the acute exposure of Hungarian consumers to pesticide residues.
A detailed evaluation of the monitoring data was published recently [13]. Of the 119 commodities included in the sampling program apples, sour cherries, table grapes, peaches/nectarines, sweet peppers, and strawberries were selected for estimation of acute exposure. The edible portions of these fruits are close to the whole fruit sampled, and result in less than 20% difference in the estimated intake values. These commodities were frequently sampled and analyzed for a wide range (12-42) of residues, thus providing sufficient data for intake calculations.
In the evaluation of the residue data special attention was given to multiple (7-13) residues that were present in 40-50% of the samples. It should be noted that the residues of parent compounds, their metabolites, and isomers were determined according to the residue definitions for enforcement purposes published by the European Commission. These are sometimes different from those defined for risk assessment purposes. Since the ARfD values are established considering the effect of all toxicological significant residues and metabolites, the reported residue concentrations should only be adjusted with the mass ratio of the analytes reflecting the two definitions. Consequently, we somewhat underestimated the short-term intake (ESTI) using the reported residue values. However, this deficiency does not affect our conclusions regarding the exposure of Hungarian consumers.
In critical cases, the relevant residue data should be obtained by the analyses of samples taken shortly after harvest applying specific individual methods that recover and quantify all residue components defined for risk assessment purposes. The extra expenses involved in method development, validation, sampling, and analyses should be carefully evaluated for cost/benefit ratio before such a project is undertaken.
The national food consumption surveys were conducted in 2009 and 2018-2020 according to the actual methodologies recommended by EFSA. Both studies involved subjects selected randomly from the sampling targets of the national household budget surveys taking into account the age, gender, and geographical distribution of the Hungarian population. The results indicate that the average body mass has increased, while the net consumption of fresh fruits and vegetables slightly decreased in the case of children of 4-10 years old in line with the Hungarian nutritional and physical activity studies [77,78] The difference is not statistically significant. Such a difference can also be attributed to the seasonal variation of consumptions that can be clearly seen in the consumption days of young children <3 years. The spread of consumption data indicated by their relative standard deviation was in the same range in both surveys.
The short-term daily intake was calculated with the methodology applied by the JMPR [18]. It provides a conservative point estimate of acute exposure based on the 97.5th percentile of residue data obtained from the monitoring program and the 97.5th percentile of consumed food normalized by the average body weight observed during the surveys. In case of limited input data points (≤10) the maximum observed values were used in the calculations to avoid underestimation of the intake. Moreover, the unit-to-unit variability of pesticide residues in medium and large-size crops was accounted for by applying the so-called variability factor (VF) of 3 applied by the JMPR, the average of variability of residues in market surveys (monitoring programs) (3.6) calculated by EFSA Expert Panel, and 7 recommended by EFSA for medium and large crops for general use.
The short-term intake acute intake was calculated from those residues that had acute reference doses established by EFSA or the JMPR. The consumer’s exposure was characterized by the hazard quotients (HQ=ESTI/ARfD) and the hazard index (HI=∑HQ). The latter one based on dose addition and assumes no interaction among the residues present, and it can also be used when the substances have dissimilar modes of action [29,76].
4.1. Calculation of the short-term intake (ESTI) based on single residues detected in various apple samples
The ESTI was calculated from the 2018-2020 apple consumption data of the six age groups with those 17 pesticides that were detected in different apple samples. The ESTI was highest for the age group of 1-2 years. The corresponding HQ values ranged between 0.1 and 0.62 when VF of 3 was applied. The results indicated that the ESTI is the highest for the youngest children and gradually decreases for older consumers. Since the highest three quotient values (0.62, 0.40, 0.33) were well below 1, we can conclude, assuming that only one pesticide residue is detectable in a sample, that the current plant protection practice applied in domestically grown and imported apples does not cause any health risk even for the most sensitive age group.
The calculation was repeated with the consumption values obtained from the 2009 survey as well as applying VF values of 3.6 and 7. The highest HQ values were obtained for lambda-cyhalothrin (ARfD=0.005) and thiacloprid (ARfD=0.02). Based on the 2009 consumption survey data, they were 0.85, 0.99, and 1.82 for lambda cyhalothrin, and 0.56, 0.65, and 1.19 for thiacloprid when VF of 3, 3.6, and 7 were applied, respectively. The tendency was naturally the same in the case of the 2018-2020 survey data. The results clearly indicate the effect of the selection of VF on the estimated exposure. The risk assessors should decide on the probability and percent coverage of residues when selecting the VF values for making decisions based on monitoring data.
In addition to apples, the HQ values were also calculated with a VF of 3.6 for the other 5 food items based on the more complete 2018-2020 consumption data for the six age groups. The HQ values were below 1 for all pesticides except acetamiprid in grapes (1.5, 1.81) in the case of young children (<3 yrs). The calculated HQ values represent the worst-case scenario of the exposure of consumers based on their food containing single pesticide residue.
4.2. Multiple residue data assessment of pepper and strawberry samples
The cumulative effects of pesticide residues were studied for different scenarios. Pepper and strawberry samples contained 5 residues above the MRL beside another 2-8 compounds. The HI values for residues in peppers were highest (0.25) in age group 2-3 yrs, while for strawberries the highest value (0.46) was obtained in age group 3-9 yrs. The results indicate that the exceedance of MRLs does not necessarily raise health concerns.
4.3. Multiple residue data assessment in one food item or combined consumption of several food items within one day
A maximum of 4 food items of the selected 6 were consumed within one day on 4 occasions (0.08%) from the 5229 survey days. The main contributors to the total amount eaten (g/kgbw/day) were the apple-grape and apple–peach joint presence. The cherries and peppers did not add substantially to the sum. The combined daily consumption of apples and grapes (39.9 g/kgbw/day) represents the 99.7 percent upper tail of daily consumption. For the calculation of cumulative exposure, we selected acetamiprid, difenoconazole and fluopyram representing the ARfD range (0.025–0.5 mg/kgbw/day) of all pesticides that were detected and could be present in any of the six food items. Further on, we assumed that the food items contained the average concentration of all residues that were present in their samples, because taking the 97.5 percentile of their residues would lead to unrealistically over-estimated short-term intake that might occur with 1.56×10⁻⁵ probability (in 0.0016% of the cases). The HI values calculated for the 12 largest amounts consumed from the 6 food items ranged from 0.07 to 0.84 g/kgbw/day. The results indicate that it is unlikely that the combined consumption of the 5 fruits and peppers would result in intake concern.
Since 30-50% of the samples analyzed contained more than one pesticide residue the cumulative exposure deriving from multiple residues was studied. The number of different residues varied in the samples. We considered that the ratio of residue measured (Ri) and the corresponding ARfDi value affect the ESTI and HQ values most, and their sum would influence the calculated HI values. Therefore, we screened the dataset based on the sum of Ri/ARfDi and the number of residues present in a given sample. Samples with high ΣRr [mg/kg] and Σ(Ri/ARfDi) were selected for calculation of ESTI using the 2018-2020 survey data, the hazard quotients (HQi), and the hazard index. The Σ (R/ARfD) values provided the most reliable indication of high HI values. However, no direct relationship was found. The evaluation of the results revealed, as expected, that the residues having low ARfD values contributed mostly to the HI values. The high Hi values ranged for apple (1.1-1.14), table grapes (2-6.6), peaches (2.6-2.7), strawberries (1.6-2.7), and peppers (4.1-10.4). Pesticide residues with ARfD values ranging from 0.005 to 0.06 mg/kgbw/day were the major contributors.
It is pointed out that none of the residues resulted in high HI values exceeded the corresponding MRLs. Therefore, the samples were considered compliant. Concerning the calculated HQ and HI values, the JMPR (2009) concluded [80] that values above 1 should not necessarily be interpreted as a health concern because of the conservative assumptions used in the ARfD assessments. However, the authors consider that HI values in the range of 4-10 do raise concern and would require further actions for revisiting the recommended use of such pesticides.
4.4. Advantage and limitations of the assessment using HI values
Finally, it is reemphasized that the HI values calculated from the hazard quotients, or the other methods (relative potency factors, MOET) provide only a point estimate of the exposure and the probability of the occurrence of the given case cannot be reliably quantified. Only the two-dimensional Monte Carlo probabilistic approach would provide different scenarios that are associated with a quantitative measure of uncertainty (upper and lower boundary of the mean) at each percentile of the exposure distribution [21]. However, the point estimates of consumers’ exposure based on the HI values taking into account their ARfD values provides a simple and generally applicable methodology that can be applied without having access to specific software and technical knowledge. Therefore, its use in the first-tier risk assessment is recommended.
Supplementary Materials
Table S1. Summary of residues, their MRLs and ARfD values detected in the selected samples during 2017-2021.
Author Contributions
Conceptualization, methodology, original draft preparation, review, Á.A.; data curation, review, editing, J.Sz-Cs; data curation, A.V., L.B., H. Sz-D; All authors have read and agreed to the published version of the manuscript.
Funding
This research received no external funding.
Institutional Review Board Statement
Not applicable.
Informed Consent Statement
Not applicable.
Acknowledgments
The authors greatly appreciate the responsible work of the organizing teams of the implementation of the 2009 and 2018-2020 dietary surveys and grateful for making the raw data available to perform the assessment of acute exposure of Hungarian consumers. The valuable, dedicated contribution of late Judit Sali to the success of surveys is especially highlighted.
Conflicts of Interest
The authors declare no conflict of interest.
Abbreviations
| ARfD | Acute reference dose |
| AS | Active substance |
| CAG | Cumulative Assessment Group |
| EFSA | European Food Safety Authority |
| ESTI | Estimated short-term intake |
| FAO | Food and Agriculture Organization |
| HI | Hazard index |
| HQ | Hazard quotient |
| HBS | Household budget survey |
| HCSO | Hungarian Central Statistical Office |
| IC | Index compound |
| JMPR | Joint Meeting on Pesticide Residues |
| HFCSO | Hungarian Food Chain Safety Office |
| LOD | Limit of detection |
| LOQ | Limit of quantification |
| MRL | Maximum Residue Limit |
| MOE | Margin of exposure (individual) |
| MOET | Margin of exposure (combined) |
| NOAEL | No Observed Adverse Effect Level |
| STMR | Supervised Trials Median Residue |
| US FDA | United States Food and Drug Administration |
| TDI | Tolerable maximum daily intake |
| WHO | World Health Organization |
Appendix A
Definition of terms used
| consumer day | From a total number of records in a food consumption survey those days on which an individual reported consuming the food or foods of interest. |
| intake | For the purpose of food or feed risk assessment, the amount of a substance (including nutrients) ingested by a person or animal as part of its diet. This term does not refer to whole foods. The intake of whole foods is termed “food consumption”. |
| LP | Highest large portion reported (97.5th percentile of eaters), in kg food per day. |
| HR | Highest residue in composite sample of edible portion found in the supervised trials used for estimating the maximum residue level, in mg/kg. |
| Ue | Unit weight of the whole commodity (as defined for MRL setting, including inedible parts). |
| TMDI | Theoretical maximum daily intake is a prediction of the maximum daily intake of, for example, a pesticide residue, assuming that residues are present at the maximum residue levels/limits and average daily consumption of foods per person. |
| Ui | Median unit weight of the edible portion, in kg. |
| ν (VF) | Variability factor, defined as the 97.5th percentile of residue level in the unit divided by the mean residue level for the lot of units of interest. |

Table A1.
Summary of consumption survey 2009.
| Age [year] | 0-1 | 1-2 | 2-3 | 3-9 | 9-18 | 18-64 | 64-74 | >74 (101) |
| No. of subjects | 78 | 132 | 138 | 816 | 1638 | 9947 | 1227 | 999 |
| Ave bw [kg] | 8.16 | 12.11 | 14.39 | 24.80 | 51.67 | 75.32 | 77.26 | 70.72 |
| Apples | ||||||||
| Consum [day] | 32 | 47 | 65 | 311 | 551 | 2859 | 471 | 384 |
| LP [kg] | 0.330 | 0.322 | 0.225 | 0.383 | 0.379 | 0.481 | 0.391 | 0.357 |
| Max1 | 54.55 | 27.27 | 16.67 | 32.14 | 14.29 | 16.13 | 1.00 | 8.57 |
| P97.52 | 40.45 | 26.59 | 15.63 | 15.43 | 7.33 | 6.38 | 5.07 | 5.05 |
| Average3 | 15.11 | 10.65 | 8.50 | 6.32 | 3.42 | 2.56 | 2.34 | 2.50 |
| Median4 | 11.44 | 9.89 | 9.38 | 5.91 | 3.13 | 2.21 | 2.00 | 2.24 |
| SD5 | 10.06 | 6.01 | 3.79 | 3.78 | 1.76 | 1.56 | 1.20 | 1.20 |
| CV6 | 0.67 | 0.56 | 0.45 | 0.60 | 0.51 | 0.61 | 0.51 | 0.48 |
| Cherries | ||||||||
| Consum [day] | 2 | 4 | 9 | 71 | 104 | 670 | 119 | 77 |
| LP [kg] | 0.04 | 0.10 | 0.14 | 0.65 | 1.58 | 2.32 | 1.02 | 0.55 |
| Max1 | 4.55 | 8.33 | 9.41 | 26.09 | 30.59 | 30.77 | 13.16 | 7.71 |
| P97.52 | NA | NA | NA | 17.93 | 9.24 | 7.73 | 8.33 | 5.41 |
| Average3 | 3.27 | 6.76 | 4.58 | 5.16 | 3.15 | 2.44 | 2.42 | 2.02 |
| Median4 | 3.27 | 6.86 | 4.55 | 3.64 | 2.34 | 1.88 | 1.86 | 1.97 |
| SD5 | 1.80 | 1.82 | 4.55 | 4.92 | 3.57 | 2.44 | 2.32 | 1.39 |
| CV6 | 0.55 | 0.27 | 0.99 | 0.95 | 1.13 | 1.00 | 0.96 | 0.69 |
| Grapes | ||||||||
| Consum [day] | 2 | 0 | 0 | 2 | 3 | 25 | 4 | 7 |
| LP [kg] | 0.05 | 0.07 | 0.28 | 0.30 | 0.47 | 0.22 | ||
| Max1 | 6.25 | 2.86 | 5.36 | 3.92 | 6.03 | 3.08 | ||
| P97.52 | ||||||||
| Average3 | 2.00 | |||||||
| Median4 | 1.85 | |||||||
| SD5 | 0.87 | |||||||
| CV6 | 0.44 | |||||||
| Peaches | ||||||||
| Consum [day] | 7 | 5 | 1 | 15 | 24 | 178 | 18 | 32 |
| LP [kg] | 0.13 | 0.17 | 0.29 | 0.62 | 1.11 | 0.83 | 0.64 | 0.64 |
| Max1 | 16.00 | 13.64 | 20.00 | 25.00 | 21.43 | 20.00 | 8.33 | 10.71 |
| P97.52 | NA | NA | NA | NA | NA | 11.03 | NA | 9.05 |
| Average3 | 11.06 | 11.19 | 20.00 | 9.04 | 5.55 | 4.11 | 4.01 | 4.46 |
| Median4 | 13.64 | 10.91 | 20.00 | 7.50 | 4.38 | 3.64 | 3.37 | 3.75 |
| SD5 | 4.04 | 1.52 | - | 5.81 | 4.45 | 2.83 | 2.04 | 2.48 |
| CV6 | 0.37 | 0.14 | 0.64 | 0.80 | 0.69 | 0.51 | 0.56 | |
| Peppers | ||||||||
| Consum [day] | 3 | 13 | 20 | 146 | 302 | 2406 | 310 | 194 |
| LP [kg] | 0.01 | 0.12 | 0.11 | 0.16 | 0.22 | 0.27 | 0.32 | 0.20 |
| Max1 | 1.5 | 10 | 7.69 | 11.6 | 7.14 | 6.15 | 5.56 | 3.58 |
| P97.52 | NA | 9.53 | 7.54 | 6.32 | 4.19 | 3.53 | 4.09 | 2.86 |
| Average3 | 0.90 | 2.51 | 2.01 | 1.69 | 1.08 | 0.95 | 0.94 | 0.66 |
| Median4 | 0.63 | 1.36 | 1.05 | 1.00 | 0.57 | 0.64 | 0.63 | 0.36 |
| SD5 | 0.52 | 2.82 | 2.23 | 1.90 | 1.22 | 0.91 | 0.97 | 0.67 |
| CV6 | 0.59 | 1.12 | 1.11 | 1.13 | 1.13 | 0.96 | 1.04 | 1.02 |
| Strawberries | ||||||||
| Consum [day] | 1 | 0 | 3 | 26 | 40 | 212 | 27 | 27 |
| LP [kg] | 0.04 | 0.06 | 1.08 | 0.50 | 0.54 | 0.35 | 0.22 | |
| Max1 | 5.00 | 3.85 | 43.48 | 9.68 | 10.00 | 4.55 | 3.17 | |
| P97.52 | 7.22 | |||||||
| Average3 | 6.17 | 2.82 | 2.08 | 1.68 | 1.49 | |||
| Median4 | 3.92 | 2.23 | 1.63 | 1.59 | 1.67 | |||
| SD5 | 8.65 | 2.42 | 1.92 | 1.96 | 0.96 | |||
| CV6 | 1.40 | 0.86 | 0.92 | 1.17 | 0.64 | |||
Notes: 1: Maximum amount consumed [g/kgbw/day]; 2: 97.5th percentile consumption [g/kgbw/day]; 3: Average of daily food consumption [g/kgbw/day]; 4: median of consumed food; 5: standard deviation of consumed food; 6: relative standard deviation of daily food consumption.
Table A2.
Summary of consumption survey 2018-2020.
| Age [year] | 1-2 | 2-3 | 3-9 | 9-18 | 18-64 | 64-74 |
| No of subjects | 536 | 516 | 939 | 1159 | 977 | 1070 |
| Ave bw [kg] | 11.07 | 13.62 | 17.57 | 50.50 | 79.55 | 81.50 |
| Apples | ||||||
| Consum [day] | 241 | 244 | 431 | 395 | 314 | 457 |
| LP [kg] | 0.322 | 0.324 | 0.466 | 0.733 | 0.480 | 0.524 |
| Max1 | 63.83 | 55.75 | 46.00 | 32.86 | 10.34 | 16.02 |
| P97.52 | 29.13 | 23.81 | 26.50 | 14.52 | 6.03 | 6.43 |
| Average3 | 9.71 | 8.40 | 7.10 | 3.92 | 2.23 | 2.56 |
| Median4 | 7.69 | 6.90 | 5.77 | 2.94 | 1.94 | 2.14 |
| SD5 | 8.72 | 6.66 | 6.34 | 4.01 | 1.52 | 1.64 |
| CV6 | 0.90 | 0.79 | 0.89 | 1.02 | 0.68 | 0.64 |
| Cherries | ||||||
| Consum [day] | 9 | 1 | 17 | 20 | 25 | 19 |
| LP [kg] | 0.170 | 0.084 | 0.251 | 0.170 | 0.435 | 0.229 |
| Max1 | 15.38 | 6.15 | 14.29 | 3.38 | 5.47 | 2.82 |
| P97.52 | NA | NA | NA | NA | NA | NA |
| Average3 | 6.64 | 3.37 | 1.38 | 1.45 | 0.98 | |
| Median4 | 6.96 | 2.67 | 1.00 | 0.91 | 0.63 | |
| SD5 | 4.35 | 3.31 | 1.03 | 1.47 | 0.87 | |
| CV6 | 0.66 | 0.98 | 0.75 | 1.02 | 0.89 | |
| Grape fresh+fresh pressed | ||||||
| Consum [day] | 18 | 16 | 38 | 64 | 66 | 48 |
| LP [kg] | 0.326 | 0.486 | 0.230 | 0.500 | 0.374 | 0.609 |
| Max1 | 29.41 | 35.71 | 25.00 | 20.80 | 5.56 | 9.26 |
| P97.52 | NA | NA | 13.11 | 9.91 | 4.70 | 7.49 |
| Average3 | 12.94 | 12.82 | 5.64 | 3.36 | 4.62 | 2.37 |
| Median4 | 11.60 | 10.71 | 4.46 | 2.61 | 1.54 | 1.60 |
| SD5 | 7.91 | 9.67 | 4.48 | 3.22 | 1.25 | 2.23 |
| CV6 | 0.61 | 0.75 | 0.79 | 0.96 | 0.27 | 0.94 |
| Peaches | ||||||
| Consum [day] | 11 | 10 | 28 | 26 | 30 | 46 |
| LP [kg] | 0.18 | 0.21 | 0.38 | 0.42 | 0.58 | 0.87 |
| Max1 | 16.00 | 15.38 | 21.43 | 9.29 | 7.46 | 14.38 |
| P97.52 | 17.14 | 8.39 | 7.29 | 10.66 | ||
| Average3 | 8.45 | 7.08 | 6.51 | 3.55 | 3.69 | 2.95 |
| Median4 | 9.09 | 6.67 | 5.66 | 3.13 | 2.07 | 2.61 |
| SD5 | 5.39 | 5.31 | 4.48 | 2.15 | 1.94 | 2.08 |
| CV6 | 0.64 | 0.75 | 0.69 | 0.61 | 0.53 | 0.71 |
| Peppers | ||||||
| Consum [day] | 2 | 3 | 10 | 19 | 28 | 23 |
| LP [kg] | 0.02 | 0.03 | 0.09 | 0.12 | 0.12 | 0.18 |
| Max1 | 1.67 | 2.14 | 3.94 | 2.49 | 1.52 | 2.22 |
| P97.52 | NA | NA | NA | NA | NA | NA |
| Average3 | 1.24 | 1.84 | 1.74 | 1.10 | 0.68 | 0.67 |
| Median4 | 1.24 | 2.00 | 1.58 | 1.00 | 0.59 | 0.60 |
| SD5 | 0.60 | 0.41 | 0.88 | 0.72 | 0.35 | 0.48 |
| CV6 | 0.48 | 0.22 | 0.51 | 0.65 | 0.52 | 0.72 |
| Strawberry fresh and frozen | ||||||
| Consum [day] | 15 | 14 | 9 | 26 | 28 | 33 |
| LP [kg] | 0.211 | 1.090 | 0.413 | 0.337 | 0.545 | 0.323 |
| Max1 | 19.09 | 80.00 | 23.53 | 6.67 | 6.85 | 6.00 |
| P97.52 | NA | NA | NA | NA | NA | 3.98 |
| Average3 | 7.25 | 11.04 | 4.39 | 1.59 | 1.72 | 1.31 |
| Median4 | 5.80 | 3.07 | 1.15 | 0.84 | 1.34 | 0.87 |
| SD5 | 5.15 | 20.68 | 7.50 | 1.83 | 1.33 | 1.25 |
| CV6 | 0.71 | 1.87 | 1.71 | 1.15 | 0.78 | 0.96 |
Notes: 1: Maximum amount consumed [g/kgbw/day]; 2: 97.5th percentile consumption [g/kgbw/day]; 3: Average of daily food consumption [g/kgbw/day]; 4: median of consumed food; 5: standard deviation of consumed food. 6: relative standard deviation of daily food consumption
References
- FAO. Pesticides trade, global, regional and country trends 1990–2018. Available online: https://www.fao.org/documents/card/en/c/cb0488en (accessed on 6 July 2023).
- FAO/WHO. Synthesis report on the environmental and health impacts of pesticides and fertilizers and ways to minimize them. 2022. Available online: www.fao.org/pest-and-pesticide-management/resources/en/ (accessed on 9 August 2023).
- National Research Council. Future role of pesticides in US agriculture; National Academies Press: Washington, D.C., USA, 2020; p. 332.
- OECD. Test guidelines for chemicals. Available online: https://www.oecd.org/chemicalsafety/testing/oecdguidelinesforthetestingofchemicals.htm (accessed on 9 August 2023).
- Solecki, R.; Schumacher, D.; Pejl, Bhula, R.; MacLachan, D.J. OECD Guidance documents and test guidelines. In Food Safety Assessment of Pesticide Residues; Ambrus, Á., Hamilton, D., Eds.; World Scientific: Hackensack, NJ, USA, 2017; pp. 13-36.
- Humphrey, P.; Margerison, S.; van der Velde-Koerts, T.; Doherty, M.; Rowland J. Principles of safety assessment of Pesticides at National level. In Food Safety Assessment of Pesticide Residues; Ambrus, Á., Hamilton, D., Eds.; World Scientific: Hackensack, NJ, USA, 2017; pp. 507–510.
- European Council. Consolidated text: Regulation (EC) No 396/2005 of the European Parliament and of the Council of 23 February 2005 on maximum residue levels of pesticides in or on food and feed of plant and animal origin and amending Council Directive 91/414/EEC (Text with EEA relevance. Available online: http://data.europa.eu/eli/reg/2005/396/2023-02-28 (accessed on 6 July 2023).
- European Council, Consolidated text: Regulation (EC) No 1107/2009 of the European Parliament and of the Council of 21 October 2009 concerning the placing of plant protection products on the market and repealing Council Directives 79/117/EEC and 91/414/EEC. Available online: https://eur-lex.europa.eu/legal-content/EN/TXT/?uri=celex%3A32009R1107 (accessed on 6 July 2023).
- US Environmental Protection Agency. Regulation of pesticide residues on food. Available online: https://www.epa.gov/pesticide-tolerances (accessed on 6 July 2023).
- FAO/WHO. JMPR reports and evaluations. Available online: https://www.who.int/groups/joint-fao-who-meeting-on-pesticide-residues-(jmpr)/publications (accessed on 6 July 2023).
- ASEAN. Maximum residue levels. Available online: https://asean.org/wp-content/uploads/images/2015/October/outreach-document/Edited%20MRLs-2.pdf (accessed on 6 July 2023).
- CODEX MRLs. Available online: http://www.fao.org/fao-who-codexalimentarius/codex-texts/dbs/pestres/pesticides/en/ (accessed on 6 July 2023).
- Ambrus, Á.; Vásárhelyi, A.; Ripka, G.; Szemánné-Dobrik, H.; Szenczi-Cseh, J. Evaluation of the results of pesticide residue analysis in food sampled between 2017 and 2021. Agrochemicals 2023, 2, 409–435. [Google Scholar] [CrossRef]
- Carrasco Cabrera, L.; Medina Pastor, P. The 2020 European Union report on pesticide residues in food. EFSA Journal 2020, 20, (3):7215, 57 pp. [Google Scholar] [CrossRef]
- European Commission. Commission implementing regulation (EU) 2021/601 of 13 April 2021 concerning a coordinated multiannual control program of the Union for 2022, 2023 and 2024 to Ensure compliance with maximum residue levels of pesticides and to assess the consumer exposure to pesticide residues in and on food of plant and animal origin, 2021. Available online: http://data.europa.eu/eli/reg_impl/2021/601/oj/ (accessed on 8 July 2023).
- Szenczi-Cseh, J.; Ambrus, Á. Uncertainty of exposure assessment of consumers to pesticide residues derived from food consumed. J. Environ Sci. Health B 2017, 52((9)), 658–670. [Google Scholar] [CrossRef] [PubMed]
- FAO. Submission and evaluation of pesticide residues data for the estimation of maximum residue levels in food and feed. FAO Plant Production and Protection Paper 2016, 225, p. 298. [Google Scholar]
- Dutra-Caldas, E.; van der Velde-Koerts, T. Dietary exposure and risk characterization for pesticide residues in food. In Food Safety Assessment of Pesticide Residues; Ambrus, Á., Hamilton, D., Eds.; World Scientific: Hackensack, NJ, USA, 2017; pp. 404–466. [Google Scholar]
- Dujardin, B.; Bocca, V. Cumulative dietary exposure assessment of pesticides that have acute effects on the nervous system using SAS® software. EFSA Journal 2019. 17(9):5764, pp. 54.. [Google Scholar] [CrossRef]
- Dujardin, B.; Bocca, V. Annexes to the scientific report on the cumulative dietary exposure assessment of pesticides that have acute effects on the nervous system using SAS® software - Input and output data sets. [CrossRef]
- Ambrus, Á.; Szenczi-Cseh, J.; Doan, V.V.N.; Vásárhelyi, A. Evaluation of monitoring data in foods. Agrochemicals 2023, 2, 69–95. [Google Scholar] [CrossRef]
- Caldas, E.D.; Boon, P.E.; Tressou, J. Probabilistic assessment of the cumulative acute exposure to organophosphorus and carbamate insecticides in the Brazilian diet. Toxicology 2006, 222, 132–142. [Google Scholar] [CrossRef]
- EFSA Panel on Plant Protection Products and their Residues (PPR). Scientific opinion on the identification of pesticides to be included in cumulative assessment groups on the basis of their toxicological profile (2014 update). EFSA Journal 2013, 11(7):3293, pp. 131. [CrossRef]
- Crivellente, F.; Hart, A.; Hernandez-Jerez A.F.; Hougaard Bennekou, S.; Pedersen, R.; Terron, A.; Wolterink, G.; Mohimont, L. Scientific report on the establishment of cumulative assessment groups of pesticides for their effects on the nervous system. EFSA Journal, 2019, 17(9):5800, pp. 115. [CrossRef]
- US Environmental Protection Agency. Guidance on cumulative risk assessment of pesticide chemicals that have a common mechanism of toxicity. Available online: https://www.federalregister.gov/documents/2002/01/16/02-959/pesticides-guidance-on-cumulative-risk-assessment-of-pesticide-chemicals-that-have-a-common (accessed on 12 July 2023).
- Environmental Protection Agency. Organophosphorus cumulative risk assessment (2006 Update). Available online: https://www.regulations.gov/document?D=EPA-HQ-OPP-2006-0618-0002 (accessed on 2 August 2023).
- US Environmental Protection Agency. Revised N-methyl carbamate cumulative risk assessment, 2007. Available online: https://archive.epa.gov/pesticides/reregistration/web/pdf/nmc_revised_cra.pdf (accessed on 2 August 2023).
- US Environmental Protection Agency. Pyrethrins/pyrethroid cumulative risk assessment,2011. Available online: https://www.regulations.gov/document?D=EPA-HQ-OPP-2011-0746-0003 (accessed on 2 August 2023).
- US Environmental Protection Agency. Chlorotriazines: cumulative risk assessment - atrazine, propazine, and simazine,2018. Available online: https://www.regulations.gov/document/EPA-HQ-OPP-2013-0266-1160 (accessed on 26 July 2023).
- Kortenkamp, A.; Evans, R.; Faust, M.; Kalberlah, F.; Scholze, M.; Schuhmacher-Wolz, U. Investigation of the state of the science on combined actions of chemicals in food through dissimilar modes of action and proposal for science-based approach for performing related cumulative risk assessment. EFSA Supporting Publications, 2012, EN-232, pp. 233. Available on: http://www.efsa.europa.eu/en/supporting/doc/232e.pdf https://doi.org10.2903/sp.efsa.2012.EN-232 (accessed on 26 July 2023 ). 26 July.
- Cui, K.; Wu, X.; Zhang, Y.; Cao, J.; Wei, D.; Xu, J.; Dong, F.; Liu, X.; Zheng, Y. Cumulative risk assessment of dietary exposure to triazole fungicides from 13 daily-consumed foods in China. Environmental Pollution 2021, 286, 117550. [Google Scholar] [CrossRef]
- Boon, P.E.; van der Voet, H.; van Raaij, M.T.M.; van Klaveren, J.D. Cumulative risk assessment of the exposure to organophosphorus and carbamate insecticides in the Dutch diet. Food Chem. Toxicol. 2008, 46, 3090e3098. [Google Scholar] [CrossRef]
- Boon, P.E.; van Donkersgoed, G.; Christodoulou, D.; Crepet, A.; D'Addezio, L.; Desvignes, V.; Ericsson, B.G.; Galimberti, F.; Ioannou-Kakouri, E.; Jensen, B.H.; Rehurkova, I.; Rety, J.; Rupich, J.; Sand, S.; Stephenson, C.; Stromberg, A.; Turrini, A.; van der Voet, H.; Ziegler, P.; Hamey, P.; van Klaveren, J.D. Cumulative dietary exposure to a selected group of pesticides of the triazole group in different European countries according to the EFSA guidance on probabilistic modelling. Food Chem. Toxicol. 2015, 79, 13–31. [Google Scholar] [CrossRef]
- Sieke, C. Probabilistic cumulative dietary risk assessment of pesticide residues in foods for the German population based on food monitoring data from 2009 to 2014. Food Chem. Toxicol. 2018, 121, 396–403. [Google Scholar] [CrossRef]
- Zentai, A.; Kerekes, K.; Szabó, I.; Ambrus, Á. Refining customer exposure due to pesticide residues–Part 1. J. Food Investig. 2015, 41, 681–719. [Google Scholar]
- Jensen, B.H.; Petersen, A.; Nielsen, E.; Christensen, T.; Poulsen, M. E.; Andersen, J. H. Cumulative dietary exposure of the population of Denmark to pesticides. Food Chem. Toxicol. 2015, 83, 300–307. [Google Scholar] [CrossRef]
- Jensen, B.H.; Petersen, A.; Petersen, P.B.; Christensen, T.; Fagt, S.; Trolle, E.; Poulsen, M.E.; Hinge Andersen, J. Cumulative dietary risk assessment of pesticides in food for the Danish population for the period 2012-2017. Food Chem.Toxicol. 2022, 168, 113359. [Google Scholar] [CrossRef]
- Larsson, M.O.; Sloth Nielsen, V.; Bjerre, N.; Laporte, F.; Cedergreen, N. Refined assessment and perspectives on the cumulative risk resulting from the dietary exposure to pesticide residues in the Danish population. Food Chem. Toxicol. 2018, 111, 207–267. [Google Scholar] [CrossRef] [PubMed]
- Wilkinson, C.F.; Christoph, G.R.; Julien, E.; Kelley, J.M.; Kronenberg, J.; McCarthy, J.; Reiss, R. Assessing the risks of exposures to multiple chemicals with a common mechanism of toxicity: how to cumulate? Regul. Toxicol. Pharmacol. 2000, 31((1)), 30e43. [Google Scholar] [CrossRef] [PubMed]
- Harrell, F.E.; Davis, C.E. A new distribution-free quantile estimator. Biometrika 1982, 69((3)), 635 640. [Google Scholar] [CrossRef]
- Zaiontz, C. Real Statistics. Available online: https://real-statistics.com/descriptive-statistics/ranking-function-excel/harrell-davis-quantiles/ (accessed on 8 May 2023).
- USDA. Food composition database. Available online: http://www.nal.usda.gov/fnic/foodcomp/search/index.html (accessed on19 April 2023).
- USDA. Food data central. Available online: https://fdc.nal.usda.gov/ (accessed on19 April 2023).
- Monroe, D. Pre-Engel studies and the work of Engel: the origins of consumption research. Home Economics Research Journal 1974, 3((1)), 43–64. [Google Scholar] [CrossRef]
- Peterkin, B.B. USDA food consumption research: parade of survey greatsThe Journal of Nutrition 1994, 124, 1836S–1842S. [CrossRef]
- Borlizzi, A.; Delgrossi, M.E.; Cafiero, C. National food security assessment through the analysis of food consumption data from Household Consumption and Expenditure Surveys: The case of Brazil’s Pesquisa de Orçamento Familiares 2008/09. Food Policy 2017, 72, 20–26. [Google Scholar] [CrossRef]
- Bailey, R. L. Overview of dietary assessment methods for measuring intakes of foods, beverages, and dietary supplements in research studies. Current Opinion in Biotechnology 2021, 70, 91–96. [Google Scholar] [CrossRef]
- Conforti, P.; Grünberger, K.; Troubat, N. The impact of survey characteristics on the measurement of food consumption. Food Policy 2017, 72, 43–52. [CrossRef]
- Engle-Stone, R.; Sununtnasuk, C.; Fiedler, J.L. Investigating the significance of the data collection period of household consumption and expenditures surveys for food and nutrition policymaking: Analysis of the 2010 Bangladesh household income and expenditure survey. Food Policy 2017, 72, 72–80. [Google Scholar] [CrossRef]
- European Food Safety Authority. General principles for the collection of national food consumption data in the view of a pan-European dietary survey. EFSA Journal 2009, 7((12)), 1435, pp. 51. [Google Scholar] [CrossRef]
- FSA. Guidance on the EU Menu methodology. EFSA Journal 2014, 12((12)), 3944, pp. 77. [Google Scholar] [CrossRef]
- Ocké, M.; de Boer, E.; Brants, H.; van der Laan, J.; Niekerk, M.; van Rossum, C.; Temme, L.; Freisling, H.; Nicolas, G.; Casagrande, C.; Slimani, N.; Trolle, E.; Ege, M.; Christensen, T.; Vandevijvere, S.; Bellemans, M.; De Maeyer, M.; Defourny, S.; Rupich, J.; Dofkova, M.; Rehurkova, I.; Jakubikova, M.; Blahova, J.; Piskackova, Z.; Maly, M. PANCAKE—Pilot study for the assessment of nutrient intake and food consumption among kids in Europe. EFSA Supporting Publications 2012, EN-339, pp. 120. Available online: http://www.efsa.europa.eu/en/supporting/pub/339e.htm (accessed on 17 May 2023).
- Ambrus, Á.; Horváth, Zs.; Farkas, Zs.; Cseh, J, Petrova, S.; Dimitrov, P.; Duleva, V.; Rangelova, L.; ChikovaIscener, E.; Ovaskainen, M-L.; Pakkala, H; Heinemeyer, G; Lindtner, O.; Schweter, A.; Naska, A.; Sekuła, W.; Guiomar, S.; Lopes, C.; and Torres, D. Pilot study in the view of a Pan-European dietary survey—adolescents, adults and elderly. EFSA Supporting Publications 2013, 10(11). Available online: https://efsa.onlinelibrary.wiley.com/doi/10.2903/sp.efsa.2013.EN-508.
- Szeitz-Szabó, M.; Bíró, L.; Bíró, G.; Sali, J. Dietary survey in Hungary, 2009. Part I. Macronutrients, alcohol, caffeine, fibre. Acta Alimentaria 2011, 40((1)), 142–152. [Google Scholar] [CrossRef]
- Biró, L.; Szeitz-Szabó, M.; Biró, G.; Sali, J. Dietary survey in Hungary, 2009. Part II: Vitamins, macro- and microelements, food supplements and food allergy. Acta Alimentaria 2011, 40((2)), 301–312. [Google Scholar] [CrossRef]
- HFCSO. Food consumption survey 2018-2020 supported by the EFSA EU Menu project (unpublished).
- FAO. Report of the First Meeting of the Codex Committee on pesticide residues. Available online: https://www.fao.org/fao-who-codexalimentarius/sh-proxy/en/?lnk=1&url=https%253A%252F%252Fworkspace.fao.org%252Fsites%252Fcodex%252FMeetings%252FCX-718-01%252Fal66_24e.pdf (accessed on 17 May 2023). FAO/WHO. IEDI calculation template 17-cluster dietAvailable online: https://cdn.who.int/media/docs/default-source/food-safety/gemsfood/iedi-calculation-vs04-17clusters.xlsx (accessed on 17 May 2023).
- WHO GEMS/Food Cluster Diets 2012. Available online: https://www.who.int/data/gho/samples/food-cluster-diets (accessed on 17 May 2023).
- Anastassiadou, M.; Brancato, A.; Carrasco Cabrera, L.; Ferreira, L.; Greco, L.; Jarrah, S.; Kazocina, A.; Leuschner, R.; Magrans, J.O. ; Miron, I; Pedersen, R; Raczyk, M.; Reich, H.; Ruocco S.; Sacchi, A; Santos, M; Stanek, A; Tarazona, J; Theobald, A; Verani, A. Pesticide Residue Intake Model- EFSA PRIMo revision 3.1 (update of EFSA PRIMo revision 3). EFSA supporting publication, 2019; pp. 15. [Google Scholar] [CrossRef]
- Commission implementing regulation (EU) 2016/662 of 1 April 2016 concerning a coordinated multiannual control program of the Union for 2017, 2018 and 2019 to ensure compliance with maximum residue levels of pesticides and to assess the consumer exposure to pesticide residues in and on food of plant and animal origin (Text with EEA relevance). Available online: https://eur-lex.europa.eu/legal-content/en/ALL/?uri=CELEX%3A32016R0662 (accessed on 1 June 2023).
- Commission implementing regulation (EU) 2018/555 of 9 April 2018 concerning a coordinated multiannual control program of the Union for 2019, 2020 and 2021 to ensure compliance with maximum residue levels of pesticides and to assess the consumer exposure to pesticide residues in and on food of plant and animal origin (Text with EEA relevance.) Available online:. Available online: https://eur-lex.europa.eu/legal-content/EN/TXT/?uri=CELEX%3A32018R0555 (accessed on 1 June 2023).
- European Commission Directive 2002/63/EK Establishing community methods of sampling for the official control of pesticide residues in and on products of plant and animal origin and repealing Directive 79/700/EEC. Available online: https://eur-lex.europa.eu/legal-content/EN/ALL/?uri=celex%3A32002L0063 (accessed on 1 June 2023).
- ISO. ISO/IEC 17025:2017 General requirements for the competence of testing and calibration laboratories. Available online: www.iso.org/ISO-IEC-17025-testing-and-calibration-laboratories.html (accessed on 25 May 2023).
- European Commission. Analytical quality control and method validation procedures for pesticide residues analysis in food and feed SANTE 11312/2021. Available online: https://food.ec.europa.eu/system/files/2022-02/pesticides_mrl_guidelines_wrkdoc_2021-11312.pdf (accessed on 25 May 2023).
- Anastassiades, M.; Lehotay, S.J.; Štajnbaher, D.; Schenck, F.J. Fast and easy multiresidue method employing acetonitrile extraction/partitioning and ‘dispersive solid-phase extraction’ for the determination of pesticide residues in produce. J. AOAC Int. 2003, 86, 412–431, (accessed on 31 December 2021). [Google Scholar] [CrossRef] [PubMed]
- Anastassiades, M.; Scherbaum, E.; Tasdelen, B.; Stajnbaher, D. Recent developments. In QuEChERS methodology for pesticide multiresidue analysis. Pesticide Chemistry: Crop Protection, Public Health, Environmental Safety; Ohkawa, H., Miyagawa, H., Lee, P.W., Eds.; WILEY-VCH Verlag GmbH & Co.: Weinheim, pp. 439–458.
- Anastassiades, M.; Wachtler, A.K.; Kolberg, D.I.; Eichhorn,E.; Marks, H.; Benkenstein, A.; Zechmann, S.; Mack,D.; Wildgrube, C.; Barth, A.; Sigalov, I.; Görlich, S.; Dörk,D.; Cerchia, G. Quick method for the analysis of highly polar pesticides in food involving extraction with acidified methanol and LC-or IC-MS/MS measurement I. Food of plant origin (QuPPe-PO-Method). Available online: https://www.eurl-pesticides.eu/userfiles/file/EurlSRM/EurlSrm_meth_QuPPe_PO_V11_1.pdf (accessed on 27 June 2023).
- FAO. Portion of commodities to which Codex MRLs apply and which is analyzed (CAC/GL 41-1993). Available online: http://www.fao.org/fao-who-codexalimentarius/sh-proxy/en/?lnk=1&url=https%253A%252F%252Fworkspace.fao.org%252Fsites%252Fcodex%252FStandards%252FCXG%2B41-1993%252FCXG_041e.pdf (accessed on 25 May 2023).
- Rodler, I.; Biró, L.; Greiner, E.; Zajkás, G.; Szórád, I.; Varga, A.; Domonkos, A.; Ágoston, H.; Balázs, A.; Vitray, J.; Hermann, D.; Boros, J.; Németh, R.; Kéki, Zs. [Dietary survey in Hungary, 2003–2004.] Táplálkozási vizsgálat Magyarországon, 2003-2004. Orvosi Hetilap 2005, 146((34)), 1781–1789. [Google Scholar]
- Biró, L.; Kicsák, M.; Sági, K. Multicenter investigation of energy- and nutrient intake of type 1 diabetics. Results and relationships. Diabetologia Hungarica 1999, 7((4)), 243–251. [Google Scholar]
- Biró, L.; Rabin, B.; Regöly-Mérei, A.; Nagy, K.; Pintér, B.; Beretvás, E.; Morava, E.; Antal, M. Dietary habits of medical and pharmacy students at Semmelweis University, Budapest. Acta Alimentaria 2005, 34((4)), 463–471. [Google Scholar] [CrossRef]
- Hamilton, D.; Ambrus, Á.; Dieterle, R.; Felsot, A.; Harris, C.; Petersen, B.; Racke, K.; Wong, S.-S.; Gonzales, R.; Tanaka, K.; Earl, M.; Roberts, G.; Bhula, R. Pesticide residues in food—Acute dietary exposure. Pest Manag. Sci. 2004, 60, 311–339. [Google Scholar] [CrossRef] [PubMed]
- EFSA. Opinion of the Scientific Panel on Plant Health, Plant Protection Products and their Residues on a request from the Commission related to the appropriate variability factor(s) to be used for acute dietary exposure assessment of pesticide residues in fruit and vegetables. EFSA J. 2005, 177, 1–61. [Google Scholar] [CrossRef]
- Klaveren, J.D; G. van Donkersgoed, G.H; van der Voet, H.; C. Stephenson, C.; Boon, P.E. Cumulative Exposure Assessment of Triazole Pesticides scientific/technical report submitted to EFSA, 2009, RIKILT – Institute of Food Safety, Wageningen University and Research Centre. Available online: https://edepot.wur.nl/11984 (accessed on 6 August 2023).
- WHO. Inventory of evaluations performed by the Joint Meeting on Pesticide Residues (JMPR). Available online: https://apps.who.int/pesticide-residues-jmpr-database/Home/Range/All (accessed on 6 August 2023).
- Reffstrup, T.K.; Larsen, J.C.; Meyer, O. Risk assessment of mixtures of pesticides. Current approaches and future strategies. Regul. Toxicol. Pharmacol. 2010, 56((4)), 174e192. [Google Scholar] [CrossRef] [PubMed]
- Antal, E.; Pilling, R.; Kőris, T.; Biró, L. Representative nutritional and physical activity study in Hungary among 11–18 years old children (in Hungarian). Magyar Tudomány 2019, 180((5)), 720–738. [Google Scholar] [CrossRef]
- Sarkadi Nagy, E.; Bakacs, M.; Illés, É.; Nagy, B.; Varga, A., Kis, O.; Molnár, S.; Martos, É. [Hungarian Diet and Nutritional Status Survey – OTÁP2014. II. Energy and macronutrient intake of the Hungarian population]. Orv Hetil. 2017, 158(15), 587–597. [CrossRef]
- FAO. Pesticide residues in food 2009 Report of the Joint FAO/WHO Meeting on pesticide residues, Geneva 2009.FAO Plant Production and Protection Paper 196. Available online: https://www.fao.org/fileadmin/templates/agphome/documents/Pests_Pesticides/JMPR/JMPRreport09.pdf (accessed on 6 August 2023).
Figure 1.
Relative frequency of residues detected in the selected commodities during 2017-2021.
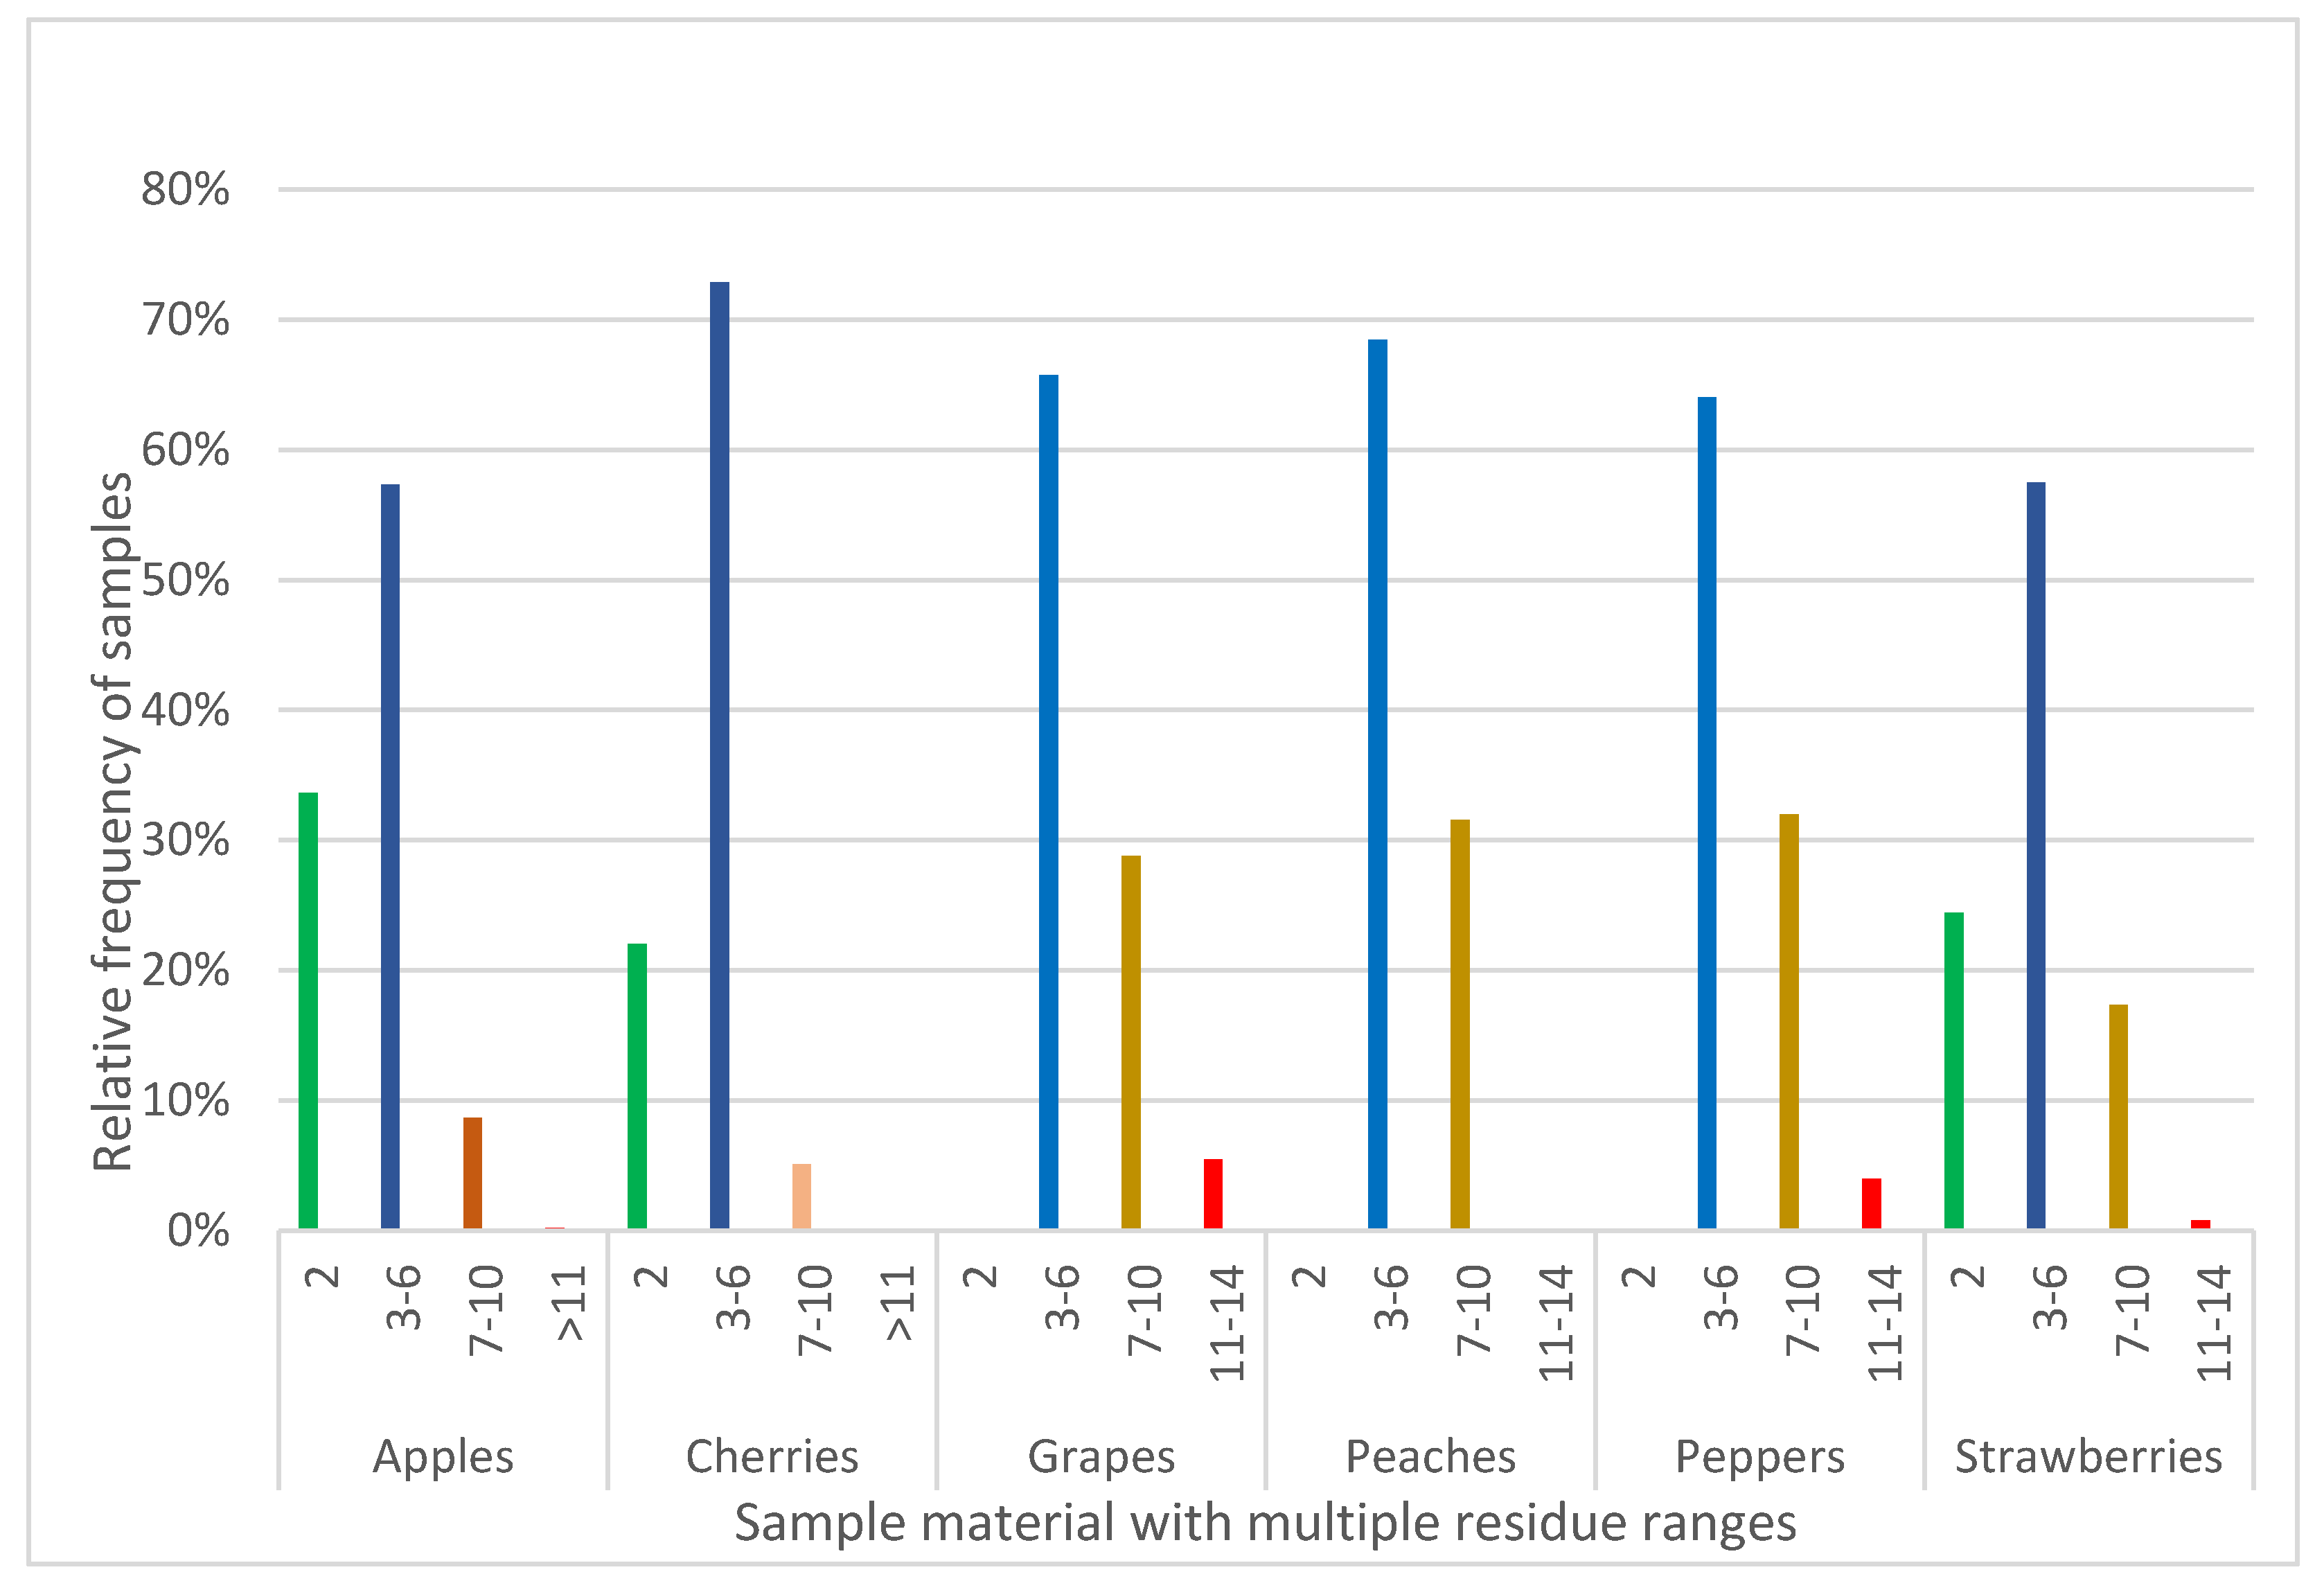
Table 1.
Gender and age distributions of the participants of the two surveys.
| Age (year) | Gender | 2009 | 2018-2020 |
|---|---|---|---|
| 0-1 | Male | 18 | - |
| Female | 60 | - | |
| 1-2 | Male | 46 | 134 |
| Female | 86 | 134 | |
| 2-3 | Male | 73 | 131 |
| Female | 65 | 128 | |
| 3-9 | Male | 420 | 237 |
| Female | 396 | 233 | |
| 9-18 | Male | 800 | 288 |
| Female | 838 | 292 | |
| 18-64 | Male | 4946 | 256 |
| Female | 5001 | 255 | |
| 64-74 | Male | 600 | 257 |
| Female | 627 | 257 | |
| >74 | Male | 447 | - |
| Female | 552 | - |
Note: The age ranges were calculated as: 0-1: babies up to one year, excluding those who had their birthdays on the survey day; the other age groups were defined similarly.
Table 2.
Descriptive statistics of mass distribution of selected food items.
| Unit mass of medium sized items [g] | ||||||||
|---|---|---|---|---|---|---|---|---|
| No. | Maximum | P0.975 | Average | Median | P0.025 | Min | ||
| Apples | 922 | 475 | 345 | 222 | 220 | 105 | 87 | |
| Grapes | 717 | 1291 | 1106 | 308 | 265 | 50 | 19 | |
| Nectarines | 313 | 316 | 180 | 139 | 143 | 94 | 11 | |
| Peaches | 73 | 301 | 284 | 197 | 208 | 102 | 17 | |
| Peppers, bell | 289 | 298 | 278 | 218 | 218 | 159 | 86 | |
| Peppers, green | 492 | 199 | 152 | 76 | 64 | 34 | 5 | |
The typical maximum and median unit mass of strawberries are 19 and ≤12 g. Cherries are smaller (max 6-8 g).
Table 3.
Main parameters of the analytical tests carried out between 2017-2021.
| Commodity1 | Number of | Proportion of occurrence | |||
|---|---|---|---|---|---|
| Samples2 | Analytes3 | R>MRL4 | MRL≥R≥LOQ5 | R<LOQ6 | |
| All commodities | 9924 | 622 | 1.0% | 53.0% | 45.9% |
| Apples | 833 | 617 | 0.1% | 74.1% | 25.8% |
| Cherries | 122 | 583 | 0.8% | 78.7% | 21.3% |
| Grapes | 411 | 618 | 0.2% | 80.5% | 19.2% |
| Peaches | 349 | 593 | 0.3% | 66.2% | 33.5% |
| Peppers | 616 | 621 | 0.6% | 48.4% | 51.0% |
| Strawberries | 225 | 601 | 1.3% | 74.2% | 24.4% |
Notes: 1: Commodities included in the sampling programme. 2: Number of samples investigated. 3: Total number of residues screened in the samples. The scopes of the analytical methods were decided based on the prior information available. Consequently, not all samples were tested for all analytes. 4: Percent of samples contained residues above the MRL. 5: Percent of samples contained detectable residues <MRL. 6: Percent of samples without detectable residues (limit of quantification).
Table 4.
Summary of multiple (≥2) residues detected in individual samples of all commodities.
| Year | Total no. of samples analysed | Samples with multiple residues | Max. no. of residues |
|---|---|---|---|
| 2017 | 1902 | 761 (40%) | 23 |
| 2018 | 1995 | 820 (41%) | 13 |
| 2019 | 1842 | 916 (50%) | 15 |
| 2020 | 1750 | 625 (36%) | 16 |
| 2021 | 1666 | 719 (43%) | 11 |
Table 5.
Maximum number of multiple residues found in the selected commodities.
| Commodity | Maximum number of multiple residues found in samples per years | ||||
|---|---|---|---|---|---|
| 2017 | 2018 | 2019 | 2020 | 2021 | |
| Apples | 10 | 13 | 8 | 9 | 11 |
| Cherries | 10 | 10 | 6 | 6 | 6 |
| Grapes | 12 | 11 | 11 | 11 | 7 |
| Peaches | 6 | 6 | 7 | 9 | 5 |
| Peppers | 7 | 11 | 7 | 8 | 8 |
| Strawberries | 7 | 9 | 11 | 7 | 9 |
Table 6.
The number of samples1 and residues investigated in the selected commodities.
| 2017 | 2018 | 2019 | 2020 | 2021 | ||||||
|---|---|---|---|---|---|---|---|---|---|---|
| Number of | ||||||||||
| Samples | RES | Samples | RES | Samples | RES | Samples | RES | Samples | RES | |
| Apples | 73 | 42 | 101 | 38 | 107 | 39 | 89 | 38 | 103 | 40 |
| Cherries | 16 | 18 | 16 | 21 | 10 | 12 | 8 | 10 | 9 | 13 |
| Grapes | 20 | 42 | 17 | 31 | 17 | 35 | 13 | 42 | 6 | 27 |
| Peaches | 3 | 12 | 10 | 26 | 9 | 19 | 12 | 25 | 4 | 10 |
| Peppers | 5 | 15 | 6 | 27 | 3 | 13 | 6 | 32 | 5 | 21 |
| Strawberries | 33 | 27 | 35 | 37 | 36 | 34 | 3 | 11 | 20 | 26 |
Notes: 1: samples containing multiple residues; RES: type of residues investigated in various samples.
Table 7.
The estimated short-term intake and HQ values based on the apple consumption from the 2018-2020 survey.
Table 7.
The estimated short-term intake and HQ values based on the apple consumption from the 2018-2020 survey.
| Age | 1-2 | 2-3 | 3-9 | 9-18 | 18-64 | 64-74 | 1-2 | ||
| BW [kg] | 11.1 | 13.6 | 17.6 | 50.5 | 79.6 | 81.5 | |||
| LP [kg] | 0.32 | 0.32 | 0.47 | 0.73 | 0.48 | 0.52 | |||
| Residues | P0.975 (mg/kg) | ARfD (mg/kgbw/day) | ESTI | HQ | |||||
| Acetamiprid | 0.12 | 0.025 | 0.0082 | 0.0067 | 0.0062 | 0.0028 | 0.0014 | 0.0014 | 0.33 |
| Captan sum | 1.02 | 1.3 | 0.070 | 0.057 | 0.053 | 0.024 | 0.012 | 0.012 | 0.05 |
| Carbendazim | 0.094 | 0.02 | 0.006 | 0.005 | 0.005 | 0.002 | 0.001 | 0.001 | 0.32 |
| Chlorpyrifos-Methyl | 0.055 | 0.1 | 0.004 | 0.003 | 0.003 | 0.001 | 0.001 | 0.001 | 0.04 |
| Difenoconazole | 0.112 | 0.16 | 0.008 | 0.006 | 0.006 | 0.003 | 0.001 | 0.001 | 0.05 |
| Dithianon | 0.163 | 0.12 | 0.011 | 0.009 | 0.008 | 0.004 | 0.002 | 0.002 | 0.09 |
| Etofenprox | 0.175 | 1 | 0.012 | 0.010 | 0.009 | 0.004 | 0.002 | 0.002 | 0.01 |
| Fluopyram | 0.182 | 0.5 | 0.012 | 0.010 | 0.009 | 0.004 | 0.002 | 0.002 | 0.02 |
| Fluxapyroxad | 0.07 | 0.25 | 0.005 | 0.004 | 0.004 | 0.002 | 0.001 | 0.001 | 0.02 |
| Indoxacarb | 0.08 | 0.125 | 0.005 | 0.004 | 0.004 | 0.002 | 0.001 | 0.001 | 0.04 |
| Lambda-Cyhalothrin | 0.045 | 0.005 | 0.003 | 0.003 | 0.002 | 0.001 | 0.001 | 0.001 | 0.62 |
| Methoxyfenozide | 0.139 | 0.1 | 0.010 | 0.008 | 0.007 | 0.003 | 0.002 | 0.002 | 0.10 |
| Pirimicarb | 0.09 | 0.1 | 0.006 | 0.005 | 0.005 | 0.002 | 0.001 | 0.001 | 0.06 |
| Pyraclostrobin | 0.074 | 0.03 | 0.005 | 0.004 | 0.004 | 0.002 | 0.001 | 0.001 | 0.17 |
| Tebuconazole | 0.148 | 0.03 | 0.010 | 0.008 | 0.008 | 0.003 | 0.002 | 0.002 | 0.34 |
| Thiacloprid | 0.118 | 0.02 | 0.008 | 0.007 | 0.006 | 0.003 | 0.001 | 0.001 | 0.40 |
| Thiamethoxam | 0.045 | 0.5 | 0.003 | 0.003 | 0.002 | 0.001 | 0.001 | 0.001 | 0.01 |
Table 8.
Comparison of HQ values calculated based on apple consumption for age group of 1-2 years with variability factors of 3, 3.6 and 7.
Table 8.
Comparison of HQ values calculated based on apple consumption for age group of 1-2 years with variability factors of 3, 3.6 and 7.
| Compound | ARFD (mg/kgbw/day) | Survey year | BW (kg) | LP (kg) | HQ (ν=3) | HQ (ν=3.6) | HQν=7 |
|---|---|---|---|---|---|---|---|
| Lambda-Cyhalothrin | 0.005 | 2009 | 12.11 | 0.322 | 0.85 | 0.99 | 1.82 |
| 2018-2020 | 11.1 | 0.323 | 0.62 | 0.72 | 0.99 | ||
| Thiacloprid | 0.02 | 2009 | 12.11 | 0.322 | 0.56 | 0.65 | 1.19 |
| 2018-2020 | 11.1 | 0.323 | 0.4 | 0.47 | 0.87 |
BW: body mass.
Table 9.
Hazard quotients calculated with the residues detected in the selected commodities.
| Crop | HQ for Age groups | |||||
|---|---|---|---|---|---|---|
| 1-2 | 2-3 | 3-9 | 9-18 | 18-64 | 64-74 | |
| Cherries | ||||||
| Acetamiprid | 0.078 | 0.030 | 0.072 | 0.017 | 0.027 | 0.014 |
| Fluopyram | 0.006 | 0.002 | 0.005 | 0.001 | 0.002 | 0.001 |
| Grapes | ||||||
| Acetamiprid | 1.50 | 1.81 | 0.66 | 0.50 | 0.23 | 0.38 |
| Difenoconazole | 0.798 | 0.963 | 0.351 | 0.265 | 0.125 | 0.200 |
| Fluopyram | 0.083 | 0.101 | 0.037 | 0.028 | 0.013 | 0.021 |
| Peaches | ||||||
| Acetamiprid | 0.456 | 0.659 | 0.436 | 0.204 | 0.066 | 0.131 |
| Fluopyram | 0.034 | 0.049 | 0.033 | 0.015 | 0.005 | 0.010 |
| Peppers | ||||||
| Acetamiprid | 0.072 | 0.087 | 0.203 | 0.094 | 0.060 | 0.087 |
| Difenoconazole | 0.012 | 0.014 | 0.033 | 0.015 | 0.010 | 0.014 |
| Fluopyram | 0.004 | 0.005 | 0.011 | 0.005 | 0.003 | 0.005 |
| Indoxacarb | 0.152 | 0.186 | 0.432 | 0.200 | 0.127 | 0.186 |
| Strawberries | ||||||
| Pyraclostrobin | 0.085 | 0.360 | 0.105 | 0.030 | 0.031 | 0.018 |
| Trifloxystrobin | 0.011 | 0.045 | 0.013 | 0.004 | 0.004 | 0.002 |
Table 10.
Summary of multiple residues exceeding the MRL values.
| Crop | Origin | Analyte | MRL | Highest residue | No. of residues detected |
|---|---|---|---|---|---|
| Cherries | Hungary | Dimethoate/omethoate | 0.02 | 0.052 | 2 |
| Peppers | Turkey | Chlorpyrifos | 0.01 | 0.058 | 8 |
| Turkey | Chlorpyrifos | 0.01 | 0,.036 | 4 | |
| Strawberries | Hungary | Tebuconazole | 0.02 | 0.17 | 9 |
| Hungary | Flonicamid | 0.03 | 0.32 | 3 | |
| Hungary | Propamocarb | 0.01 | 0.064 | 4 |
Table 11.
ARfD values and residues detected in peppers and strawberries.
| Active substances | ARfD | Peppers | Strawberries |
| Residues [mg/kg] | |||
| Acetamiprid | 0.025 | 0.17 | |
| Boscalid | NA | 0.12 | 0.13 |
| Chlorpyrifos-methyl | 0.1 NAP | 0.058 | |
| Cyprodinil | NA | 0.29 | |
| Etoxazole | NA | 0.038 | |
| Flonicamid (sum) | 0.025 | 0.32 | |
| Hexythiazox | NA | 0.017 | |
| Indoxacarb | 0.005 | 0.11 | |
| Methoxyfenozide | 0.1 | 0.082 | |
| Penconazole | 0.5 | 0.014 | |
| Picoxystrobin | NAP | 0.209 | |
| Pyraclostrobin | 0.03 | 0.026 | 0.029 |
| Pyridaben | 0.05 | 0.064 | |
| Spirotetramat (sum) | 1.0 | 0.033 | |
| Tebuconazole | 0.03 | 0.17 | |
| Trifloxystrobin | 0.5 | 0.057 | |
Notes: NA: no ARfD; NAP: not authorized, no ARfD reported by European Commission.
Table 12.
Hazard indices calculated from multiple residues in peppers and strawberries.
| Age groups | 1-2 | 2-3 | 3-9 | 9-18 | 18-64 | 64-74 |
|---|---|---|---|---|---|---|
| Peppers | 0.19 | 0.25 | 0.16 | 0.08 | 0.05 | 0.07 |
| Strawberries | 0.37 | 0.37 | 0.46 | 0.13 | 0.13 | 0.08 |
Table 13.
Frequency and relative frequency of the combined consumption of the selected food items.
| No.1 | Frequency | Rel. frequency |
|---|---|---|
| 0 | 2845 | 54.41% |
| 1 | 2057 | 39.34% |
| 2 | 288 | 5.51% |
| 3 | 35 | 0.67% |
| 4 | 4 | 0.08% |
| Total | 5229 |
1: Number of food items consumed.
Table 14.
Amount of food [g/kgbw] consumed on one day during the 2018-2020 survey.
| Case | Daily consumption g/kgbw/day | ||||||||
|---|---|---|---|---|---|---|---|---|---|
| Age | Bw [kg] | Apple | Cherries | Grapes | Peaches | Peppers | Strawberries | Sum | |
| 1 | 3.9 | 14 | 32.1 | 7.71 | 39.9 | ||||
| 2 | 3.77 | 15.5 | 25.8 | 12.90 | 38.7 | ||||
| 3 | 5.75 | 18 | 25.0 | 6.67 | 31.7 | ||||
| 4 | 5.05 | 18.8 | 18.6 | 8.51 | 27.1 | ||||
| 5 | 3.43 | 17 | 11.8 | 14.71 | 26.5 | ||||
| 6 | 1.63 | 10 | 22.5 | 2 | 24.5 | ||||
| 7 | 5.05 | 18.8 | 16.0 | 8.51 | 24.5 | ||||
| 8 | 1.6 | 12 | 3.3 | 20.83 | 24.2 | ||||
| 9 | 2.54 | 12.5 | 0.0 | 12 | 12.00 | 24.0 | |||
| 10 | 2.19 | 15 | 20.0 | 2 | 22.0 | ||||
| 11 | 3.91 | 14 | 1.8 | 19.00 | 20.8 | ||||
| 12 | 9.34 | 27 | 5.6 | 3.70 | 9.3 | ||||
Table 15.
Consumption days and relative frequency of the sum [g/kgbw] of consumed food.
| Food1 g/kgbw | Frequency | |
| day | proportion | |
| 20 | 5164 | 98.8% |
| 30 | 45 | 0.9% |
| 40 | 16 | 0.3% |
| 90 | 3 | 0.1% |
| 95 | 1 | 0.0% |
| More | 0 | |
| Sum | 5629 | |
Note: 1: Total mass of the selected 6 food items within a day.
Table 16.
Residues detected in the samples of selected commodities.
| Number of samples with reported residue levels1 | |||||
|---|---|---|---|---|---|
| Apples | Grapes | Peaches | Strawberries | Peppers | |
| Acetamiprid | 162 (0.037) |
36 (0.073) |
40 (0.033) |
3 0.030 |
39 (0.079) |
| Captan | 118 | 12 | 7 | ||
| Carbendazim | 27 | 12 | 10 | 6 | |
| Chlorpyrifos | 8 | 2 | 3 | ||
| Chlorpyrifos -methyl | 13 | 5 | 2 | 1 | |
| Cypermethrin | 6 | 5 | 1 | 0 | |
| Deltamethrin | 1 | 1 | 4 | 2 | |
| Difenoconazole | 42 (0.041) |
19 (0.108) |
1 (0.017) |
49 (0.064) |
62 (0.070) |
| Fenoxycarb | 5 | 2 | |||
| Fenpyroximate | 12 | 0 | 0 | 0 | |
| Flonicamid | 29 | 1 | |||
| Fluopyram | 88 (0.039) |
44 0.085) |
54 (0.048) |
34 (0.086) |
39 (0.049) |
| Fluxapyroxad | 26 | 22 | |||
| Imidacloprid | 1 | 16 | 9 | 2 | |
| Indoxaxcarb | 61 (0.021) |
6 0.049) |
16 (0.023) |
13 0.048) |
|
| Lambda cyhalothrin | 21 | 16 | 39 | 4 | |
| Methoxyfenozid | 83 | 30 | |||
| Penconazol | 3 | 37 | 6 | 23 | |
| Thiacloprid | 54 | 6 | 19 | ||
NA: not applicable; 1: the average residues given in brackets were calculated with the reported LOQ values.
Table 17.
Hazard indices calculated based on the selected residues.
| Cases | HI1 | ||||
|---|---|---|---|---|---|
| Apples | Grapes | Peaches | Strawberries | HI | |
| 1 | 0.70 | 0.167 | 0.87 | ||
| 2 | 0.56 | 0.279 | 0.84 | ||
| 3 | 0.54 | 0.144 | 0.69 | ||
| 4 | 0.40 | 0.184 | 0.59 | ||
| 5 | 0.25 | 0.318 | 0.57 | ||
| 6 | 0.49 | 0.49 | |||
| 7 | 0.35 | 0.184 | 0.53 | ||
| 8 | 0.07 | 0.125 | 0.20 | ||
| 9 | 0.00 | 0.072 | 0.07 | ||
| 10 | 0.43 | 0.43 | |||
| 11 | 0.04 | 0.411 | 0.45 | ||
| 12 | 0.12 | 0.022 | 0.14 | ||
1: cumulative effect of the 4 selected residues that were present in the consumed food items.
Table 18.
Selection of pesticide residues for calculation of HQ and HI values.
| Sample code | 882095 | ||||
| ΣRr | 0.31 | HI | |||
| NRr | 6 | 5.33625 | |||
| S(R/ARfD) | NRal | 11 | |||
| Active substances | ARfD | Σ(R/ARfD) | 8.45 | ESTI | HQ |
| **** | |||||
| **** | |||||
| **** | |||||
| Difenoconazole | 0.16 | ||||
| Dimethomorph (sum of isomers) | 0.6 | ||||
| Famoxadone | 0.1 | ||||
| Fenpyrazamine | 0.3 | ||||
| **** | |||||
| Indoxacarb | 0.005 | 4.4 | 0.022 | 0.002849 | 0.035617 |
| Lambda-cyhalothrin | 0.005 | 1.8 | 0.009 | 0.001166 | 0.233128 |
| Methoxyfenozide | 0.1 | 1.9 | 0.19 | 0.024608 | 4.921586 |
| Penconazole | 0.5 | 0.053 | 0.006864 | 0.068643 | |
| **** | |||||
| Spirotetramat (sum) | 1.0 | 0.011 | 0.011 | 0.001425 | 0.047489 |
| Spiroxamine (sum of isomers) | 0.1 | 0.23 | 0.023 | 0.002979 | 0.029789 |
Notes: ΣR: sum of residue concentrations, NRi: number of residues with ARfD values, NRall: number of residues detected in the sample.
Table 19.
Examples for the calculated highest cumulative acute exposure for age groups.
| Apples, 1-2 yrs | |||||
|---|---|---|---|---|---|
| Sample code | 713531 | 764209 | 871718 | 100208 | 701284 |
| NRall | 8 | 5 | 8 | 8 | 3 |
| NRr | 8 | 5 | 8 | 8 | 3 |
| Rmax | 0.9 | 0.81 | 0.61 | 0.15 | 0.35 |
| Σ(R/ARfD) | 6.28 | 8.3 | 11.28 | 12.5 | 14.1 |
| HI | 0.51 | 0.67 | 0.74 | 1.1 | 1.14 |
| CritAS1 | Captan | Indoxa | Indoxa | Cyper | Thiab |
| CritAS2 | Captan | Aceta | |||
| Grapes, 2-3 years | |||||
| Sample code | 709244 | 706623 | 734019 | 747619 | 870823 |
| NRall | 3 | 12 | 7 | 8 | 8 |
| NRr | 8 | 9 | 2 | 2 | 3 |
| Rmax | 0.21 | 2.03 | 0.61 | 0.51 | 0.25 |
| Σ(R/ARfD) | 15.44 | 50.75 | 22.26 | 15.6 | 6.94 |
| HI | 2 | 6.57 | 1.65 | 2.05 | 0.93 |
| CritAS1 | Aceta | Cyper | Actea | Aceta | Aceta |
| CritAS2 | Indoxa | Delta | Pyrac | Pyrac | |
| Peaches, 2-3 years | |||||
| Sample code | 772309 | 880314 | 913511 | 914291 | 952444 |
| NRall | 7 | 9 | 5 | 6 | 8 |
| NRr | 5 | 6 | 6 | 4 | 7 |
| Rmax | 0.236 | 0.23 | 0.11 | 0.245 | 0.43 |
| Σ(R/ARfD) | 5.49 | 4.22 | 7.86 | 20.74 | 19.64 |
| HI | 0.72 | 0.55 | 1.03 | 2.7 | 2.57 |
| CritAS1 | Lanbd | Lambda | Lambda | Lamda | Deltam |
| CritAS2 | Captan | Tebuco | Indoxa | Tebuco | Piridab |
| Strawberries, 2-3 years | |||||
| Sample code | 747732 | 743721 | 858610 | 814218 | 975290 |
| NRall | 6 | 4 | 9 | 11 | 7 |
| NRr | 5 | 9 | 5 | 6 | 5 |
| Rmax | 1.42 | 0.67 | 0.59 | 0.326 | 0.29 |
| Σ(R/ARfD) | 34.3 | 23.12 | 19.6 | 4.31 | 9.72 |
| HI | 2.74 | 1.85 | 1.64 | 0.35 | 0.77 |
| CritAS1 | Thebu | Thebu | Flonic | Pyraclo | Thiab |
| Crt AS2 | Iprod | Thebu | Pyraclo | ||
| Peppers, 2-3 yrs | |||||
| Sample code | 653512 | 733476 | 803030 | 961507 | 961620 |
| NRall | 5 | 9 | 11 | 7 | 8 |
| NRr | 4 | 5 | 9 | 4 | 7 |
| Rmax | 0.62 | 0.43 | 0.46 | 0.65 | 0.54 |
| Σ(R/ARfD) | 24.8 | 13.3 | 21.7 | 13.8 | 31.8 |
| HI | 8.13 | 4.06 | 7.1 | 4.5 | 10.44 |
| CritAS1 | Lambda | Flonic | Indoxac | Aceta | Indoxa |
| CritAS2 | Imidac | Flonicam | Aceta | ||
| Cherries, 1-2 years | |||||
| Sample code | 682237 | 679422 | 750295 | 973694 | 679512 |
| NRall | 3 | 8 | 3 | 6 | 4.00 |
| NRr | 3 | 6 | 3 | 6 | 4.00 |
| Rmax | 0.06 | 0.505 | 0.14 | 0.35 | 0.25 |
| Σ(R/ARfD) | 8.96 | 4.5 | 9.40 | 10.30 | 5.20 |
| HI | 0.14 | 0.14 | 0.14 | 0.16 | 0.08 |
| CritAS1 | Carbend | Pirimicarb | Carbe | Lambda | Tebuco |
| CritAS2 | Thioph | Tebucon | Aceta | ||
Abbreviation of residues with ARfD values in brackets: Aceta: acetamiprid (0.025), Captan (0.3); Carbend: carbendazim (0.02); Cyper: cypermethrin (0.005); Delta: Deltamethrin (0.01); Flonic: flonicamid (0.025); Indoxa: indoxacarb (0.005); Imida: imidacloprid (0.08); Ipro: iprodione (0.06); Lambda: lambda-cyhalothrin (0.005), Pyrac: pyraclostrobin (0.03); Pyrida: pyridaben (0.05);Tebuco: tebuconazole (0.03) Thiac: thiacloprid (0.02); Thioph: thiophanate-methyl (0.02).
Disclaimer/Publisher’s Note: The statements, opinions and data contained in all publications are solely those of the individual author(s) and contributor(s) and not of MDPI and/or the editor(s). MDPI and/or the editor(s) disclaim responsibility for any injury to people or property resulting from any ideas, methods, instructions or products referred to in the content. |
© 2023 by the authors. Licensee MDPI, Basel, Switzerland. This article is an open access article distributed under the terms and conditions of the Creative Commons Attribution (CC BY) license (http://creativecommons.org/licenses/by/4.0/).
Copyright: This open access article is published under a Creative Commons CC BY 4.0 license, which permit the free download, distribution, and reuse, provided that the author and preprint are cited in any reuse.


