Submitted:
04 November 2024
Posted:
05 November 2024
You are already at the latest version
Abstract
The paper presents a study on optimizing leather defect detection using the YOLOv11 model. Traditional leather processing has faced challenges in quality control, where human inspection accuracy ranges between 70% to 85%, affecting leather utilization rates and resulting in significant material waste. This research introduces an automated solution to improve defect classification and detection accuracy. The study focuses on defects commonly found in leather, such as insect larvae damage and removal cuts, using a specialized light chamber to control environmental variables. By analyzing both grain and flesh sides of the leather, the researchers demonstrated a significant increase in defect detection accuracy, with the flesh side achieving a higher classification rate. YOLOv11's dual-side analysis allowed for clearer identification of subtle defects, leading to a more efficient classification process. The results suggest that integrating advanced AI models like YOLOv11 with controlled digitization environments could drastically reduce human error and improve leather utilization, providing a scalable solution for the leather industry.
Keywords:
finished leather
; YOLO
; classification
; detection
; deep learning
; computer vision
1. Introduction
The traditional processing and use of leather date back to around 7000 BCE. However, with the invention of chrome tanning in the early 19th century, leather production began to industrialize, marking the start of modern leather manufacturing. According to research by IMARC Group, the global leather industry market size was valued at $390,9 billion in 2023, with an estimated compound annual growth rate (CAGR) of 4,8% from 2024 to 2032 [1]. Despite adopting alternatives like synthetic and vegan leather, genuine animal leather remains widely utilized, with its market estimated at approximately $100 billion in 2023, and an expected growth rate of around 4% per year [2]. Animal hides in use are cow (67%), sheep (12%), pig (11%), goat (10%), and other (0,5%) [3]. Finished leather goods find extensive applications across various industries, including fashion, automotive, furniture, and footwear.
For manufacturers of finished leather hides and products, leather utilization poses significant challenges from business, environmental, and social perspectives. Increasing the utilization of finished leather hides before the cutting process can lead to cost savings, reduced leather waste, decreased inventory requirements, and a lower demand for animal hides. According to the Food and Agriculture Organization of the United Nations (FAO), this high consumption of genuine leather contributes to the death of about 1 billion animals annually worldwide [4].
Leather utilization rates for finished leather vary based on the type of animal hide used and the specific industry or product. This paper focuses on optimizing defect detection, classification, and segmentation of finished cowhide leather in the automotive industry, which is 17% of the global market for genuine leather products. For the innovative project “Improving the utilization of industrially processed animal leather through the application of artificial intelligence, No.: 00136377/00127312/2023/26” we researched automotive interior suppliers operating in Serbia. In total, 12 international companies that supply industrial leather have been surveyed: YanFeng (3), Adient (2), Magna (2), Grammer (1), AutoStop Interiors (2), SMP (1), and Passubio SPA (1).
Key findings relevant to this study indicate that the accuracy rate of quality inspection operators for finished leather hides ranges between 70% and 85%, directly affecting the leather utilization rate, which varies from 50% to 85%. Scrap rates following the cutting process range from 1,5% to 10%, while customer complaints are between 0,5% and 3%. Customer complaints and scrap rates further reduce utilization by an additional 6-10% due to losses in optimization of post-processing leather hides or recalculations in automatic pattern nesting for leather. The total number of finished leather hides cut daily by these companies ranges between 120 and 350. The average weight of a leather hide is around 25 kg, and the average purchase price is approximately 35 EUR per hide. Considering all these factors, the result is concerning: each surveyed companies produces approximately 3400 kg of leather waste daily, amounting to a loss of around 4700 EUR per day. The cause of such poor process performance is the human factor and the inability to conduct consistent inspection of industrial leather.
Encouragingly, during an extensive literature review, we found over 100 scientific papers published in journals and conference proceedings on the topic of defect detection and classification in industrial leather using automated control. The methods applied for defect detection and classification on finished leather include the following [5]:
- Traditional image processing methods achieved an accuracy range of 70% to 85%,
- Machine Learning-Based Methods reported accuracies ranging from 80% to 90%,
- Deep learning approaches demonstrated higher accuracy levels, often exceeding 90%.
Deep learning techniques, particularly those based on You Only Look Once (YOLO) models, were identified as the most effective for leather defect inspection and classification among the methods analyzed. YOLO models not only provided higher accuracy rates but also improved processing efficiency compared to traditional methods. YOLOv2 and similar architectures have been noted for their real-time processing capabilities and high detection and classification rates, achieving accuracies of around 92% to 95% in some studies [5]. To the best of our knowledge, the versions of YOLO models applied to defect detection and classification range from v1 to v9 [5,6,7]. In this study, we will employ the YOLOv11 model, which was released on September 30, 2024, and currently represents the state-of-the-art in YOLO models, for defect detection and classification in industrial leather.
The primary contribution of this paper will be the application of the YOLOv11 model to the flesh side of leather to improve defect classification on the grain side, within a specially designed, controlled, closed environment. The model will be applied to defects resulting from damage caused by insect larvae and damage due to the removal of the hide from the animal, which are barely or almost not visible on the surface of finished leather.
2. Theoretical Background
2.1. Literature Review
In a comprehensive review conducted by Chen, Z. et al. [5], 90 scientific papers published over the last three decades, up to 2022, were analyzed. These studies primarily focused on addressing the challenges of defect detection and classification on the grain side of the leather using image processing and machine learning techniques. The defects addressed by these authors are: Tick Marks, Hot-Iron Marks, Scabies, Open and Closed Surface Cuts, Scars, Pinholes, Fungal Attack, Chrome Patch, Wrinkles, and Healing Wounds. As this research is centered on the application of deep learning methodologies, traditional image processing and machine learning approaches will not be considered in this literature review. Various models have been employed for detection and classification tasks on the grain side of the leather, including Mask R-CNN, U-Net, YOLOv2, AlexNet, SVM, CNN, ResNet50, GAN, and Salthisature models [5]. This work also provides insights into data volume, defect types, and the best-achieved accuracy. For defect detection and classification on the grain side of the leather, the authors utilized datasets ranging from 270 to 15000 samples across 1 to 9 different defect types, with accuracy rate ranging from 80% to 96%. Based on this literature review, it has been concluded that a dataset of 300 samples per defect will be sufficient to achieve meaningful results [5].
In the experimental study, Chen, Z. et al. [6] provide a detailed analysis of the performance and application of YOLO (v1-v8) models for defect detection and classification on leather surfaces. The authors consider YOLO a practical option for improving quality control processes in the leather industry. They highlight issues with certain types of defects where YOLO did not perform well, suggesting the potential to detect hard-to-see defects by examining the leather’s reverse side. The defects addressed by these authors are: Cavity, Pinhole, Scratch, Rotten Surface, Growth Line, Healing Wound, Crease, and Bacterial Wounds.
Deep learning has emerged as the most effective approach for solving defect detection and identification problems on the grain side of the leather, as confirmed by the findings of Tabernik, D. et al. [8].
Andrzej Wróbel and Piotr Szymczyk [9] reported achieving over 95% accuracy in defect detection using the YOLOv5 model, with the requirement of 1000 or more samples per defect. Similarly, Thangakumar, J., et al. [10] applied YOLOv8 for precise defect detection and segmentation on the front side of the wet blue leather, which falls outside the scope of this study, as it pertains to pre-finished leather. However, their findings indicate that the YOLOv8 model demonstrated high accuracy and reliability in defect detection and segmentation, using less time and fewer training samples. Based on previous experiences with YOLO models, Silva, V. [11] used YOLOv5 for detection and classification tasks on the grain side of the leather using a relatively small dataset of defective and non-defective leathers.
In contrast, Wang, M. et al. [7] utilized YOLOv9, positioning them as one of the few authors to explore the latest versions of YOLO. Their study compared the performance of Faster-RCNN, VFNet, Detr, and YOLO (v3, v5, v7) with YOLOv9, where YOLOv9 achieved superior speed and accuracy, reaching nearly 95% defect detection accuracy on the grain side of the leather. Defekti kojima su se ovi autori bavili su: Bubble, Dent, and Broken Glue.
Based on the analysis of the literature review, we determined that a dataset of 300 samples per defect will be adequate to achieve an initial accuracy higher than 90%, which is the goal of this research. Based on the extensive literature review we concluded that YOLO technology is highly suitable for defect detection and classification problems. Additionally, the literature review revealed that no previous studies have employed the reverse side of leather for defect detection and classification purposes. All studies reviewed by the authors were conducted in laboratory conditions without environmental control. We will design a dedicated environment that enables consistent and controlled conditions, suitable for industrial application. A literature review also led us to conclude that no author has yet addressed defects resulting from damage created by insect larvae or from the removal of the hide, most likely because they are barely or not at all visible on the leather surface. Even when visible, they are difficult to classify, as the two classes (grubs and suckout) manifest almost identically on the leather surface.
2.2. YOLO Model
This section provides a summary of the advancements in the YOLO model family over the past year (Table 1). The previous models, from YOLOv1 to YOLOv8, are presented and thoroughly analyzed in an experimental study conducted by Chen Z. et al. [6].
The YOLOv9 model, developed in February 2024, incorporates advanced architectures and optimization techniques to reduce data loss and improve model efficiency. A key advancement over YOLOv8 is the implementation of Programmable Gradient Information (PGI) (Table 2) and the Generalized Efficient Layer Aggregation Network (GELAN). PGI mitigates information loss by preserving gradient information across network layers, while GELAN facilitates feature extraction at all scales, simplifying computation. Together, these techniques yield improvements over the YOLOv8 model: a 49% reduction in training parameters and a 43% decrease in computational load, making this model suitable for high-performance tasks and resource-constrained devices [12]. In the literature, we have encountered applications of YOLOv9 across various industries. Yang et al. [13] applied YOLOv9 in the case of a target-matching method for visible and infrared images at sea based on decision-level topological relations. Huang, X. et al. [14] used an improved YOLOv9-OREPA model in their study on underwater crack detection. Rizzieri, N. et al. [15] employed YOLOv8 and YOLOv9 for detecting Diabetic Retinopathy (DR), a severe eye disease secondary to diabetes. Wang, X. et al. [16] utilized the YOLOv9 model for coffee detection and segmentation in the agriculture sector. Bustamante, A. et al. [17] used YOLOv9 for accurate posture detection of elderly people, aiming to improve monitoring and provide timely alerts in homes and elderly care facilities. Mi, Z., & Yan, W. Q. [18] combined YOLOv9 and Swin Transformer to develop a complex model for detecting strawberry ripeness. Li, J., Feng [19] applied YOLOv9 to handle various adverse weather conditions. Wan, L. et al. [20] used YOLOv9 for mobile inspections conducted by intelligent tunnel robots, which are instrumental in broadening inspection reach, economizing on inspection expenditures, and augmenting the operational efficiency of inspections. Xu, W. et al. [21] applied YOLOv9 for violence detection. Although the YOLOv9 model was released at the beginning of 2024, numerous scientific papers already demonstrated its diverse applications in object detection, achieving excellent results in detection, classification, and segmentation.
The YOLOv10 model, developed in May 2024, introduces efficiency-focused advancements by eliminating the NMS algorithm during inference. Utilizing consistent dual assignments (Table 2), the model applies two approaches for object label assignment: one that generates multiple predictions per object during training and another that selects the best prediction for each object, thereby increasing inference speed. Additionally, YOLOv10 employs an enhanced backbone for feature extraction (CSPNet) and, unlike previous versions, it does not use predefined anchors, making it simpler and faster. It also incorporates elements of the self-attention mechanism, helping it focus on the important parts of the image. These improvements enhance the model’s accuracy and efficiency, making YOLOv10 an excellent choice for applications requiring fast response and high precision [22].
Although the YOLOv10 model was only released in mid-2024, published studies on its applications are already available. Hussain, M., & Khanam, R. [23] focused on improving quality inspection within the photovoltaic (PV) domain using YOLOv10. Tan, L. et al. [24] used YOLOv10 for a novel self-checkout system for retail, enhancing checkout efficiency and reducing labor costs. Qiu, X. et al. [25] employed YOLOv10 for a lightweight drone target detection algorithm. Liu, W. et al. [26] used YOLOv10 for tomato recognition and for a rapid sorting system. Zhang, C. et al. [27] developed a novel YOLOv10-DECA model for real-time detection of concrete cracks.
The YOLOv11 model, developed in September 2024, brings new enhancements in speed and accuracy, with an improved backbone and feature extraction architecture. The model uses optimized data processing methods and faster training, with a reduced number of parameters compared to YOLOv8 (<22%), making it more efficient. Additionally, it supports various tasks such as object detection, segmentation, pose estimation, and classification, making this model a versatile choice for applications that require high accuracy in real-time on devices with limited capabilities [28]. The YOLOv11 model was only recently launched, so we cannot refer to any relevant model applications.
3. Methodology
3.1. Environmental Set-Up
For the research, we created a dedicated small-scale environment in the form of a light chamber, which would be suitable for industrial conditions. This environment for digitizing industrial leather cuts is fully enclosed to control lighting and industrial dust—factors that can significantly impact the research. Lighting is essential for achieving adequate photographs for computer vision applications, while industrial dust on the leather poses a problem by concealing tiny perforation defects.
To control the environment, we constructed a digitization chamber with dimensions of 1000mm x 1000mm x 1000mm. The chamber walls are made of Forex material, and the interior is matte white. The chamber includes a pull-out drawer where the leather cut is placed in the designated digitization area. The digitization zone measures 800mm x 800mm. To manage the technical solution, we developed an operational software system. The surface on which we digitize the leather is burgundy, providing contrast that is beneficial for AI models.
The lighting is LED type, 2100 LUX, with a color temperature of 4000K, positioned at a 45-degree angle. The industrial camera used for digitizing leather cut parts is The Imaging Source DFK 38UX541 1.1”, 20.3 Megapixels, 18 fps, with a Global Shutter and USB 3,1 output with a resolution of 4504 x 4504 pixels (1:1 aspect ratio)1. The lens used on the camera is a V1226-MPZ, 12 mm 1″ f/2,6—f/16 with a fixed focal length2.
To manage the solution, we developed operational software for lighting, camera control, and AI model applications. The software is controlled via a touch-screen monitor Zeus ZUS215MAX located on the front of the chamber. All equipment is connected via the NVIDIA Jetson Orin Nano Developer kit. The prototype developed for this research, which consists of custom-made hardware and software, is named Prototype P2-24 (Figure 1).
3.2. Data Collection and Model Training
The data annotation was carried out using the CVAT.ai software3 allowing easy data export in the desired format. The data consists of images of leather pieces, each with two images: front and back (Figure 2 and Figure 3). For each piece of leather, polygonal annotations of defects were made on both sides. As mentioned before, we focus on two defects (grubs and suckout) that are more clearly visible on the back side, in an attempt to improve the overall classification accuracy. These are defects to which no tolerance is applied according to the general standards of leather industry customers; they must be removed without exception. The total dataset consists of 1200 images, of which 600 (300 front, 300 back) is of class grubs and 600 (300 front, 300 back) of class suckout, with a total of 1327 annotations. The image resolution is 4504 × 4504. The dataset is split into training, validation and test sets, which creates: 840 images for training, 240 for validation and 120 for test.
We use two fine-tuned YOLOv11 models for detection, trained separately with data from the front and back side of the leather, respectively. Models are trained to recognize defects on both sides of each leather piece with corresponding annotations. The training was conducted on an NVIDIA RTX 4090 GPU, with optimized parameters for epochs, initial learning rate, and batch size, using rigid image augmentations to enhance the model’s robustness.
3.3. Metrics for Evaluation
We use a test set of 120 (60+60) images of leather pieces, with both front and back views provided for each piece. Each image is annotated with polygonal defect markings, allowing precise comparison of defect detection on each side. Across all images, there are a total of 64 grubs and 60 suckout defects annotated. After detecting defects on both sides of the leather, we defined a combined weighted scoring system that applies to the output classification. The experiment tests two approaches:
- Front-Only Classification: Based solely on the front side.
- Dual-Side Combined Classification: Combines results from both front and back sides.
The selection of scoring weights involves a degree of arbitrariness and is refined through trial and error. However, an informed approach can guide this process, and we have determined that a 0,3/0,7 weighting, favoring the backside, yields the most accurate results when considering these two classes.
CombinedScore = 0.7 * Conffront + 0.3 * Confback
4. Results
We applied the YOLO model on a dataset of 1200 defective samples from both sides of the leather, focusing on grubs and suckout defects, and the results are shown in Table 3. In the case of detection on the grain side, we achieved satisfactory accuracy of 85.8% for grubs and 87.1% for suckout. However, for defect detection on the flesh side, we achieved significantly better results, with 93.5% for grubs and 91.8% for suckout.
In terms of classification, we obtained relatively low results for grubs on the grain side at 66.8%, while suckout classification accuracy was 97.6%. For defect classification on the flesh side, we achieved outstanding results of 98.2% for grubs and 97.6% for suckout.
The results demonstrate a notable improvement in defect detection accuracy on the flesh side of the leather, with an overall accuracy increase from 0.85 to 0.93. F1-Score improved from 0.86 to 0.93, reflecting a more balanced and effective classification. Precision increased from 0.87 to 0.92, indicating fewer false positives on the flesh side, while recall rose from 0.84 to 0.94, showing a higher rate of correctly identified defects. This improvement across all three metrics suggests that the flesh side provides clearer defect signals, allowing for more accurate and reliable detection. In Figure 4, confusion matrices show the performance of the two detectors.
Furthermore, Figure 5 illustrates the distribution and relationship between class probability for the flesh side (blue) and the grain side (green). Scores are sorted in ascending order for both the front and flesh side to facilitate direct comparison. The difference between the two distributions is significant, indicating a clear separation in scores for the front and flesh sides. This separation may contribute to a more nuanced approach to defect detection, where certain defects are more reliably detected on the flesh side, as confirmed by higher confidence scores for the flesh side.
It is also important to note that the grain side shows much greater variability in classification confidence, reinforcing the hypothesis that weighted scoring could significantly enhance accuracy (Table 5). These results highlight differences in the detection scores for the defects grubs and suckout when comparing the flesh side and grain side of leather pieces. For both classes, the back-side scores are significantly higher than the grain-side scores, with an average difference of around 28.7% for grubs and 18.2% for suckout. This indicates that they are much more discernable on the flesh side compared to the front. The standard deviation on the flesh side is low, showing that flesh side scores are consistently high. In contrast, the front-side scores have a higher standard deviation, reflecting more variability and less consistent detection on the front.
5. Discussion
The results of this study demonstrate the effectiveness of using YOLOv11 for defect detection and classification on finished leather, especially when analyzing both the grain and flesh sides. The experiment confirms that defect detection on the flesh side yields higher accuracy and reliability for certain defects, such as grubs (larval damage) and suckout (cut damage). This outcome supports the hypothesis that examining the flesh side can reveal defects otherwise difficult to detect on the grain side, providing a promising approach for optimizing leather utilization.
Table 6 shows a comparison of the results we achieved with this case study with the results of other authors who also applied YOLO models for the case of defect detection and classification.
The specialized environmental setup, consisting of a light chamber equipped with a 20.3-megapixel industrial camera, played a crucial role in enhancing detection accuracy by minimizing variables like lighting inconsistencies and dust interference, which are common in industrial environments. This controlled setting proved essential for achieving consistent, reliable defect detection, indicating that adopting similar environments could be beneficial in industrial applications.
The two-class weighted scoring system introduced here also proved advantageous, particularly when detection on one side provided better visibility or detail than the other. By assigning greater weight to the flesh side for specific defect types, this scoring method capitalized on the flesh side’s improved accuracy, as shown by an average accuracy difference of 28.7% for grubs and 18.2% for suckout. This approach highlights the potential of side-specific detection, where each side of the leather can provide unique data, refining the classification process and potentially reducing waste through more precise grading.
The increased precision and recall scores on the flesh side underscore the model’s capability to reduce false positives and false negatives, two critical aspects of automated leather inspection. With precision increasing from 0.87 to 0.92 and recall from 0.84 to 0.94 on the flesh side, these improvements suggest that incorporating backside analysis can significantly reduce inspection errors. Such accuracy has substantial implications for real-world applications, potentially allowing manufacturers to meet stricter quality standards and minimize waste due to misclassification or overlooked defects.
The low detection and classification results on the grain side for grubs and suckout defects are attributed to the limited or impossible surface visibility of these defects during inspection, which subsequently affects processes such as lamination and sewing. Additionally, the low classification results are due to the nearly identical surface appearance of both defects. The only reliable classification occurs when suckout presents as a line resembling a scar. Conversely, these two defects are clearly distinguishable on the flesh side, as illustrated in Figure 2 and Figure 3. Grubs defects are circular or elliptical, often occurring in clusters. The larvae create a uniform erosion within the leather, leaving a distinct and visible shape. Suckout, on the other hand, appears as a tear or separation on the flesh side, typically split into two parts. For this reason, the application of YOLOv11 achieved relatively lower results on the grain side for grubs and suckout defects compared to other studies using YOLO models for different defect classes. However, by applying YOLOv11 to the flesh side, we achieved higher results than previously reported in the literature.
It is essential to recognize that not all defect types may benefit from dual-side analysis. Certain surface characteristics unique to the grain side may not manifest clearly on the flesh side, warranting further research to assess the applicability of this approach across all defect types. Thus, while dual-side analysis shows promise, expanding the classification system to accommodate a wider range of leather defect profiles could enhance its robustness.
The promising results achieved with YOLOv11 confirm its suitability for industrial defect detection, where both accuracy and speed are crucial. Recent advances in deep learning and computer vision, as exemplified by YOLOv11, offer a pathway to streamline leather inspection processes, reduce human error, and improve leather utilization. Future studies could expand the range of detectable defects, validate this approach across larger datasets, and adapt the methodology to other stages of leather processing. Practical considerations for industrial applications should also be taken into account, as both sides of the leather would need to be digitized, possibly simultaneously, to avoid errors. A potential solution could involve using a transparent surface for dual-side digitization, although this would require entirely new studies focused on the development of appropriate hardware and environments for digitization.
6. Conclusions
This work is the result of an experimental study within a scientific innovation project. For the purposes of the experiment, dedicated hardware was developed, and the latest technology of the YOLO model series (YOLOv11) was used for defect recognition and localization on the grain and flesh side of industrial leather. Experimental validation confirmed that the application of YOLO on the flesh side of industrial leather led to improved detection and classification of defects whose damage is more evident on the flesh side of industrial leather. For the experiment, we used the grubs defect, which is caused by damage inflicted by larvae on the flesh side of industrial leather, and suckout, which results from cuts during the separation of the hide from the animal’s body. The data used for training and validating the experiment were more than sufficient to achieve appropriate accuracy in detection and classification.
In this study, we presented a unique novelty contribution that, to the best of our knowledge, has not been previously documented in the literature:
- We utilized a controlled, fully enclosed environment with identical digitization conditions for each defect, thus making a significant contribution toward implementing a technical solution for automatic defect inspection on leather in an industrial setting.
- We applied computer vision models to detect, classify, and segment defects on the flesh side of industrial leather.
- We investigated defects in the industry, known internally as grubs (larval damage) and suckout (cut damage), which, to the best of our knowledge, have not been studied by any previous authors.
The limitation of this study lies in its inapplicability to other types of defects that occur on industrial leather, particularly because certain defects on the grain side of industrial leather do not manifest on the flesh side or are barely visible. A separate experimental study would need to be conducted for each defect individually to determine the effectiveness of the comprehensive application of the YOLOv11 model in addressing the challenges of automating the industrial leather inspection process.
It has been demonstrated that YOLOv11 is highly successful in detecting and classifying defects, even for those that are difficult to classify due to their similar manifestations on the surface. By applying a controlled environment in the form of a digitization chamber and using the YOLO model on data obtained in controlled conditions, we have shown that it is possible to implement computer vision in industrial settings, creating the potential to overcome manual labor and reduce leather waste by optimizing utilization in the pre-cutting process of finished leather hides. The ability to accurately classify defects in an industrial environment contributes to the possibility of assessing tolerance and meeting different customer standards, which can significantly enhance utilization optimization.
Acknowledgements
This research was conducted as part of the innovation grant “Improving the Utilization of Industrially Processed Animal Leather through the Application of Artificial Intelligence,” Ref. No.: 00136377/00127312/2023/26, within The project “EU for Green Agenda in Serbia”, with the technical and financial support of the European Union and in partnership with the Ministry of Environmental Protection, is implemented by UNDP in cooperation with the Embassy of Sweden and the European Investment Bank (EIB), with additional funding from the Governments of Sweden, Switzerland and Serbia.
| 1 | |
| 2 | Available online: https://www.rmaelectronics.com/computar-v1226-mpz/) |
| 3 | Available online: https://www.cvat.ai/
|
References
- Grand View Research. Available online: https://www.grandviewresearch.com/industry-analysis/leather-goods-market (accessed on 25 October 2024).
- Cognitive Market Research. Available online: https://www.cognitivemarketresearch.com/genuine-leather-market-report (accessed on 25 October 2024).
- Mascianà, P. World statistical compendium for raw hides and skins, leather and leather footwear. Intergovernmental group on meat and dairy products sub-group on hides and skins. Food and Agricultural Organization of the United Nations, Rome, 2015.
- Food and Agriculture Organization of the United Nations—FAOSTAT Database. Available online: https://www.fao.org/faostat/en/#data/QCL (accessed on 26 October 2024).
- Chen, Z.; Jiehang, D.; Zhu, Q.; Wang, H.; Chen, Y. A systematic review of machine-vision-based leather surface defect inspection. Electronics 2022, 11, 2383. [Google Scholar] [CrossRef]
- Chen, Z.; Zhu, Q.; Zhou, X.; Deng, J.; Song, W. Experimental Study on YOLO-Based Leather Surface Defect Detection. IEEE Access 2024, 12, 32830–32848. [Google Scholar] [CrossRef]
- Wang, M.; Xie, X.; Qiu, H.; Li, J. GEI-YOLOv9-based leather defect detection algorithm research. Fourth International Conference on Image Processing and Intelligent Control 2024, 13250, 571–576. [Google Scholar]
- Tabernik, D.; Šela, S.; Skvarč, J.; Skočaj, D. Segmentation-based deep-learning approach for surface-defect detection. Journal of Intelligent Manufacturing 2020, 31, 759–776. [Google Scholar] [CrossRef]
- Wróbel, A.; Szymczyk, P. An Application of a Material Defect Detection System Using Artificial Intelligence. International Journal of Modern Manufacturing Technologies 2023, 15, 221–228. [Google Scholar] [CrossRef]
- Thangakumar, J. Revolutionizing leather quality assurance through deep learning powered precision in defect detection and segmentation by a comparative analysis of Mask RCNN and YOLO v8. In 2024 International Conference on Advances in Data Engineering and Intelligent Computing Systems (ADICS), Chennai, India, April, 2024.
- Silva, V.; Pinho, R.d.; Allahdad, M.K.; Silva, J.; Ferreira, M.J.; Magalhães, L. A Robust Real-time Leather Defect Segmentation Using YOLO. In 2023 18th Iberian Conference on Information Systems and Technologies (CISTI), Aveiro, Portugal, June, 2023.
- Wang, C.Y.; Yeh, I.H.; Liao, H.Y.M. Yolov9: Learning what you want to learn using programmable gradient information. 2024. [Google Scholar]
- Yang, S.; Cao, Z.; Liu, N.; Sun, Y.; Wang, Z. Maritime electro-optical image object matching based on improved YOLOv9. Electronics 2024, 13, 2774. [Google Scholar] [CrossRef]
- Huang, X.; Liang, C.; Li, X.; Kang, F. An Underwater Crack Detection System Combining New Underwater Image-Processing Technology and an Improved YOLOv9 Network. Sensors 2024, 24, 5981. [Google Scholar] [CrossRef] [PubMed]
- Rizzieri, N.; Dall’Asta, L.; Ozoliņš, M. Diabetic Retinopathy Features Segmentation without Coding Experience with Computer Vision Models YOLOv8 and YOLOv9. Vision 2024, 8, 48. [Google Scholar] [CrossRef] [PubMed]
- Wang, X.; Zhang, C.; Qiang, Z.; Liu, C.; Wei, X.; Cheng, F. A Coffee Plant Counting Method Based on Dual-Channel NMS and YOLOv9 Leveraging UAV Multispectral Imaging. Remote Sensing 2024, 16, 3810. [Google Scholar] [CrossRef]
- Bustamante, A.; Belmonte, L.M.; Morales, R.; Pereira, A.; Fernández-Caballero, A. Bridging the Appearance Domain Gap in Elderly Posture Recognition with YOLOv9. Applied Sciences 2024, 14, 9695. [Google Scholar] [CrossRef]
- Mi, Z.; Yan, W.Q. Strawberry Ripeness Detection Using Deep Learning Models. Big Data and Cognitive Computing 2024, 8, 92. [Google Scholar] [CrossRef]
- Li, J.; Feng, Y.; Shao, Y.; Liu, F. IDP-YOLOV9: Improvement of Object Detection Model in Severe Weather Scenarios from Drone Perspective. Applied Sciences 2024, 14, 5277. [Google Scholar] [CrossRef]
- Wan, L.; Li, Z.; Zhang, C.; Chen, G.; Zhao, P.; Wu, K. Algorithm Improvement for Mobile Event Detection with Intelligent Tunnel Robots. Big Data and Cognitive Computing 2024, 8, 147. [Google Scholar] [CrossRef]
- Xu, W.; Zhu, D.; Deng, R.; Yung, K.; Ip, A.W. Violence-YOLO: Enhanced GELAN Algorithm for Violence Detection. Applied Sciences 2024, 14, 6712. [Google Scholar] [CrossRef]
- Wang, A.; Chen, H.; Liu, L.; Chen, K.; Lin, Z.; Han, J.; Ding, G. Yolov10: Real-time end-to-end object detection, 2024.
- Hussain, M.; Khanam, R. In-Depth Review of YOLOv1 to YOLOv10 Variants for Enhanced Photovoltaic Defect Detection. Solar 2024, 4, 351–386. [Google Scholar] [CrossRef]
- Tan, L.; Liu, S.; Gao, J.; Liu, X.; Chu, L.; Jiang, H. Enhanced self-checkout system for retail based on improved YOLOv10. Journal of Imaging 2024, 10, 248. [Google Scholar] [CrossRef] [PubMed]
- Qiu, X.; Chen, Y.; Cai, W.; Niu, M.; Li, J. LD-YOLOv10: A Lightweight Target Detection Algorithm for Drone Scenarios Based on YOLOv10. Electronics 2024, 13, 3269. [Google Scholar] [CrossRef]
- Liu, W.; Wang, S.; Gao, X.; Yang, H. A Tomato Recognition and Rapid Sorting System Based on Improved YOLOv10. Machines 2024, 12, 689. [Google Scholar]
- Zhang, C.; Peng, N.; Yan, J.; Wang, L.; Chen, Y.; Zhou, Z.; Zhu, Y. A Novel YOLOv10-DECA Model for Real-Time Detection of Concrete Cracks. Buildings 2024, 14, 3230. [Google Scholar] [CrossRef]
- Ali, M.L.; Zhang, Z. The YOLO Framework: A Comprehensive Review of Evolution, Applications, and Benchmarks in Object Detection. Preprints 2024. accepted. [Google Scholar]
Figure 1.
Digitization environment named Prototype P2-24.
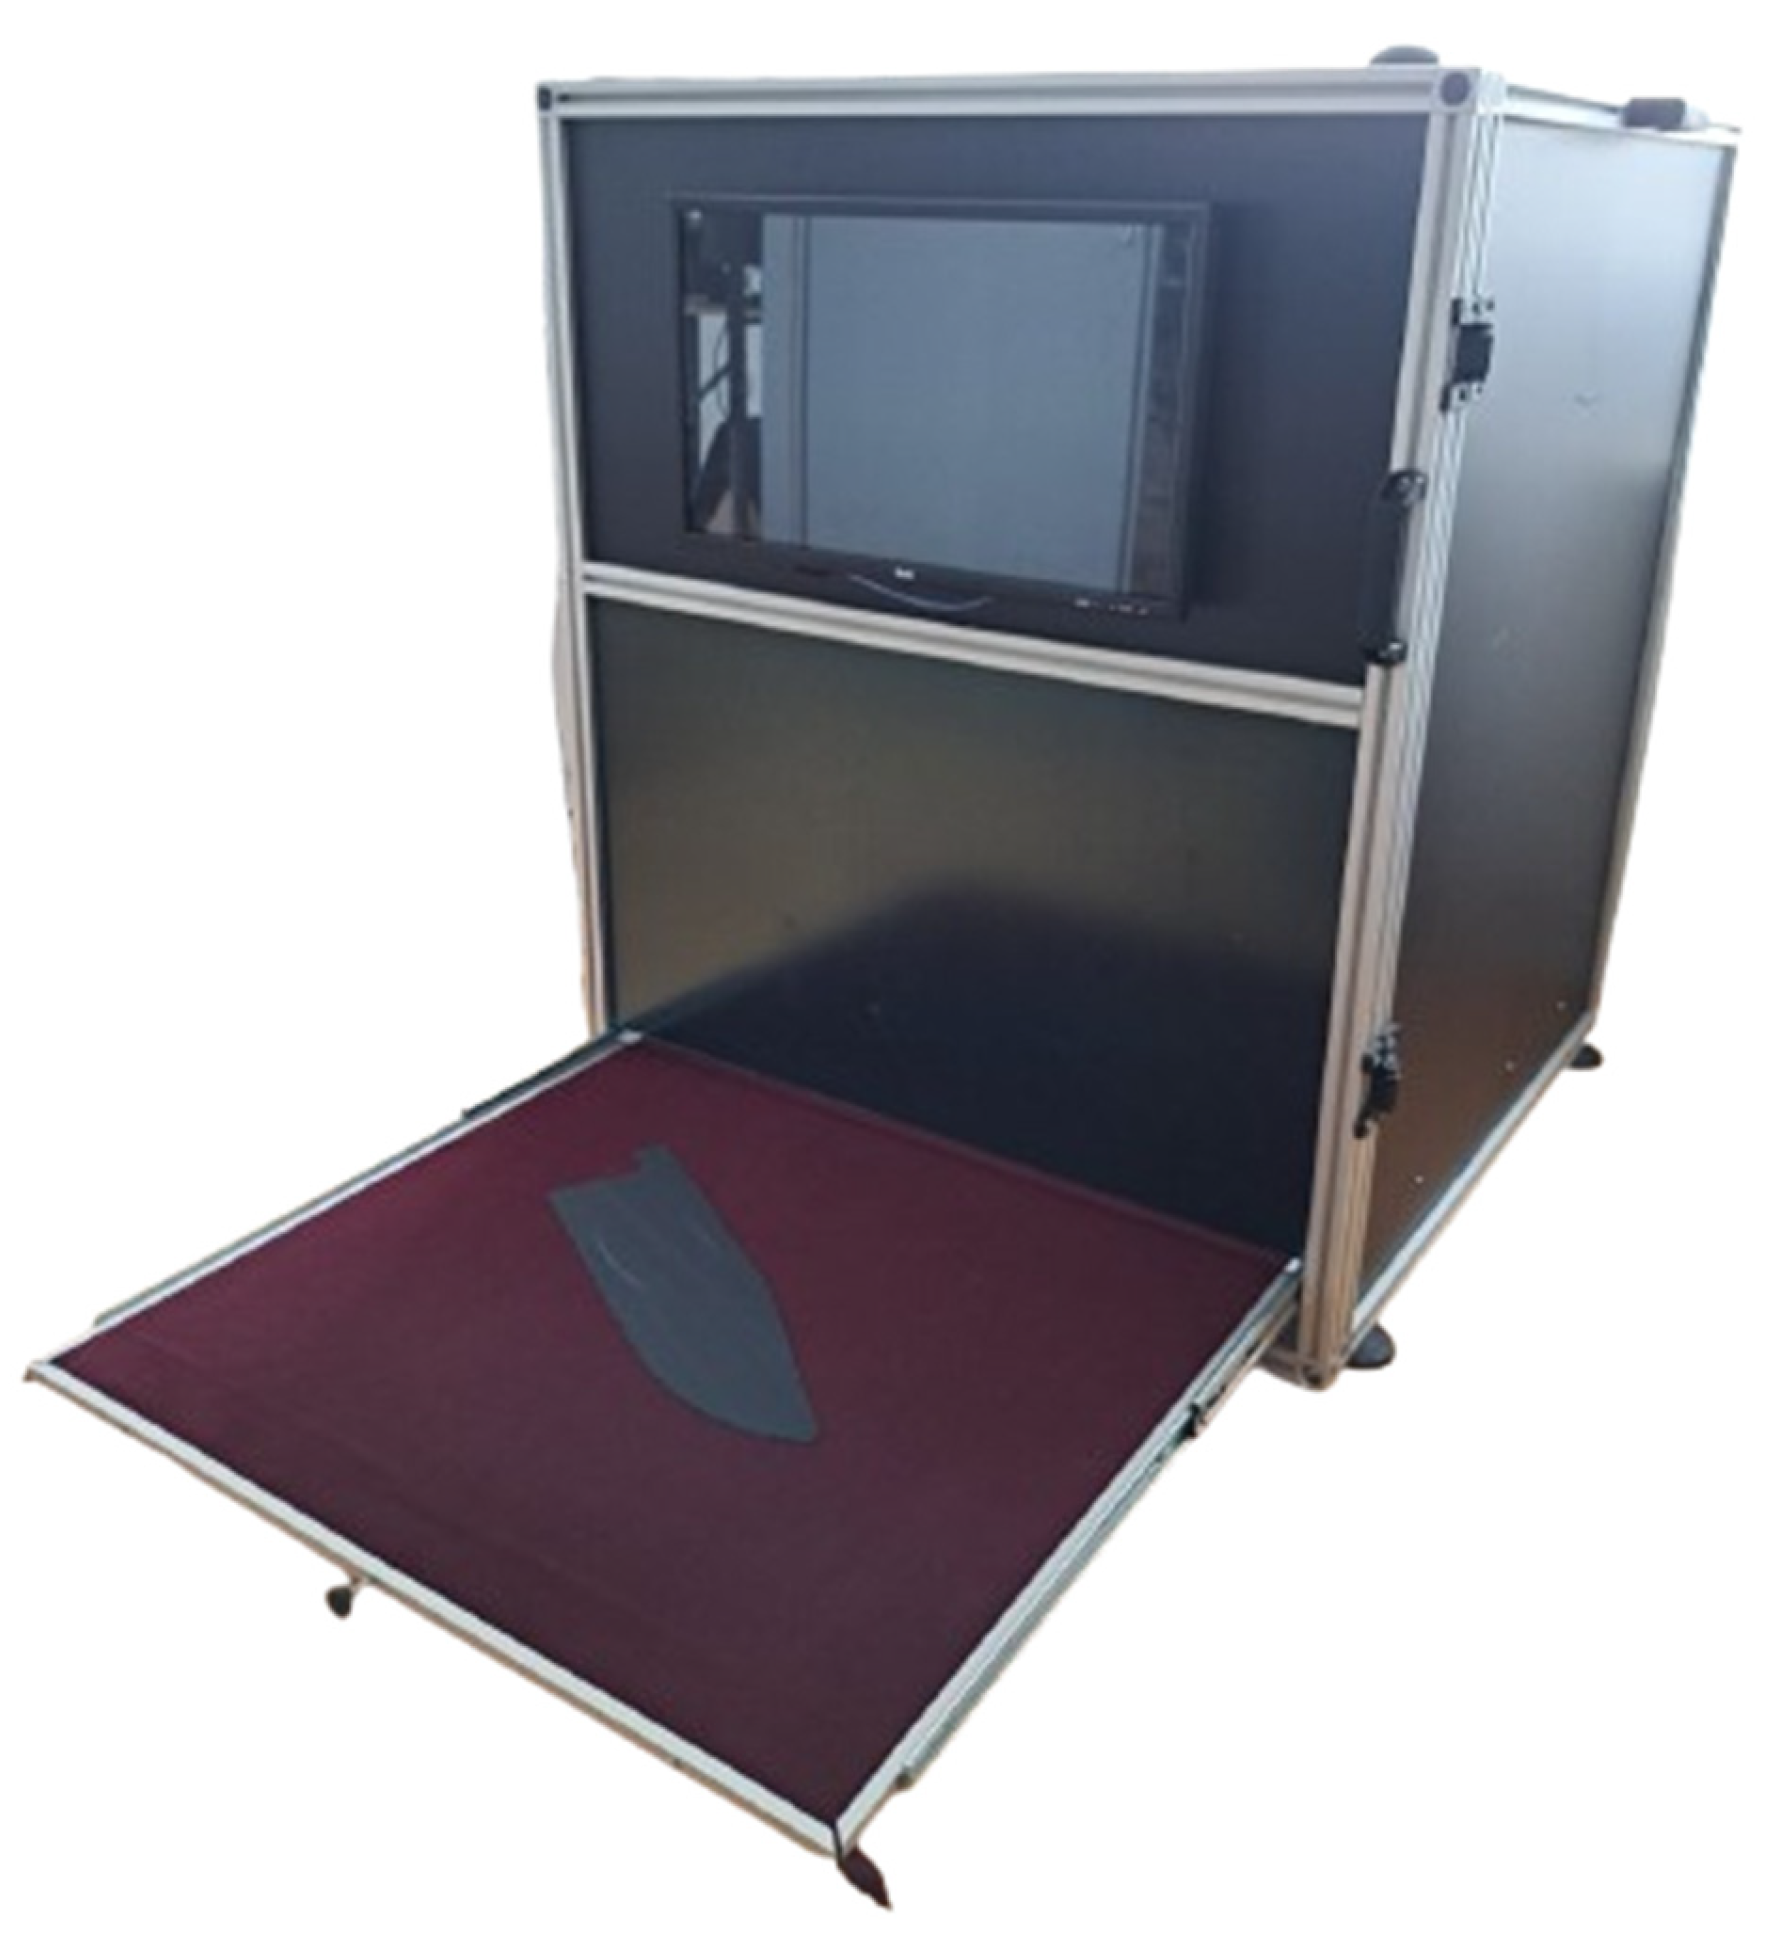
Figure 2.
Example of an enlarged annotated image of grain (left) and flesh (right) leather sides showing a defect named grubs (larval damage).
Figure 2.
Example of an enlarged annotated image of grain (left) and flesh (right) leather sides showing a defect named grubs (larval damage).
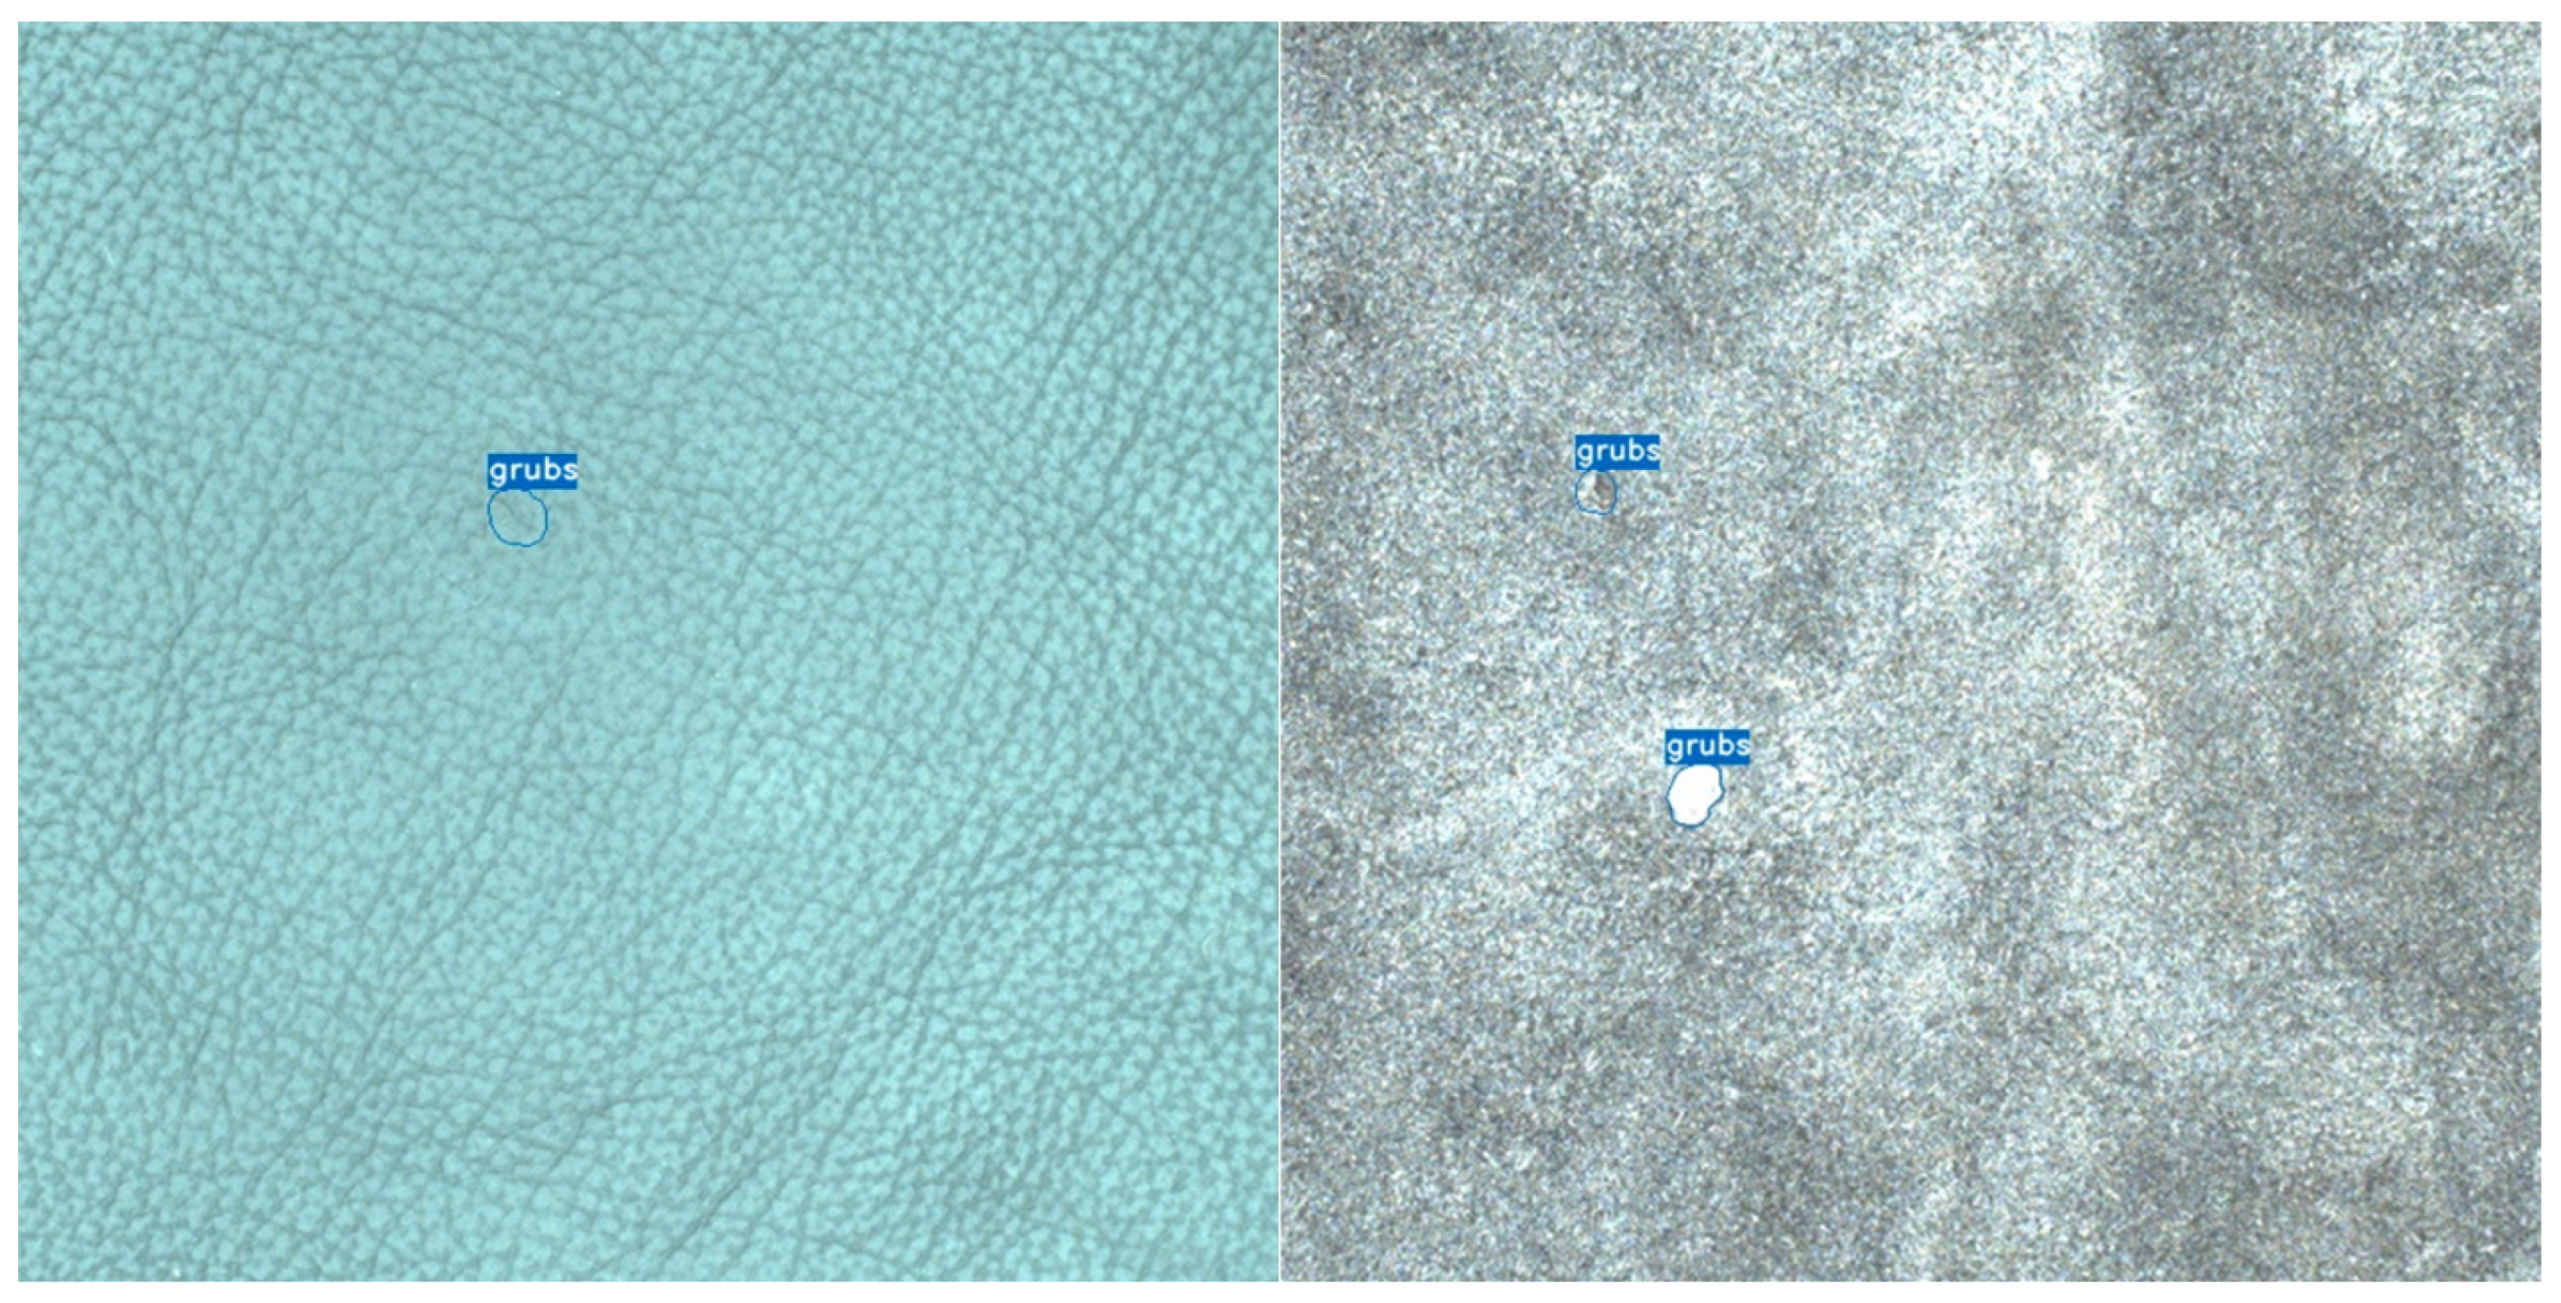
Figure 3.
Example of an enlarged annotated image of grain (left) and flesh (right) leather sides showing a defect named suckout (cut damage).
Figure 3.
Example of an enlarged annotated image of grain (left) and flesh (right) leather sides showing a defect named suckout (cut damage).
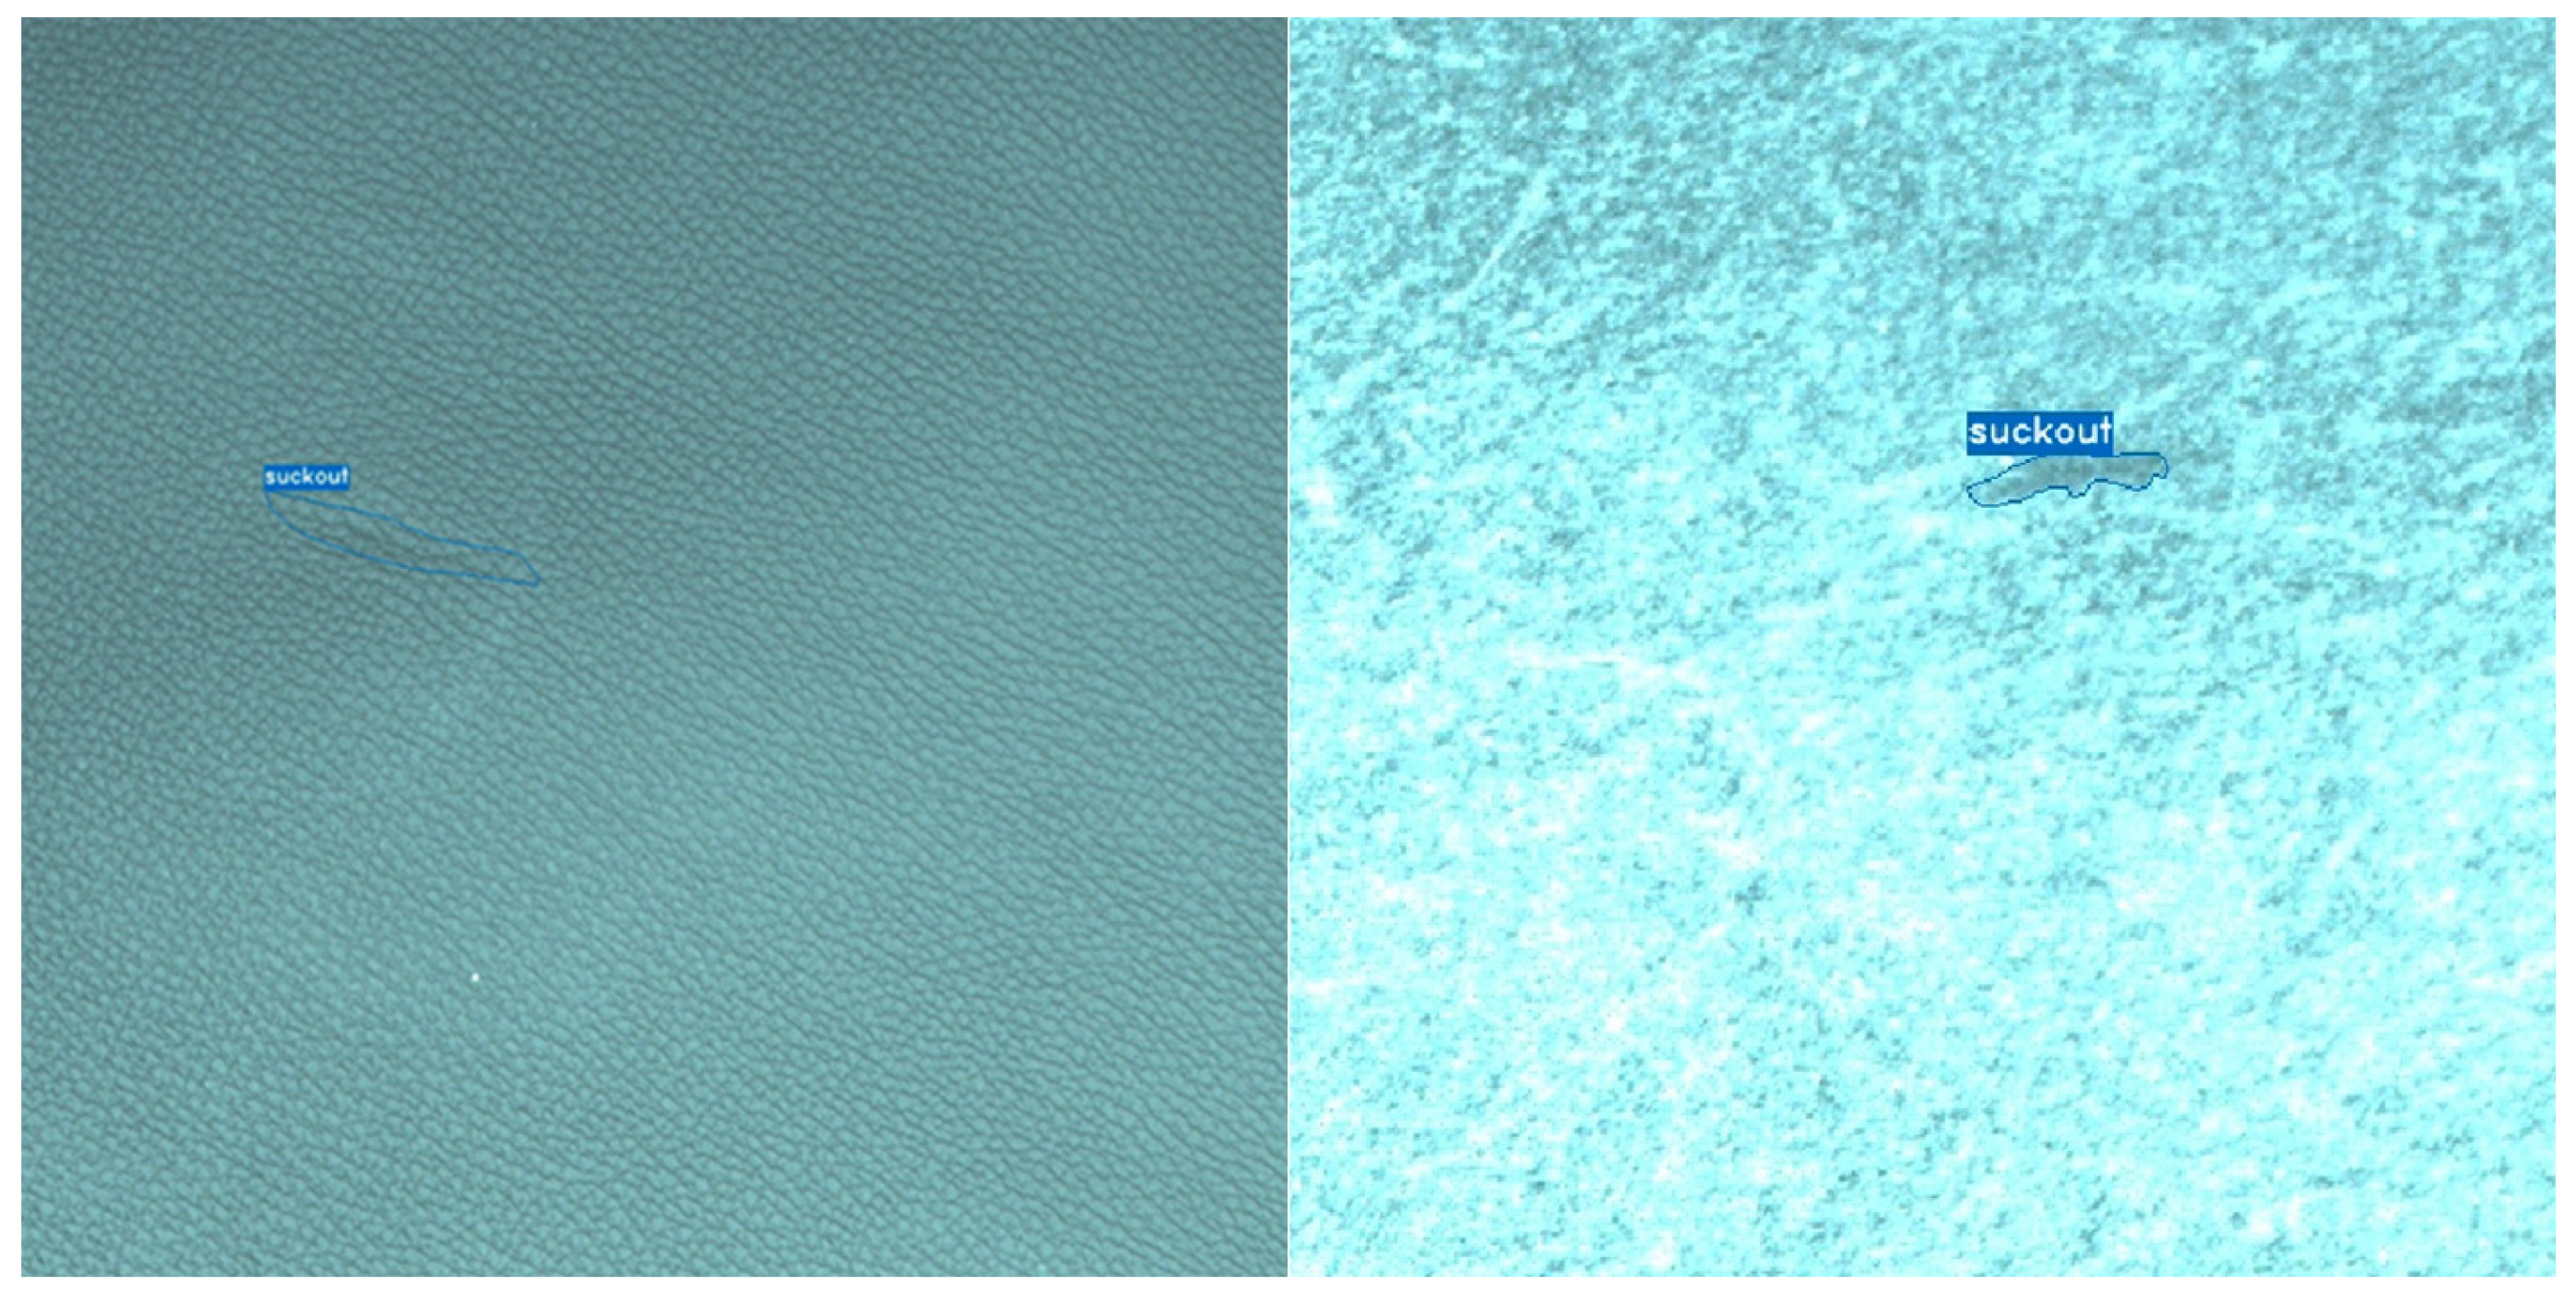
Figure 4.
Normalized confusion matrices for the grain (left) and flesh (right) side.
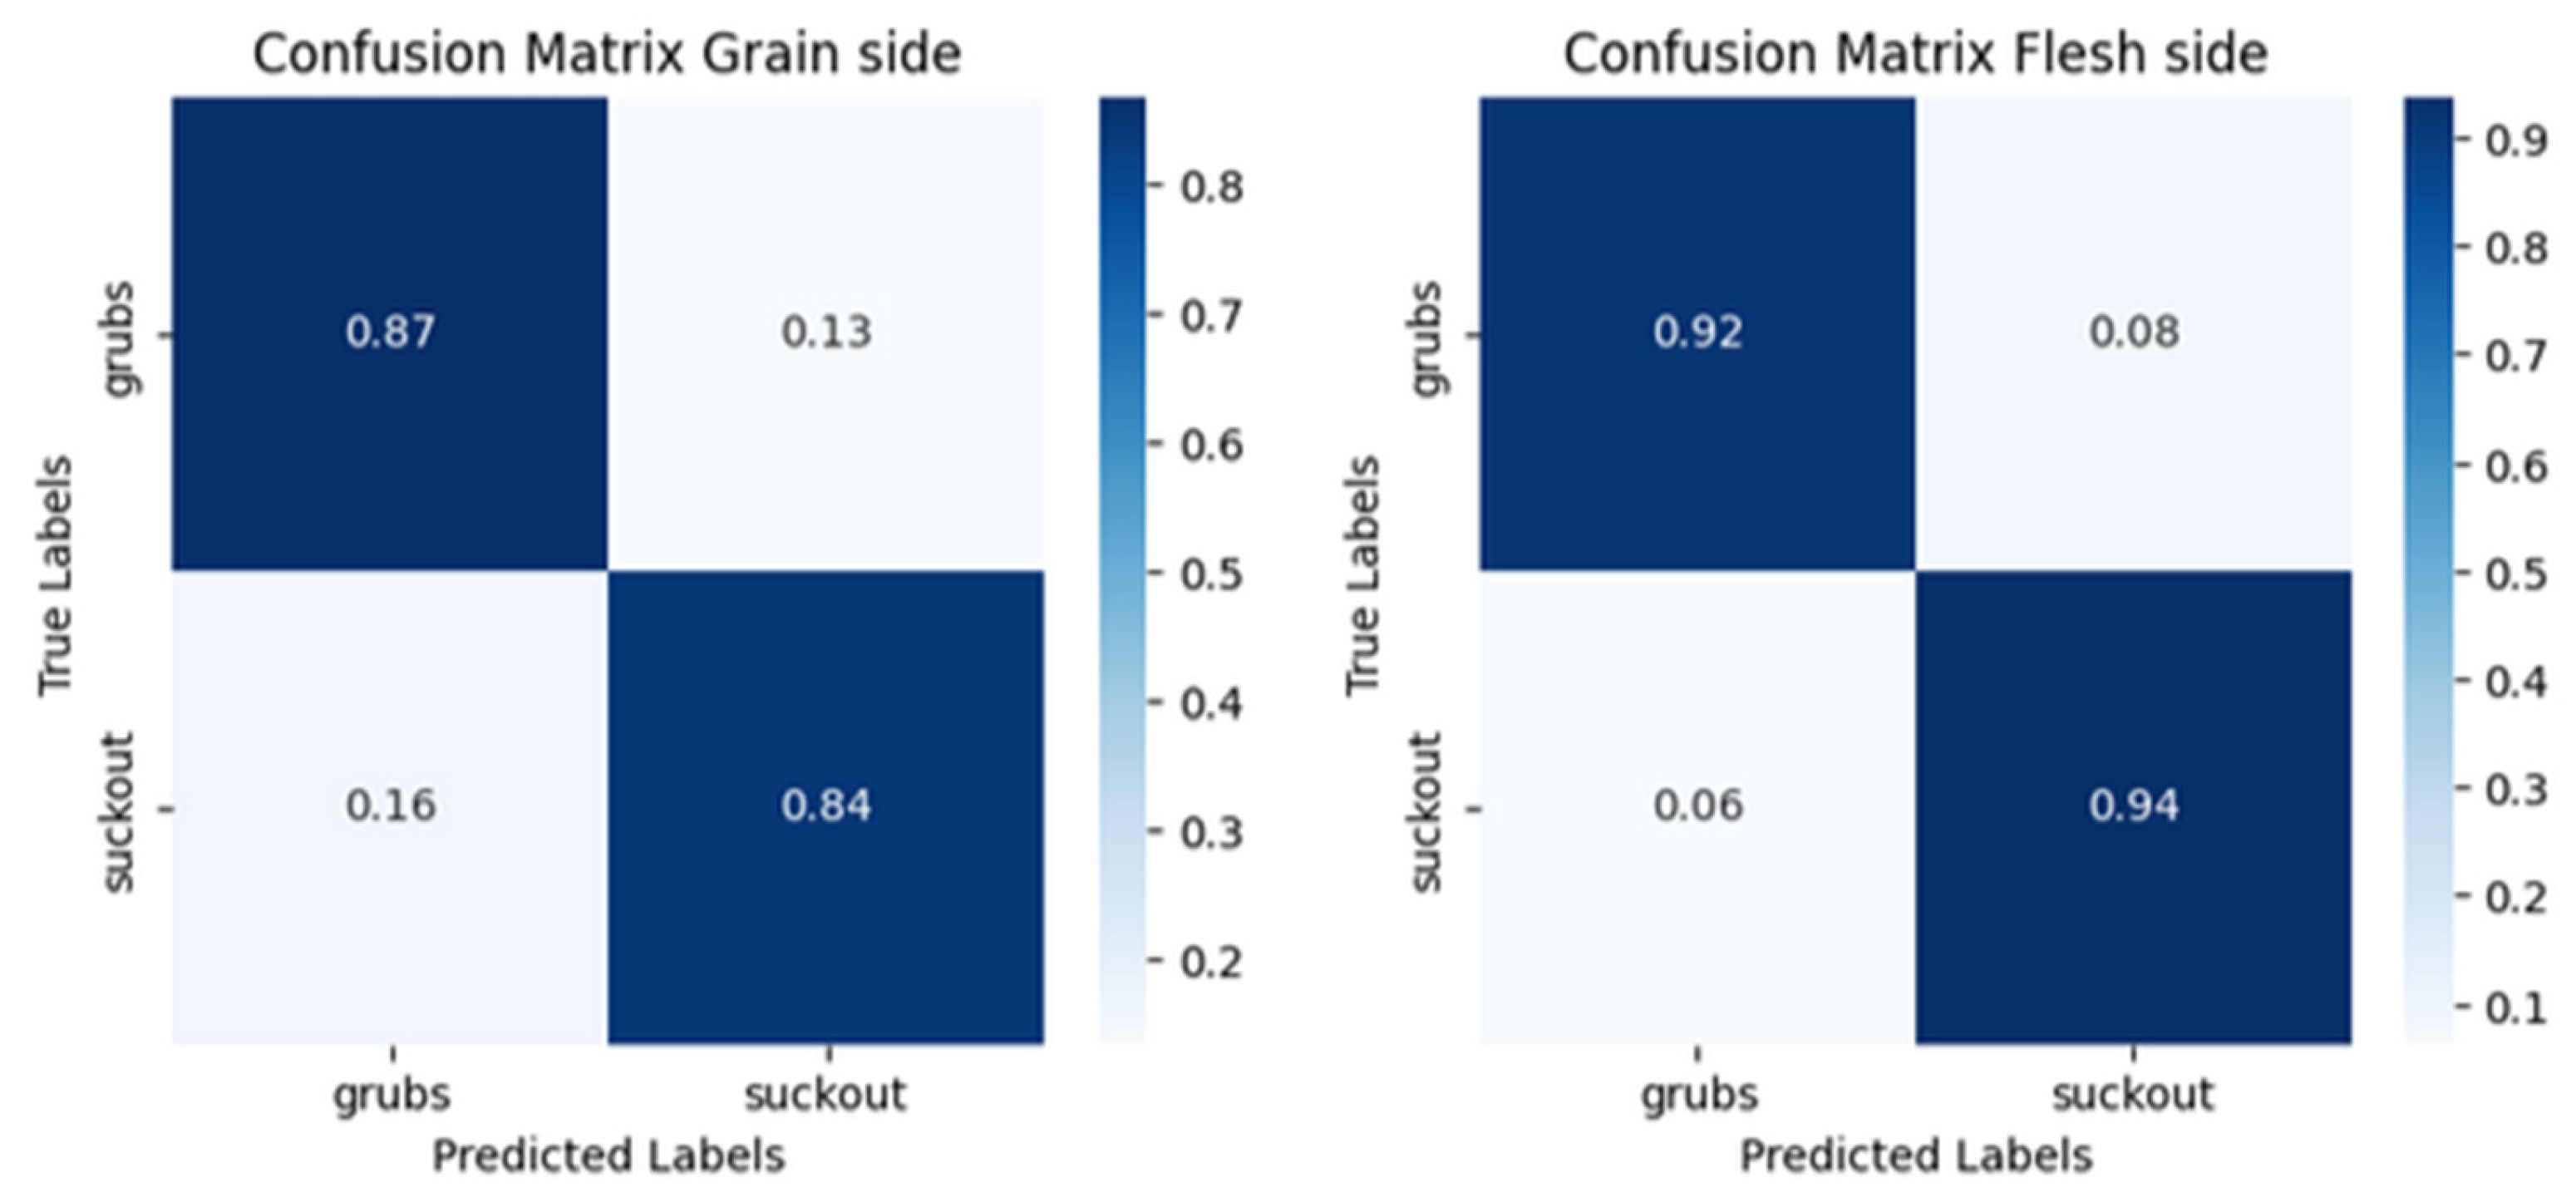
Figure 5.
Barchart of prediction confidences.
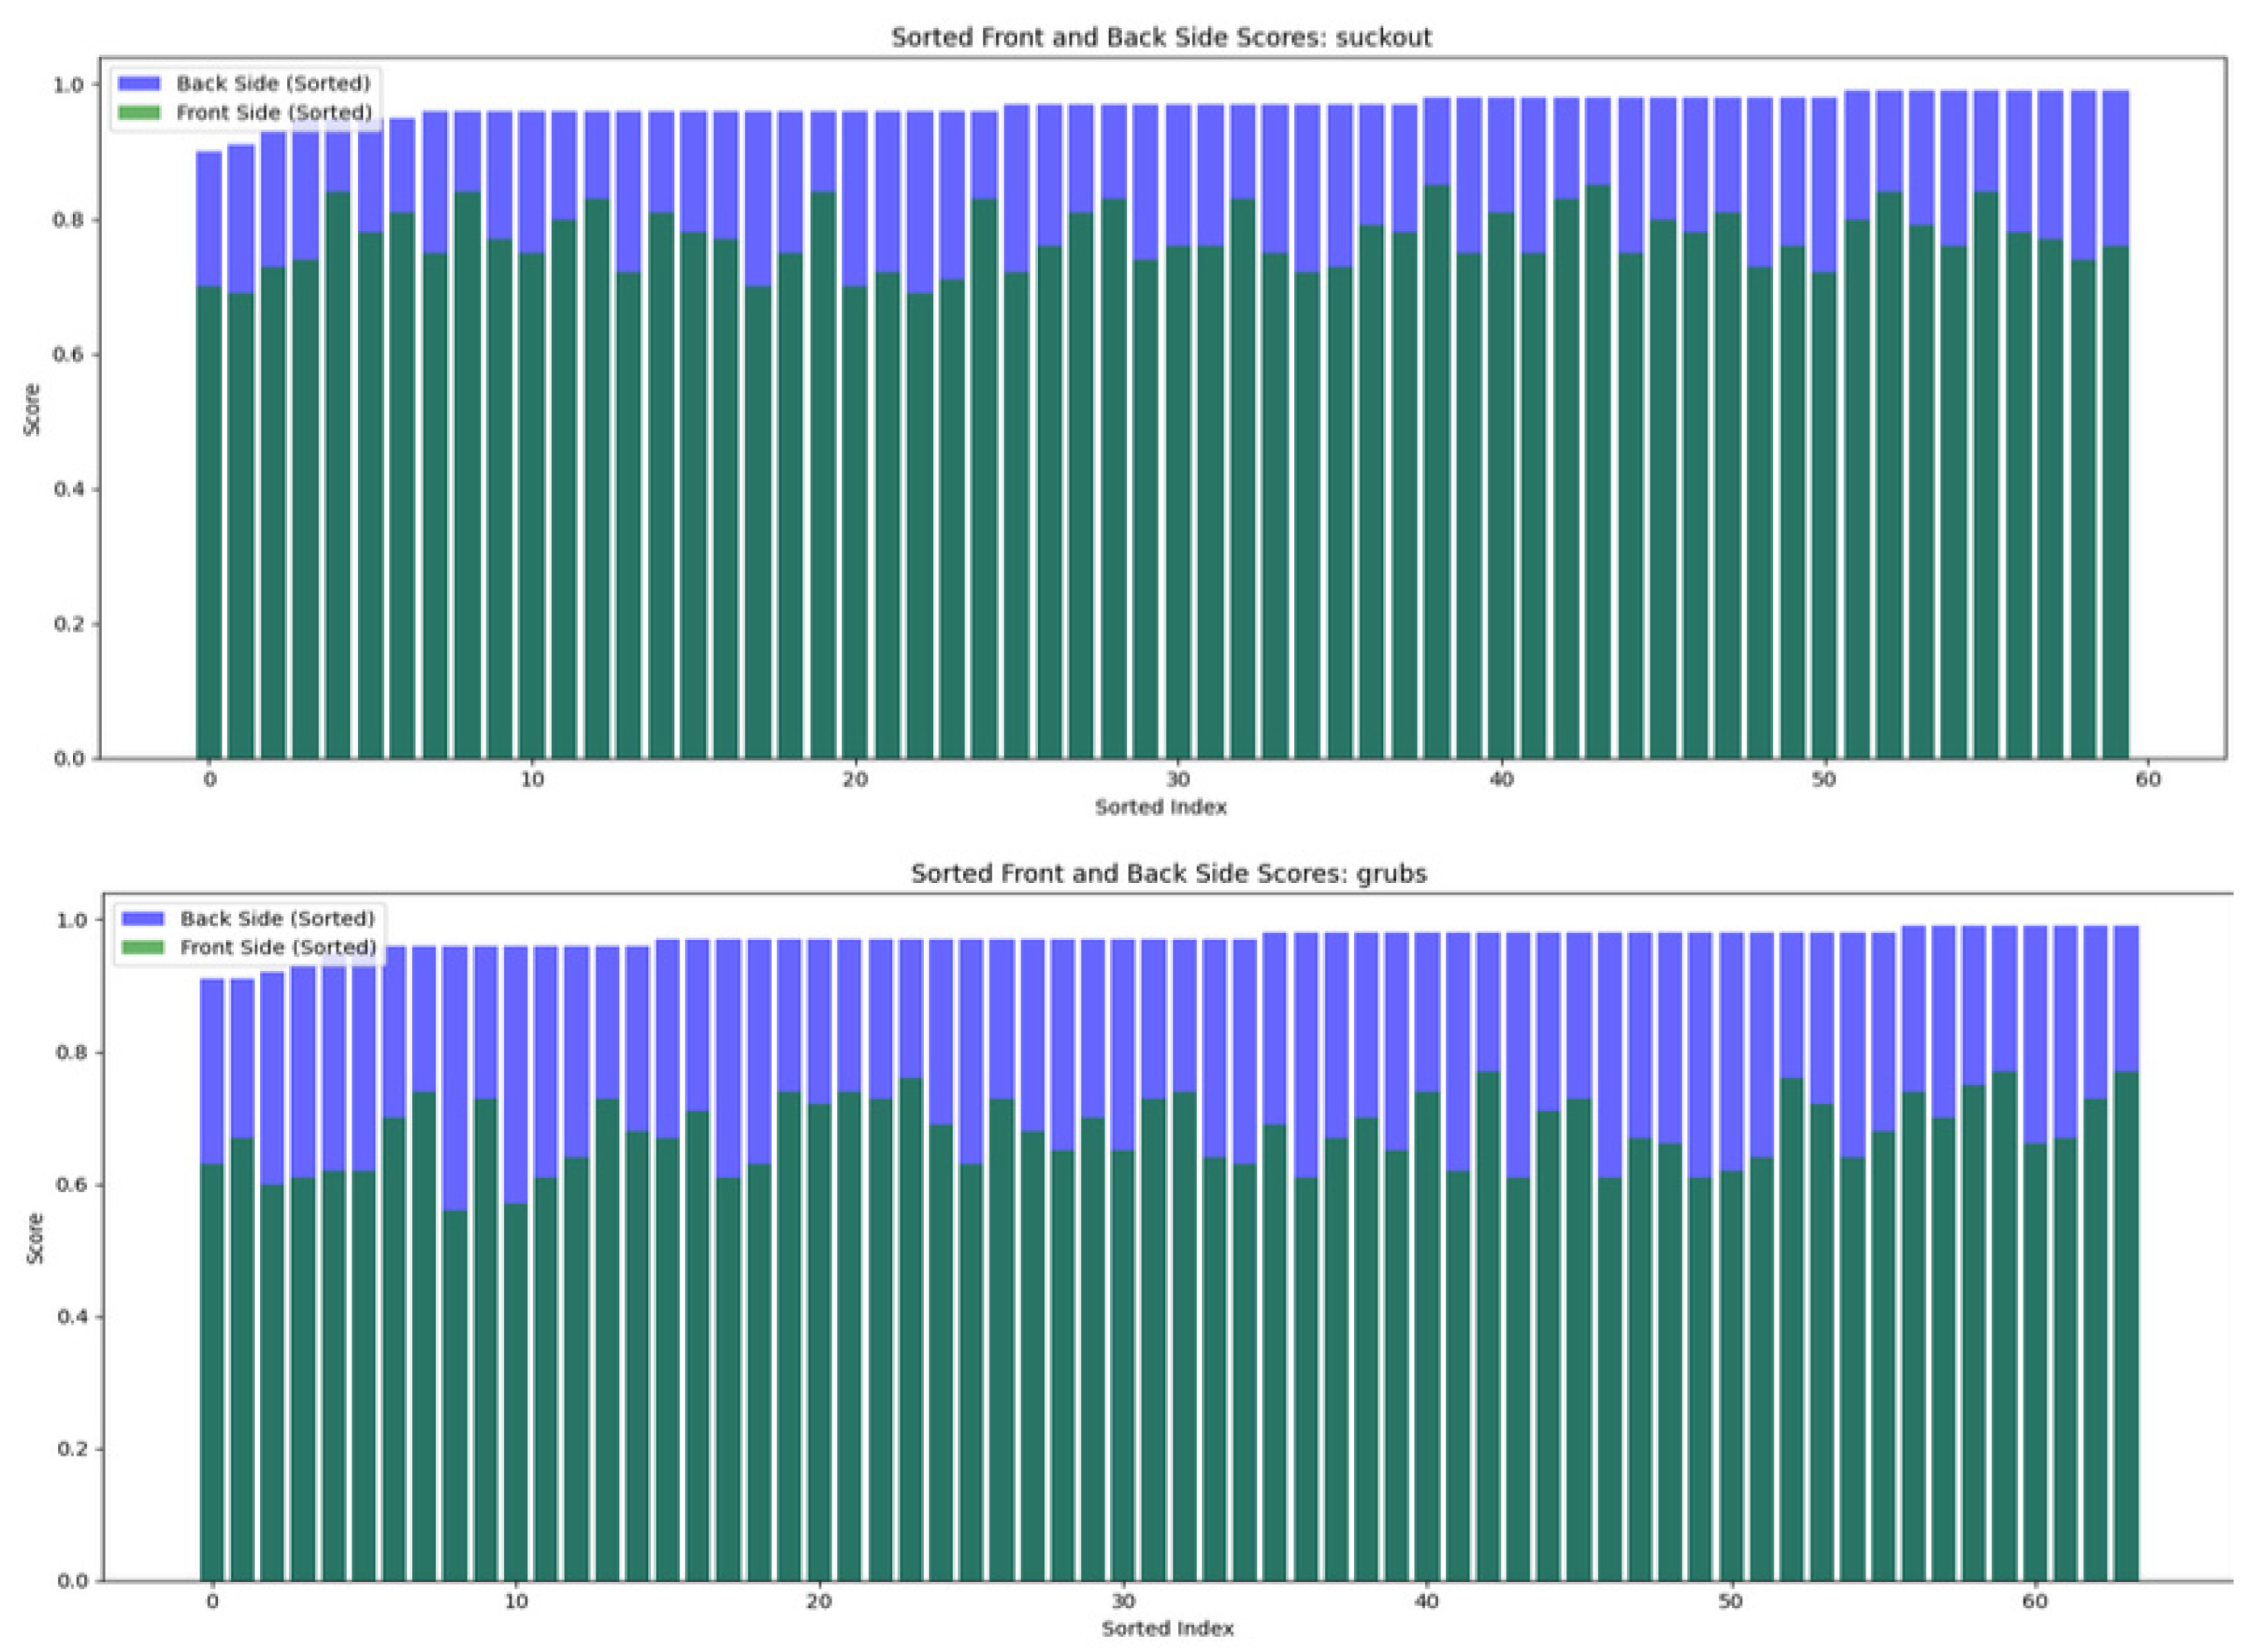

Table 1.
Evolution of YOLO Models in 2024.
| Model | Backbone | Head | Label Allocation |
|---|---|---|---|
| YOLOv9 | CSPDarkNet53 | conv, anchor boxes, multi-label classification, Auto Learning Bounding Box | Programmable Gradient Information (PGI) |
| YOLOv10 | CSPDarkNet53 or custom | conv, decoupled detection head, anchor-free, multi-label classification | Consistent dual assignments for NMS-free training |
| YOLOv11 | Ultralytics Backbone | Multi-task support for detection, segmentation, classification, pose estimation, OBB | Optimized Task-Aligner Assigner |
Table 2.
Algorithms Used for Calculating the Cost Function.
| Model | Confidence Error Loss | Box Regression Loss | Classification Loss |
|---|---|---|---|
| YOLOv9 | BCE | PGIoU (Programmable Gradient IoU) | BCE |
| YOLOv10 | BCE | DIoU (Dual IoU) | BCE |
| YOLOv11 | BCE | CIoU + DFL | BCE |
Table 3.
Performance results.
| Sample size of leather | Average accuracy detection (%) | Average accuracy classification (%) | ||||
|---|---|---|---|---|---|---|
| grubs | suckout | grubs | suckout | grubs | suckout | |
| Grain side | 300 | 300 | 85.8 | 87.1 | 66.8 | 78.2 |
| Flesh side | 300 | 300 | 93.5 | 91.8 | 98.2 | 97.6 |
Table 4.
Algorithms Used for Calculating the Cost Function.
| Metric | Grain side (%) | Flesh side (%) |
|---|---|---|
| Accuracy | 85 | 93 |
| F1-Score | 86 | 93 |
| Precision | 87 | 92 |
| Recall | 84 | 94 |
| Suckout Accuracy | 87 | 92 |
| Grubs Accuracy | 85 | 94 |
Table 5.
Performance results.
| Grubs | Suckout | |||
|---|---|---|---|---|
| Mean Accuracy (%) | STD (%) | Mean Accuracy (%) | STD (%) | |
| Grain side | 68.44 | 5.83 | 78.28 | 5.1 |
| Flesh side | 97.19 | 1.58 | 96.5 | 1.44 |
Table 6.
Relevant use of YOLO model series for detection and classification of industrial leather defects on finished leather.
Table 6.
Relevant use of YOLO model series for detection and classification of industrial leather defects on finished leather.
| Author | Sample size | Defects | Leather side | YOLO model |
Best accuracy (%) |
|---|---|---|---|---|---|
| Wang, M. et al. [7] | 6288 | Bubble, dent, broken glue | Grain | YOLOv9 | 94.7 |
| Andrzej Wróbel and Piotr Szymczyk [9] | 400 | General defects (not categorized) | Grain | YOLOv5 | 95 |
| Chen, Z. et al. [6] | 2855 | Cavity, pinhole, scratch, rotten surface, growth line, healing wound, crease, bacterial wound | Grain | YOLOv5-v8 | 85.1 |
| Thangakumar, J., et al. [10] | Not specified | Various leather defects | Not specified | YOLOv8 | 92 |
| The proposed model in this paper: | 1200 | Grubs (larval damage) and suckout (cut damage) | Both grain and flush | YOLOv11 | 97.6 |
Disclaimer/Publisher’s Note: The statements, opinions and data contained in all publications are solely those of the individual author(s) and contributor(s) and not of MDPI and/or the editor(s). MDPI and/or the editor(s) disclaim responsibility for any injury to people or property resulting from any ideas, methods, instructions or products referred to in the content. |
© 2024 by the authors. Licensee MDPI, Basel, Switzerland. This article is an open access article distributed under the terms and conditions of the Creative Commons Attribution (CC BY) license (http://creativecommons.org/licenses/by/4.0/).
Copyright: This open access article is published under a Creative Commons CC BY 4.0 license, which permit the free download, distribution, and reuse, provided that the author and preprint are cited in any reuse.


