
Submitted:
02 November 2024
Posted:
05 November 2024
You are already at the latest version
Abstract
In this study, a diverse collection of images of myxozoans from the genera Henneguya and Myxobolus was created, providing a practical dataset for application in computer vision. Four versions of the YOLOv5 network were tested, achieving an average precision of 97.9%, a recall of 96.7%, and an F1 score of 97%, demonstrating the effectiveness of MLens in the automatic detection of these parasites. These results indicate that machine learning has the potential to make micro-parasite detection more efficient and less reliant on manual work in parasitology. The beta version of the MLens shows strong performance, and future improvements may include fine-tuning the WebApp hyperparameters, expanding to other myxosporean genera, and refining the model to handle more complex optical microscopy scenarios. This work represents a significant ad-vancement, opening new possibilities for the application of machine learning in parasitology and substantially accelerating parasite detection.
Keywords:
Aprendizado de máquina
; parasitologia
; mixozoários
; detecção de objetos
; microscópio
; YOLO
1. Introduction
The class Myxozoa comprises over 70 genera and approximately 2600 species, all of which are obligate endoparasites [1,2]. Many of these parasites cause severe diseases known as myxosporidioses [3]. Lom & Arthur [4] described morphological and morphometric variables as indispensable factors in defining myxospores and taxonomic groupings.
Among myxozoans, the genera Henneguya [4] and Myxobolus play significant roles as parasites of ichthyofauna [5]. These polyphyletic genera encompass various members distributed worldwide, are found in both freshwater and marine ichthyofauna, and have also been reported in reptiles and amphibians [1,6]. Their geographic distribution is influenced by environmental factors such as water temperature, water quality, and host availability [7,8,9].
Furthermore, as highlighted by Sichman et al. [10], humanity’s relentless pursuit of new heights of progress is undeniably driven by continuous advances in the broad domain of science, as evidenced in the case of artificial intelligence (AI), which has played a pivotal role in enabling the development of specialized computational technologies. Therefore, this phenomenon has sparked substantial and enduring interest, with its impact continuing to resonate notably in an everevolving society [11,12].
Neural networks aspire to emulate the complexity of biological neuronal functions [13]. Analogous to cellular processes, artificial neurons excel in their ability to receive, process, and transmit information through mathematical operations, thereby enabling them to identify patterns, perform classifications, and predict characteristics [13,14]. This biology-mathematics symbiosis-inspired process opens promising horizons for innovation in the field of AI, where human and artificial minds intertwine in the pursuit of innovative and bold solutions [15].
The application of AI finds fertile ground in parasitology, playing a crucial role in addressing persistent challenges, and convolutional neural networks are tools used in computer vision (CV) and are now essential in veterinary medicine and industry [16]. They are intrinsically associated with CV, which, when combined with image analysis techniques, results in comprehensive specialized systems that offer solutions for detecting and classifying parasitic objects with minimal human intervention and high accuracy [17]. This, in turn, eliminates the errors often associated with human analysis stemming from tasks that are often fatiguing, monotonous, costly, or simply lack expertise [18,19,20].
Moreover, the acquisition of microscopy images establishes a solid foundation for feeding CV systems, revealing new diagnostic and research perspectives in parasitology [21,22].
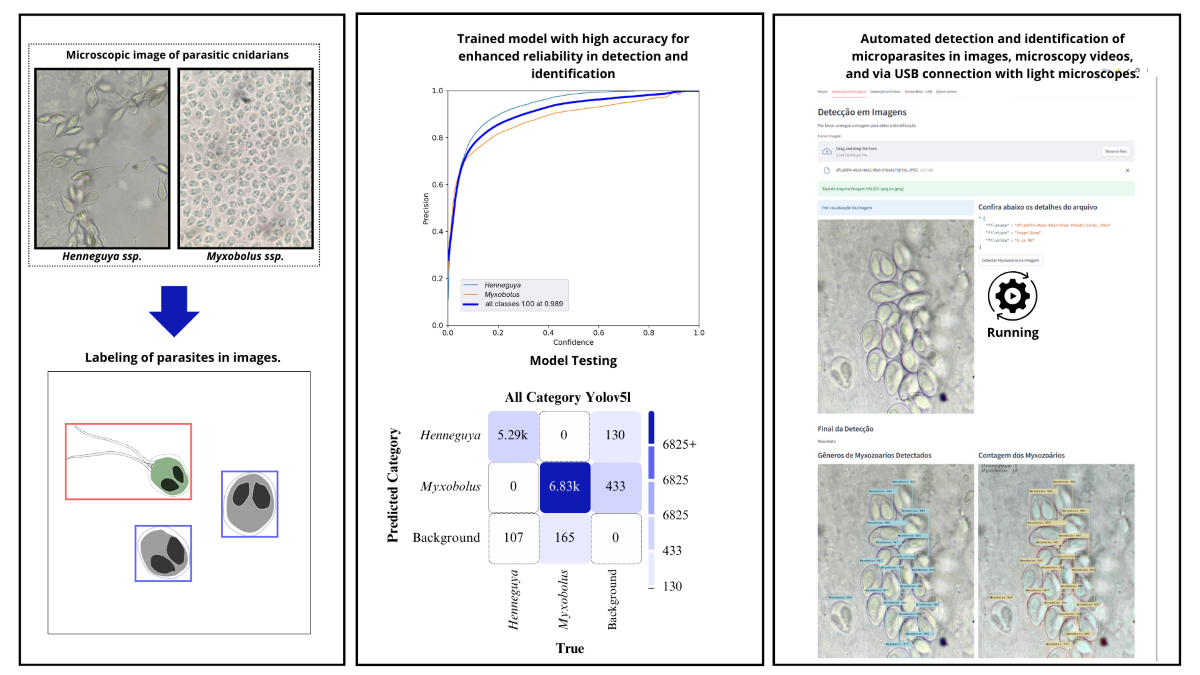
In this study, a beta version of a WebApp called MLens was developed to perform automated detection and classification of the genera Myxobolus and Henneguya in light microscopy-acquired images via the YOLOv5 neural network, aiming to increase the efficiency and accuracy of parasitological diagnosis.
2. Material And Methods
The development of the MLens or processing light microscopy images, aimed at detecting two genera of myxozoans via the You Only Look Once (YOLOv5) algorithm, was performed in three distinct phases: dataset collection, project dataset training and implementation. Notably, all stages were conducted at the Laboratory of Morphomolecular Integration and Technologies (LIMT) of the Federal Rural University of the Amazon.
2.1. Cnidaria: Myxozoa
Myxozoa (Cnidaria: Endocnidoxoa) represents one-fifth of the known cnidarian species [23,24] worldwide, spanning freshwater and marine environments [23,25]. Many infections are asymptomatic and are considered harmless. However, some species have high pathogenic potential, causing disease and significant mortality in parasitized organisms. This can lead to substantial economic losses in the fishing and aquaculture sector. Additionally, immunocompromised individuals who consume raw fish protein from infected fish may experience harm caused by these parasites, although there is no evidence that humans are hosts in any stage of the myxozoan life cycle. However, myxozoan spores have been detected in human feces [26].
Myxozoans exhibit a complex life cycle that involves alternating between invertebrate and vertebrate hosts. The latter serve as intermediate hosts, whereas invertebrates act as definitive hosts, particularly those from the classes Oligochaeta and Polychaeta, which belong to the phylum Annelida [7]. Transmission between hosts occurs through two morphologically distinct forms: the myxospore, which develops in vertebrates, and the actinospore, which is found in invertebrates. Typically, this transmission occurs via spores that disperse in water Fiala et al. [2], Figure 1.
Okamura et al. [24] reported that myxozoans exhibit pronounced structural simplification, along with miniaturization, as a result of their parasitic niche. Okamura et al. [7] reported that these parasites obligatorily undergo complex life cycles, requiring both invertebrate and vertebrate hosts. This extensive group of endoparasites has complex, obligatory microscopic, and heterogeneous life cycles that are dependent on both invertebrate and vertebrate hosts [24,27]. These parasites have the potential to cause significant environmental and economic damage. Although they are commonly found in fish, they can also infect reptiles, amphibians, waterfowl, and even small mammals7 and Eiras et al. [28].
2.2. Data Acquisition
The image collection system used in this study belongs to the LIMMT. The team imaged all parasites of the genera Henneguya and Myxobolus found during necropsies between 2022 and 2024 via smartphones, as exemplified in the pipeline (Figure 2). In total, 125 images with dimensions of 2160 x 3840 pixels were collected and subdivided into 12 smaller images with dimensions of 640 pixels. Therefore, the sample comprised 12,000 images divided into two genera, Myxobolus and Henneguya, covering various species of Amazonian fish and different tissues, such as gills, liver, and skeletal muscle. The images were uniformly sized at 640 pixels each and were in JPEG format.
2.3. Data Preprocessing
To enhance the generalizability of the model for identifying microparasites in microscopy images, several image processing techniques were employed, as shown in Figure 3. As discussed by Zhao et al. [29], rotations were applied at angles of 90°, 180°, and 270°. Additionally, horizontal and vertical flips were employed on the original images and at 90° clockwise Bydder et al. [30], Zendehdel et al. [31], and Ghose et al. [32], thus avoiding redundancies. These transformations provided increased diversity in the dataset because, after subdividing the original images, each subunit resulted in eight new unique images. This helps the model recognize patterns in multiple orientations and reflections, thereby improving its robustness and accuracy in detecting these genera in various scenarios.
2.3. Labeling of Myxozoans
The Roboflow platform for CV was used to demarcate the regions of interest, that is, to label the parasites in the form of bounding boxes. As emphasized by Noever and Noever [19], the essence of this task was the accuracy of labeling the objects of interest, which, in turn, depended on human performance. As illustrated in Figure 4, the quality and consistency of these labels were crucial because they served as the foundation for the learning process of the model for identifying and locating objects in new images.
This requirement was met by carefully creating bounding boxes, precisely outlining the location of the myxozoans, and assigning each genus a specific label, as shown in Table I. This enabled the generation of label files in “.txt” format linked to the source image. These files included the category (in this case, the genus) and bounding box coordinate information (X: x-coordinate center of the bounding box, Y: y-coordinate center of the bounding box, W: width of the bounding box, and H: height of the bounding box), as illustrated in Table 1.
The model was trained after appropriately labeling the data and organizing the training and validation sets. MLens was subsequently implemented in a real-world context by performing myxozoan detection on the basis of the meticulously provided information in this process. Table 2 shows the categories listed in Table 1.
Furthermore, this study aimed to obtain reliable evidence that the labeled genera Henneguya and Myxobolus presented a numerical balance. The analysis included an exploration of the characteristics of the labels used and the associated bounding boxes (Figure 5), Statistical Analysis of Labels: Gender Histogram and Density Map of Bounding Box Sizes. These genera exhibited a quantitative balance. However, the number of parasites in question tended to be very small compared with the image scale, which could complicate detection.
2.4. Quantitative Characteristics of the Dataset
The images were randomly distributed for training and validation at a ratio of 80:20. However, when making such divisions, obtaining a balance between the number of samples of each genus in the training and test sets was important to ensure maximum consistency in the data distribution.
2.5. Experimental Configuration
To ensure the rigor of this study, Google Colaboratory was used for the training and validation phases of the model. This free cloud server was designed to foster research and education in machine learning and includes integrated libraries, such as TensorFlow, Matplotlib, Keras, and OpenCV, eliminating the need for complex local installations Ray et al. [33]. Additionally, Colab facilitates synchronization with Google Drive, allowing the storage of large data volumes without consuming disk space. It also promotes mobility, collaboration, and project sharing, requiring only an email account, making it convenient for community collaboration.
This platform provides hardware adapted for machine learning, including an Intel Xeon CPU; an NVIDIA Tesla® L4 GPU with 24 Gigabytes (GB) of GDDR6 memory and 7680 CUDA cores; and 78 GB of storage and 51 GB of RAM, which is supported by CUDA v12.2. The deep learning frames PyTorch v2.2.1 and Python v3.10.12 were used for development. Finally, an interactive dashboard was created via Streamlit v1.19.0.
2.6. YOLOv5
YOLOv5 has become an essential algorithm in contemporary object detection, balancing speed and execution accuracy Liu et al. [34] and Li et al. [35]. Object detection is a fundamental digital field. It involves identifying the objects present in an image or frame and determining their exact locations. This type of activity is more complex than object classification, which only recognizes the presence of objects without indicating their positions in an image Xu et al. [36]. Moreover, objects cannot be classified multiple times, increasing the complexity of the detection process.
The range of YOLOv5 is noteworthy. Compared with previous versions, YOLOv3, YOLOv4, and YOLOv5 boasts higher accuracy and excels in terms of lightness, speed of object detection, and inference speed. These characteristics are crucial for embedded applications that require real-time detection Xu et al. [36], Zhang et al. [37] and Badgujar et al. [38]. These findings demonstrate that this algorithm can substantially improve the detection and identification of myxozoans via light microscopy.
The YOLOv5 architecture includes various variants; however, in this study, only the following four variants were used: YOLOv5n, YOLOv5s, YOLOv5m, and YOLOv5l (Figure S1). As discussed by Elshahawy et al. [39], the recommended steps for machine training were followed and documented in a notebook hosted on Google Colab. However, its ability and adaptability to other applications using different datasets are relatively simple, flexible, and open.
2.5. Evaluation Metrics
In machine learning, the interpretation of appropriate metrics ensures the accurate assessment of a model. However, these metrics can vary from situation to situation, causing some difficulty in comparison and potentially leading to erroneous conclusions. In this study, the precision (P), recall, F1_Score, and mAP were used as evaluation metrics [40,41].
According to Shen et al. [42], the mAP metric is the average precision calculated across all genera for all categories (N). Notably, an mAP of 0.5 is an intersection over the union (IoU) threshold of 0.5. Furthermore, mAP0.5:0.95 represents the average across IoU thresholds from 0.5-0.95, with an interval of 0.05. The formulas for precision, recall, mAP, and F1_Score are as follows:
4. Results and Discussion
Standard hyperparameters were used: an initial learning rate (lr0) of 0.01 and a final learning rate (lrf) of 0.01. Furthermore, an SGD with a momentum of 0.937 and weight_decay of 0.0005 was used to control the regularization and avoid overfitting. A batch size of 16 was selected to balance the training speed and model accuracy [43], with training lasting for 300 epochs to allow the models to clearly absorb patterns in the data, and the image dimensions were set to 640 pixels. In the first three epochs, a warmup_momentum of 0.8 and warmup_bias_lr of 0.1 were applied.
The emergence of various object detection models, such as the YOLO series, has revolutionized the field of CV. Each variant of these networks has unique characteristics in terms of GPU memory requirements [44,45,46,47]. The results were derived from the detection training of the Henneguya and Myxobolus genera via the YOLOv5n, YOLOv5s, YOLOv5m, and YOLOv5l variants configured with the parameters listed in Table 3, as exemplified by Huang et al. [48] and Du [49].
In particular, the YOLOv5 model has drawn significant attention because of its high performance and efficiency. In Figure 6, the YOLOv5l model requires 11 GB of GPU memory to stabilize its training process, whereas the YOLOv5m model requires 7.1 GB. Interestingly, the YOLOv5s variant requires only 4 GB of GPU memory, and the most resource-efficient model, YOLOv5n, uses only 2.4 GB of GPU memory until the completion of training [47,50].
The most plausible explanation for the difference in GPU memory requirements can be attributed to the inherent architectural characteristics of each variant. As discussed by Hasan et al. [47], the YOLOv5n model, which is the smallest in the series, is more suitable for deployment on mobile hardware platforms, such as those embedded in vehicles, owing to its compact size and low memory demand.
Nevertheless, the analysis of the training time and model performance is a common consideration in machine learning. Larger models, such as YOLOv5l, are often more accurate in detection but are associated with robust computational resources and longer training times [51]. Fu et al. [52] highlighted that smaller variants such as YOLOv5n are more efficient and suitable for implementation on resource-constrained platforms while accepting some precision trade-offs.
The variants differed in their training completion times, as shown in Figure 6. Notably, YOLOv5n, the shortest, took 400.46 minutes, followed by YOLOv5s (508.85 minutes) and YOLOv5m (870.15 minutes), and YOLOv5l, which was the most complex, required 1336.78 minutes. Additionally, the model sizes, presented in Figure 6, corresponded to their complexities: YOLOv5n resulted in a 3.9 MB model, YOLOv5s in a 13.8 MB model, YOLOv5m in a 40.3 MB model, and YOLOv5l in a 92.9 MB model. These differences clearly indicate that model complexity influences training time and hardware demand, as mentioned by Tong & Yiquan [51] and Cai et al. [53].
The training performance curves of the models are shown in Figure 7 (a, b, c and d). Ma et al. [54] reported that such metrics are evaluation criteria for models that allow understanding of their advantages and disadvantages and comparing different models to determine the most suitable model for real-world situations. Without such metrics, verifying the progress or superiority of one model over others would be impossible [55,56].
According to Figure 7.a and 7.c, the precision and recall rates of all the models started to increase significantly from epoch 2. Initially, at epoch 0, the precision and recall varied according to the complexity of the model: YOLOv5l started with the highest precision at 59.6% and recall at 68.7%; YOLOv5m had the highest initial precision, reaching 69.6% and a recall of 68.1%, whereas YOLOv5n had the lowest values (41.5% and 58.6%, respectively). All the models achieved accelerated gains in precision and recall for up to approximately epoch 10.
The mAP scores, shown in Figure 7.b, demonstrated a similar trend. The YOLOv5m and YOLOv5l models begin with higher mAP_50 scores (66.8% and 71.8%, respectively); however, the YOLOv5l model outperforms YOLOv5m (93.4% and 92.6%, respectively) only at approximately epoch 18. However, until epoch 10, all the variants rapidly evolve in terms of mAP_50.
When the mAP50:95 metric was evaluated via Figure 7.d, an interesting dynamic was observed between the YOLOv5l and YOLOv5m variants. The training started with YOLOv5m at an mAP50:95 of 38.7%, followed by YOLOv5l at 36.5%. Both methods achieved similar performances until epoch 9, when they reached mAP50:95 values of 64.5% and 66.3%, respectively. However, as the training progressed, YOLOv5l showed consistent improvement, achieving a remarkable score of 89.2% at the end of the training. However, YOLOv5m maintained considerable performance, scoring 86%. In contrast, YOLOv5s reached 80.6%, and YOLOv5n, despite improving over the epochs, lagged behind with only 73.5% mAP50:95.
Figure 8 (a, b and c) illustrates the training losses, highlighting the effectiveness of YOLOv5 variants over 300 epochs in detecting myxozoans. Initially, all the models experienced abrupt losses, which decreased rapidly during the first 50 epochs and then gradually stabilized. Among them, YOLOv5n, being the least complex, showed greater losses and resulted in greater losses than did other more complex models, such as YOLOv5s, YOLOv5m, and YOLOv5l, which showed a better fit to the training data. This difference underscores the superior ability of more robust models to capture data patterns.
However, Figure 9 (a, b and c) indicates losses during validation, which were not discrepant and followed a trend similar to that during training, with the losses rapidly decreasing in the first 50 epochs. The YOLOv5n model again presented the highest final losses, whereas the more complex models achieved better validation results.
These results reflect the superior generalization capacity of the more complex models, which is essential for effective performance on new data, as shown in Table 4, with precision, recall, mAP:50, and mAP:50-95 for the validation set.
Figure 10(a) shows precision and recall, while Figure 10(b) highlights precision and confidence, the performance of the models in distinguishing the genera Henneguya, Myxobolus, and background. Overall, the YOLOv5l model achieved a robust accuracy of 99.3% for Henneguya, indicating that almost all of its predictions were correct, even with high recall. For Myxobolus, a precision of 96.6% demonstrated high performance, although slightly lower than that of Henneguya. The average precision for all classes (mAP: 0.5) of 97.9% highlights the consistency of the model. In the recall-confidence curve, even with high confidence, the model maintains recall, indicating that its predictions are reliable.
The confusion matrices shown in Figure 11 (a, b, c and d) for the YOLOv5n, YOLOv5s, YOLOv5l, and YOLOv5m variants provide an analysis of the performance for the detection of Henneguya, Myxobolus, and background. Furthermore, YOLOv5n correctly identified 4.89k (TP) instances of Henneguya, with 396 false positives (FPs), and 6.70k TPs for Myxobolus, with 954 FPs. Although it performs well in detection, the number of FPs can still be reduced. Additionally, YOLOv5s maintained balance, identifying 5.13k TPs for Henneguya with 274 FPs and 6.78k TPs for Myxobolus with 648 FPs. A notable reduction in false positives was observed compared with YOLOv5n.
Finally, YOLOv5m stood out with 5.23k TP for Henneguya and only 153 FPs and 6.82k TP for Myxobolus with 534 FPs, showing a good balance between precision and discrimination capability. However, YOLOv5l demonstrated significant superiority, with 5.29k TP for Henneguya and only 130 FPs and 6.83k TP for Myxobolus, with 433 FPs, indicating its higher precision.
Figure 12 provides a qualitative analysis of the detection results for the genera Myxobolus and Henneguya for some images not used in the proposed dataset. As depicted in the images, myxozoans of various shapes and positions were observed, although belonging to the genera Myxobolus and Henneguya, which were still detected with high precision. This demonstrates that the MLens can perform robust detections.
5. Conclusions
In the present study, a diverse collection of myxozoan images was obtained from the genera Henneguya and Myxobolus. This collection aimed to cover various situations and scenarios in light microscopy, providing a practical dataset for use in CV. Simultaneously, different versions of the YOLOv5 network were implemented to detect tar-infected parasites, which significantly improved the myxozoan detection accuracy.
Four networks were tested to automate the detection and differ-entiation of myxozoans and obtained satisfactory results, achieving an average precision of 97.9% for all genera, with a recall of 96.7% and an F1_Score of 97%. These results demonstrate the potential applicability of the MLens in real-world scenarios, indicating that machine learning in parasitology offers considerable benefits, making microparasite detection processes more efficient and less labor intensive.
From a forward-looking perspective, further advancements in web and mobile applications for the detection of myxozoans and parasites aimed at increasing the number of identifiable genera with continuous improvements in precision, accuracy, and real-time performance are expected. This is an important field for future research, including topics such as enhancing the quality and diversity of datasets and addressing the challenges in detecting multiple small targets in complex scenarios.
The MLens showed excellent results as a beta version, and further medium-term training, fine tuning of hyperparameters, and expansion of the collection are needed. This is the first software developed for the detection of myxozoans, which will hopefully serve as a gateway to the field of parasitology associated with AI.
Author Contributions
Conceptualization, G.C., J.S.-N., M.O., and A.S.; methodology, G.C., J.S.-N., and M.O.; software, G.C., J.S.-N., and M.O.; validation, G.C., J.S.-N., and M.O.; formal analysis, G.C., J.S.-N., and M.O.; investigation, G.C., J.S.-N., and M.O.; resources, G.C., J.S.-N., M.O., and A.S.; data curation, G.C., J.S.-N., and M.O.; writing—original draft preparation, G.C., J.S.-N., and M.O.; writing—review and editing, G.C., J.S.-N., M.O., and K.X.; visualization, G.C., J.S.-N., M.O., and K.X.; supervision, G.C., J.S.-N., and M.O.; project administration, G.C., J.S.-N., and M.O.; funding acquisition, A.S. All authors have read and agreed to the published version of the manuscript.
Data Availability Statement
The final product, consolidated with the data supporting the results reported in this study, is openly available at https://github.com/gscproseg/master.git.
Acknowledgments
I would like to express my sincere gratitude to the National Council for Scientific and Technological Development (CNPq) for the grant of the stricto sensu master’s scholarship, which supported my research and was essential for the completion of this study.
Conflicts of Interest
The authors declare no conflicts of interest. The funders had no role in the design of the study; in the collection, analysis, or interpretation of the data; in the writing of the manuscript; or in the decision to publish the results.
References
- Lom, J.; Dyková, I. Myxozoan genera: definition and notes on taxonomy, life-cycle terminology and pathogenic species. Folia Parasitologica, 2006, 53(1), 1-36. [CrossRef]
- Fiala, I.; Bartošová-Sojková, P.; Whipps, C.M. Classification and phylogenetics of Myxozoa. In Myxozoan Evolution, Ecology and Development; Okamura, B., Gruhl, A., Bartholomew, J.L., Eds.; Springer: Cham, 2015; pp. 85-110. [CrossRef]
- Jones, S.R.M.; Bartholomew, J.L.; Zhang, J.Y. Mitigating Myxozoan disease impacts on wild fish populations. In Myxozoan Evolution, Ecology and Development; Okamura, B., Gruhl, A., Bartholomew, J., Eds.; Springer: Cham, 2015. [CrossRef]
- Lom, J.; Arthur, J.R. A guideline for the preparation of species descriptions in Myxosporea. Journal of Fish Diseases, 1989, 12(2), 151-156. [CrossRef]
- Carvalho, A.A.; Videira, M.N.; Bittencourt, L.S.; Araújo, P.G.; Ferreira, R.L.S., et al. Infection of Henneguya sp. on the gills of Metynnis lippincottianus from Curiaú River, in eastern Amazon region (Brazil). Brazilian Journal of Veterinary Parasitology, 2020, 29(3), 003320. [CrossRef]
- Zago, A.C.; Vieira, D.H.M.D.; Franceschini, L.; Silva, R.J. Morphological, ultrastructural, and molecular analysis of a new species of Myxobolus (Cnidaria, Myxosporea) parasitizing Apareiodon piracicabae (Characiformes, Parodontidae) from Brazil. Parasitology International, 2022, 88, 102556. [CrossRef]
- Okamura, B.; Gruhl, A.; Bartholomew, J.L. An Introduction to Myxozoan Evolution, Ecology and Development. In Myxozoan Evolution, Ecology and Development; Okamura, B., Gruhl, A., Bartholomew, J.L., Eds.; Springer: Cham, 2015; pp. xx-xx. [CrossRef]
- Jerônimo, G.T., et al. Fish parasites can reflect environmental quality in fish farms. Reviews in Aquaculture, 2022, 14(3), 1558-1571. [CrossRef]
- Lauringson, M., et al. Spatial and intrahost distribution of myxozoan parasite Tetracapsuloides bryosalmonae among Baltic sea trout (Salmo trutta). Journal of Fish Diseases, 2023, 46(10), 1073-1083. [CrossRef]
- Sichman, J.S. Artificial intelligence and society: advances and risks. Estudos Avançados, 2021, 35, 37-50. [CrossRef]
- Li, R. Artificial Intelligence Revolution: How AI Will Change Our Society, Economy, and Culture; Skyhorse Publishing: New York, 2020. ISBN 9781510753006.
- Lee, K.W. Augmenting or Automating? Breathing Life into the Uncertain Promise of Artificial Intelligence [PhD Thesis]. New York University, New York, 2022.
- De Moraes, A.L.Z.; Barbosa, L.V.F.; Del Grossi, V.C.D. Artificial Intelligence and Human Rights: Contributions to a Regulatory Framework in Brazil; Editora Dialética: São Paulo, 2022. ISBN 9786525253725.
- Siqueira-Batista, R., et al. Artificial neural networks and medical education. Revista Brasileira de Educação Médica, 2014, 38, 548-556. [CrossRef]
- Chen, L., et al. Review of image classification algorithms based on convolutional neural networks. Remote Sensing, 2021, 13(22), 4712. [CrossRef]
- Yonck, R. Heart of the Machine: Our Future in a World of Artificial Emotional Intelligence; Arcade: New York, 2020. eISBN 9781628727374.
- Rahimzadeh, M.; Attar, A. A modified deep convolutional neural network for detecting COVID-19 and pneumonia from chest X-ray images based on the concatenation of Xception and ResNet50v2. Informatics in Medicine Unlocked, 2020, 19, 100360. [CrossRef]
- Yaacoub, J.P.; Noura, H.; Salman, O.; Chealb, A. Security analysis of drones systems: Attacks, limitations, and recommendations. Internet of Things, 2020, 11, 100218. [CrossRef]
- Noever, D.; Noever, S.E.; Miller, M. Hunting with machine vision. arXiv, 2021. [CrossRef]
- Carvalho, A.C.P. Inteligência artificial: riscos, benefícios e uso responsável. Estudos Avançados, 2021, 35, 21–36. [CrossRef]
- Candiotto, K.B.B.; Karasinski, M. Inteligência artificial e os riscos existenciais reais: uma análise das limitações humanas de controle. Filosofia Unisinos, 2022, 23, e23307. [CrossRef]
- Keszthelyi, S.; Pónya, Z.; Csóka, A.; Bázar, G.; Morschhauser, T.; Donkó, T. Non-destructive imaging and spectroscopic techniques to investigate the hidden-lifestyle arthropod pests: a review. Journal of Plant Diseases and Protection, 2020, 127(3), 283-295. [CrossRef]
- Kumar, S.; Arif, T.; Ahamad, G.; Chaudhary, A.A.; Khan, S.; Ali, M.A.M. An efficient and effective framework for intestinal parasite egg detection using YOLOv5. Diagnostics, 2023, 13(18), 2978. [CrossRef]
- Okamura, B.; Hartigan, A.; Naldoni, J. Extensive uncharted biodiversity: the parasite dimension. Integrative and Comparative Biology, 2018, 58(6), 1132-1145. [CrossRef]
- Giribet, G.; Edgecombe, G. The Invertebrate Tree of Life; 2020. [CrossRef]
- Zatti, S.A.; Marinho, A.M.R.; Adriano, E.A., et al. Integrative taxonomy reveals a panmictic population of Henneguya longisporoplasma n. sp. (Cnidaria: Myxozoa) in the Amazon Basin. Acta Parasitologica, 2022, 67, 1644-1656. [CrossRef]
- Okamura, B.; Gruhl, A. Myxozoa + Polypodium: a common route to endoparasitism. Trends in Parasitology, 2016, 32(4), 268-271. [CrossRef]
- Eiras, J.C.; Barman, G.D.; Chanda, S., et al. An update of the species of Myxosporea (Cnidaria, Myxozoa) described from Indian fish. Journal of Parasitic Diseases, 2023, 47, 12-36. [CrossRef]
- Zhao, Z.; Tang, J.; Zhang, Z.; Li, L.; Ding, Y. When self-supervised learning meets scene classification: remote sensing scene classification based on a multitask learning framework. Remote Sensing, 2020, 12(20), 3276. [CrossRef]
- Bydder, M.; Rahal, A.; Fullerton, G.D.; Cooper, T.G. The magic angle effect: a source of artifacts, a determinant of image contrast, and a technique for imaging. Journal of Magnetic Resonance Imaging: An Official Journal of the International Society for Magnetic Resonance in Medicine, 2007, 25(2), 290-300. [CrossRef]
- Zendehdel, N.; Chen, H.; Leu, M.C. Real-time tool detection in smart manufacturing using you-only-look-once (YOLO) v5. Manufacturing Letters, 2023, 35, 1052-1059. [CrossRef]
- Ghose, P.; Ghose, A.; Sadhukhan, D., et al. Improved polyp detection from colonoscopy images using finetuned YOLO-v5. Multimedia Tools and Applications, 2024, 83, 42929-42954. [CrossRef]
- Ray, S.; Alshouiliy, K.; Agrawal, D.P. Dimensionality reduction for human activity recognition using Google Colab. Information, 2020, 12(1), 6. [CrossRef]
- Liu, Q.; Zhang, Y.; Yang, G. Small unopened cotton boll counting by detection with MRF-YOLO in the wild. Computers and Electronics in Agriculture, 2023, 204, 107576. [CrossRef]
- Li, R. Artificial Intelligence Revolution: How AI Will Change Our Society, Economy, and Culture; Simon and Schuster: 2020. ISBN 9781510753006.
- Xu, X.; Zhang, X.; Zhang, T. Lite-YOLOv5: a lightweight deep learning detector for on-board ship detection in large-scene Sentinel-1 SAR images. Remote Sensing, 2022, 14(4), 1018. [CrossRef]
- Zhang, J.; Chen, Z.; Yan, G.; Wang, Y.; Hu, B. Faster and lightweight: an improved YOLOv5 object detector for remote sensing images. Remote Sensing, 2023, 15, 4974. [CrossRef]
- Badgujar, C.M.; Poulose, A.; Gan, H. Agricultural object detection with You Only Look Once (YOLO) algorithm: a bibliometric and systematic literature review. Computers and Electronics in Agriculture, 2024, 223, 109090. [CrossRef]
- Elshahawy, M.; Elnemr, A.; Oproescu, M.; Schiopu, A.G.; Elgarayhi, A.; Elmogy, M.M. Early melanoma detection based on a hybrid YOLOv5 and ResNet technique. Diagnostics, 2023, 13, 2804. [CrossRef]
- Wu, D., et al. Detection of Camellia oleifera fruit in complex scenes via YOLOv7 and data augmentation. Applied Sciences, 2022, 12(22), 11318. [CrossRef]
- Zhang, Y.; Wang, H.; Xu, R.; Yang, X.; Wang, Y.; Liu, Y. High-precision seedling detection model based on a multiactivation layer and depth-separable convolution using images acquired by drones. Drones, 2022, 6(6), 152. [CrossRef]
- Shen, L.; Lang, B.; Song, Z. Ca-YOLO: Model optimization for remote sensing image object detection. IEEE Access, 2023, 11, 26438-26450. [CrossRef]
- Isa, I.S.; Rosli, M.S.A.; Yusof, U.K.; Maruzuki, M.I.F.; Sulaiman, S.N. Optimizing the hyperparameter tuning of YOLOv5 for underwater detection. IEEE Access, 2022, 10, 52818-52831. [CrossRef]
- Benjumea, A.; Aduen, I.; Cuzzolin, F.; Bradley, A. YOLO-Z: Improving small object detection in YOLOv5 for autonomous vehicles. arXiv, 2021. [CrossRef]
- Wang, J.; Chen, Y.; Z.D., et al. Improved YOLOv5 network for real-time multiscale traffic sign detection. Neural Computing and Applications, 2023, 35, 7853-7865. [CrossRef]
- Wang, A.; Peng, T.; Cao, H.; Xu, Y.; Wei, X.; Cui, B. Tia-YOLOv5: An improved YOLOv5 network for real-time detection of crop and weed in the field. Frontiers in Plant Science, 2022, 13, 1091655. [CrossRef]
- Hasan, H.; Saad, F.; et al., S.A. Experimental validation of computer-vision methods for the successful detection of endodontic treatment obturation and progression from noisy radiographs. Oral Radiology, 2023, 39, 683-698. [CrossRef]
- Huang, R.; Pedoeem, J.; Chen, C. YOLO-LITE: A real-time object detection algorithm optimized for non-GPU computers. In 2018 IEEE International Conference on Big Data (Big Data); Seattle, WA, USA, 2018, pp. 2503-2510. [CrossRef]
- Du, J. Understanding of object detection based on CNN family and YOLO. Journal of Physics: Conference Series, 2018, 1004, 012029. [CrossRef]
- Redmon, J. You only look once: Unified, real-time object detection. In Proceedings of the IEEE Conference on Computer Vision and Pattern Recognition; University of Washington, Allen Institute for AI, Facebook AI Research, 2016. Disponível em: http://pjreddie.com/yolo/.
- Tong, K.; Wu, Y. Deep learning-based detection from the perspective of small or tiny objects: A survey. Image and Vision Computing, 2022, 123, 104471. [CrossRef]
- Fu, X.; Wei, G.; Yuan, X.; Liang, Y.; Bo, Y. Efficient YOLOv7-Drone: An enhanced object detection approach for drone aerial imagery. Drones, 2023, 7(10), 616. [CrossRef]
- Cai, H.; Shangguan, H.; Wang, L. PC-Yolo: Enhanced YOLOv5-based defect detection system with improved partial convolution for ham sausage inspection. In Fourth International Conference on Computer Vision and Pattern Analysis (ICCPA 2024); SPIE, 2024, pp. 451-459. [CrossRef]
- Ma, S.; Lu, H.; Liu, J.; Zhu, Y.; Sang, P. LAYN: Lightweight Multi-Scale Attention YOLOv8 Network for Small Object Detection. IEEE Access, 2024, 12, 29294-29307. [CrossRef]
- Geng, X.; Su, Y.; Cao, X., et al. YOLOFM: an improved fire and smoke object detection algorithm based on YOLOv5n. Scientific Reports, 2024, 14, 4543. [CrossRef]
- Xiong, C.; Zayed, T.; Abdelkader, E.M. A novel YOLOv8-GAMWise-IoU model for automated detection of bridge surface cracks. Construction and Building Materials, 2024, 414, 135025. [CrossRef]
Figure 1.
Life cycle of myxosporeans. A—Annelid or Ectoprocta (definitive host); B—Actinosporidian; C—Fish (intermediate host); D—Myxosporean.
Figure 1.
Life cycle of myxosporeans. A—Annelid or Ectoprocta (definitive host); B—Actinosporidian; C—Fish (intermediate host); D—Myxosporean.
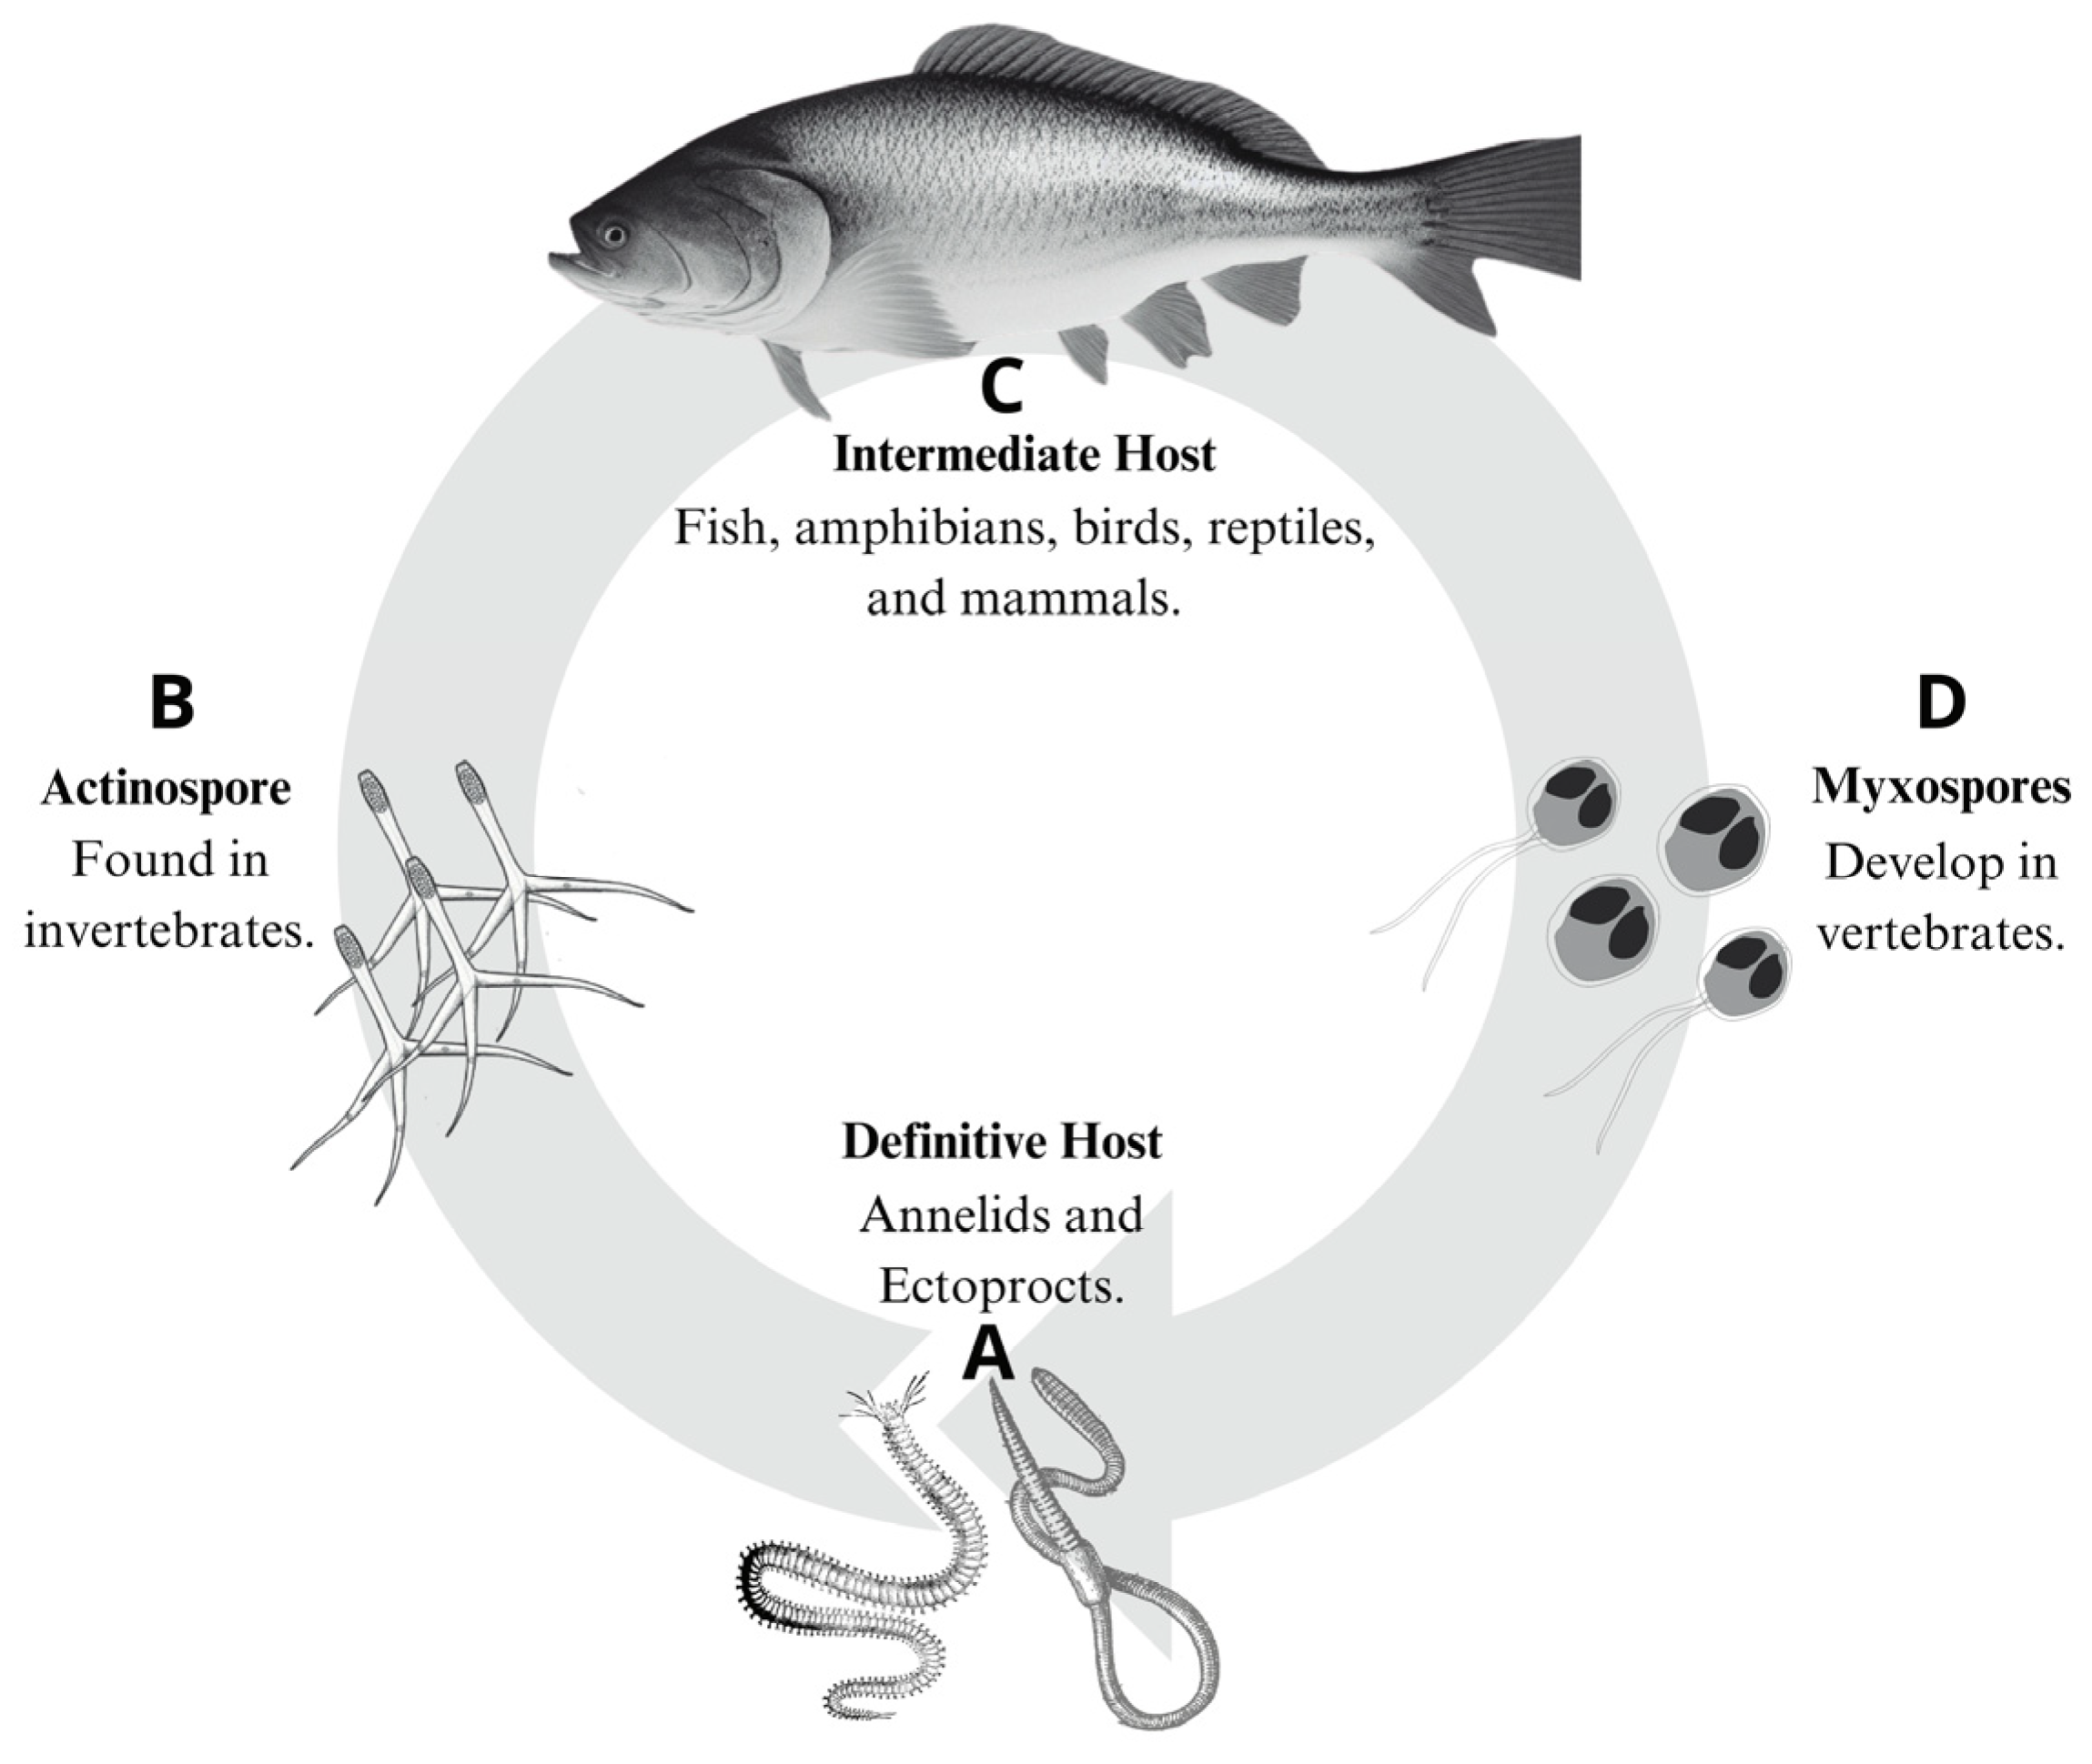
Figure 2.
Pipeline for Data Collection and Dataset Creation: Schematic representation of the steps involved in collecting parasitological data from fish, obtaining microscopic images, and labeling objects of interest for model training.
Figure 2.
Pipeline for Data Collection and Dataset Creation: Schematic representation of the steps involved in collecting parasitological data from fish, obtaining microscopic images, and labeling objects of interest for model training.
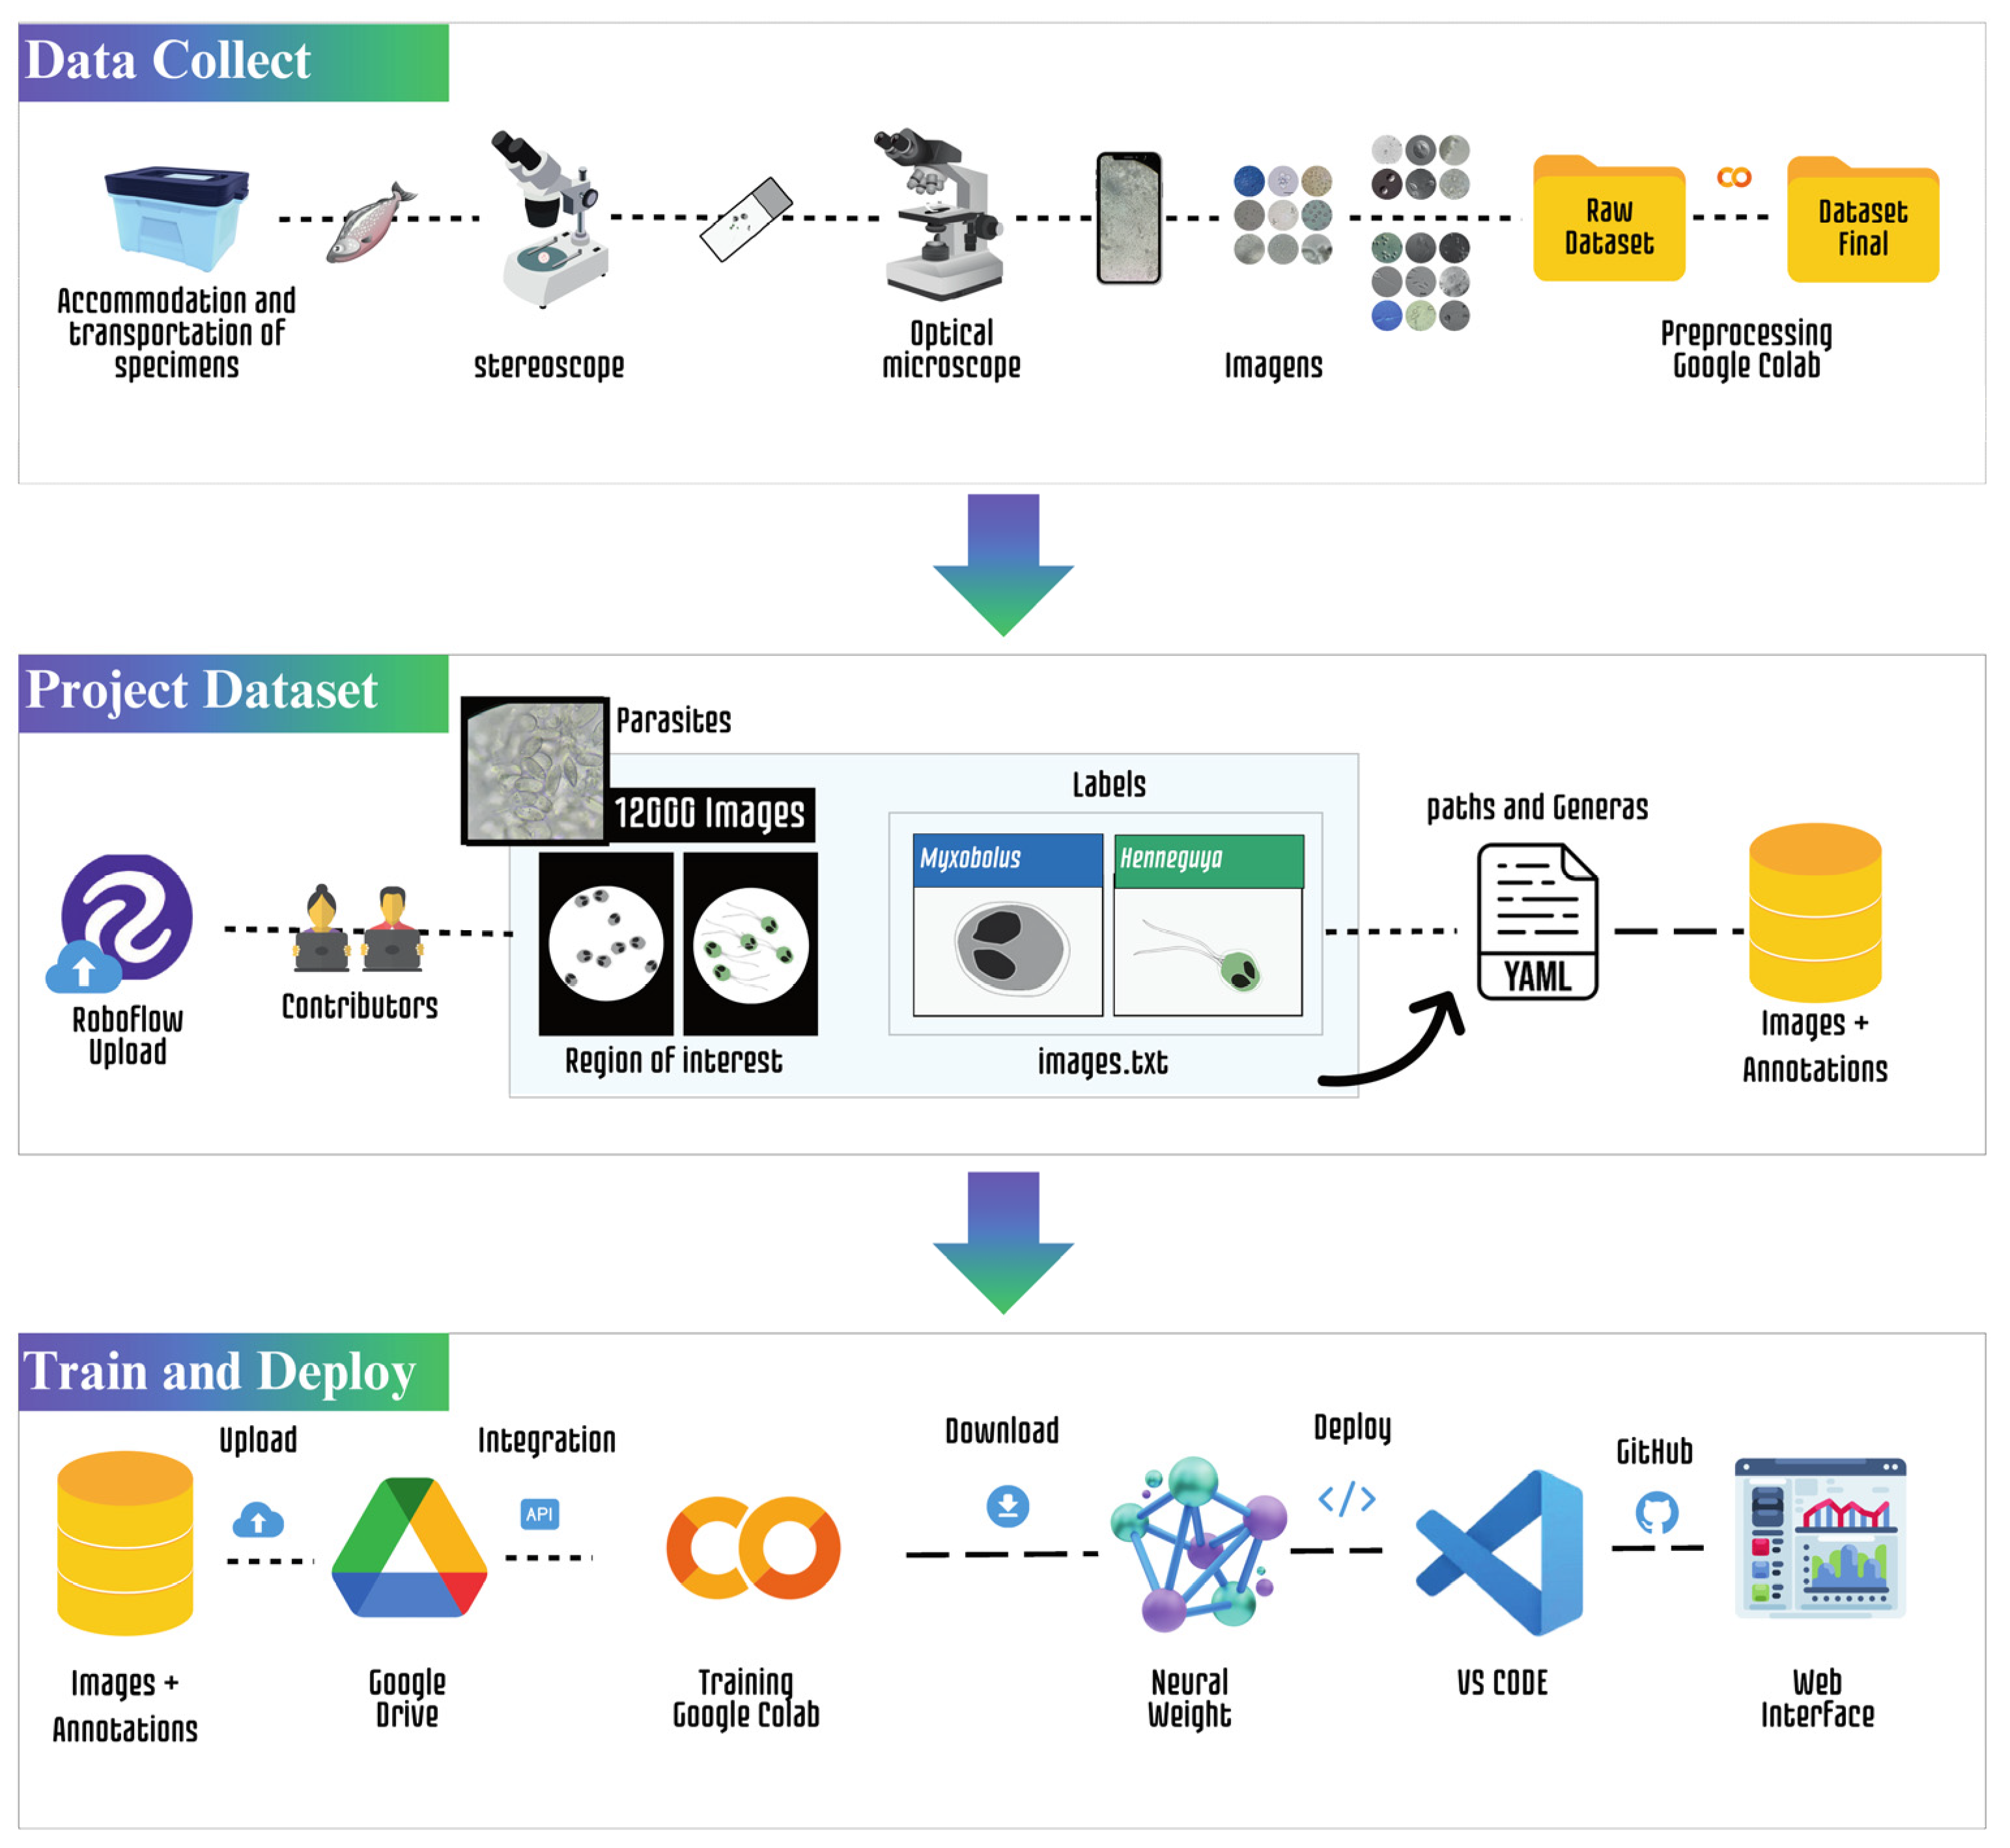
Figure 3.
Statistical Analysis of Labels, Histogram of Genus (a) and Density Map of Bounding Box Sizes (b).
Figure 3.
Statistical Analysis of Labels, Histogram of Genus (a) and Density Map of Bounding Box Sizes (b).
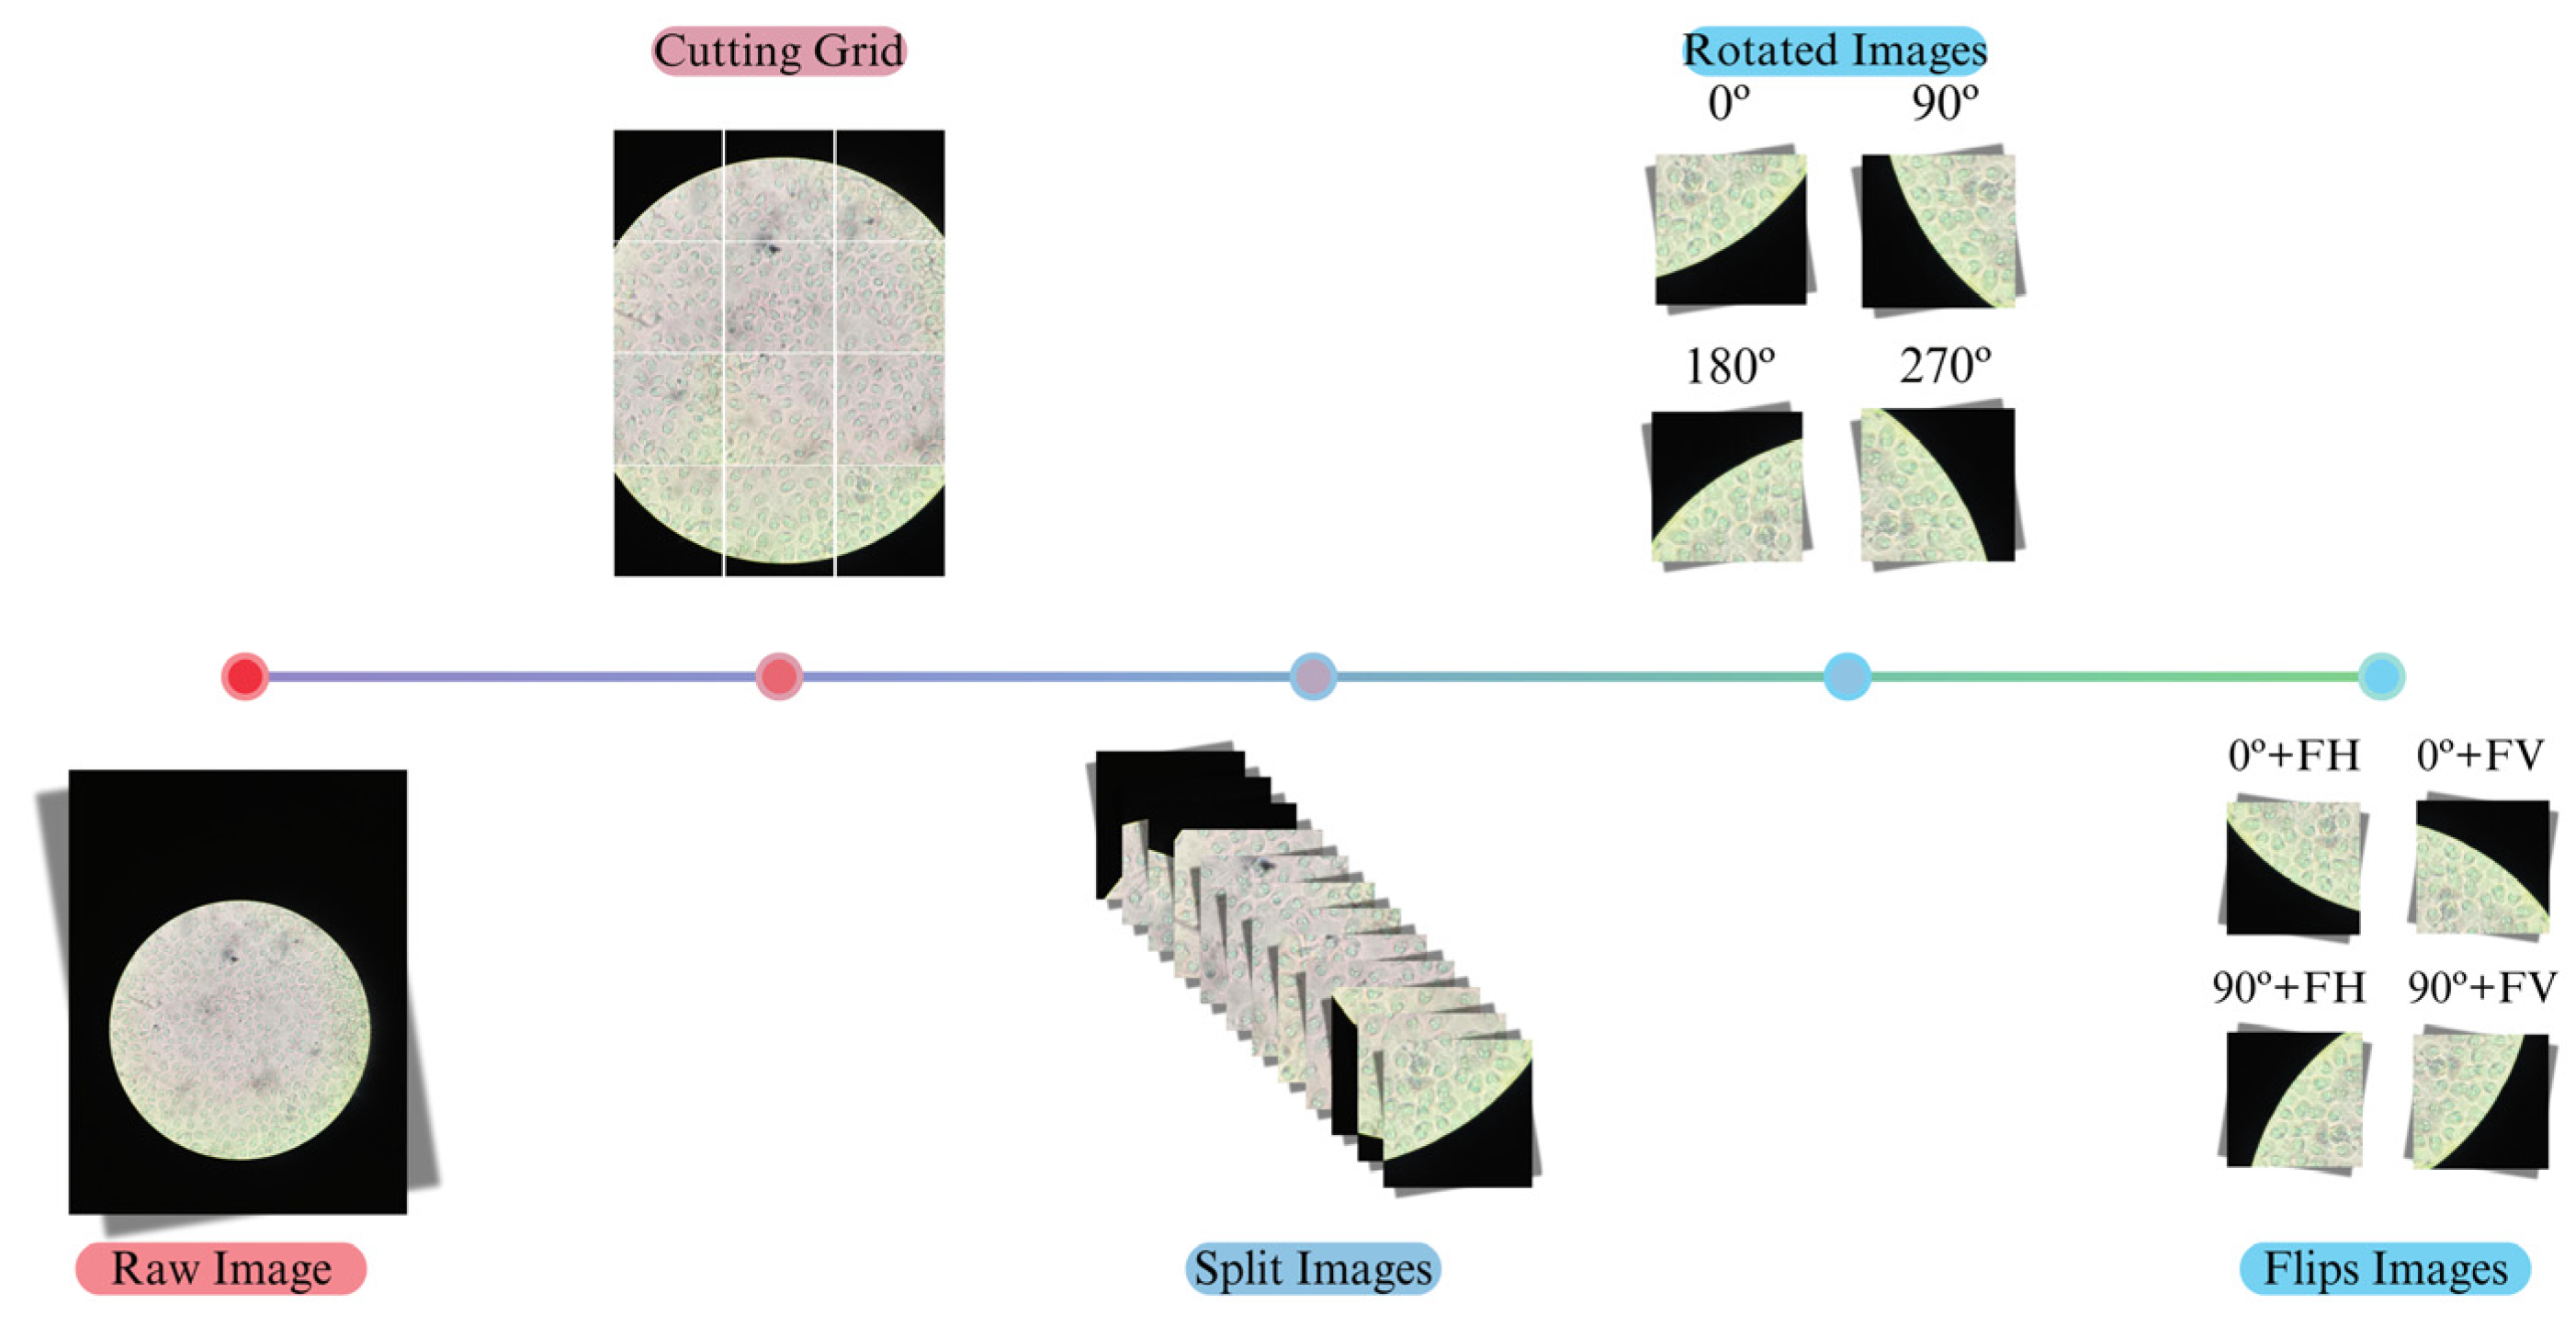
Figure 4.
Object Parameters in Images—Coordinates and dimensions (x, y, width, height) of objects detected in an image.
Figure 4.
Object Parameters in Images—Coordinates and dimensions (x, y, width, height) of objects detected in an image.
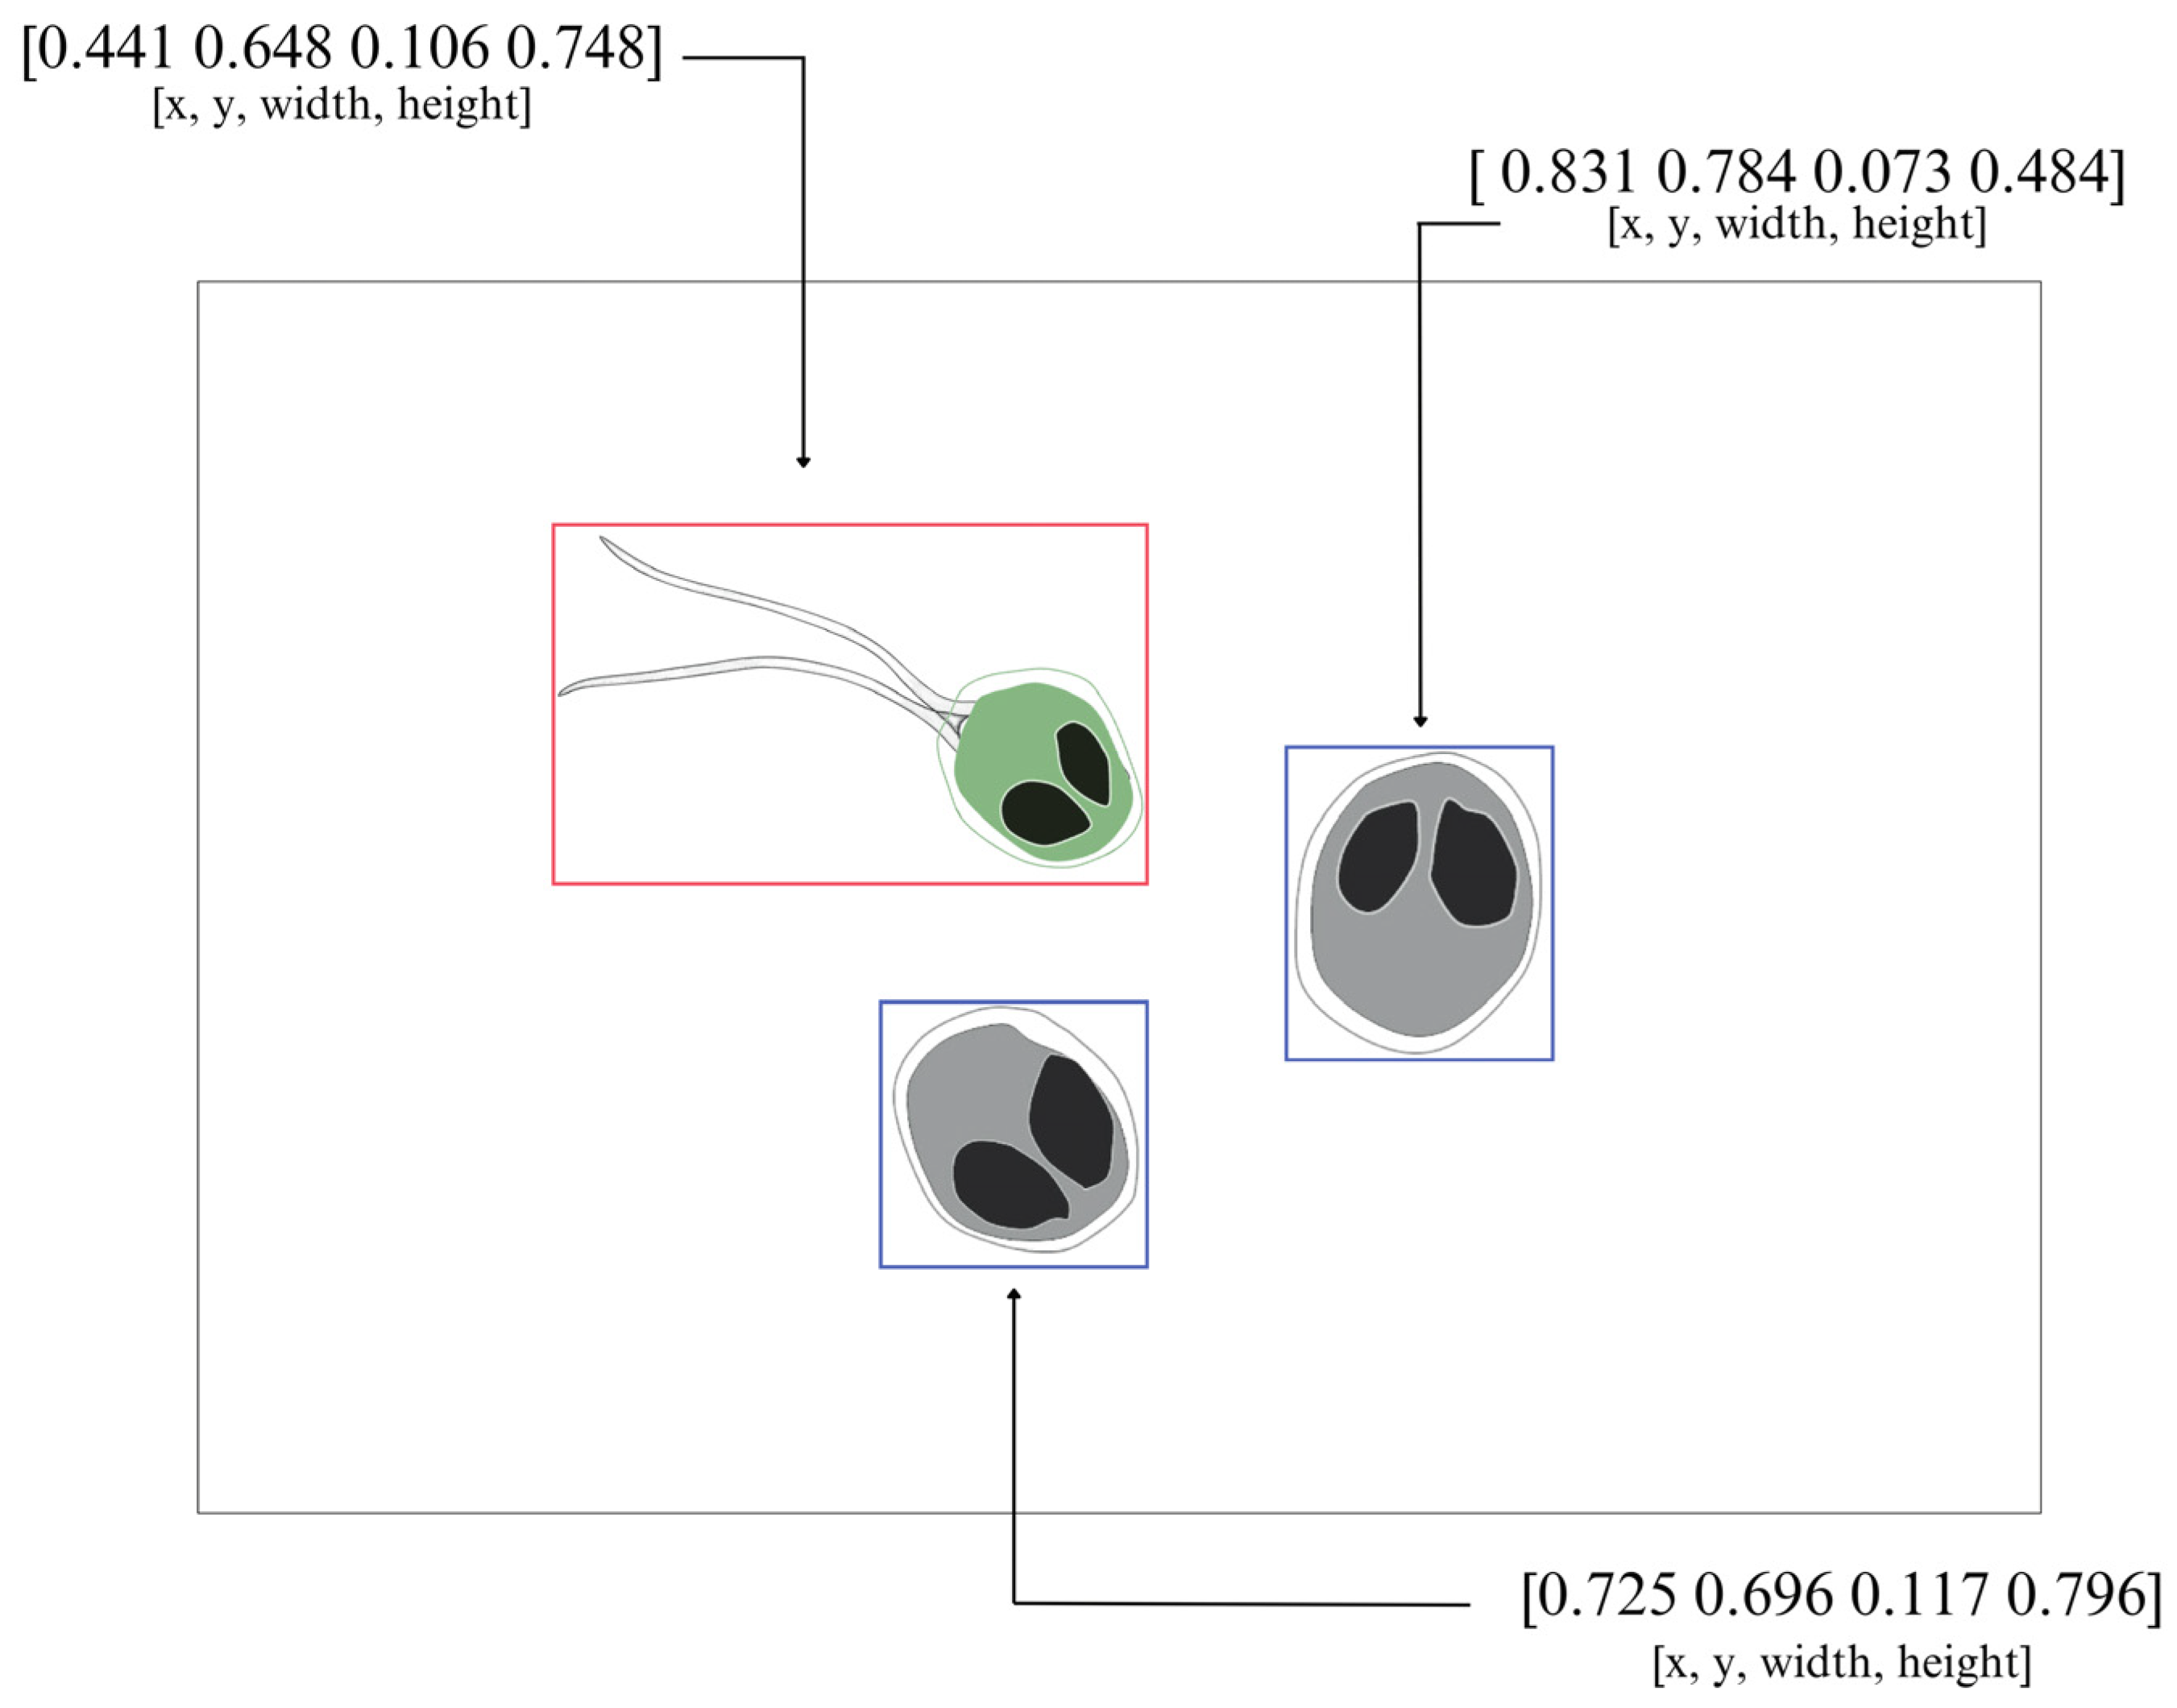
Figure 5.
Statistical Analysis of Labels, Histogram of Genus (a) and Density Map of Bounding Box Sizes (b).
Figure 5.
Statistical Analysis of Labels, Histogram of Genus (a) and Density Map of Bounding Box Sizes (b).
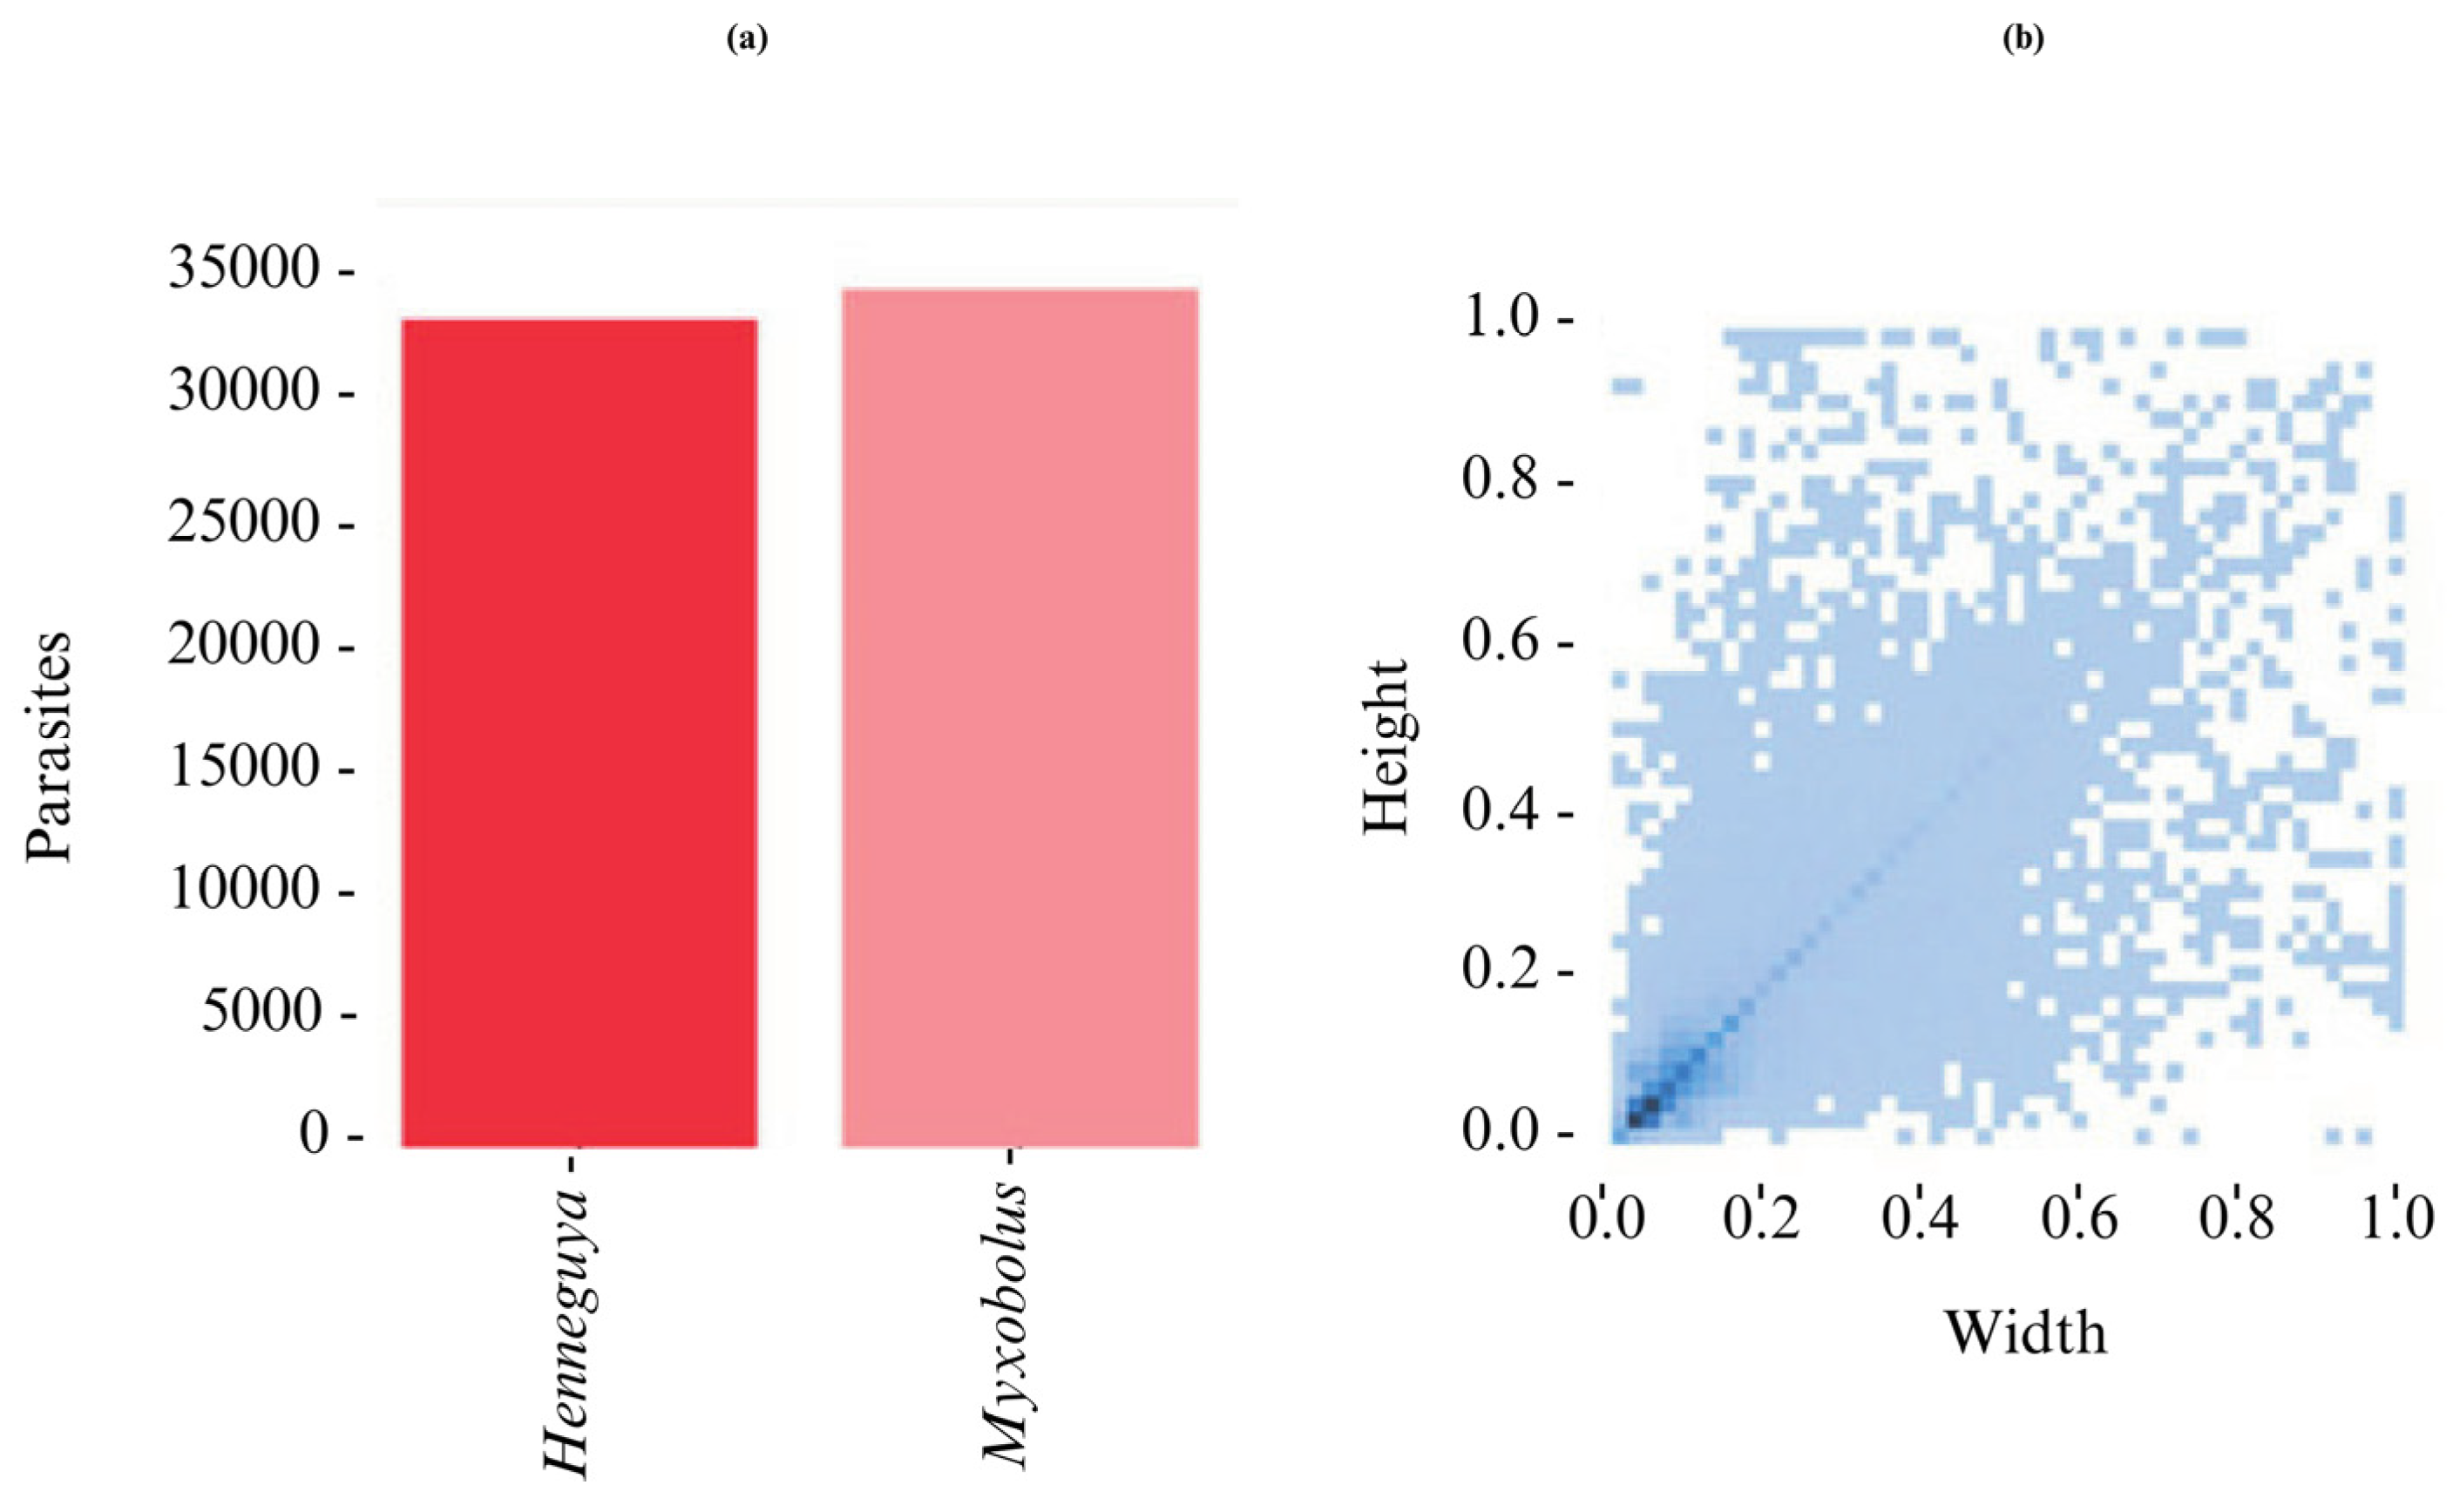
Figure 6.
YOLOv5 (s,n,m and l), Training Time(TT); Model Size(TM) and GPU Memory Usage (UM), features normalized by the number of epochs.
Figure 6.
YOLOv5 (s,n,m and l), Training Time(TT); Model Size(TM) and GPU Memory Usage (UM), features normalized by the number of epochs.
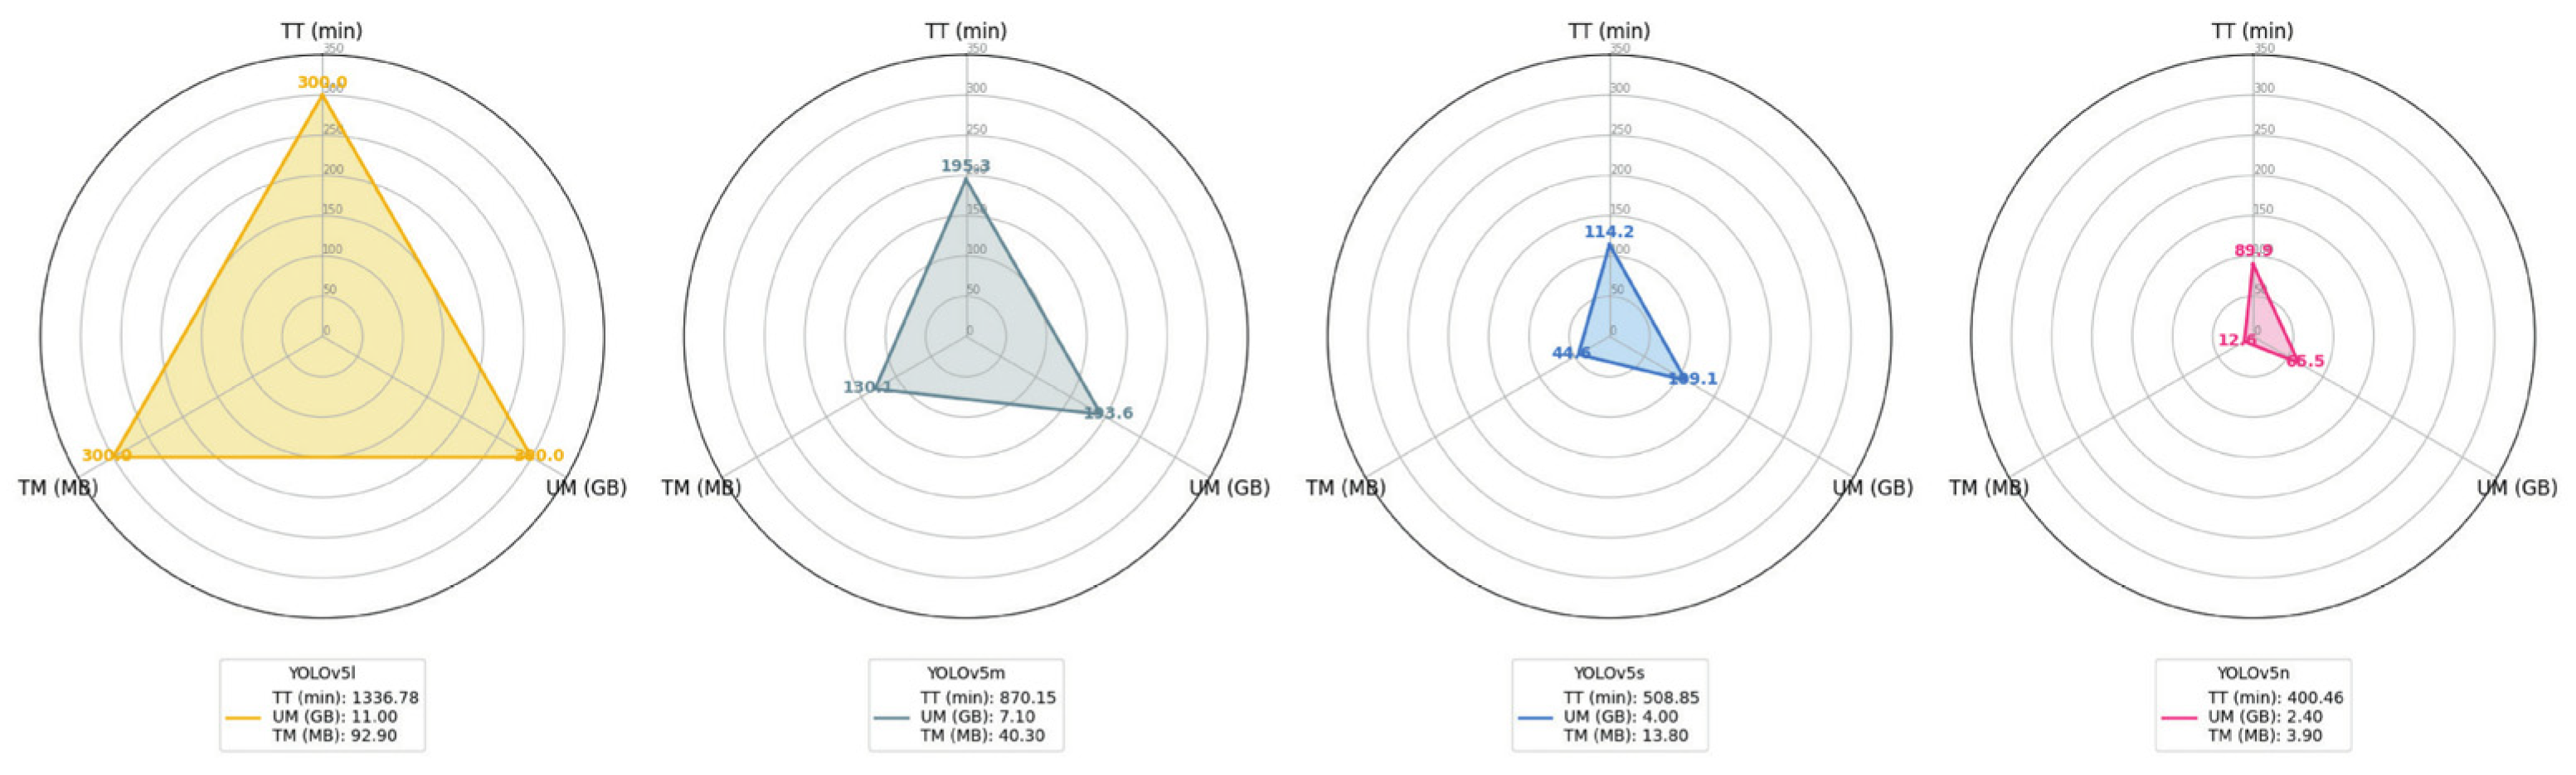
Figure 7.
YOLOv5 Models—(a) Precision Across Epochs, (b) Recall Across Epochs, (c) mAP@0.5 Across Epochs, and (d) mAP@0.5:0.95 Across Epochs.
Figure 7.
YOLOv5 Models—(a) Precision Across Epochs, (b) Recall Across Epochs, (c) mAP@0.5 Across Epochs, and (d) mAP@0.5:0.95 Across Epochs.
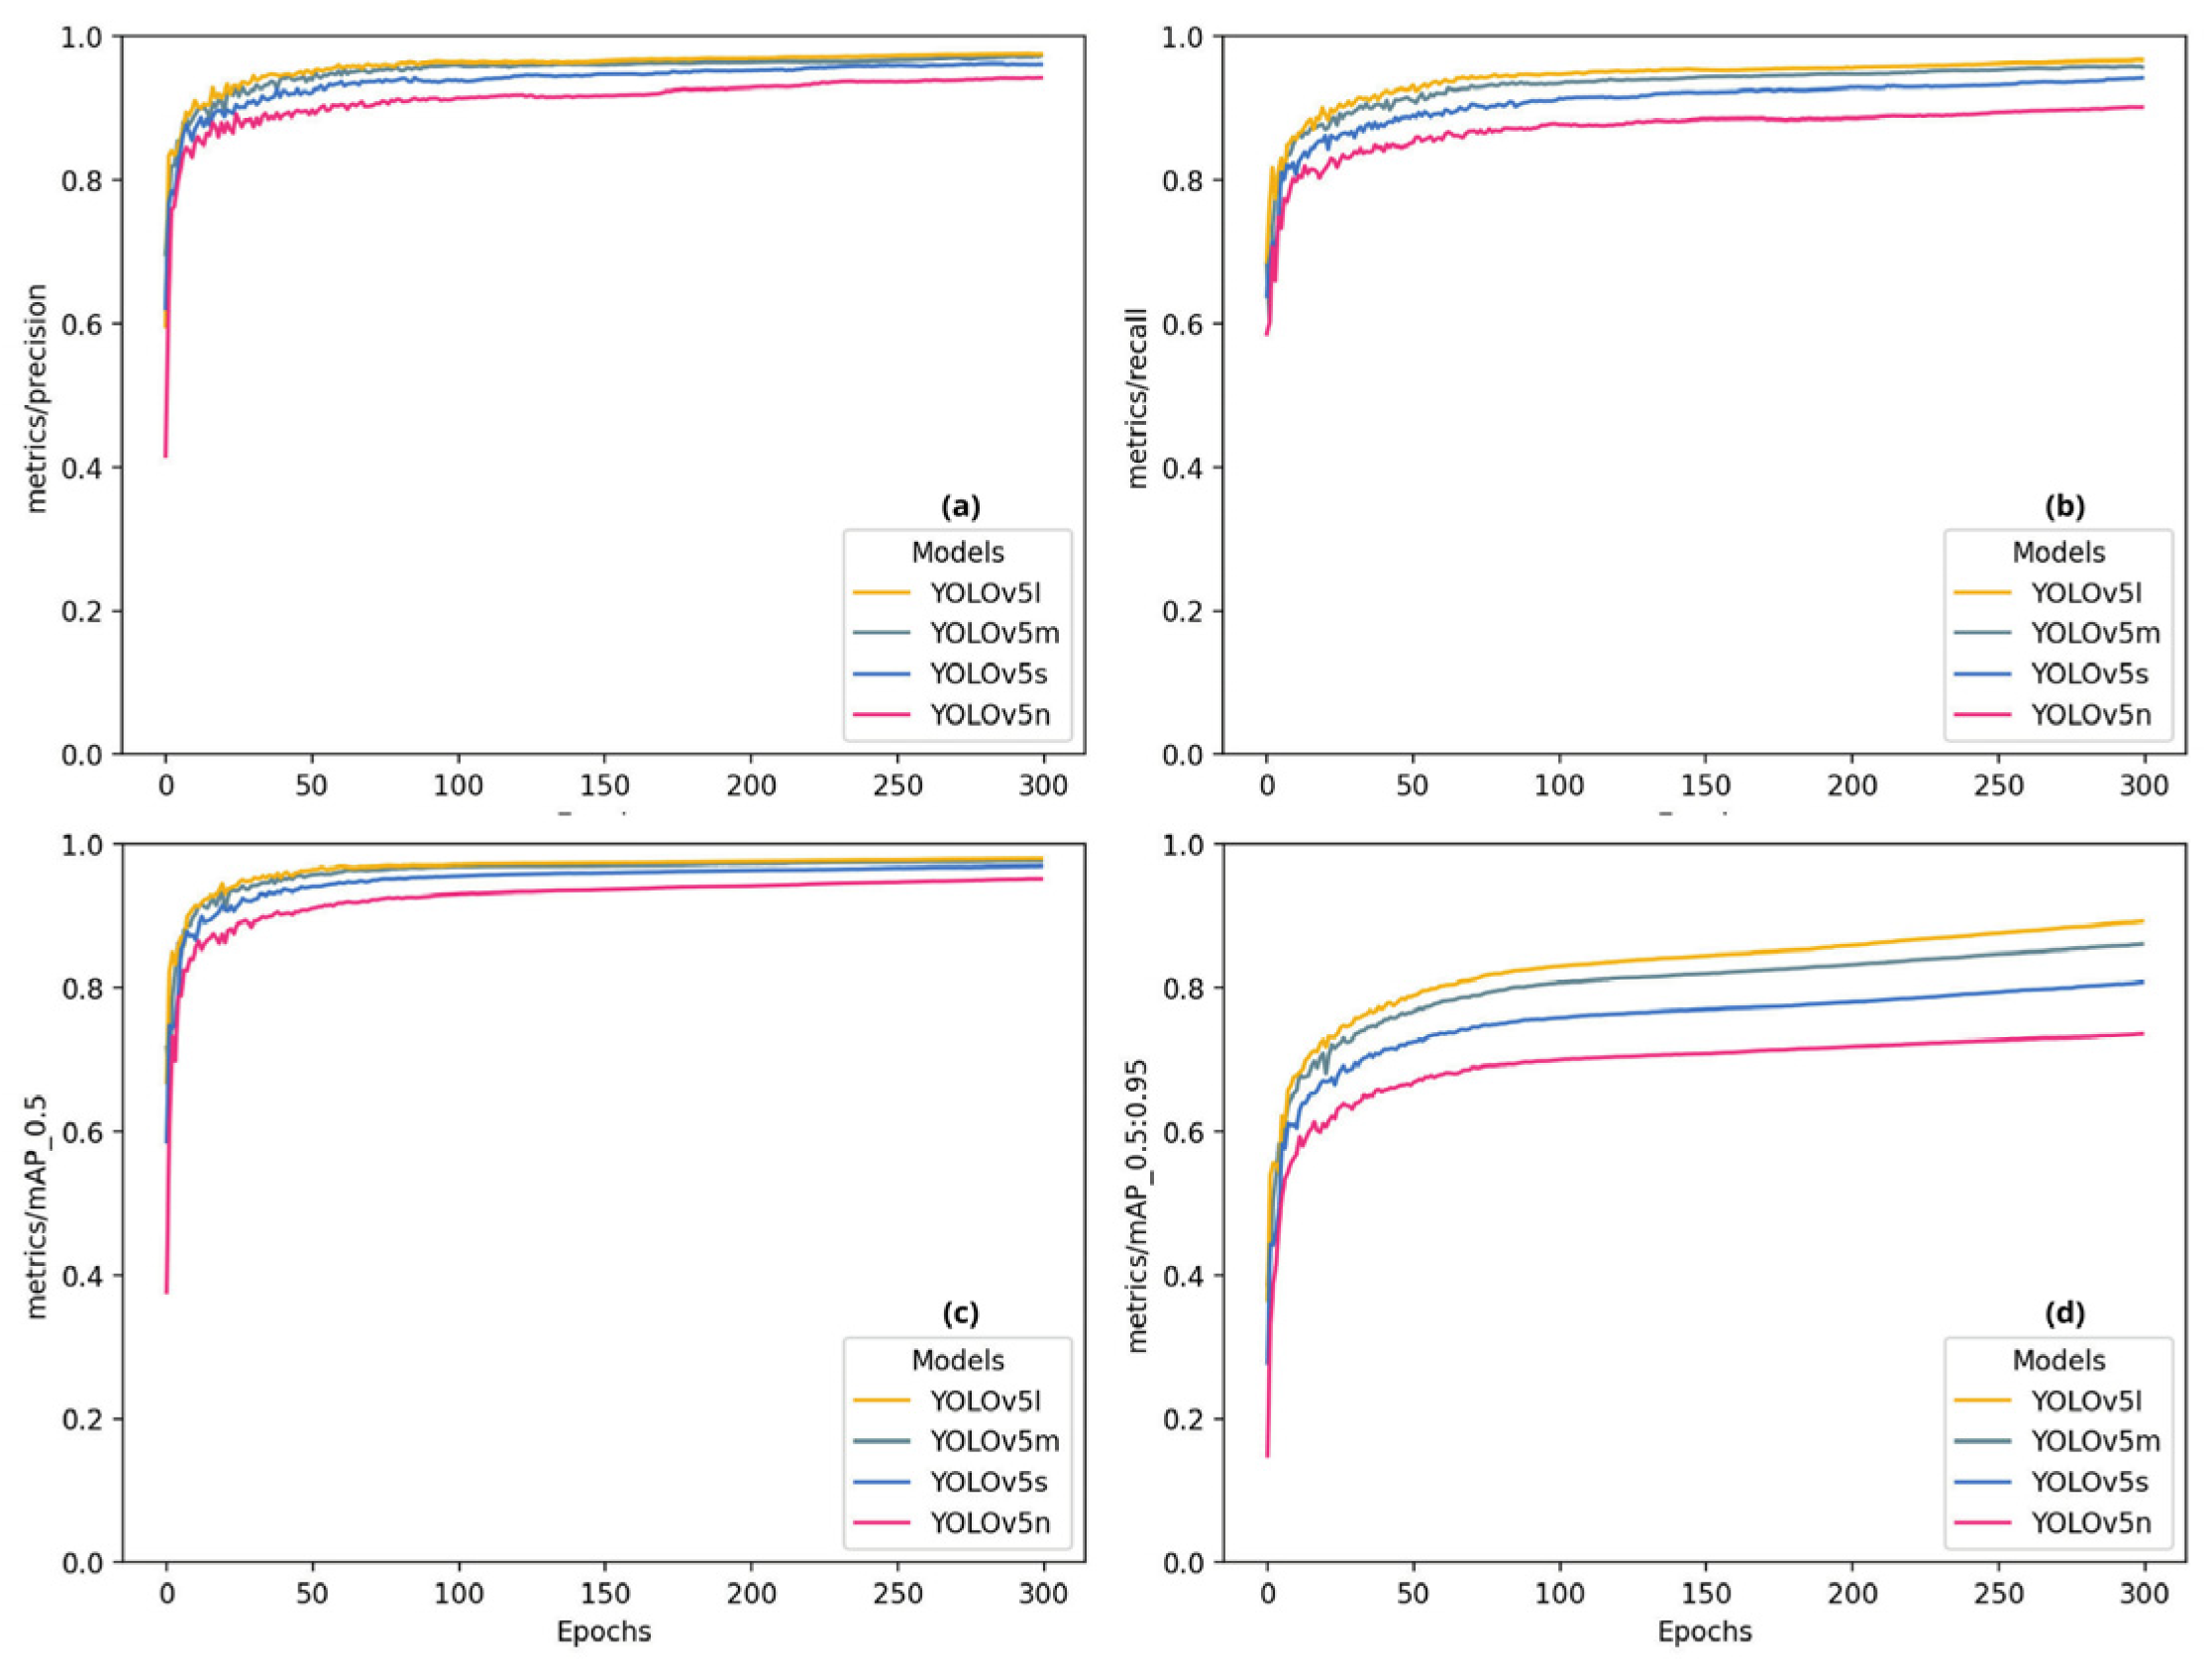
Figure 8.
YOLOv5 Models—YOLOv5 Models—(a) Training Box Loss Across Epochs, (b) Training Classification Loss Across Epochs, (c) Training Object Loss Across Epochs.
Figure 8.
YOLOv5 Models—YOLOv5 Models—(a) Training Box Loss Across Epochs, (b) Training Classification Loss Across Epochs, (c) Training Object Loss Across Epochs.

Figure 9.
YOLOv5 Models—YOLOv5 Models—(a) Training Box Loss Across Epochs, (b) Training Classification Loss Across Epochs, (c) Training Object Loss Across Epochs.
Figure 9.
YOLOv5 Models—YOLOv5 Models—(a) Training Box Loss Across Epochs, (b) Training Classification Loss Across Epochs, (c) Training Object Loss Across Epochs.
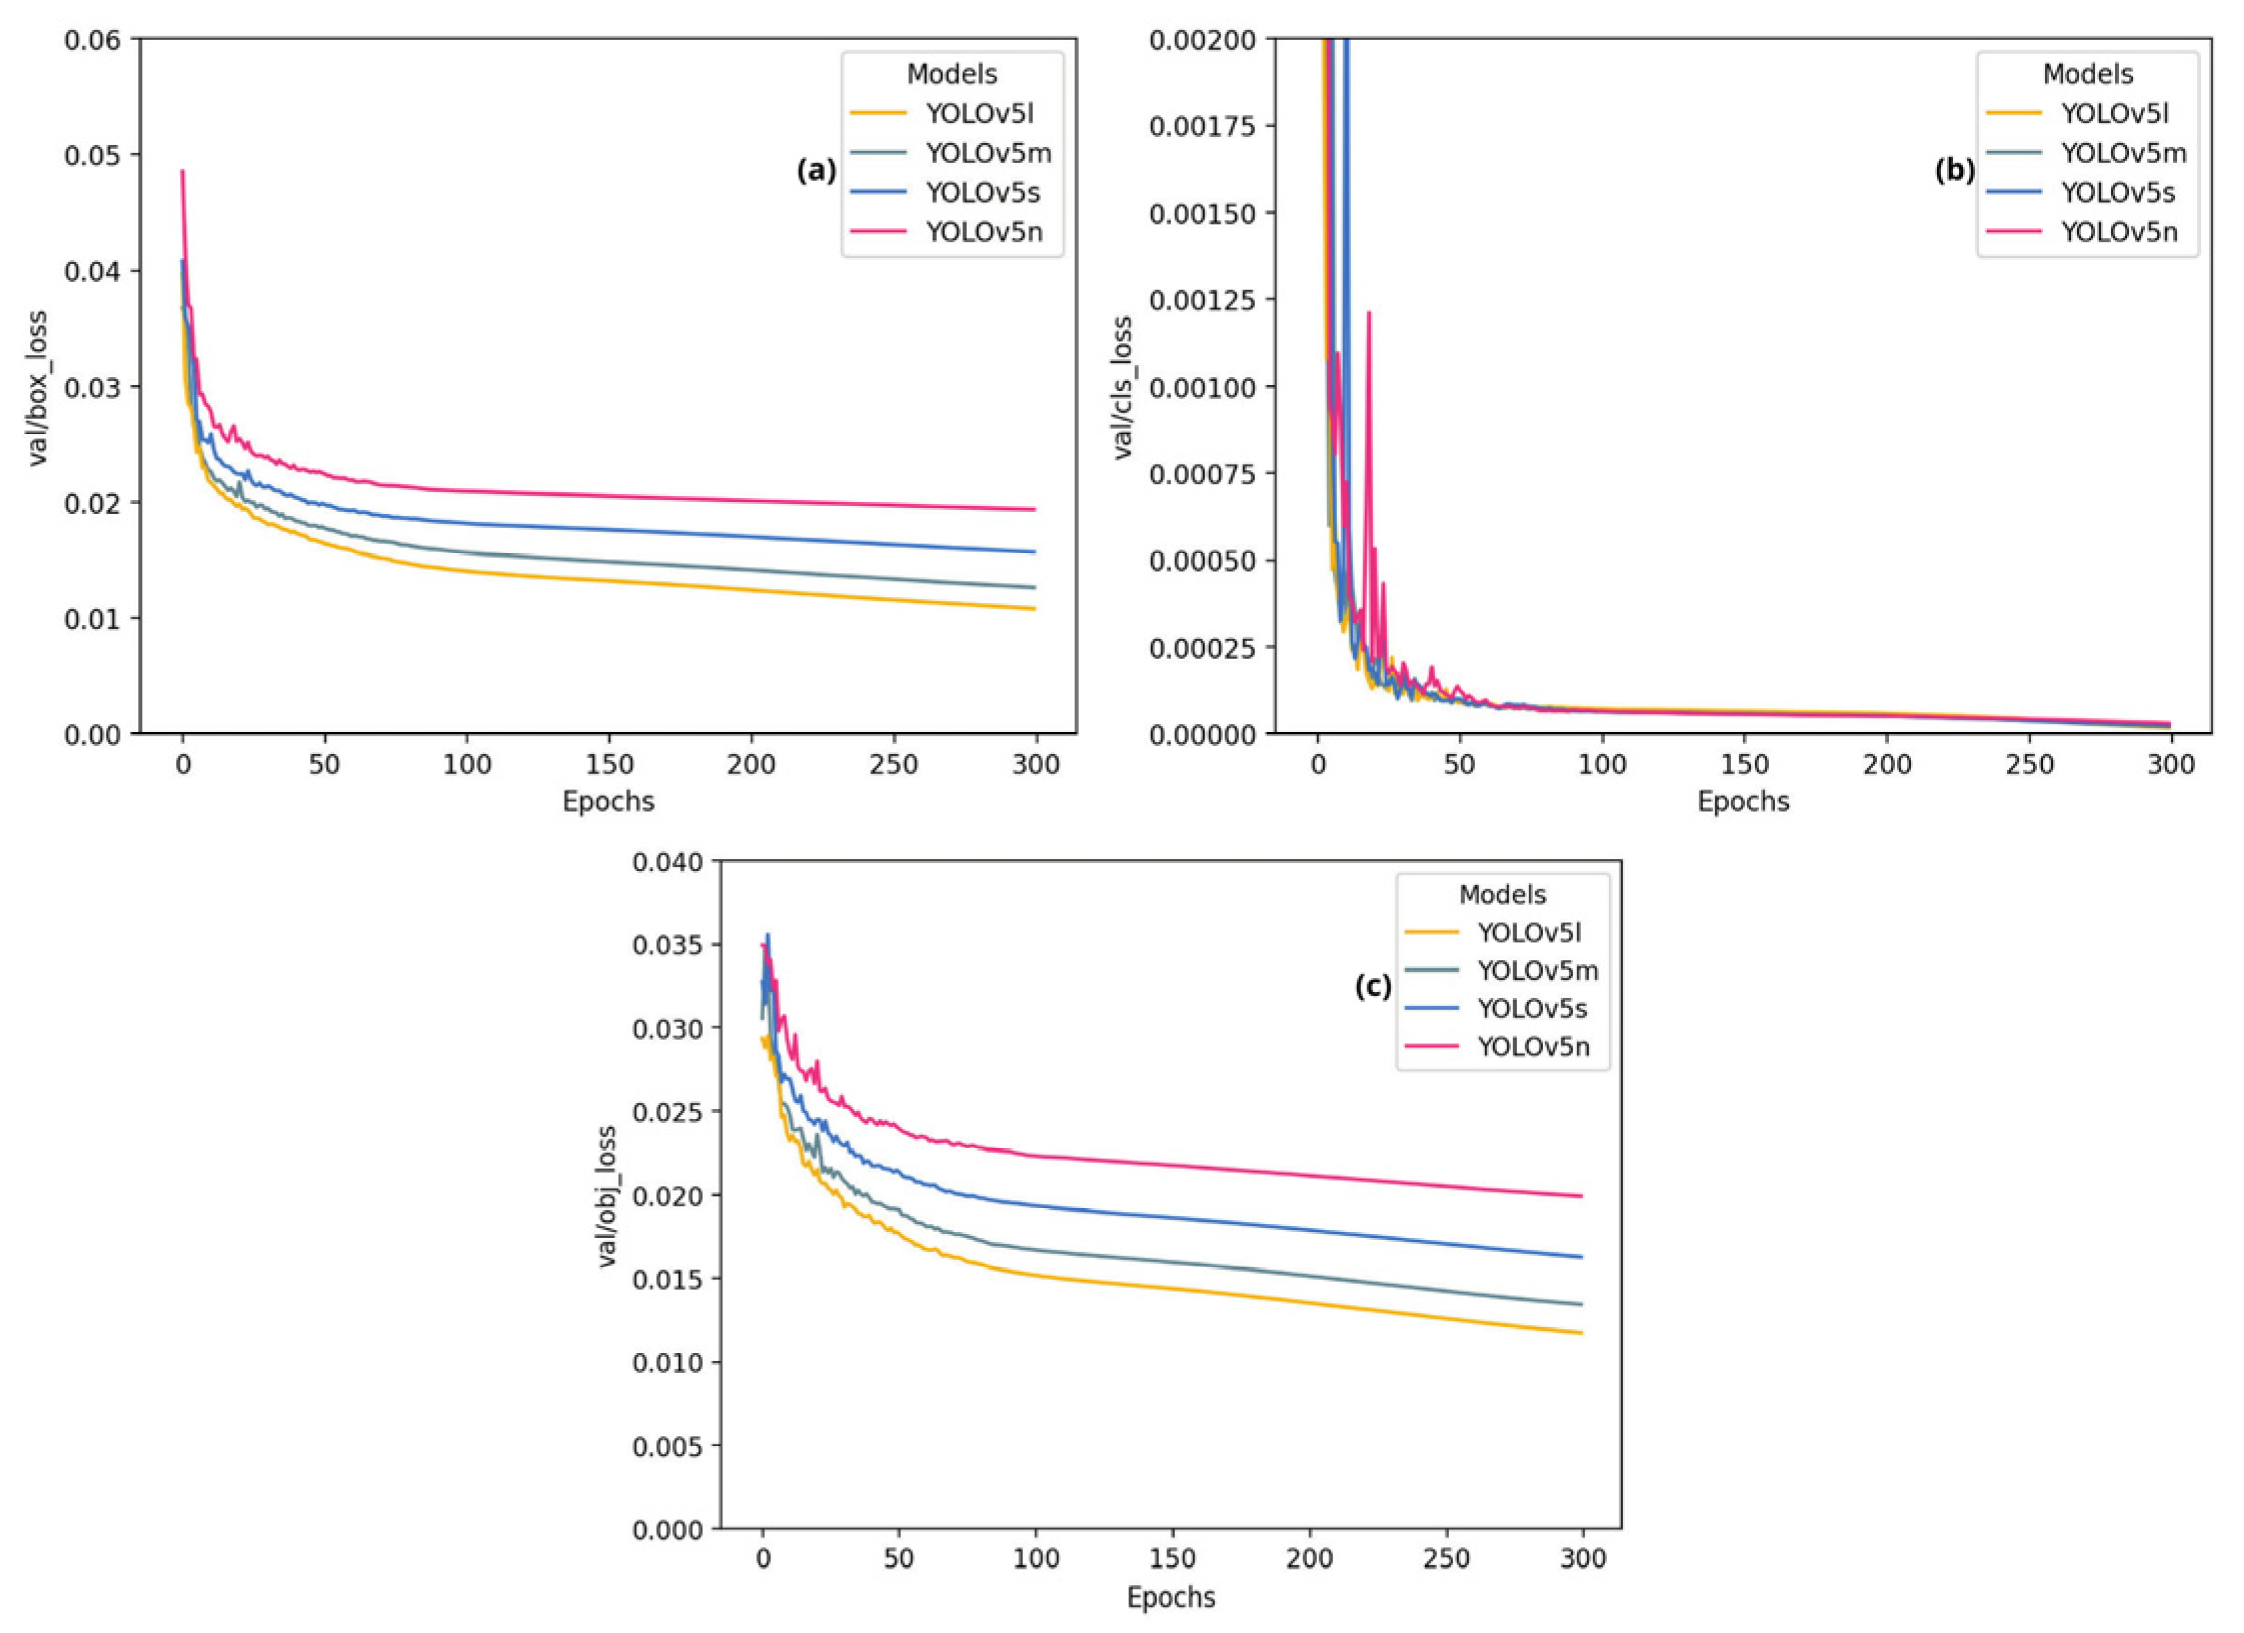
Figure 10.
Performance of YOLOv5 Models in Distinguishing Between Henneguya, Myxobolus, and Background. (a) Precision and recall, showing the balance between true positive detections and model robustness, analyzed alongside the YOLOv5l model confusion matrix Figure 11 (c). (b) Precision and confidence, illustrating the model’s certainty in detecting each genus relative to the background, for the YOLOv5l model.
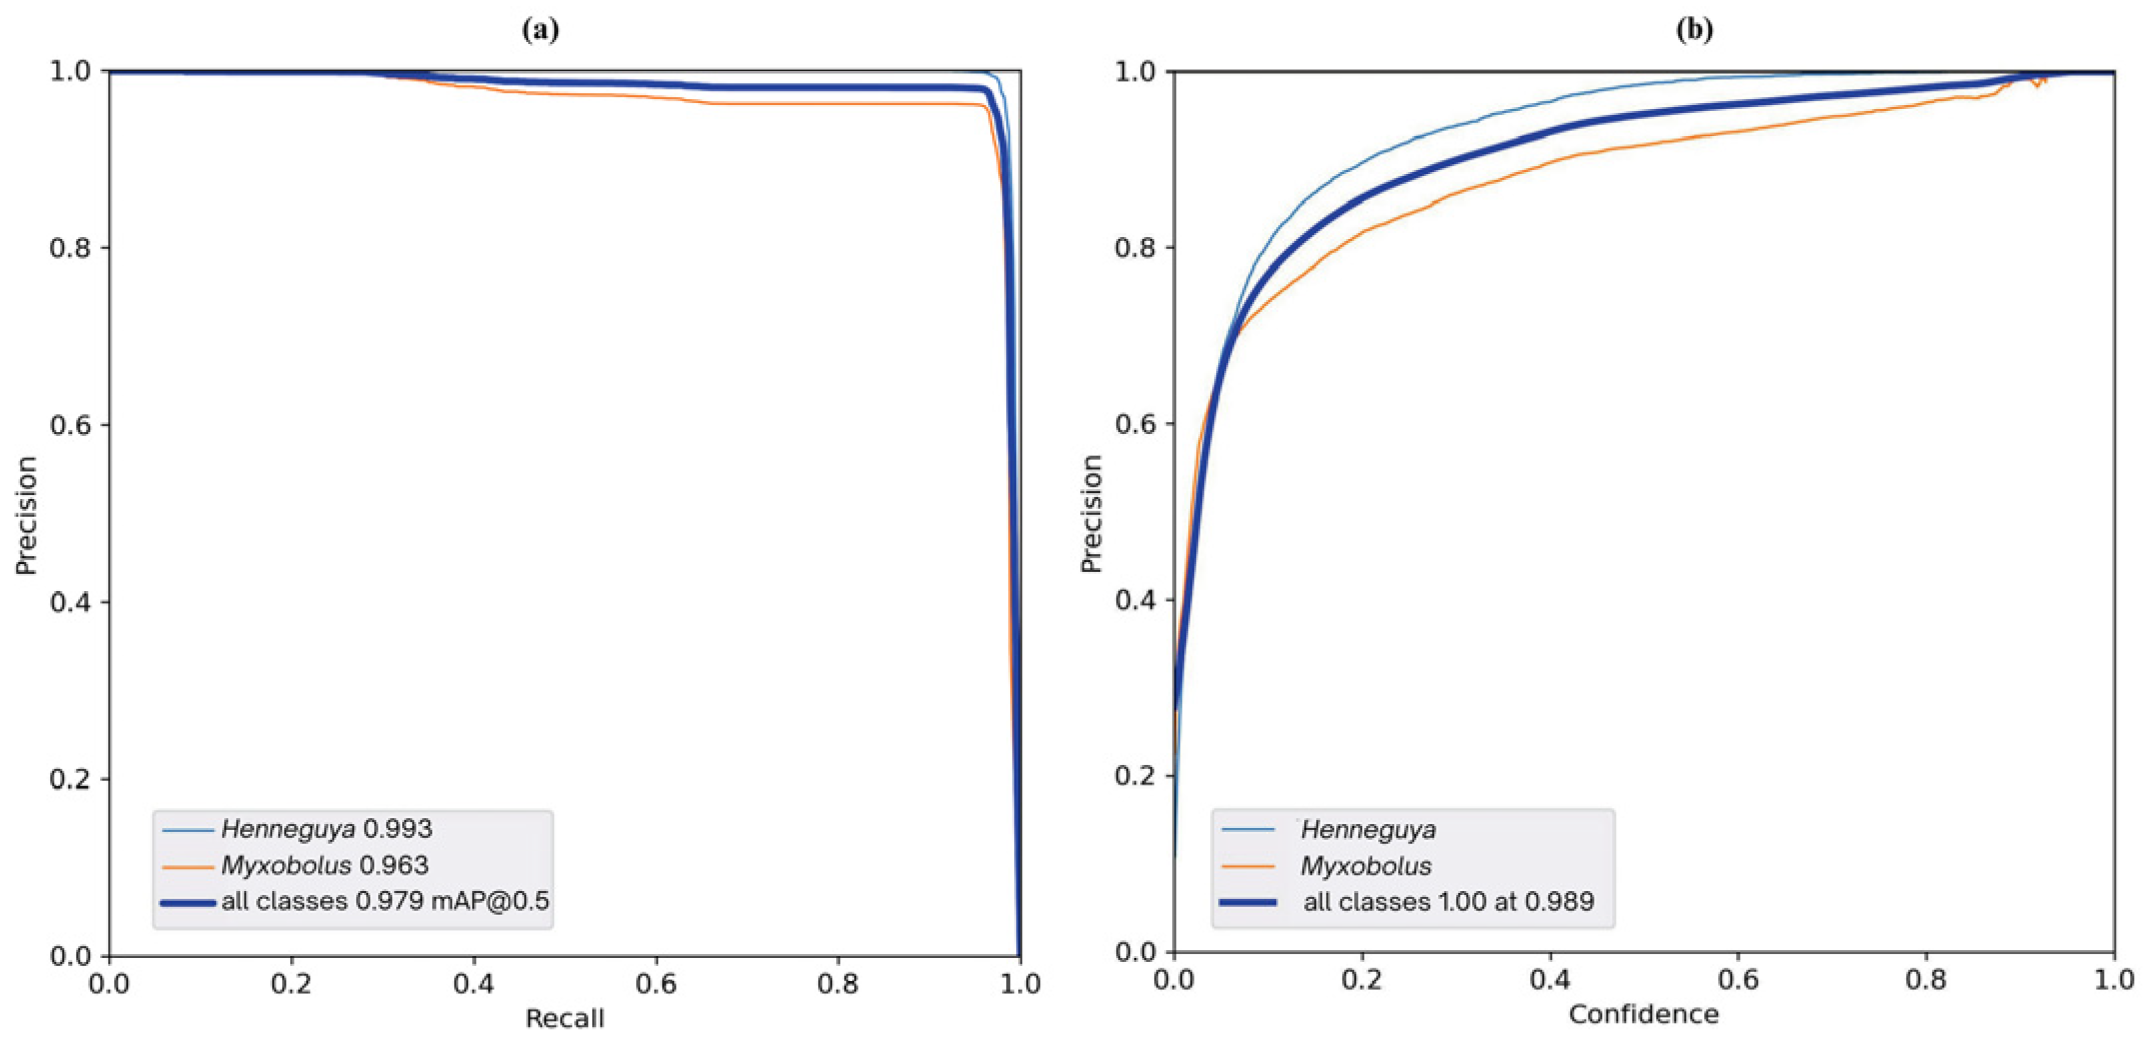
Figure 11.
Confusion matrix for parameter detection with YOLOv5—Performance of different versions of the YOLOv5 model (n, s, l, m) in detecting the Henneguya, Myxobolus and Background categories.
Figure 11.
Confusion matrix for parameter detection with YOLOv5—Performance of different versions of the YOLOv5 model (n, s, l, m) in detecting the Henneguya, Myxobolus and Background categories.
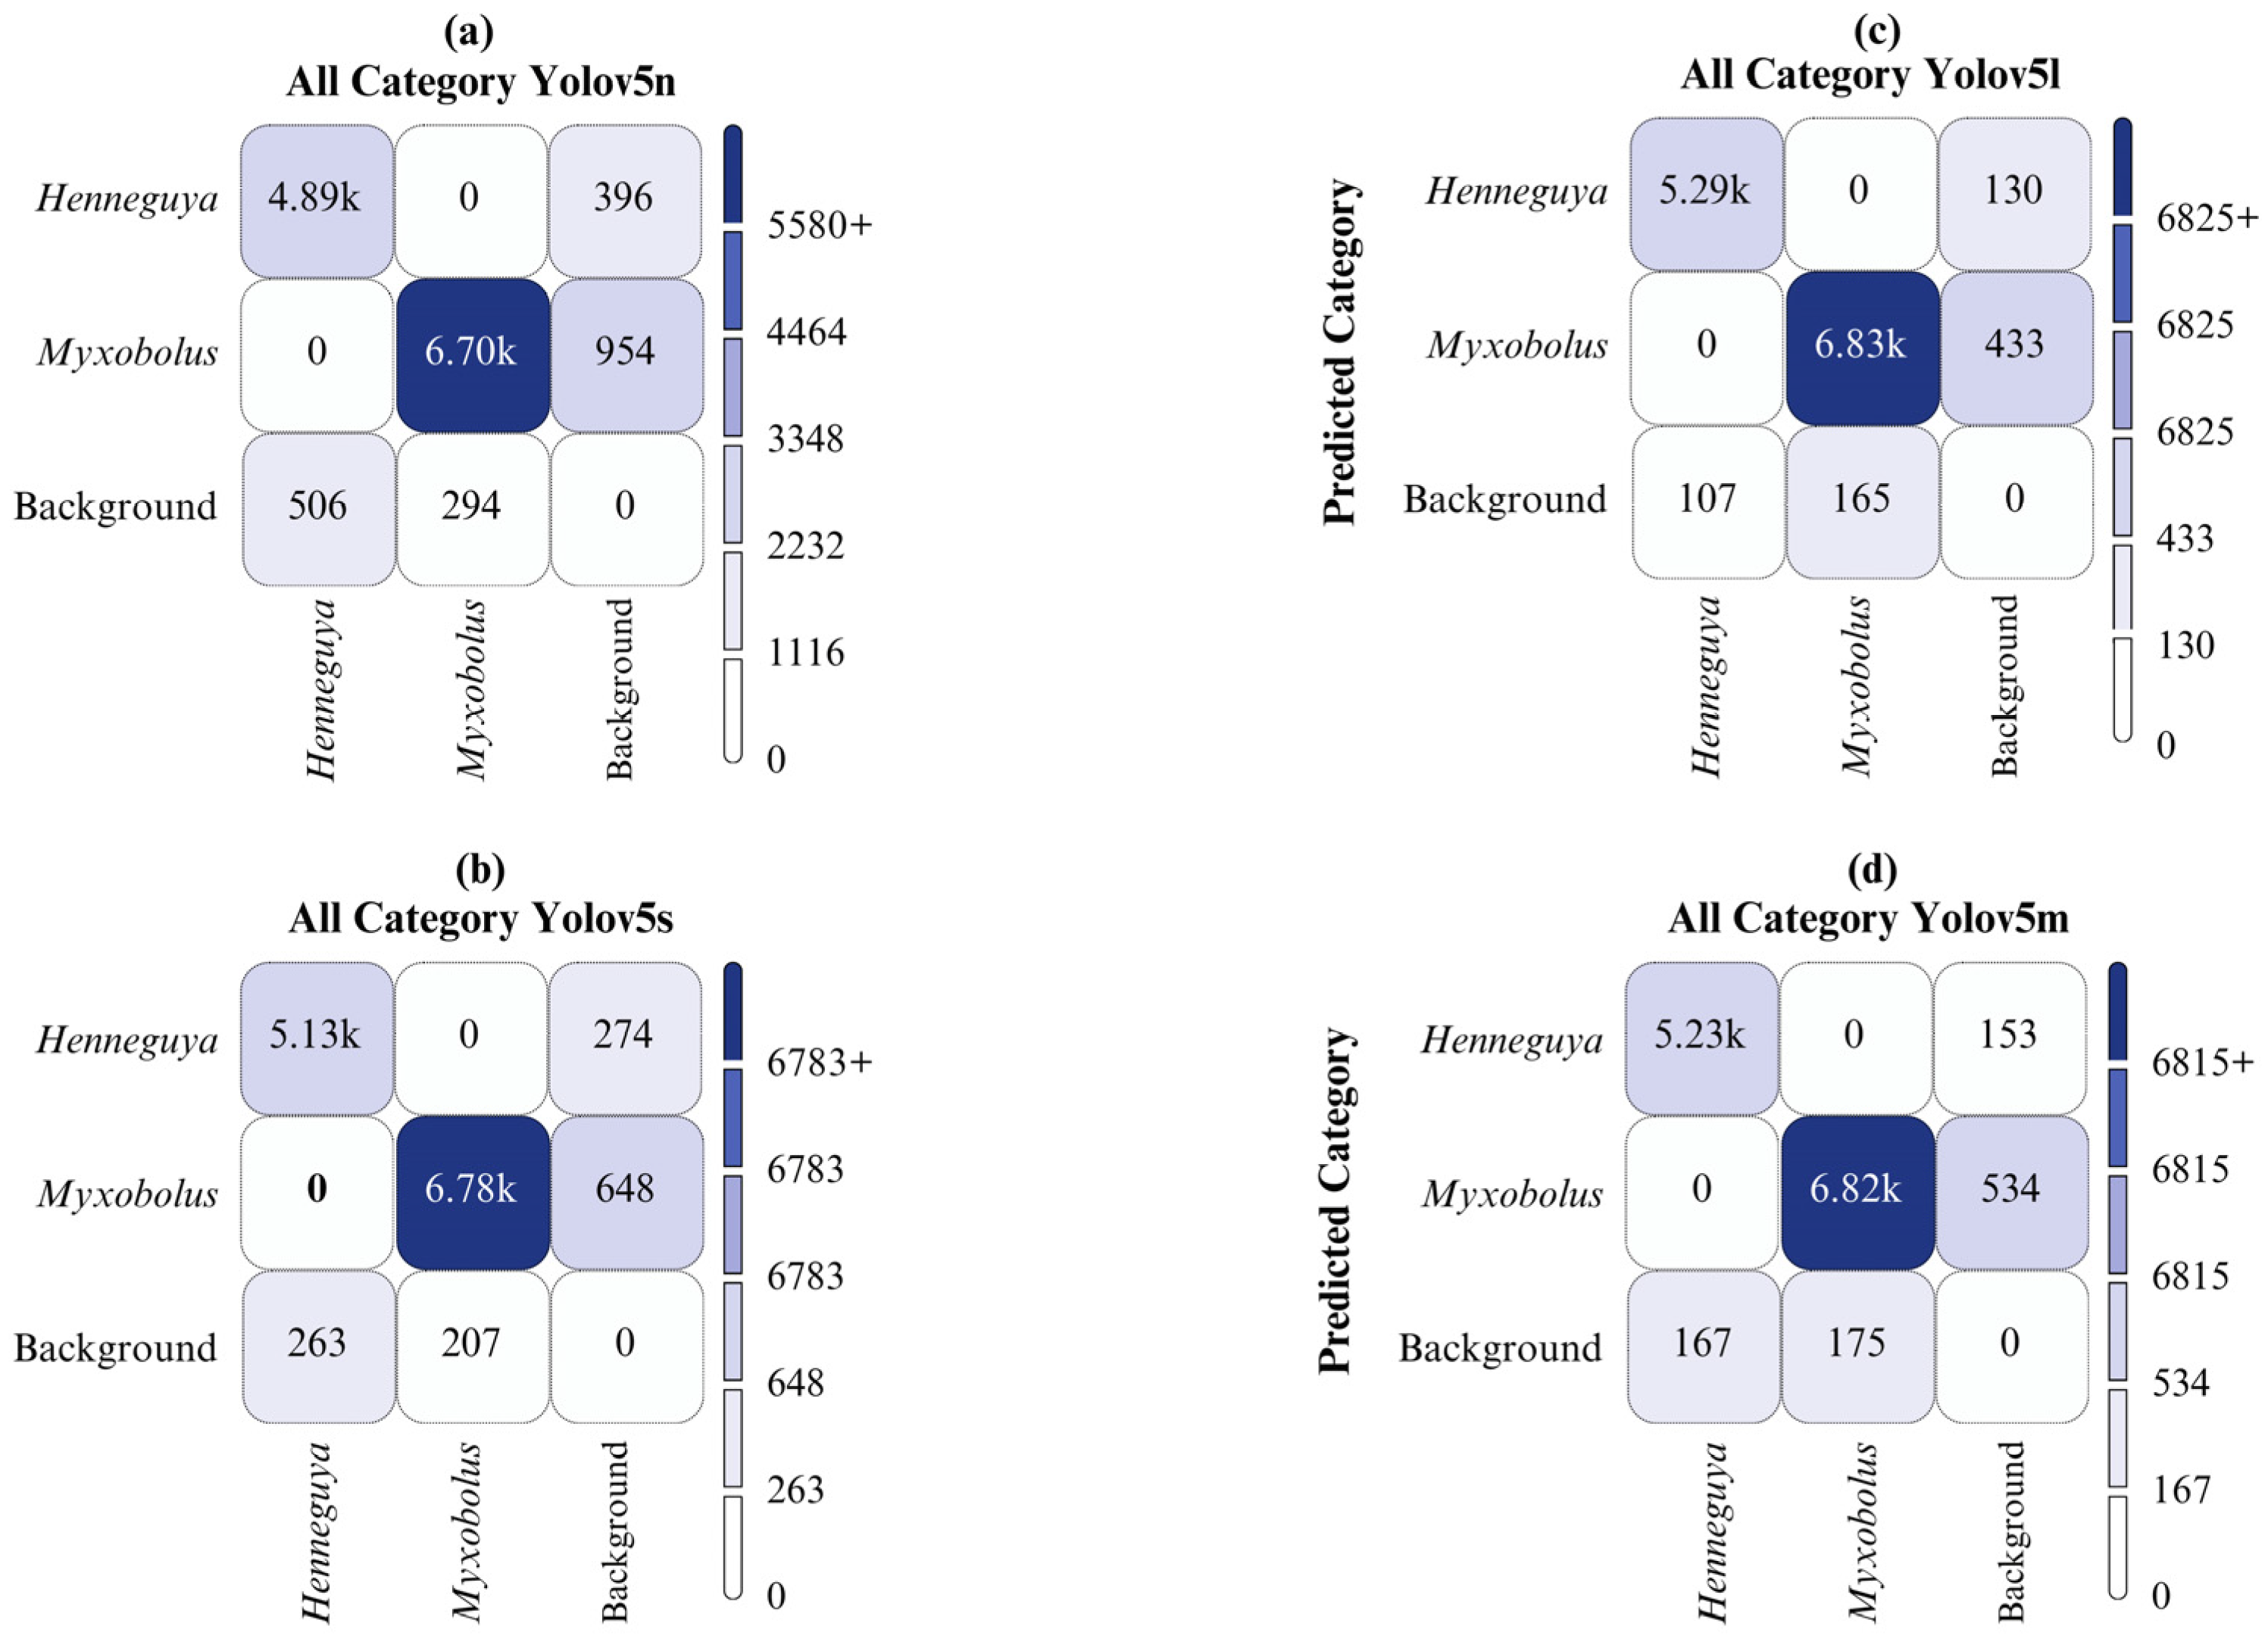
Figure 12.
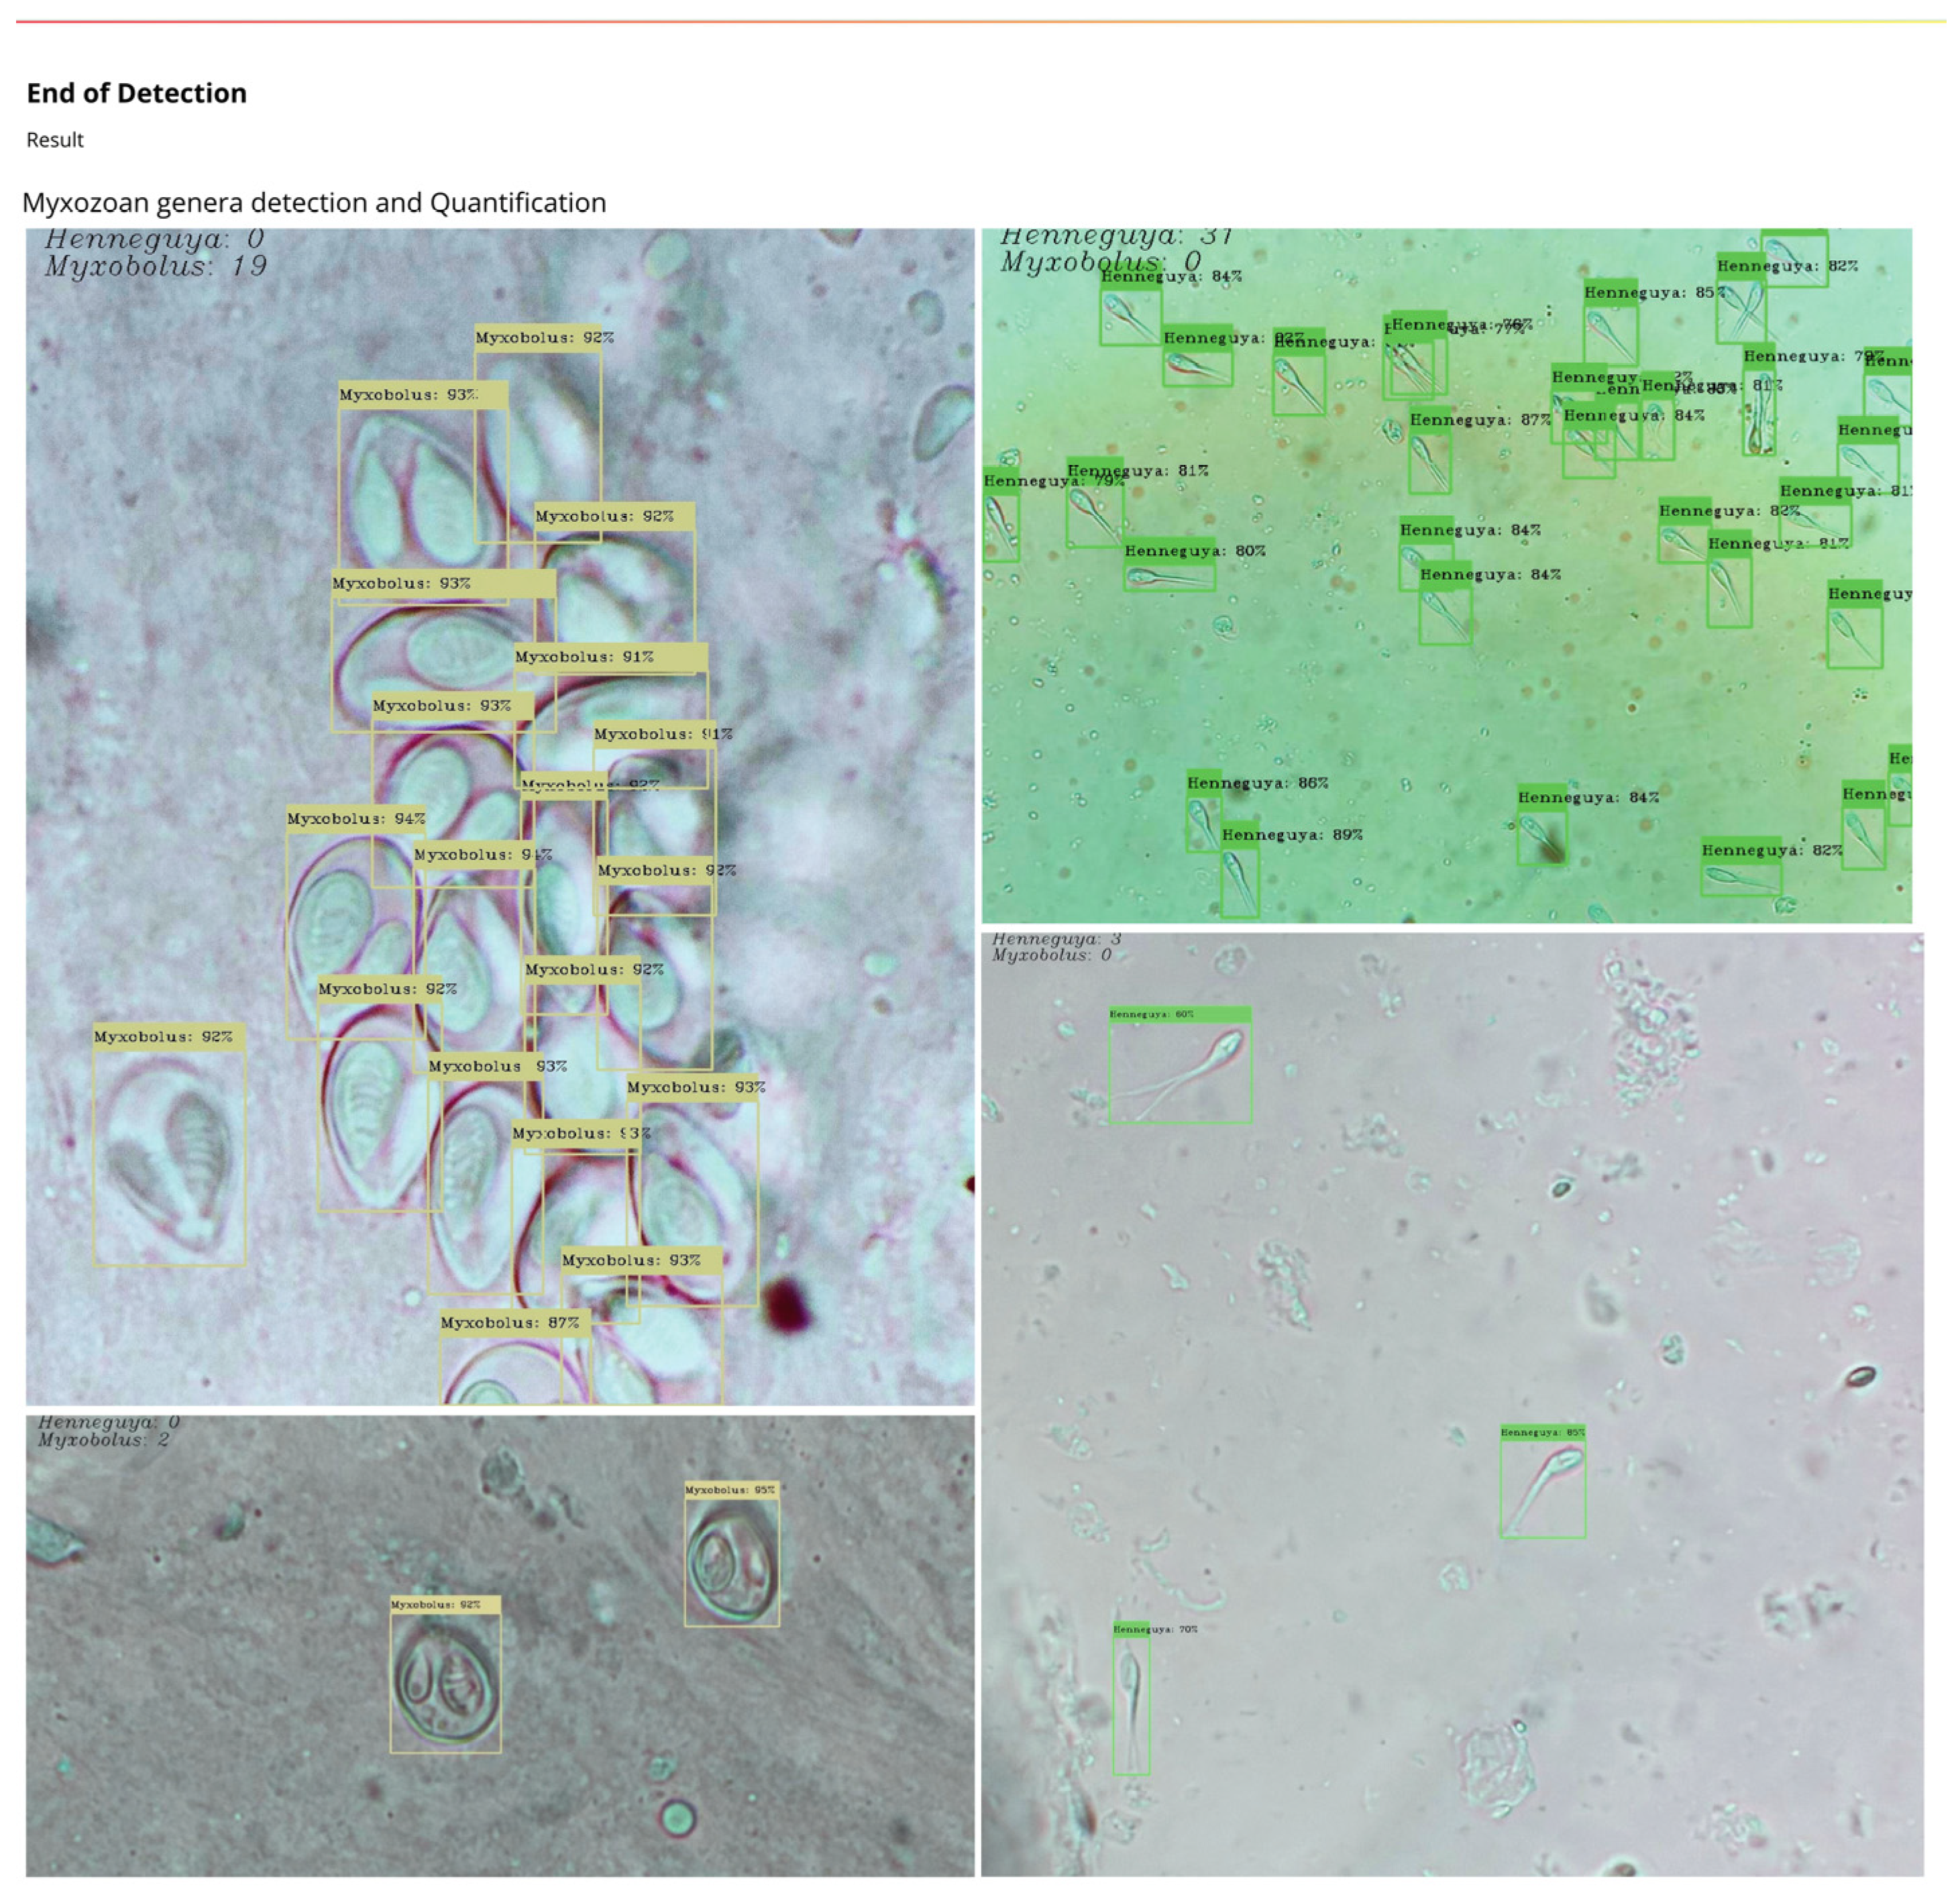

Table 1.
Labeling Scheme in Text File—X and Y are the center coordinates of the target, and W and H are the width and height of the target, respectively.
Table 1.
Labeling Scheme in Text File—X and Y are the center coordinates of the target, and W and H are the width and height of the target, respectively.
| Genera | X | Y | W | H |
|---|---|---|---|---|
| 1 | 0.72500000 | 0.69609375 | 0.11718750 | 0.79609375 |
| 1 | 0.83125000 | 0.78437500 | 0.07343750 | 0.48437500 |
| 0 | 0.44140625 | 0.64765625 | 0.10625000 | 0.74765625 |
Table 2.
Information on each of the genera labeled for YOLO: Henneguya and Myxobolus..
| Category Information Genera Labeled for YOLOv5 | ||||
|---|---|---|---|---|
| Henneguya | 0 | Myxobolus | 1 | |
Table 4.
YOLOv5 Models Performance by each genus.
| Model | Genus | Images | Parasites | Precision | Recall | mAP:50 | mAP:50-95 |
|---|---|---|---|---|---|---|---|
| YOLOv5l | All | 2000 | 12386 | 0.974 | 0.967 | 0.980 | 0.892 |
| Henneguya | 2000 | 5396 | 0.994 | 0.970 | 0.993 | 0.905 | |
| Myxobolus | 2000 | 6990 | 0.954 | 0.965 | 0.966 | 0.879 | |
| YOLOv5m | All | 2000 | 12386 | 0.972 | 0.957 | 0.976 | 0.860 |
| Henneguya | 2000 | 5396 | 0.995 | 0.951 | 0.990 | 0.876 | |
| Myxobolus | 2000 | 6990 | 0.949 | 0.962 | 0.962 | 0.844 | |
| YOLOv5n | All | 2000 | 12386 | 0.928 | 0.895 | 0.943 | 0.727 |
| Henneguya | 2000 | 5396 | 0.976 | 0.852 | 0.947 | 0.74 | |
| Myxobolus | 2000 | 6990 | 0.880 | 0.938 | 0.939 | 0.713 | |
| YOLOv5s | All | 2000 | 12386 | 0.948 | 0.935 | 0.964 | 0.954 |
| Henneguya | 2000 | 5396 | 0.985 | 0.915 | 0.974 | 0.815 | |
| Myxobolus | 2000 | 6990 | 0.911 | 0.954 | 0.954 | 0.780 |
Disclaimer/Publisher’s Note: The statements, opinions and data contained in all publications are solely those of the individual author(s) and contributor(s) and not of MDPI and/or the editor(s). MDPI and/or the editor(s) disclaim responsibility for any injury to people or property resulting from any ideas, methods, instructions or products referred to in the content. |
© 2024 by the authors. Licensee MDPI, Basel, Switzerland. This article is an open access article distributed under the terms and conditions of the Creative Commons Attribution (CC BY) license (http://creativecommons.org/licenses/by/4.0/).
Copyright: This open access article is published under a Creative Commons CC BY 4.0 license, which permit the free download, distribution, and reuse, provided that the author and preprint are cited in any reuse.


