
Submitted:
01 November 2024
Posted:
01 November 2024
You are already at the latest version
Abstract
Rhinoviruses and respiratory enteroviruses remain among the leading causes of acute respiratory infections, particularly in children. Little is known about the genetic diversity of enteroviruses and rhinoviruses in pediatric patients with acute respiratory infections in Russia. We assessed the prevalence of human rhinoviruses/enteroviruses (HRV/EV) in 1992 children aged 0 to 17 years hospitalized with acute respiratory infections during the 2023-2024 epidemic season using PCR. The detection rate of HRV/EV was 11% (220/1,992). We performed typing of 58 HRV and 28 EV viruses by partial sequencing of the VP1 gene. Rhinovirus A was the most common among HRV, followed by rhinovirus C; rhinovirus B was detected in only three cases. Enteroviruses were represented by all four species, with the EV-D68 genotype being the most frequently detected. Phylogenetic analysis of the VP1 fragment of EV-D68 showed that all our sequences belonged to the B3 subclade. We identified the first case of EV-C105 infection in Russia in a two-year-old girl hospitalized with pneumonia. Phylogenetically, the Novosibirsk strain EV-C105 was closely related to a strain discovered in France in 2018. This research helped to fill a critical gap in understanding the epidemiological landscape of HRV/EV in pediatric populations within Russia.
Keywords:
Enteroviruses
; Rhinoviruses
; Picornaviridae
; EV typing
; EV-C105
; EV-D68
1. Introduction
Enteroviruses (EV) and Human Rhinoviruses (HRV) belong to the genus Enterovirus of the Picornaviridae family which is classified into 15 species (EV A-L, and HRV A-C). EV A-D and HRV A-C are pathogenic to humans [1]. The HRV/EV genome is represented by a single-stranded positive-sense RNA, consisting of a 5’ untranslated region (UTR), an open reading frame (ORF) that encodes a single precursor polypeptide, and a 3’ untranslated region with a poly-A-tail. The precursor polypeptide undergoes posttranslational processing, resulting in the formation of 4 structural proteins (VP1 – 4), and 7 non–structural proteins (ссылка). On the base of amino acid sequence divergence of the VP4/2 genes or VP1 genes EV and HRV are divided into more than 100 types [2]. Despite their genetic similarity, rhinoviruses and enteroviruses cause a broad spectrum of diseases [3]. Rhinoviruses are one of the main causes of acute respiratory tract infections [4]. Most often, HRV causes mild self-limited diseases, but can also lead to severe lower respiratory tract illnesses such as bronchiolitis and pneumonia, as well as exacerbations of bronchial asthma or chronic obstructive pulmonary disease [5]. At the same time, EV can infect various tissues and can cause diseases of the gastrointestinal tract, respiratory and nervous systems, such as hand-foot-and-mouth disease, viral meningitis, encephalitis, acute flaccid paralysis [6]. Some EV genotypes are predominantly isolated from respiratory samples, e.g., enteroviruses EV-C104, EV-C105, EV-C109, EV-C117, EV-C118, CV-A21, EV-D68 [3]. These genotypes cause respiratory tract diseases of varying severity and can, in some cases, lead to acute flaccid paralysis [7]. Particularly, EV-D 68 caused a major outbreak of severe respiratory disease and neurological complications in children in 2014, affecting more than 2,000 people worldwide, primarily children [8]. And now it continues to represent a global public health concern [9].
Since 2020, the COVID-19 pandemic and associated disease control measures have significantly altered the circulation patterns of enveloped viruses, including the influenza virus, respiratory syncytial virus (RSV), and human metapneumovirus. Concurrently, studies have shown that the circulation of rhinoviruses and enteroviruses has remained stable, continuing to be an important component of the respiratory viral spectrum [10]. However, little is known about the genetic diversity of enteroviruses and rhinoviruses in children with acute respiratory infections in Russia.
In this study, we assessed the contribution of enteroviruses to the etiology of acute respiratory infections in hospitalized children during the 2023-2024 period. We examined age distribution, clinical signs of illness, and the genetic diversity of human rhinovirus (HRV) and enteroviruses (EV). This research aims to fill a critical gap in understanding the epidemiological landscape of these viruses in pediatric populations within Russia.
2. Materials and Methods
2.1. Ethics Issues
The study was approved by the Committee on Biomedical Ethics at FRC FTM (protocol No. 16 of June 15th 2023). Each patient/legal representative involved in the study signed an informed consent.
2.2. Sample collection
The study included 1992 children aged 0 to 17 years hospitalized with acute respiratory infection (ARI). The inclusion criteria were the duration of the disease less than 7 days and the presence of at least one systemic symptom (fever, malaise, myalgia, headache) and one respiratory symptom (cough, sore throat, runny nose/nasal congestion, shortness of breath). On the first day after admission, a nasal and throat swab was taken from the child and placed in a tube with the transport medium (MEM medium, 0.5% bovine serum albumin, 100 mcg/ml gentamicin). The samples were stored at -20 ° C before delivery to the laboratory, but no more than 72 hours. In addition, a questionnaire was filled out for each patient, which reflected the main demographic data (gender, age), clinical symptoms of the disease, the presence of chronic diseases, hospitalization in the ICU, and the clinical diagnosis.
2.3. Detection of respiratory viruses
Total RNA/DNA was isolated from respiratory samples using a commercial Ribosorb kit (Interlabservice, Russia) in accordance with the manufacturer's instructions. Reverse transcription was performed using the Reverta-L kit (Interlabservice, Russia) in accordance with the manufacturer's instructions.
The detection of influenza (HInfV) and SARS-CoV-2 viruses was performed using the AmpliPrime Influenza SARS-CoV-2/Flu(A/B/H1pdm09) PCR-kit (NextBio, Russia). Respiratory syncytial virus (HRSV); coronaviruses NL63/229E, OC43/HKU1 (HCoV); parainfluenza virus types 1-4 (HPIV); metapneumovirus (HMPV); rhinovirus (HRV); adenovirus (HAdV); and bocavirus (HBoV) were detected using the AmpliSens ARVI-screen-FL PCR-kit (Interlabservice, Russia). The detection of enteroviruses was carried out using the AmpliSens Human enterovirus-FL PCR-kit (Interlabservice, Russia).
2.4. HRV/EV typing
Nasal and throat swabs were suspended in 1000 µL of transport medium and centrifuged at 3000 rpm for 3 min. RNA extraction was carried out using the RNA Isolation Column Kit (modified) (Biolabmix, Russia) according to the manufacturer's recommendations and stored at −80˚C until further analysis.
Sequencing of the VP1 capsid protein gene portion was performed in accordance with WHO recommendations [11]. Extracted RNA was then reverse-transcribed into cDNA using Reverse transcriptase RNAscribe RT kit (Biolabmix, Novosibirsk, Russia) and a set of primers (Table 1) for the VP1 gene (AN32, AN33, AN34 and AN35 in concentration 10 pmol/μL). Following incubation at 25°C for 10 min, 55°C for 50 min, and 85°C for 5 min, the entire 20 μl RT reaction mixture was utilized for the first PCR (PCR1), which had a final volume of 50 μl. This reaction included primers SO224 and SO222 in concentration 10 pmol/μL (Table) and was conducted using the BioMaster HS-Taq PCR-Color (2×) kit (Biolabmix, Novosibirsk, Russia) under the following conditions: 95°C for 5 min, followed by 39 cycles of 95°C for 20 sec, 42°C for 30 sec, and a ramp of 0.4°C/sec to the 60°C for 45 sec, then 72°C for 45 sec, and a final extension at 72°C for 5 min. Semi-nested PCR2 was conducted using 1 μl of the PCR1, primers AN88 and AN89 (10 pmol/μL) employing the BioMaster HS-Taq PCR-Color (2×) kit (Biolabmix, Novosibirsk, Russia) under the following conditions: at 95°C for 5 min prior to 39 amplification cycles of 95°C for 20 sec, 60°C for 20 sec, and 72°C for 15 sec followed by a final incubation at 72˚C for 5 min. The result of PCR2 is a product of a VP1 gene fragment of 348-393 bp. The reaction products were separated and visualized on 1.5% agarose gels with ethidium bromide (0.5 μg/ml). The appropriate size products were purified from the gel using the GeneJET Gel Extraction Kit (Thermo Fisher Scientific, Waltham, USA). The resulting DNA templates were sequenced with a BigDye Terminator v3.1 ready reaction cycle sequencing kit on an ABI 3500xL Genetic Analyzer (Thermo Fisher Scientific, UK) by using primers AN89 and AN88. 77 sequences of the partial VP1 203-353 nt were deposited in Gene Bank (accession numbers will be assigned later, sequences are currently under consideration). Sequences obtained were compared with the enterovirus sequences available in GenBank.
2.5. Phylogenetic analysis
Sequences of fragment of VP1 region of enteroviruses and rhinoviruses obtained from in this study were compared against nucleotide sequences from relevant taxonomy group downloaded from the GenBank. All sequences were then aligned using the MAFFT-L-INS-i (v7.520) [12]. Phylogenetic trees were constructed using maximum likelihood (ML) method implemented in IQ-TREE IQtree v1.6.12 [13]. An ultrafast bootstrap (UFBoot) [14] and an approximate likelihood ratio test with the Shimodaira-Hasegawa-like (SH-aLRT) procedure [15] were used to evaluate support for node on the tree for 1,000 replicates. Visualization was done with iTOL [16].
2.6. Statistical Analysis
Descriptive statistics were performed with median and interquartile range for quantitative variables, with absolute, relative frequencies and 95% confidence interval for categorial variables. The Manna-Whitney (U) test and the Chi-square test (Chi2) were applied to identify the statistical significance. Differences between groups were analyzed by the Kruskal-Wallis test (H) and multiple corrections were performed using the Dunn’s post hoc test with Bonferroni correction. To quantify effect size, we used risk ratio (RR) with 95% CI, as well as the adjusted standardized residual (AR). An adjusted standardized residual greater than 1.96 indicates a statistically significant difference from the expected frequencies. The relationship between age and the presence of EV/HRV assessed with Spearman’s rank correlation. The p-value were computed using permutation techniques with 999,999 iterations. The statistical significance was set to p=0.05. The analysis was performed using R v.4.3.2, Python v.3.12, RStudio software and GraphPad Prism v.10.3.1.
3. Results
The study was conducted from September 2023 to May 2024 coinciding with a seasonal increase in the incidence of acute respiratory infections. As part of the annual monitoring of respiratory viruses in hospitalized children, nasal and pharyngeal swabs were taken within 24 hours of admission, and subsequently analyzed by real-time PCR to detect common respiratory viruses. A total of 1992 samples were collected from children aged 0-17 years. Of these, 1,098 (55.1%) samples were obtained from boys and 894 (44.9%) samples were obtained from girls. The largest number of samples was obtained from infants. The gender and age distribution of the patients is presented in Table 2.
3.1. Detection of Respiratory Viruses
PCR testing revealed that at least one respiratory virus was detected in 1190/1992 (59.8%) of the included patients. Viral co-infection was detected in 171/1992 (8.6%) children. To identify age differences, we divided patients into the following age groups: children of the first year of life (0-12 months), young children (1-2 years), preschool children (3-6 years), and school–age children (7-17 years). The detection rate of respiratory viruses, as well as the frequency of viral co-infection, decreased with age being significantly lower in the age group of 7-17 year age group compared with all other ages (Figure 1).
HRSV was the most prevalent in the etiology of ARIs during 2023-2024, which was detected in 305/1992 (15.3%) children. HRSV was significantly more frequently detected in children under 12 months of age compared with all other age groups, with detection rates of 23.4% and 15.2%, 12.3%, 4.5% for the respective age groups. A similar pattern was observed for SARS-CoV-2, which was significantly more common in children aged 0-12 months compared to children aged 1-2 years old, 3-6 years old and 7-17 years old with detection rates of 13.0%, 6.4%, 2.0% and 2.6%, respectively. HInfV was found in 179/1992 (9.0%) children, with the detection rate increasing with age; it was significantly higher in preschool and school-age children compared to those aged children 0-12 months and 1-2 years old with rates 13.3%, 12.7% and 4.5%, 8.8%, respectively. The incidence of respiratory viruses across different age groups is shown in Figure 2.
3.2. Detection of HRV/EV
HRV detection carried out using the ARVI-screen-FL PCR-kit (Interlabservice, Russia), EV detection was performed using the AmpliSens Human enterovirus-FL PCR-kit (Interlabservice, Russia). The limitation of these kits includes potential cross-reactivity and the identification of closely related variants of enteroviruses and rhinoviruses, as noted in the manufacturer's instructions. In our study, we found that out of 220 samples positive for HRV/EV by PCR, 121 samples were positive only for HRV, 49 samples were positive only for EV, and 50 samples detected both HRV and EV simultaneously.
There was no significant difference between sex and the presence of HRV/EV (p=0.946). However, there was a statistically significant negative very weak correlation between age and the presence of HRV/EV (rs=-0.070, p=0.002). In children under 1 year of age, the risk ratio for EV infection was 1.35 (95% CI: 1.05 to 1.74) (Table 3).
HRV/EV were detected throughout the study period, however, two peaks of infections were noticeable: one in the autumn months and a smaller peak in April and May. During the winter months, there was a significant decrease in the detection levels of HRV/EV attributed to the prevalence of HInfV and HRSV (Figure 3).
3.3. Clinical Signs of HRV/EV Infections
We compared clinical features of HRV/EV infection with those of Influenza and RSV-infection. The distribution of various symptoms among children with respiratory viruses, HRV/EV, differs significantly (p=0.020). However, the contribution to these differences is primarily due to the symptoms distribution associated with HInfV and HRSV, rather than HRV/EV (Table 4). Malaise was significantly more common in children with HInfV (AR=2.52) and less frequent in those with HRSV (AR=-2.12) (Figure 4). Conversely, dyspnea was more frequently observed in children with HRSV (AR=2.52) but less so in those with HInfV (AR=-2.09) (Figure 4). Nasal congestion was significantly less common in children with HRSV (AR=-2.69) (Figure 4). Statistically significant differences in temperature were found between HRV/EV, HInfV, and HRSV (p<0.001). Post hoc comparisons revealed differences between all pairs: HRV/EV and HInfV (p<0.001), HRV/EV and HRSV (p=0.001), HInfV and HRSV (p<0.001). Statistically significant differences in the frequency of hypoxia were found between HRV/EV, HInfV, and HRSV (p=0.015). Post hoc comparisons revealed differences between HRV/EV and HRSV (p=0.030). No statistically significant differences in ICU admission were found (p=0.177).
3.4. HRV/EV Typing and Phylogenetic Analysis
By partial sequencing of the VP1 gene, we performed typing of samples positive for HRV/EV. A total of 58 HRV and 28 EV samples were typed including one rhinovirus sample and one enterovirus sample included were collected during the 2022-2023 epidemic season. Rhinoviruses A (32 samples, 15 genotypes) were the most common among HRV, followed by rhinoviruses C (23 samples, 8 genotypes). Rhinoviruses B were detected in only three cases (3 genotypes). Enteroviruses were represented by all four species, with enterovirus D being the most frequently detected (13 samples), all belonging to the EV-D68 genotype. Enteroviruses A were represented by the genotypes coxsackievirus A2 and coxsackievirus A6. Among enteroviruses B, we identified coxsackievirus B 5, echovirus 5 and echovirus 6. Enterovirus C was represented by a single sample EV-C105, from the 2022-2023 season. The prevalence of HRV/EV genotypes is shown in Table 5.
A comparison of the seasonal distribution of HRV and EV revealed that rhinoviruses were detected throughout the entire observation period (September 2023 – May 2024), while the vast majority of enteroviruses were detected in the fall of 2023 (Figure 5).
The sequences of 56 rhinoviruses identified in this study, belonging to three different species, exhibited similarities with various strains collected worldwide (Europe, East Asia, America, Africa, and Australia) between 2003 and 2023 (Figure 6). Given the extensive development of international air travel, tracking patterns of transmission has become a challenging task.
A detailed comparative analysis of the nucleotide sequences of Novosibirsk isolates coxsackievirus A6 showed an appreciable level of similarity with strains detected in 2017 and 2023 in various cities of Russia (Khabarovsk, Miass) as well as other countries, such as China and the Netherlands (Figure 7). Another genotype of EV, coxsackievirus A2, found in our study exhibited significant genetic similarity to a strain identified in the Russian city Yoshkar-Ola in 2019 (Figure 7), which was isolated from a throat swab. The Novosibirsk strain of coxsackievirus B5 demonstrated close similarity of the nucleotide sequence of VP1 with the strain from Novgorod, which circulated in 2023 (Figure 7). Furthermore, we observed that the echovirus 6 strain had genetic similarities with those circulated in 2022. Two cases of echovirus 6 detection were observed in patients from Omsk and Yekaterinburg (Figure 7), with biological material sourced from cerebrospinal fluid and feces. Outside the Russian Federation, this strain was found in throat swabs collected in Kazakhstan (Figure 7).
It is especially important to emphasize that in our study we detected a strain of EV-C105 for the first time in Russia, similar to the strain from France identified in a throat swab in 2018 (Figure 7).
Additionally, our investigation revealed several sequences of EV-D68, the vast majority of which exhibited a high degree of genetic similarity to those collected from the nasopharyngeal swabs of children in Senegal (Africa) in 2023 (Figure 7). Interestingly, one strain was closely related to a variant from Canada, sourced from a nasopharyngeal swab in 2022 (Figure 7). Phylogenetic analysis of the VP1 fragment showed that all our sequences belonged to the B3 subclade of enterovirus D68 (Figure 8).
3.5. Clinical Characteristics of HRV-A and HRV-C Infection
We compared the clinical characteristics of diseases caused by HRV-A and HRV-C in order to identify the possible effect of the virus type on the disease severity. No statistically significant differences were found; however, a tendency toward statistically significant differences between HRV-A and HRV-C was found in age (p=0.090), presence of hypoxia (p=0.050), diagnoses (p=0.076, due to the low proportion of upper respiratory tract diseases in children with HRV-C) (Table 6).
3.6. Clinical Characteristics of EV-D68 Infection
In total, we have confirmed 13 cases of EV-D68 infection. Most of the patients were young children with the median age of 18 months. All children had no chronic diseases. All patients had fever (median Temperature was 38.3°C), 76.92% of patients had cough, and 69.23% had shortness of breath. Almost half of the cases occurred with hypoxia, but none of the patients needed oxygen support or mechanical ventilation, as well as hospitalization in the ICU. All patients with EV-D68 had low respiratory tract infection, including acute bronchitis in 61.54% cases, and pneumonia in 38.46% cases. None of the patients exhibited neurological symptoms (Table 7).
4. Discussion
Rhinoviruses and respiratory enteroviruses remain one of the leading causes of acute respiratory infections especially in children [3,17]. In our study we found that the HRV/EV ratio reached 18.5% (220/1190) among PCR-confirmed viral infections in hospitalized children in 2023-2024 in Novosibirsk. Rhinoviruses are considered the primary cause of the so-called “common cold” with mild symptoms, but they can cause severe diseases of the lower respiratory tract, requiring hospitalization, such as bronchitis, bronchiolitis and pneumonia [5,18]. In our study, 53.6% (118/220) of children with RV/EV had bronchitis and 29.5% (65/220) of the children had pneumonia.
Rhinoviruses and enteroviruses are heterogeneous group of viruses, including over 169 RV genotypes of HRV and 116 Genotypes of EV, according to International Committee on Taxonomy of Viruses (ICTV) [19]. We detected 32 viruses of HRV-A, belonged to 15 different genotypes, 23 HRV-C, belonged to 8 genotypes, and only 3 HRV-B, belonged to 3 genotypes. According to different studies, RV-A and RV-C are also predominant in the world [20-22]. In the review of Esneau C. et al. (2022), based on the analysis of studies conducted in different regions, the top 25 subtypes of rhinoviruses in Europe, Asia and Africa were identified. In our study, RV-C41 was the most often detected (13/58), which, however, was not in the 25 highest ranked subtypes in the Esneau C. study [5].
HRV infections occur year-round, however seasonality is characterized by a major peak of infection in the autumn/fall and a smaller one in the spring [23], while EV infection peaks in summer and early autumn [24]. We also could see HRV infection throughout the year with two peaks in autumn and spring months, and majority cases of confirmed EV-infection occurred in fall 2023.
Some investigators have reported that RV-C caused more serious illness compared with cases caused by RV-A and RV-B [23,25]. However, other studies have not found differences in the disease severity [21,26]. Some researchers note that low respiratory tract infection was more common in HRV-C than HRV-A illness cases [25]. We did not find a statistically significant difference in the severity of the diseases due to the small number of analyzed cases, however we observed a tendency towards statistically significant differences in the presence of hypoxia and a lower proportion of upper respiratory tract diseases in children with HRV-C compared with HRV-A.
The most prevalent genotype of EV in our study was EV-D68. We detected 13 cases of EV-D68 infection, mostly in young children. All patients had low respiratory tract infection (bronchitis or pneumonia). In addition to respiratory tract infections, EV-D68 illnesses can be associated with neurologic disease, such as acute flaccid myelitis [9]. None of the patients showed neurological symptom in our study. Phylogenetic analysis of the VP1 fragment showed that all our sequences belonged to the B3 subclade of enterovirus D68, which is most often responsible for outbreaks of respiratory diseases caused by enteroviruses [27-29]. Intriguingly, the sequences of enterovirus D68 from Novosibirsk, Russia, are very similar to sequences of enteroviruses from different parts of the world, such as Africa and Canada. Such information indicates the possibility of transmission of enterovirus D68 between countries located at great distances. Moreover, homology is observed between strains found in one year in distant parts of the world (Novosibirsk, 2024 – Senegal, 2023). This indicates the high speed with which enterovirus D68 is able to cross continental boundaries.
In our study, we identified the first case of the EV-C105 infection in Russia in a HIV-positive two-year-old girl hospitalized with pneumonia, and it was detected in combination with Coronavirus HKU-1/OC 43. The girl had only respiratory symptoms and no neurological manifestations. Phylogenetically, the Novosibirsk strain EV-C105 was close to the strain discovered in France in 2018. The genotype C105 was discovered less than two decades ago and there are currently only 34 sequences in GenBank. It was first identified in the Democratic Republic of the Congo in 2010 from patient with acute flaccid paralysis [30]. Thus, it can be mind that either 14 years or less have passed before the virus transferred from Africa to Europe and then to the Asian part of Russia. Nevertheless, this is hypothesis as there are not many sequenced strains of enteroviruses, especially for this genotype as mentioned earlier.
Phylogenetic analysis of Coxsackievirus A6 strains showed their similarity with strains from different cities of Russia (Khabarovsk, Miass) as well as other countries (China and the Netherlands). The wide geographic distribution of Coxsackievirus A6 viruses indicates the strain can travel long distances. At the same time, between 2020 and 2022, many countries introduced quarantine measures that reduced the volume of passenger and cargo shipments, which may have slowed, but did not stop, the spread of the virus.
The observed similarities between the detected enterovirus strains (coxsackieviruses, echovirus) in Russia may indicate related sources of infection and the ability of the strains to circulate in the population for several years. In addition, the genetic similarity of most strains to those detected in countries such as China, the Netherlands, and Kazakhstan indicates a broader circulation pattern that may include international transmission routes.
The implementation of non-pharmaceutical interventions aimed at mitigating the spread of SARS-CoV-2 led to a marked decline in the activity of many respiratory viruses. For instance, global influenza virus activity saw a substantial reduction during the early months of the pandemic, as non-pharmaceutical interventions effectively curtailed transmission routes shared with other respiratory viruses [31]. RSV also experienced significant decreases in case counts across various regions, particularly affecting pediatric populations where close contact in settings like childcare facilities is common. In contrast, rhinoviruses and enteroviruses demonstrated resilience during this period. While their prevalence initially declined at the pandemic's onset, they quickly rebounded and maintained levels comparable to those observed in previous years [32]. This resilience may be attributed to their transmission dynamics and environmental stability, which allowed them to persist even amidst stringent public health measures. Overall, the COVID-19 pandemic has reshaped our understanding of respiratory virus epidemiology. The reductions in circulation for many enveloped viruses highlight the effectiveness of control measures, while the sustained presence of rhinoviruses underscores their unique characteristics within the respiratory viral landscape. Continued surveillance and research are essential to inform future public health strategies as we navigate the ongoing impacts of these changes.
Author Contributions
Conceptualization, O.G.K. and K.A.S.; Methodology, O.G.K., A.R.N., N.A.D., A.A.D. and K.A.S.; Software, A.R.N., N.A.D. and A.A.D.; Validation, T.A.S. and O.G.K.; Formal analysis, A.R.N., T.A.S., M.V.S., T.A.M., T.A.G., N.A.D., A.A.D., and O.G.K.; Investigation, T.A.G., T.A.M. and T.A.S.; Resources, T.A.S. and M.V.S.; Data curation, O.G.K., T.A.S. and K.A.S.; Writing—original draft, A.R.N. and O.G.K.; Writing—review & editing, O.G.K., A.R.N. and K.A.S.; Visualization, A.R.N, N.A.D., A.A.D. and O.G.K.; Project administration, A.M.S.; Funding acquisition, O.G.K. All authors have read and agreed to the published version of the manuscript.
Funding
This research was funded by RSF grant number 23-24-00492.
Institutional Review Board Statement
All aspects of the study were approved by the Committee on Biomedical Ethics of the Federal Research Center of Fundamental and Translational Medicine (protocol No. 16 on June 15th 2023).
Informed Consent Statement
Written informed consent was obtained from all patients/legal representatives involved in the study.
Data Availability Statement
The original contributions presented in the study are included in the article; further inquiries can be directed to the corresponding author.
Acknowledgments
We kindly thank the clinicians of Novosibirsk Children’s Municipal Clinical Hospitals №3 and №6 for their assistance with sample collection. We thank the Centers for Collective Use of Scientific Equipment “Proteomic analysis” of Research Center of Fundamental and Translational Medicine (Novosibirsk, Russia) for the technical support. We are grateful to the SB RAS Genomics Core Facility (Institute of Chemical Biology and Fundamental Medicine, ICBFM SB RAS, Novosibirsk, Russia) for their assistance with sequencing.
Conflicts of Interest
The authors declare no conflicts of interest.
References
- Mengual-Chuliá B, Tamayo-Trujillo R, Mira-Iglesias A, Cano L, García-Esteban S, Ferrús ML, Puig-Barberà J, Díez-Domingo J, López-Labrador FX; VAHNSI network. Enterovirus D68 disease burden and epidemiology in hospital-admitted influenza-like illness, Valencia region of Spain, 2014-2020 influenza seasons. J Med Virol. 2024 Jul;96(7):e29810. [CrossRef] [PubMed]
- Linster M, Donato C, Mah MG, Grau ML, Low JG, Ooi EE, Su YCF, Smith GJD, Vijaykrishna D. Genetic diversity of respiratory enteroviruses and rhinoviruses in febrile adults, Singapore, 2007-2013. Influenza Other Respir Viruses. 2020 Jan;14(1):67-71. Epub 2019 Sep 30. [CrossRef] [PubMed] [PubMed Central]
- Royston L, Tapparel C. Rhinoviruses and Respiratory Enteroviruses: Not as Simple as ABC. Viruses. 2016 Jan 11;8(1):16. [CrossRef] [PubMed] [PubMed Central]
- Xiao M, Banu A, Jia Y, Chang M, Wang G, An J, Huang Y, Hu X, Tang C, Li Z, Niu Y, Tian X, Deng W, Tang C, Du J, Cui X, Chan JF, Peng R, Yin F. Circulation pattern and genetic variation of rhinovirus infection among hospitalized children on Hainan Island, before and after the dynamic zero-COVID policy, from 2021 to 2023. J Med Virol. 2024 Jun;96(6):e29755. [CrossRef] [PubMed]
- Esneau C, Duff AC, Bartlett NW. Understanding Rhinovirus Circulation and Impact on Illness. Viruses. 2022 Jan 13;14(1):141. [CrossRef] [PubMed] [PubMed Central]
- Tapparel C, Siegrist F, Petty TJ, Kaiser L. Picornavirus and enterovirus diversity with associated human diseases. Infect Genet Evol. 2013 Mar;14:282-93. Epub 2012 Nov 29. [CrossRef] [PubMed]
- Holm-Hansen CC, Midgley SE, Fischer TK. Global emergence of enterovirus D68: a systematic review. Lancet Infect Dis. 2016 May;16(5):e64-e75. Epub 2016 Feb 24. [CrossRef] [PubMed]
- Fall A, Kenmoe S, Ebogo-Belobo JT, Mbaga DS, Bowo-Ngandji A, Foe-Essomba JR, Tchatchouang S, Amougou Atsama M, Yéngué JF, Kenfack-Momo R, Feudjio AF, Nka AD, Mbongue Mikangue CA, Taya-Fokou JB, Magoudjou-Pekam JN, Noura EA, Zemnou-Tepap C, Meta-Djomsi D, Maïdadi-Foudi M, Kame-Ngasse GI, Nyebe I, Djukouo LG, Kengne Gounmadje L, Tchami Ngongang D, Oyono MG, Demeni Emoh CP, Tazokong HR, Mahamat G, Kengne-Ndé C, Sadeuh-Mba SA, Dia N, La Rosa G, Ndip L, Njouom R. Global prevalence and case fatality rate of Enterovirus D68 infections, a systematic review and meta-analysis. PLoS Negl Trop Dis. 2022 Feb 8;16(2):e0010073. [CrossRef] [PubMed] [PubMed Central]
- Grizer CS, Messacar K, Mattapallil JJ. Enterovirus-D68 - A Reemerging Non-Polio Enterovirus that Causes Severe Respiratory and Neurological Disease in Children. Front Virol. 2024;4:1328457. Epub 2024 Feb 14. [CrossRef] [PubMed] [PubMed Central]
- Rankin DA, Spieker AJ, Perez A, Stahl AL, Rahman HK, Stewart LS, Schuster JE, Lively JY, Haddadin Z, Probst V, Michaels MG, Williams JV, Boom JA, Sahni LC, Staat MA, Schlaudecker EP, McNeal MM, Harrison CJ, Weinberg GA, Szilagyi PG, Englund JA, Klein EJ, Gerber SI, McMorrow M, Rha B, Chappell JD, Selvarangan R, Midgley CM, Halasa NB; NVSN Network Investigators. Circulation of Rhinoviruses and/or Enteroviruses in Pediatric Patients With Acute Respiratory Illness Before and During the COVID-19 Pandemic in the US. JAMA Netw Open. 2023 Feb 1;6(2):e2254909. [CrossRef] [PubMed] [PubMed Central]
- WHO, Enterovirus Surveillance Guidelines – Guidelines for Enterovirus Surveillance in Support of the Polio Eradication Initiative, World Health Organization Regional Office for Europe, 2015.
- Katoh K, Standley DM. MAFFT multiple sequence alignment software version 7: improvements in performance and usability. Mol Biol Evol. 2013 Apr;30(4):772-80. Epub 2013 Jan 16. [CrossRef] [PubMed] [PubMed Central]
- Trifinopoulos J, Nguyen LT, von Haeseler A, Minh BQ. W-IQ-TREE: a fast online phylogenetic tool for maximum likelihood analysis. Nucleic Acids Res. 2016 Jul 8;44(W1):W232-5. Epub 2016 Apr 15. [CrossRef] [PubMed] [PubMed Central]
- Minh BQ, Nguyen MA, von Haeseler A. Ultrafast approximation for phylogenetic bootstrap. Mol Biol Evol. 2013 May;30(5):1188-95. Epub 2013 Feb 15. [CrossRef] [PubMed] [PubMed Central]
- Guindon S, Gascuel O. A simple, fast, and accurate algorithm to estimate large phylogenies by maximum likelihood. Syst Biol. 2003 Oct;52(5):696-704. [CrossRef] [PubMed]
- Letunic I, Bork P. Interactive Tree of Life (iTOL) v6: recent updates to the phylogenetic tree display and annotation tool. Nucleic Acids Res. 2024 Jul 5;52(W1):W78-W82. [CrossRef] [PubMed] [PubMed Central]
- Fine J, Bray-Aschenbrenner A, Williams H, Buchanan P, Werner J. The Resource Burden of Infections With Rhinovirus/Enterovirus, Influenza, and Respiratory Syncytial Virus in Children. Clin Pediatr (Phila). 2019 Feb;58(2):177-184. Epub 2018 Nov 2. [CrossRef] [PubMed]
- Louie JK, Roy-Burman A, Guardia-Labar L, Boston EJ, Kiang D, Padilla T, Yagi S, Messenger S, Petru AM, Glaser CA, Schnurr DP. Rhinovirus associated with severe lower respiratory tract infections in children. Pediatr Infect Dis J. 2009 Apr;28(4):337-9. [CrossRef] [PubMed]
- Current ICTV Taxonomy Release. Available online: https://ictv.global/taxonomy/ (accessed on 28 October 2024).
- Giardina FAM, Piralla A, Ferrari G, Zavaglio F, Cassaniti I, Baldanti F. Molecular Epidemiology of Rhinovirus/Enterovirus and Their Role on Cause Severe and Prolonged Infection in Hospitalized Patients. Microorganisms. 2022 Mar 31;10(4):755. [CrossRef] [PubMed] [PubMed Central]
- Kuypers J, Perchetti GA, Chu HY, Newman KL, Katz J, Khatry SK, LeClerq SC, Jerome KR, Tielsch JM, Englund JA. Phylogenetic characterization of rhinoviruses from infants in Sarlahi, Nepal. J Med Virol. 2019 Dec;91(12):2108-2116. Epub 2019 Aug 21. [CrossRef] [PubMed] [PubMed Central]
- Georgieva I, Stoyanova A, Angelova S, Korsun N, Stoitsova S, Nikolaeva-Glomb L. Rhinovirus Genotypes Circulating in Bulgaria, 2018-2021. Viruses. 2023 Jul 22;15(7):1608. [CrossRef] [PubMed] [PubMed Central]
- Bizzintino J, Lee WM, Laing IA, Vang F, Pappas T, Zhang G, Martin AC, Khoo SK, Cox DW, Geelhoed GC, McMinn PC, Goldblatt J, Gern JE, Le Souëf PN. Association between human rhinovirus C and severity of acute asthma in children. Eur Respir J. 2011 May;37(5):1037-42. Epub 2010 Aug 6. [CrossRef] [PubMed] [PubMed Central]
- 24. Baertl, S.; Pietsch, C.; Maier, M.; Hönemann, M.; Bergs, S.; Liebert, U.G. Enteroviruses in Respiratory Samples from Paediatric Patients of a Tertiary Care Hospital in Germany. Viruses 2021, 13, 882. [CrossRef]
- Martin EK, Kuypers J, Chu HY, Lacombe K, Qin X, Strelitz B, Bradford M, Jones C, Klein EJ, Englund JA. Molecular epidemiology of human rhinovirus infections in the pediatric emergency department. J Clin Virol. 2015 Jan;62:25-31. Epub 2014 Nov 15. [CrossRef] [PubMed] [PubMed Central]
- McCulloch DJ, Sears MH, Jacob JT, Lyon GM, Burd EM, Caliendo AM, Hill CE, Nix WA, Oberste MS, Kraft CS. Severity of rhinovirus infection in hospitalized adults is unrelated to genotype. Am J Clin Pathol. 2014 Aug;142(2):165-72. [CrossRef] [PubMed] [PubMed Central]
- Chen L, Shi L, Yang H, Gu DY, Meng J, Xu YQ, Yao XJ, Zhang HL, Cheng JQ, Ma HW, Zhang RL, He YQ. Identification and Whole-Genome Sequencing of Four Enterovirus D68 Strains in Southern China in Late 2015. Genome Announc. 2016 Sep 22;4(5):e01014-16. [CrossRef] [PubMed] [PubMed Central]
- Huang W, Yin C, Zhuge J, Farooq T, Yoon EC, Nolan SM, Chen D, Fallon JT, Wang G. Complete Genome Sequences of Nine Enterovirus D68 Strains from Patients of the Lower Hudson Valley, New York, 2016. Genome Announc. 2016 Dec 15;4(6):e01394-16. [CrossRef] [PubMed] [PubMed Central]
- Piralla A, Principi N, Ruggiero L, Girello A, Giardina F, De Sando E, Caimmi S, Bianchini S, Marseglia GL, Lunghi G, Baldanti F, Esposito S. Enterovirus-D68 (EV-D68) in pediatric patients with respiratory infection: The circulation of a new B3 clade in Italy. J Clin Virol. 2018 Feb-Mar;99-100:91-96Epub 2018 Jan 12. [CrossRef] [PubMed] [PubMed Central]
- Grard G, Drexler JF, Lekana-Douki S, Caron M, Lukashev A, Nkoghe D, Gonzalez JP, Drosten C, Leroy E. Type 1 wild poliovirus and putative enterovirus 109 in an outbreak of acute flaccid paralysis in Congo, October-10. Euro Surveill. 2010 Nov 25;15(47):19723. [CrossRef] [PubMed]
- Chow EJ, Uyeki TM, Chu HY. The effects of the COVID-19 pandemic on community respiratory virus activity. Nat Rev Microbiol. 2023 Mar;21(3):195-210. Epub 2022 Oct 17. [CrossRef] [PubMed] [PubMed Central]
- Taktak A, Smaoui F, Chtourou A, Maâloul M, Karray-Hakim H, Hammami A, Fki-Berrajah L, Gargouri S. Significant impact of COVID-19 pandemic on the circulation of respiratory viruses in Tunisia, 2020-2021. Clin Epidemiol Glob Health. 2023 May-Jun;21:101306. Epub 2023 Apr 27. [CrossRef] [PubMed] [PubMed Central]
Figure 1.
PCR detection rate of respiratory viruses in different age groups
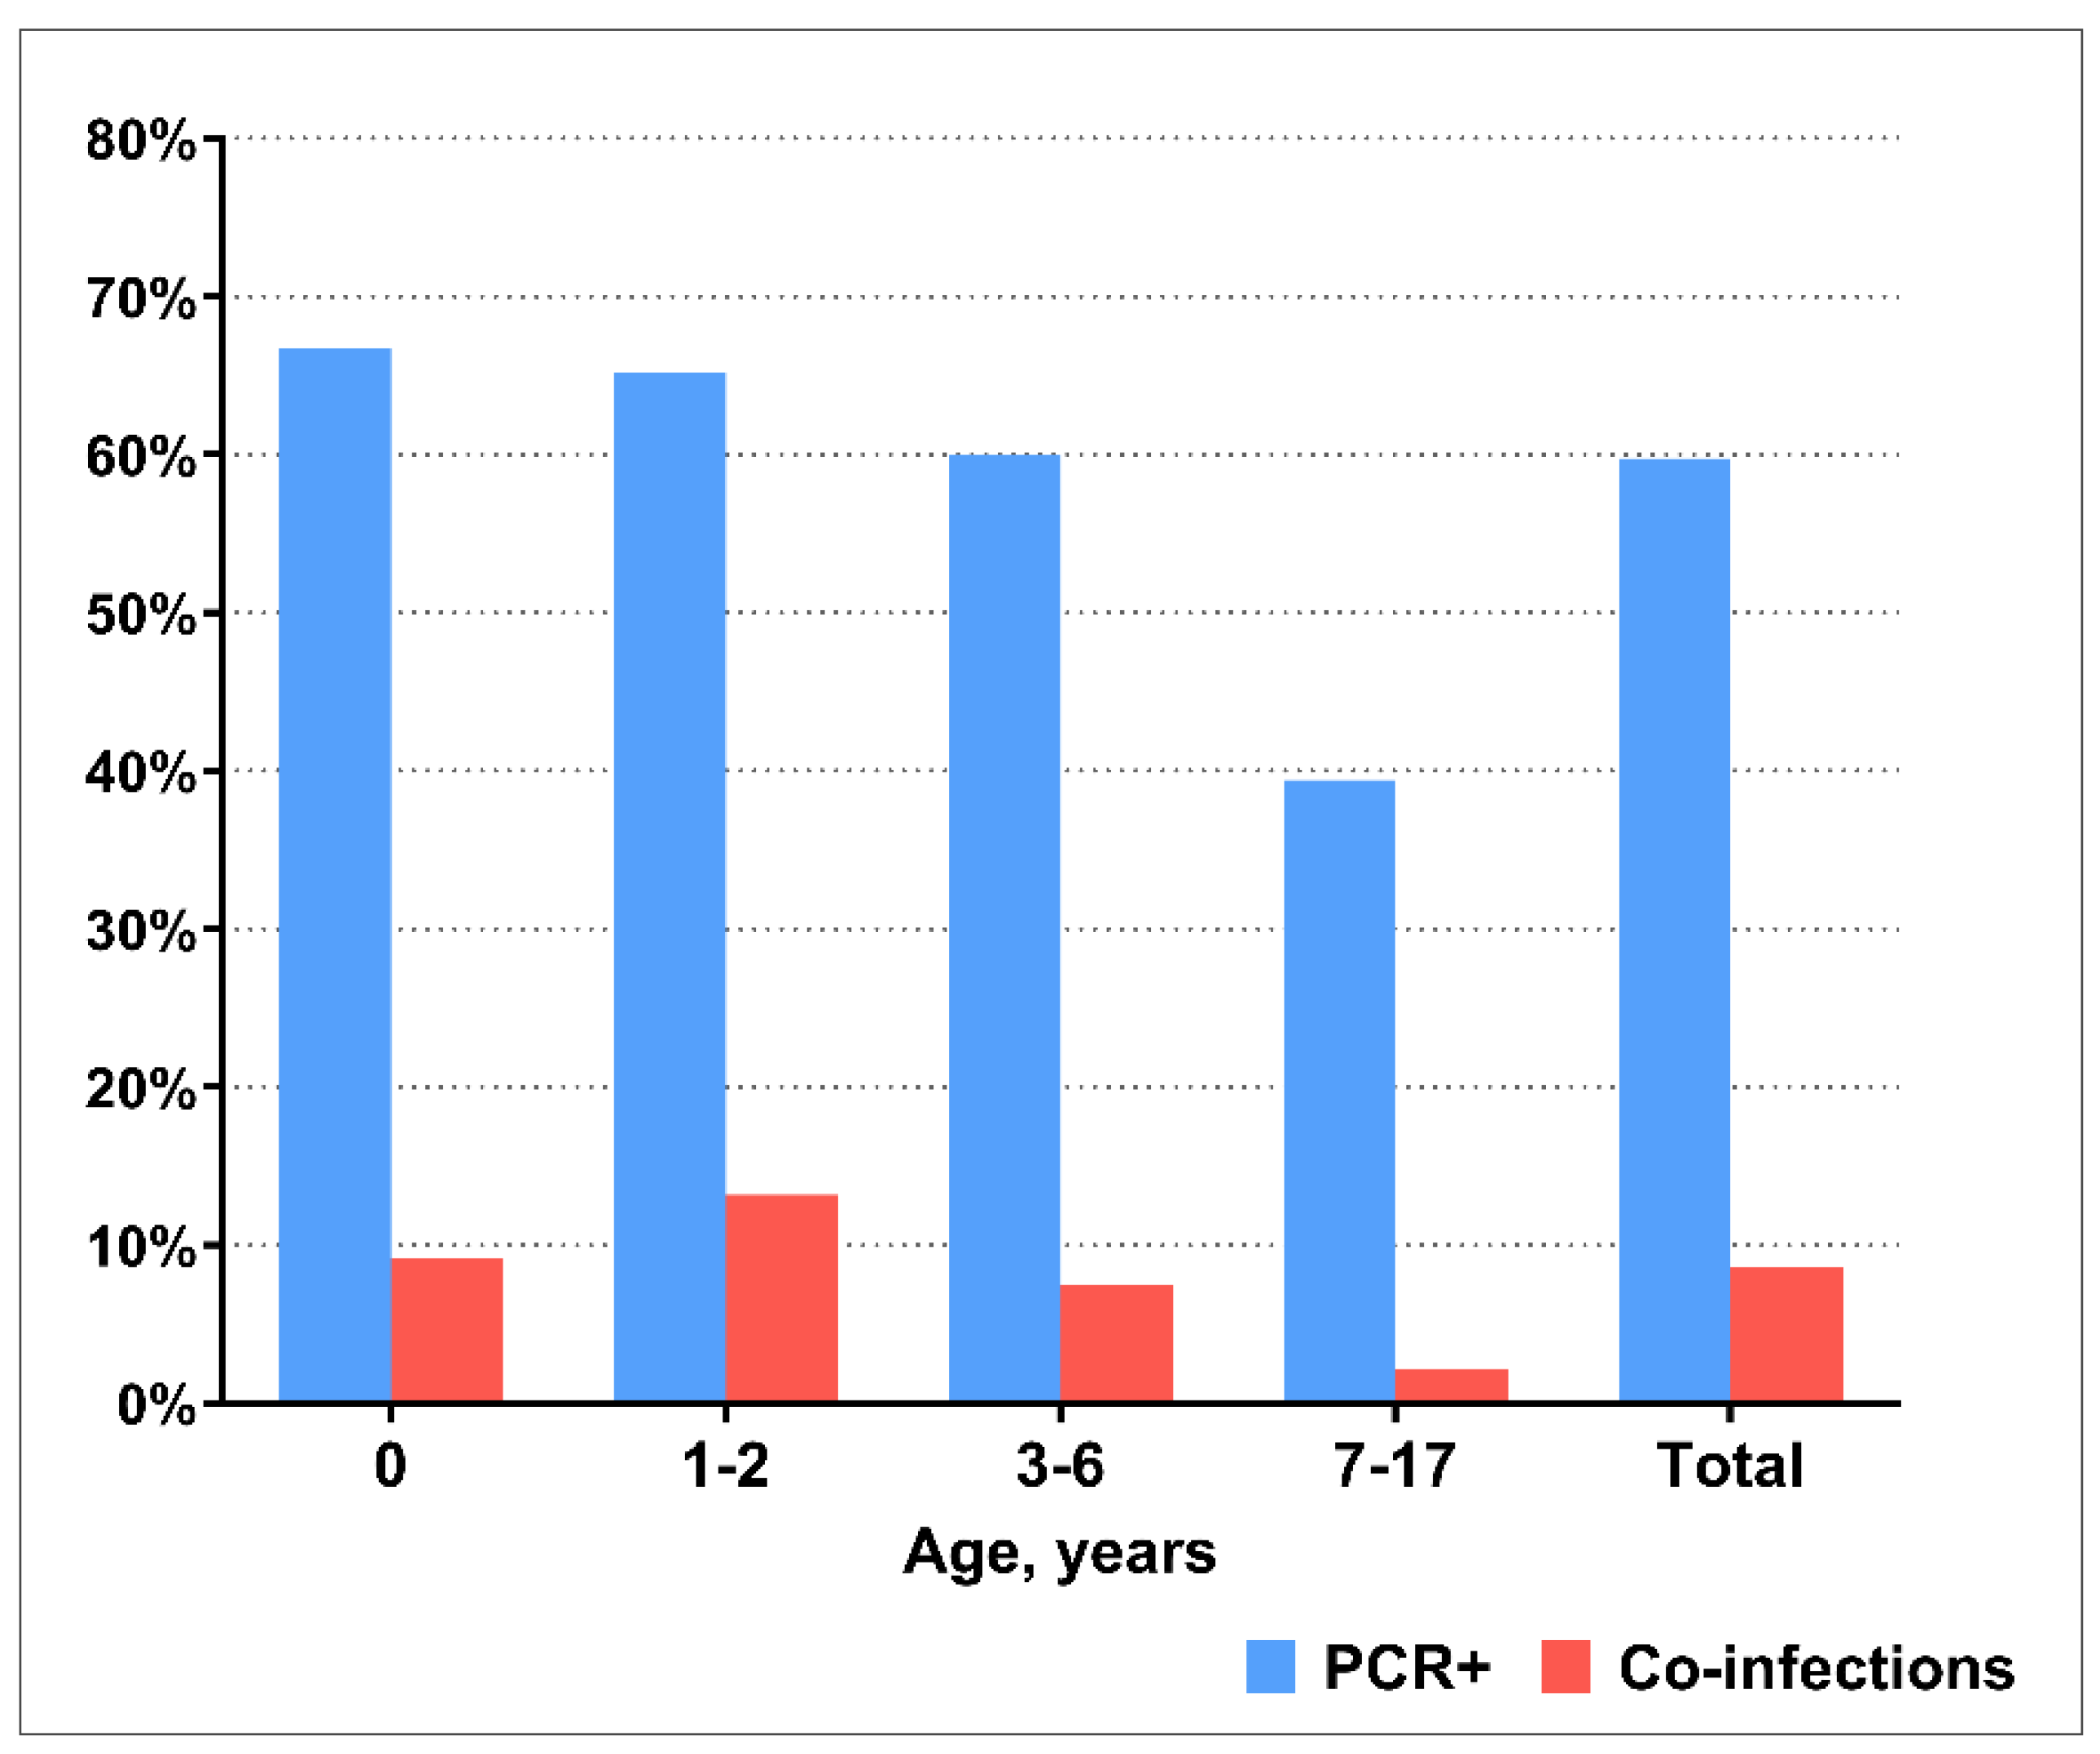
Figure 2.
Age distribution of respiratory viruses in hospitalized children in 2023-2024
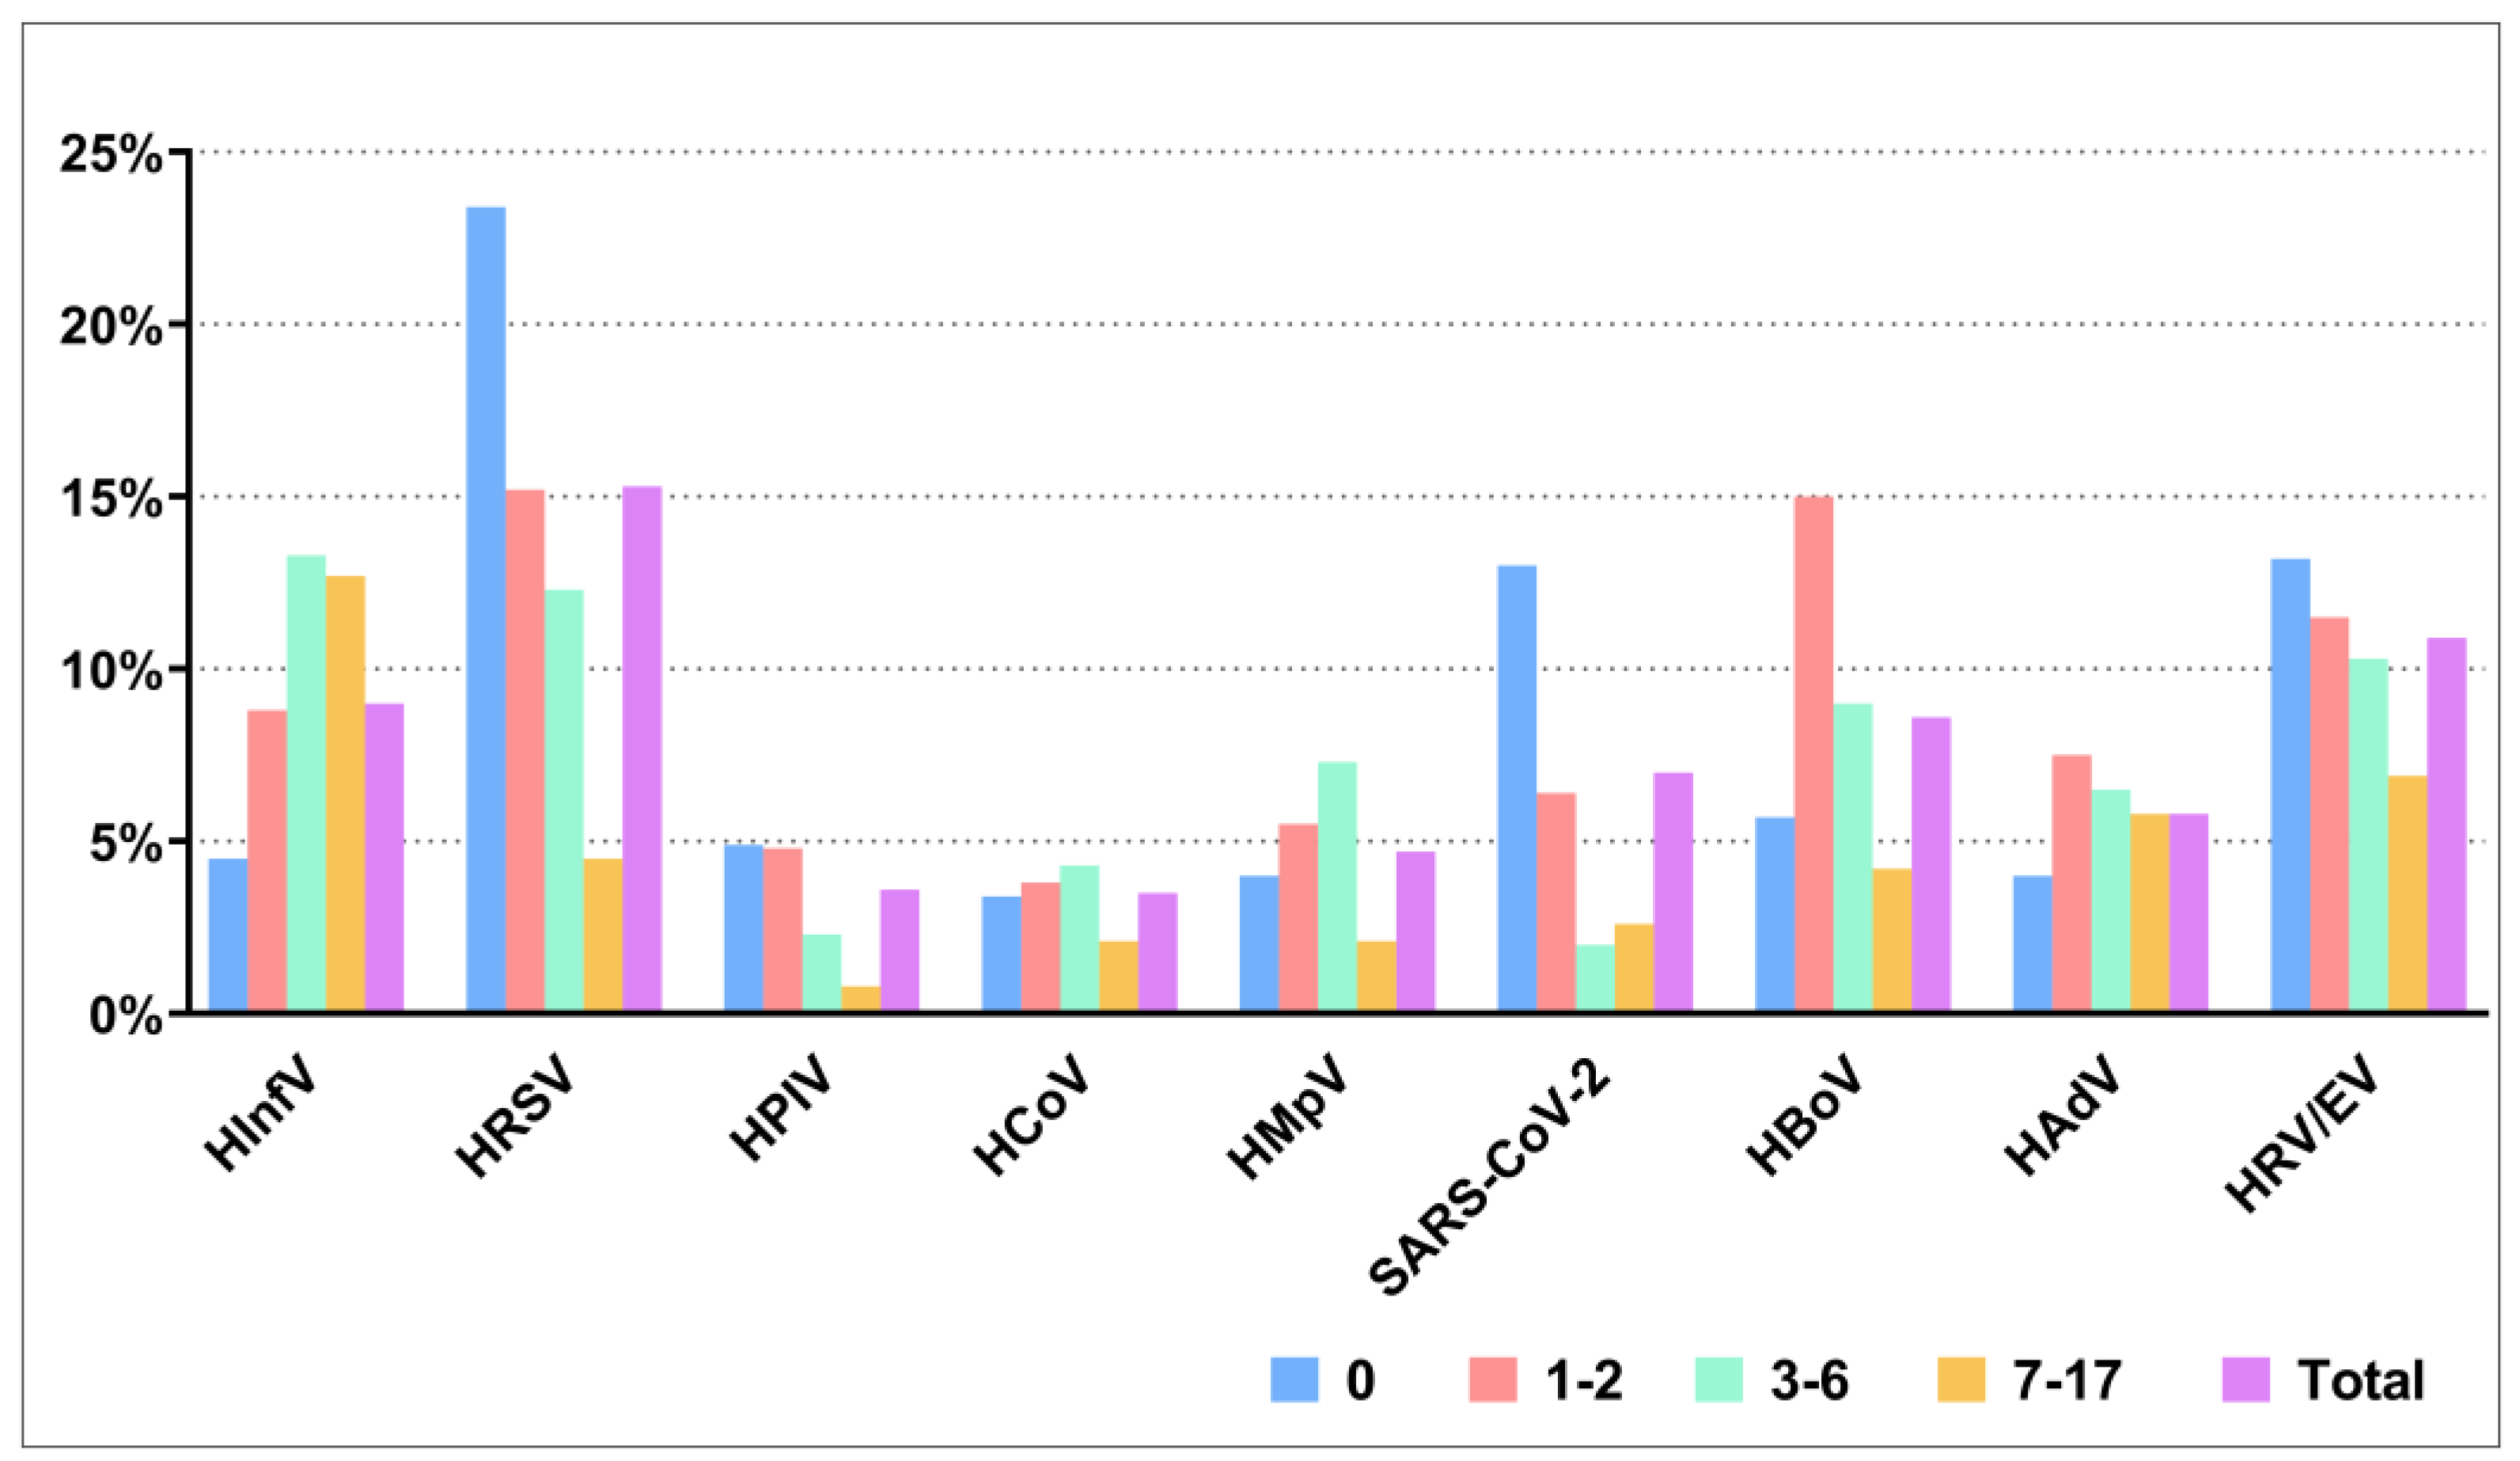
Figure 3.
Seasonal distribution of respiratory viruses in 2023-2024
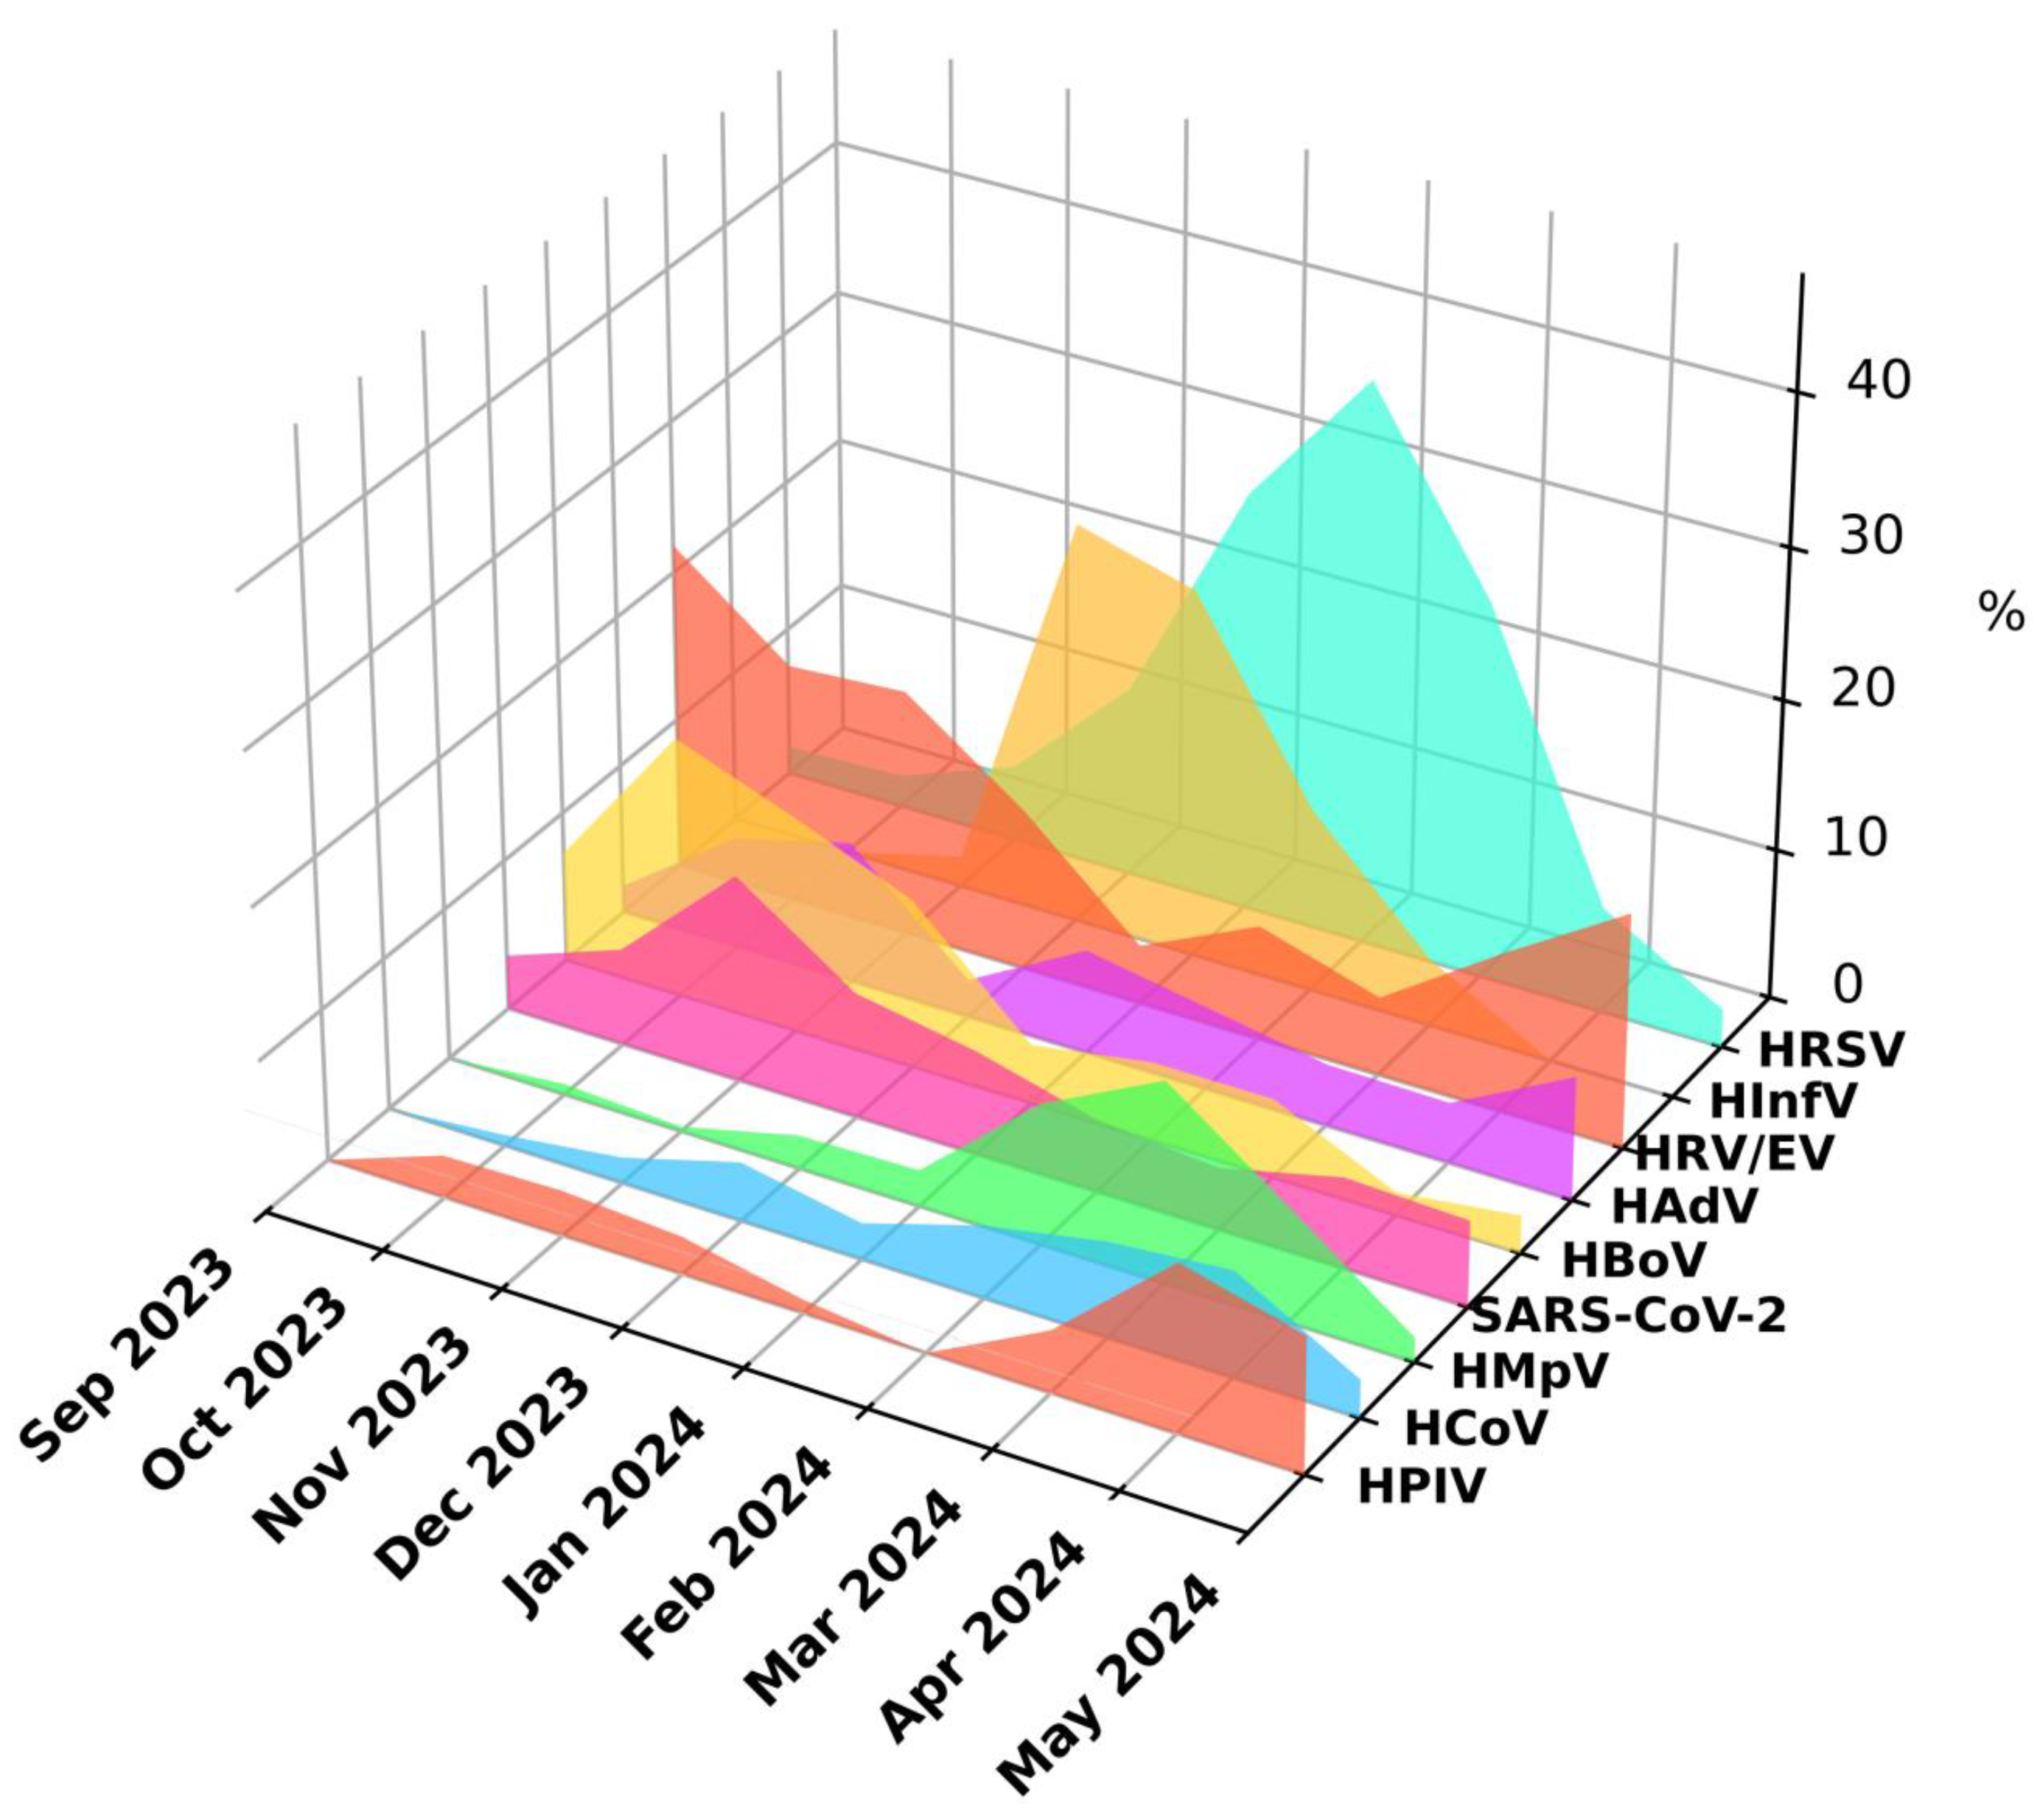
Figure 4.
The bar chart showing the standardized residuals obtained from the chi-square test. These residuals help estimate how much the observed frequencies differ from the expected ones, which allows us to identify statistically significant deviations in the distribution of symptoms. The red dotted line indicates the threshold |1.96|, which corresponds to the 95% significance level.
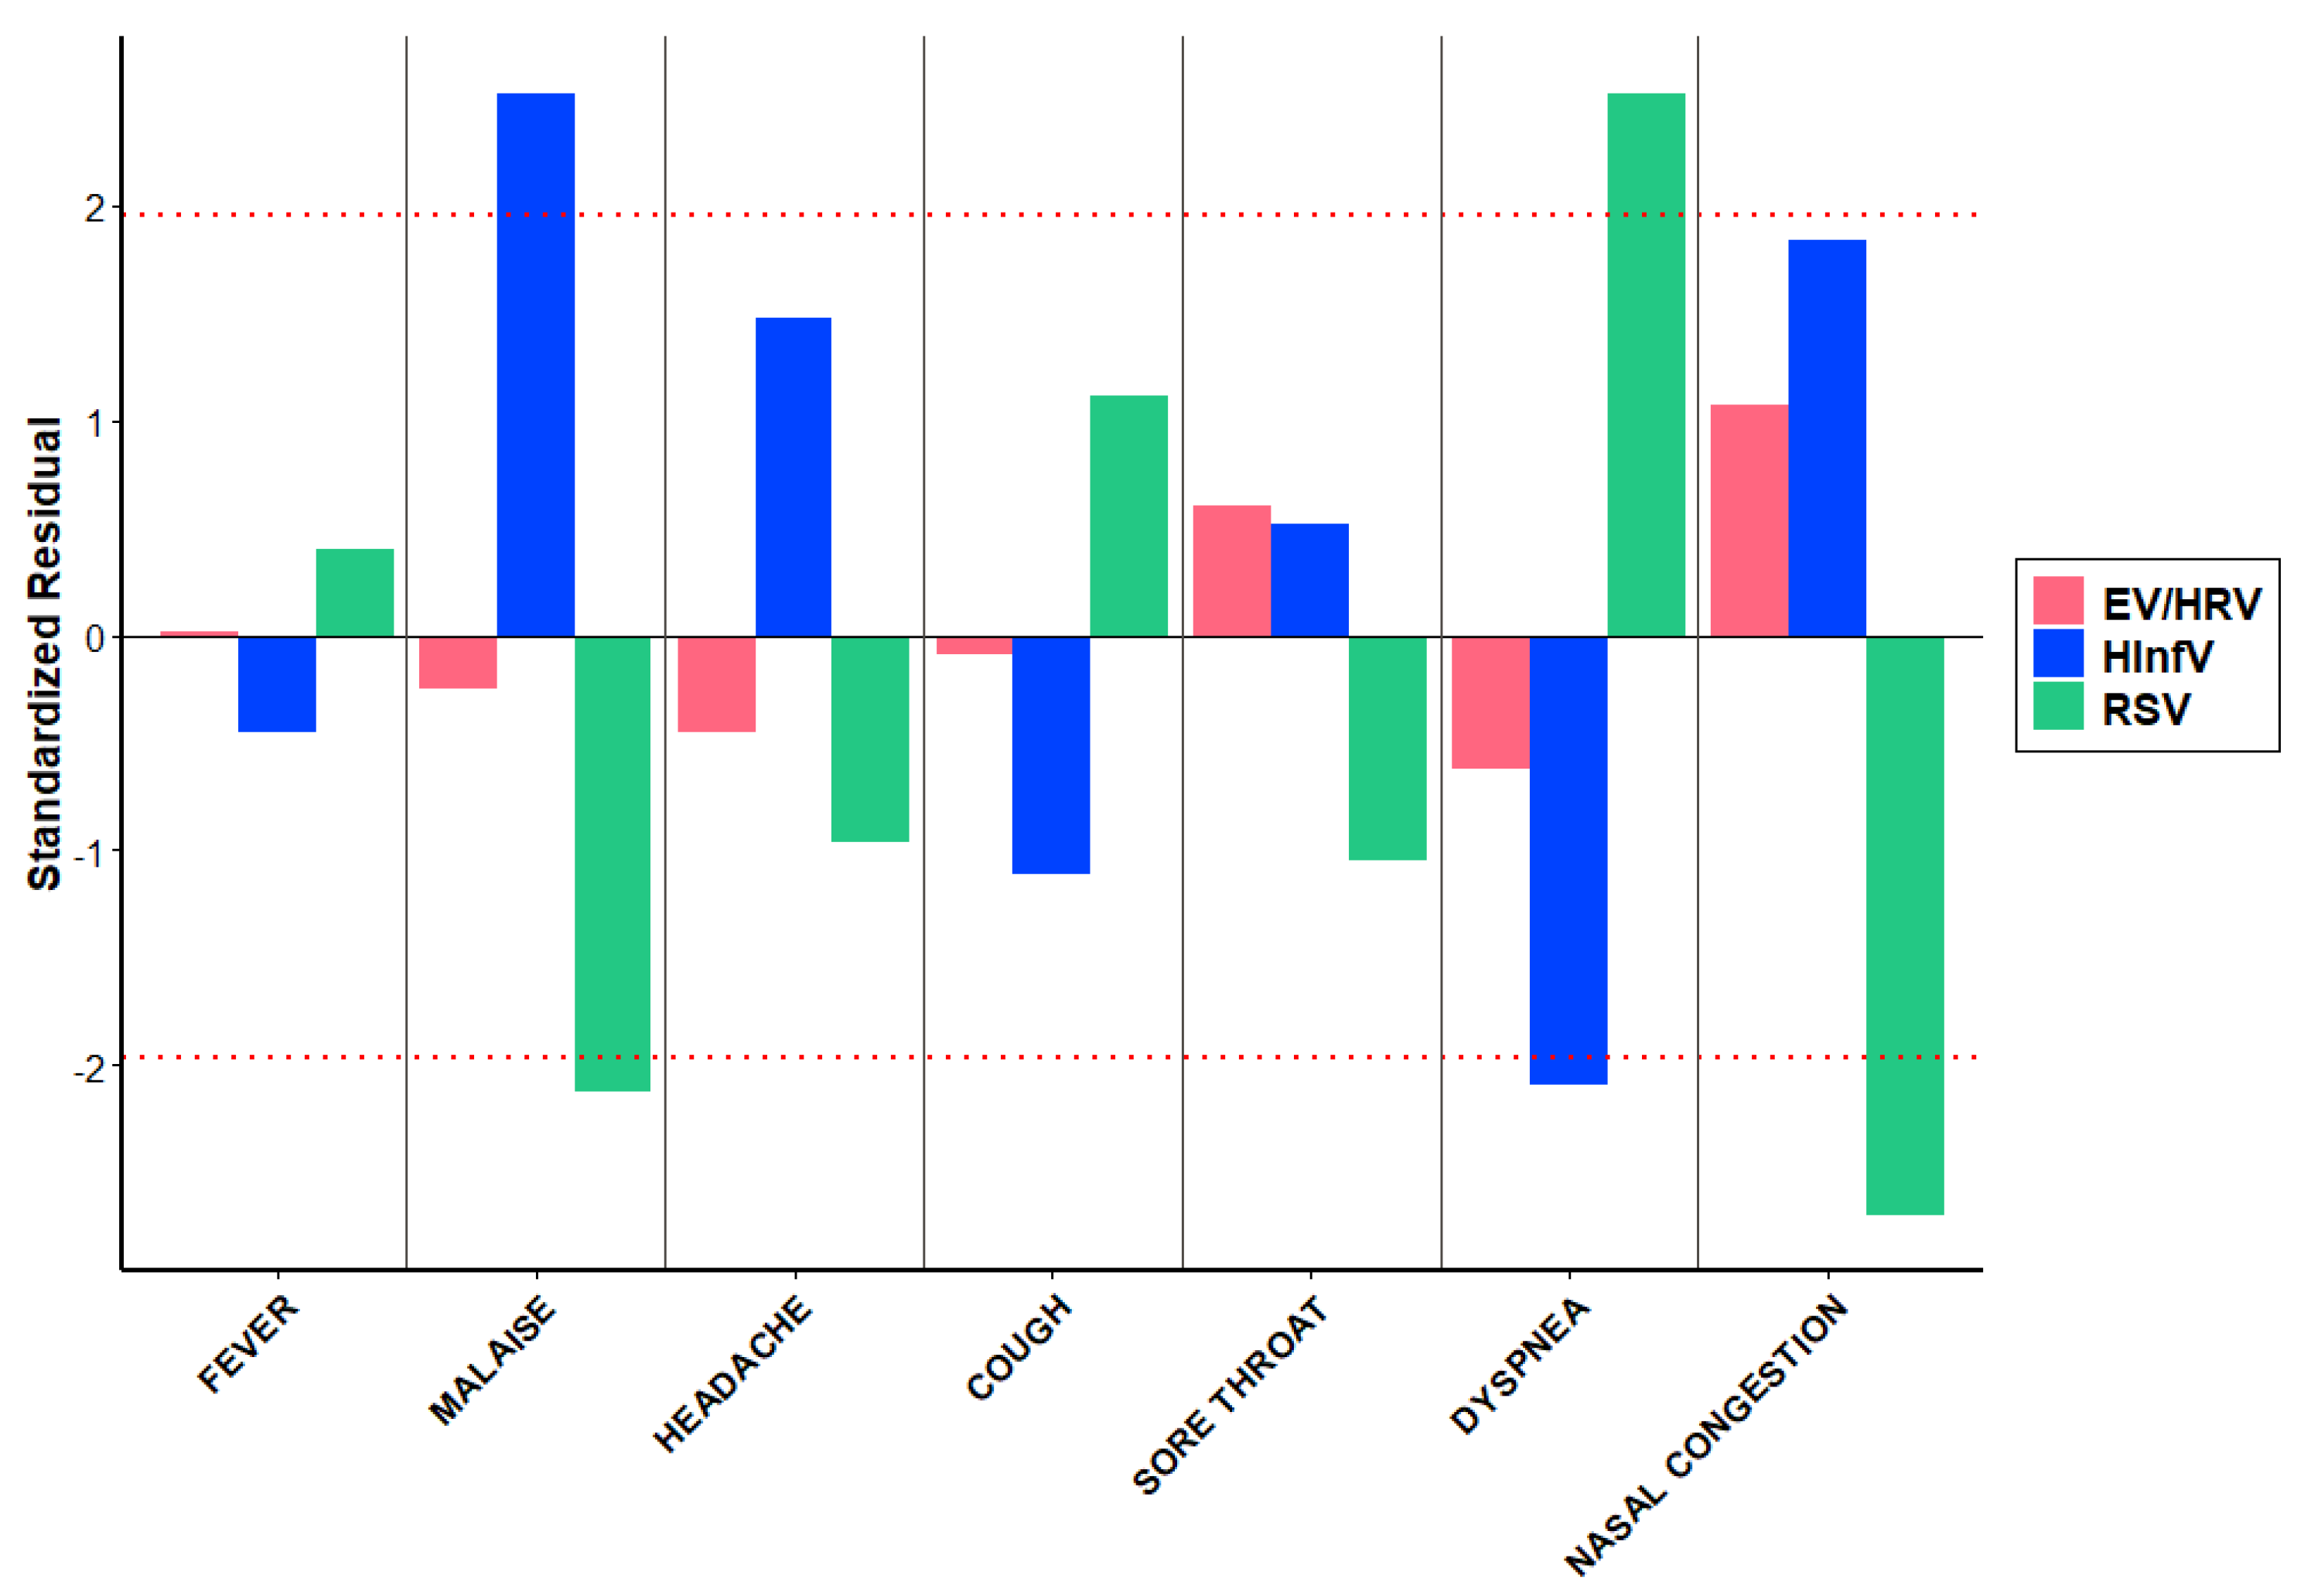
Figure 5.
Heatmap showing the occurrence of EV or RV among different months
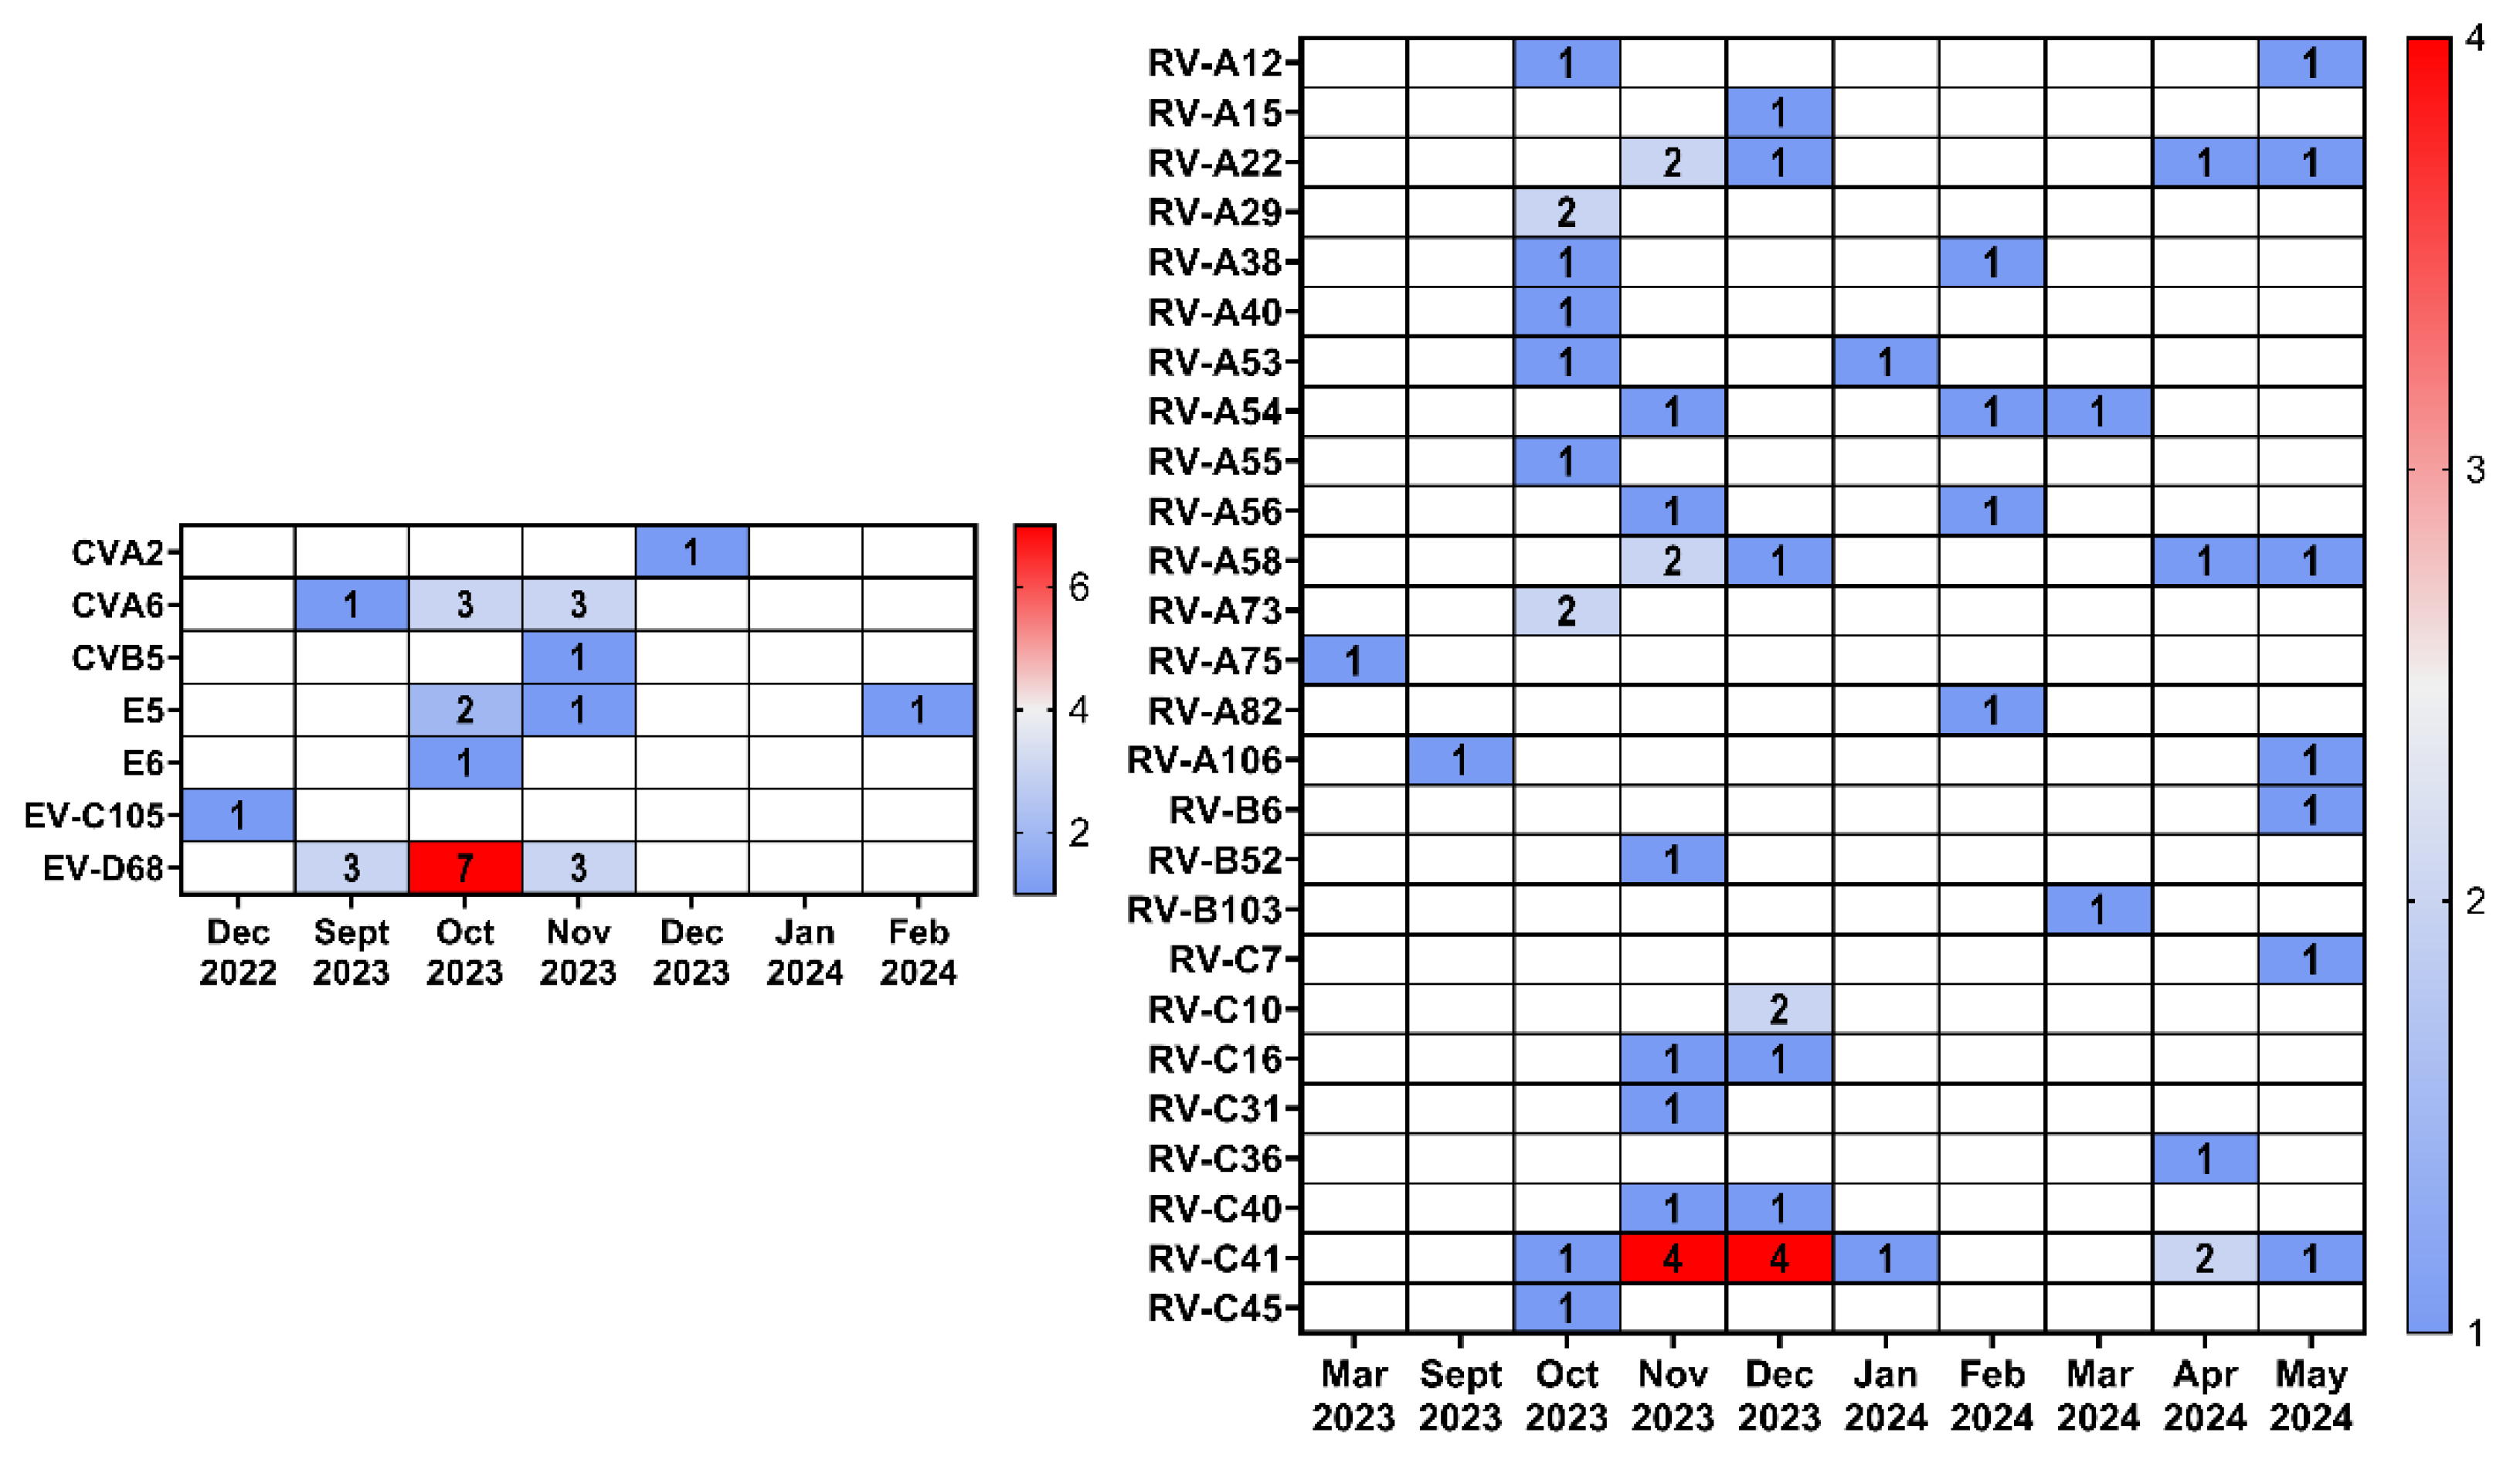
Figure 6.
The phylogenetic tree constructed from partial VP1 nucleotide sequences of rhinoviruses (161 sequences). The analysis was inferred using the Maximum Likelihood method (substitution model: GTR+F+I+G4+R). Reference strains for each species are shown with a blue circle; current study strains (n=56) are shown in red. Colored bars indicate the genotype. Ultrafast bootstrap > 70% and SH-aLRT > 60% support values (n=1000) are marked on the branches with purple circles, the size of which reflects the level of support.
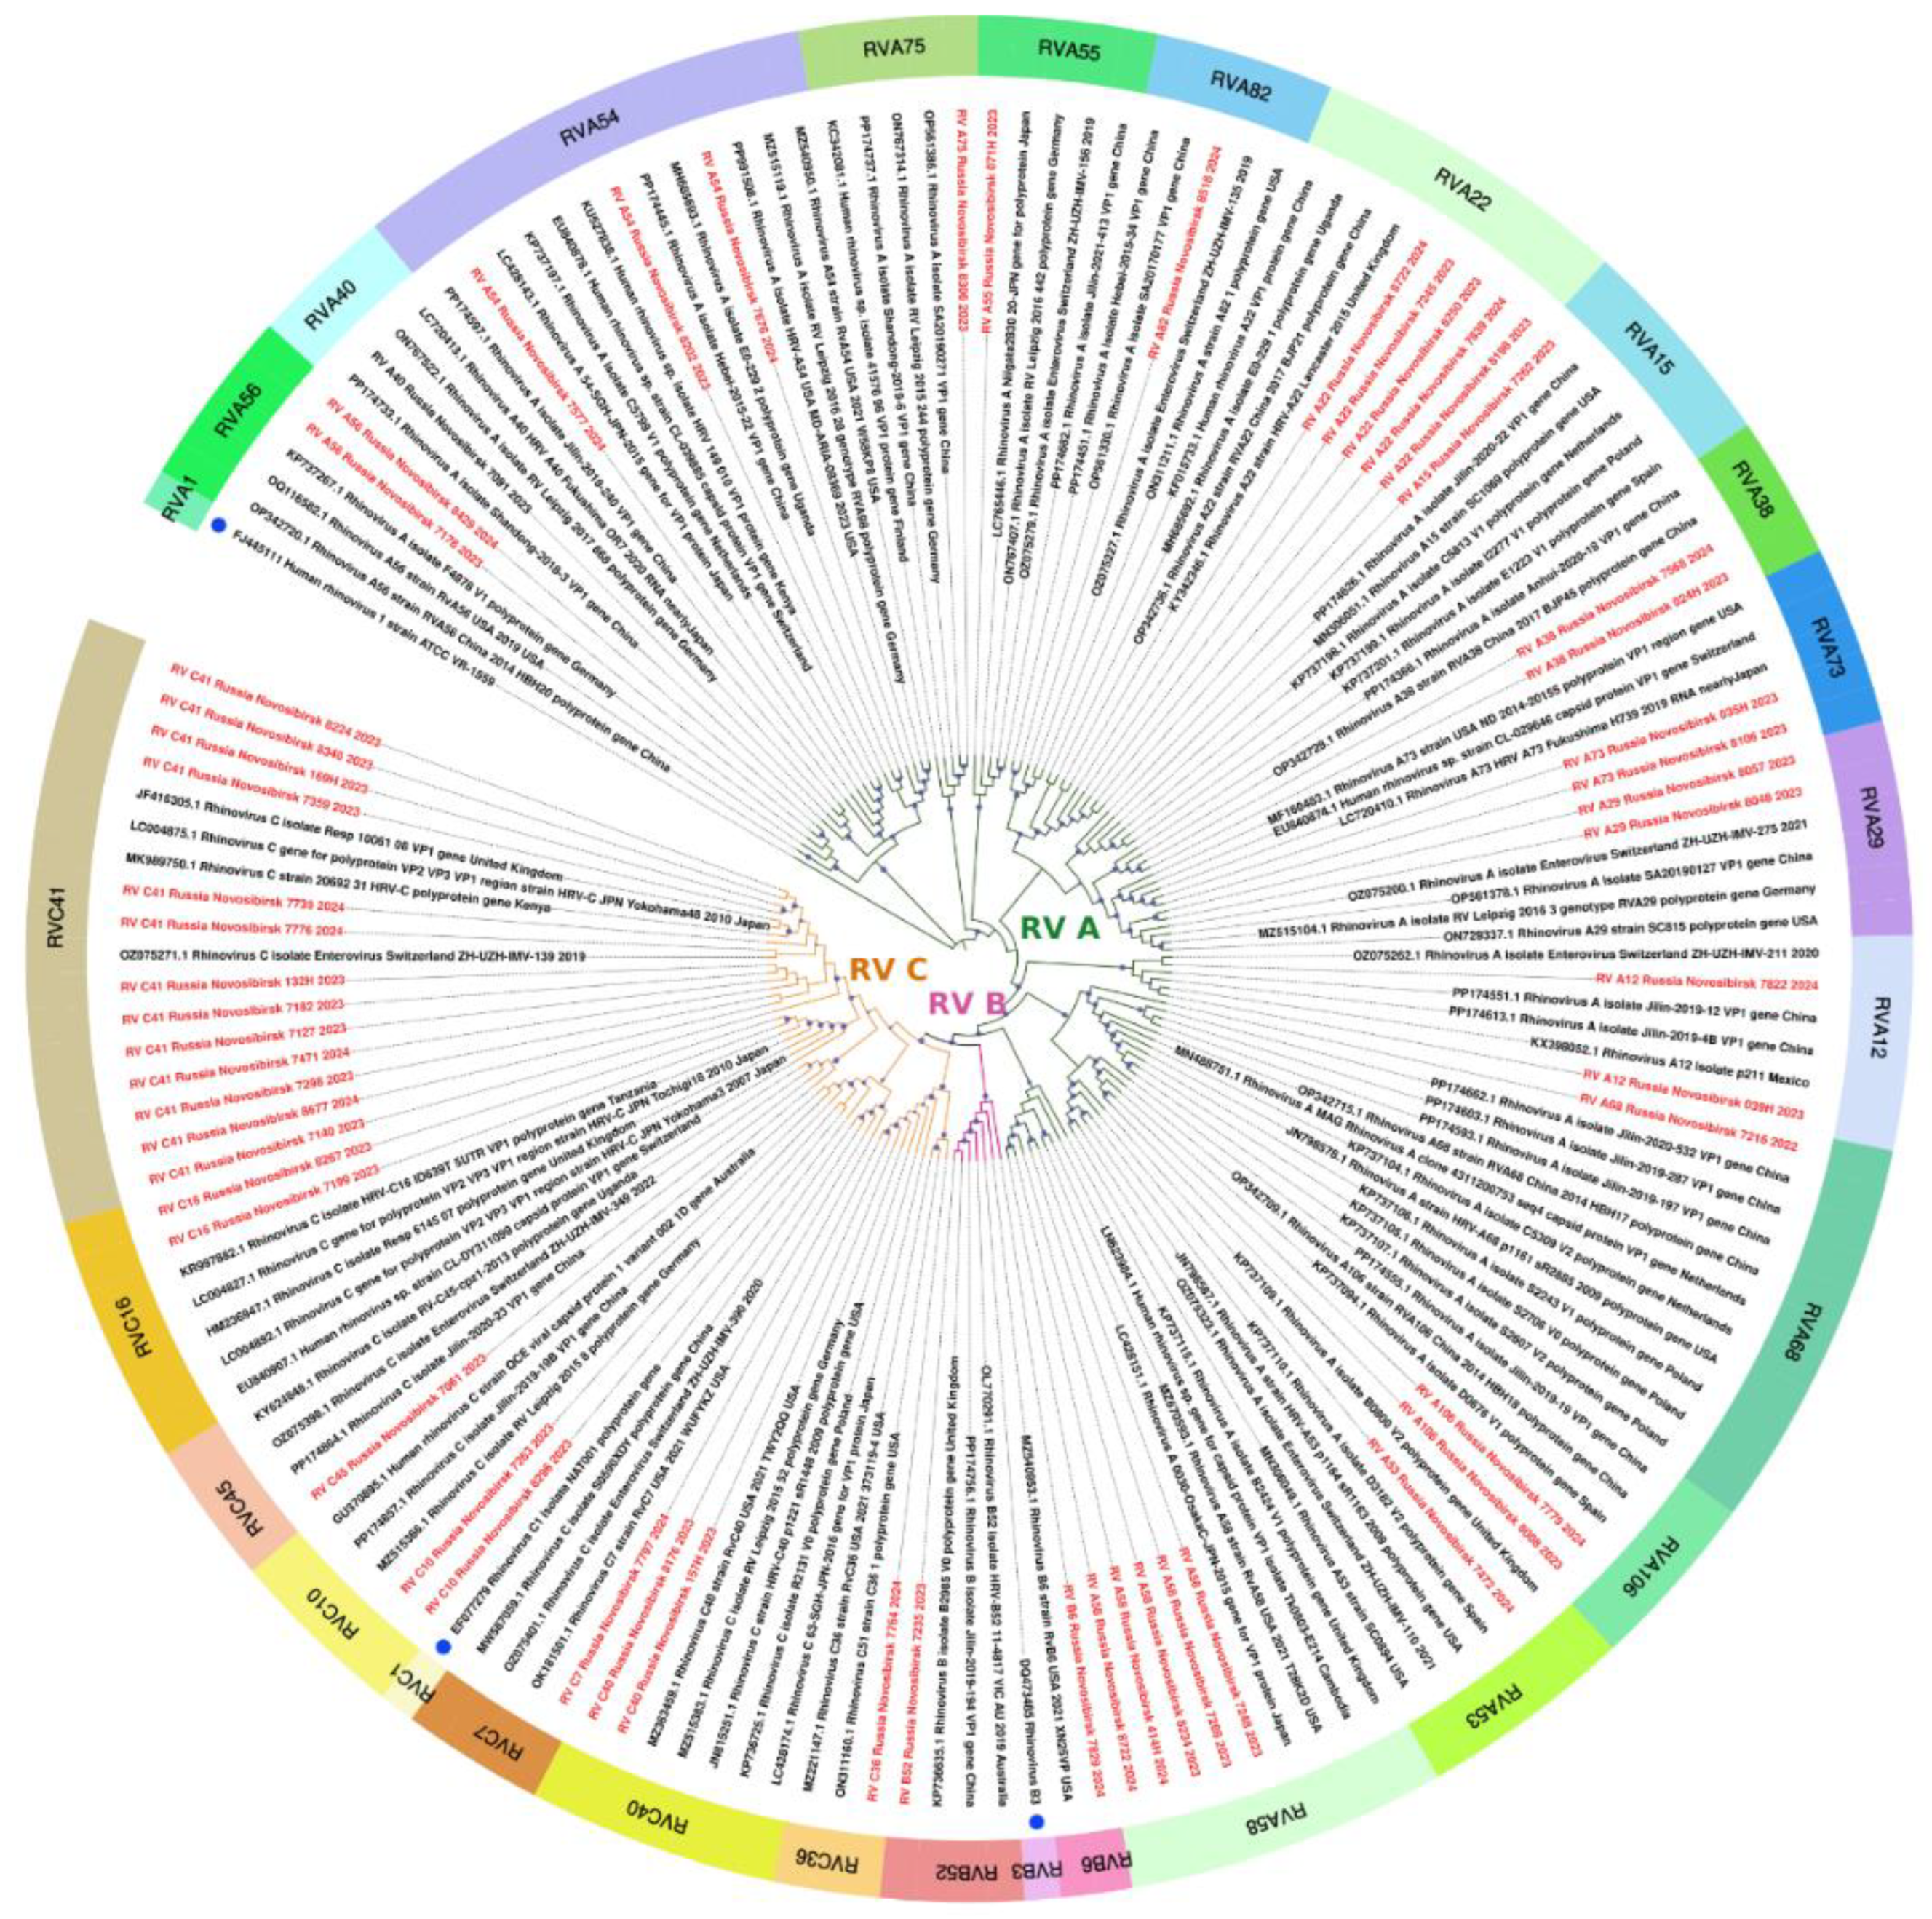
Figure 7.
The phylogenetic tree constructed from partial VP1 nucleotide sequences of enteroviruses (61 sequences). The analysis was inferred using the Maximum Likelihood method (substitution model: K2P+G4+R). Reference strains for each species are shown with a blue circle; current study strains (n=22) are shown in red. Colored bars indicate the genotype. Ultrafast bootstrap > 70% and SH-aLRT > 60% support values (n=1000) are marked on the branches with purple circles, the size of which reflects the level of support.
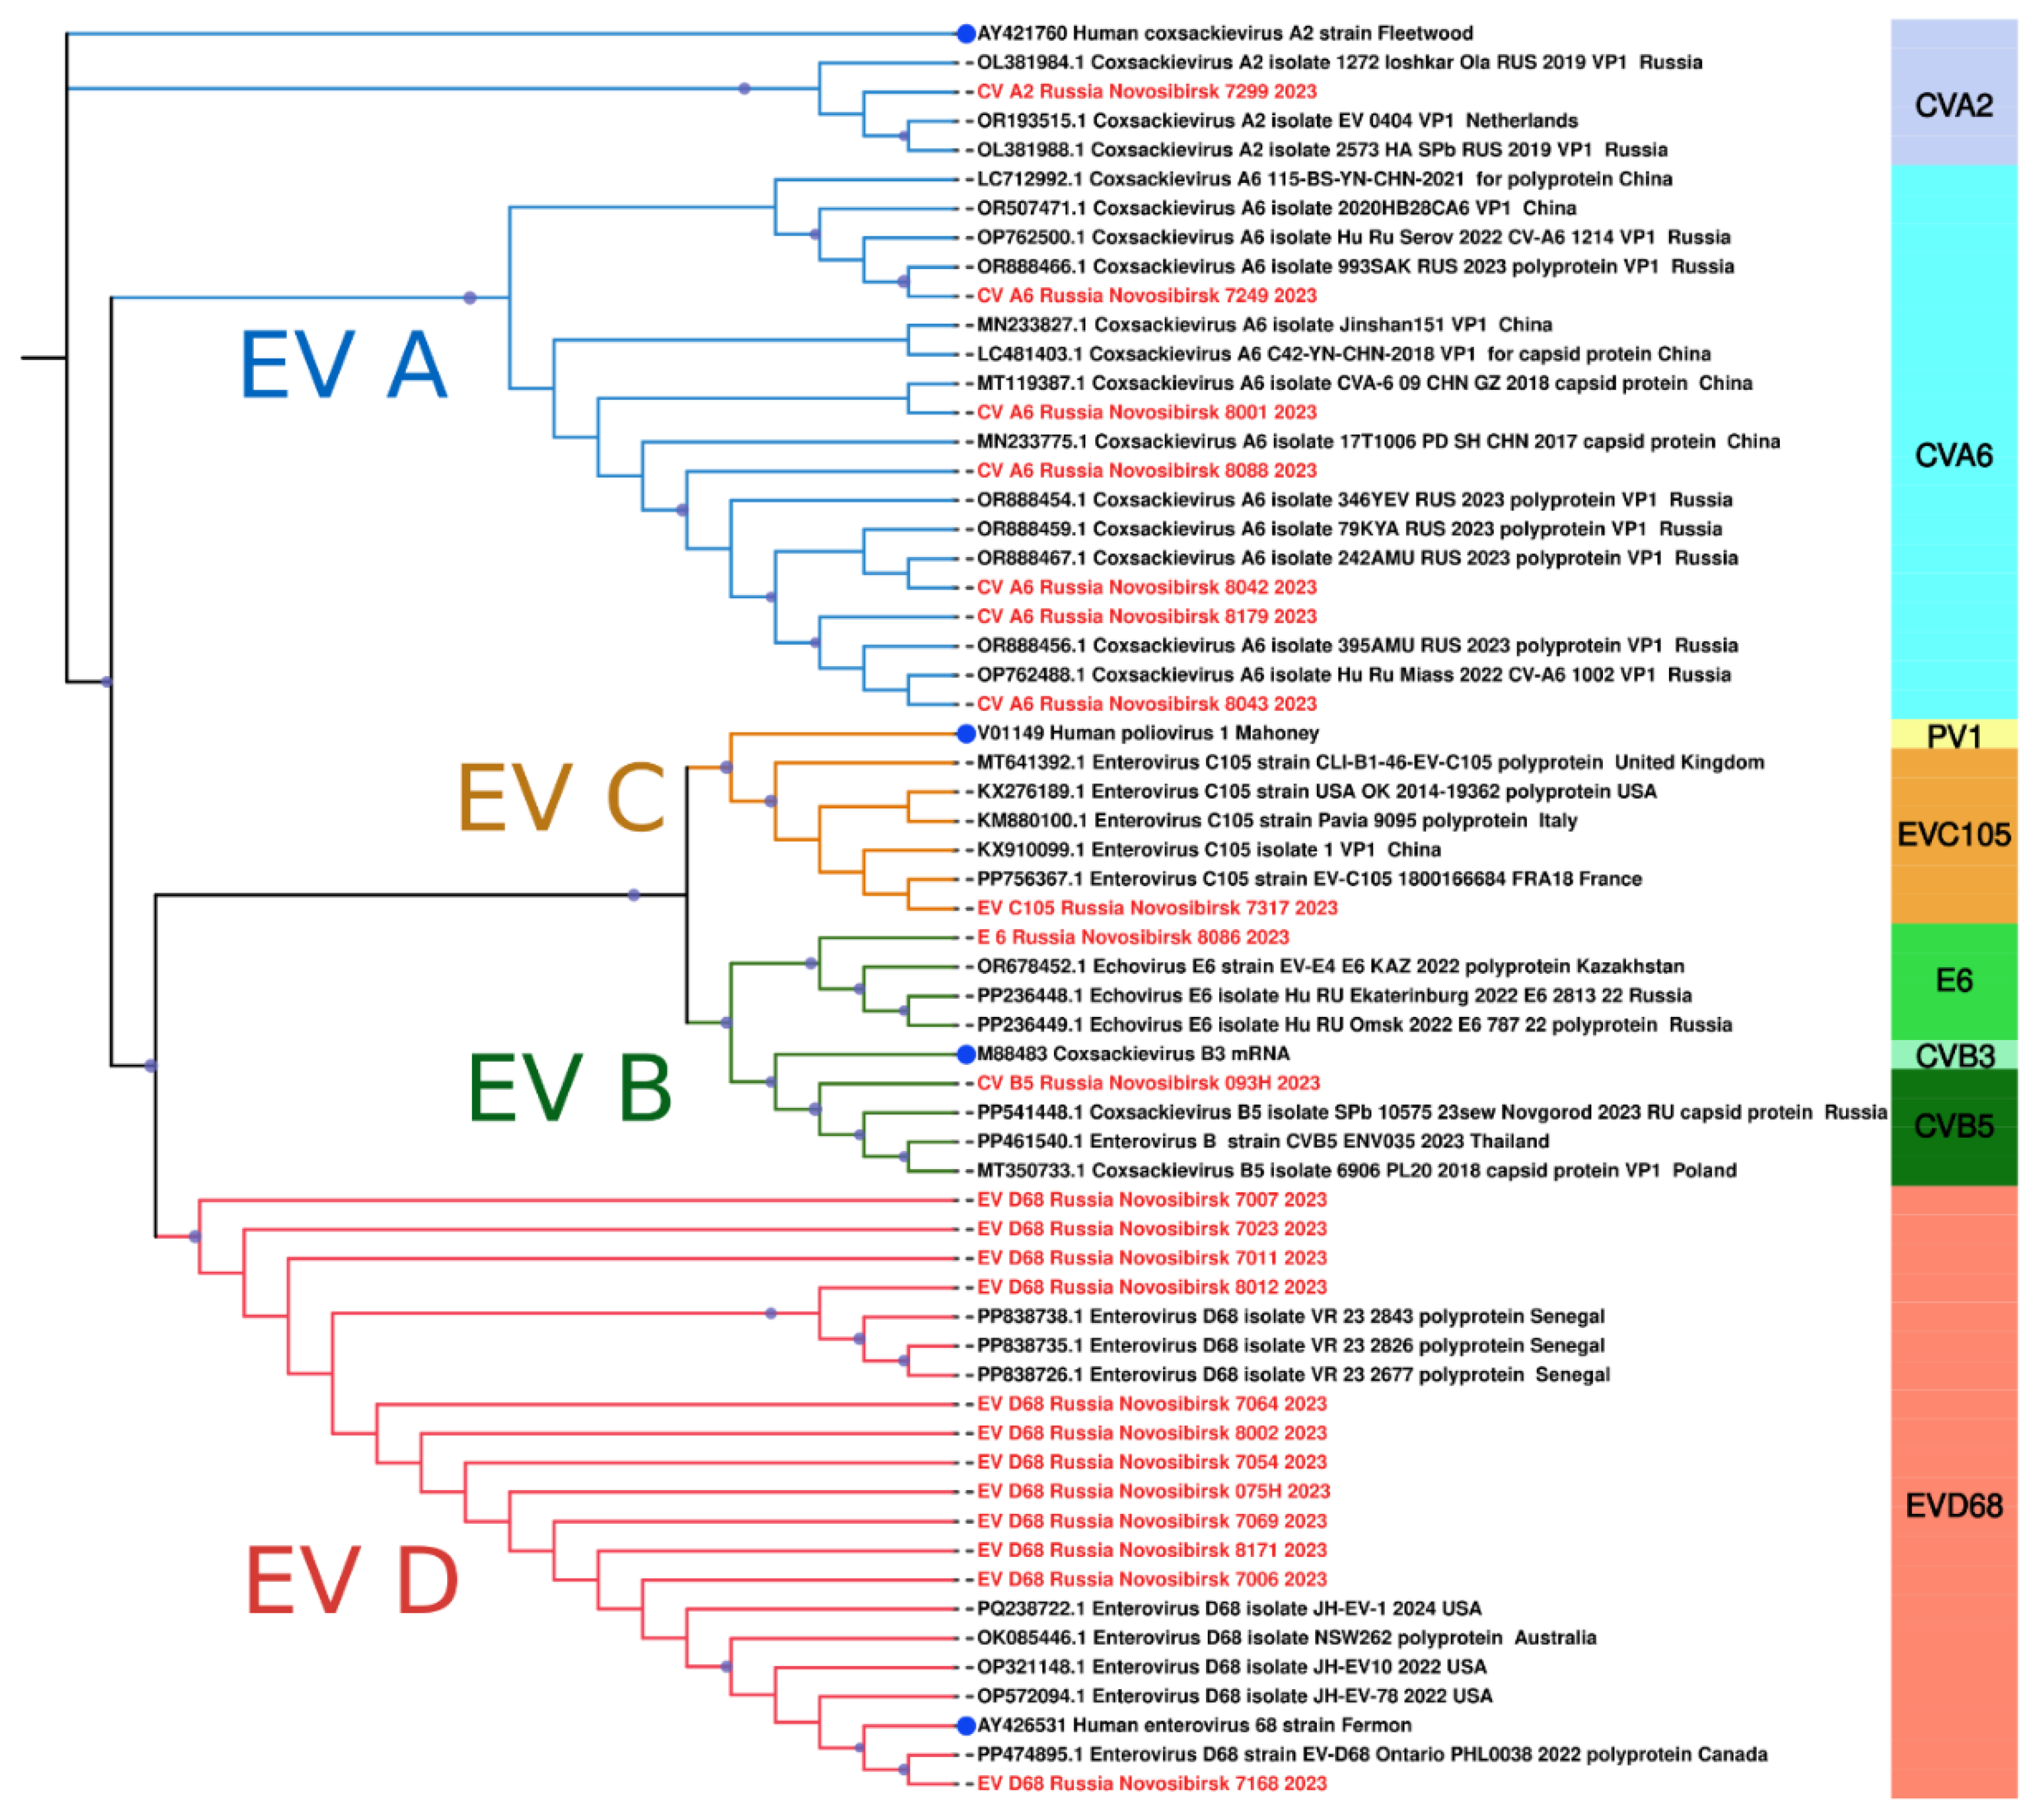
Figure 8.
The phylogenetic tree constructed from partial VP1 nucleotide sequences of enteroviruses D68 (139 sequences). The tree includes GenBank sequences belonging to known clades. The analysis was inferred using the Maximum Likelihood method (substitution model: TN+F+G4+R). Reference strain for enterovirus D68 is shown with a blue circle; current study strains (n=12) are shown in red. Ultrafast bootstrap > 70% and SH-aLRT > 60% support values (n=1000) are marked on the branches with purple circles, the size of which reflects the level of support.
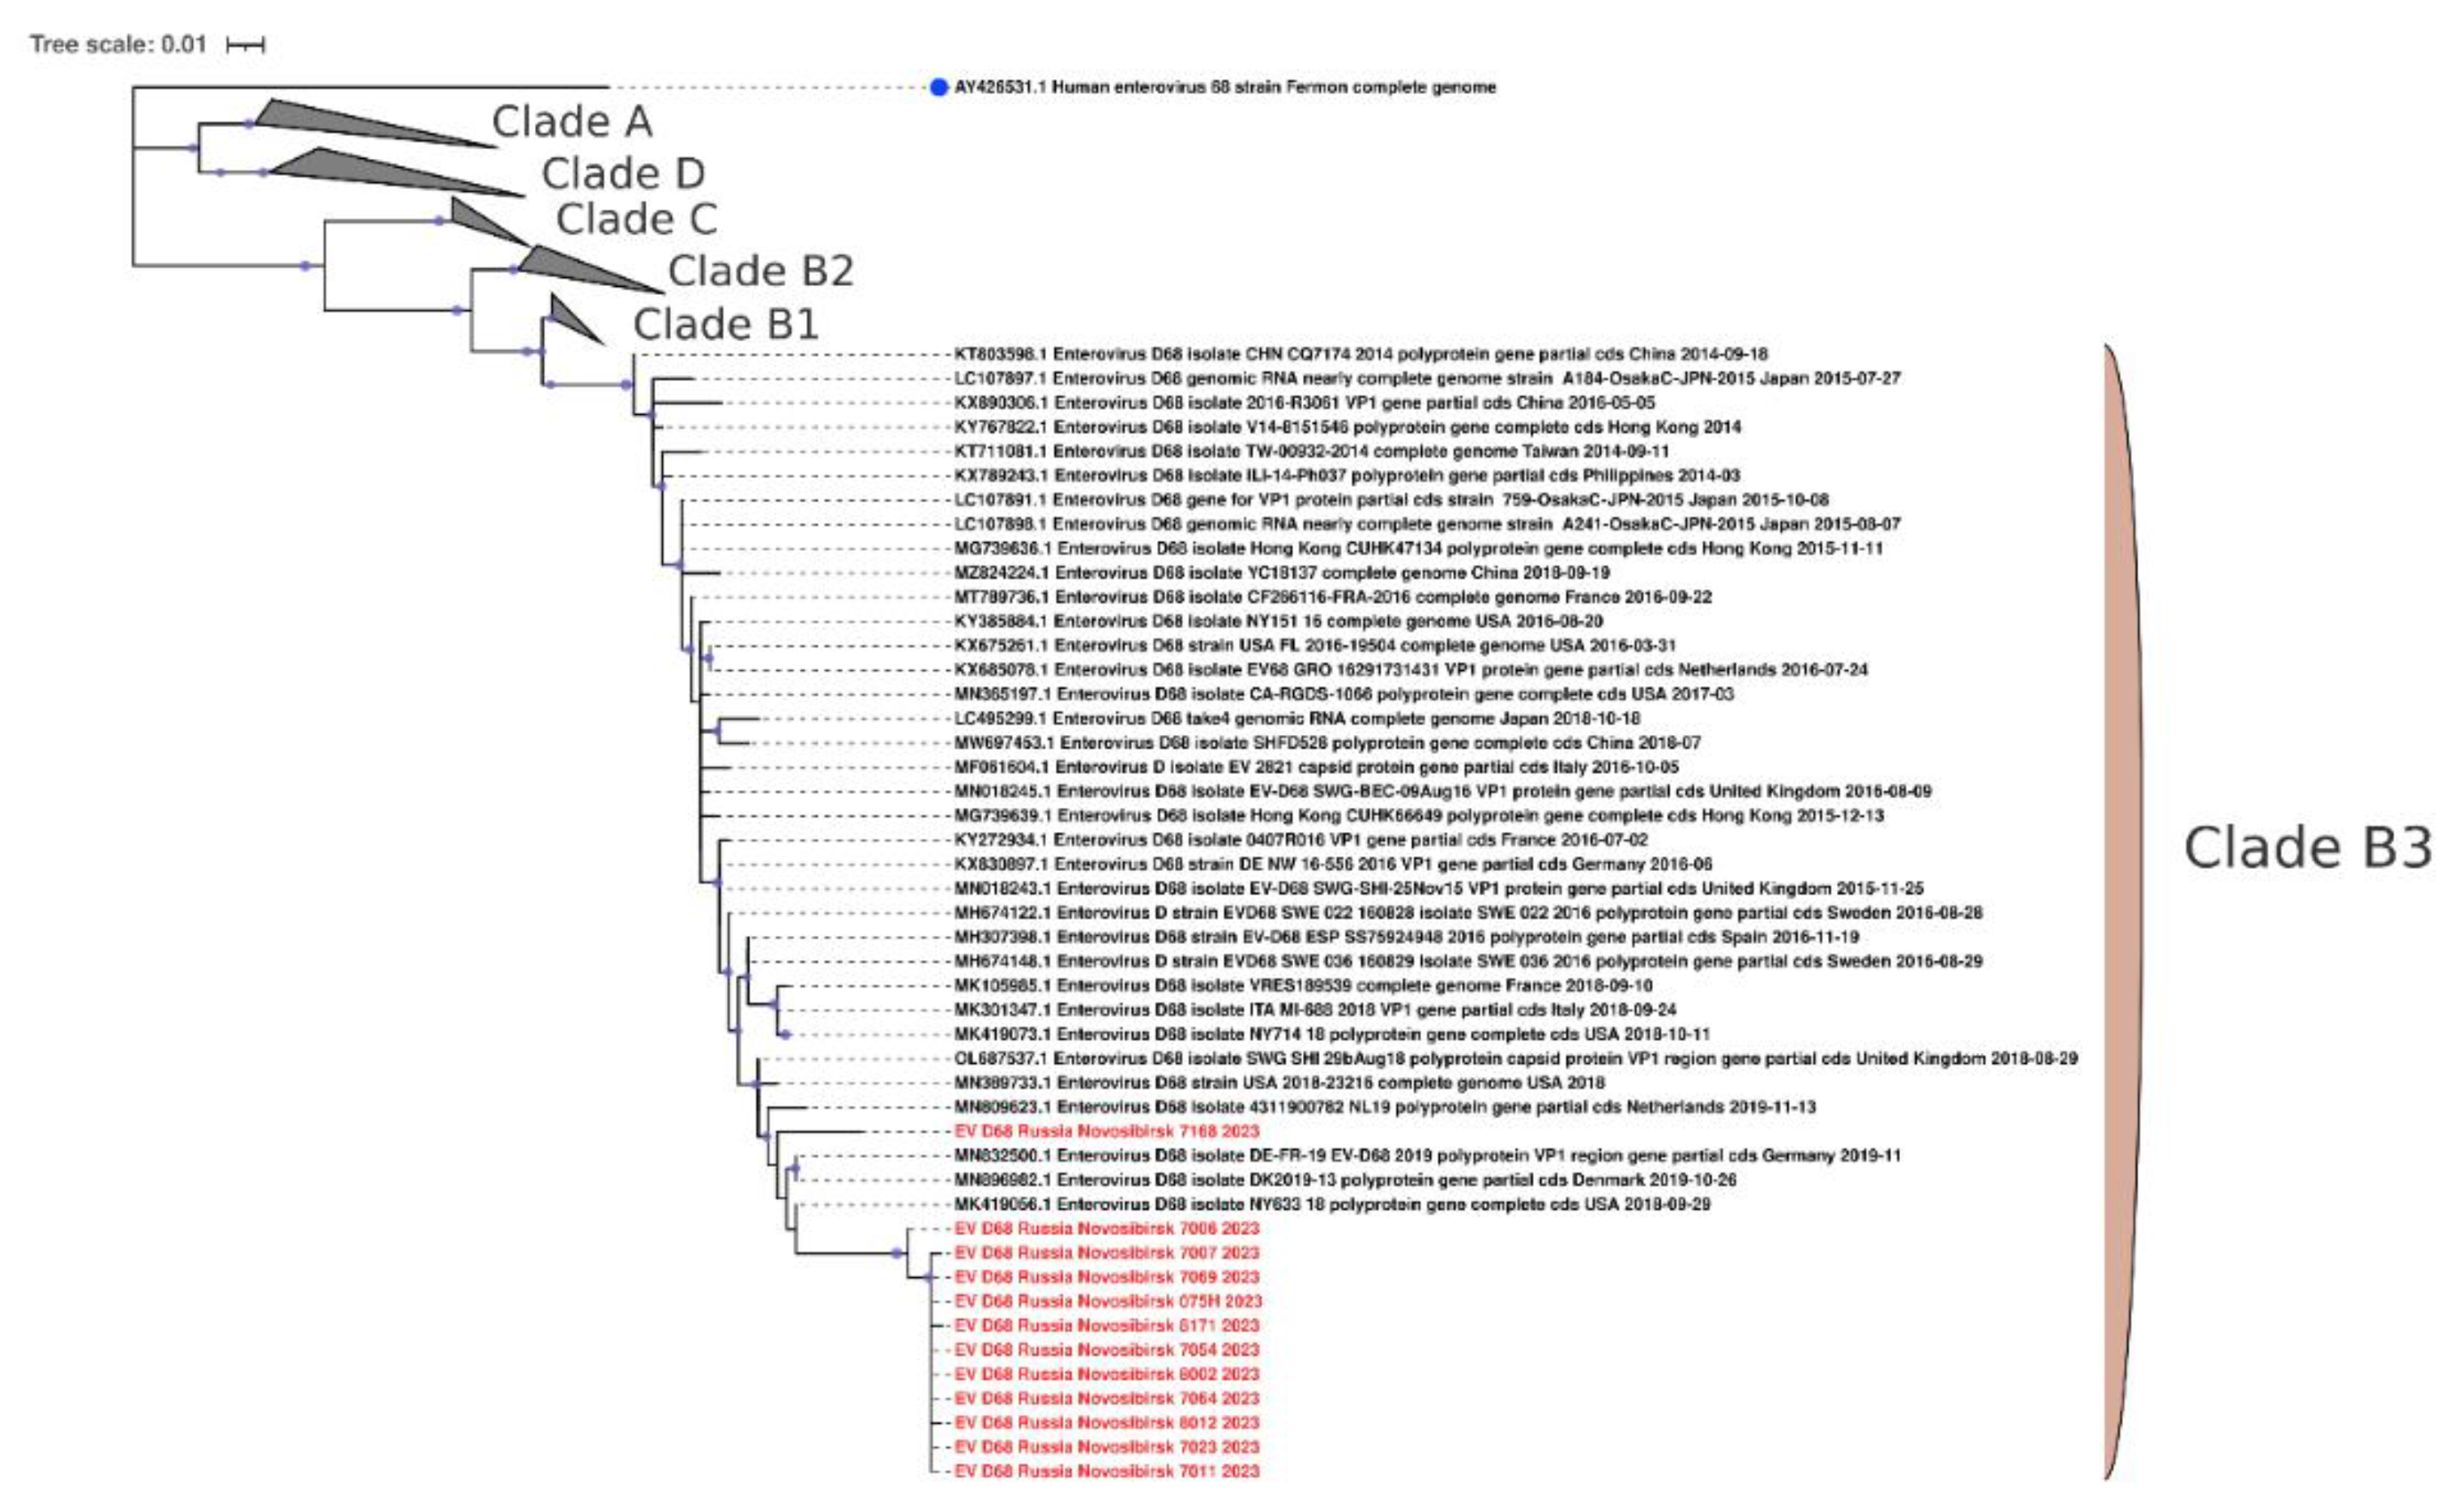

Table 1.
Primers used for cDNA synthesis and PCR amplification (according to WHO recommendations) [11]
Table 1.
Primers used for cDNA synthesis and PCR amplification (according to WHO recommendations) [11]
| Step | Primer Name | Sequence |
|---|---|---|
| cDNA (RT) primers | AN32 | 5’ GTY TGC CA 3’ |
| AN33 | 5’ GAY TGC CA 3’ | |
| AN34 | 5’ CCR TCR TA 3’ | |
| AN35 | 5’ RCT YTG CCA 3’ | |
| PCR 1 primers | SO224 (forward) | 5’ GCI ATG YTI GGI ACI CAY RT 3’ |
| SO222 (reverse) | 5’ C ICC IGG IGG IAY RWA CAT 3’ | |
| snPCR 2 primers | AN89 (forward) | 5’ CCA GCA CTG ACA GCA GYN GAR AYN GG 3’ |
| AN88 (reverse) | 5’ TAC TGG ACC ACC TGG NGG NAY RWA CAT 3’ |
Table 2.
Demographic characteristics of included patients.
| Age | Sex | ||
|---|---|---|---|
| Male | Female | Total | |
| 0 – 12 months | 372 (18.7%) |
295 (14.8%) |
667 (33.5%) |
| 1 – 2 years | 318 (15.9%) |
229 (11.5%) |
547 (27.4%) |
| 3 – 6 years | 213 (10.7%) |
187 (9.4%) |
400 (20.1%) |
| 7 – 17 years | 195 (9.8%) |
183 (9.2%) |
378 (19.0%) |
| Total |
1098 (55.1%) |
894 (44.9%) |
1992 (100%) |
Note: the percentage is calculated from the total number of collected samples
Table 3.
Distribution of HRV/EV among different age groups. Absolute, relative frequencies with 95% CI and relative risk of HRV/EV-infection are indicated
Table 3.
Distribution of HRV/EV among different age groups. Absolute, relative frequencies with 95% CI and relative risk of HRV/EV-infection are indicated
| Age | Presence of EV/HRV | Risk ratio of EV/HRV infection, 95%CI |
|---|---|---|
| 0 years (n=667) | 89, 13.34% [10.97-16.14] |
RR=1.35 [1.05-1.74]* |
| 1-2 years (n=547) | 64, 11.70% [9.27-14.67] |
RR=1.08 [0.82-1.43] |
| 3-6 years (n=400) | 41, 10.25% [7.65-13.61] |
RR=0.91 [0.66-1.26] |
| 7-17 years (n=378) | 26, 6.88% [4.74-9.89] |
RR=0.57 [0.39-0.85]* |
*- indicates statistical significance
Table 4.
Distribution of symptoms among the most common respiratory viruses and enteroviruses/rhinoviruses. Absolute, relative frequencies and 95% CI are indicated.
Table 4.
Distribution of symptoms among the most common respiratory viruses and enteroviruses/rhinoviruses. Absolute, relative frequencies and 95% CI are indicated.
| Symptoms | HRV/EV (n=220) |
HInfV (n=178) |
RSV (n=306) |
Comparison |
|---|---|---|---|---|
| Fever | 161, 73.18% [66.81-78.91] |
161, 90.45% [85.15-94.34] |
231, 75.49% [70.27-80.21] |
Chi2=23.75; p=0.020* |
| Malaise | 61, 27.73% [21.92-34.14] |
80, 44.94% [37.49-52.56] |
74, 24.18% [19.49-29.38] |
|
| Headache | 1, 0.45% [0.12-0.25] |
3, 1.69% [0.35-4.85] |
1, 0.33% [0-1.81] |
|
| Cough | 156, 70.91% [64.43-76.82] |
151, 84.83% [78.70-89.76] |
232, 75.82% [70.62-80.51] |
|
| Sore throat | 8, 3.64% [1.58-7.04] |
8, 4.49% [1.96-8.66] |
7, 2.29% [0.92-4.66] |
|
| Dyspnea | 70, 31.82% [25.72-38.42] |
62, 34.83% [27.86-42.32] |
123, 40.20% [34.66-45.93] |
|
| Nasal congestion | 45, 20.45% [15.33-26.40] |
50, 28.09% [21.62-35.30] |
41, 13.40% [9.79-17.73] |
|
| Median Temperature, °C | 38.3 (37.8-38.9) | 39.4 (39.0-39.8) | 38.6 (38.0-39.1) | H=137.9, p<0.001* |
| Hypoxia | 70, 31.82% [26.02-38.24] |
58, 32.58% [26.13-39.77] |
131, 42.81% [37.39-48.41] |
H=8.5, p=0.015* |
| ICU | 7, 3.18% [1.55-6.42] |
8, 4.49% [2.30-8.62] |
5, 1.63% [0.70-3.77] |
H=3.5, p=0.177 |
*- indicates statistical significance
Table 5.
HRV/EV genotypes distribution
| Species | Genotypes | Number of samples |
|---|---|---|
| Rhinovirus A | RV-A12 | 2 |
| RV-A15 | 1 | |
| RV-A22 | 5 | |
| RV-A29 | 2 | |
| RV-A38 | 2 | |
| RV-A40 | 1 | |
| RV-A53 | 2 | |
| RV-A54 | 3 | |
| RV-A55 | 1 | |
| RV-A56 | 2 | |
| RV-A58 | 5 | |
| RV-A73 | 2 | |
| RV-A75 | 1 | |
| RV-A82 | 1 | |
| RV-A106 | 2 | |
| Rhinovirus B | RV-B6 | 1 |
| RV-B52 | 1 | |
| RV-B103 | 1 | |
| Rhinovirus C | RV-C7 | 1 |
| RV-C10 | 2 | |
| RV-C16 | 2 | |
| RV-C31 | 1 | |
| RV-C36 | 1 | |
| RV-C40 | 2 | |
| RV-C41 | 13 | |
| RV-C45 | 1 | |
| Enterovirus A | CV A2 | 1 |
| CV A6 | 7 | |
| Enterovirus B | CV B5 | 1 |
| E5 | 4 | |
| E6 | 1 | |
| Enterovirus C | C105 | 1 |
| Enterovirus D | D68 | 13 |
| 7 species | 33 genotypes | 86 viruses |
Table 6.
Distribution of the under study characteristics of children with HRV A and HRV C. Absolute and relative frequencies with 95% CI are indicated for qualitative variables, medians with interquartile range are indicates for quantitative variables
Table 6.
Distribution of the under study characteristics of children with HRV A and HRV C. Absolute and relative frequencies with 95% CI are indicated for qualitative variables, medians with interquartile range are indicates for quantitative variables
| Characteristics | HRV A (n=32) |
HRV C (n=23) |
Comparison |
|---|---|---|---|
| Sex: | U=348.5; p=0.789 | ||
| -Female (n=27) | 17, 53.13% [36.45-69.13] |
11, 47.83% [29.24-67.04] |
|
| -Male (n=28) | 15, 46.88% [30.87-63.55] |
12, 52.17% [32.96-70.76] |
|
| Median age, years | 1 (0-3) | 2 (1-5) | U=270.5; p=0.090 |
| Symptoms: | Chi2=3.45; p=0.644 | ||
| -Fever | 31, 96.88% [83.78-99.92] |
22, 95.65% [78.05-99.89] |
|
| -Malaise | 14, 43.75% [26.36-62.34] |
15, 65.22% [42.73-83.62] |
|
| -Headache | 0, 0% [0-10.9] |
0, 0% [0-14.8] |
|
| -Cough | 32, 100% [89.11-100] |
21, 91.30% [71.96-98.93] |
|
| -Sore throat | 1, 3.13% [0.08-16.22] |
3, 13.04% [2.78-33.59] |
|
| -Dyspnea | 14, 43.75% [26.36-62.34] |
15, 65.22% [42.73-83.62] |
|
| -Nasal congestion | 7, 21.88% [9.28-39.97] |
5, 21.74% [7.46-43.70] |
|
| Median Temperature, °C | 38.1 (37.4-38.5) | 38.0 (37.4-38.4) | U=368.0; p>0.999 |
| Hypoxia | 8, 25.00% [13.25-42.11] |
12, 52.17% [32.96-70.76] |
U=268.0, p=0.050 |
| Diagnosis: | Chi2=5,27; p=0.076 | ||
| -Upper respiratory tract diseases | 9, 28.13% [15.57-45.38] |
1, 4.35% [0.22-20.99] |
|
| -Bronchitis | 16, 50.00% [33.63-66.37] |
14, 60.87% [40.79-77.84] |
|
| -Pneumonia | 7, 21.88% [11.02-38.76] |
8, 34.78% [18.81-55.11] |
|
| ICU | 2, 6.25% [1.11-20.15] |
1, 4.35% [0.22-20.99] |
U=361.0, p>0.999 |
Table 7.
Clinical characteristics of EV-D68 infection
| Characteristics | EV-D68 (n=13) |
|---|---|
| Median age, months | 18 (1-96) |
| Symptoms: | |
| -Fever | 13, 100% [75.29-100] |
| -Malaise | 9, 69.23% [38.57-90.91] |
| -Headache | 1, 7.69% [0.19-36.03] |
| -Cough | 10, 76.92% [46.19-94.96] |
| -Sore throat | 2, 15.38% [1.92-45.45] |
| -Dyspnea | 9, 69.23% [38.57-90.91] |
| -Nasal congestion | 2, 15.38% [1.92-45.45] |
| -Neurological symptoms | 0, 0% [0-24.71] |
| Median Temperature, °C | 38.3 (37.0 – 39.4) |
| Hypoxia | 6, 46.15% [19.22-74.87] |
| ICU | 0, 0% [0-24.71] |
| Diagnosis: | |
| -Upper respiratory tract diseases | 0, 0% [0-24.71] |
| -Bronchitis | 8, 61.54% [31.58-86.14] |
| -Pneumonia | 5, 38.46% [13.86-68.42] |
Disclaimer/Publisher’s Note: The statements, opinions and data contained in all publications are solely those of the individual author(s) and contributor(s) and not of MDPI and/or the editor(s). MDPI and/or the editor(s) disclaim responsibility for any injury to people or property resulting from any ideas, methods, instructions or products referred to in the content. |
© 2024 by the authors. Licensee MDPI, Basel, Switzerland. This article is an open access article distributed under the terms and conditions of the Creative Commons Attribution (CC BY) license (http://creativecommons.org/licenses/by/4.0/).
Copyright: This open access article is published under a Creative Commons CC BY 4.0 license, which permit the free download, distribution, and reuse, provided that the author and preprint are cited in any reuse.


