Submitted:
01 November 2024
Posted:
01 November 2024
You are already at the latest version
Abstract
Drought presents significant challenges in arid regions, adversely impacting agriculture, water resources, and ecosystems. In Xinjiang, Northwest China, although large-scale climatic phenomena are well studied, finer-scale climatic variability in subregions such as the Ili River Valley (IRV) remains understudied. This knowledge gap impairs effective agricultural planning and environmental management in this ecologically fragile but agriculturally important region. In this study, we analyze the spatiotemporal evolution of drought in the IRV from 1961 to 2023, using data from ten meteorological stations. We applied the SPEI drought Index alongside Sen's trend analysis, the Mann-Kendall test, the cumulative departure method, and wavelet analysis to examine drought patterns. Results indicate significant drying trends in the IRV beginning in 2005, with frequent drought events from 2015 onwards, and 2019 marking a key transition from wet to dry conditions. The overall drought rate was -0.09/10a, suggesting a milder drought severity in the IRV compared to broader Xinjiang. Seasonally, the IRV experiences drier summers and wetter winters relative to the region's averages, with negligible changes in autumn and milder drought conditions in spring. Abrupt changes in drying seasons occurred later than in Xinjiang, with delays of 5, 21, and over 37 years for spring, summer, and autumn, respectively, indicating a lagging response. Spatially, the western plains are more prone to aridification than the central and eastern mountainous regions. significant differences in drought cycles, longer than those in Xinjiang, with distinct wet-dry phases observed over multiple time scales and across seasons highlighting the complexity of drought variability in IRV. In conclusion, the Vally exhibits unique drought characteristics, with milder intensities, pronounced seasonal variation, spatial heterogeneity, and notable resilience to climate change. These findings emphasize the necessity of region-specific drought management strategies, as those effective on a larger regional scale may not be suitable for subregions.
Keywords:
Ili river valley
; climate change
; meteorological drought
; spatiotemporal evolution
1. Introduction
Climate extremes have become increasingly frequent in recent decades, driven by the intensification of global warming, with significant implications for both natural ecosystems and human societies [1,2]. The sixth report of the Intergovernmental Panel on Climate Change (IPCC) emphasized that the global annual average surface temperature has surged by 1.09°C over the past century [3,4]. Arid and semi-arid regions, characterized by unique geographical locations, fragile ecological environments, and specific socioeconomic conditions, confront unprecedented challenges due to the temperature rise induced by global warming [5,6]. This temperature rise manifests in an increased frequency of extreme climate events, notably severe droughts [7], which rank among the most devastating natural disasters globally, inflicting substantial economic and social losses [8,9]. Droughts, as one of the most frequent and costly natural disasters worldwide, surpass the impact of other hazards, potentially instigating social instability and undermining ecosystem service functions [10,11]. Exacerbated by climate change, these droughts precipitate significant reductions in river flows, lake levels, and overall water availability, resulting in severe hydrological imbalances [12,13,14]. Furthermore, drought profoundly affects agricultural production, leading to water shortages for irrigation and diminished crop yields, posing threats to food security [15,16]. Moreover, meteorological droughts can substantially impede vegetation productivity (GPP/NPP), thereby affecting the carbon storage capacity of terrestrial ecosystems and influencing the global carbon cycle [17,18,19]. Hence, drought induced by global warming has emerged as one of the most pressing global concerns.
Significant progress has been made in the study of droughts. Studies showed that, a marked warming and drying trend in global semi-arid and arid regions [20,21]. However, these regions exhibit significant regional variations in precipitation changes. Specifically, studies have shown that precipitation has significantly increased in southern Asia, southern Africa, and the northeastern drylands of North America, and a notable drought occurs in central North America, southwestern South America, eastern Africa, and western Asia [22,23,24,25]. China is one of the main areas suffering from severe drought, which has caused huge socioeconomic losses in recent decades [26]. Drought aggravation in northwestern China has been a significant concern due to its impact on water resources, agriculture, and ecosystems [27,28]. Recent studies have focused on understanding the trends, causes, and effects of drought in this region to inform better management and mitigation strategies. Qi et al. (2022) analyzed the spatiotemporal variations in precipitation, annual average temperature, and area characteristics in China's arid regions, and explored the different responses of drought regions in China to ENSO [29]. Chi et al. (2023) systematically investigated the spatial patterns of climate change and related climate hazards in northwest China [30]. Zhou et al. (2023) studied the changes in temperature and precipitation in Xinjiang and its subregions from 1960 to 2019 and analyzed the multi-temporal scale correlations between these changes and atmospheric circulation indices [31]. These studies have explored drought from different perspectives and spatiotemporal scales. However, existing drought research has predominantly focused on large-scale regions, neglecting detailed analyses of localized areas with unique geographical and topographical conditions. Therefore, it is necessary to adopt detailed research methods to deeply analyze the spatiotemporal variation characteristics of drought in these localized regions.
The Yili River Valley, located in the semiarid region of northwestern China within the Xinjiang Uygur Autonomous Region, is an important agricultural and pastoral base [26,32]. The valley boasts the most complete vertical natural zone spectrum in the global temperate arid areas, with abundant vegetation resources including grasslands and forests, and serves as a crucial ecological barrier [33,34]. The valley, recognized as one of the five Key Terrestrial Biodiversity Areas nationwide, is experiencing significant ecosystem degradation due to climate change [35,36]. This has rendered it a climate-sensitive and ecologically fragile region [33]. Thus, urgent attention must be directed towards mitigating these challenges to Protect and sustain the valuable natural resources of the Valley. Several studies have sought to understand the climatic characteristics of the Ili River Valley. However, most of these studies are based on individual cases or mean values averaged over entire study periods, limiting a comprehensive understanding of the region’s climatic variability.
This study aims to: (1) Quantify drought severity in the Yili River Valley using the Standardized Precipitation Evapotranspiration Index (SPEI) to objectively measure meteorological drought conditions; (2) analyze spatial and temporal trends, as well as long-term drought characteristics in the Yili River Valley from 1961 to 2023, employing Sen's trend analysis, the Mann-Kendall test, and the cumulative anomaly method; and (3) Visually represents the periodic law of meteorological droughts in the Ili River Valley using wavelet analysis.
2. Materials and Methods
2.1. Trial Area
The Ili River Valley (referring specifically to the upper reaches of the Ili River, China) is situated within the temperate continental semi-arid climate zone (42°14′16′′ ~44°53′30′′; 80°09′42′′~84°56′50′′). The region exhibits a western-facing trumpet-shaped topography with its north, east and south sides circumscribed by the Tianshan Mountains (Figure 1). This unique terrain attribute enables it to receive annual moistening from the Atlantic Ocean, thereby forming a warm and humid climate distinctive from the arid and semi-arid regions of Xinjiang. The mean annual temperature of the region is 10.4°C, with a total annual precipitation of 417.6 mm, reaching 1000 mm in high-altitude areas; hence, it is termed the "Independent Wet Island", additionally representing the area with the most copious precipitation in Xinjiang. Moreover, the mountains bordering the north and south impede dry hot airflows originating from the Gurbantünggüt Desert and Taklamakan Desert as well as dry cold airflows from Siberia [35]. Abundant precipitation and seasonal melting water from the western Tianshan Mountains make significant contributions to water circulation and ecological security within the region. Owing to rich water resources, the region exhibits high biodiversity and developed agriculture [37], thereby forming an important ecological buffer in northwest China [35].
2.2. Data Acquisition and Processing
To characterize the fundamental climatic patterns of the Yili River Valley and calculate the Standardized Precipitation Evapotranspiration Index (SPEI), this study obtained meteorological data (https://data.cma.cn) from ten representative meteorological stations located across eight counties and two cities in the Yili region (Chabuchaer County, Yining County, Nilke County, Gongliu County, Xinyuan County, Zhaosu County, Tekesi County, Huocheng County, Yining City, and Huoerguosi City). The stations are spatially distributed to adequately represent the fundamental meteorological conditions across the Yili River Valley. Using data from these meteorological stations, monthly, quarterly, and annual temperature and precipitation values were calculated to determine the SPEI over various time scales from 1961 to 2023. A cumulative anomaly analysis was performed on the calculated SPEI data to examine drought trends at different temporal and spatial scales using the Sen slope method. Additionally, the Mann-Kendall test was applied to assess the significance and potential abrupt changes in SPEI-defined drought factors.
2.2.1. Standardized Precipitation Evapotranspiration Index (SPEI)
The SPEI, proposed by Vicente-Serrano et al. [38], integrates the benefits of the Palmer Drought Severity Index (PDSI) and the Standardized Precipitation Index (SPI) by incorporating potential evapotranspiration. This makes it particularly suitable for studying drought under conditions of global warming, and it has become a widely adopted method for calculating drought indices globally. The calculation steps for SPEI are as follows:
- 1)
- Calculation of the hydrothermal balance:
- 2)
- Constructing cumulative sequences of water surplus and deficit at different time scale:
- 3)
- Normalize fitting the Di data series. There may be negative values in the original data sequence Di, Therefore, the log-logistic probability distribution with three parameters is adopted:
(4)Normalization of cumulative probability density:
When the cumulative probability :
Where: c0 = 2.515517, c1 = 0.802853, c2 = 0.010328, d1 = 1.432788, d2 = 0.189269, d3 = 0.001308.
When the cumulative probability P > 0.5, is represented by 1-P:
SPEI is a standardized drought index with multiple time scales, and the corresponding drought grade division refers to the standard table of SPEI drought grade division (Table 1). In this paper, SPEI1, SPEI3, SPEI12 is used to analyze the variation of drought trend with time in Yili River Valley. Based on the meteorological drought grade standard (GB/T20481-2017) implemented by the country in 2017, this paper formulates the SPEI drought grade classification standard suitable for the study area in Table 1.
1.3.2 Sen trend Analysis and Mann-Kendall Test
The Theil-Sen median slope estimation method is a non-parametric statistical approach utilized for trend calculation. This method estimates the trend by calculating the median slope from all possible pairs of data points, effectively mitigating the influence of anomalous observations. The Mann-Kendall (MK) test, another non-parametric technique, is commonly employed to assess the statistical significance of trends in time series data. Unlike other methods, this test does not depend on the assumption of a normal distribution, nor is it affected by missing values or outliers, which makes it particularly suitable for evaluating the significance of long-term trends. By combining the Sen slope estimation with the Mann-Kendall trend test, a comprehensive, robust, and appropriate method for analyzing long-term SPEI data trends can be obtained.
- 1)
- Theil-Sen median slope estimation
In the present study, the Sen trend slope is employed to quantify the changing trend of the time series. The calculation formula for the Sen trend slope is as follows:
Where:1<j<i<n; Median is a median function; β is the trend of Sen, it is used to represent the ascending and descending degree of SPEIitrend. When β>0, SPEIi show an upward trend, the larger the β value, the more obvious the upward trend; When β<0, SPEIi show a downward trend, the smaller the β value, the more obvious the downward trend.
- 2)
- Mann-Kendall trend test
Define a time series SPEIi (i=1, 2…, n) of the statistic S:
Among them,
The constructed statistic sequence Si= (i=1, 2..., n) approximately follows a normal distribution with mean E(S)=0 and variance
When n ≥ 10,the standard normal test statistic Z for S can be calculated by the following formula:
At a given confidence level α,if |Z|≥Z_((1-α/2)), rejecting the null hypothesis that time series {SPEIi} is trendless. It indicates that {SPEIi} has a significant upward (Z>0) or downward (Z<0) trend.
- 3)
- MK abrupt test
Construct time series SPEIi (i=1, 2…, n) of the order column Sk:
Among them,
Statistic UFk is defined assuming that the time series is random and independent:
Among them, ESk and Var (Sk) is the mean and variance of Sk, calculated as follows:
Where: UFk is the standard normal distribution, given the significance level α, find the normal distribution table, if, it indicates that there is a significant trend change in the sequence. The original time series is arranged in reverse order, the above process is repeated, At the same time, UBk=-UFk is used to draw the two curves respectively. When the intersection point of the two curves is located within the critical line, the sequence can be considered to have a mutation, and the corresponding moment of the intersection point is the mutation start time.
1.3.3 Cumulative Anomaly Method
The cumulative anomaly method is a statistical technique employed to examine the trending patterns in time series data. This method involves calculating the difference between each value and its average value (i.e., anomaly) within the time series, followed by the accumulation of these anomaly values to form a new cumulative anomaly series. In this study, the cumulative anomaly method was utilized to analyze the long-term trends and periodic changes in SPEI data, thereby providing an effective means for understanding complex time series data. The calculation formula as follows:
Where: CA is the cumulative anomaly; A(t) represents the value of the time series data at time t; u denotes the average value of the time series data; n is the total number of observations in the time series.
1.3.4 Wavelet Analysis
The wavelet analysis methodology has been extensively leveraged to conduct localized time-frequency investigations of signal characteristics. By scrutinizing the variations of signals within the time-frequency domain, the technique is capable of accentuating specific features and possessing multi-resolution analytical capabilities in the time-frequency space. It has the capacity to distinctly elucidate the evolving cycles and trends exhibited by the non-stationary time series associated with climatic phenomena such as precipitation and temperature across diverse temporal scales, and can furnish both qualitative and quantitative estimations of their prospective developmental trajectories.
This research endeavor employed the built-in functions of Matlab R2018a software, initially mitigating boundary effects, subsequently computing the wavelet coefficients utilizing the Morlet complex wavelet [39], and ultimately leveraging Origin 2024 software to construct contour visualizations of the pertinent data.
3. Results
3.1. Analysis of Drought Dynamics in the Ili River Valley
Figure 2 illustrates the drought variations identified by the Standardized Precipitation Evapotranspiration Index (SPEI) at different time scales in the study area from 1961 to 2023. SPEI-1 reflects short-term drought, SPEI-3 captures seasonal wet and dry variations, and SPEI-12 depicts interannual drought variations. As shown in the figure, SPEI-1 and SPEI-3 exhibit high-frequency and large-amplitude fluctuations, clearly demonstrating subtle changes in SPEI values. At the annual scale, the fluctuations in the SPEI-12 graph decrease, better reflecting the characteristics of long-term drought changes.
The research results indicate that, during the study period, the frequency and intensity of droughts in the Ili River Valley have significantly increased, with a notable rise in the number of years experiencing moderate, severe, and extreme droughts across all time scales. Additionally, the frequency and intensity of short-term droughts are higher than those of interannual droughts. In the SPEI-12 graph, the SPEI value in 2008 was less than -2.0, indicating that the Ili River Valley experienced an extreme drought event in 2008. Over the past six years, the Ili River Valley has been suffering from continues droughts of varying degrees.
3.2. Interannual Variations of the SPEI in the Ili River Valley
The interannual variation of SPEI in the Ili River Valley from 1961 to 2023 is shown in Figure 3. Overall, the SPEI values exhibit a trend of initially rising and then falling, ranging from -2.09 to 1.73. Over the past 63 years, the SPEI values have shown a slight decreasing trend. The Mann-Kendall (M-K) test results indicate a significant shift in SPEI in 2019, indicating 2019 is the turning point between wet and dry periods. A comparison of the average annual SPEI values before and after the abrupt change year (2019) reveals that the post-change values decreased by 1.09 compared to the pre-change values.
The magnitude and trend of SPEI changes in the Ili River Valley from 1961 to 2023 can be intuitively assessed through anomaly and cumulative anomaly, as illustrated in Figure 6. Throughout this period, the cumulative anomaly of the average annual SPEI exhibited an initial increase followed by a decrease, forming an approximate "inverted V" shape. From 1961 to 2004, the SPEI anomalies were predominantly positive, indicating higher SPEI values and a relatively humid period, with 1969 being the wettest year. In contrast, from 2005 to 2023, the SPEI anomalies were primarily negative, indicating a relatively arid period. Notably, the SPEI anomaly values in 2008, 2013, 2020, 2021, and 2023 were less than -1, with 2008 reaching the lowest value of -2.1, highlighting a rapid intensification of drought severity since 2005. These findings suggest that drought conditions in the Ili River Valley have deepened in recent years, necessitating further research and attention.
Figure 4 illustrates the spatial distribution of the SPEI slope in the Ili River Valley. The figure indicates that the drought trend across the entire Ili River Valley is intensifying, with all regions exhibiting negative Sen slope values, averaging -0.09/10a. The most pronounced drought trends are observed in the western regions, particularly in Huoerguosi City and Chabuchaer County, with slope values reaching -0.15/10a (P<0.05). In contrast, the drought trend at the central Yining County station is relatively mild, with a slope of -0.03/10a. Overall, on an annual scale, the Ili River Valley exhibits an increasing drought trend, with the western regions experiencing a more significant drought trend compared to the relatively milder trends in the central and eastern regions.
3.3. Seasonal variations of the SPEI in the Ili River Valley
Figure 5 illustrates the seasonal variations and results of the Mann-Kendall (M-K) test of the SPEI in the Ili River Valley. All seasons, except winter, exhibit a drying trend, with summer showing the most significant drying tendency.
In spring, the SPEI displaying a decreasing trend, with values ranging from -1.57 to 1.65 over the study period. The spring of 2002 was the wettest, while 2020 was the driest in the 63-year record. The SPEI time series exhibited an increasing trend from 1961 to 2003, followed by a declining trend, indicating a general drying tendency of spring season in the region. A significant abrupt change in SPEI was detected in 2011, with the average annual SPEI decreasing by 0.63 before and after this event.
In summer, the SPEI exhibited a declining trend, with values ranging from -2.21 to 1.94 over the study period. The summer of 1993 was the wettest on record, while 2023 was the driest. The SPEI time series displayed an increasing trend from 1961 to 2007, followed by a significant drying trend. A notable drought abrupt change was detected in 2020, with the average annual SPEI dropping by 1.50 before and after this event.
In autumn, the SPEI decreases, ranging from -2.17 to 2.24, the autumn of 1987 was the wettest on record, while the autumn of 1997 was the driest. The SPEI time series showed an increasing trend from 1961 to 1990, followed by a declining trend, suggesting a general drying pattern of autumn in the region. No abrupt change in SPEI was detected.
In winter, the SPEI showed an increasing trend, with values ranging from -1.98 to 2.12, the winter of 1968 was the driest on record, while the winter of 2010 was the wettest. The SPEI exhibited a declining trend from 1961 to 1986, followed by a significant rising trend, indicating a wetting pattern in the region. A significant abrupt change in SPEI was detected in 1984, with the average annual SPEI increasing by 0.48 before and after this event.
Overall, the Ili River Valley exhibits an insignificant drying trend in spring and autumn, a significant drying trend in summer, and a significant wetting trend in winter.
Figure 6 illustrates significant seasonal differences in the anomalies and cumulative anomalies of the SPEI) in the Ili River Valley from 1961 to 2023. The SPEI changes in spring and summer are generally consistent with interannual variations, whereas autumn and winter exhibit notable differences.
Figure 6.
Variation trend of seasonal SPEI interannual anomaly and cumulative anomaly in Yili River Valley from 1961 to 2023.
Figure 6.
Variation trend of seasonal SPEI interannual anomaly and cumulative anomaly in Yili River Valley from 1961 to 2023.
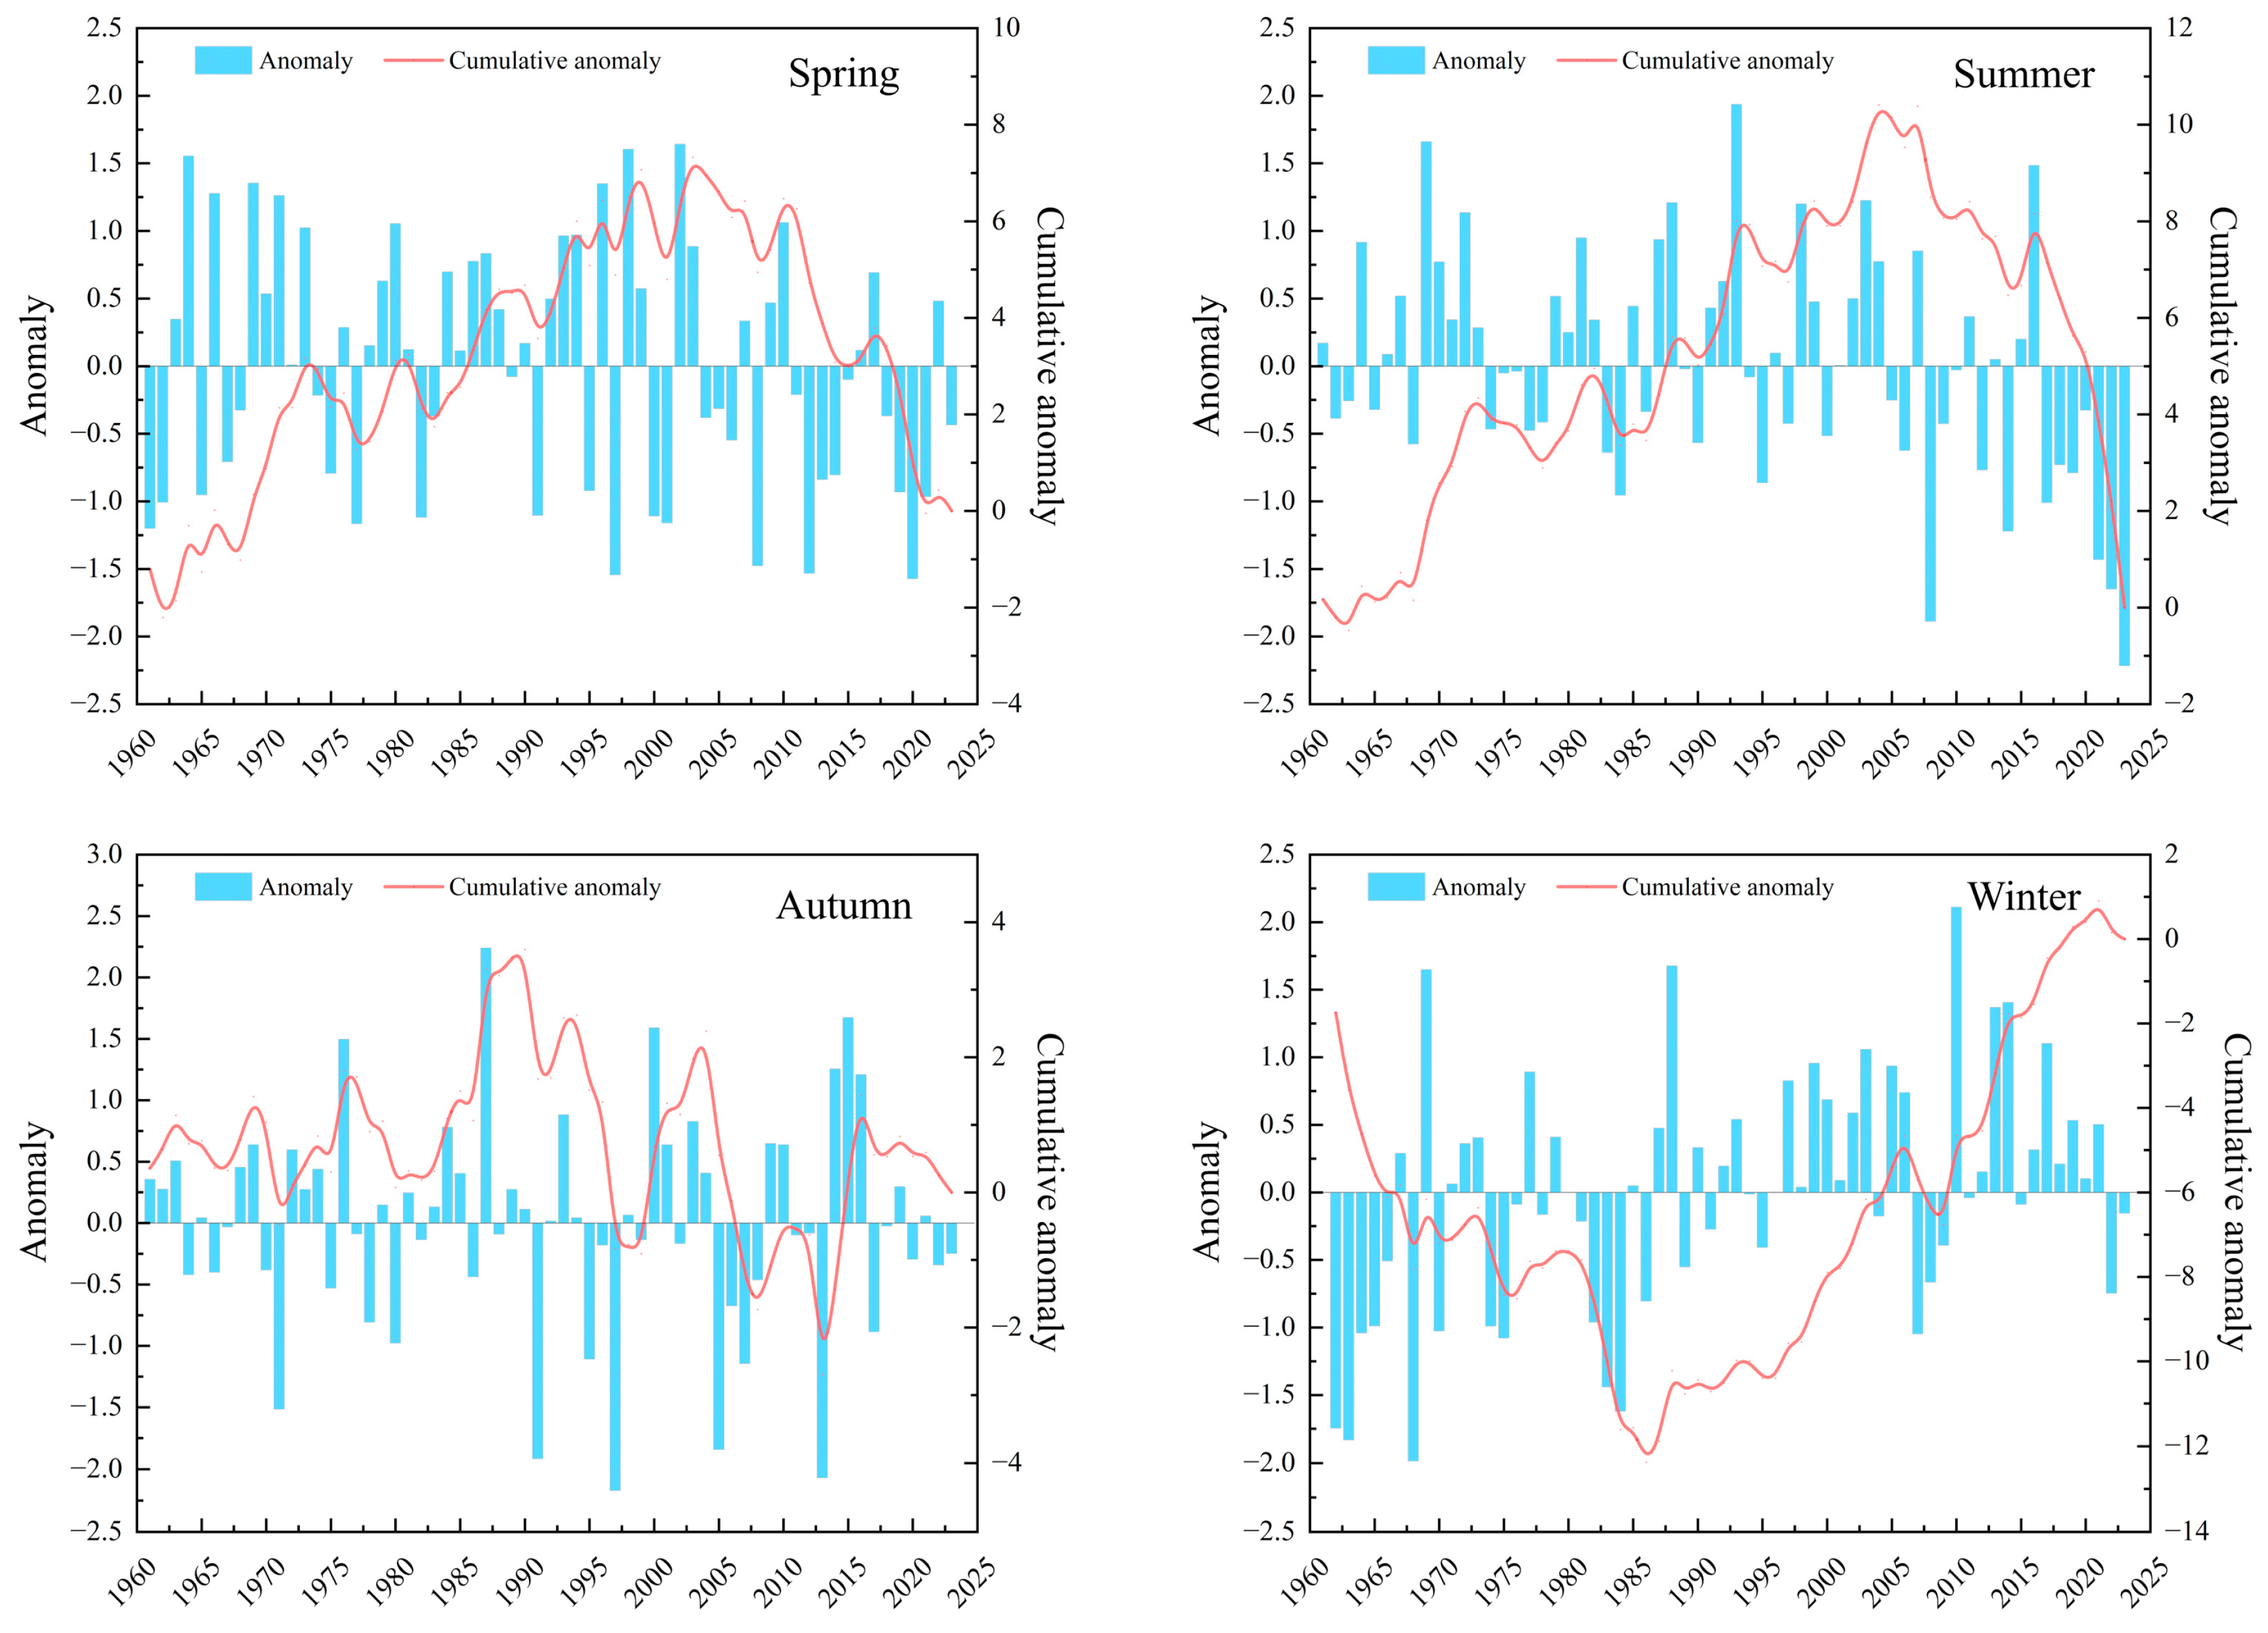
In spring and summer, SPEI anomalies were predominantly positive between 1961 and 2004, indicating wetter periods. Conversely, from 2005 to 2023, the anomalies were mostly negative, indicating drier periods. Additionally, cumulative SPEI anomalies in spring and summer initially increased and then decreased, forming an overall "inverted V" shape. Specifically, the cumulative SPEI anomaly in spring reached a peak of 7.32 in 2003, suggesting a wet period before 2003 and a transition to a drier period thereafter. Similarly, in 2004, the cumulative SPEI anomaly in summer reached its peak at 10.41.
In autumn, SPEI changes are more complex. There were more wet years between 1961 and 1990, while the period from 1991 to 2023 saw an increase in years with negative anomalies, indicating a trend towards aridification. The cumulative SPEI anomaly in autumn peaked at 3.60 in 1990. SPEI changes in winter generally showed an opposite trend to the interannual changes. From 1961 to 1986, the Ili River Valley experienced a drier period, while from 1987 to 2023, it experienced a wetter period. The cumulative SPEI anomaly in winter exhibited a "V" shape from 1961 to 2023, reaching its lowest value of -12.38 in 1986, indicating a drier period before 1986 and a transition to a wetter period thereafter.
As shown in Figure 7, there are significant spatial differences in the SPEI changes across different seasons in the Ili River Valley. The drought trends in spring, summer, and autumn generally align with annual trends, all indicating a deepening of drought conditions. However, during winter, the Ili River Valley exhibits a notable wetting trend.
From 1961 to 2023, the SPEI values in spring show a decreasing trend, with an average regional trend rate of -0.1/10a. This trend is particularly pronounced and statistically significant (p<0.05) at the stations in Huocheng City and Chabuchaer County. In summer, the region overall displays a significant drought trend, with an average trend rate of -0.15/10a. The western part of the valley, including western Zhaosu and Gongliu counties, shows the most pronounced drought trend, while the trend in Tekesi County is relatively mild. The autumn drought trend is somewhat alleviated compared to spring and summer, with an average trend rate of -0.03/10a and no significant increases or decreases at any station. The SPEI values at four stations, including Yining City and its surrounding counties (Yining, Huocheng, and Chabuchaer), exhibit an increasing trend, indicating a wetting pattern, while other stations, particularly Tekesi, show a drought trend. In contrast to other seasons, winter demonstrates a significant wetting trend, with SPEI values increasing at all stations. Nine stations, excluding Tekesi, pass the significance test, with an average regional trend rate of 0.2/10a.
3.4 periodical Characteristics of the SPEI in Ili River Valley
Using wavelet periodic analysis, this study investigated the periodicity of the SPEI in the Ili River Valley from 1961 to 2023. As shown in Figure 8, the results indicate that the region exhibits significant drought variability on both interannual and seasonal timescales. The wavelet analysis identified two distinct drought variability cycles in the study area. The first is a long-term cycle on a 23a timescale, with an average drought period of 15a, characterized by 4 alternating dry-wet phases that persist throughout the entire time series. The second is a short-term cycle on a 9a timescale, with an average drought period of 6a, displaying approximately 10 alternating dry-wet phases.
At the seasonal scale (as illustrated in Figure 9), distinct drought variability cycles are observed across different seasons. In spring, significant periodic oscillations are detected on an 11a timescale, with an average drought variability period of 7a, during which 8 periodic dry-wet alternations occur. Additionally, a weaker periodic oscillation is observed on a 26a timescale, with an average period of 17a, encompassing approximately 2 periodic dry-wet alternations. In summer, significant periodic oscillations appear on a 21a timescale, with an average drought variability period of 13a and 3 dry-wet alternations. Moreover, a weaker yet more frequent oscillation is recorded on an 8a timescale, with an average period of 6a, indicating relatively frequent dry-wet alternations. The drought variability cycle characteristics in autumn are similar to those in summer, with no significant differences in the main cycle, average period, or number of dry-wet alternations. In winter, significant periodic oscillations are observed on a 31a timescale, with an average drought variability period of 20a, characterized by around 2 prominent periodic dry-wet alternations. Weak periodic oscillations are also noted on a 17a timescale, with an average period of 11a, which includes approximately 5 periodic dry-wet alternations. Notably, in addition to the more prominent first and second principal cycles, drought variability across seasons is accompanied by some less pronounced small-scale periodic oscillations.
From the perspective of spatial variation (Figure 10 and Figure 11), the characteristics of drought cycles across different locations within the Ili River Valley show significant variability. At the interannual scale, the primary cycle timescales for Yining City and Zhaosu stations are 9a and 14a, respectively, with average periods of 6a and 10a. Other stations display primary cycle timescales ranging from 20 to 30a, with corresponding average periods of 10 to 20a. The secondary cycle timescales for these two stations are 24a and 15a, respectively, while those for other stations are generally around 10a, with average periods not exceeding 10a.
At the seasonal scale, during spring, the primary and secondary cycle timescales for Tekesi Station are 24a and 11a, with average periods of 16a and 8a, respectively. For other stations, the primary cycle timescale predominantly hovers around 10a, with an average period of 7a, while the secondary cycle largely falls within 20-30a, with an average period of 10-20a. In summer, Huocheng Station displays a notable long-period characteristic, with primary and secondary cycle timescales of 48a (average period of 30a) and 30a (average period of 19a), respectively. However, the primary cycle for Xinyuan and Zhaosu stations is relatively short (9a timescale and 6a average period), but their secondary cycles are longer, at 23a and 24a (average periods of 16a). For the remaining stations, the primary cycle timescale remains centered around 20-30a with an average period of 10-20a, while the secondary cycle is approximately 8a with an average period of 5a. In autumn, the primary cycles across the stations can be categorized into two groups: approximately 20a and 10a timescales, with corresponding average drought periods of 5-15a. Winter, however, presents more complex characteristics. Stations such as Chabuchaer, Nileke, Tekesi, and Xinyuan exhibit primary cycle timescales ranging from 17 to 48a (average periods of 10-30a) and secondary cycle timescales ranging from 6 to 31a (average periods of 4-19a). The remaining stations show a primary cycle timescale of about 30a (average period of 20a) and a secondary cycle concentrated around 15a (average period of 10a).
4. Discussion
4.1. Drought Trends in Ili River Valley in Recent 60 Years
Drought represents a significant environmental challenge in Xinjiang, China, an arid and semi-arid region. The region has experienced an increasing trend in drought since the 1990s, with a notable shift from a wetting to a drying trend around 1997 [40,41,42]. However, the drought dynamics in the Ili River Valley, a sub-region of Xinjiang, appear to be distinct. Our analysis indicates that from 1961 to 2023 (Figure 2-4), drought severity in the Ili River Valley has shown a significant increasing trend since 2005, with 2019 marking a turning point between wet and dry periods. This trend is not entirely consistent with the broader drought patterns reported across Xinjiang [43]. Our findings indicate a divergent response, which can be attributed to the different time scales and regional variations within the larger Xinjiang region [28,41,44,45,46]. Notably, the drought trend in the Ili River Valley is approximately 0.09/10a (Figure 3), based on linear regression, which is less intense than the 0.122/10a trend observed for the broader Xinjiang region [45]. This discrepancy suggests that the Ili River Valley may be experiencing a milder drought intensity compared to other parts of Xinjiang. The underlying driver of these regional differences appears to be the complex interplay between temperature and precipitation patterns. Over the past two decades, significant increases in temperature without corresponding increases in precipitation have exacerbated the severity of meteorological drought in Xinjiang [41]. Climate model projections (CMIP6) further indicate that the region is likely to experience continued drying trends in the coming decades (2021–2100), with varying intensities from −0.1/10a to −0.2/10a under different emission scenarios [47]. However, whether the Ili River Valley will continue to exhibit a synchronized response to these broader aridification trends in Xinjiang remains an important topic for further investigation and discussion.
4.2. Seasonal Variations of Drought in the Ili River Valley
The analysis reveals pronounced seasonal variability in drought patterns within the Ili River Valley. A drying trend is observed during spring, summer, and autumn, while winter displays a tendency towards wetter conditions (Figure 4). This pattern aligns with findings from numerous studies conducted in the broader Xinjiang region, though with varying intensities [28,48,49]. Specifically, in Xinjiang, the linear trend of the SPEI indicates a downward trajectory in spring, summer, and autumn, with k (slope) values all above 0.11/10a, while the winter SPEI shows an upward trend with a k of 0.08/10a [50]. However, the SPEI in Ili River Valley displays more subtle changes for autumn, with k values of 0.02/10a, while intensity of the spring drought (0.1/10a) somehow milder than the averaged in Xinjiang (0.13/10a). Notably, the Valley exhibits a significant trend towards aridification (0.16/10a) during the summer, higher than the aridification trend observed in Xinjiang (0.11/10a), characterized by an increasing frequency and severity of summer droughts [28,48]. This could be attributed to the weak increase in precipitation during significant warming periods in the region [41], or possibly the influence of altitude, as suggested by Zhang et al. (2021) [49]. In contrast to the summer, the Valley demonstrates a pronounced trend towards wetter conditions in winter, with a trend of 0.19/10a, significantly higher than that of averaged in Xinjiang. This finding is consistent with the work of Jin et al. (2024), who reported a 17.3% increase in annual average precipitation in the Tianshan Mountains over the past 60 years, with a particularly striking 135.7% increase in winter precipitation [50].
The analysis reveals pronounced seasonal variability in drought patterns within the Ili River Valley. A drying trend is observed during spring, summer, and autumn, while winter displays a tendency towards wetter conditions (Figure 4). This pattern aligns with findings from numerous studies conducted in the broader Xinjiang region, though with varying intensities [28,48,49]. Specifically, in Xinjiang, the linear trend of the SPEI indicates a downward trajectory in spring, summer, and autumn, with k (slope) values all less than –0.11/10a, while the winter SPEI shows an upward trend with a k of 0.08/10a [50]. However, the SPEI in the Ili River Valley displays more subtle changes in autumn, with a k of –0.02/10a, while the intensity of the spring drought (–0.10/10a) is somewhat milder than the average in Xinjiang (–0.13/10a). Notably, during the summer, the Valley exhibits a significant trend towards aridification (–0.16/10a), greater than the aridification trend observed in Xinjiang (–0.11/10a), characterized by an increasing frequency and severity of summer droughts [28,48]. This could be attributed to the weak increase in precipitation during significant warming periods in the region [41], or possibly to the influence of altitude, as suggested by Zhang et al. (2021) [49]. In contrast to the summer, the Valley demonstrates a pronounced trend towards wetter conditions in winter, with a k value of 0.19/10a, significantly higher than that observed in Xinjiang (0.08/10a). This finding is consistent with the work of Jin et al. (2024), who reported a 17.3% increase in annual average precipitation in the Tianshan Mountains over the past 60 years, with a particularly striking 135.7% increase in winter precipitation [50].
The Mann-Kendall (MK) mutation analysis (Figure 4) further reveals that the Ili River Valley experiences abrupt changes in drying seasons (spring, summer, autumn) several years later than the broader Xinjiang region [40,51], exhibits a lagging response. For example, the Ili River Valley exhibited a 5-year lag in the abrupt change year for spring SPEI and a 21-year lag for summer SPEI, compared to the regional trends. In autumn, a delay exceeding 35 years was observed, with no significant abrupt changes detected in this season in the Valley. This lagging response is also evident at the annual scale, where the Ili River Valley demonstrated a 22-year lag in the abrupt change year compared to the broader Xinjiang region [43,44]. These findings indicate that the Ili River Valley exhibits greater resilience and resistance to the impacts of climate change, potentially due to factors such as its unique geographic characteristics or local climate dynamics, which may buffer the effects observed in the surrounding areas.
4.3. Spatial Variations in Drought Patterns within the Ili River Valley
The spatial variability of meteorological drought within the Ili River Valley is further elucidated by analyzing the Sen's slope of the SPEI at various meteorological stations. The results indicate a more pronounced trend of aridification in the western Ili River Valley compared to the eastern part of the region. This disparity may be attributed to the distinct geographical characteristics of the two areas, with the western Ili River Valley comprising an oasis plain, while the eastern part is predominantly mountainous. This finding aligns with the conclusions of Zhang et al. (2021), who reported that the warming and wetting trends in the Tianshan region are primarily concentrated in ecological zones above 2800 meters, while the densely populated low-lying oases are experiencing warming and drought [50]. In contrast, the Tekesi area in the central Ili River Valley exhibits a lower trend of aridification during the summer compared to the surrounding regions, but a higher trend of aridification in the autumn. The specific reasons for these divergent drought patterns in Tekesi County relative to its neighboring areas warrant further detailed analysis, taking into account the unique topographical characteristics of the Tekesi region.
The observed spatial heterogeneity in drought trends within the Ili River Valley highlights the need for a nuanced understanding of the regional climate dynamics at play. The disparities between the western oasis plain, eastern mountainous regions, and the central Tekesi area underscore the importance of considering local-scale factors, such as terrain, land cover, and microclimatic conditions, when assessing the regional meteorological drought patterns.
4.4. Drought Periodicity in the Ili River Valley
This study also conducted a wavelet analysis of drought variability cycles at multiple temporal scales for both the entire Ili River Valley and ten monitoring stations located within each county and city. The results indicate that the Ili River Valley exhibits significant periodicity and dry-wet variation characteristics across various temporal scales, consistent with the overall drought variability patterns observed in the arid regions of Northwestern China [28,52,53,54]. However, the dominant periodic scales of drought variation in the Ili River Valley (9-year and 15-year cycles) are longer than the average periodic scales observed in Xinjiang (5-8 years) [55]. This discrepancy suggests that the regional climate dynamics and drought patterns in this area are distinct and potentially more resilient to the impacts of climate change compared to the broader Xinjiang region. At the regional scale, the monitoring stations within the Ili River Valley demonstrate significant variability in drought cycle characteristics across different temporal scales and seasonal contexts. This finding highlights the complexity and heterogeneity of drought dynamics in the region, underscoring the importance of accounting for the influence of large-scale averages on localized, small-scale phenomena in future research.
The observed differences in drought periodicity between the Ili River Valley and the broader Xinjiang region suggest that local-scale factors play a crucial role in shaping the temporal patterns of drought variability. The longer periodic cycles detected in the Ili River Valley may reflect the unique climatic, hydrological, vegetation and topographical features of this sub-region, which can dampen the influence of large-scale drought drivers. Incorporating this spatial and temporal variability into drought monitoring and forecasting efforts will be essential for developing effective, targeted strategies to address the impacts of drought in the Ili River Valley.
5. Conclusions
This study identifies a significant increase in drought severity in the Ili River Valley since 2005, with 2019 marking a shift from wetter to drier conditions. Seasonal analysis reveals notable variability, with drying trends prevailing in spring, summer, and autumn, while winter conditions have become wetter. Although the annual and seasonal drought patterns in the Valley align with broader trends observed in Xinjiang, they are characterized by a milder intensity, particularly in spring and autumn. Spatially, the western oasis plain experiences more intense aridification than the eastern mountainous areas, highlighting the influence of local topography and land cover on drought dynamics. The delayed abrupt changes in drought patterns within the Valley further emphasize its relative resilience, suggesting that local climate dynamics and geographic characteristics play critical roles in moderating the impacts of broader climatic trends. Additionally, the Valley demonstrates longer periodic drought cycles (9a and 15a) compared to the regional average, indicating a distinct climatic responsiveness that may buffer against rapid climate fluctuations.
These findings underscore the necessity for region-specific drought monitoring and management strategies that account for both temporal and spatial heterogeneities. Future research should focus on elucidating the underlying mechanisms driving these regional differences and exploring adaptive measures to enhance drought resilience in the Ili River Valley.
Supplementary Materials
The following supporting information can be downloaded at the website of this paper posted on Preprints.org.
Author Contributions
Conceptualization, BE; data curation, SH; writing—original draft preparation, SH; writing—review and editing, SH, BE; visualization, NK, ZZ; project administration and funding acquisition, BE. All authors have read and agreed to the published version of the manuscript.
Funding
This study was supported by the National Natural Science Foundation of China (32460279); and the Tian chi Fund Project of Xinjiang Uyghur autonomous region, China (2023TCYCQNBS01).
Data Availability Statement
The data supporting the findings of this study are openly available in the supplementary material.
Acknowledgments
The authors would like to thank Prof. Qingdong Shi from Xinjiang university for his contribution to this research program. We also appreciate all reviewers and editors for their comments on this paper.
Conflicts of Interest
The authors declare that they have no conflict of interest.
References
- Yuan, X.; Wang, Y.M.; Ji, P.; Wu, P.L.; Sheffield, J.; Otkin, J.A. A global transition to flash droughts under climate change. Science 2023, 380, 187–191. [Google Scholar] [CrossRef] [PubMed]
- Zhang, J.; Wang, F. Changes in the risk of extreme climate events over East Asia at different global warming levels. Water 2019, 11, 2535. [Google Scholar] [CrossRef]
- Yan, Z.; Ding, Y.; Zhai, P.; Song, L.; Cao, L.; Li, Z. Re-assessing climatic warming in China since 1900. J. Meteorolog. Res. 2020, 34, 243–251. [Google Scholar] [CrossRef]
- Wang, Y.; Ma, J.; Zhang, L.; Huang, Y.; Guo, X.; Yang, Y.; Zhao, E.; Zhao, Y.; Chu, Y.; Jiang, M. Spatial Distribution of, and Variations in, Cold Regions in China from 1961 to 2019. Sustain. 2022, 14, 465. [Google Scholar] [CrossRef]
- Song, L.L.; Tian, Q.; Li, Z.J. Response of Ecological Environment to Climate Change in the Source Area of the Yangtze River Based on the Observation During 2005-2015. Pol. J. Environ. Stud. 2021, 12, 13. [Google Scholar] [CrossRef]
- Zhou, Q.; Huang, J.; Hu, Z.; Yin, G. Spatial-temporal changes to GRACE-derived terrestrial water storage in response to climate change in arid Northwest China. Hydrol. Sci. J. 2022, 67, 535–549. [Google Scholar] [CrossRef]
- Li, W.; Pan, R.; Jiang, Z.; Chen, Y.; Li, L.; Luo, J.J.; Zhai, P.; Shen, Y.; Yu, J. Future changes in the frequency of extreme droughts over China based on two large ensemble simulations. J. Clim. 2021, 34, 6023–6035. [Google Scholar] [CrossRef]
- Cunha, A.; Zeri, M.; Leal, K.; Costa, L.; Cuartas, L.; Marengo, J.; Tomasella, J.; Vieira, R.; Barbosa, A.; Cunningham, C. Extreme drought events over Brazil from 2011 to 2019. Atmos. 2019, 10, 642. [Google Scholar] [CrossRef]
- Wan, L.; Bento, V.A.; Qu, Y.; Qiu, J.; Song, H.; Zhang, R.; Wu, X.; Xu, F.; Lu, J.; Wang, Q. Drought characteristics and dominant factors across China: Insights from high-resolution daily SPEI dataset between 1979 and 2018. Sci. Total Environ. 2023, 901, 166362. [Google Scholar] [CrossRef]
- Li, P.; Omani, N.; Chaubey, I.; Wei, X. Evaluation of drought implications on ecosystem services: Freshwater provisioning and food provisioning in the Upper Mississippi River Basin. Int. J. Environ. Res. Public Health 2017, 14, 496. [Google Scholar] [CrossRef]
- Xu, C.; Ke, Y.; Zhou, W.; Luo, W.; Ma, W.; Song, L.; Smith, M.D.; Hoover, D.L.; Wilcox, K.R.; Fu, W. Resistance and resilience of a semi-arid grassland to multi-year extreme drought. Ecol. Indic. 2021, 131, 108139. [Google Scholar] [CrossRef]
- Jones, E.; van Vliet, M.T. Drought impacts on river salinity in the southern US: Implications for water scarcity. Sci. Total Environ. 2018, 644, 844–853. [Google Scholar] [CrossRef] [PubMed]
- Zhang, D.; Zhang, Q.; Qiu, J.; Bai, P.; Liang, K.; Li, X. Intensification of hydrological drought due to human activity in the middle reaches of the Yangtze River, China. Sci. Total Environ. 2018, 637, 1432–1442. [Google Scholar] [CrossRef] [PubMed]
- Cui, J.; Chen, A.; Huntingford, C.; Piao, S. Integrating ecosystem water demands into drought monitoring and assessment under climate change. Nat. Water 2024, 2, 215–218. [Google Scholar] [CrossRef]
- Kim, W.; Iizumi, T.; Nishimori, M. Global patterns of crop production losses associated with droughts from 1983 to 2009. J. Appl. Meteorol. Climatol. 2019, 58, 1233–1244. [Google Scholar] [CrossRef]
- Leng, G.; Hall, J. Crop yield sensitivity of global major agricultural countries to droughts and the projected changes in the future. Sci. Total Environ. 2019, 654, 811–821. [Google Scholar] [CrossRef]
- Xu, C.; McDowell, N.G.; Fisher, R.A.; Wei, L.; Sevanto, S.; Christoffersen, B.O.; Weng, E.; Middleton, R.S. Increasing impacts of extreme droughts on vegetation productivity under climate change. Nat. Clim. Change. 2019, 9, 948–953. [Google Scholar] [CrossRef]
- Deng, Y.; Wang, X.; Wang, K.; Ciais, P.; Tang, S.; Jin, L.; Li, L.; Piao, S. Responses of vegetation greenness and carbon cycle to extreme droughts in China. Agric. For. Meteorol. 2021, 298, 108307. [Google Scholar] [CrossRef]
- Piao, S.; Zhang, X.; Chen, A.; Liu, Q.; Lian, X.; Wang, X.; Peng, S.; Wu, X. The impacts of climate extremes on the terrestrial carbon cycle: A review. Sci. China Earth Sci. 2019, 62, 1551–1563. [Google Scholar] [CrossRef]
- Pan, N.; Wang, S.; Liu, Y.; Li, Y.; Xue, F.; Wei, F.; Yu, H.; Fu, B. Rapid increase of potential evapotranspiration weakens the effect of precipitation on aridity in global drylands. J. Arid Environ. 2021, 186, 104414. [Google Scholar] [CrossRef]
- Berg, A.; McColl, K.A. No projected global drylands expansion under greenhouse warming. Nat. Clim. Change. 2021, 11, 331–337. [Google Scholar] [CrossRef]
- Yan, X.; Cheng, P.; Zhang, Q.; Li, X.; He, J.; Yan, X.; Zhao, W.; Wang, L. Comparisons of climate change characteristics in typical arid regions of the Northern Hemisphere. Front. Environ. Sci. 2022, 10, 1033326. [Google Scholar] [CrossRef]
- Daramola, M.T.; Xu, M. Recent changes in global dryland temperature and precipitation. Int. J. Climatol. 2022, 1267–1282. [Google Scholar] [CrossRef]
- Loh, P.S.; Mohammed Alnoor, H.I.; He, S. Impact of climate change on vegetation cover at south Port Sudan area. Climate 2020, 8, 114. [Google Scholar] [CrossRef]
- Strydom, S.; Savage, M.; Clulow, A. Long-term trends and variability in the dryland microclimate of the Northern Cape Province, South Africa. Theor. Appl. Climatol. 2019, 137, 963–975. [Google Scholar] [CrossRef]
- Li, L.; She, D.; Zheng, H.; Lin, P.; Yang, Z.L. Elucidating diverse drought characteristics from two meteorological drought indices (SPI and SPEI) in China. J. Hydrometeorol. 2020, 21, 1513–1530. [Google Scholar] [CrossRef]
- Yao, N.; Li, L.; Feng, P.; Feng, H.; Li Liu, D.; Liu, Y.; Jiang, K.; Hu, X.; Li, Y. Projections of drought characteristics in China based on a standardized precipitation and evapotranspiration index and multiple GCMs. Sci. Total Environ. 2020, 704, 135245. [Google Scholar] [CrossRef]
- Huang, W.; Yang, J.; Liu, Y.; Yu, E. Spatiotemporal variations of drought in the arid region of Northwestern China during 1950–2012. Adv. Meteorol. 2021, 1–12. [Google Scholar] [CrossRef]
- Qi, Z.; Cui, C.; Jiang, Y.; Chen, Y.; Ju, J.; Guo, N. Changes in the spatial and temporal characteristics of China’s arid region in the background of ENSO. Sci. Rep. 2022, 12, 17826. [Google Scholar] [CrossRef]
- Chi, H.; Wu, Y.; Zheng, H.; Zhang, B.; Sun, Z.; Yan, J.; Ren, Y.; Guo, L. Spatial patterns of climate change and associated climate hazards in Northwest China. Sci. Rep. 2023, 13, 10418. [Google Scholar] [CrossRef] [PubMed]
- Zhou, G.; Chen, Y.; Yao, J. Variations in precipitation and temperature in Xinjiang (Northwest China) and their connection to atmospheric circulation. Front. Environ. Sci. 2023, 10, 1082713. [Google Scholar] [CrossRef]
- Liu, X.; Li, Y.; Ma, K.; Yang, L.; Li, M.; Li, C.; Wang, R.; Wang, N.; Deng, L.; He, M.-y. Spatial distribution and potential sources of arsenic and water-soluble ions in the snow at Ili River Valley, China. Chemosphere 2022, 295, 133845. [Google Scholar] [CrossRef] [PubMed]
- YANG, H.; SUN, H.l.; YE, M.; GE, X.y.; WU, F.; JIN, X.l.; WU, R. Characteristics of Vegetation Phenology Changes and Its Response to Climate Change in the Yili River Valley. Acta Agrestia Sin. 2024, 32, 859, (In Chinese with English abstract). [Google Scholar] [CrossRef]
- Shi, M.; Wu, H.; Fan, X.; Jia, H.; Dong, T.; He, P.; Baqa, M.F.; Jiang, P. Trade-offs and synergies of multiple ecosystem services for different land use scenarios in the yili river valley, China. Sustain. 2021, 13, 1577. [Google Scholar] [CrossRef]
- Xu, Y.J.; CHEN, Y.N.; LI, W.H.; FU, A.H.; MA, X.D.; GUI, D.W.; CHEN, Y.P. Distribution pattern and environmental interpretation of plant species diversity in the mountainous region of Ili River Valley, Xinjiang, China. Environ. Monit. Assess. 2010, 34, 1142. [Google Scholar] [CrossRef]
- Wang, Y.J.; Qin, D.H. Influence of climate change and human activity on water resources in arid region of Northwest China: An overview. Adv. Clim. Chang. Res. 2017, 8, 268–278. [Google Scholar] [CrossRef]
- Li, L.; Li, J.; Yu, R. Characteristics of summer regional rainfall events over Ili River Valley in Northwest China. Atmos. Res. 2020, 243, 104996. [Google Scholar] [CrossRef]
- Vicente-Serrano, S.M.; Beguería, S.; López-Moreno, J.I. A multiscalar drought index sensitive to global warming: the standardized precipitation evapotranspiration index. J. Clim. 2010, 23, 1696–1718. [Google Scholar] [CrossRef]
- Cohen, E.A.K.; Walden, A.T. A Statistical Study of Temporally Smoothed Wavelet Coherence. IEEE Trans. Signal Process. 2010, 58, 2964–2973. [Google Scholar] [CrossRef]
- Yao, J.; Zhao, Y.; Chen, Y.; Yu, X.; Zhang, R. Multi-scale assessments of droughts: A case study in Xinjiang, China. Sci. Total Environ. 2018, 630, 444–452. [Google Scholar] [CrossRef] [PubMed]
- Yao, J.; Zhao, Y.; Yu, X. Spatial-temporal variation and impacts of drought in Xinjiang (Northwest China) during 1961–2015. PeerJ 2018, 6, e4926. [Google Scholar] [CrossRef] [PubMed]
- An, Q.; He, H.; Gao, J.; Nie, Q.; Cui, Y.; Wei, C.; Xie, X. Analysis of Temporal-Spatial Variation Characteristics of Drought: A Case Study from Xinjiang, China. Water 2020, 12. [Google Scholar] [CrossRef]
- Li, Q.; Chen, Y.; Shen, Y.; Li, X.; Xu, J. Spatial and temporal trends of climate change in Xinjiang, China. J. Geog. Sci. 2011, 21, 1007–1018. [Google Scholar] [CrossRef]
- Hu, W.; Yao, J.; He, Q.; Chen, J. Changes in precipitation amounts and extremes across Xinjiang (northwest China) and their connection to climate indices. PeerJ 2021, 9, e10792. [Google Scholar] [CrossRef] [PubMed]
- Yao, J.; Mao, W.; Chen, J.; Dilinuer, T. Recent signal and impact of wet-to-dry climatic shift in Xinjiang, China. J. Geog. Sci. 2021, 31, 1283–1298. [Google Scholar] [CrossRef]
- Qu, L.-l.; Yao, J.-Q.; Zhao, Y. Mechanism analysis of the summer dry-wet interdecadal transition in the Tarim Basin, Northwest China. Atmos. Res. 2023, 291, 106840. [Google Scholar] [CrossRef]
- Zhang, X.; Wang, X.; Zhou, B. CMIP6-projected changes in drought over Xinjiang, Northwest China. Int. J. Climatol. 2023, 43, 6560–6577. [Google Scholar] [CrossRef]
- Li, M.; Yao, J.; Guan, J.; Zheng, J. Observed changes in vapor pressure deficit suggest a systematic drying of the atmosphere in Xinjiang of China. Atmos. Res. 2021, 248, 105199. [Google Scholar] [CrossRef]
- Zhang, Y.; An, C.; Liu, L.; Zhang, Y.; Lu, C.; Zhang, W. High mountains becoming wetter while deserts getting drier in Xinjiang, China since the 1980s. Land 2021, 10, 1131. [Google Scholar] [CrossRef]
- Jin, C.; Wang, B.; Cheng, T.F.; Dai, L.; Wang, T. How much we know about precipitation climatology over Tianshan Moun-tains––the Central Asian water tower. npj Clim. Atmos. Sci. 2024, 7, 21. [Google Scholar] [CrossRef]
- DAKEY, N.; REN, J. Analysis of the spatial and temporal characteristics of drought evolution in Xinjiang from 1961 to 2020. Water Saving Irrigation 2024(2):9-16. (In Chinese with English abstract). [CrossRef]
- Peng, Y.; Peng, T.; Li, Y. Spatiotemporal Characteristics of Drought in Northwest China Based on SPEI Analysis. Atmos. 2023, 14. [Google Scholar] [CrossRef]
- Zhang, Y.; Zhang, Y.; Cheng, L.; Cong, N.; Zheng, Z.; Huang, K.; Zhang, J.; Zhu, Y.; Gao, J.; Sun, Y. Have China’s drylands become wetting in the past 50 years? J. Geog. Sci. 2023, 33, 99–120. [Google Scholar] [CrossRef]
- Lian, L.; Liu, B. Change characteristics of dry and wet spells in northwest China during the past 58 years. Arid Land Geog. 2019, 42, 1301–1309 (In Chinese with English abstract). [Google Scholar] [CrossRef]
- Xuan, J.; Zheng, J.; Liu, Z. SPEI-based spatiotemporal variation of drought in Xinjiang. Arid Zone Res. 2016, 33, 338–344 (In Chinese with English abstract). [Google Scholar] [CrossRef]
Figure 1.
Sketch map of the study area.
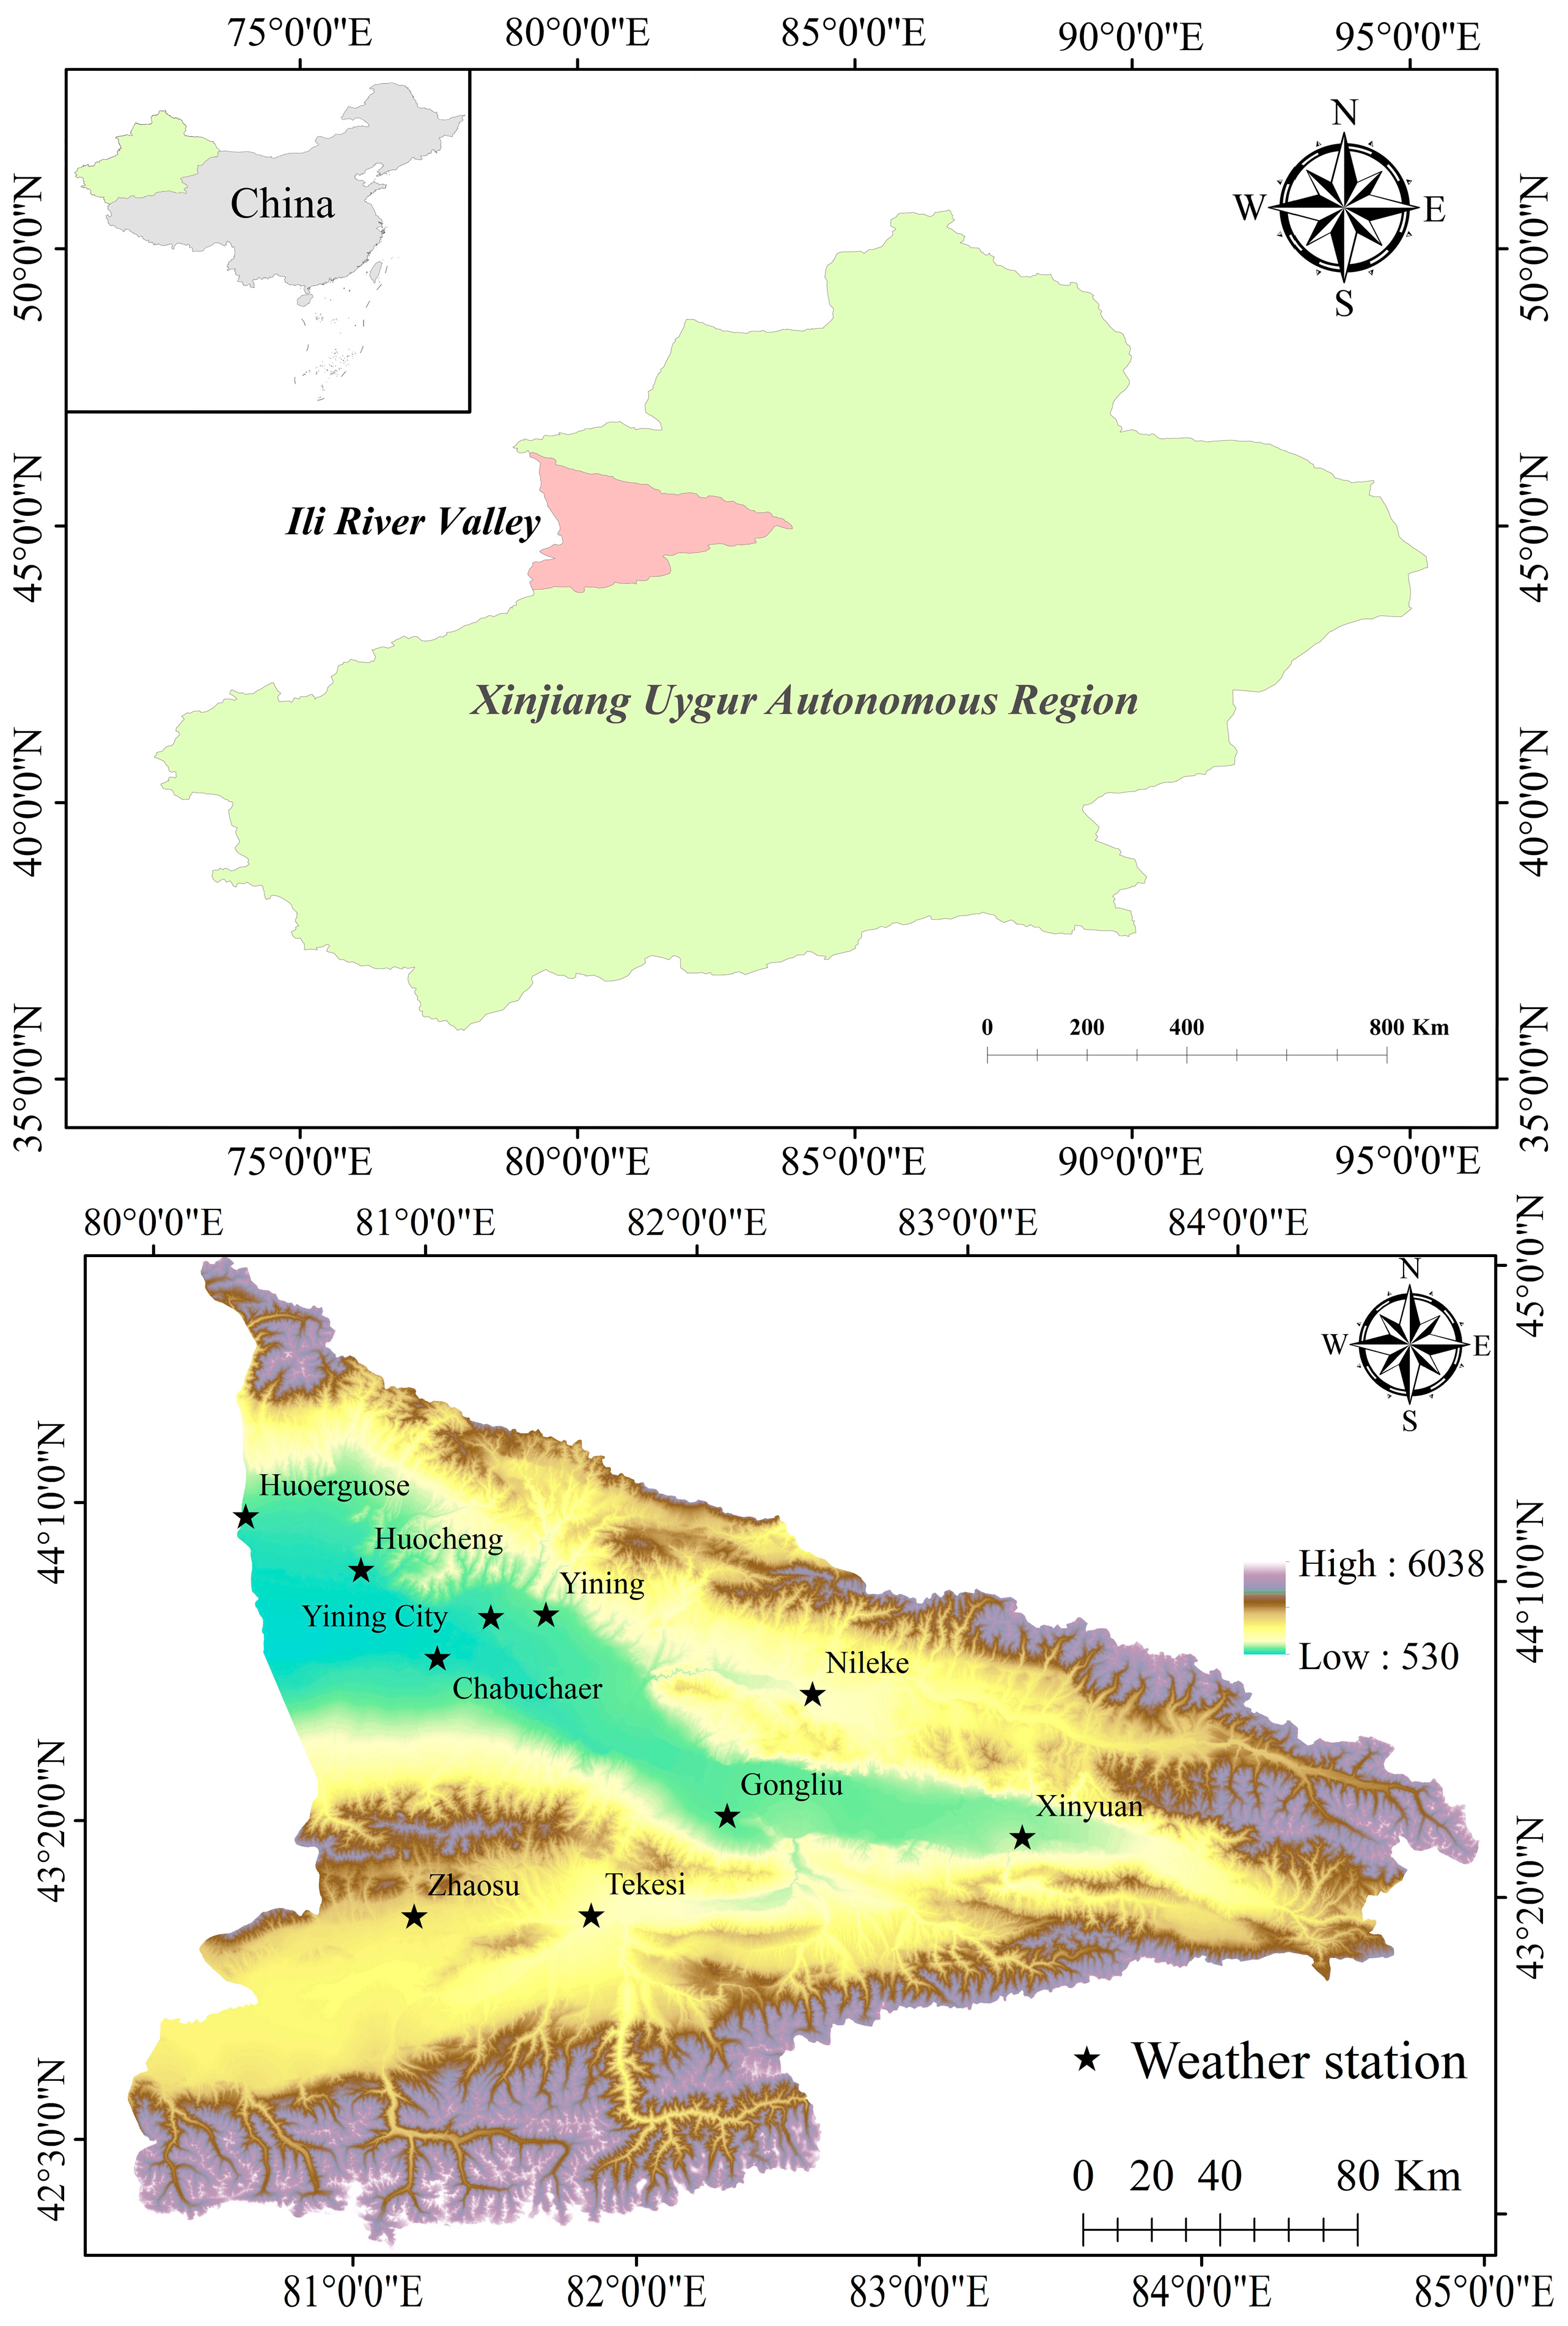
Figure 2.
SPEI fluctuation diagram for the Ili River Valley region from 1961 to 2023.
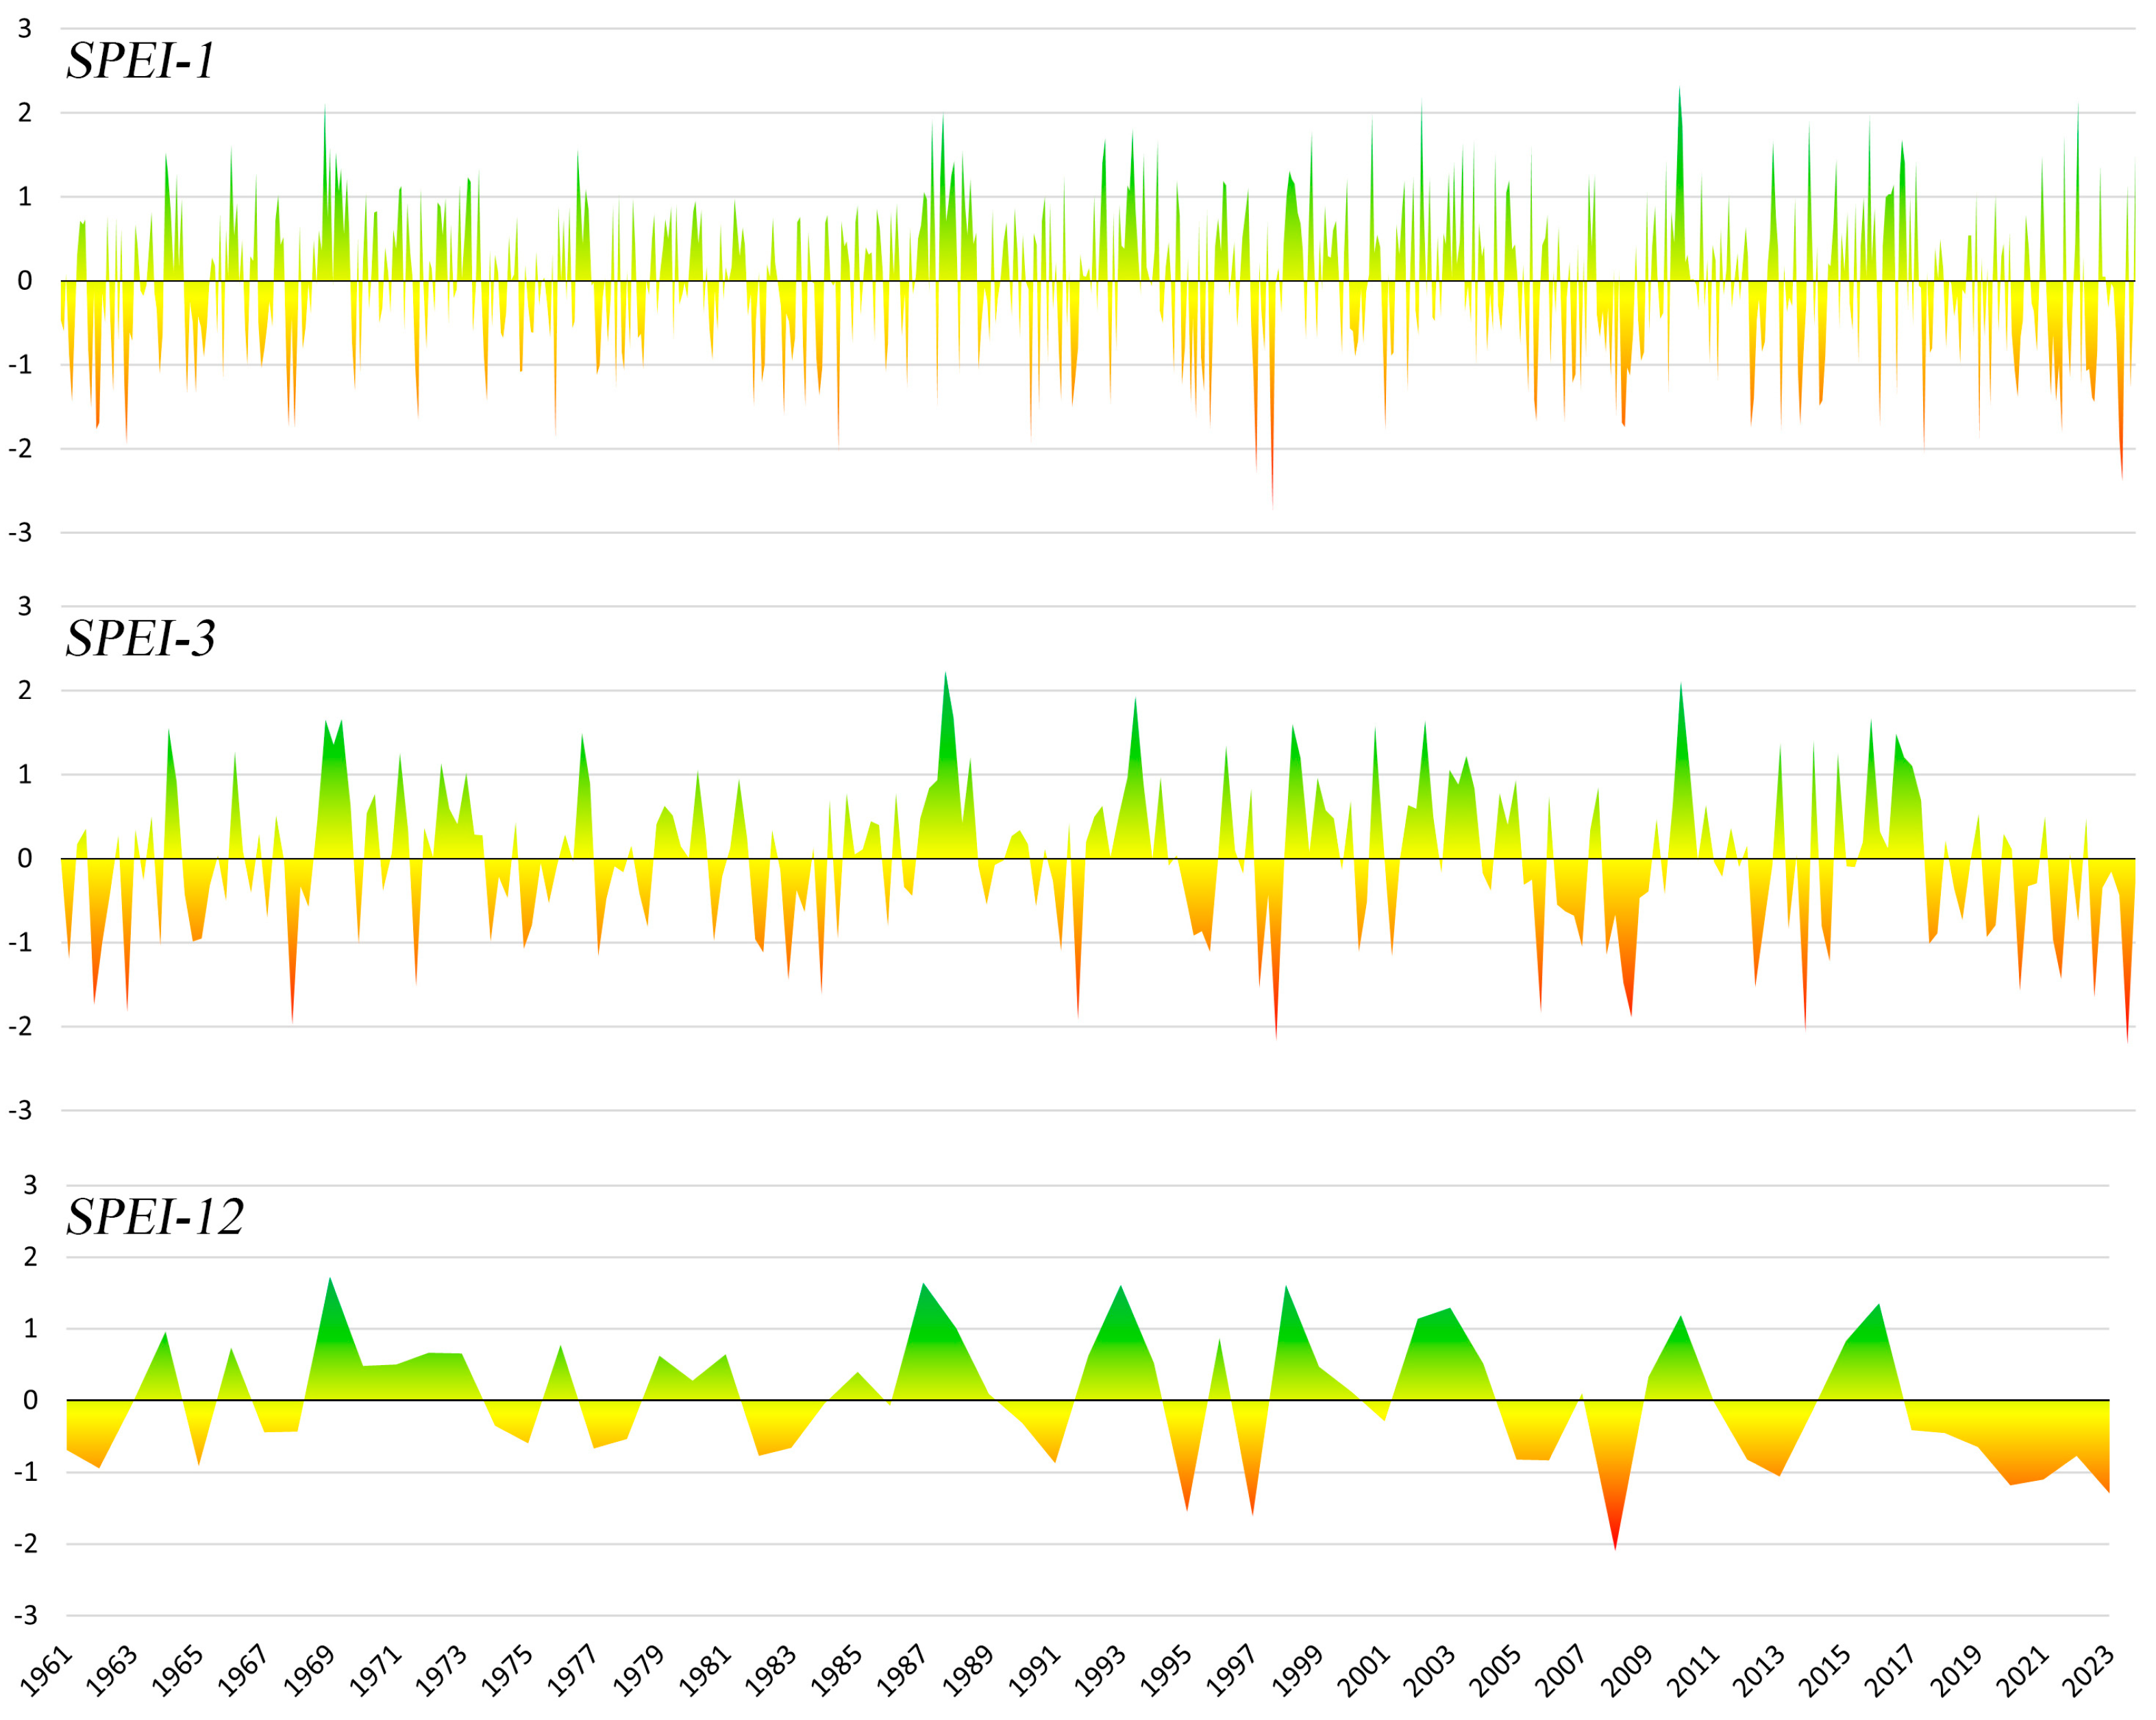
Figure 3.
Results Mann-Kendall (M-K) mutation test and anomaly analysis.
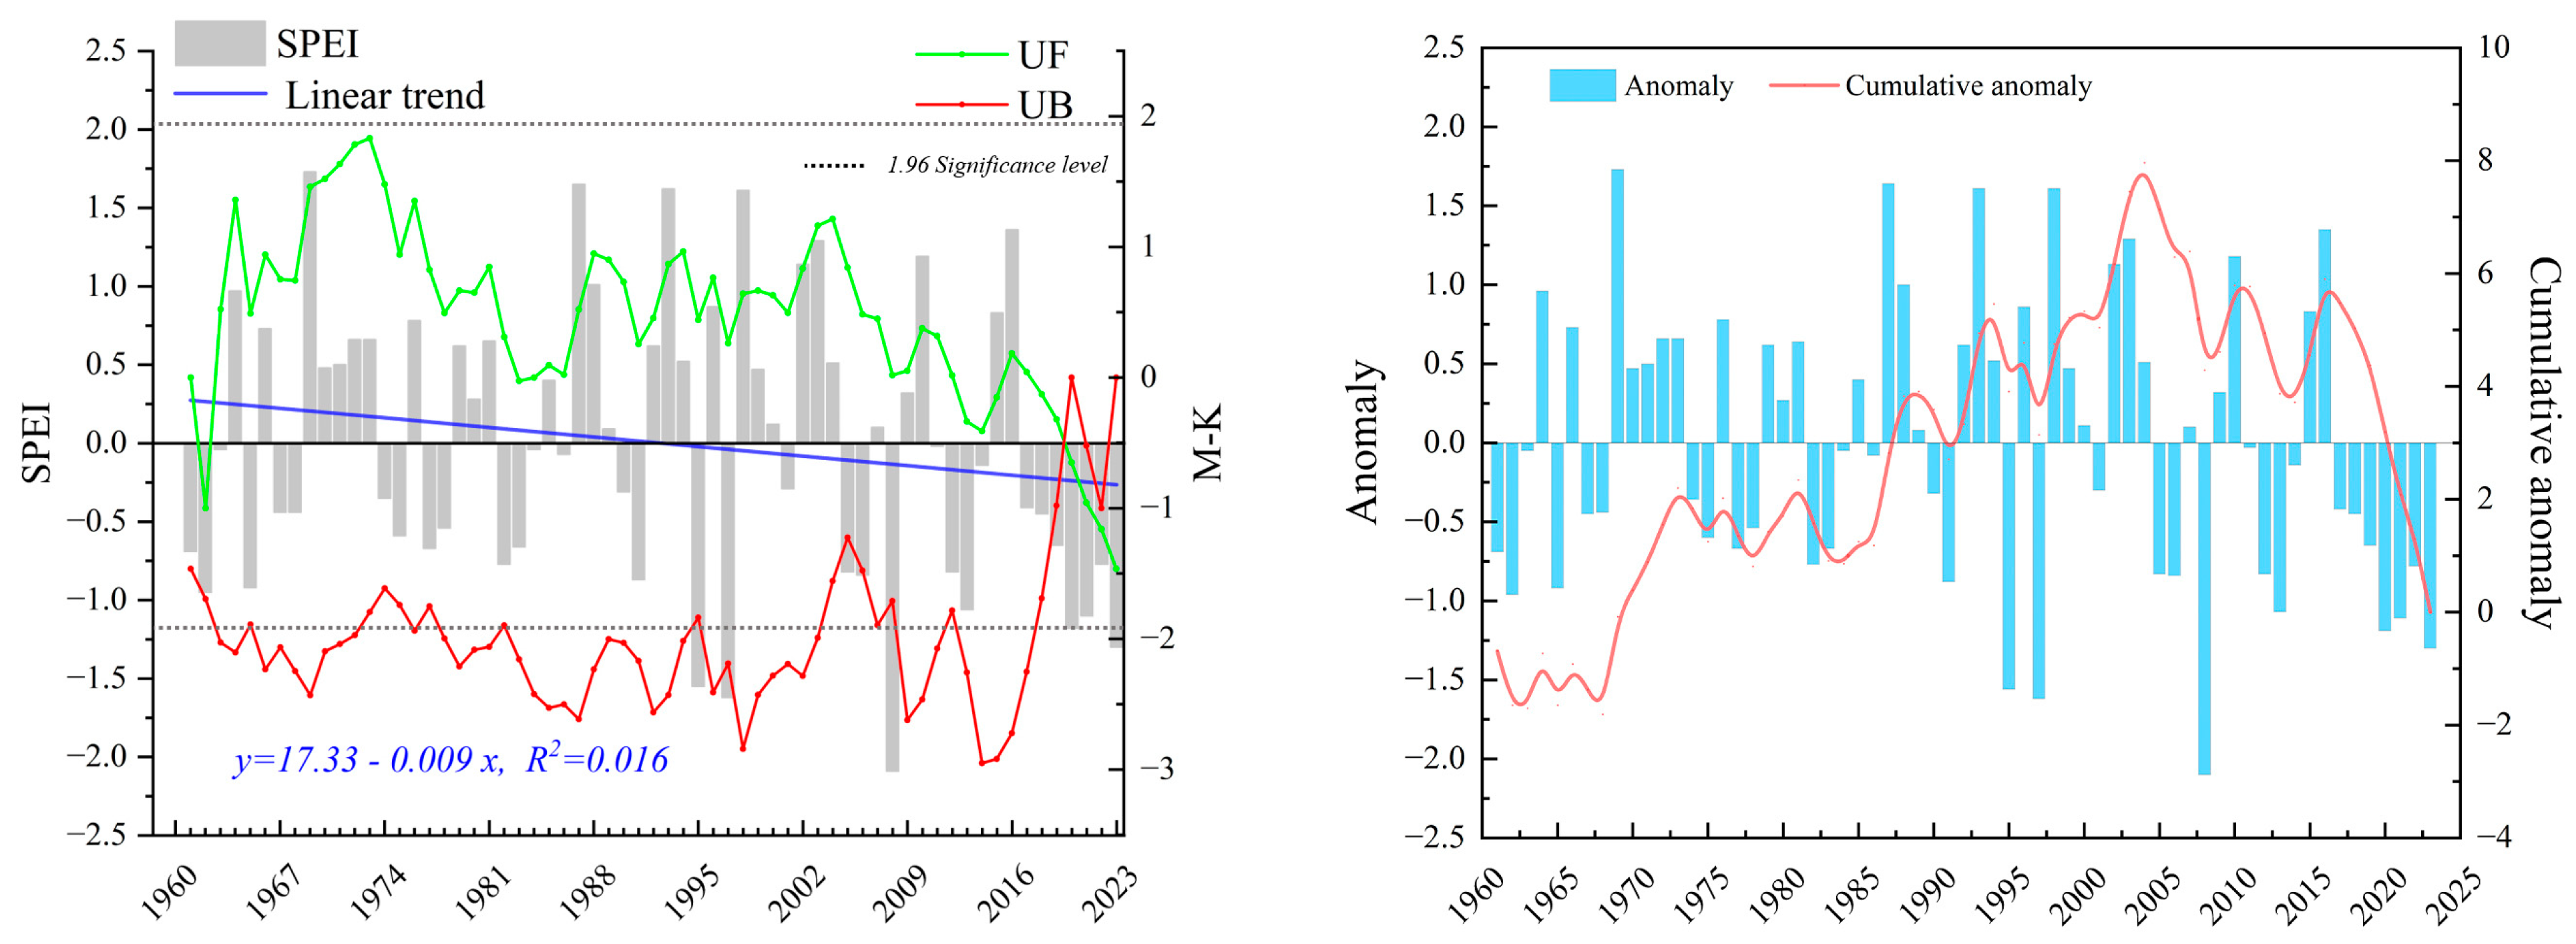
Figure 4.
Temporal Variations of SPEI in the Ili River Valley Region from 1961 to 2023.
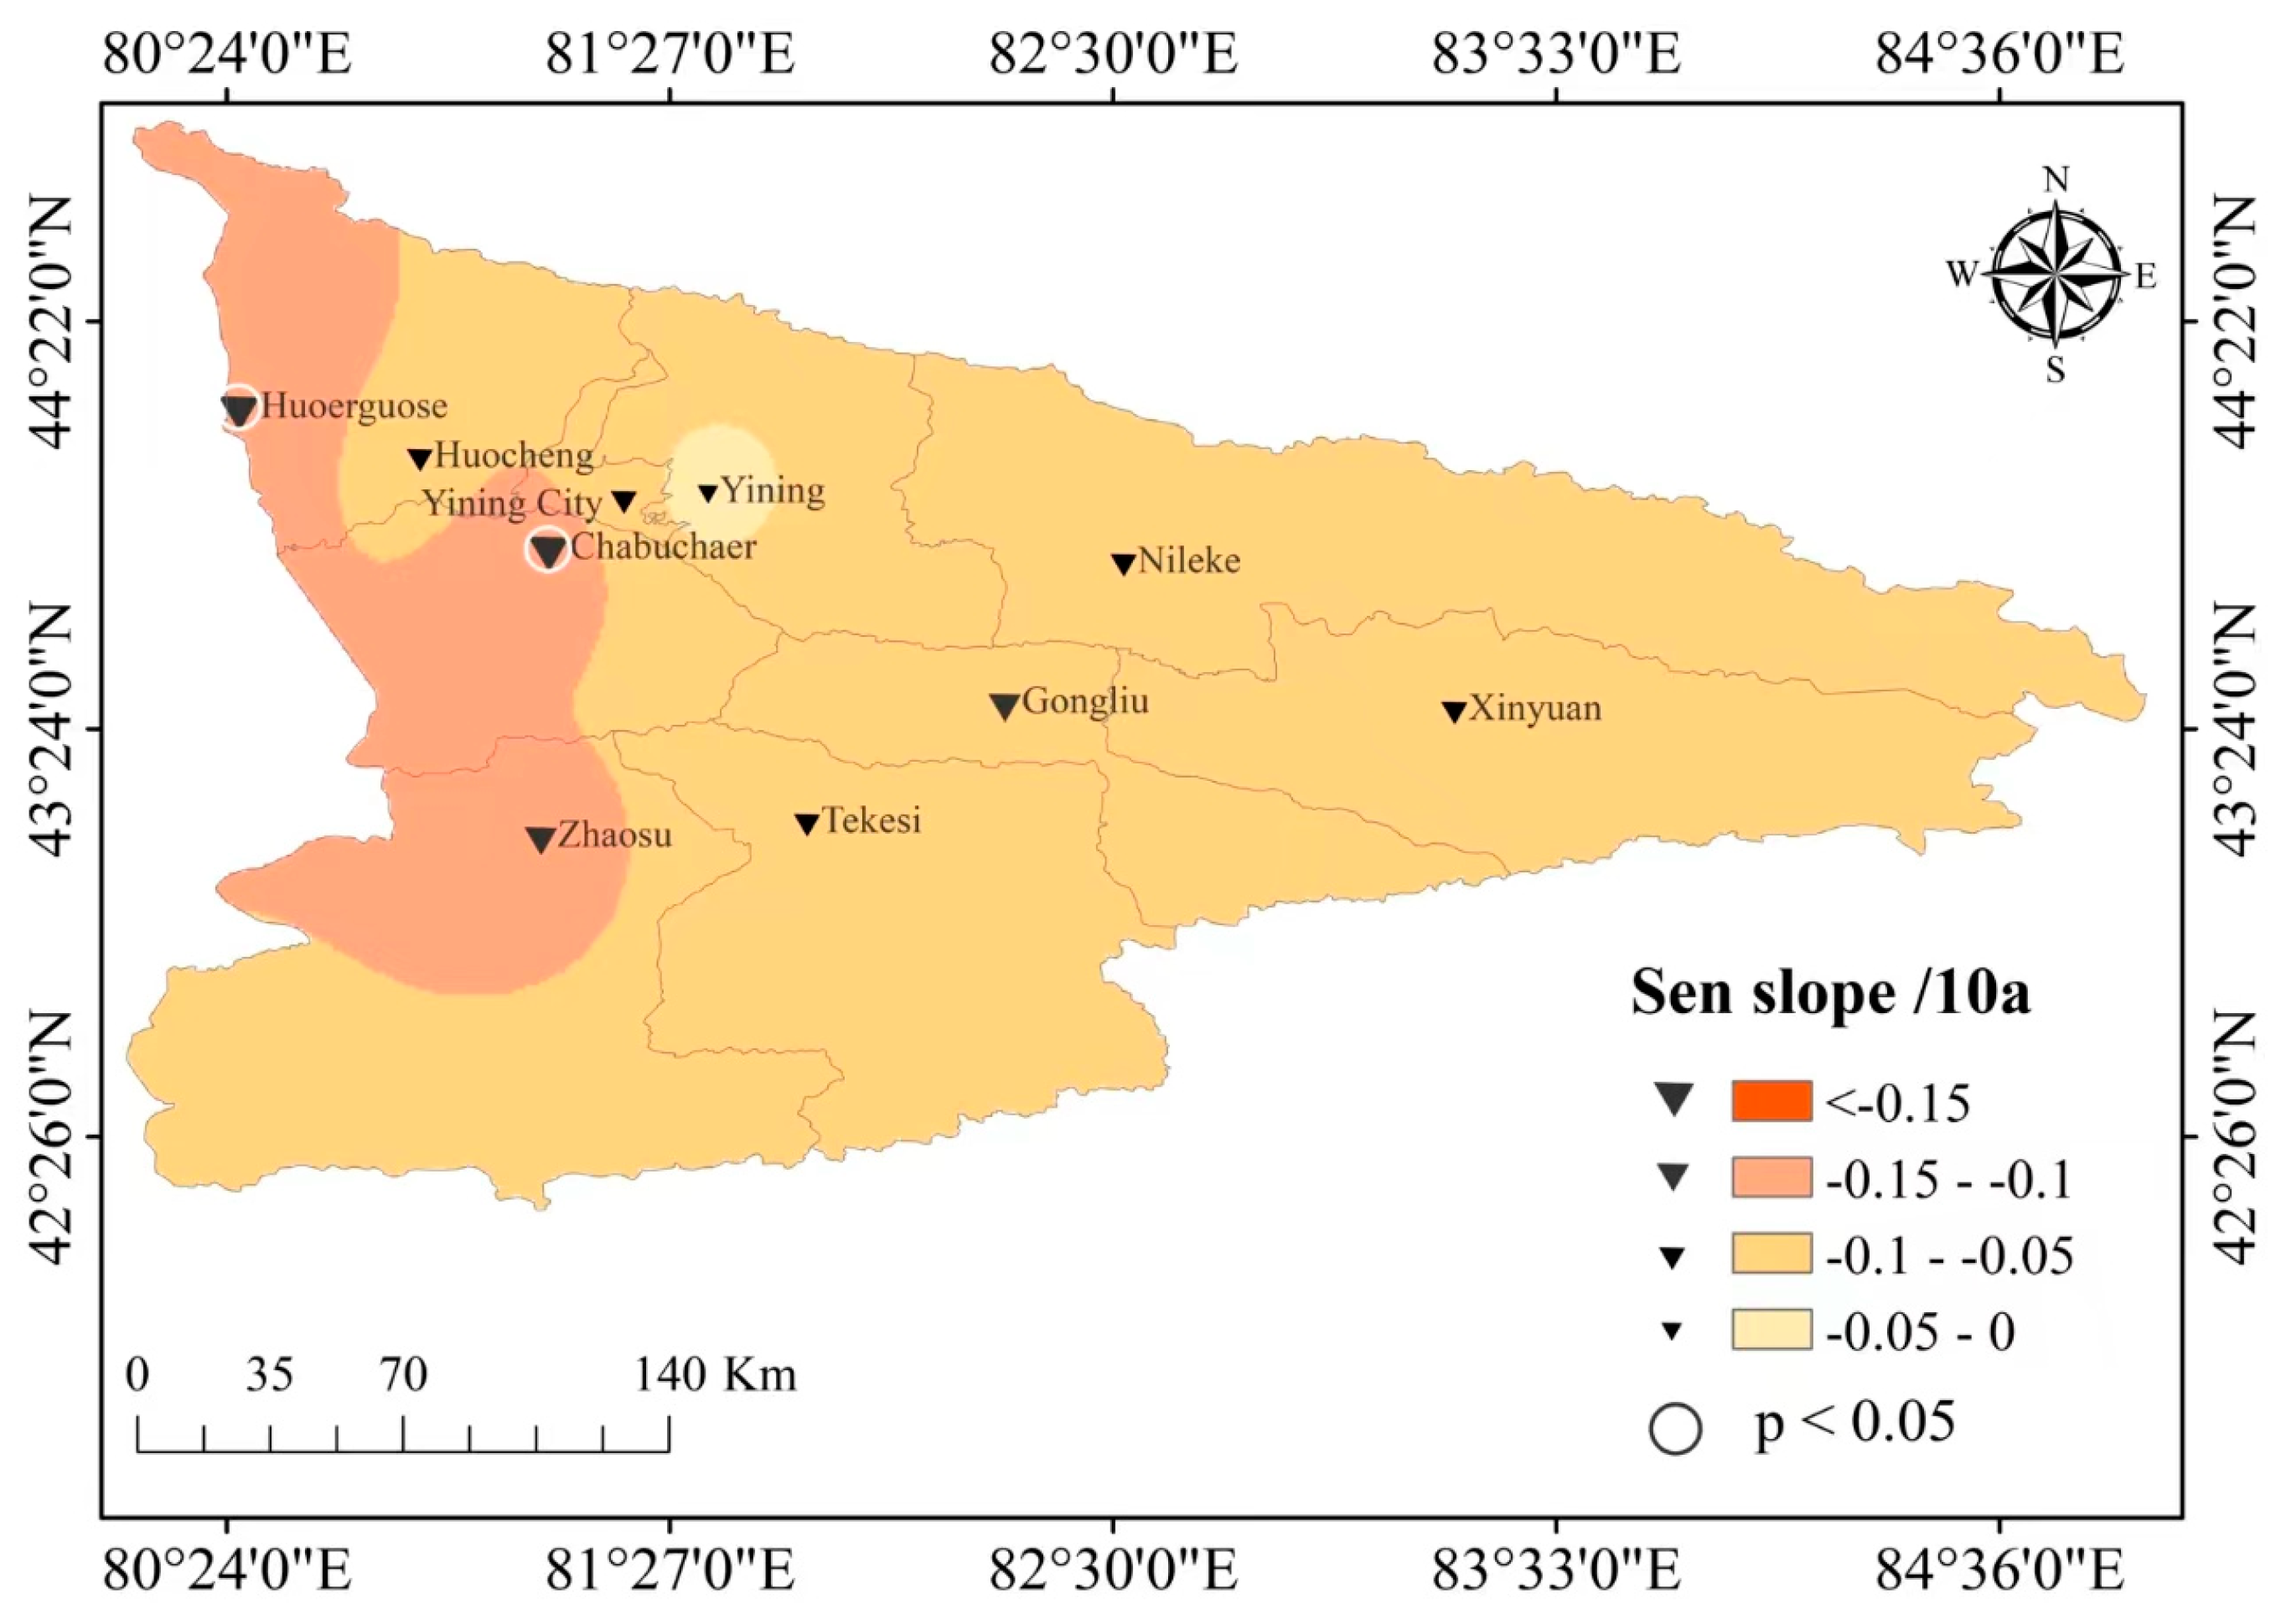
Figure 5.
Interannual variation of seasonal SPEI and M-K mutation test in Ili River Valley from 1961 to 2023.
Figure 5.
Interannual variation of seasonal SPEI and M-K mutation test in Ili River Valley from 1961 to 2023.
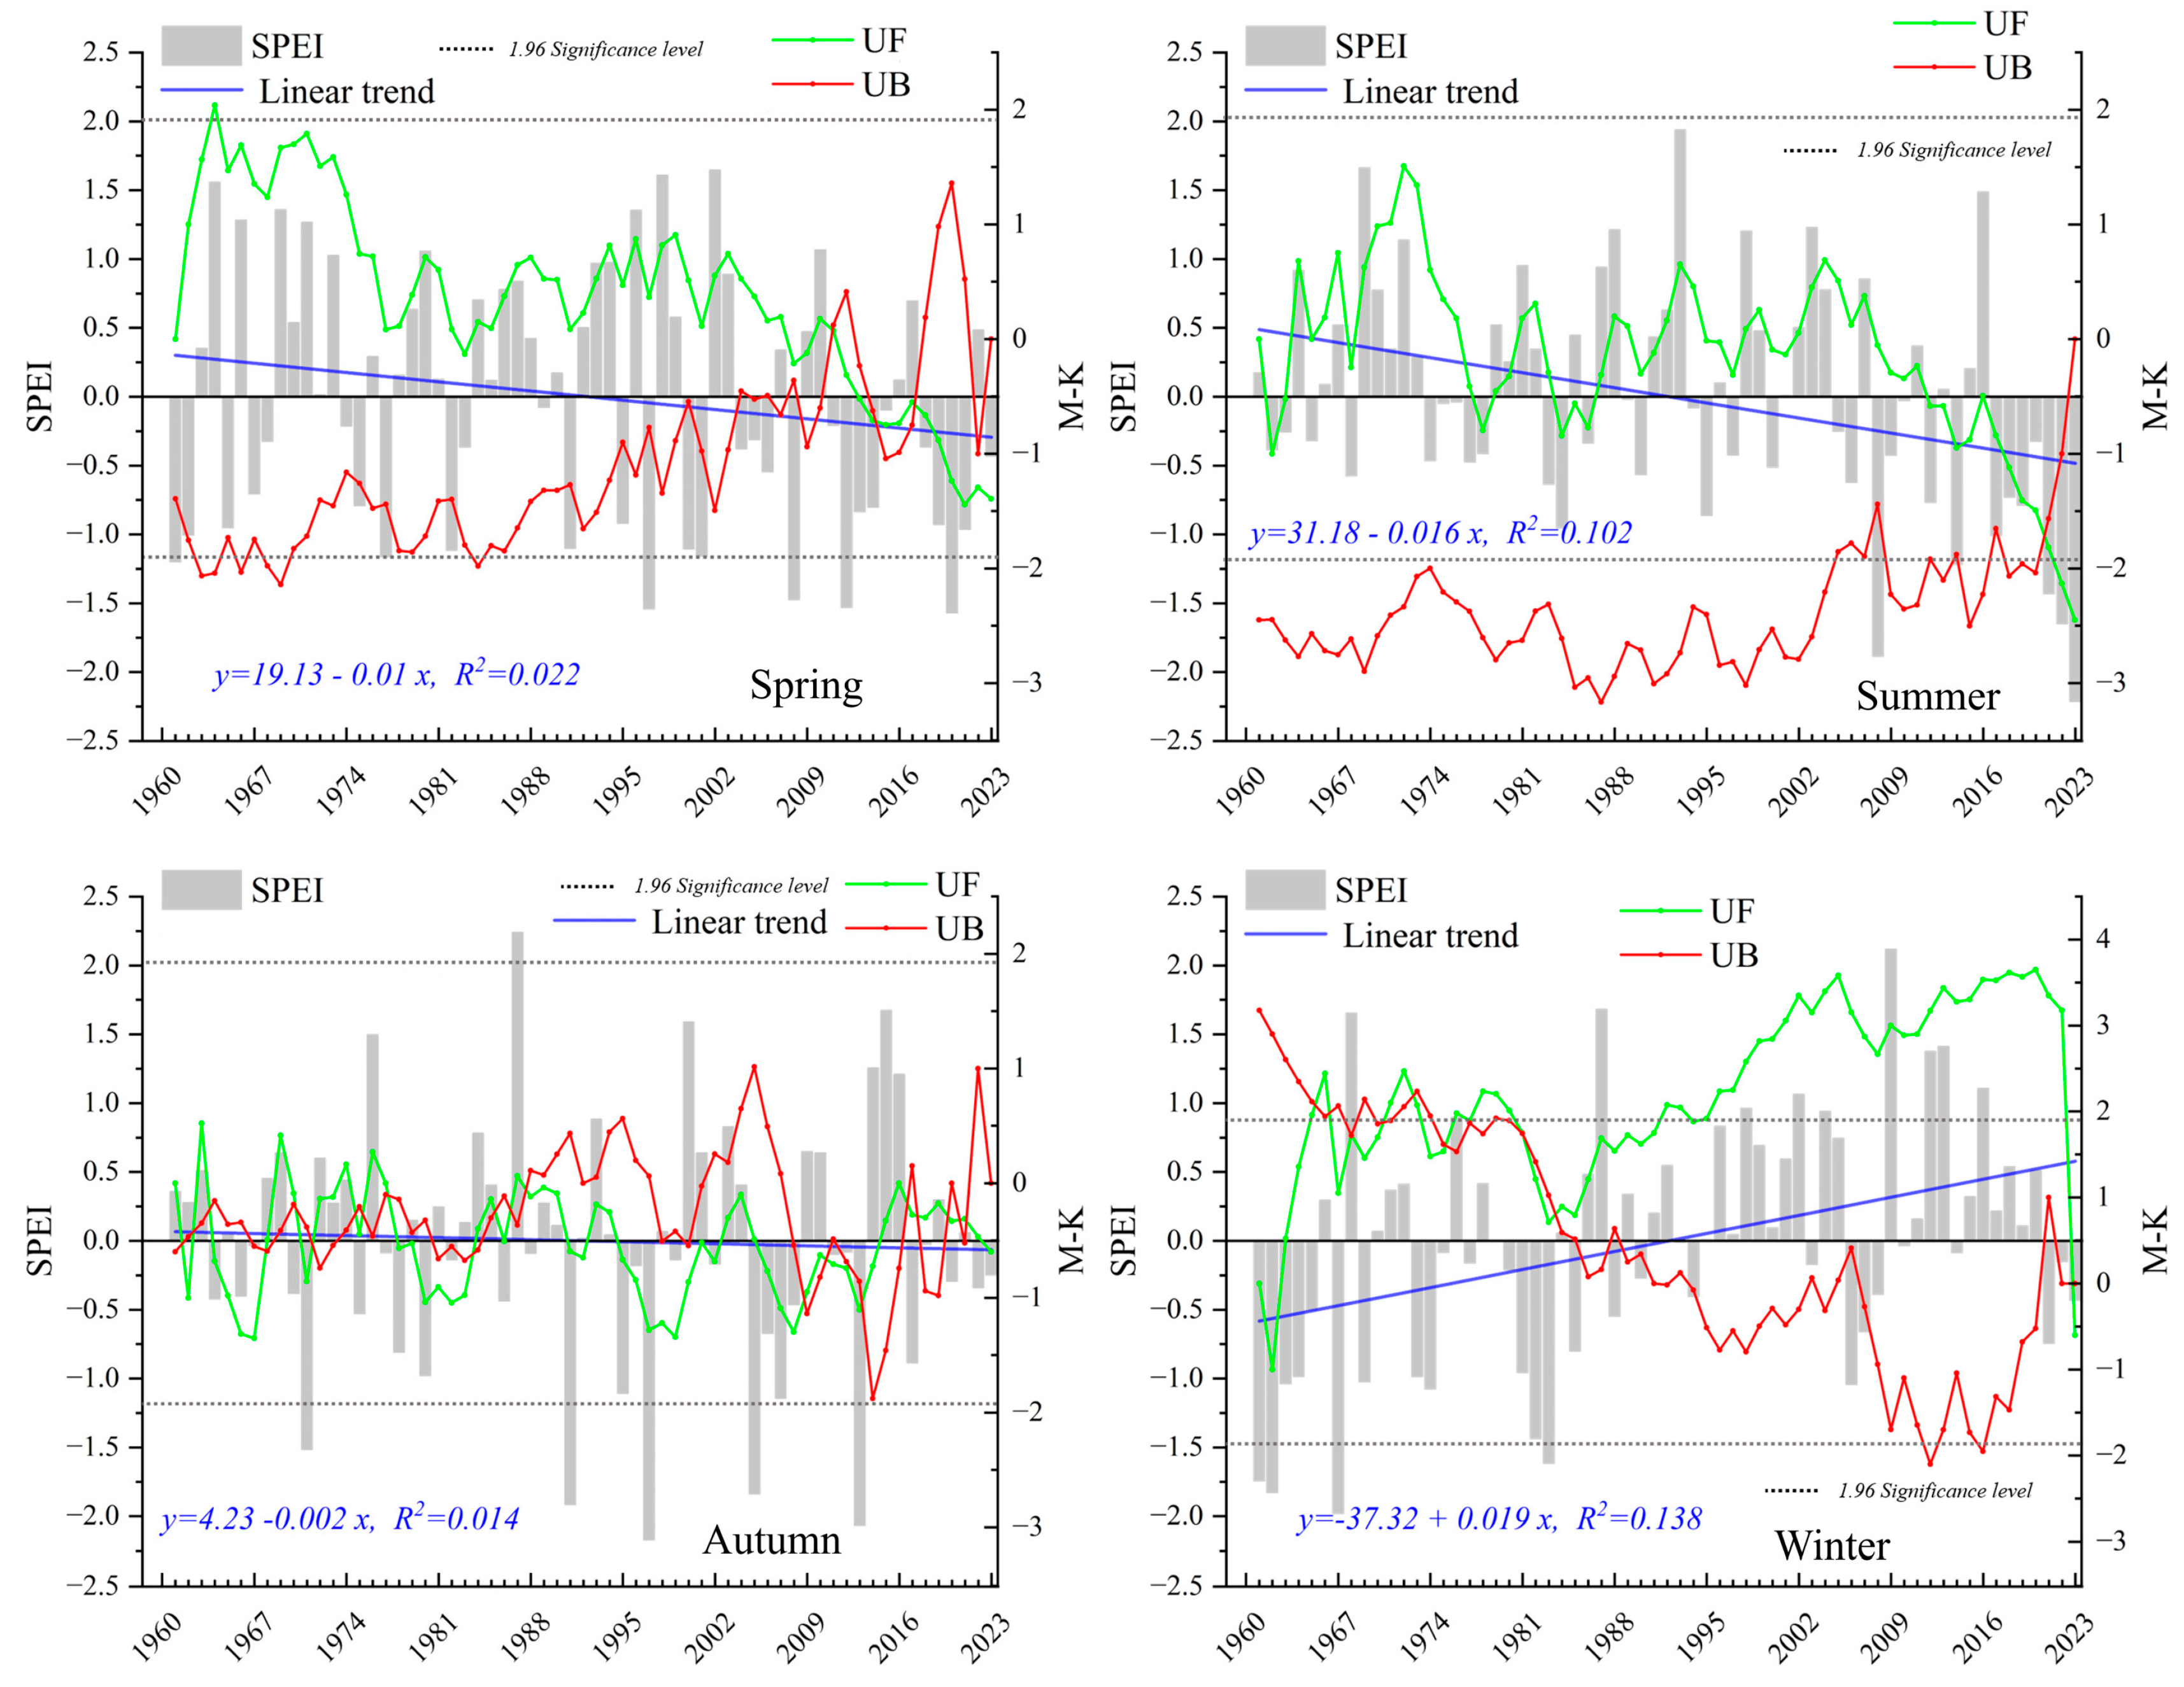
Figure 7.
Spatial variation trend of seasonal SPEI in Yili River Valley from 1961 to 2023.
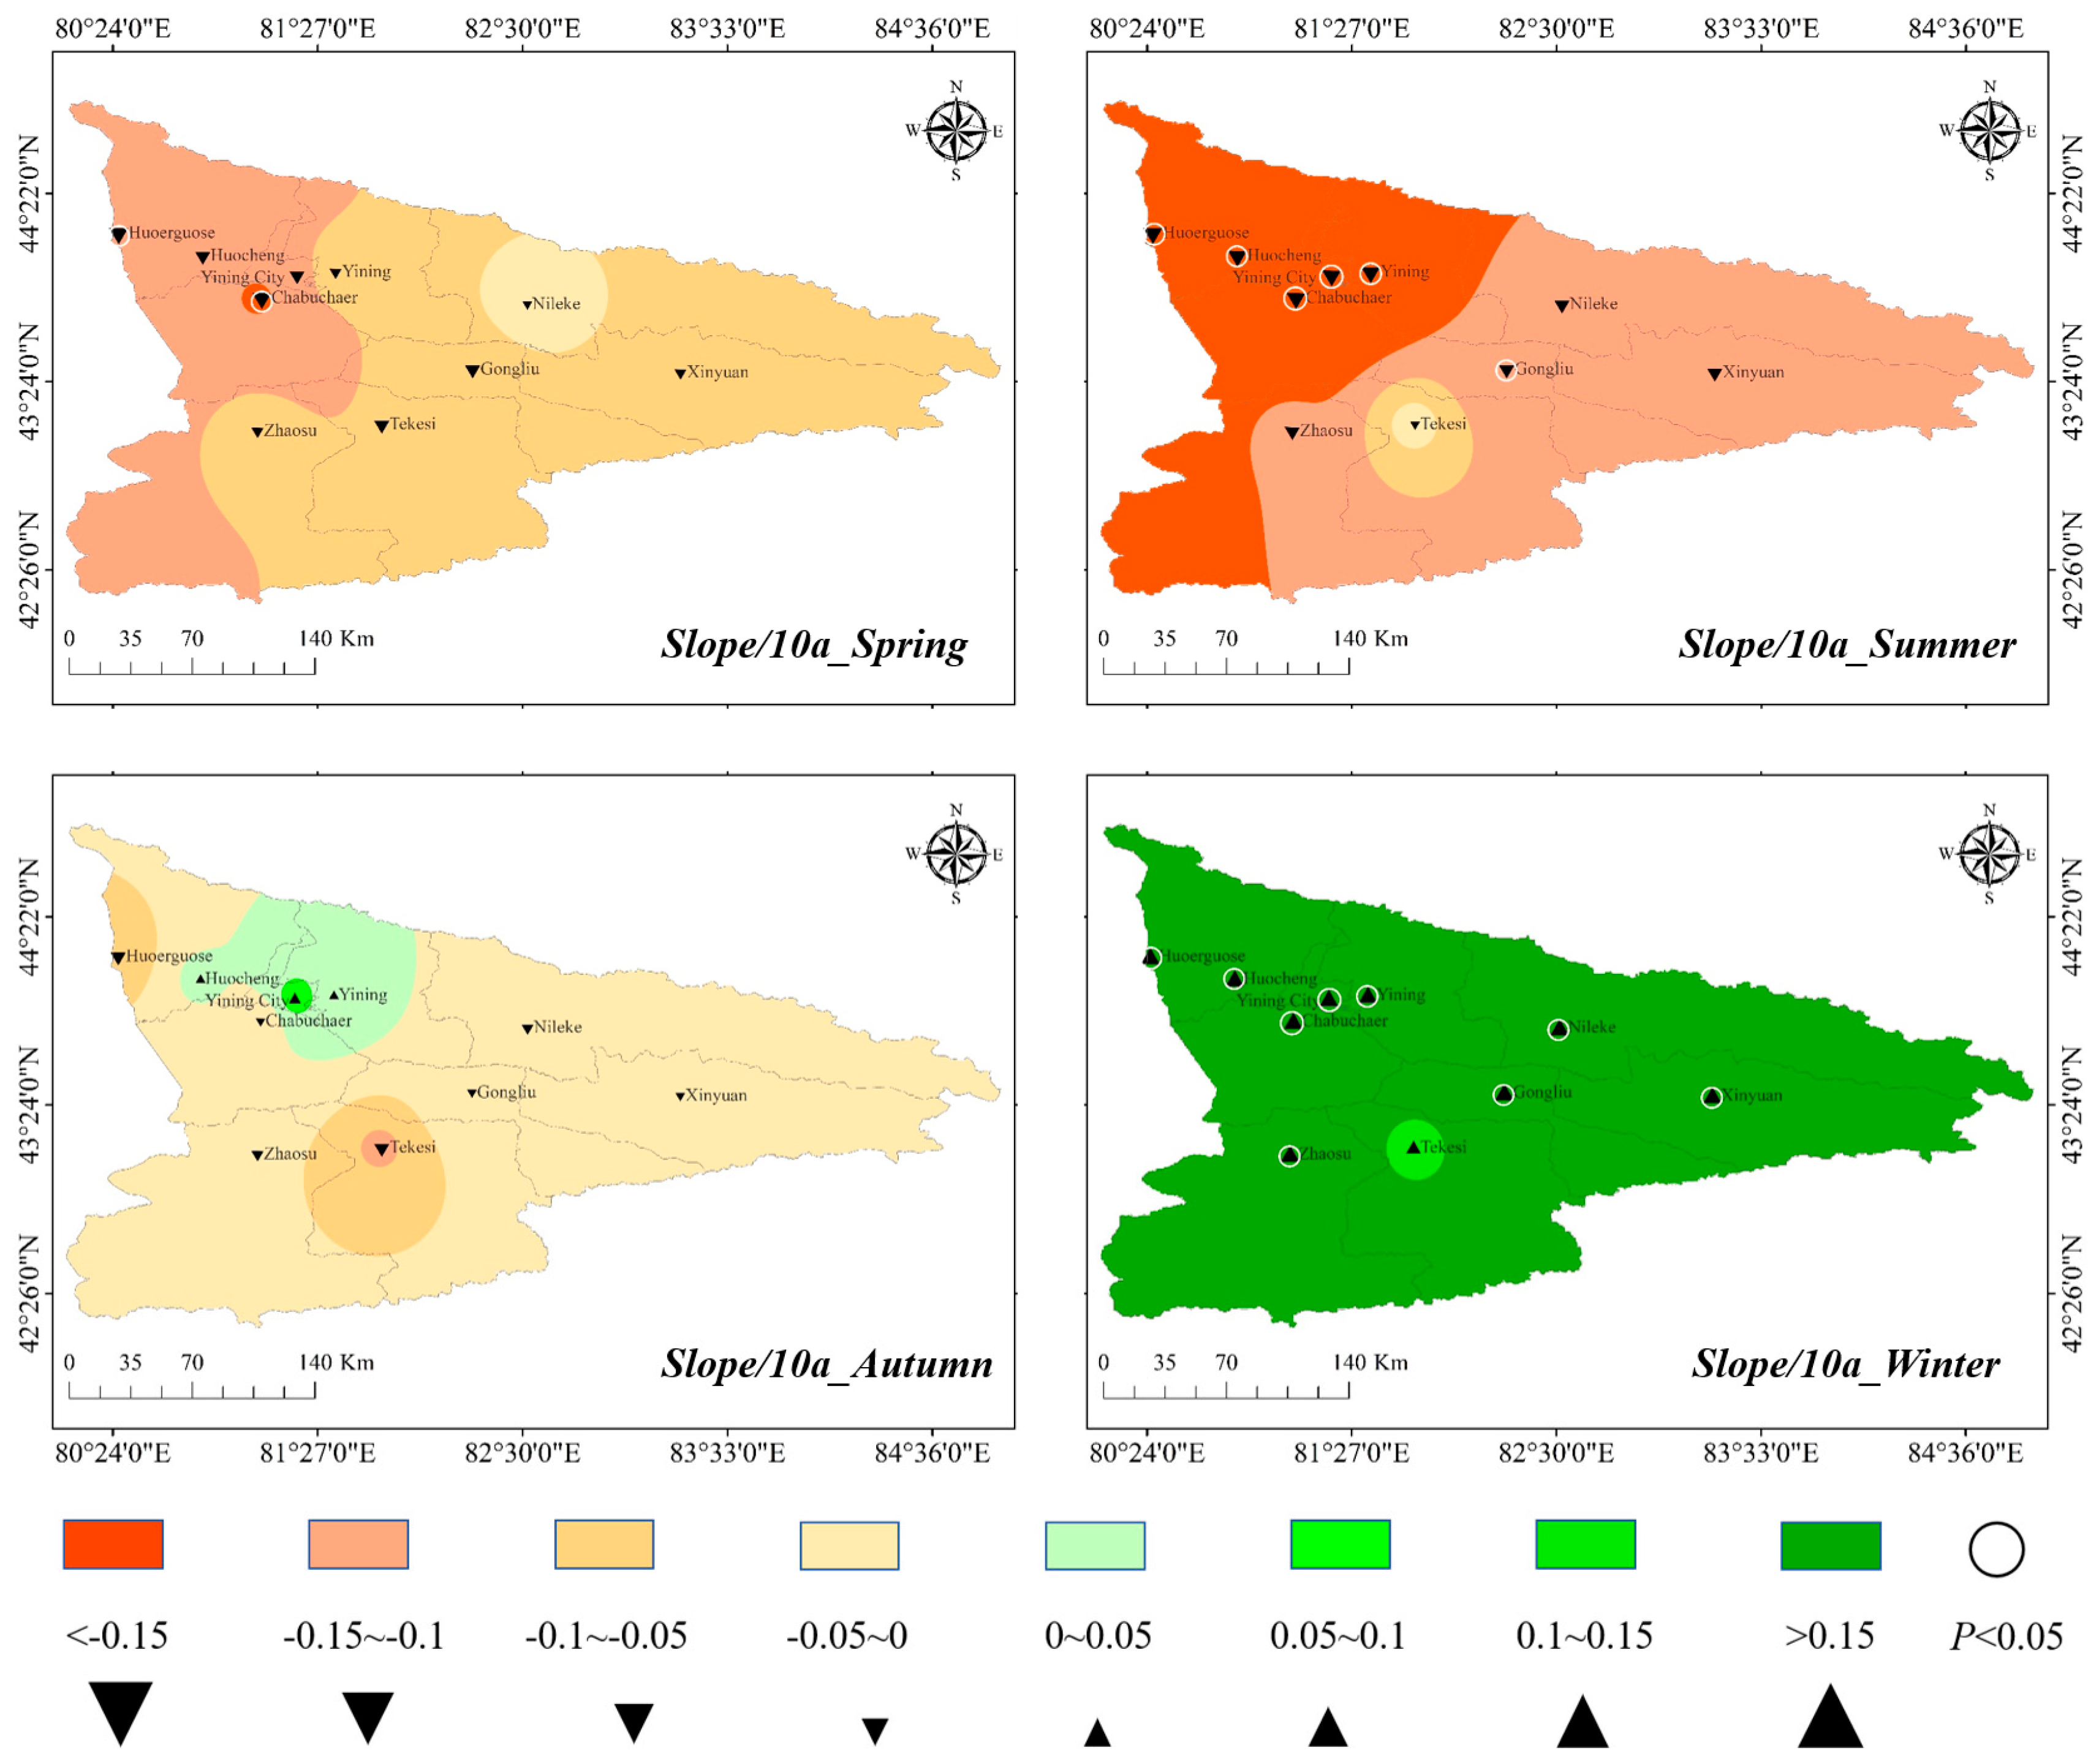
Figure 8.
Real contour map and wavelet variance of the annual SPEI wavelet coefficients in the Ili River Valley from 1961 to 2023.
Figure 8.
Real contour map and wavelet variance of the annual SPEI wavelet coefficients in the Ili River Valley from 1961 to 2023.
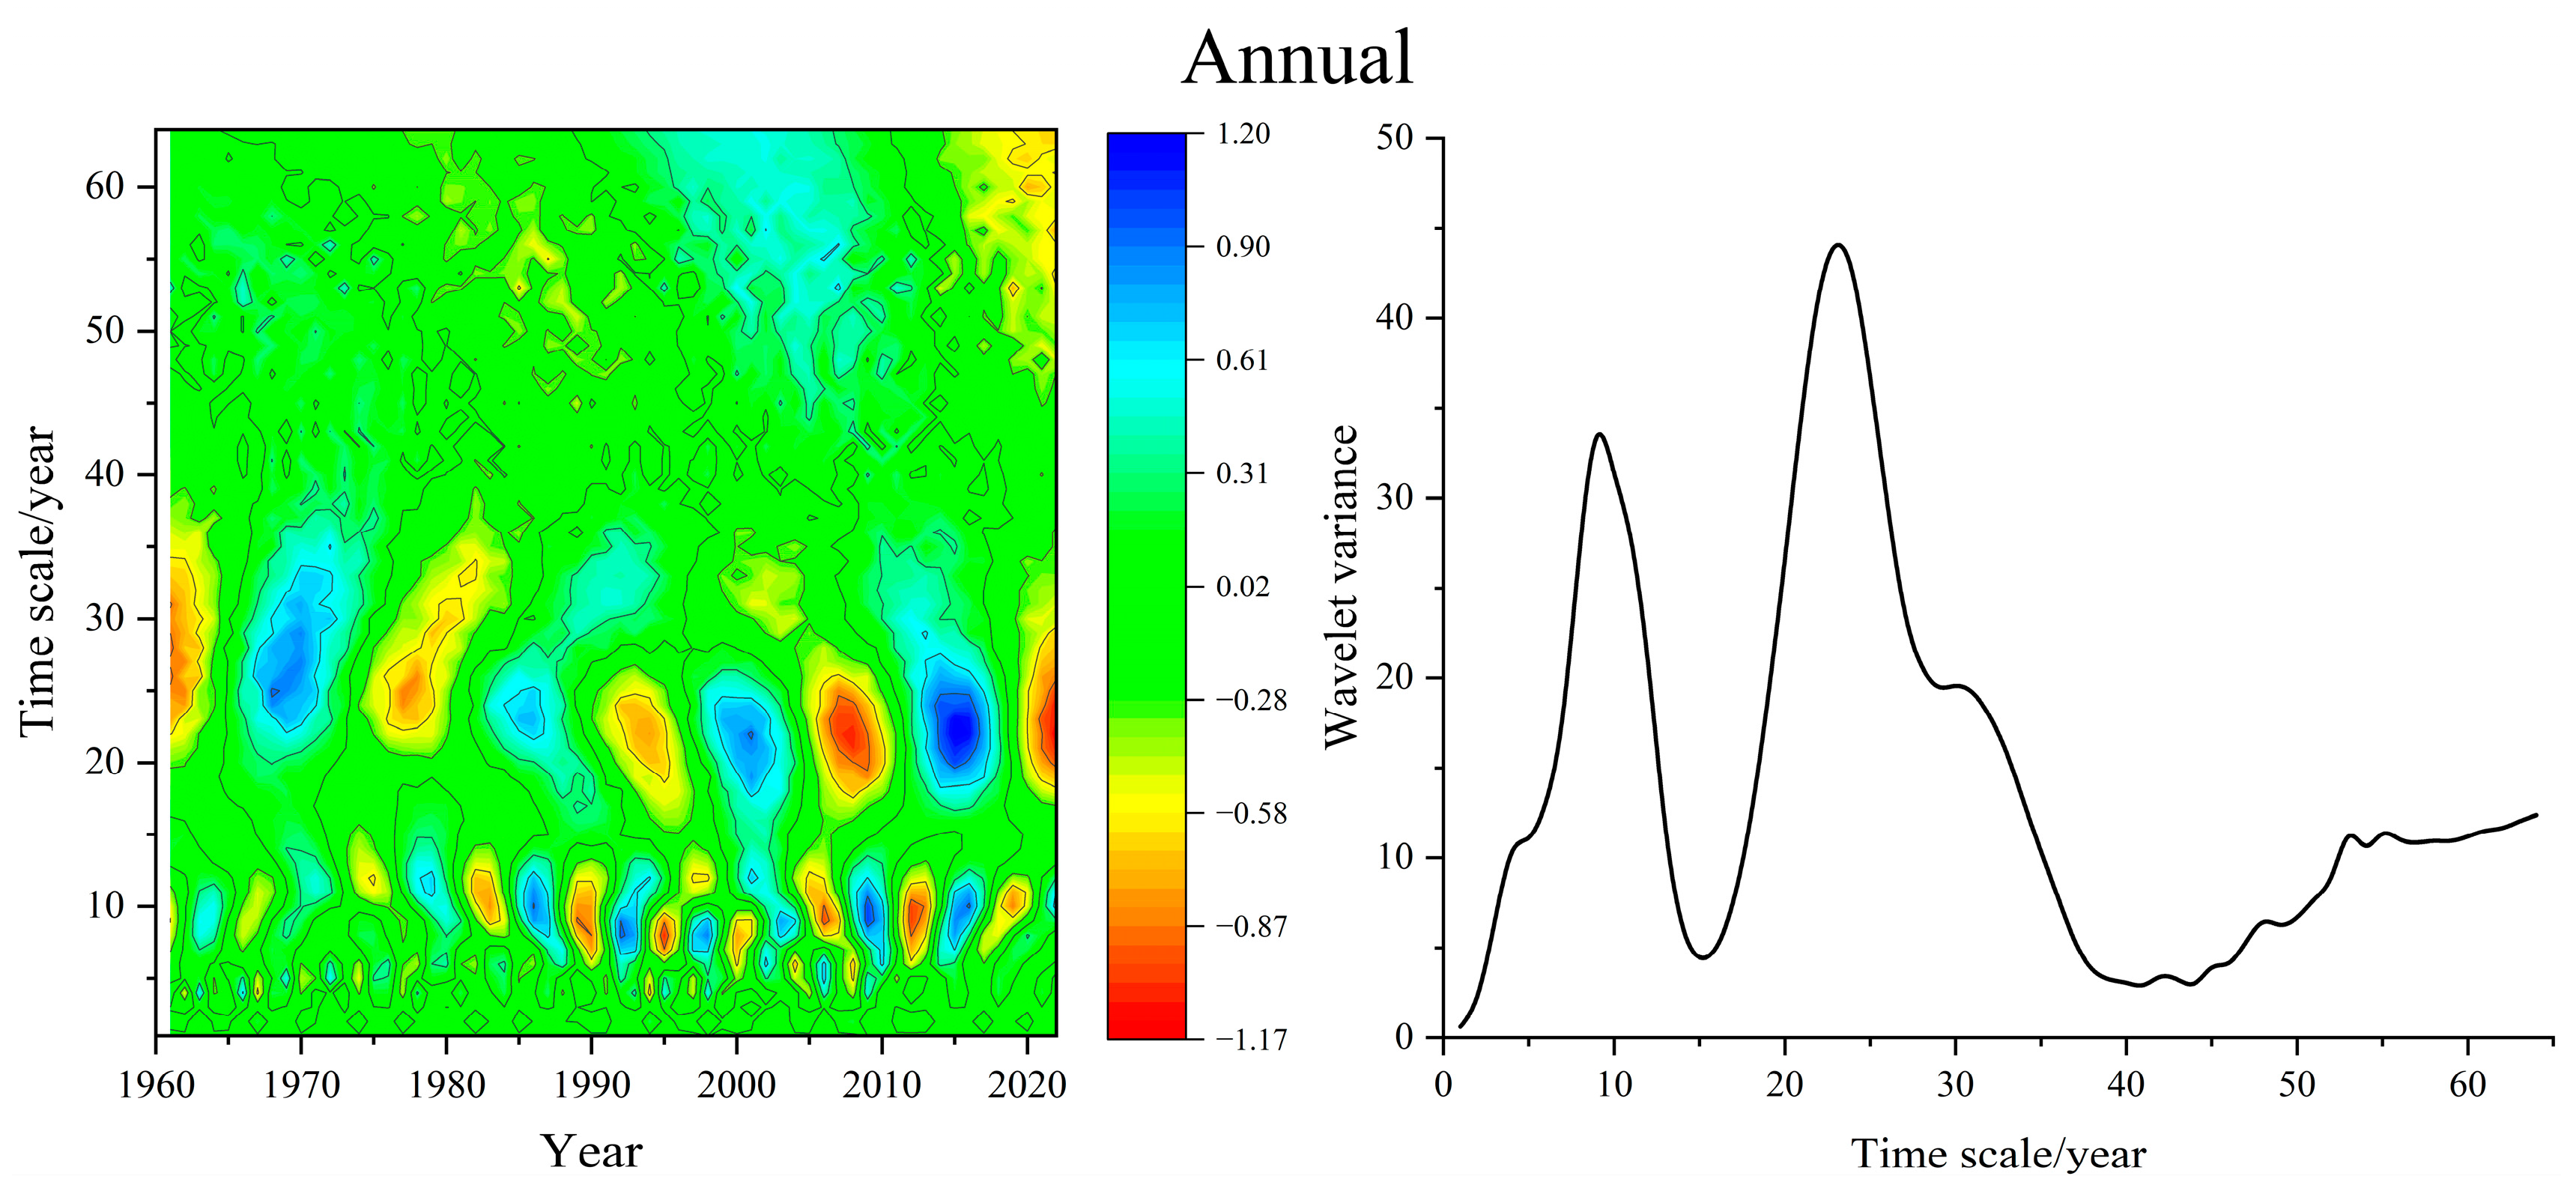
Figure 9.
Real contour map and wavelet variance of the seasonal SPEI wavelet coefficients in the Ili River Valley from 1961 to 2023.
Figure 9.
Real contour map and wavelet variance of the seasonal SPEI wavelet coefficients in the Ili River Valley from 1961 to 2023.
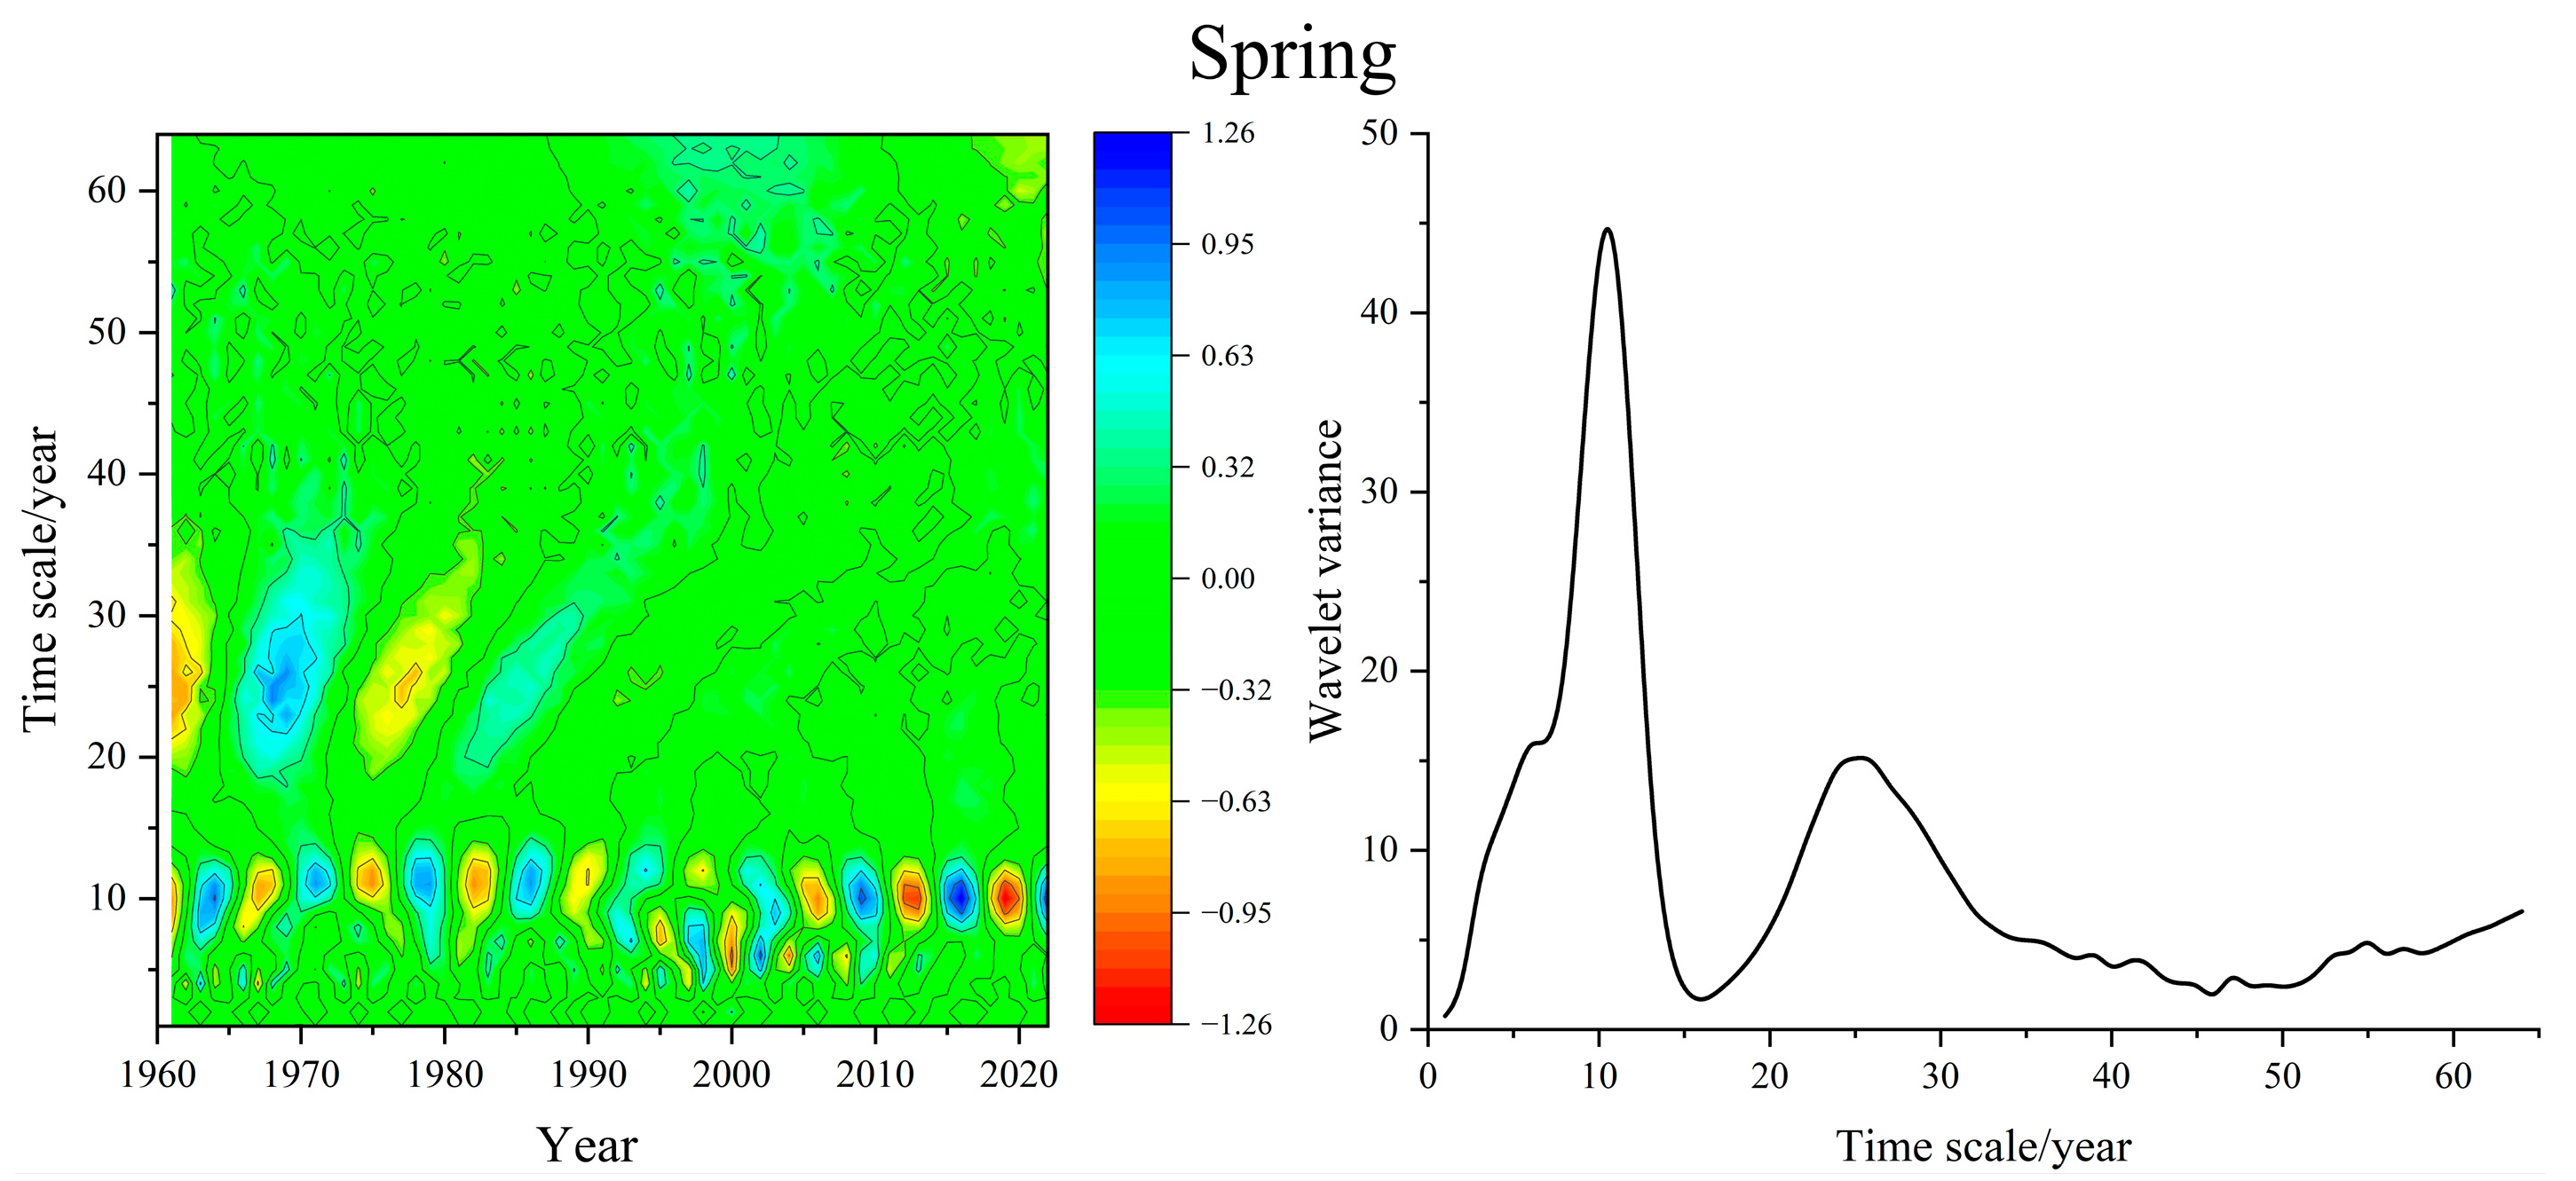
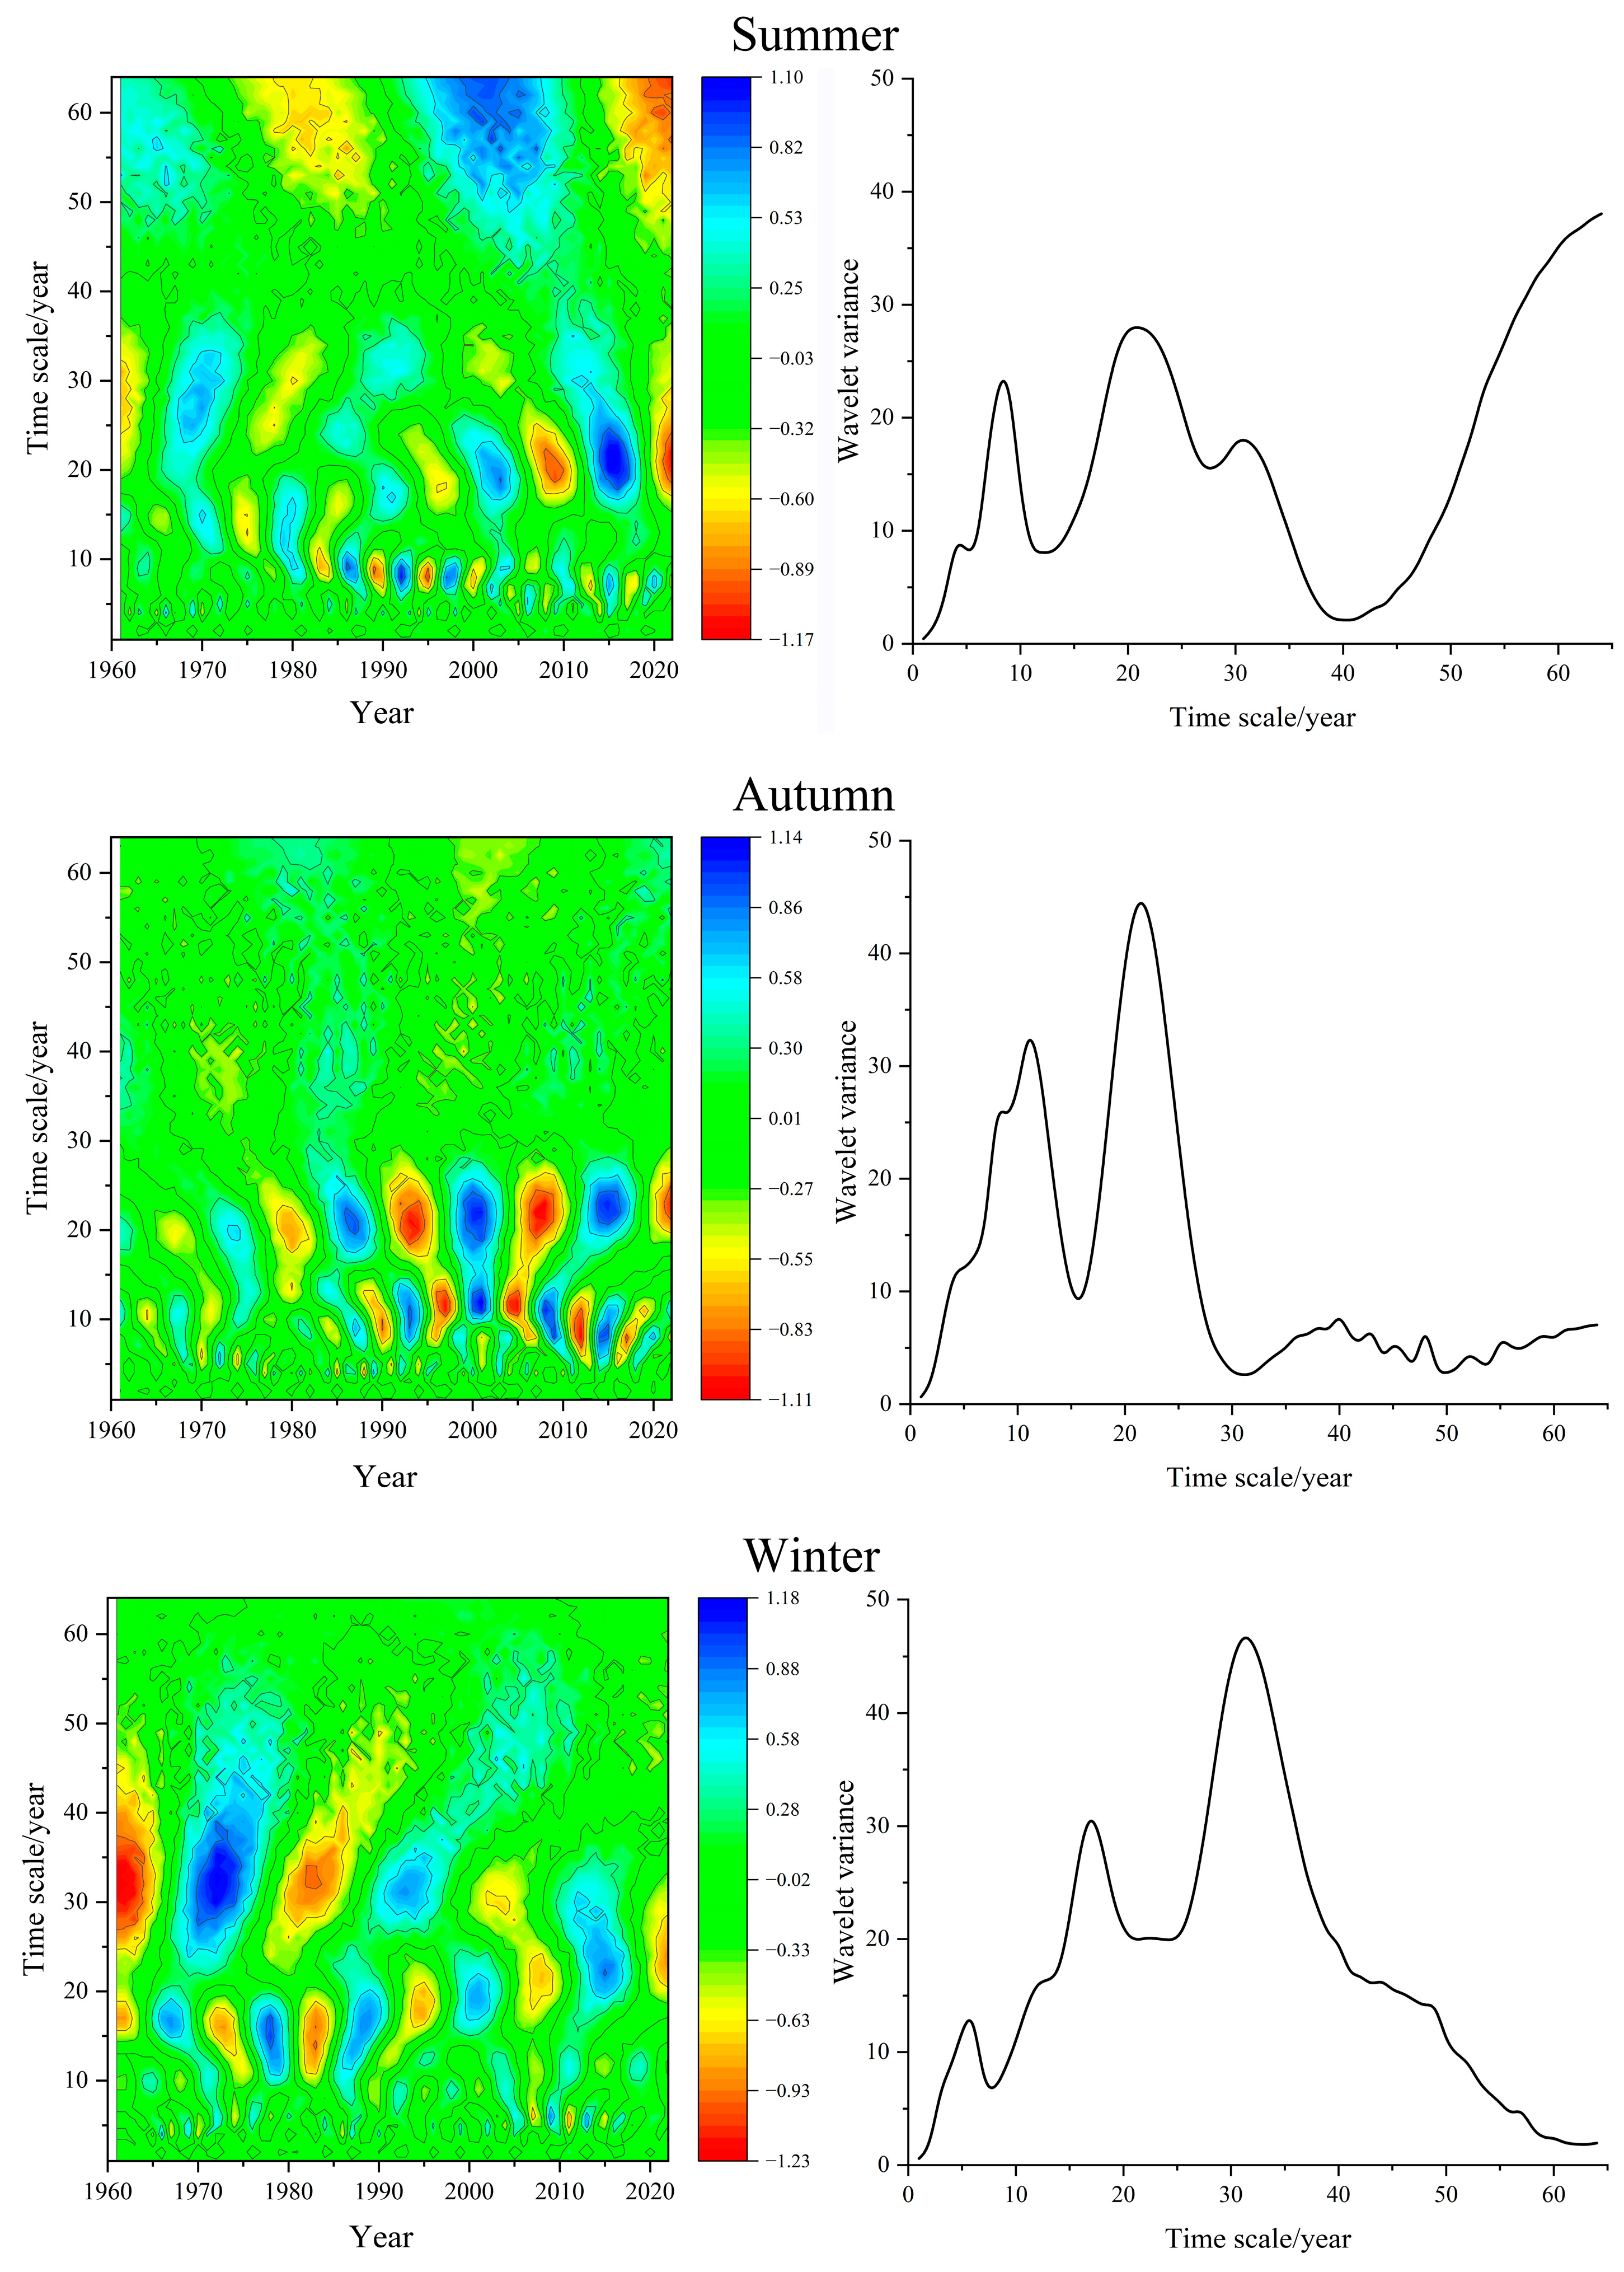
Figure 10.
3D scatter plot of the time scales and average periods of the SPEI on an annual scale at various stations in the Ili River Valley from 1961 to 2023 (refer to Supplementary Figure S1).
Figure 10.
3D scatter plot of the time scales and average periods of the SPEI on an annual scale at various stations in the Ili River Valley from 1961 to 2023 (refer to Supplementary Figure S1).
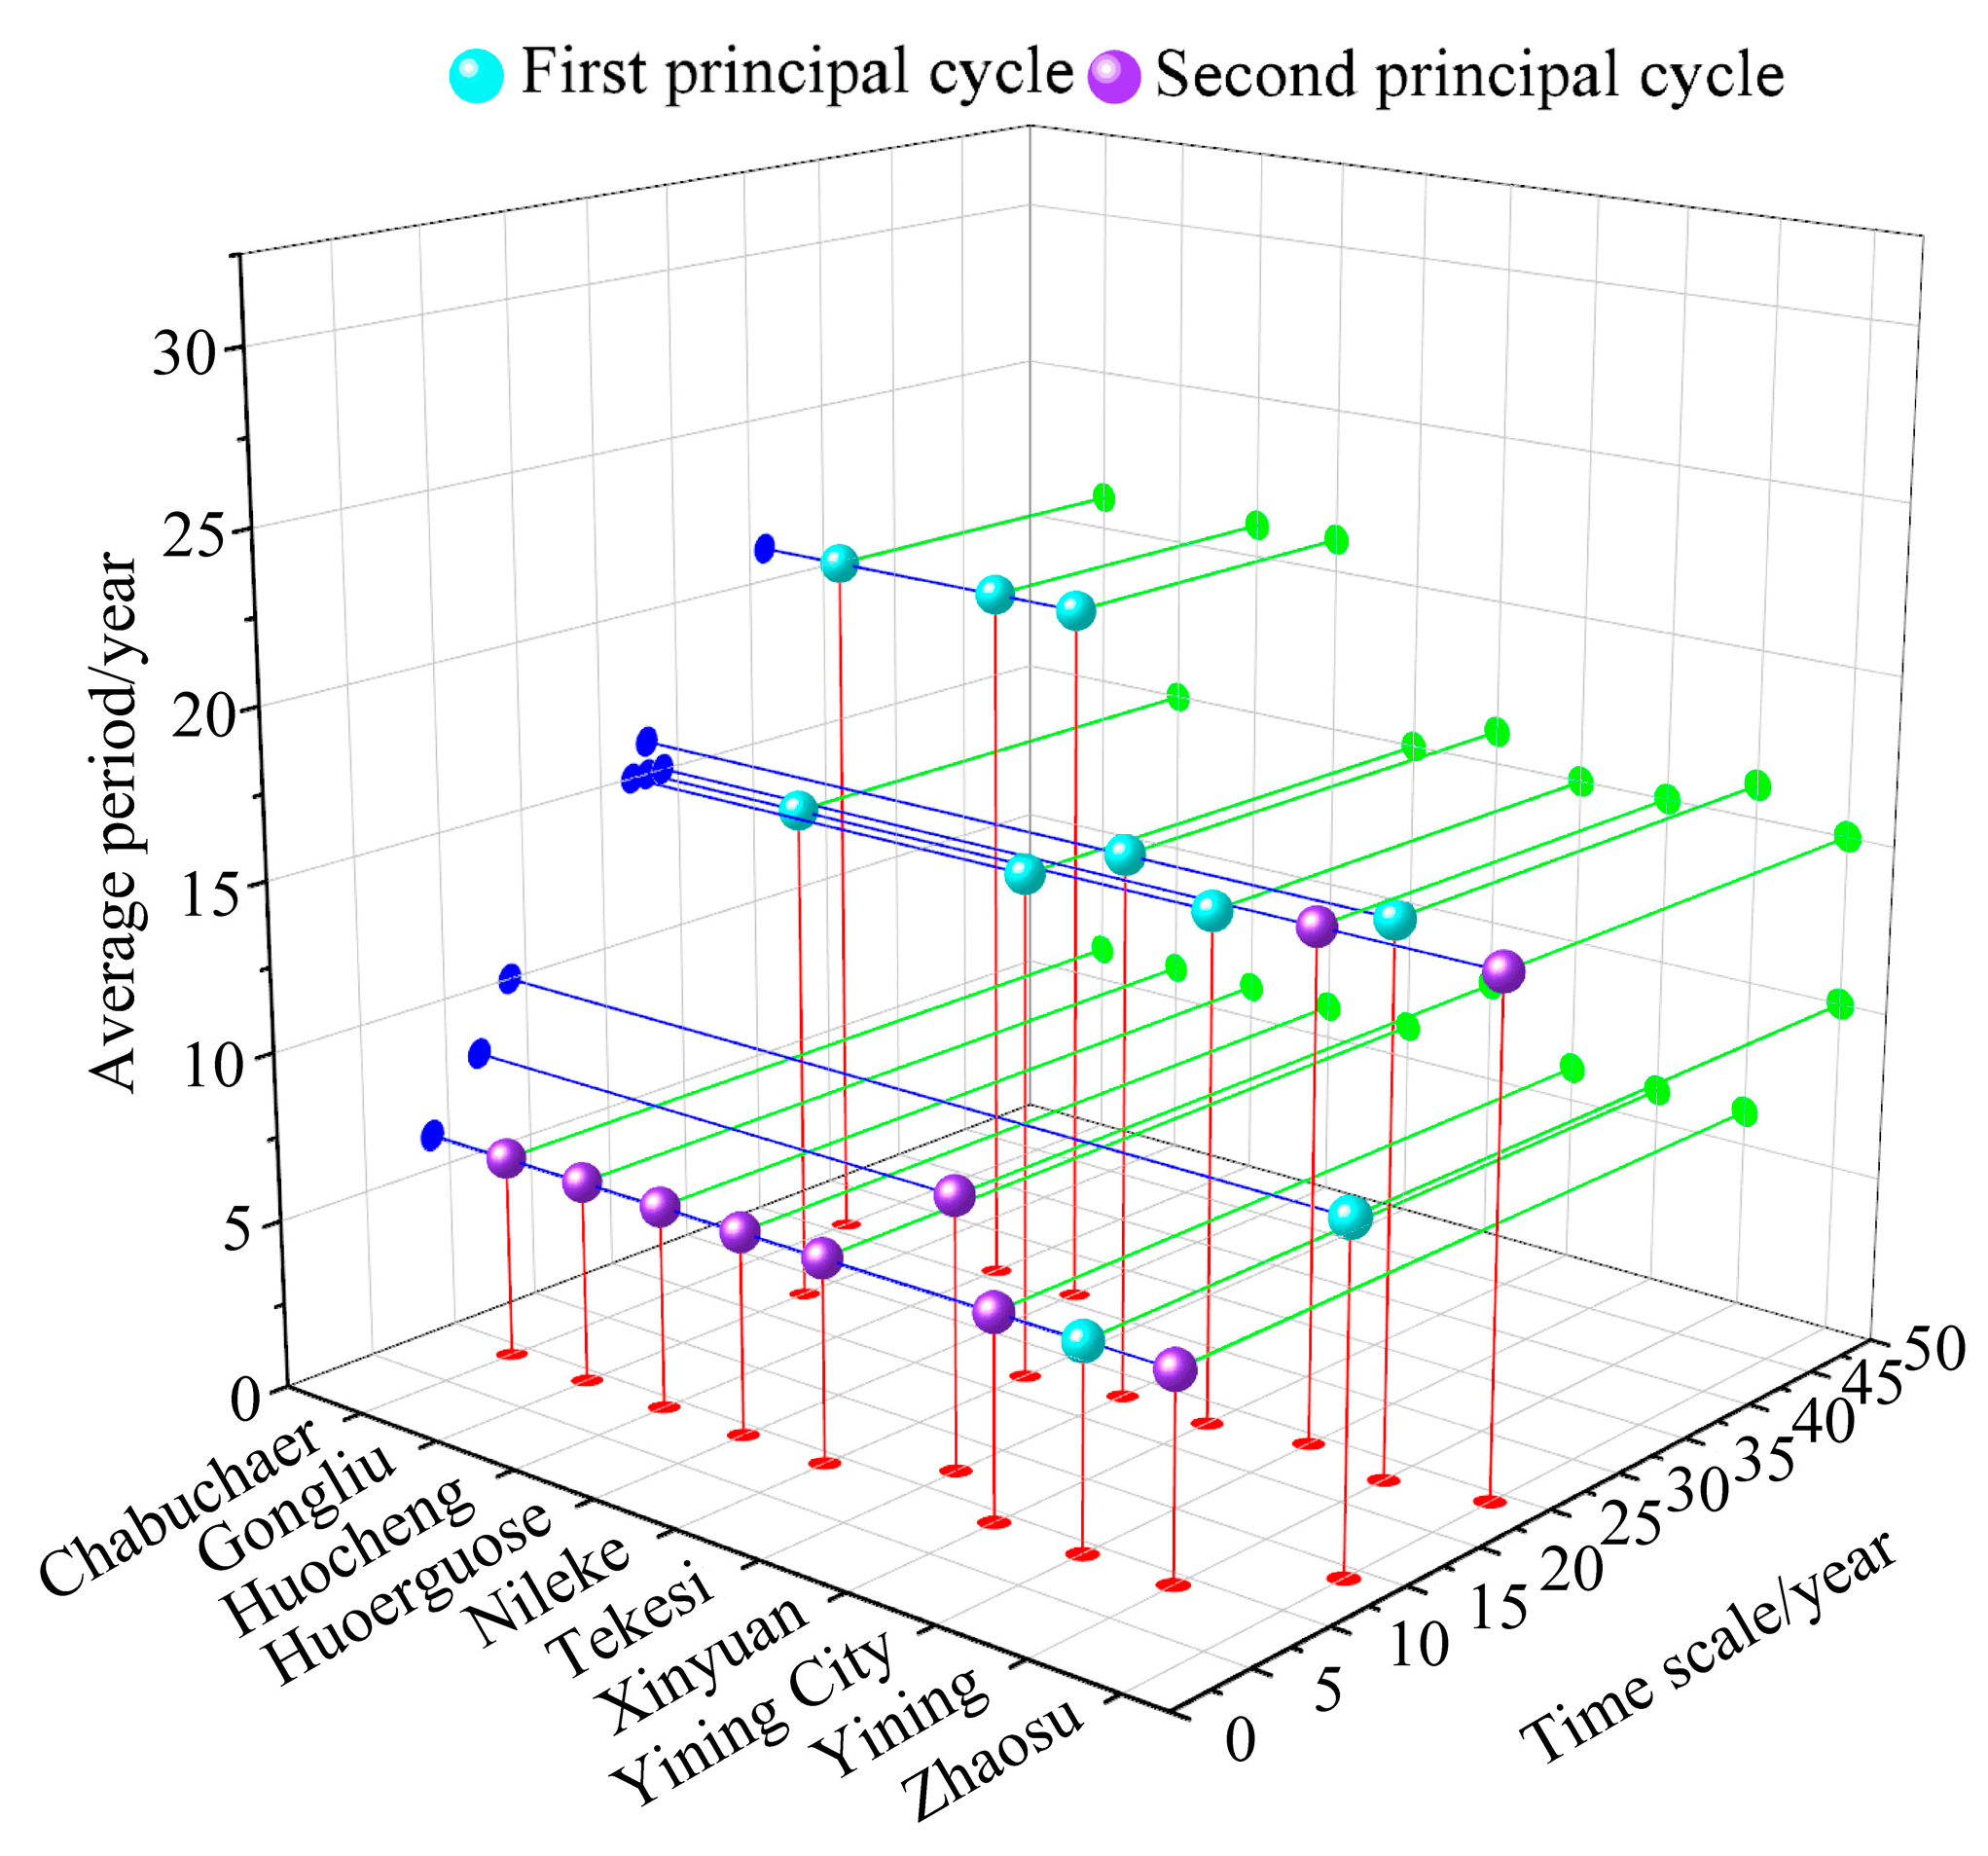
Figure 11.
3D scatter plot of the time scales and average periods of the SPEI on seasonal scale at various stations in the Ili River Valley from 1961 to 2023 (refer to Supplementary Figure S2).
Figure 11.
3D scatter plot of the time scales and average periods of the SPEI on seasonal scale at various stations in the Ili River Valley from 1961 to 2023 (refer to Supplementary Figure S2).
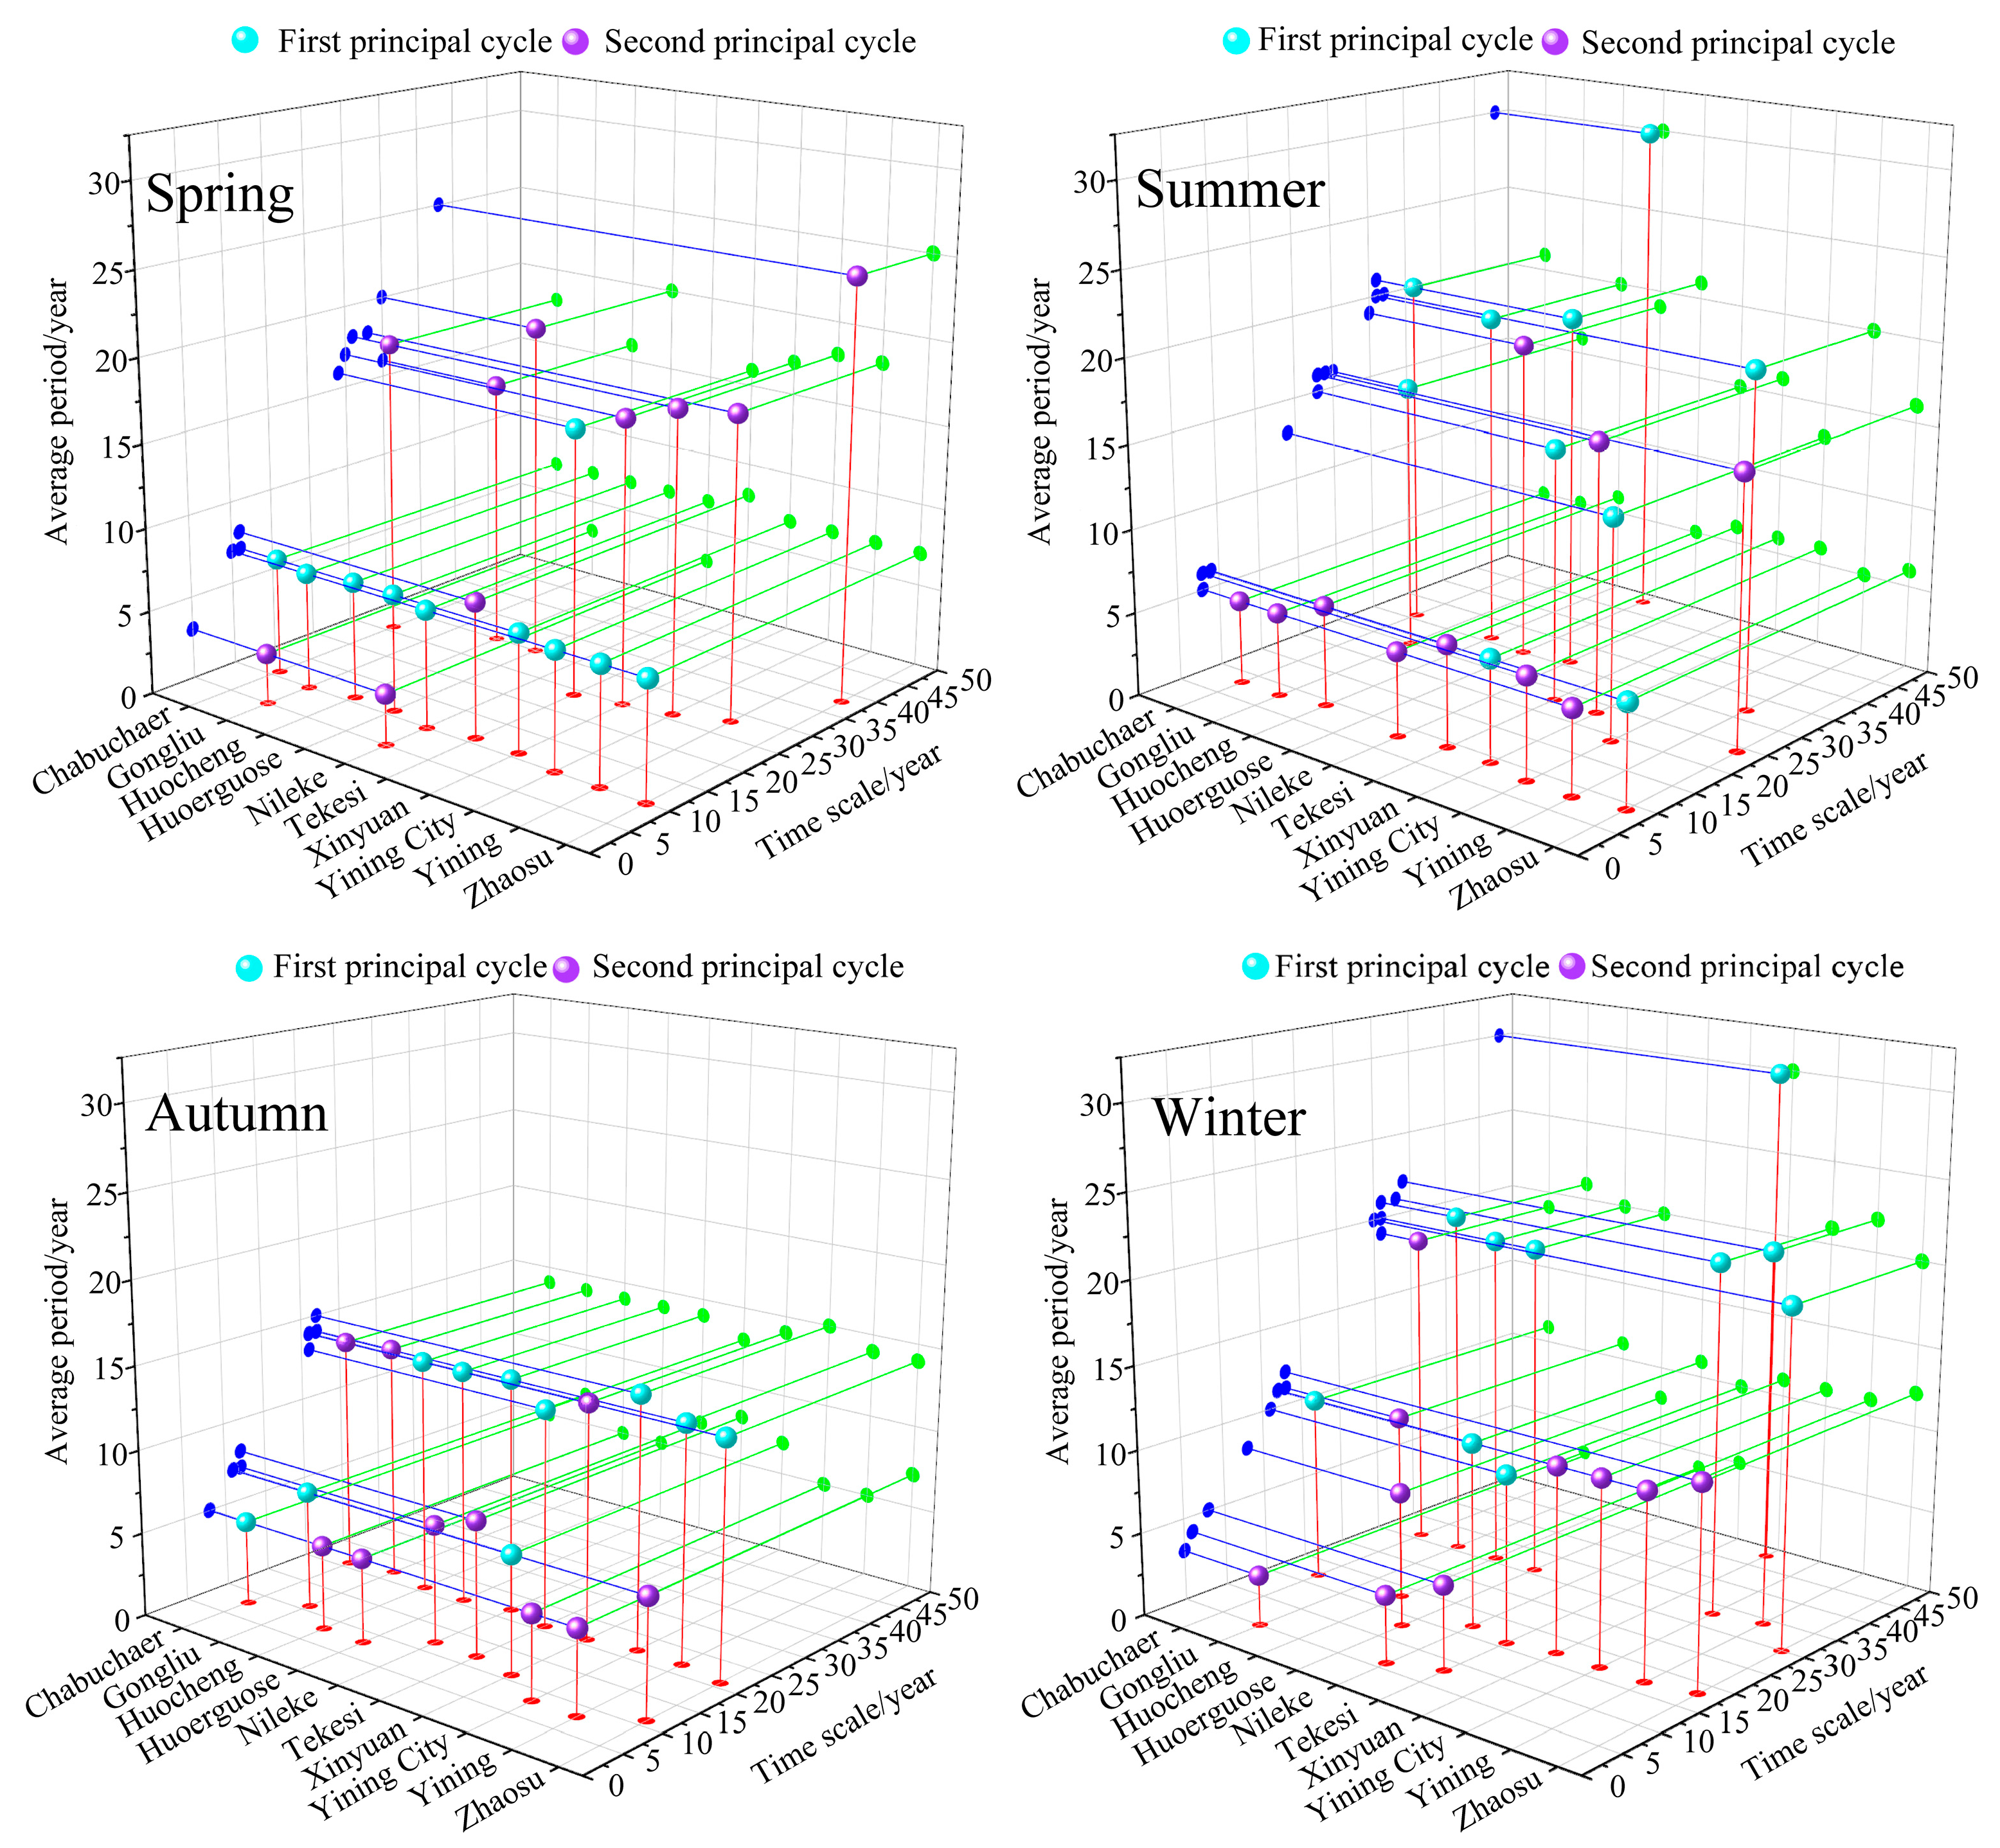

Table 1.
SPEI drought classification standard table
| Grade | Classification | SPEI threshold |
|---|---|---|
| 1 | No drought | -0.5<SPEI |
| 2 | Mild drought | -1.0<SPEI≤-0.5 |
| 3 | Moderate drought | -1.5<SPEI≤-1.0 |
| 4 | Severe drought | -2.0<SPEI≤-1.5 |
| 5 | Extreme drought | SPEI≤-2.0 |
Disclaimer/Publisher’s Note: The statements, opinions and data contained in all publications are solely those of the individual author(s) and contributor(s) and not of MDPI and/or the editor(s). MDPI and/or the editor(s) disclaim responsibility for any injury to people or property resulting from any ideas, methods, instructions or products referred to in the content. |
© 2024 by the authors. Licensee MDPI, Basel, Switzerland. This article is an open access article distributed under the terms and conditions of the Creative Commons Attribution (CC BY) license (https://creativecommons.org/licenses/by/4.0/).
Copyright: This open access article is published under a Creative Commons CC BY 4.0 license, which permit the free download, distribution, and reuse, provided that the author and preprint are cited in any reuse.


