
Submitted:
01 November 2024
Posted:
01 November 2024
You are already at the latest version
Abstract
The roles of man-made weirs were well-known as flooding control in summer monsoon, but the function of wintering habitat for wintering water birds were not revealed. This study examined the effects of man-made weirs on the wintering distribution of water birds in Tancheon Stream, Korea, with a focus on the effects of freeze-thaw process. Data collected during January to February 2003 included thawed water surface ratios, water depths, sandbar areas, and bird distribution under different weather conditions. The analysis revealed a strong positive correlation between thawed surface areas in front of weir’s drop structures and the abundance of dabbling and diving water birds during severe cold conditions with temperatures below - 9°C. However, it was also observed that the stagnant water impounded by the weirs tended to freeze easily in winter, making it difficult for water birds to inhabit those areas. These results suggest an adaptation process against man-made weirs by wintering water birds in urban streams, provide significant insights for improving the function of weirs to enhance water birds’ habitats, especially in urban stream management.
Keywords:
freeze-thaw pattern
; weir impact
; water bird distribution
; urban streams
1. Introduction
In a city of all over the worlds, many urban streams have been modified with impervious surfaces and channelized through the construction of embankments, concrete or rubber weirs, and drop structures. These structures aim to reduce flooding hazards and control water flow [1,2,3,4]. However, these changes are known to negatively impact water birds, primarily due to the reduction of natural habitats such as sandbars and the decline in fish diversity, which serves as prey for the birds [5,6,7]. Notably, man-made weirs may cause water surfaces to freeze during severe winter weather, reducing the available habitat for water birds.
Every winter, over 900,000 water birds migrate from the Northern Hemisphere to South Korea, with about 40,000 overwintering in the Hangang River watershed, which flows through Seoul, the capital of South Korea [8,9]. During severe winter weather, water surfaces in this watershed frequently freeze, causing birds to relocate to non-frozen areas [10,11]. Tributaries of the Hangang River are particularly susceptible to freezing due to reduced water flow, impervious surfaces, and channelization [12]. Weirs in urban streams can exacerbate freezing by creating conditions similar to reservoir dams, leading to stagnant water that freezes easily. Thus, the freeze-thaw dynamics created by weirs could significantly affect the distribution of water birds in urban streams during winter.
To ensure the stable wintering of water birds, it is essential to investigate the impacts of weirs on their distribution in relation to freeze-thaw dynamics. This study aimed to assess the effects of weirs on the distribution of water birds in Tancheon Stream, South Korea. Specifically, we examined correlations between the spatial distribution of water birds and environmental factors, such as thawed water surface areas, sandbars, and water depths.
2. Materials and Methods
We conducted the study in Tancheon Stream, which flows through Seongnam City, Korea (Figure 1).
The base channel of the stream was concrete-lined, and 17 weirs were distributed along its length. The middle reach of the stream, which spanned approximately 8.4 km with a channel width of about 50 m, was the focus of this study. This section contained 13 weirs, each measuring approximately 50 m in length and 1-4 m in height. The surrounding land use was primarily urban. The study reach was divided into 76 units, each approximately 100 meters apart, covering the distance between weirs (Figure 2). Of these, only 52 units were included in the analysis, excluding 24 units that containing bridges. The 52 units were categorized based on their distance from the weirs as follows: 0-100 m (11 units), 100-200 m (6 units), 200-300 m (10 units), 300-400 m (4 units), 400-500 m (10 units), 500-600 m (6 units), and 600-700 m (5 units).
Migratory birds typically arrive in Korea from late October and settle into wintering areas by late December. To analyze the impact of the freeze-thaw phenomenon on water bird distributions, we conducted our survey during the stable wintering season from January to February 2003. The survey days (January 5, 6, 12, 24, 27, 29, and February 13, 18, 20) were categorized based on weather severity: severe cold days (mean thawed water surface ratio < 20%, mean air temperature < -9°C), cold days (thawed ratio 50-70%, air temperature -2 to 4°C), and warm days (thawed ratio > 90%, air temperature 0-5°C) (Figure 3). Air temperature data were obtained from the Korea Meteorological Administration [13].
For water depths, measurements were taken under the assumption that depths remained constant, given the low precipitation during the survey period (32.5 mm of the annual total yearly precipitation of 2,012 mm [13]. In each unit (approximately 100 m), four transect lines were established at 20-meter intervals across the stream. Each transect had five measurement points (5, 10, 20, 30, and 40 meters from the right bank to the left). The area of sandbars was assumed to remain constant in the same way as water depth. Using a 1:1500 digital topographic map provided by Seongnam City [14], the area for each unit was calculated with AutoCAD. To estimate the thawed water surface areas, the thawed regions were sketched onto the survey map at a scale of 1:1500 during each survey day. Next, the map was overlaid with a translucent acetate grid divided into squares of 0.25 cm2 each. We then counted the number of grid squares (interstices) that fell completely within the thawed area, assigning a value of 1 to each. Interstices that landed precisely on the boundary of the thawed area were given a value of 0.5 per unit. The total count was multiplied by 56.25 m2, to calculate the thawed water surface area in square meters. Finally, the thawed ratio (%) was calculated by comparing the thawed area to the total area of each unit.
We recorded water bird numbers in the stream channel during the first two hours after sunrise on the survey days. Binoculars (8 x 30 magnification) were used to identify birds, referencing a field guide [15]. Our study concentrated on the most common species, including dabbling ducks such as Spot-billed Duck (Anas poecilorhyncha), Common Teal (Anas crecca), Mallard (Anas platyrhynchos), and Pintail (Anas acuta), as well as diving water birds like the Little Grebe (Tachybaptus ruficollis), Common Merganser (Mergus merganser), and Pochard (Aythya ferina) (Table 1).
The measured values were represented in the graph as means and standard error (standard deviation/√n). To examine the effects of weirs on the distribution of water birds in relation to the freeze-thaw phenomenon, we analyzed the statistical correlations between water bird distributions and environmental variables.
3. Results
3.1. Distribution of Environmental Variables
The mean water depths (ranging from 21 to 69 cm) increased gradually with distance from the weirs (Figure 4(a), Table S1), showing a statistically significant correlation with the distance (r = 0.61, p < 0.01, Figure 6). In contrast, the mean areas of sandbars were primarily concentrated in the 0–300 m and 400–500 m sections, while the 300–400 m and 500–700 m sections showed relatively smaller sandbar areas (Figure 4(b)). The correlation with the distance was statistically significant (r = - 0.61, p < 0.01, Figure 6).
During the severe cold weather conditions, with a mean thawed ratio of less than 20% and mean air temperatures below -9°C, the highest mean thawed ratios were observed at the front of the weirs (0-100 m), ranging from 36 to 39% (Figure 5(a1 ~ a3), Table S2). In the subsequent sections (100–200 m, 200–300 m), thawed ratios decreased to 20–23% and 13–18%, respectively. Other sections (300-700 m) exhibited lower thawed ratios of less than 8%. The correlation with distance was statistically significant (r = - 0.90, p < 0.001, Figure 6). Under the cold weather conditions (mean thawed ratios: 50–70%, mean air temperatures: -2 to 4°C), the front section of the weirs (0-100 m) exhibited higher thawed ratios (73-93%) compared to the severe cold conditions (Figure 5(b1 ~ b3)). The mean thawed ratios gradually decreased with distance from the weirs, and the correlation with distance remained statistically significant (r = - 0.85, p < 0.001, Figure 6). However, during the warmer conditions (mean thawed ratios: > 90%, mean air temperatures: 0 to 5°C), all sections displayed higher thawed ratios (74-100%) compared to the cold conditions (Figure 5(c1 ~ c3)). But the correlation with distance was not statistically significant (r = - 0.37).
Water depth showed a statistically significant negative correlation with the thawed ratio (r = - 0.75, p < 0.001, Figure 6) during the severe cold weather conditions. During cold weather conditions, the correlation coefficient slightly decreased to r = - 0.67 (p < 0.001, Figure 6). During the warm weather period when most survey units were thawed, the relationship between water depth and thawed ratio was not statistically significant (r = - 0.38, Figure 6). The area of sandbars showed a statistically significant positive correlation with the thawed ratio (r = 0.70, p < 0.001, Figure 6) during the severe cold conditions. Under the cold conditions, the correlation coefficient decreased to r = 0.60 (p < 0.01, Figure 6). During the warm conditions, when the average thawed ratios across all sections exceeded about 74%, the correlation between sandbar area and thawed ratio was not statistically significant (r = 0.013, Figure 6).
3.2. Distribution of Water Birds
During the severe cold weather conditions (mean thawed ratio: < 20%, mean air temperature: < - 9°C), dabbling ducks and diving water birds were densely distributed within sections close to the weirs (0–300 m) (Figure 7(a1 ~ a3), Figure 8(a1 ~ a3), Table S3, S4). As the weather transitioned to the cold conditions (mean thawed ratio: 50–70%, mean air temperature: - 2 to 4°C), the birds spread out over a wider area (dabbling ducks: up to 600 m, diving water birds: up to 500 m) (Figure 7(b1 ~ b3), Figure 8(b1 ~ b3)). Under the warmer conditions (mean thawed ratio: > 90%, mean air temperature: 0 to 5°C), dabbling ducks tended to spread up to 700 m from the weirs (Figure 7(c1 ~ c3)). Notably, diving water birds were not observed in the sections near the weirs (0–100 m) during warmer days, likely due to the shallow water depth in these areas (Figure 8(c1 ~ c3)).
To further examine the relationships between the abundance of water birds and environmental variables, we calculated correlation coefficients (Table 2).
During the severe cold weather, the abundance of both dabbling ducks and diving water birds showed strong positive correlations with the thawed water surface ratios (dabbling ducks: r = 0.85, p < 0.01; diving water birds: r = 0.87, p < 0.01). However, as the weather warmed, these correlations gradually weakened (cold days: dabbling ducks (r = 0.68, p < 0.01), diving water birds (r = 0.60, p < 0.01); warm days: dabbling ducks (r = 0.29, ns), diving water birds (r = -0.27, ns). The abundance of dabbling ducks was also positively and significantly correlated with the area of sandbars across all periods (severe cold days: r = 0.58, p < 0.01; cold days: r = 0.62, p < 0.01; warm days: r = 0.44, p < 0.05). In contrast, the abundance of diving water birds showed a significant positive correlation with sandbar areas only during the severe cold days (r = 0.64, p < 0.01). Water depth had a negative and significant correlation with the abundance of dabbling ducks during all periods (severe cold days: r = - 0.59, p < 0.01; cold days: r = - 0.55, p < 0.01; warm days: r = - 0.55, p < 0.05). For diving water birds, a significant negative correlation with water depth was observed only during the severe cold days (r = -0.65, p < 0.01).
Assuming that the warm period, when most of the water surface was thawed, had minimal influence on bird distribution due to ice formation, dabbling ducks of this study were primarily found in areas with abundant sandbars and shallow water. In contrast, diving ducks showed little correlation with sandbar area or water depth. As temperatures dropped and the frozen surface area increased, the distribution patterns of water birds changed. Dabbling ducks became more concentrated near the weirs, where water remained thawed, typically characterized by shallow depths and extensive sandbars. During the severe cold period, despite the shallow water, diving ducks were also compelled to concentrate near the weirs, likely due to the availability of thawed water.
4. Discussion
The results of this study highlight the significant role of weirs in shaping the winter distribution of water birds in urban streams, specifically in the Tancheon Stream. Our observations underline that freeze-thaw dynamics created by the presence of weirs influence habitat availability for water birds, with a particularly strong impact during severe winter weather conditions.
The presence of weirs appears to provide a refuge for water birds during severe cold weather, as thawed water surface areas were predominantly found in front of weir’s drop structures even in temperatures below - 9°C. These thawed areas likely offer critical feeding grounds when other sections of the stream are frozen. Our correlation analysis supports this, showing a strong positive association between thawed water surface ratios and water bird abundance, particularly for dabbling ducks and diving water birds during severe cold conditions. In these areas, water birds are presumed to engage mainly in resting and feeding behaviors. Lee [11] analyzed the diurnal behaviors of wintering ducks in Tancheon Stream during the winters of 1999 to 2000. The study categorized behaviors into feeding, resting and sleeping, movement, alertness, and etc. The results indicated that Spot-billed Ducks (Anas poecilorhyncha) predominantly exhibited resting (50.05%) and feeding (13.65%) behaviors. Common Teal (Anas crecca) showed a dominance of resting (42.37%) and feeding (41.65%), while Mallards (Anas platyrhynchos) were mainly involved in resting (36.30%) and movement (21.92%), with resting behavior being a common dominant activity among the three species.
The presence of abundant sandbars in the shallow areas near the weirs likely influenced the distribution of dabbling ducks, alongside the thawed water surfaces. The formation of weirs, as artificial structures, can impact water depth and river flow, thereby affecting sandbar formation [16,17], which in turn can influence the distribution of water birds [18,19]. However, the areas where water is impounded by the weir tend to have deeper depths and stagnant conditions, which make them more susceptible to freezing. This compels waterbirds to gather in the confined thawed areas near the weir’s drop structure. As habitat space becomes limited, the risk of exposure to disturbances from humans and other sources may increase [20,21,22]. Lee [11] investigated disturbances impacting the feeding and resting behavior of water birds in Tancheon Stream. Human activity accounted for 86% of the disturbances, followed by terrestrial animals like dogs and cats (6.2%), aircraft (4.7%), and raptors (1.6%). Additionally, vehicle noise was suggested as a potential disturbance factor. These disturbances are likely to have a stronger impact on water birds concentrated in limited areas during periods of severe freezing.
The findings from our study suggest several implications for urban stream management and water bird conservation. To ensure stable wintering conditions for water birds, urban planners and conservationists should consider the role of weirs in maintaining thawed water surfaces in front of weir drop structures during winter. However, it is equally important to mitigate the negative impacts of weirs, such as the potential for excessive freezing in stagnant waters. Management strategies could include partial removal or modification of weirs to promote flow variability, creating more dynamic and ecologically diverse habitats [23,24].
5. Conclusions
This study examined the impact of weirs, a characteristic feature of urban streams in South Korea, on winter freeze-thaw dynamics and the distribution of water birds. It highlighted both the positive and negative effects of water bird distribution associated with weir structures and emphasized the need for improvements in the design and management of weirs. Future studies should consider a broader range of environmental factors, such human disturbances, to gain a more comprehensive understanding of how urbanization influences water bird ecology. Additionally, monitoring over multiple winter seasons would help capture year-to-year variability and refine conservation recommendations for managing urban water bodies effectively.
Supplementary Materials
Table S1: Water depths and sandbar areas in relation to distance from weirs in Tancheon, 2003; Table S2: Thawed ratios (%) of the water surfaces in relation to distance from weirs in Tancheon, 2003; Table S3: Abundance of the dabbling ducks in relation to distance from weirs in Tancheon, 2003; Table S4: Abundance of the diving water birds in relation to distance from weirs in Tancheon, 2003.
Author Contributions
Conceptualization, Jangho Lee and Chan-Ryul Park; methodology, Jangho Lee and Chan-Ryul Park; software, Jangho Lee; validation, Jangho Lee; formal analysis, Jangho Lee; investigation, Jangho Lee; resources, Jangho Lee; data curation, Jangho Lee and Chan-Ryul Park; writing—original draft preparation, Jangho Lee; writing—review and editing, Jangho Lee and Chan-Ryul Park; visualization, Jangho Lee; supervision, Chan-Ryul Park; project administration, Chan-Ryul Park; funding acquisition, Chan-Ryul Park. All authors have read and agreed to the published version of the manuscript.
Funding
The author of Chan-Ryul Park was partially funded by National Institute of Forest Science, grant number FE0100-2020-01-2024.
Institutional Review Board Statement
Not applicable.
Informed Consent Statement
Not applicable.
Data Availability Statement
Suggested data is available.
Acknowledgments
We would like to thank Jeong Kwon Choi and his colleagues from Gachon University for providing research facilities.
Conflicts of Interest
The authors declare no conflicts of interest. The funders had no role in the design of the study; in the collection, analyses, or interpretation of data; in the writing of the manuscript; or in the decision to publish the results.
References
- Ministry of Environment; Korea Environment Corporation. Handbook for Ecological Stream Restoration; Ministry of Environment: Gwacheon, Gyeonggi-do, the Republic of Korea, 2011; p. 100. [Google Scholar]
- Kim, M.J. Suggestions for ecological stream restoration. J. Environ. Impact Assess. 2007, 16, 59–68. [Google Scholar]
- Kim, Y.H.; Park, N.H.; Jin, Y.H.; Kim, C. Development and application of evaluation technique for revetment for nature-friendly river improvement. J. Korea Water Resour. Assoc. 2007, 40, 1007–1014. [Google Scholar] [CrossRef]
- Lee, S.M.; Choi, Y.J.; Ji, J.W.; Lee, E.Y.; Yi, S.Y.; Yi, J.E. Flood vulnerability assessment of an urban area: A case study in Seoul, South Korea. Water 2023, 15, 1979. [Google Scholar] [CrossRef]
- Brookes, A.; Shields Jr, F.D. River Channel Restoration: Guiding Principles for Sustainable Projects, 1st ed.; Wiley & Sons: Chichester, UK. 1996; p. 458. [Google Scholar]
- Kim, J.J.; Atique, U.; An, K.G. Long-term ecological health assessment of a restored urban stream based on chemical water quality, physical habitat conditions and biological integrity. Water 2019, 11, 114. [Google Scholar] [CrossRef]
- Seongnam City. The 2nd Biotope Mapping Project; Seongnam City: Seongnam, Gyeonggi-do, the Republic of Korea, 2004; p. 283. [Google Scholar]
- Kim, H.J.; Kim, D.W.; Kwon, I.K.; Kim, J.H. 2014-2015 Winter Waterbird Census of Korea; National Institute of Biological Resources: Incheon, the Republic of Korea, 2015; Volume 241. [Google Scholar]
- Kim, H.J.; Kim, D.W.; Kang, S.G.; Oh, M.R.; Park, J.Y.; Kim, J.H. 2015-2016 Winter Waterbird Census of Korea; National Institute of Biological Resources: Incheon, the Republic of Korea, 2016; p. 249. [Google Scholar]
- Hong, S.H.; Yeum, J.H.; Han, B.H. Changes of physical structure of Hangang (Riv.) in Seoul City area. J. Wetlands Res. 2017, 19, 403–408. [Google Scholar] [CrossRef]
- Lee, S.W. Ecology and Management of Wintering Waterfowl on the Han River. Master Thesis, Kyung Hee University, Seoul, The Republic of Korea, August 2001. [Google Scholar]
- Oh, S.B.; Byun, H.R. Long-term variation of the freezing climate near the Han River and Seoul in Korea. J. Korean Earth Sci. Soc. 2011, 32, 761–769. [Google Scholar] [CrossRef]
- Daily Meteorological Summary. Available online: http://www.kma.go.kr (accessed on 2 May 2005).
- Seongnam City. Basic Survey and Pilot Section Design for Eco-Friendly Riverbed Maintenance of Tancheon; Seongnam City: Seongnam, Gyeonggi-do, the Republic of Korea, 2002; p. 135. [Google Scholar]
- Lee, W.S.; Koo, T.H.; Park, J.Y. A field guide to the birds of Korea; LG Foundation: Seoul, the Republic of Korea, 2000; p. 404. [Google Scholar]
- Kim, Y.H.; Cho, I.H.; Kim, H.K.; Hwang, E.A.; Han, B.H.; Kim, B.H. Assessing the impact of weirs on water quality and phytoplankton dynamics in the South Han River: A two-year study. Water 2024, 16, 833. [Google Scholar] [CrossRef]
- Kiraga, M.; Chyliński, F.; Fornal-Pieniak, B.; Ollik, M.; Staar, A. The water flow regime in the weir area for vascular and rush plant species composition. Water 2023, 15, 3189. [Google Scholar] [CrossRef]
- Tracy-Smith, E.; Galat, D.L.; Jacobson, R.B. Effects of flow dynamics on the aquatic-terrestrial transition zone (ATTZ) of lower Missouri river sandbars with implication for selected biota. River Res. Applic. 2012, 28, 793–813. [Google Scholar] [CrossRef]
- Boggie, M.A.; Collins, D.P.; Donnelly, J.P.; Carleton, S.A. Land Use, anthropogenic disturbance, and riverine features drive patterns of habitat selection by a wintering waterbird in a semi-arid environment. PLoS One 2018, 13, 0206222. [Google Scholar] [CrossRef] [PubMed]
- Taylor, D.P.; Dvorett, D.; Vradenburg, J.N.; Smith, L.M. Influence of environmental stress and anthropogenic disturbance on the energy expenditure of wintering northern pintails (Anas acuta). Waterbirds 2019, 42, 294. [Google Scholar] [CrossRef]
- Korschgen, C.E.; Dahlgren, R.B. Human Disturbances of Waterfowl: Causes, Effects, and Management. In Waterfowl Management Handbook, US Fish & Wildlife Service: Washington, D.C., USA, 1992; 13.2.15, pp. 8.
- Price, M. The Impact of Human Disturbance on Birds: a Selective Review. In Too Close for Comfort: Conflicts in Human Wildlife Encounters; Lunney, D., Munn, A., Meikle, W., Eds.; Royal Zoological Society of NSW: NEW South Wales, Australia, 2008; p. 32. [Google Scholar] [CrossRef]
- Elbourne, N.; Hammond, D.; Mant, J. Weir Removal, Lowering and Modification: A Review of Best Practice; Environment Agency: Bristol, UK, 2013; p. 74. [Google Scholar]
- Lu, Y.; Zhu, W.Y.; Liu, Q.Y.; Li, Y.; Tian, H.W.; Cheng, B.X.; Zhang, Z.Y.; Wu, Z.H.; Qing, J.; Sun, G.; et al. Impact of low-head dam removal on river morphology and habitat suitability in mountainous rivers. Int. J. Environ. Res. Public Health 2022, 19, 11743. [Google Scholar] [CrossRef] [PubMed]
Figure 1.
The location of study area at Tancheon Stream, Seongnam City, Korea.
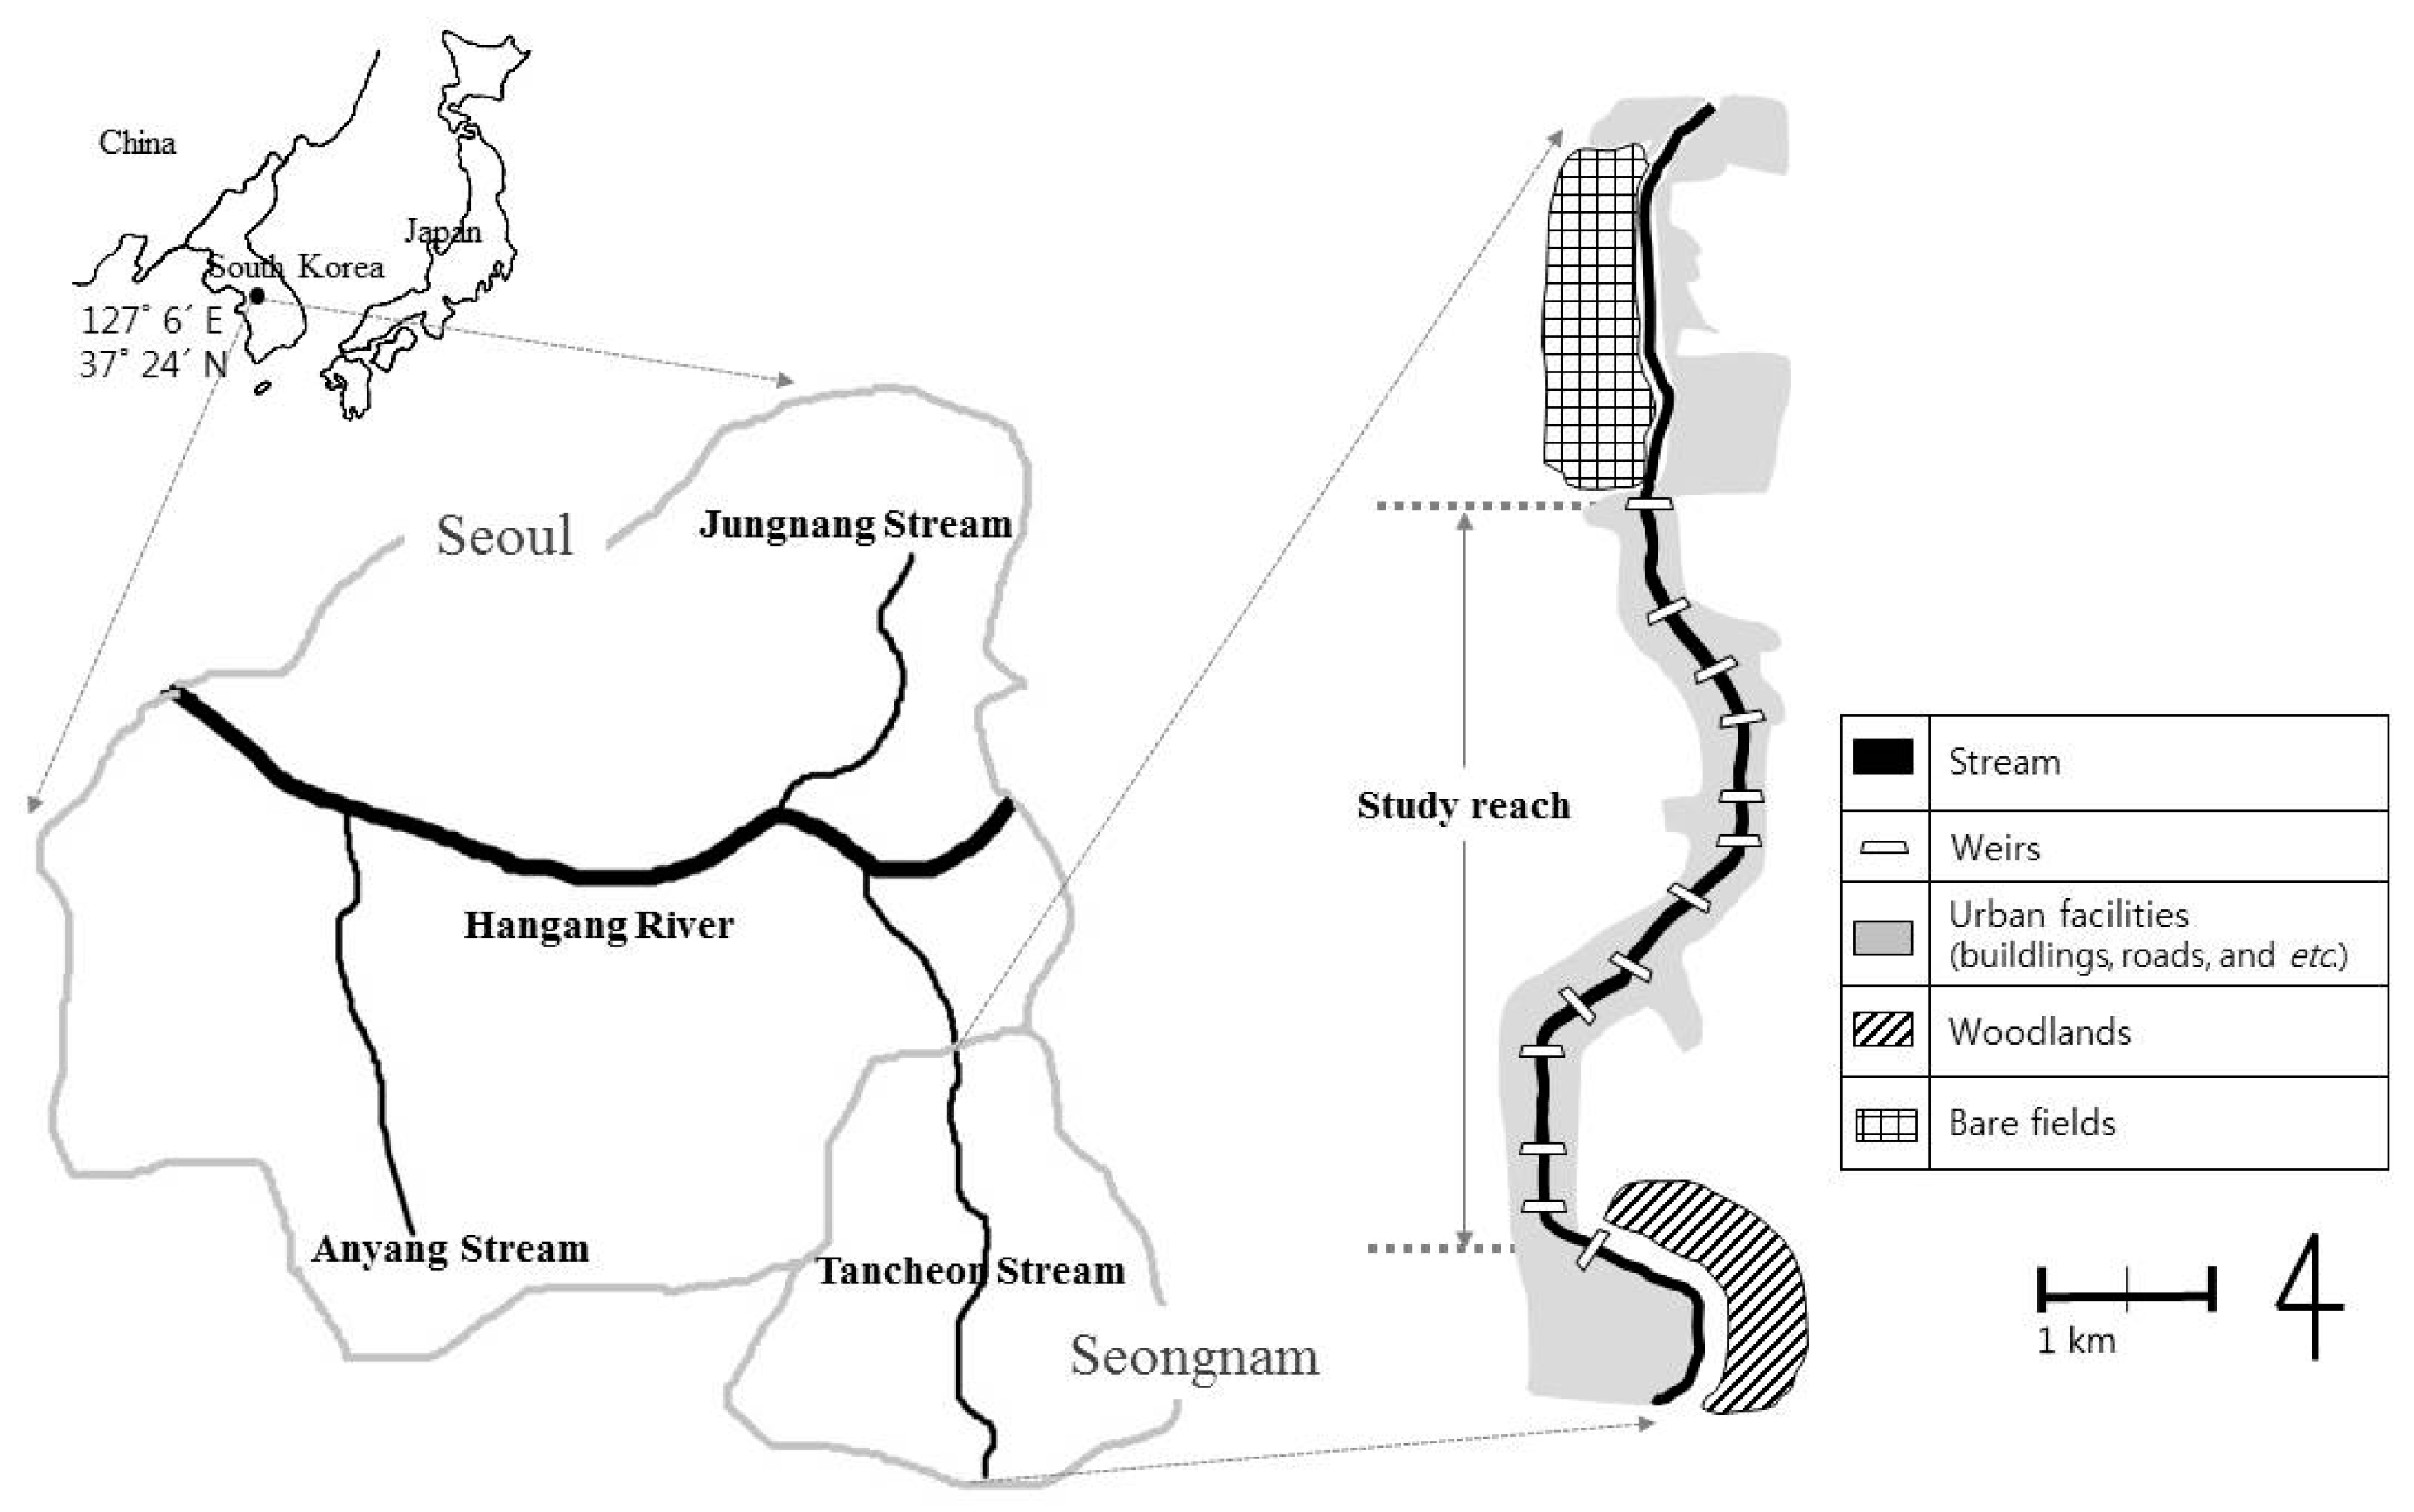
Figure 2.
Schematic explanation of survey sites in this study (U: unit; Fws: frozen area of water surface; Tws: thawed area of water surface).
Figure 2.
Schematic explanation of survey sites in this study (U: unit; Fws: frozen area of water surface; Tws: thawed area of water surface).
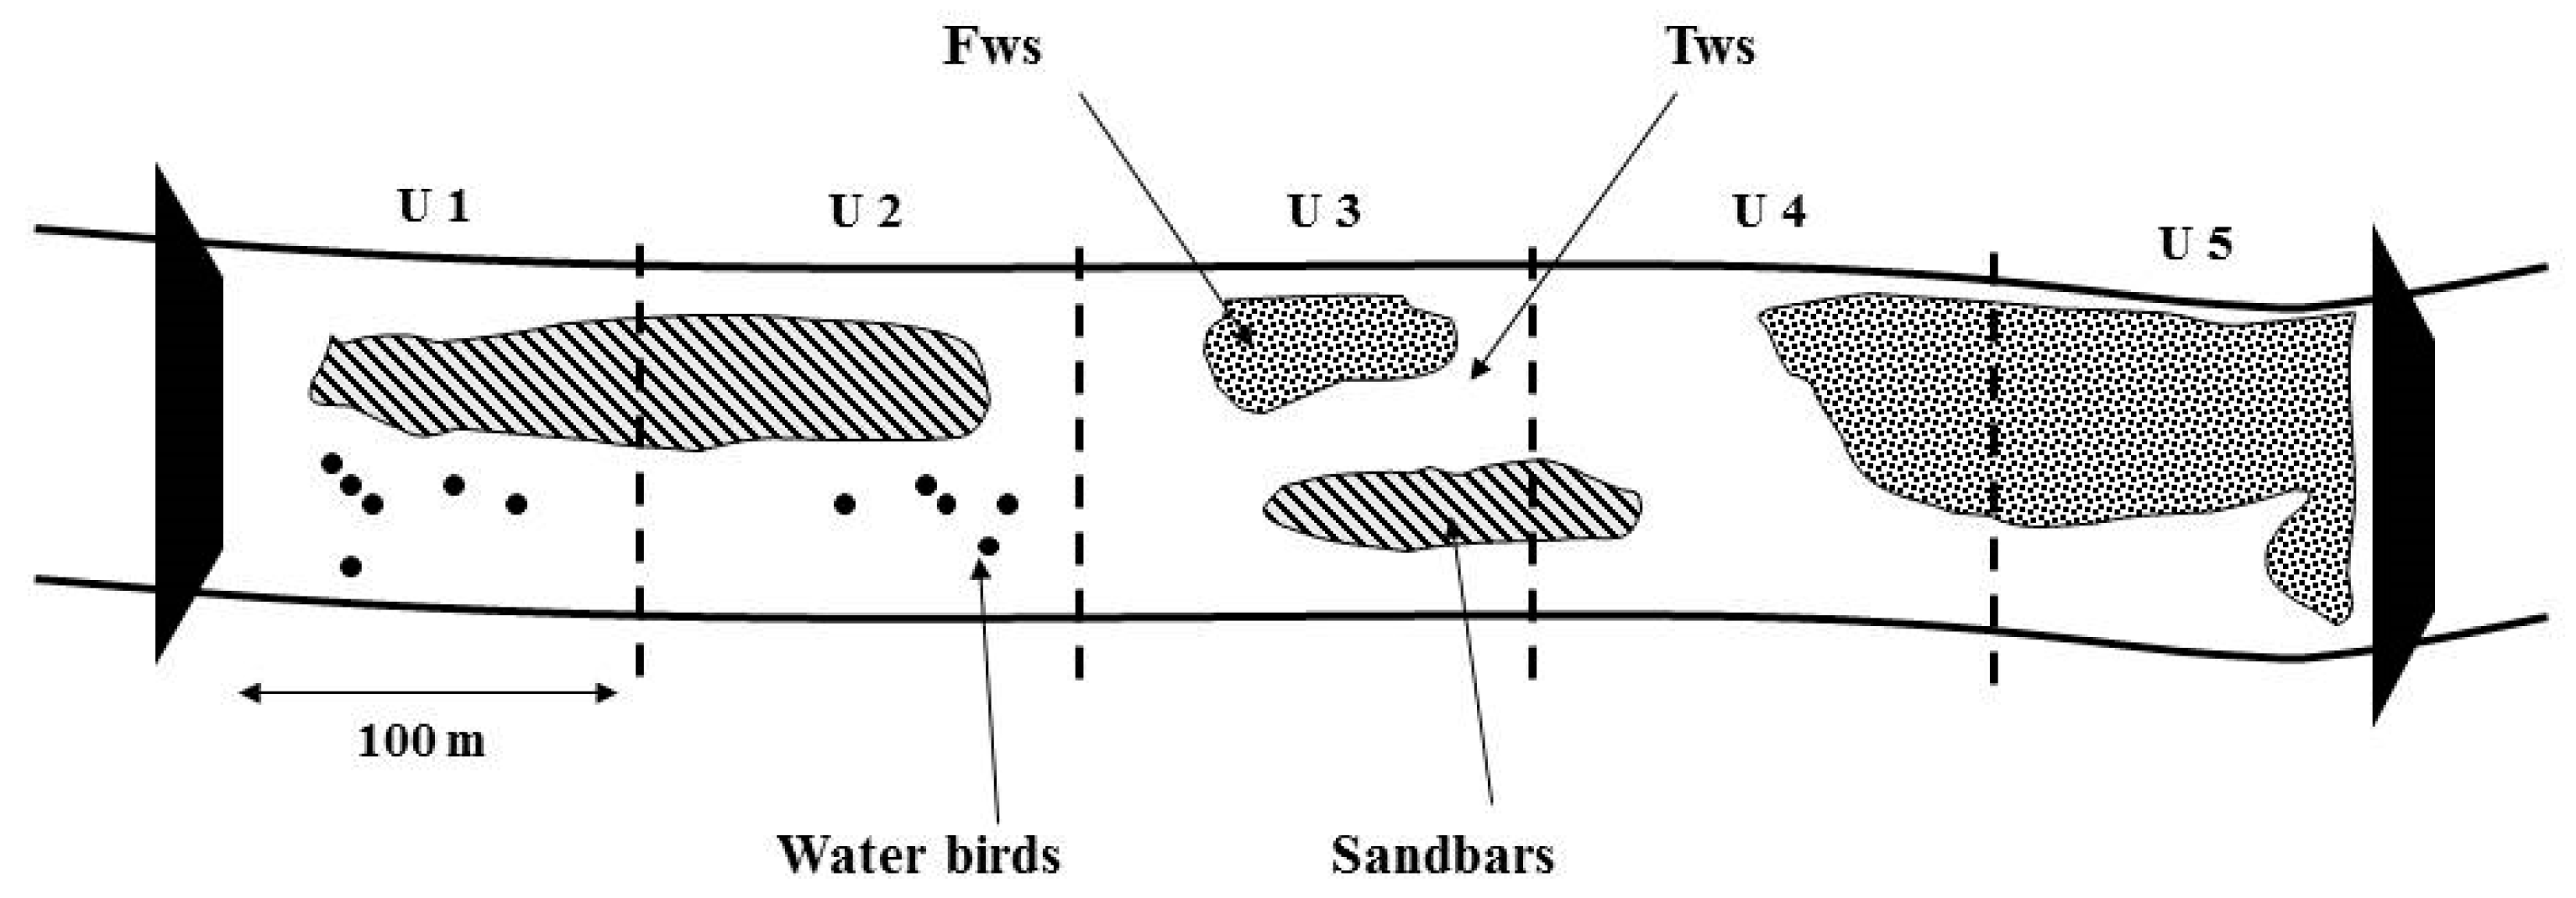
Figure 3.
The distributions of air temperatures and thawed water surface ratios in the study reach of Tancheon during the survey periods (January 5 – February 20, 2003).
Figure 3.
The distributions of air temperatures and thawed water surface ratios in the study reach of Tancheon during the survey periods (January 5 – February 20, 2003).
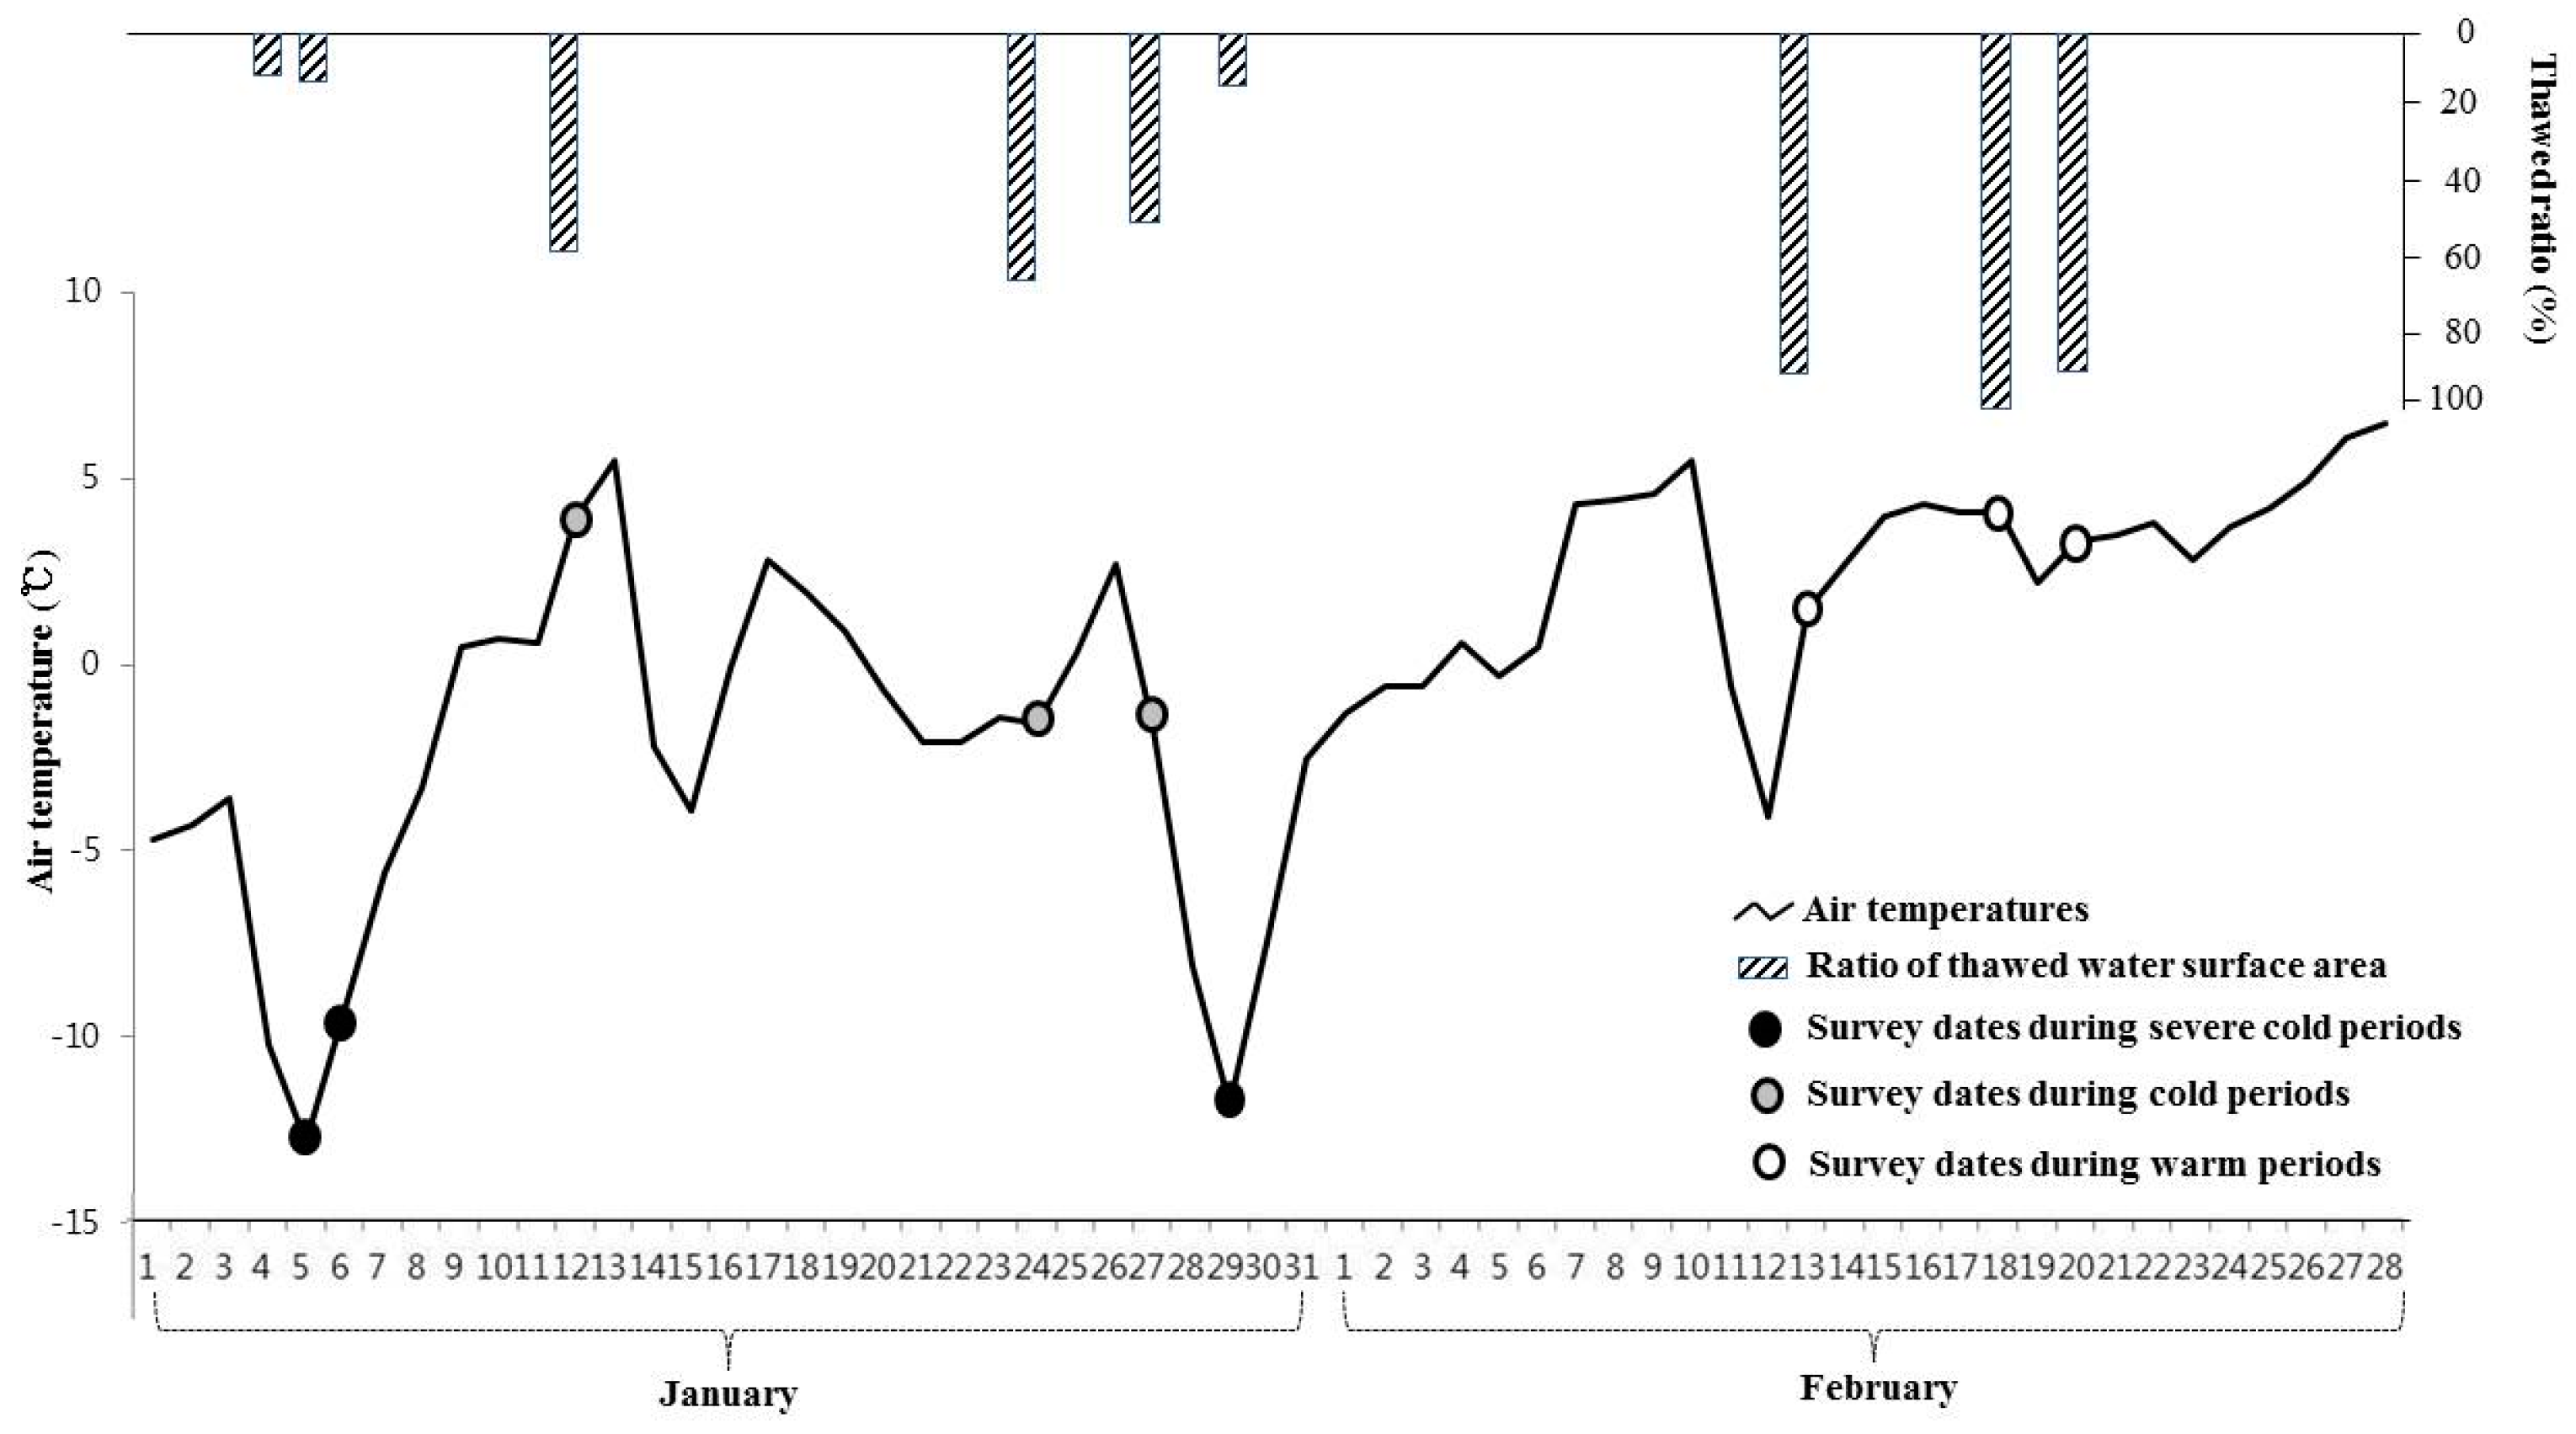
Figure 4.
Distributions of the water depths and the sandbar areas in relation to distance from weirs (mean ± S.E.) at each distance; 0-100 m (11 samples), 100-200 m (6 samples), 200-300 m (10 samples), 300-400 m (4 samples), 400-500 m (10 samples), 500-600 m (6 samples), and 600-700 m (5 samples).
Figure 4.
Distributions of the water depths and the sandbar areas in relation to distance from weirs (mean ± S.E.) at each distance; 0-100 m (11 samples), 100-200 m (6 samples), 200-300 m (10 samples), 300-400 m (4 samples), 400-500 m (10 samples), 500-600 m (6 samples), and 600-700 m (5 samples).
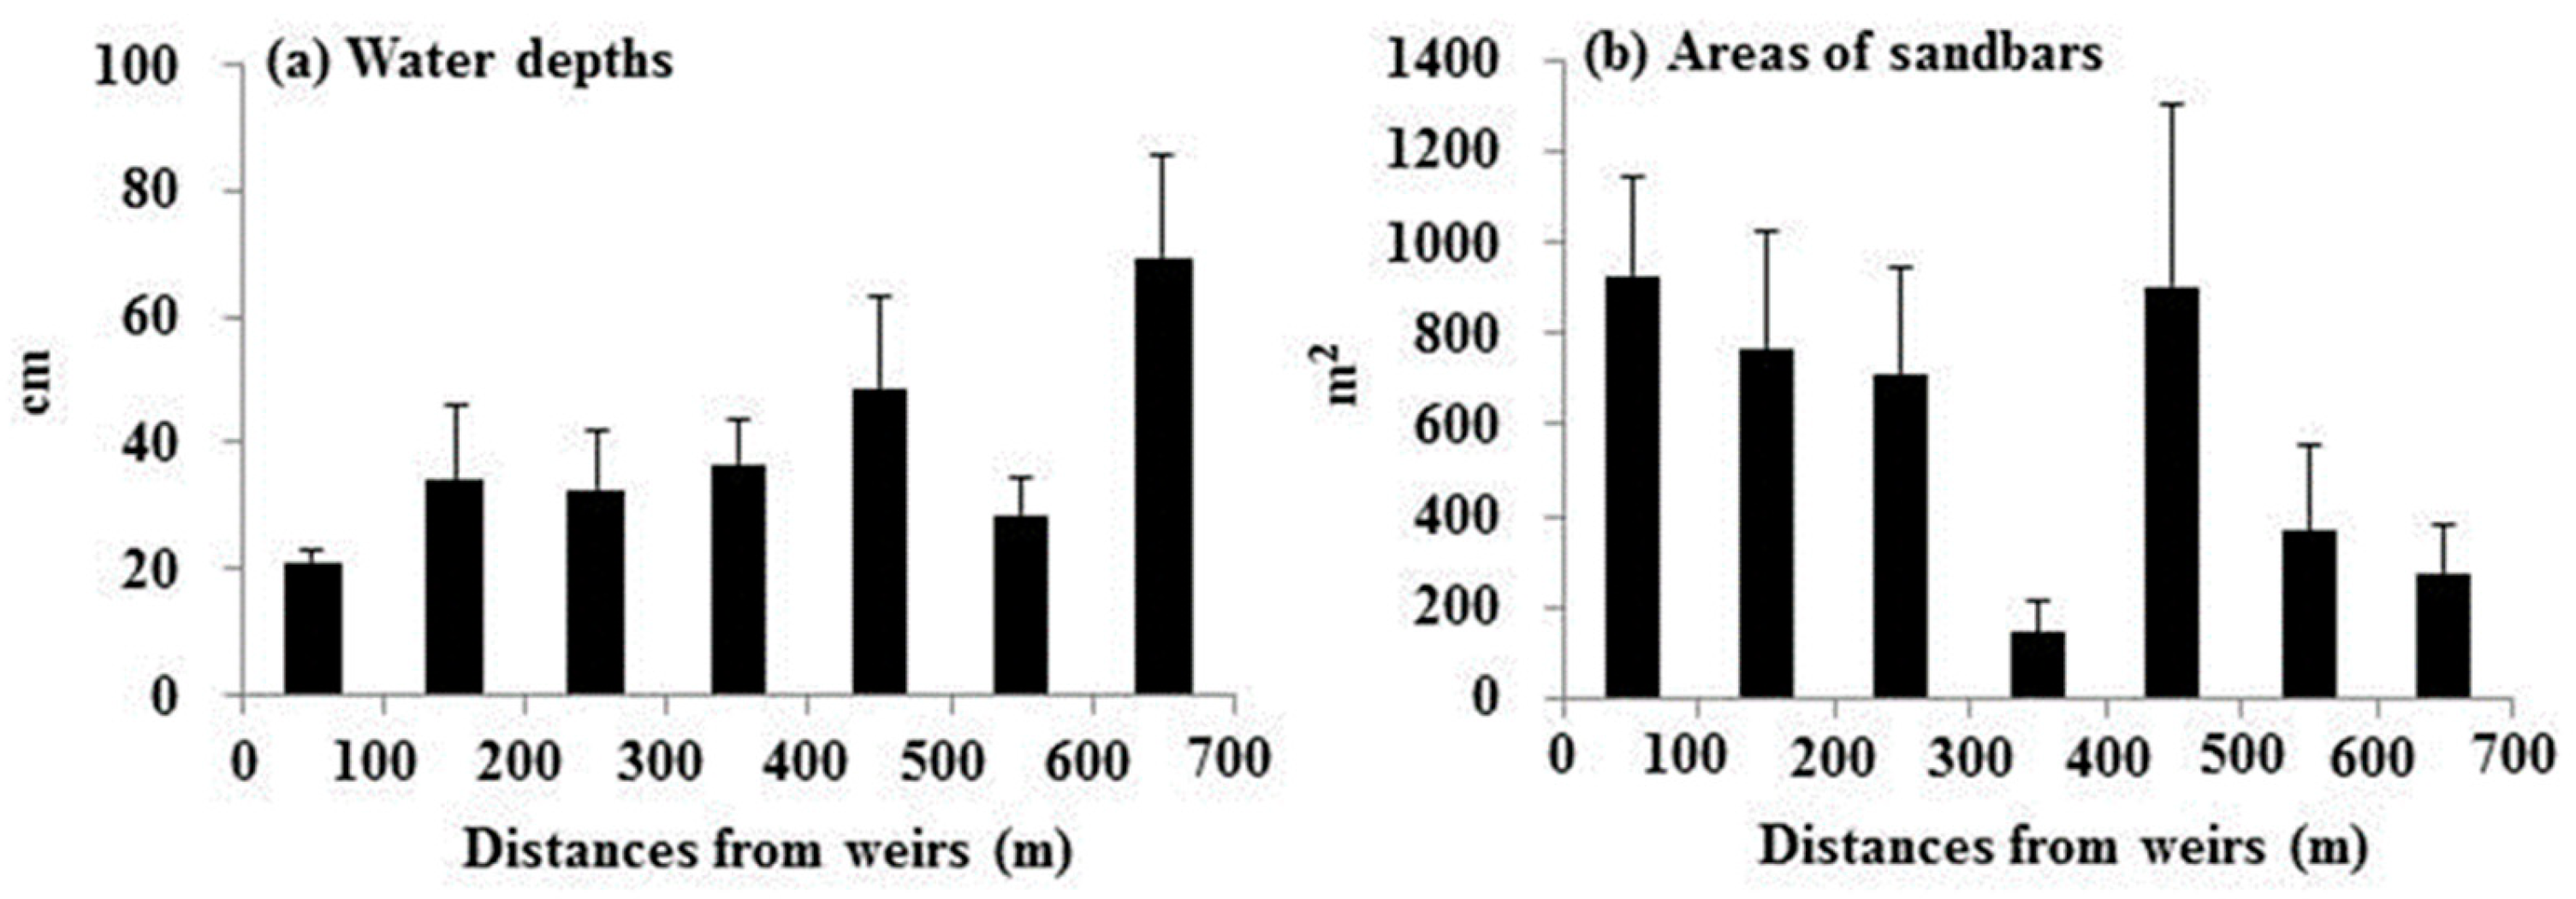
Figure 5.
Thawed ratios of the water surfaces in relation to distance from weirs (mean ± S.E.) at each distance; 0-100 m (11 samples), 100-200 m (6 samples), 200-300 m (10 samples), 300-400 m (4 samples), 400-500 m (10 samples), 500-600 m (6 samples), and 600-700 m (5 samples).
Figure 5.
Thawed ratios of the water surfaces in relation to distance from weirs (mean ± S.E.) at each distance; 0-100 m (11 samples), 100-200 m (6 samples), 200-300 m (10 samples), 300-400 m (4 samples), 400-500 m (10 samples), 500-600 m (6 samples), and 600-700 m (5 samples).
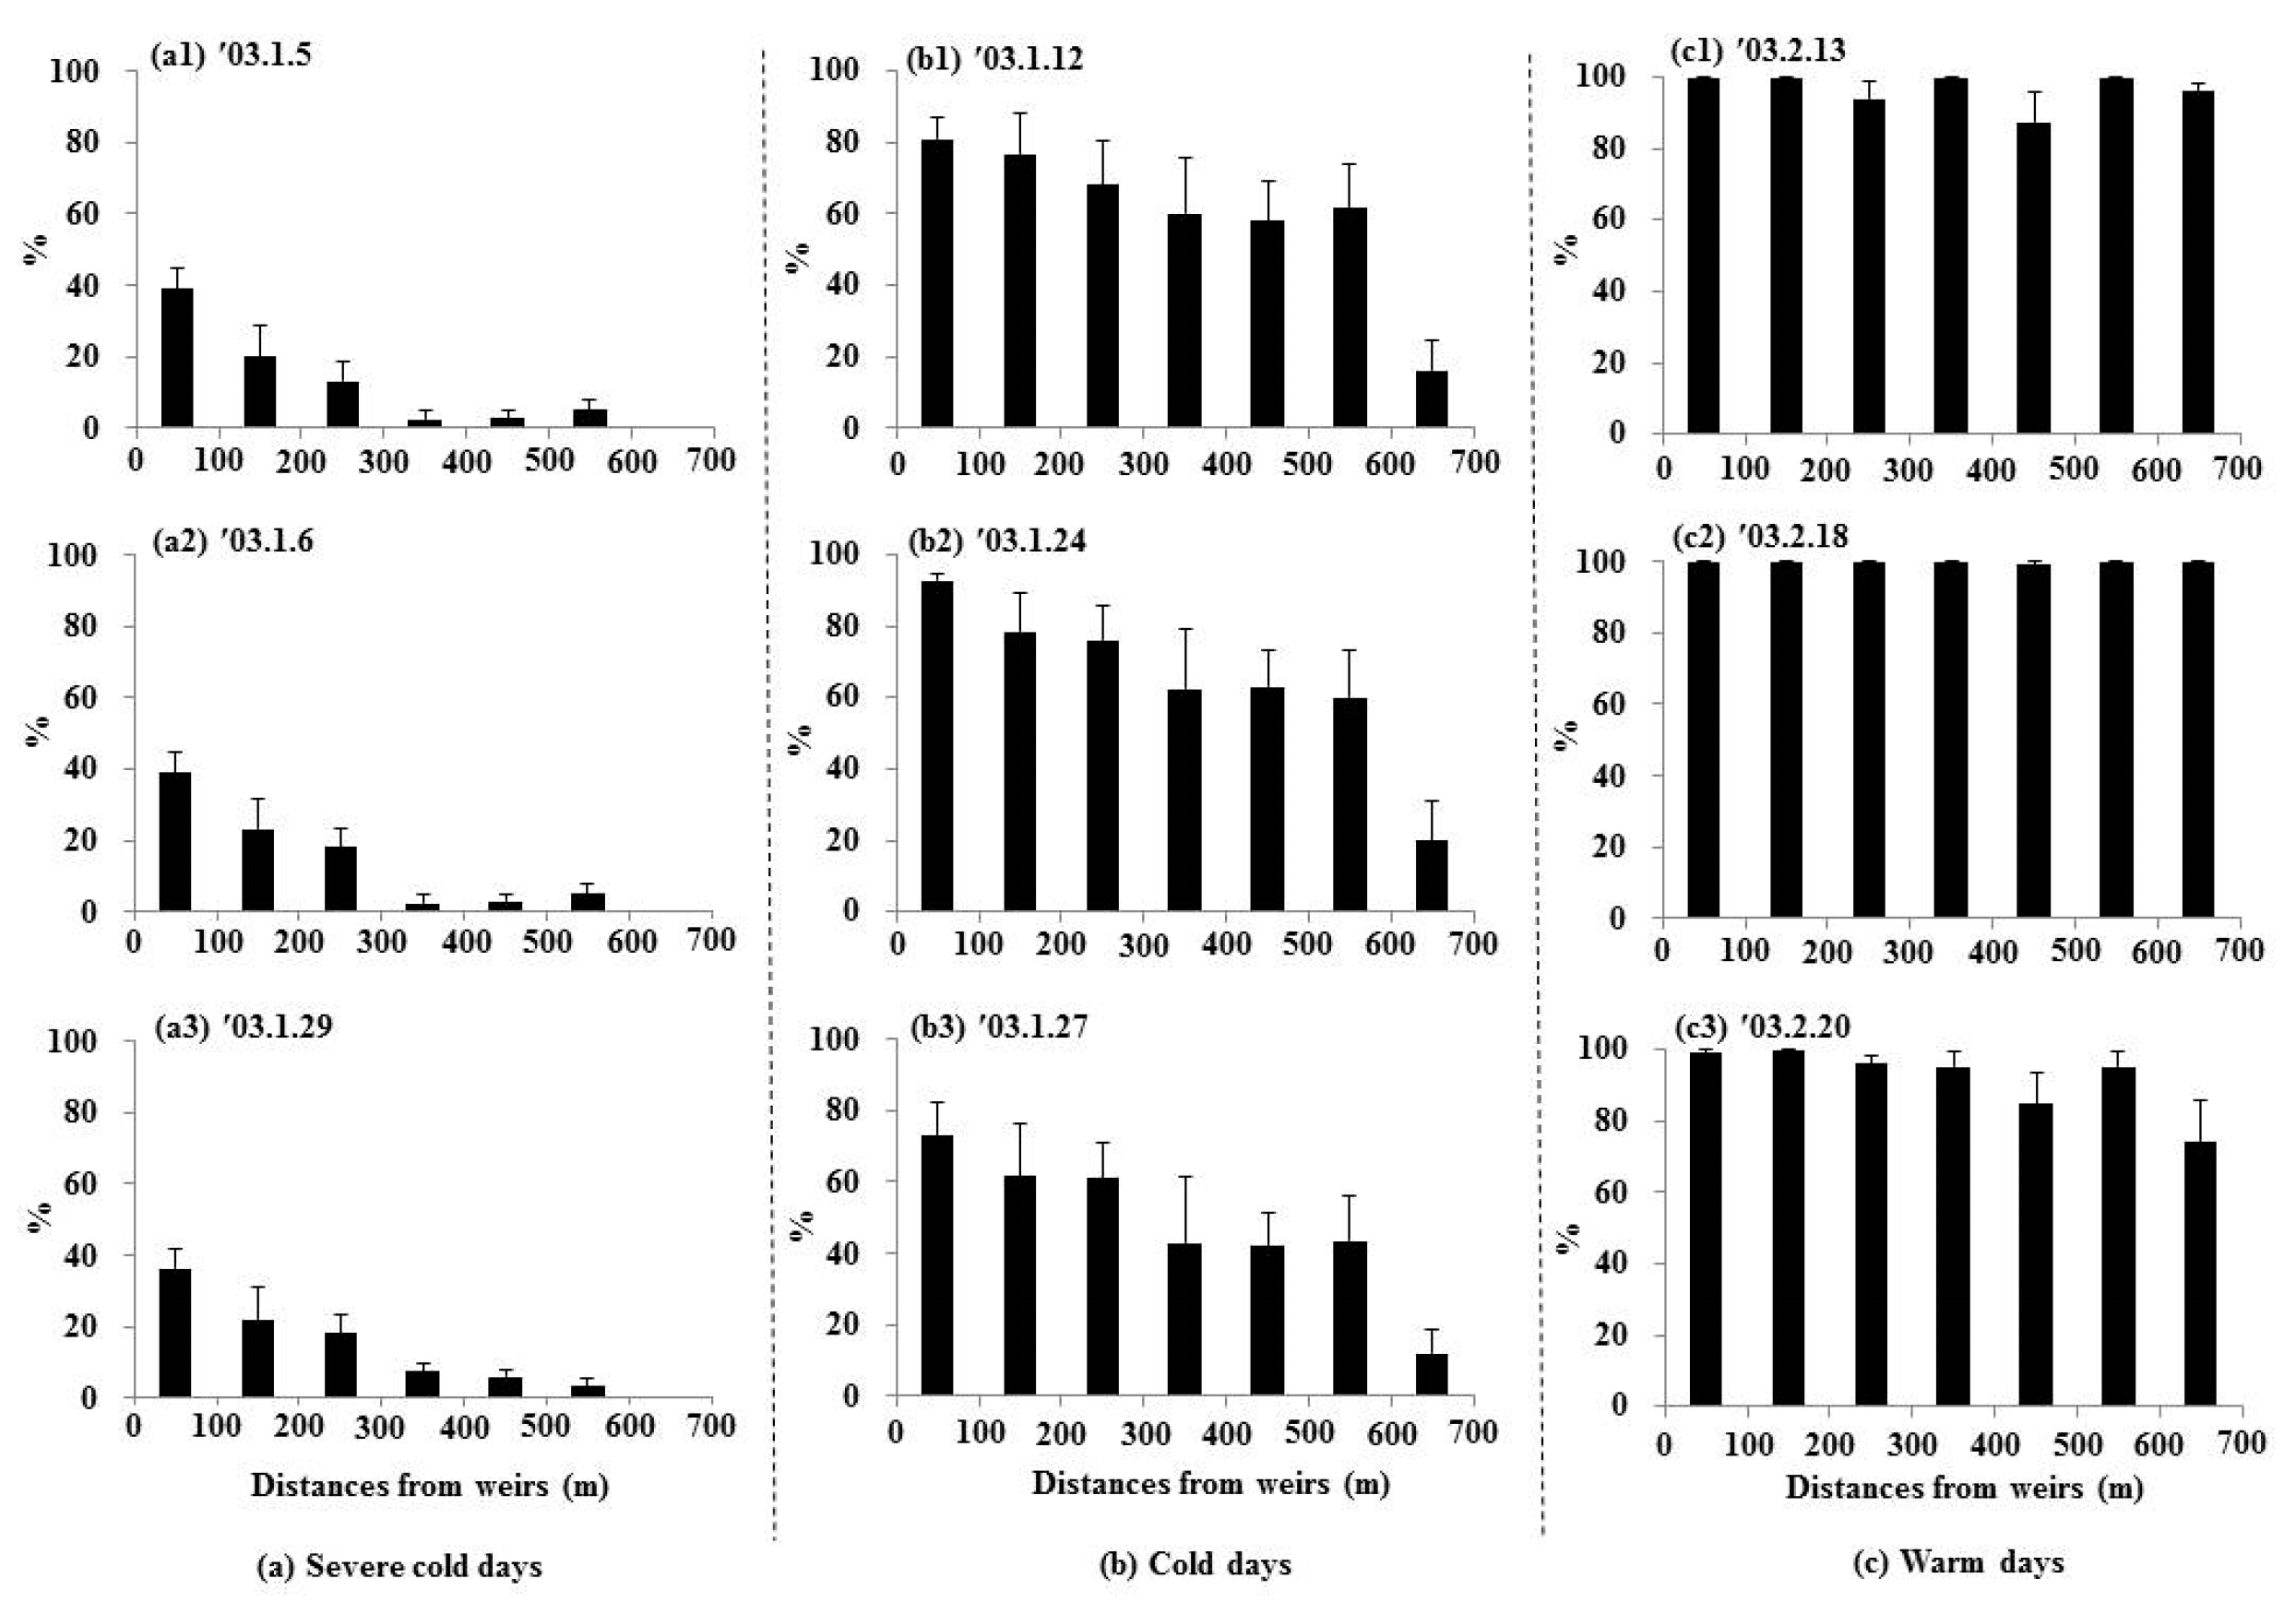
Figure 6.
Correlations among the environmental variables, black dots represent values of environmental variables within each distance section; no. of samples: each n = 7 (areas of sandbars and water depth), each n = 21 (thawed ratios in severe cold days, cold days, and warm days).
Figure 6.
Correlations among the environmental variables, black dots represent values of environmental variables within each distance section; no. of samples: each n = 7 (areas of sandbars and water depth), each n = 21 (thawed ratios in severe cold days, cold days, and warm days).
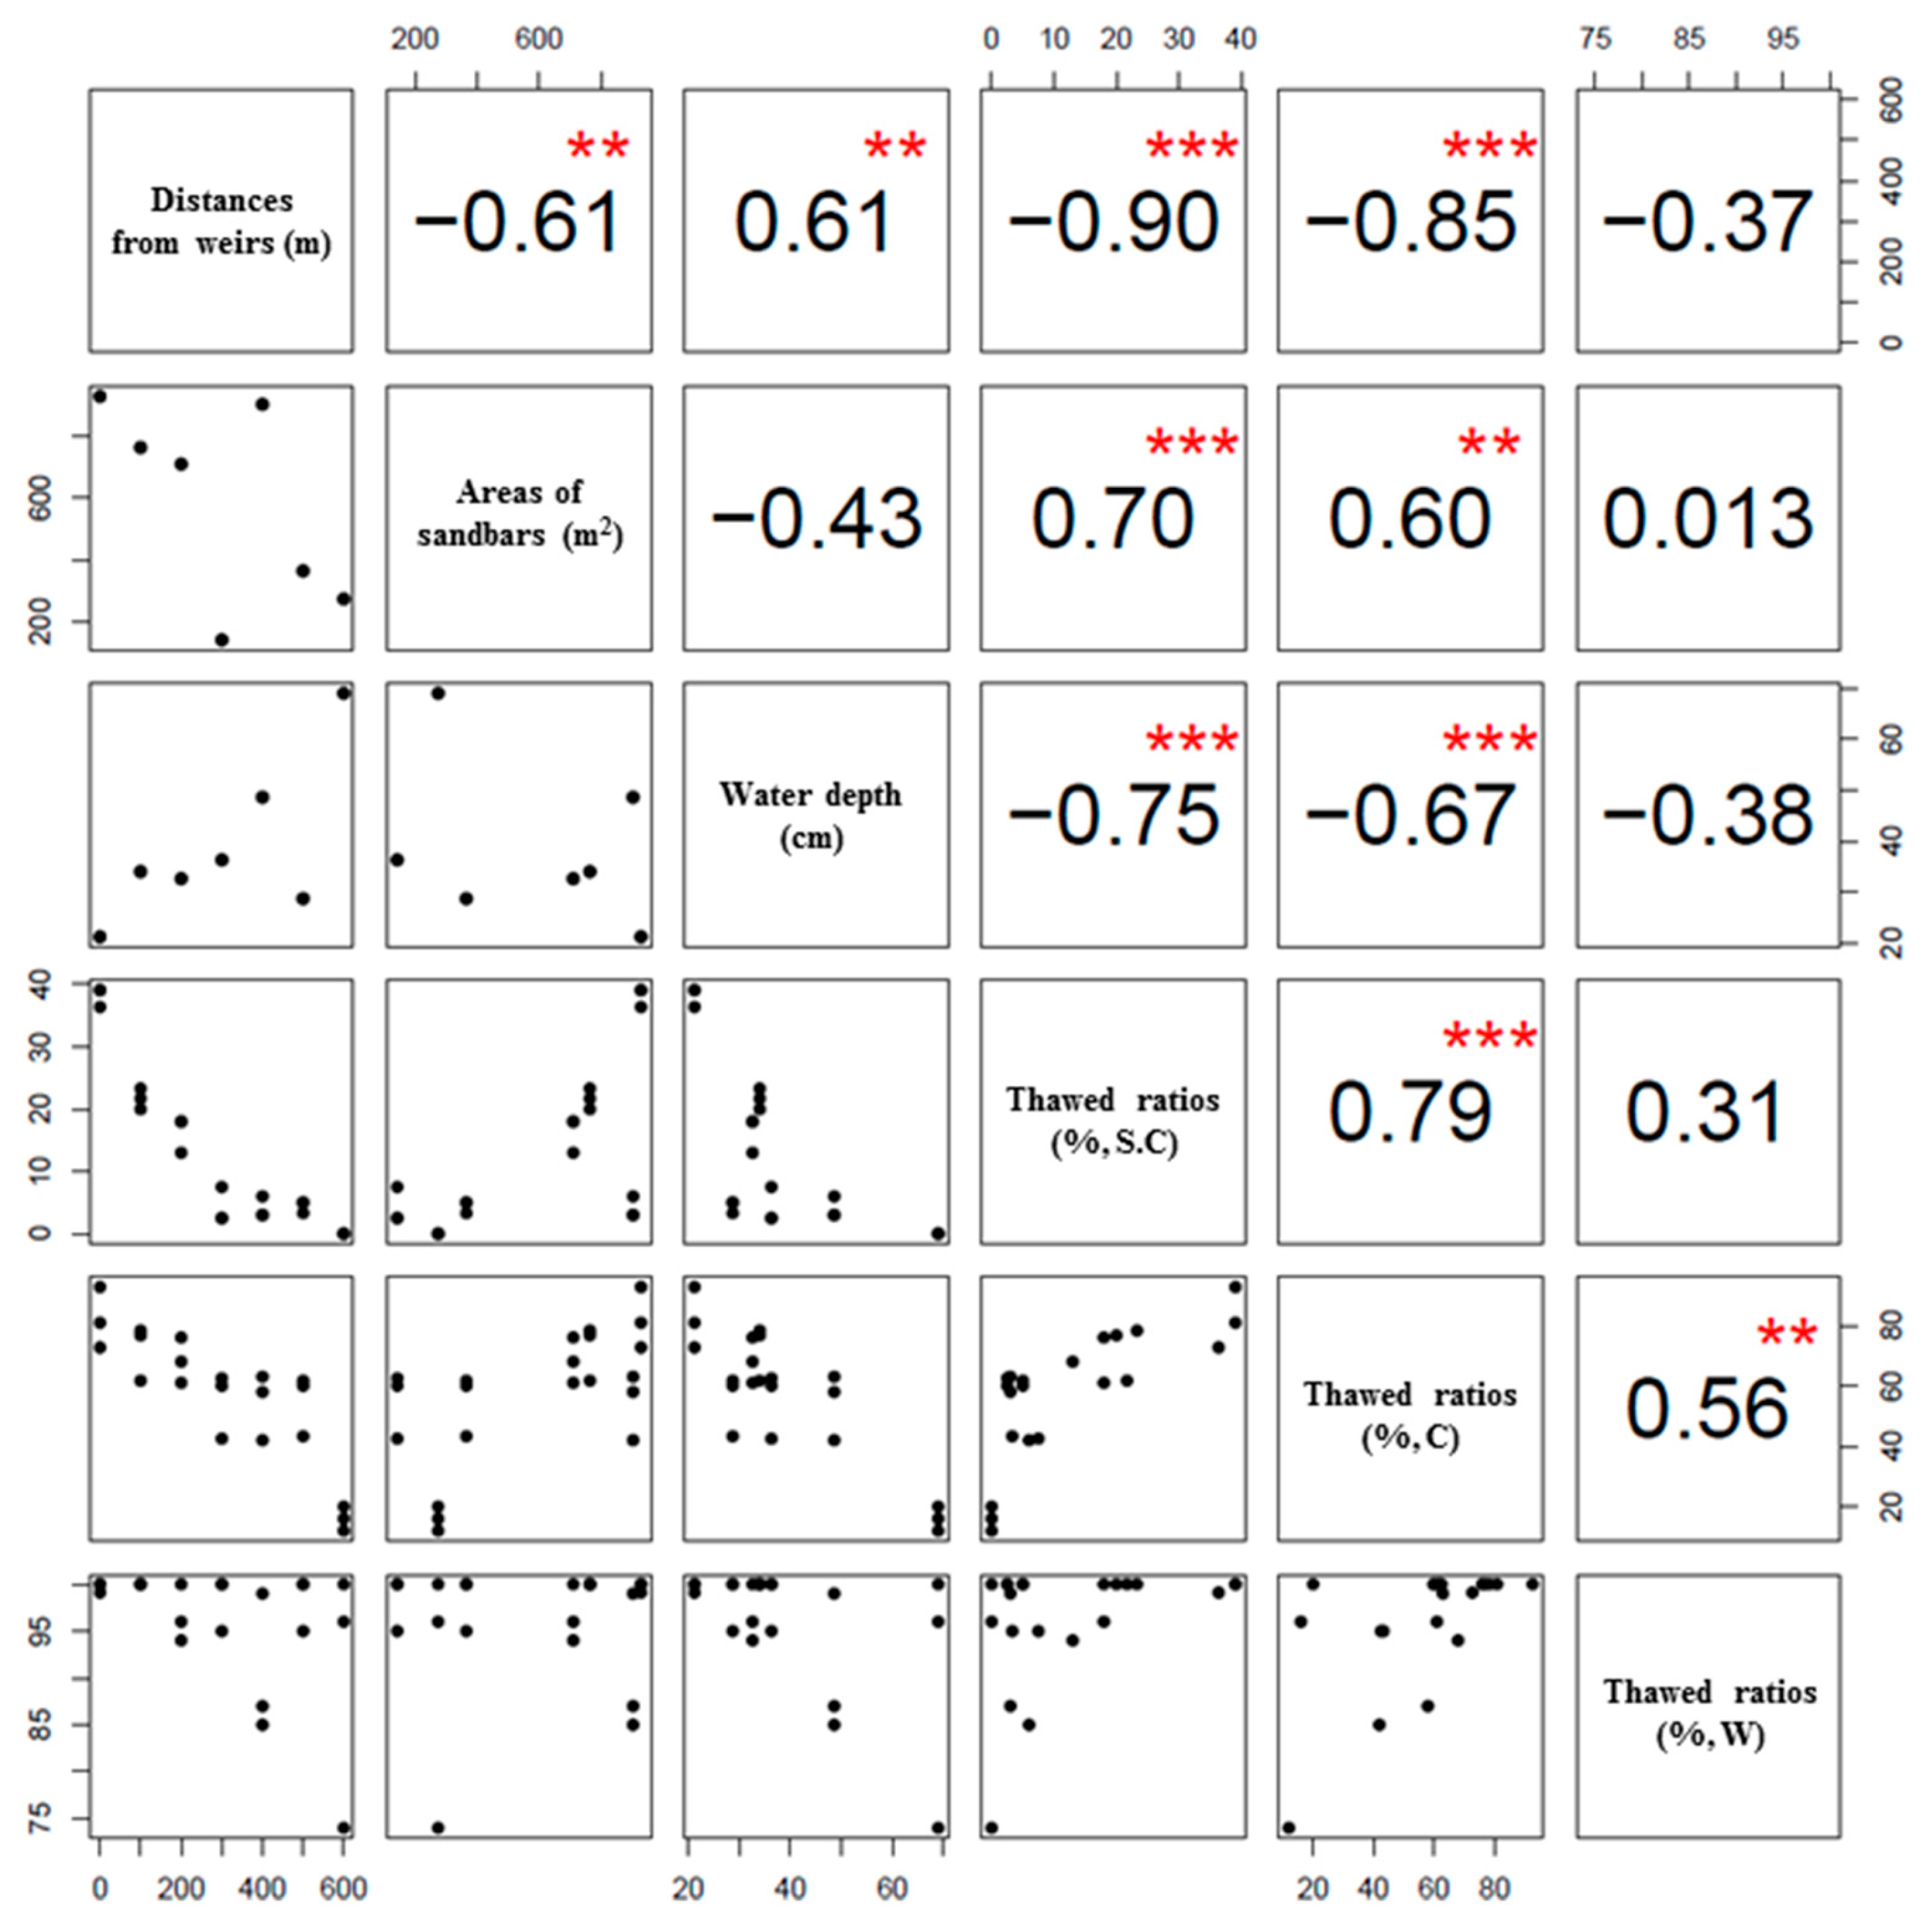
Figure 7.
Distributions of the dabbling duck abundance in relation to distance from weirs (mean ± S.E.) at each distance; 0-100 m (11 samples), 100-200 m (6 samples), 200-300 m (10 samples), 300-400 m (4 samples), 400-500 m (10 samples), 500-600 m (6 samples), and 600-700 m (5 samples).
Figure 7.
Distributions of the dabbling duck abundance in relation to distance from weirs (mean ± S.E.) at each distance; 0-100 m (11 samples), 100-200 m (6 samples), 200-300 m (10 samples), 300-400 m (4 samples), 400-500 m (10 samples), 500-600 m (6 samples), and 600-700 m (5 samples).
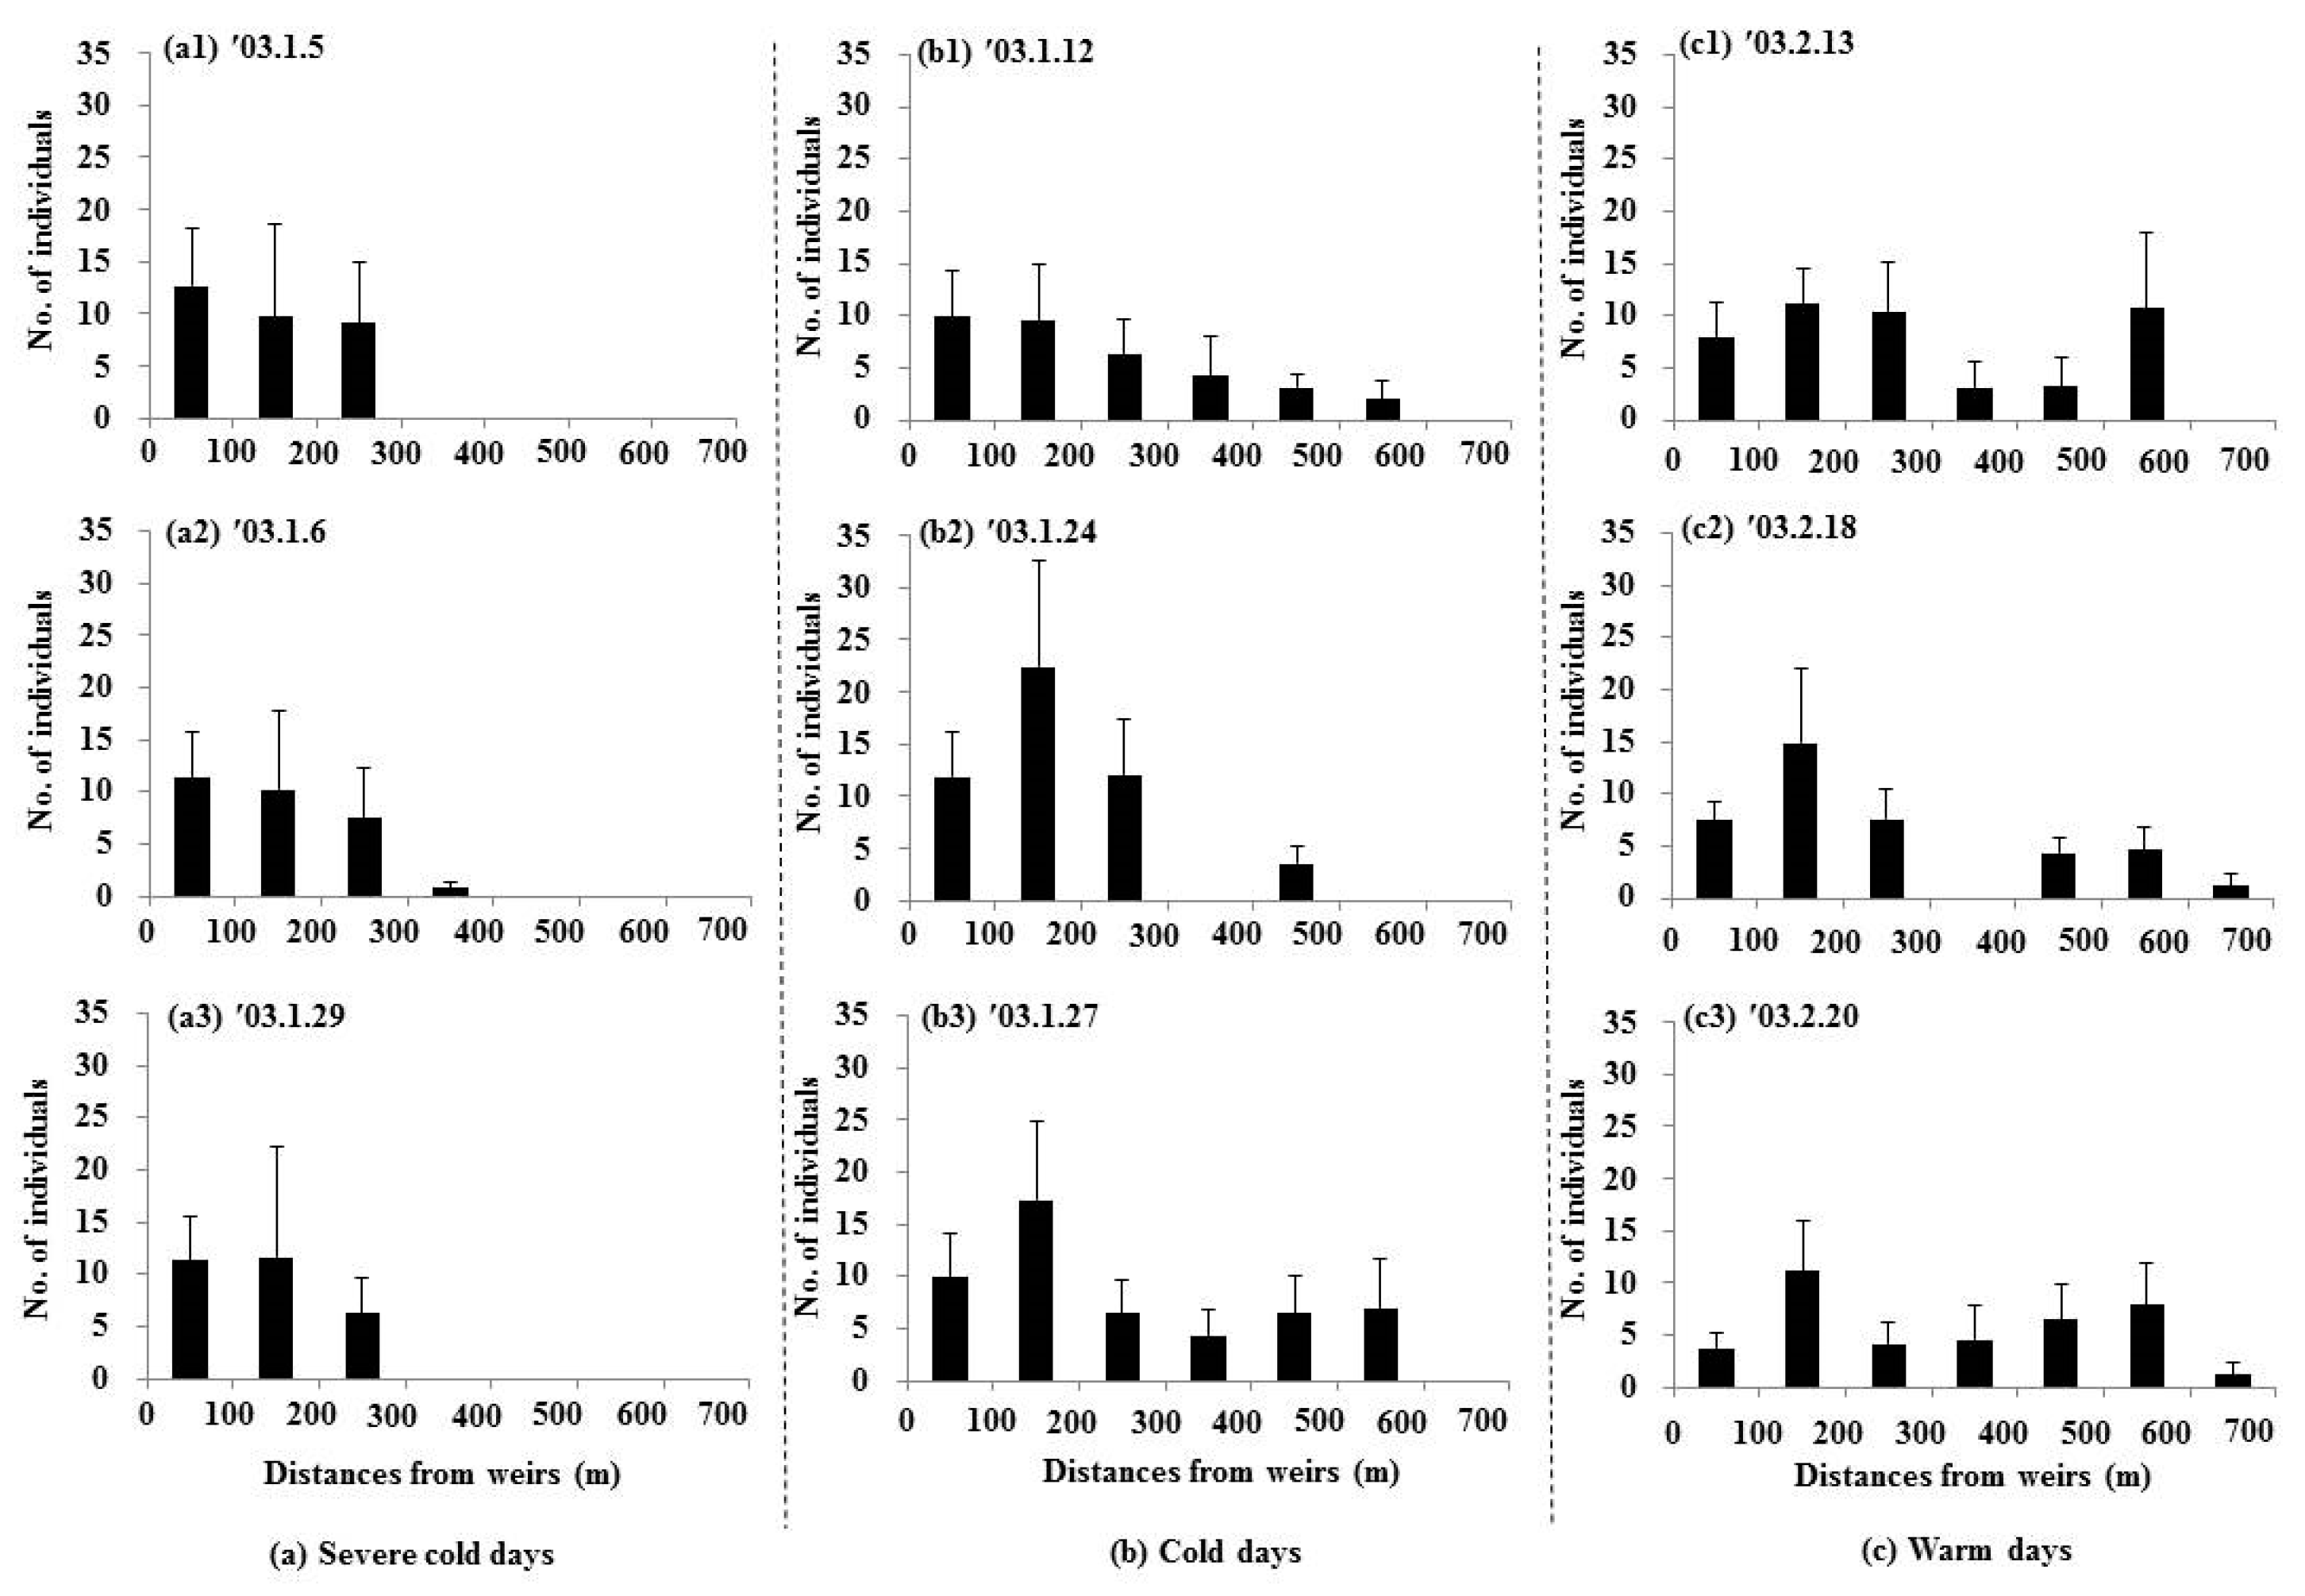
Figure 8.
Distributions of the diving water bird abundance in relation to distance from weirs (mean ± S.E.) at each distance; 0-100 m (11 samples), 100-200 m (6 samples), 200-300 m (10 samples), 300-400 m (4 samples), 400-500 m (10 samples), 500-600 m (6 samples), and 600-700 m (5 samples).
Figure 8.
Distributions of the diving water bird abundance in relation to distance from weirs (mean ± S.E.) at each distance; 0-100 m (11 samples), 100-200 m (6 samples), 200-300 m (10 samples), 300-400 m (4 samples), 400-500 m (10 samples), 500-600 m (6 samples), and 600-700 m (5 samples).
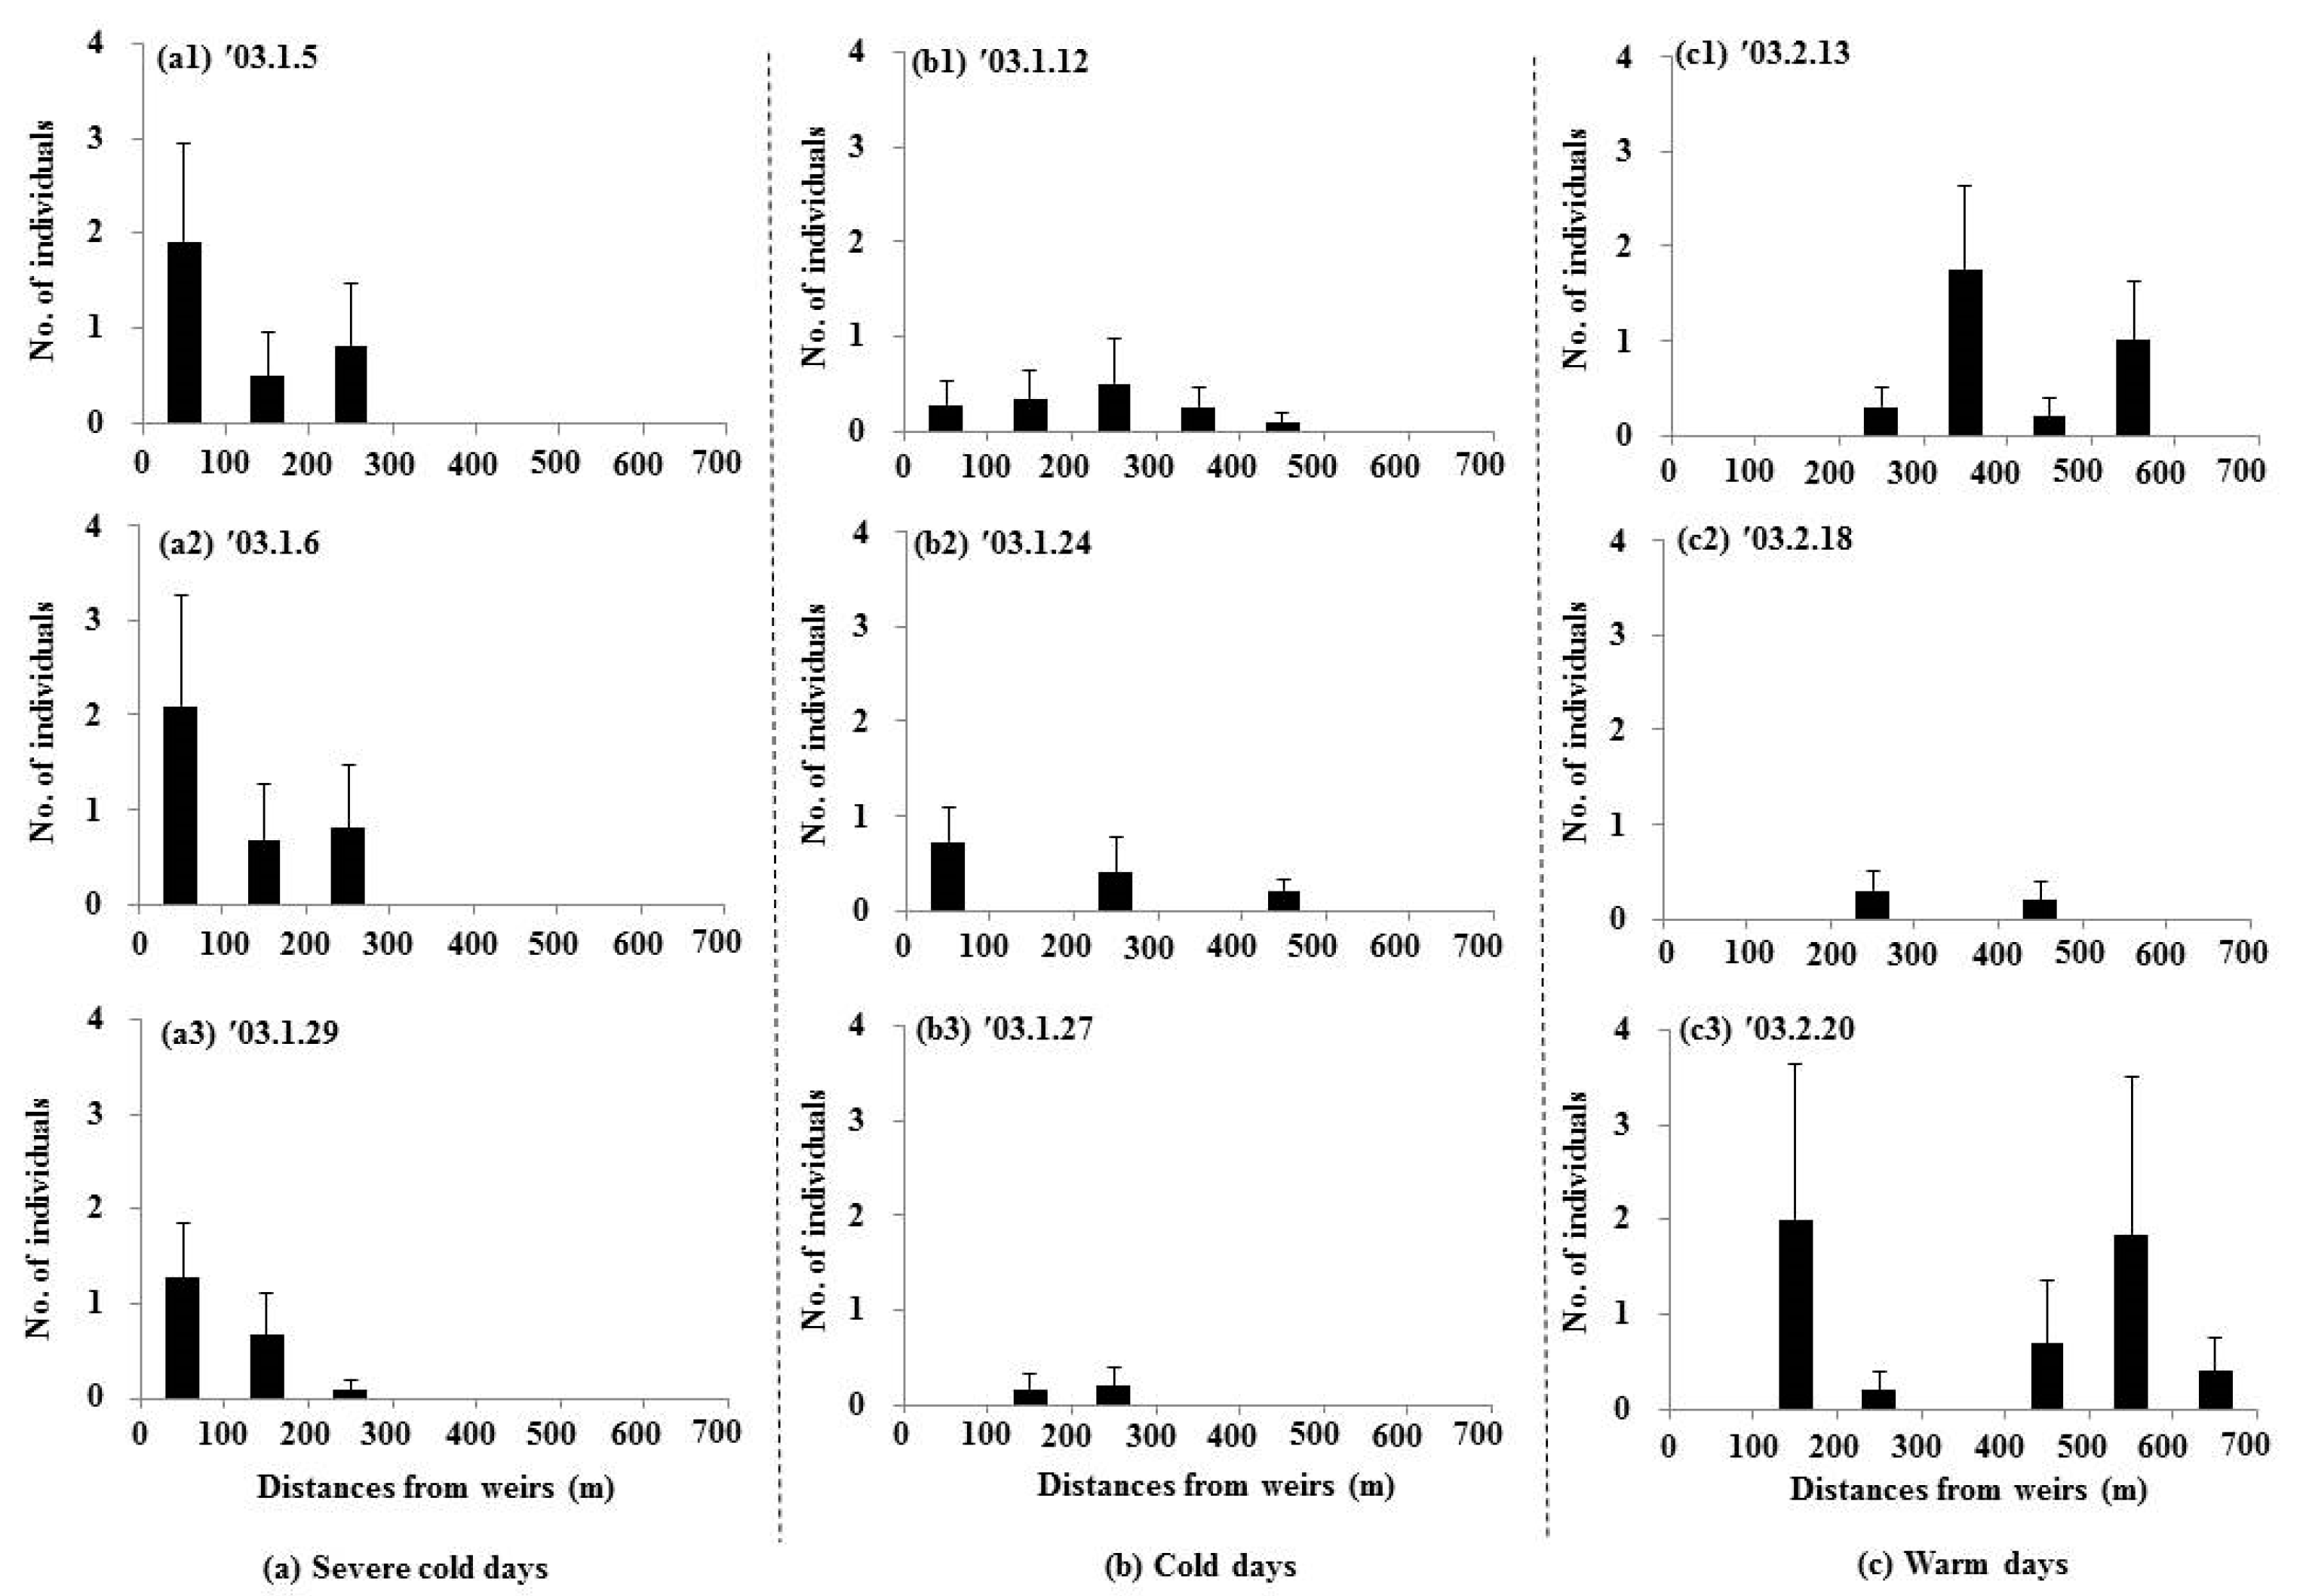

Table 1.
Abundance of the water birds in the study area (n = 9).
| Common name | Scientific name | Mean | S.E. | Min. | Max. |
| Spot-billed Duck1 | Anas poecilorhyncha | 310.3 | 18.9 | 256.0 | 399.0 |
| Little Grebe2 | Tachybaptus ruficollis | 11.2 | 3.7 | 0.0 | 28.0 |
| Common Merganser2 | Mergus merganser | 6.3 | 2.5 | 1.0 | 24.0 |
| Common Teal1 | Anas crecca | 5.6 | 1.3 | 1.0 | 11.0 |
| Mallard1 | Anas platyrhynchos | 5.4 | 1.4 | 0.0 | 14.0 |
| Little Egret | Egretta garzetta | 3.2 | 1.0 | 0.0 | 8.0 |
| Grey Heron | Ardea cinerea | 1.4 | 0.4 | 0.0 | 3.0 |
| Pochard2 | Aythya ferina | 1.2 | 0.5 | 0.0 | 4.0 |
| Herring Gull | Larus argentatus | 0.7 | 0.2 | 0.0 | 1.0 |
| Black-backed Wagtail | Motacilla lugens | 0.6 | 0.3 | 0.0 | 2.0 |
| Pintail1 | Anas acuta | 0.3 | 0.2 | 0.0 | 1.0 |
| Black-crowned Night Heron | Nycticorax nycticorax | 0.2 | 0.2 | 0.0 | 2.0 |
1: dabbling ducks, 2: diving water birds.
Table 2.
Correlations between environmental variables and water birds.
| Environmental variables | No. of individuals | |||||
| Severe cold days (n=21) | Cold days (n=21) | Warm days (n=21) | ||||
| Dabbling1 | Diving2 | Dabbling | Diving | Dabbling | Diving | |
| Thawed ratios (%) | 0.85** | 0.87** | 0.68** | 0.60** | 0.29ns | -0.27ns |
| Areas of Sandbars (m2) | 0.58** | 0.64** | 0.62** | 0.39ns | 0.44* | -0.10ns |
| Water depths (cm) | -0.59** | -0.65** | -0.55** | -0.32ns | -0.55* | 0.07ns |
1: dabbling ducks, 2: diving water birds, ns: non-significant, *: p-value < 0.05, **: p-value < 0.01
Disclaimer/Publisher’s Note: The statements, opinions and data contained in all publications are solely those of the individual author(s) and contributor(s) and not of MDPI and/or the editor(s). MDPI and/or the editor(s) disclaim responsibility for any injury to people or property resulting from any ideas, methods, instructions or products referred to in the content. |
© 2024 by the authors. Licensee MDPI, Basel, Switzerland. This article is an open access article distributed under the terms and conditions of the Creative Commons Attribution (CC BY) license (http://creativecommons.org/licenses/by/4.0/).
Copyright: This open access article is published under a Creative Commons CC BY 4.0 license, which permit the free download, distribution, and reuse, provided that the author and preprint are cited in any reuse.


