
Submitted:
29 October 2024
Posted:
29 October 2024
You are already at the latest version
Abstract
This study analyzes the effects of primary energy consumption and alternative energy patents on CO2 emission intensity and CO2 emissions per capita, and their relationship using canonical correlation analysis. Our results are as follows. First, CO2 emissions from natural gas and liquefied petroleum gas have positive effects, while CO2 emissions from gasoline, fuel oil, diesel, and kerosene have negative effects on CO2 emission intensity. Second, patents for devices for producing mechanical power from muscle energy have large positive effects. Finally, the more the patents use waste heat, geothermal energy, hydro energy, and wind energy, the higher the CO2 emissions from liquefied petroleum gas, gasoline, and crude oil and the lower the CO2 emissions from diesel, which are conducive to controlling CO2 emissions. Therefore, energy policies will be more effective based on the CO2 “emissions” level from primary energy consumption and the “control” degree of CO2 emissions by alternative energy.
Keywords:
CO2 emissions
; Primary energy consumption
; Alternative energy patent
; Multiple linear regression
; Canonical correlation analysis
1. Introduction
Since 2006, China has been the world’s largest CO2 emitter [1,2]. It is predicted that the country’s economic growth and urbanization will continue to increase its CO2 emissions [3] by more than 50% during 2015–2030 [4]. Therefore, China is under significant pressure from international climate negotiations [5]. Rigorously controlling CO2 emissions in China is thus important for addressing global climate challenges [6].
Compared with major developed countries or regions, China’s CO2 emission development history has its particularities. Although some developed countries such as the United States, the United Kingdom, and France have reached their peaks of CO2 emissions [7], the Chinese government’s commitment to reach carbon peaking by 2030 is based on a different circumstance.
Figure 1 shows the development of CO2 emission intensity in China compared to the United States, the United Kingdom, Japan, the European Union, and Germany from 1960 to 2014. First, while CO2 emission intensity decreased in other countries and regions, China was the only country with a significant increase in CO2 emission intensity. Second, the CO2 emission intensity curves of China and other countries or regions crossed from 1982 to 1984. Third, China’s CO2 emission intensity dropped significantly in 1990, 1996–2002, and 2011–2013.
In addition, China’s CO2 emissions per capita are significantly lower than those of many developed countries or regions. Figure 2 shows the development of CO2 emissions per capita in China compared to the United States, the United Kingdom, Japan, the European Union, and Germany from 1960 to 2016. First, China’s CO2 emissions per capita were lower than those in other countries or regions before 2011. Second, China’s CO2 emissions per capita increased year by year; however, the increase was smaller before 2002 and more obvious from 2002 to 2011. Third, China’s CO2 emissions per capita were still generally at a low level.
For China to achieve its goals of carbon peaking and carbon neutrality by 2030 and 2060, it is essential to study the factors that influence its CO2 emission intensity and CO2 emissions per capita. As the consumption of primary energy1 is the largest source of CO2 emissions, replacing the coal-dominated energy structure with a green energy structure is crucial for most countries to reduce CO2 emissions. Alternative energy technology is integral to green energy technology. The development of alternative energy is thus one of the main options to change the coal-dominated energy structure. Alternative energy patents are an important indicator of the innovation capability of this technological field, as they are closely related to energy technology research and development (R&D) expenditure [8]. Therefore, studying the effects of primary energy consumption and alternative energy technology patents on CO2 emission intensity and CO2 emissions per capita is important for China to achieve its carbon peaking and neutrality goals.
The literature analyzed the effects of primary energy or alternative energy technologies on CO2 emissions. Some scholars studied the effects of economic development, industrial structure, population size, urbanization, energy structure, technology, and R&D on CO2 emissions; meanwhile, others studied the relationship between primary energy consumption and CO2 emissions and the one between green patents and CO2 emissions. In addition, some scholars focused on the relationship between alternative energy technology and CO2 emissions. However, only a few studies analyzed the effects of primary energy consumption and alternative energy technology patents on CO2 emissions. Thus, this study attempts to identify the effects of the CO2 “emissions” of primary energy consumption and the “control” of alternative energy technology patents on CO2 emissions to contribute to China’s carbon peaking and carbon neutrality goals.
Compared with the literature, this study makes three contributions to the research on controlling CO2 emissions. First, CO2 emission intensity was significantly affected by the CO2 emissions from natural gas, gasoline, liquefied petroleum gas, fuel oil, diesel, and kerosene, as well as by patents related to devices that produce mechanical power via muscle energy, ocean thermal energy conversion, pyrolysis, hydro energy, and harnessing energy from manmade waste. Second, CO2 emissions per capita were significantly affected by the emissions from liquefied petroleum gas, gasoline, diesel, fuel oil, and kerosene; patents for ocean thermal energy conversion; and devices for producing mechanical power from muscle energy. Thirdly, the more the patents in the technological fields used waste heat, geothermal energy, hydro energy, and wind energy, the more the CO2 was produced by the consumption of liquefied petroleum gas, gasoline, and crude oil, and the less the CO2 was produced by the consumption of diesel, which is more conducive to the control of CO2 emissions.
The remainder of the paper is organized as follows. Section 2 provides a comprehensive review of the relevant literature.Section 2 reviews the relevant literature. We describe the methodology and data in Section 3. In Section 4, we analyze the effects of CO2 emissions from primary energy consumption and alternative energy technology patents on CO2 emission intensity, CO2 emissions per capita, and total CO2 emissions using multiple linear regression (MLR). We also explore the relationship between CO2 emissions from primary energy consumption and alternative energy patents using canonical correlation analysis (CCA). Finally, Section 5 provides the conclusion and policy implications.
2. Literature Review
2.1. Primary Energy Consumption and CO2 Emissions
China is currently one of the countries that consume the most primary energy and produce the most CO2 emissions [9]; It is also a major producer of coal, oil, and natural gas. The country pledged to peak its CO2 emissions and increase its non-fossil share of primary energy to 20% by 2030 [10]. Some scholars studied the relationship between primary energy consumption and CO2 emissions. For example, Siitonen et al. [11] found that energy-saving investments in individual industrial processes may have different effects on primary energy consumption and CO2 emissions. Valadkhani et al. [12] studied the CO2 emissions from different types of primary energy and used annual data from 60 countries to examine the effects of various types of primary energy consumption on CO2 emissions. They found that all countries, except for the highest-income ones, can reduce CO2 emissions by replacing oil or coal with natural gas. In addition, some scholars studied the effects of specific fuels of primary energy on CO2 emissions. Liu et al. [13] contend that the Chinese government recognizes its dependence on fossil fuels and the consequent rise in CO2 emissions. Shao et al. [14] found that China’s consumption structure of coal-dominated energy causes massive CO2 emissions. Additionally, Zhang et al. [15] found that China’s fossil fuel combustion for electricity generation accounts for more than 40% of the global CO2 emissions, which is why reducing the use of fossil fuels is significant for controlling CO2 emissions. Moreover, the consumption of fossil energy has gradually increased, resulting in the emission of a large amount of CO2 [16,17]. Therefore, primary energy consumption has significant effects on CO2 emissions. However, the literature rarely systematically studied the differences in the contribution of primary energy consumption to CO2 emissions.
2.2. Alternative Energy and CO2 Emissions
The development of alternative energy technologies has important effects on CO2 emissions. It is well known that carbon-free energy technologies such as wind and nuclear power are more effective in reducing CO2 emissions than fossil fuel technologies such as gas- and coal-fired ones. Chen et al. [18] found that wind and nuclear technologies best reduce CO2 emissions. Manoli et al. [19] argued that green technologies play a key role in controlling the CO2 emissions from fossil fuel energy. Additionally, the comprehensive utilization of traditional and alternative energy is not only economically rational but also conducive to the development of alternative energy [20]. In summary, it is an important measure to reduce CO2 emissions by using alternative energy. However, the literature rarely systematically studied the role of specific alternative energy in mitigating CO2 emissions.
2.3. Energy Patents and CO2 Emissions
Many studies investigated the relationship between energy patents and CO2 emissions. One literature stream focused on the effects of patents on CO2 emissions. Some scholars considered that patents are also used to study the effects of technological innovation on CO2 emissions [21,22,23]. Li et al. [24] found evidence of an inverse U-shaped relation between patents and CO2 emissions. Another literature stream studied the relationship between renewable energy patents and CO2 emissions. Cheng et al. [25] analyzed the difference in the effects of renewable energy patents and environmental technology patents on CO2 emission reduction. A third literature stream studied the relationship between green patents and CO2 emissions. Cho and Sohn [26] found that policies aimed at controlling CO2 emissions can effectively promote green patent applications. Meanwhile, Kwon et al. [27] showed that an increase in CO2 emissions leads to an increase in green patent applications. Patent data were also used to examine the effect of green technologies [27,28]. Alternative energy technology patents are part of renewable and green technology patents. While the literature studied the effect of renewable energy patents and green technology patents on reducing CO2 emissions, it rarely focused on the effects of alternative energy patents on reducing CO2 emissions.
3. Methodology and Data
3.1. Methodology
CCA is an exploratory statistical method utilized to assess correlations between two sets of variables and is used in a wide range of disciplines to analyze the relationship between multiple independent and multiple dependent variables. This method was first described by Hotelling [29] and has been widely used in many academic fields such as coastal engineering by Larson et al. [30], dissolved organic matter fractions and contents by Xujing et al. [31], and the functional diversity of the microbial community and the oxidative stress in earthworms by Zhou [32]. In this study, SPSS v24 was used to run the model.
3.2. Variable Design
3.2.1. Dependent Variables
In MLR, the dependent variables include CO2 emission intensity, CO2 emissions per capita, and total CO2 emissions. CO2 emission intensity refers to the amount of CO2 emissions produced by one unit of gross domestic product (GDP) growth, which is mainly used to measure the relationship between a country’s economy and CO2 emissions. CO2 emission per capita is the annual average of CO2 emission per person in a certain area. In CCA, the dependent variable is represented by total CO2 emissions.
3.2.2. Independent Variable
In MLR and CCA, the independent variables include CO2 emissions from primary energy consumption: CO2 emissions from kerosene (CEKS); CO2 emissions from diesel (CEDS); CO2 emissions from natural gas (CENG); CO2 emissions from liquefied petroleum gas (CELG); CO2 emissions from crude oil (CECO); CO2 emissions from coal (CECL); CO2 emissions from gasoline (CEGL); CO2 emissions from fuel oil (CEFO); CO2 emissions from coke (CECK). Patents for alternative energy technologies: biofuel patents (BFLP); integrated gasification combined cycle patents (IGCP); fuel cell patents (FLCP); pyrolysis or gasification of biomass patents (PGBP); harnessing energy from manmade waste patents (HEMP); hydro energy patents (HDEP); ocean thermal energy conversion patents (OTCP); wind energy patents (WDEP); solar energy patents (SLEP); geothermal energy patents (GTEP); other production or use of heat, not derived from combustion patents (OPHP); using waste heat patents (UWHP); devices for producing mechanical power from muscle energy patents (DPMP).
3.3. Data
The data on CO2 emissions for 1998–2021 are from the “Carbon Neutrality” sub-database of the “Economic Research Series” in the China Stock Market & Accounting Research Database (https://cn.gtadata.com/; retrieval date: April 6, 2022).
The patent data of the alternative energy2 technological fields (see the Appendix for the International Patent Classification (IPC)) for 1995–20183 in China are from the China National Intellectual Property Administration (http://pss-system.cponline.cnipa.gov.cn/seniorSearch; retrieval date: April 8–26, 2022).
3.4. Descriptive Statistics
Table 1 shows the descriptive statistics for CO2 emission intensity; CO2 emissions per capita; CO2 emissions from natural gas, fuel oil, coke, liquefied petroleum gas, kerosene, coal, crude oil, gasoline, and diesel; and patent data of alternative energy technological fields in China.
From Table 1, the following conclusions can be drawn. First, regarding primary energy consumption, the ratio of the mean of CO2 emissions from coal to the total mean of CO2 emissions from primary energy consumption is the highest (65.08%). The ratio of the sum of the means of CO2 emissions from crude oil, coke, and diesel to the total mean of CO2 emissions from primary energy consumption is larger (26.34%). Second, among alternative energy patents, the ratio of the mean of biofuel patents to the total mean of alternative energy patents is the largest (34.68%). The ratio of the sum of the mean of solar energy patents and using waste heat patents to the total mean of alternative energy patents is relatively large (34.50%).
4. Results and Discussion
4.1. Effects of Primary Energy Consumption on CO2 Emission Intensity and CO2 Emissions Per Capita in China based on MLR
4.1.1. Effects of Primary Energy Consumption on CO2 Emission Intensity
The MLR method was used to analyze the collected data by taking CO2 emission intensity as the explained variable and CO2 emissions from the consumption of natural gas, fuel oil, coke, liquefied petroleum gas, kerosene, coal, crude oil, gasoline, and diesel as the explanatory variable, and the results are shown in Table 2, Table 3 and Table 4. Table 2 shows that CO2 emissions from primary energy consumption can explain 65.4% of CO2 emission intensity. The Durbin–Watson value indicates that the samples are independent and less likely to have autocorrelation. Table 4 shows that the CO2 emissions produced by other primary energy consumption have significant effects on CO2 emission intensity, except for CEKS and CEDS. The maximum variance inflation factor (VIF) value indicates that there is no multicollinearity between the independent variables. The regression model is as follows:
where represents CO2 emission intensity. , ,, , , , , , and represent CO2 emissions from the consumption of coal, coke, crude oil, gasoline, kerosene, diesel, fuel oil, liquefied petroleum gas, and natural gas, respectively. Equation (1) shows that, for every RMB 10,000 increase in GDP, CENG, CELG, CECO, and CECL increase by 2,339 tons, 1,039 tons, 71 tons, and 61 tons, respectively; for every RMB 10,000 increase in GDP, CEGL, CEFO, CEDS, CEKS, and CECK decrease by 1,457 tons, 351 tons, 225 tons, and 140 tons, and 56 tons, respectively.
Therefore, the following three conclusions can be drawn. First, with GDP growth, there have been increases or decreases in CO2 emissions from different types of primary energy consumption. This phenomenon is partly due to the dependence of economic growth on certain types of primary energy consumption and partly due to the impact of China’s energy adjustment policies on CO2 emissions. Second, with GDP growth, the increase in CENG and CELG is remarkable. In other words, the contribution of natural gas and liquefied petroleum gas to economic development may currently be difficult to replace using other energy sources. Third, with GDP growth, CEGL decrease significantly, while CEFO, CEDS, and CEKS decrease only slightly. In other words, with economic development, gasoline will be replaced, and fuel oil, diesel, and kerosene may also be replaced.
4.1.2. Effects of Primary Energy Consumption on CO2 Emissions Per Capita
The MLR method was used to analyze the data by taking CO2 emissions per capita as the explained variable and CO2 emissions from the consumption of natural gas, fuel oil, coke, liquefied petroleum gas, kerosene, coal, crude oil, gasoline, and diesel as the explanatory variable,. The results are shown in Table 5, Table 6 and Table 7. Table 5 indicates that CO2 emissions from primary energy consumption can explain 62.2% of CO2 emissions per capita. The Durbin–Watson value indicates that the samples are independent and less likely to show autocorrelation. Table 5 also proves that the CO2 produced by alternative energy sources has significant effects on CO2 emissions per capita, except for CEKS and CENG. The maximum VIF value indicates no multicollinearity between the independent variables. The regression model is as follows:
where represents CO2 emissions per capita. , ,, , , , , , and represent CO2 emissions from the consumption of coal, coke, crude oil, gasoline, kerosene, diesel, fuel oil, liquefied petroleum gas, and natural gas, respectively. Equation (2) shows that for a 1-ton increase in CO2 emissions per capita, CELG, CEKS, CECO, CENG, and CECL increase by 4,639 tons, 1,442 tons, 561 tons, 520 tons, and 326 tons, respectively. For a 1-ton increase in CO2 emissions per capita, CEGL, CEDS, CEFO, and CECK decrease by 4,008 tons, 3,597 tons, 1,579 tons, and 339 tons, respectively.
Therefore, the following three conclusions can be drawn. First, there have been increases or decreases in CO2 emissions per capita for different types of primary energy over the past 20 years. The reason for this may be the comprehensive effect of population, economic, technological, and energy policy development. Second, the growth of CELG per capita has been remarkable and that of CEKS per capita has also been relatively remarkable over the past 20 years. In other words, even after considering population growth, the CO2 emissions produced by the consumption of liquefied petroleum gas and kerosene show a relatively large increase, indicating the difficulty to replace the two primary energy sources with other sources. Third, CEGL per capita and CEDS per capita have decreased significantly, while CEFO per capita have decreased relatively obviously over the past 20 years. In other words, if population growth is considered, CO2 emissions from the consumption of gasoline, diesel, and fuel oil drop significantly, indicating that these three primary energy sources have been largely replaced by other sources.
4.2. Effects of Alternative Energy Patents on total CO2 Emissions and CO2 Emissions per Capita in China Based on MLR
4.2.1. Effects of Alternative Energy Patents on Total CO2 Emissions
Table 8, Table 9 and Table 10 show the results of the MLR analysis for the explained variable of total CO2 emissions and the following explanatory variables: BFLP, IGCP, FLCP, PGBP, HEMP, HDEP, OTCP, WDEP, SLEP, GTEP, OPHP, UWHP, and DPMP. Table 8 shows that alternative energy patents can explain 48.0% of total CO2 emissions. The Durbin–Watson value indicates that the sample is independent and unlikely to have autocorrelation. Table 10 indicates that patents from other technological fields have significant effects on total CO2 emissions, except for BFLP and IGCP. The VIF values of patents in other technological fields are all below 20, except for WDEP, indicating a slight multicollinearity between the independent variables. The regression model is as follows:
where represents total CO2 emissions. , ,, , , , , , , ,, , and represent patent data for BFLP, IGCP, FLCP, PGBP, HEMP, HDEP, OTCP, WDEP, SLEP, GTEP, OPHP, UWHP, and DPMP, respectively. Equation (3) indicates that for a 10-million-ton increase in total CO2 emissions, DPMP, PGBP, HDEP, HEMP, WDEP, IGCP, UWHP, and GTEP increase by 974, 493, 128, 112, 98, 83, 23, and 17 patents, respectively; for a 10-million-ton increase in total CO2 emissions, OTCP, FLCP, SLEP, and BFLP decrease by 1845, 91, 40, 38, and 1 patent, respectively.
Therefore, the following three conclusions can be drawn. First, different types of alternative energy technology patents have positive or negative effects on total CO2 emissions. This phenomenon may be because the growth rates of total CO2 emissions are partly higher than the growth rates of alternative energy technology patents and partly lower than the growth rates of alternative energy technology patents. Second, with the growth of total CO2 emissions, DPMP increase significantly and PGBP increase relatively fast. In other words, although total CO2 emissions are increasing, the technology of devices for producing mechanical power from muscle energy and the technology of pyrolysis or gasification of biomass, which are used to control CO2 emissions, are also developing rapidly. Third, as total CO2 emissions increase, OTCP decrease significantly, while FLCP, SLEP, and BFLP decrease relatively significantly. In other words, compared with the growth rate of CO2 emissions, the development speed of ocean thermal energy conversion technology has been significantly reduced, and the technology developments of fuel cell, solar energy, biofuel are relatively insignificant.
4.2.2. Effects of Alternative Energy Patents on CO2 Emissions per Capita
Table 11, Table 12 and Table 13 present the results of MLR for the explained variable of CO2 emissions per capita and the following explanatory variables: BFLP, IGCP, FLCP, PGBP, HEMP, HDEP, OTCP, WDEP, SLEP, GTEP, OPHP, UWHP, and DPMP. Table 11 shows that alternative energy patents can explain 17.0% of CO2 emissions per capita. The Durbin–Watson value indicates that the samples are independent and unlikely to have autocorrelation. Table 13 shows that the patents produced by other technological fields are significantly correlated with CO2 emissions per capita at the 0.1 level, except for HDEP. The VIF values of patents in other technological fields are all below 20, indicating that there is a slight multicollinearity between the independent variables, except for WDEP. The regression model is as follows:
where represents CO2 emissions per capita. , ,, , , , , , , ,, , and represent patents of BFLP, IGCP, FLCP, PGBP, HEMP, HDEP, OTCP, WDEP, SLEP, GTEP, OPHP, UWHP, and DPMP, respectively. Equation (4) shows that for a 1-ton increase in CO2 emissions per capita, DPMP, PGBP, IGCP, WDEP, UWHP, and HDEP increase by 137, 81, 46, 16, 7, and 5 patents, respectively; for a 1-ton increase in CO2 emissions per capita, OTCP, HEMP, FLCP, GTEP, OPHP, SLEP, and BFLP decrease by 392, 42, 16, 5, 3, 2, and 1 patent, respectively.
Therefore, the following three conclusions can be drawn. First, patents for different types of alternative energy have had positive or negative effects on CO2 emissions per capita over the past 20 years. The reason for this may be the comprehensive effects of population, economic, technological, and energy policy development. Second, the growth of DPMP has been relatively remarkable over the past 20 years. In other words, even after considering population growth, the patents of devices for producing mechanical power from muscle energy show a relatively large increase, indicating that this technological field has achieved relatively rapid development. Third, OTCP have decreased over the past 20 years. In other words, if population growth is considered, ocean thermal energy conversion patents drop significantly, indicating that the development of this technological field is relatively insignificant.
4.3. Relationship Between CO2 Emissions and Alternative Energy Patents in China Based on CCA
Table 14, Table 15, Table 16 and Table 17 show the results by analyzing two sets of data on the amount of CO2 emitted by primary energy consumption and patents for alternative energy sources using CCA by SSPS v24.
4.3.1. Canonical Correlations Sets
Canonical correlations sets: set 1 includes CECL, CECK, CECO, CEGL, CEKS, CEDS, CEFO, CELG, and CENG; set 2 includes BFLP, IGCP, FLCP, PGBP, HEMP, HDEP, OTCP, WDEP, SLEP, GTEP, OPHP, UWHP, and DPMP. This section studies the correlation between sets 1 and 2.
4.3.2. Canonical Correlations
Table 14 shows the results of 9 groups of data in set 1 and 13 groups of data in set 2; these are significantly correlated based on CCA, and the correlation coefficients are 0.948, 0.888, 0.820, 0.736, 0.658, 0.429, 0.378, respectively. The regression results of the other two sets of data were not significant. These correlation coefficients indicate a strong correlation between the amount of CO2 emitted by primary energy consumption and patents for alternative energy.
4.3.3. Correlation Coefficients and Models for CO2 Emissions from Primary Energy Consumption
Table 15 shows that the coefficients on CECL, CECK, CECO, CEGL, CEKS, CEDS, CEFO, CELG, and CENG in the first pair of typical variable equations in set 1 are -0.158, 0.111, -0.302, -0.524, 0.005, 0.519, 0.195, -0.774, and -0.111, respectively. According to this, the typical variable 1 equation of set 1 can be written as follows:
Equation (5) shows that CELG, CEGL, CEDS, CECO, CEFO, CECL, CENG, and CECK have relatively large effects on CO2 emissions from primary energy consumption, with CEDS, CEFO, and CECK having positive effects and CELG, CEGL, CECO, CECL, and CENG, negative effects. For information on the remaining groups in set 1, see Table 15.
4.3.4. Correlation Coefficients and Models for Alternative Energy Patents
Table 16 shows that the coefficients on BFLP, IGCP, FLCP, PGBP, HEMP, HDEP, OTCP, WDEP, SLEP, GTEP, OPHP, UWHP, and DPMP in the first pair of the canonical variable equations in set 2 are 0.434, -0.224, -0.317, 0.046, 0.479, -0.376, 0.075, -0.368, 0.172, -0.411, 0.127, -0.436, and -0.160, respectively. According to this, the canonical variable 1 equation of set 1 can be written as follows:
Equation (6) shows that HEMP, UWHP, BFLP, GTEP, HDEP, WDEP, FLCP, IGCP, SLEP, DPMP, and OPHP have relatively large effects on alternative energy technology patents, with HEMP, BFLP, SLEP, and OPHP having positive effects and UWHP, GTEP, HDEP, WDEP, FLCP, IGCP, and DPMP having negative effects. For information on the remaining groups in set 2, see Table 16.
4.3.5. Correlation Coefficients Between CO2 Emissions from Primary Energy Consumption and Alternative Energy Patents
Table 14 shows that there is a significant positive correlation between the first group of data between CO2 emissions from primary energy consumption and alternative energy patents, and the correlation coefficient is 0.948. Information on the other 6 groups of CCA will not be repeated here, for brevity.
Table 14 and Equation (7) show that UWHP, GTEP, HDEP, WDEP, and FLCP are significantly negatively correlated with ; therefore, the higher the patents of these five alternative energy technological fields, the smaller the . HEMP and BFLP are significantly positively correlated with . is significantly positively correlated with , meaning the smaller the , the smaller the . Because is significantly negatively correlated with CELG, CEGL, and CECO, and significantly positively correlated with CEDS, is small. Namely, patents for using waste heat, geothermal energy, hydro energy, wind energy, and fuel cell should be encouraged, as should be the consumption of liquefied petroleum gas, gasoline, and crude oil, while the consumption of diesel should be strictly controlled. In conclusion, China’s total CO2 emissions are inversely proportional to patents in technological fields for using waste heat, geothermal energy, hydro energy, and wind energy, respectively, and are inversely proportional to CO2 emissions from the consumption of liquefied petroleum gas, gasoline, and crude oil. They are also proportional to patents for harnessing energy from manmade waste and inversely proportional to CO2 emissions from diesel consumption.
4.3.6. Proportion of Variance Explained
Table 17 shows the proportion of explained independent variables in sets 1 and 2, and the proportion of cross variables explained between sets 1 and 2, which are important components in CCA. Table 17 also shows that the proportion of the variables reflecting the CO2 emissions of primary energy consumption explained by the first group of canonical related variables is 35.0%, the proportion of the variables reflecting alternative energy patents explained by the first group of canonical related variables is 52.6%, the proportion of the variable of CO2 emissions of primary energy consumption explained by the first group of canonical related variables of alternative energy patents is 31.5%, and the proportion of the alternative energy patents explained by the first group of canonical related CO2 emissions of primary energy consumption is 47.3%. In summary, the explanatory power of the independent variables is relatively good.
5. Conclusion and Policy Implications
5.1. Conclusions
In 2021, the Chinese government pledged to reduce China’s carbon intensity by 65%, with non-fossil energy accounting for more than 25% of its energy structure by 2030 [33]. To effectively control CO2 emissions by limiting primary energy consumption and developing alternative energy technology, this study analyzes the effects of CO2 emissions from primary energy consumption and alternative energy technology patents on CO2 emission intensity, CO2 emissions per capita, and total emissions per capita in China using MLR. It also analyzes the relationship between CO2 emissions from primary energy consumption and alternative energy technology patents using CCA. This study draws the following three conclusions. First, CO2 emissions from natural gas and liquefied petroleum gas have positive effects, while CO2 emissions from gasoline, fuel oil, diesel, and kerosene have negative effects on CO2 emission intensity; furthermore, CO2 emissions from liquefied petroleum gas and kerosene have positive effects, while CO2 emissions from gasoline, diesel, and fuel oil have negative effects on CO2 emissions per capita. Second, patents for devices for producing mechanical power from muscle energy, pyrolysis or gasification of biomass, hydro energy, and harnessing energy from manmade waste technologies have positive effects, while patents for ocean thermal energy conversion technology have negative effects on total CO2 emissions; patents for devices for producing mechanical power from muscle energy technology have a positive effect, while patents for ocean thermal energy conversion technology have negative effects on CO2 emissions per capita. Third, China’s total CO2 emissions are inversely proportional to patents for technologies using waste heat, geothermal energy, hydro energy, and wind energy, and to CO2 emissions from the combustion of liquefied petroleum gas, gasoline, and crude oil. They are also proportional to patents for technology harnessing energy from manmade waste and inversely proportional to CO2 emissions from diesel combustion.
5.2. Policy Implications
Based on the above conclusions, we make the following policy recommendations. First, to successfully achieve carbon peaking and carbon neutrality, policymakers should further increase the investment in alternative energy technologies, strengthen patent protection, improve technology transformation efficiency, and effectively use these technologies to control CO2 emissions from primary energy consumption. Second, they should comprehensively analyze the differences in the CO2 “emission” levels of different primary energy components and the difference in the “substitution” degrees of CO2 emissions by different types of alternative energy technologies, and formulate precise policies to effectively control CO2 emissions. Third, policymakers should reduce CO2 emission intensity by moderately encouraging the combustion of gasoline, fuel oil, diesel, and kerosene; they can reduce CO2 emissions per capita by moderately encouraging the combustion of gasoline, diesel, and fuel oil. Fourth, policymakers should focus on increasing investment in ocean thermal energy conversion technologies to promote technological innovation, improve the quality and quantity of patents, and reduce total CO2 emissions and CO2 emissions per capita. Finally, policymakers need to focus on increasing R&D in technology fields using waste heat, geothermal energy, hydro energy, and wind energy; strengthen intellectual property protection; and create more patents. Simultaneously, they should encourage the combustion of liquefied petroleum gas, gasoline, and crude oil and strictly control the combustion of diesel.
5.3. Limitations and Future Research Prospects
Given the space considerations, this study has the following limitations. First, the analysis of the influence mechanism between the amount of CO2 emitted by different types of primary energy sources and between different types of alternative energy technology patents is insufficient. Second, the relationship between the “emissions” of CO2 from primary energy consumption and the “control” of CO2 emissions from patents for alternative energy technologies requires further research. Therefore, considering these shortcomings of this study, we will conduct in-depth and systematic research on the above problems to provide a decision-making reference for optimizing energy policy.
Appendix A

Table A1.
International Patent Classifications (IPC) of the technological fields included in alternative energy.
Table A1.
International Patent Classifications (IPC) of the technological fields included in alternative energy.
| No. | Technology fields patent | IPC |
|---|---|---|
| 1 | BFLP | C10L 5/00, 5/40-5/48; C10L 1/00, 1/02, 1/14; C02F 3/28, 11/04; C10L 3/00; C12M 1/107; C12P 5/02; C12N 1/13, 1/15, 1/21, 5/10, 15/00; A01H |
| 2 | IGCP | C10L 3/00; F02C 3/28 |
| 3 | FLCP | H01M 4/86-4/98, 8/00-8/24, 12/00-12/08; H01M 4/86-4/98; H01M 8/00-8/24, 50/00-50/171; H01M 12/00-12/08 |
| 4 | PGBP | C10B 53/00; C10J |
| 5 | HEMP | C10L 5/00;C10J 3/02, 3/46; F23B 90/00; F23G 5/027; B09B 3/00; F23G 7/00; C10L 5/48; F23G 5/00, 7/00; B09B 3/00; F23G 5/00; B09B; C10L 5/46; F23G 5/00 |
| 6 | HDEP | E02B 9/00-9/06; F03B; F03C; F03B 15/00-15/22; B63H 19/02, 19/04 |
| 7 | OTCP | F03G 7/05 |
| 8 | WDEP | F03D; H02K 7/18; B63B 35/00, E04H 12/00; F03D 13/00; B60K 16/00; B63H 13/00 |
| 9 | SLEP | F24S; H02S; F24S; H01L 31/0525, H02S 40/44; B60K 16/00; F03G 6/00-6/06; E04D 13/00, 13/18; F22B 1/00, F24V 30/00; F25B 27/00; F26B 3/00, 3/28; F24S 23/00, G02B 7/183; F24S 10/10 |
| 10 | GTEP | F24T; F01K, F24F 5/00, F24T 10/00-50/00, H02N 10/00, F25B 30/06; F03G 4/00-4/06, 7/04 |
| 11 | OPHP | F24T 10/00-50/00; F24V 30/00-50/00; F24D 11/02; F24D 15/04; F24D 17/02, 18/00; F24H 4/00; F25B 30/00 |
| 12 | UWHP | F01K 27/00; F01K 23/06-23/10; F01N 5/00; F02G 5/00-5/04; F25B 27/02; F01K 17/00, 23/04; F02C 6/18; F25B 27/02; C02F 1/16; D21F 5/20; F22B 1/02; F23G 5/46; F24F 12/00; F27D 17/00; F28D 17/00-20/00; C10J 3/86 |
| 13 | DPMP | F03G 5/00-5/08 |
Source: The Green Inventory, the International Patent Classification (IPC).
References
- Tian, X.; Bai, F.; Jia, J.; Liu, Y.; Shi, F. Realizing low-carbon development in a developing and industrializing region: impacts of industrial structure change on CO2 emissions in southwest China. Journal of Environmental Management 2019, 233, 728–738. [Google Scholar] [CrossRef] [PubMed]
- Zhang, Y.J.; Peng, Y.L.; Ma, C.Q.; Shen, B. Can environmental innovation facilitate carbon emissions reduction? Evidence from China. Energy Policy 2017, 100, 18–28. [Google Scholar] [CrossRef]
- Zhou, X.; Zhang, J.; Li, J. Industrial structural transformation and carbon dioxide emissions in China. Energy Policy 2013, 57, 43–51. [Google Scholar] [CrossRef]
- Liu, X.; Mao, G.; Ren, J.; Li, R.Y.M.; Guo, J.; Zhang, L. How might China achieve its 2020 emissions target? A scenario analysis of energy consumption and CO2 emissions using the system dynamics model. Journal of Cleaner Production 2015, 103, 401–410. [Google Scholar] [CrossRef]
- Bai, C.; Feng, C.; Yan, H.; Yi, X.; Chen, Z.; Wei, W. Will income inequality influence the abatement effect of renewable energy technological innovation on carbon dioxide emissions? Journal of Environmental Management 2020, 264, 110482. [Google Scholar] [CrossRef]
- Lu, C.; Li, W.; Gao, S.B. Driving determinants and prospective prediction simulations on carbon emissions peak for China's heavy chemical industry. Journal of Cleaner Production 2020, 251, 119642. [Google Scholar] [CrossRef]
- Wu, R.; Wang, J.Y.; Wang, S.J.; Feng, K.S. The drivers of declining CO2 emissions trends in developed nations using an extended STIRPAT model: a historical and prospective analysis. Renewable and Sustainable Energy Reviews 2021, 149, 111328. [Google Scholar] [CrossRef]
- Margolis, R.M.; Kammen, D.M. Evidence of under-investment in energy R&D in the United States and the impact of federal policy. Energy Policy 1999, 27, 575–584. [Google Scholar]
- Şahin, U. Forecasting share of renewables in primary energy consumption and CO2 emissions of China and the United States under Covid-19 pandemic using a novel fractional nonlinear grey model. Expert Systems with Applications 2022. [Google Scholar] [CrossRef]
- Zhou, N.; Price, L.; Yande, D.; et al. A roadmap for China to peak carbon dioxide emissions and achieve a 20% share of non-fossil fuels in primary energy by 2030. Applied Energy 2019, 239, 793–819. [Google Scholar] [CrossRef]
- Siitonen, S.; Tuomaala, M.; Suominen, M.; et al. Implications of process energy efficiency improvements for primary energy consumption and CO2 emissions at the national level. Applied Energy 2010, 87, 2928–2937. [Google Scholar] [CrossRef]
- Valadkhani, A.; Smyth, R.; Nguyen, J. Effects of primary energy consumption on CO2 emissions under optimal thresholds: Evidence from sixty countries over the last half century. Energy Economics 2019, 80, 680–690. [Google Scholar] [CrossRef]
- Liu, X.; Zhao, T.; Chang, C.T.; Fu, C.J. China’s renewable energy strategy and industrial adjustment policy. Renewable Energy 2021, 170, 1382–1395. [Google Scholar] [CrossRef]
- Shao, S.; Huang, T.; Yang, L. Using latent variable approach to estimate China’s economy-wide energy rebound effect over 1954–2010. Energy Policy 2014, 72, 235–248. [Google Scholar] [CrossRef]
- Zhang, N.; Zhou, P.; Choi, Y. Energy efficiency, CO2 emission performance and technology gaps in fossil fuel electricity generation in Korea: a meta-frontier non-radial directional distance function analysis. Energy Policy 2013, 56, 653–662. [Google Scholar] [CrossRef]
- Zhao, J.; Jiang, Q.; Dong, X.; Dong, K. Assessing energy poverty and its effect on CO2 emissions: the case of China. Energy Economics 2021, 97, 105191. [Google Scholar] [CrossRef]
- Dong, K. , Hochman, G., Zhang, Y., Sun, R., Li, H., Liao, H. CO2 emissions, economic and population growth, and renewable energy: empirical evidence across regions. Energy Economics 2018, 75, 180–192. [Google Scholar] [CrossRef]
- Chen, Q.; Kang, C.; Xia, Q.; Guan, D.B. Preliminary exploration on low-carbon technology roadmap of China’s power sector. Energy 2011, 36, 1500–1512. [Google Scholar] [CrossRef]
- Manoli, G.; Katul, G.G.; Marani, M. Delay-induced rebounds in CO2 emissions and critical time-scales to meet global warming targets. Earth’s Future 2016, 4, 636–643. [Google Scholar] [CrossRef]
- Kapitonov, I.A. , Patapas, A. Principles regulation of electricity tariffs for the integrated generation of traditional and alternative energy sources. Renewable and Sustainable Energy Reviews 2021, 146, 111183. [Google Scholar] [CrossRef]
- Erdogan, S.; Yıldırım, S.; Yıldırım, D.Ç.; Gedikli, A. The effects of innovation on sectoral carbon emissions: evidence from G20 countries. Journal Environmental Management 2020, 267, 110637. [Google Scholar] [CrossRef] [PubMed]
- Hashmi, R.; Alam, K. Dynamic relationship among environmental regulation, innovation, CO2 emissions, population, and economic growth in OECD countries: a panel investigation. Journal of Cleaner Production 2019, 231, 1100–1109. [Google Scholar] [CrossRef]
- Wurlod, J.D.; Noailly, J. The impact of green innovation on energy intensity: an empirical analysis for 14 industrial sectors in OECD countries. Energy Economics 2018, 71, 47–61. [Google Scholar] [CrossRef]
- Li, W.; Elheddad, M.; Doytch, N. The impact of innovation on environmental quality: Evidence for the non-linear relationship of patents and CO2 emissions in China. Journal of Environmental Management 2021, 292, 112781. [Google Scholar] [CrossRef]
- Cheng, X.; Long, R.; Chen, H.; Li, W. Green competitiveness evaluation of provinces in China based on correlation analysis and fuzzy rough set. Ecological Indicators 2018, 85, 841–852. [Google Scholar] [CrossRef]
- Cho, J.H.; Sohn, S.Y. A novel decomposition analysis of green patent applications for the evaluation of R&D efforts to reduce CO2 emissions from fossil fuel energy consumption. Journal of Cleaner Production 2018, 193, 290–299. [Google Scholar]
- Kwon, D.S.; Cho, J.H.; Sohn, S.Y. Comparison of technology efficiency for CO2 emissions reduction among European countries based on DEA with decomposed factors. Journal of Cleaner Production 2017, 151, 109–120. [Google Scholar] [CrossRef]
- Lee, B.K.; Sohn, S.Y. Patent portfolio-based indicators to evaluate the commercial benefits of national plant genetic resources. Ecological Indicators 2016, 70, 43–52. [Google Scholar] [CrossRef]
- Hotelling, H. The most predictable criterion. Journal of Educational Psychology 1935, 26, 139–142. [Google Scholar] [CrossRef]
- Larson, M.; Capobianco, M.; Hanson, H. Relationship between beach profiles and waves at Duck, North Carolina, determined by canonical correlation analysis. Marine Geology 2000, 163, 275–288. [Google Scholar] [CrossRef]
- Xujing, Guo, Huibin, et al. Tracking variations of fluorescent dissolved organic matter during wastewater treatment by accumulative fluorescence emission spectroscopy combined with principal component, second derivative and canonical correlation analyses. Chemosphere: Environmental toxicology and risk assessment 2018, 194, 463–470. [Google Scholar] [CrossRef] [PubMed]
- Zhou, D. Effects of tetracycline on the relationship between the microbial community and oxidative stress in earthworms based on canonical correlation analysis. Environmental toxicology and pharmacology 2020, 76, 103342. [Google Scholar] [CrossRef] [PubMed]
- Guilhot, L. An analysis of China's energy policy from 1981 to 2020: Transitioning towards to a diversified and low-carbon energy system. Energy Policy 2022, 162, 112806. [Google Scholar] [CrossRef]
Figure 1.
Comparison of CO2 emission intensity among major developed countries or regions during 1960–2014.
Figure 1.
Comparison of CO2 emission intensity among major developed countries or regions during 1960–2014.
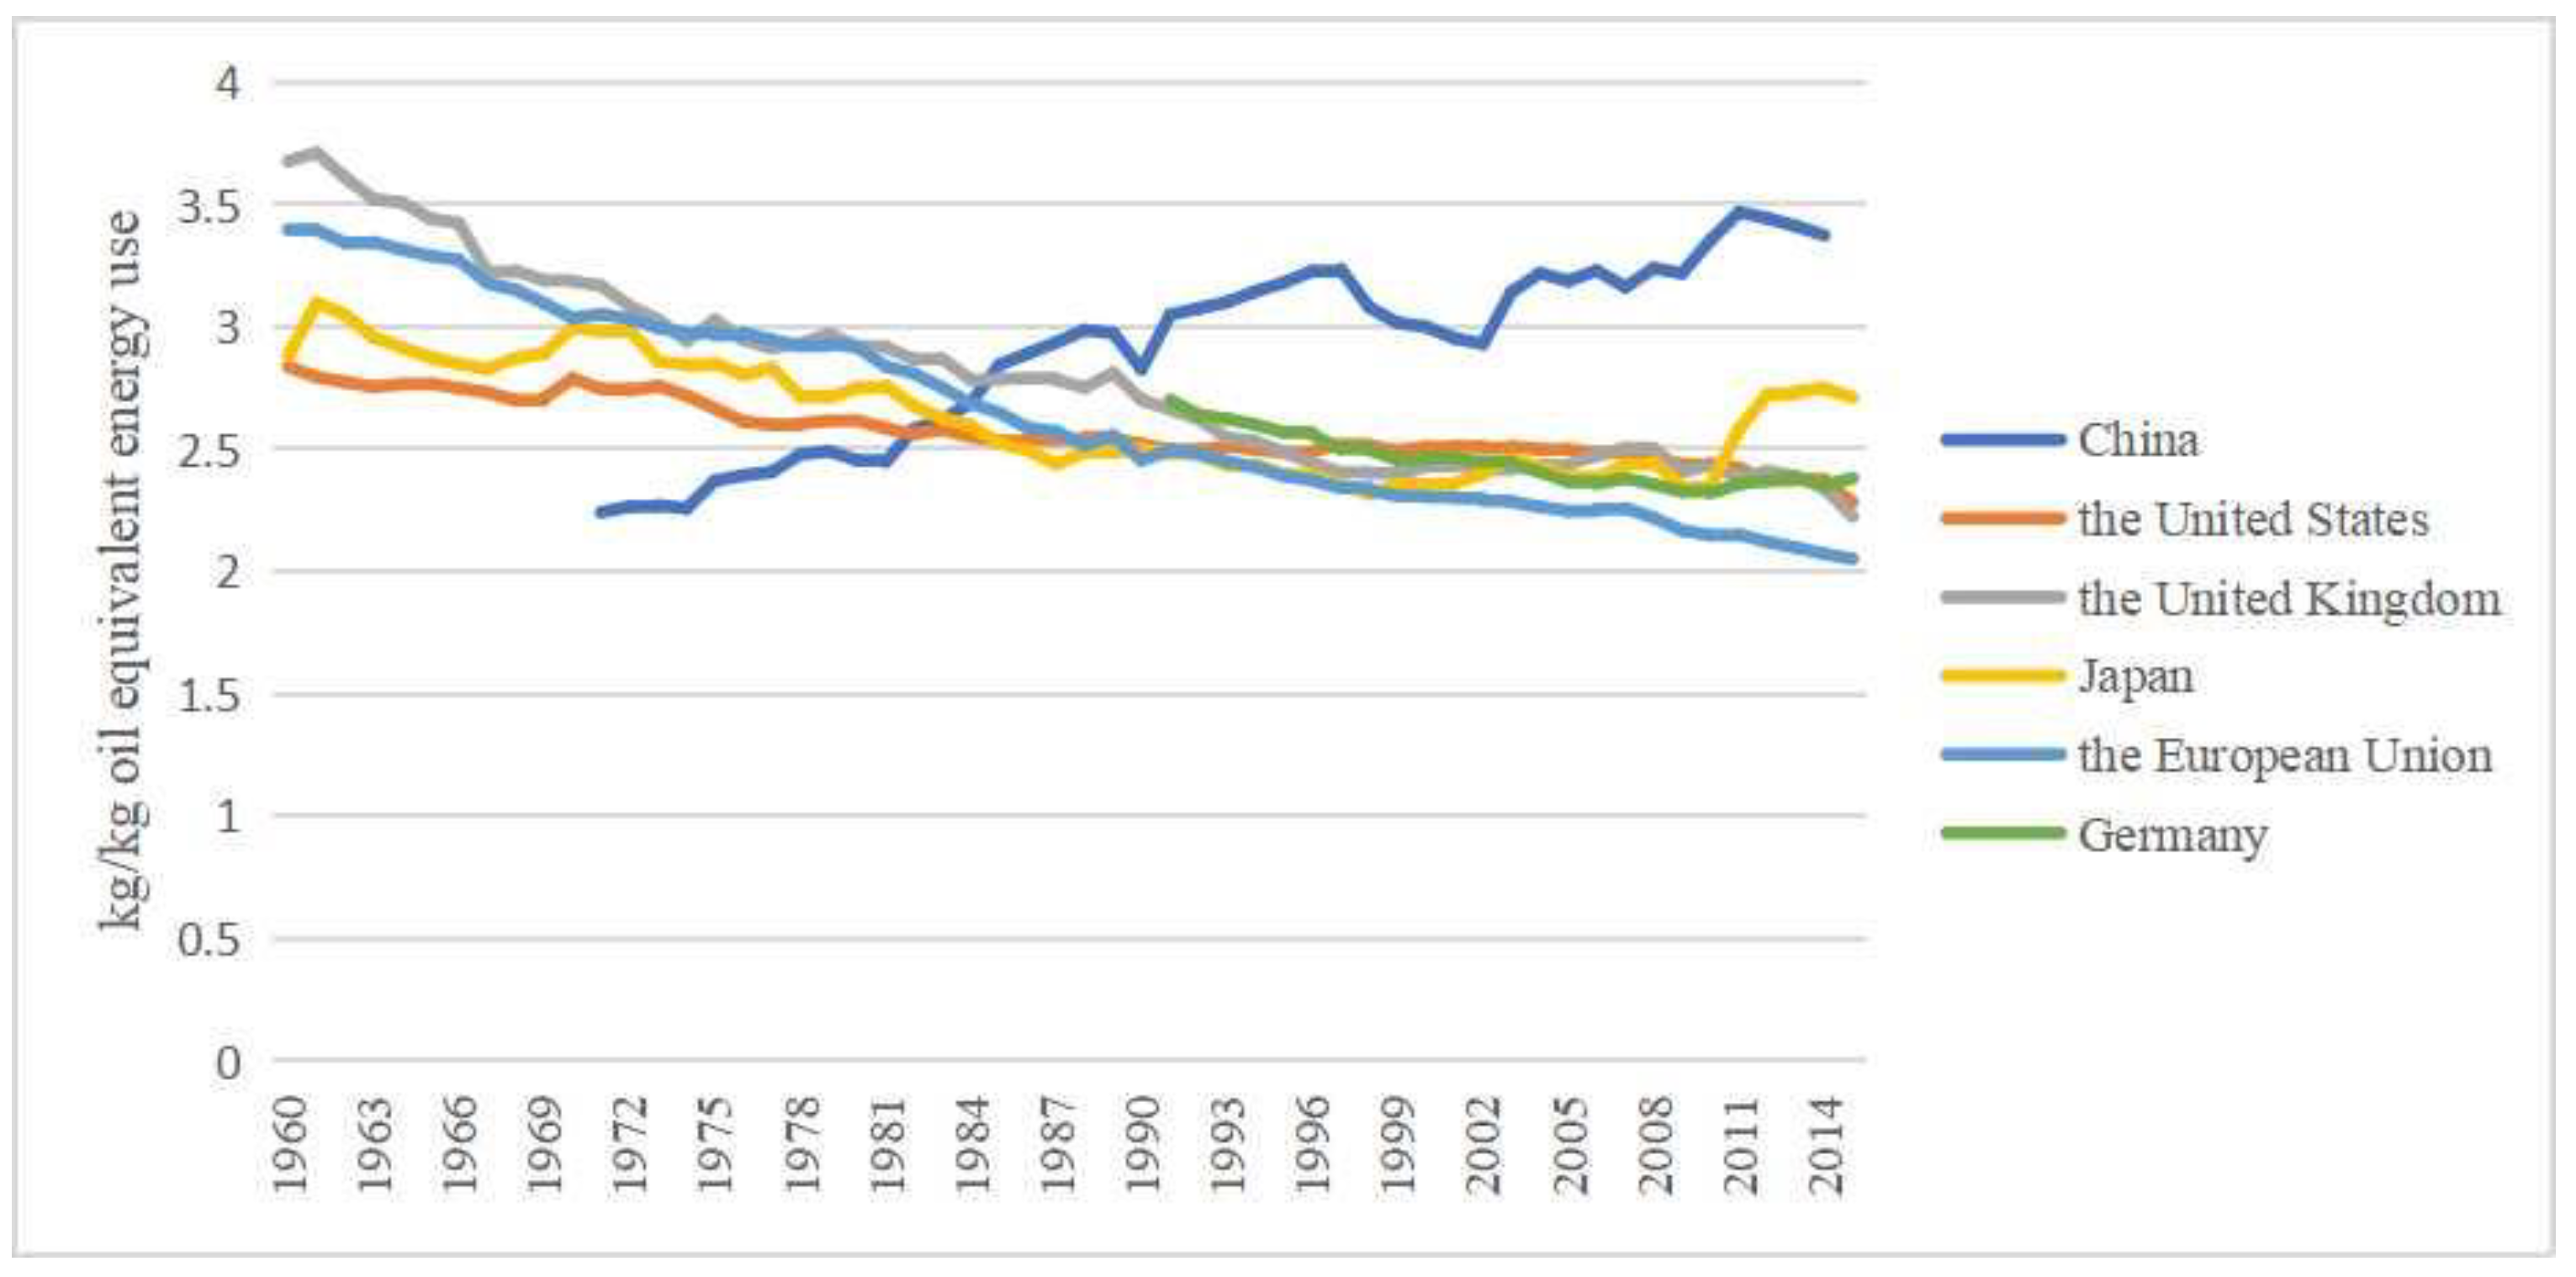
Figure 2.
Comparison of CO2 emissions per capita in major developed countries or regions during 1960–2016.
Figure 2.
Comparison of CO2 emissions per capita in major developed countries or regions during 1960–2016.

Table 1.
Descriptive statistics.
| CO2 emissions/Patents | Number of cases | Min | Max | Mean | Standard Deviation | Variance |
|---|---|---|---|---|---|---|
| CEIT | 717 | 0.0000 | 30.0200 | 4.1644 | 3.3799 | 11.424 |
| CEPC | 717 | 0.0000 | 41.5465 | 7.36514 | 5.9093 | 34.919 |
| CECL | 716 | 0.0000 | 93118.4044 | 18716.1945 | 16904.1429 | 285750045.400 |
| CECK | 713 | 0.0286 | 26753.4942 | 2477.0916 | 3478.7841 | 12101939.090 |
| CECO | 652 | 0.0302 | 39419.2915 | 3902.5952 | 4715.4648 | 22235608.040 |
| CEGL | 715 | 28.5548 | 4554.3921 | 752.0542 | 712.7446 | 508004.803 |
| CEKS | 704 | 0.0304 | 2131.0210 | 159.9756 | 288.8964 | 83461.122 |
| CEDS | 715 | 30.2231 | 5624.0911 | 1194.9783 | 1017.6913 | 1035695.603 |
| CEFO | 714 | 0.0634 | 14858.3263 | 468.1455 | 1180.3048 | 1393119.376 |
| CELG | 180 | 6.7588 | 2592.3762 | 333.1892 | 431.8124 | 186461.932 |
| CENG | 650 | 0.0000 | 5979.6703 | 753.6010 | 910.2725 | 828595.971 |
| BFLP | 720 | 0 | 15412 | 437.09 | 1271.677 | 1617162.929 |
| IGCP | 720 | 0 | 327 | 19.96 | 38.937 | 1516.082 |
| FLCP | 720 | 0 | 1961 | 68.39 | 170.042 | 28914.344 |
| PGBP | 720 | 0 | 153 | 9.48 | 18.586 | 345.429 |
| HEMP | 720 | 0 | 346 | 25.58 | 45.960 | 2112.363 |
| HDEP | 720 | 0 | 494 | 23.05 | 52.696 | 2776.817 |
| OTCP | 720 | 0 | 48 | 2.68 | 5.524 | 30.512 |
| WDEP | 720 | 0 | 1600 | 81.19 | 194.671 | 37896.605 |
| SLEP | 720 | 0 | 3957 | 225.20 | 540.133 | 291743.217 |
| GTEP | 720 | 0 | 2707 | 62.02 | 213.084 | 45404.760 |
| OPHP | 720 | 0 | 3224 | 88.15 | 248.292 | 61648.837 |
| UWHP | 720 | 0 | 3981 | 209.57 | 448.556 | 201202.304 |
| DPMP | 720 | 0 | 111 | 7.82 | 13.216 | 174.654 |
b. CO2 emission intensity: tons/10,000 yuan; b. CO2 emissions per capita: tons/person; c. CO2 emissions: 10,000 tons.
Table 2.
Model summary. b.
| Model | R | R Square | Adjusted R Square | Std. Error of the Estimate | Durbin-Watson |
|---|---|---|---|---|---|
| 1 | 0.809a | 0.654 | 0.635 | 0.9977881 | 1.724 |
a. predictor variable: (Constant), CECL, CECK, CECO, CEGL, CEKS, CEDS, CEFO, CELG, CENG. b. dependent variable: CO2 emission intensity.
Table 3.
Anova.a.
| Model | Sum of Squares | df | Mean Square | F | Sig. | |
|---|---|---|---|---|---|---|
| 1 | Regression | 306.752 | 9 | 34.084 | 34.235 | 0.000b |
| Residual | 162.280 | 163 | 0.996 | |||
| Total | 469.032 | 172 | ||||
Table 4.
Coefficients. a.
| Modes | Unstandardized Coefficients | Standardized Coefficients | t | Sig. | Collinearity Statistics | ||
|---|---|---|---|---|---|---|---|
| B | Std. Error | Beta | TOL | VIF | |||
| (Constant) | 2.339 | 0.224 | 10.446 | 0.000 | |||
| CECL | 0.061 | 0.005 | 0.786 | 11.404 | 0.000 | 0.446 | 2.240 |
| CECK | -0.056 | 0.022 | -0.161 | -2.572 | 0.011 | 0.541 | 1.848 |
| CECO | 0.071 | 0.023 | 0.281 | 3.128 | 0.002 | 0.262 | 3.814 |
| CEGL | -1.457 | 0.238 | -0.767 | -6.120 | 0.000 | 0.135 | 7.392 |
| CEKS | -0.140 | 0.263 | -0.035 | -0.533 | 0.595 | 0.492 | 2.032 |
| CEDS | -0.225 | 0.217 | -0.138 | -1.038 | 0.301 | 0.120 | 8.304 |
| CEFO | -0.351 | 0.068 | -0.420 | -5.190 | 0.000 | 0.324 | 3.089 |
| CELG | 1.039 | 0.351 | 0.275 | 2.961 | 0.004 | 0.246 | 4.067 |
| CENG | 2.339 | 0.224 | 0.102 | 10.446 | 0.000 | 0.484 | 2.066 |
a. dependent variable: CO2 emission intensity.
Table 5.
Model summary. b.
| Model | R | R Square | Adjusted R Square | Std. Error of the Estimate | Durbin-Watson |
|---|---|---|---|---|---|
| 1 | 0.789a | 0.622 | 0.601 | 4.7926981 | 1.945 |
a. predictor variable: (Constant), CECL, CECK, CECO, CEGL, CEKS, CEDS, CEFO, CELG, CENG. b. dependent variable: CO2 emissions per capita.
Table 6.
Anova.a.
| Model | Sum of Squares | df | Mean Square | F | Sig. | |
|---|---|---|---|---|---|---|
| 1 | Regression | 6167.771 | 9 | 685.308 | 29.835 | 0.000b |
| Residual | 3744.103 | 163 | 22.970 | |||
| Total | 9911.873 | 172 | ||||
Table 7.
Coefficients. a.
| Modes | Unstandardized Coefficients | Standardized Coefficients | t | Sig. | Collinearity Statistics | ||
|---|---|---|---|---|---|---|---|
| B | Std. Error | Beta | TOL | VIF | |||
| (Constant) | 10.022 | 1.075 | 9.319 | 0.000 | |||
| CECL | 0.326 | 0.026 | 0.921 | 12.788 | 0.000 | 0.446 | 2.240 |
| CECK | -0.339 | 0.105 | -0.212 | -3.238 | 0.001 | 0.541 | 1.848 |
| CECO | 0.561 | 0.109 | 0.485 | 5.160 | 0.000 | 0.262 | 3.814 |
| CEGL | -4.008 | 1.143 | -0.459 | -3.506 | 0.001 | 0.135 | 7.392 |
| CEKS | 1.442 | 1.261 | 0.078 | 1.143 | 0.255 | 0.492 | 2.032 |
| CEDS | -3.598 | 1.041 | -0.479 | -3.456 | 0.001 | 0.120 | 8.304 |
| CEFO | -1.579 | 0.325 | -0.411 | -4.861 | 0.000 | 0.324 | 3.089 |
| CELG | 4.639 | 1.685 | 0.267 | 2.753 | 0.007 | 0.246 | 4.067 |
| CENG | 0.520 | 0.456 | 0.079 | 1.141 | 0.256 | 0.484 | 2.066 |
a. dependent variable: CO2 emissions per capita.
Table 8.
Model Summary. b.
| Model | R | R2 | Adjusted R2 | Std. Error of the Estimate | Durbin-Watson |
|---|---|---|---|---|---|
| 1 | 0.693a | 0.480 | 0.470 | 17.5873205 | 1.408 |
a. predictor variable: (Constant), BFLP, IGCP, FLCP, PGBP, HEMP, HDEP, OTCP, WDEP, SLEP, GTEP, OPHP, UWHP, DPMP. b. dependent variable: total CO2 emissions.
Table 9.
Anova.a.
| Model | Sum of Squares | df | Mean Square | F | Sig. | |
|---|---|---|---|---|---|---|
| 1 | Regression | 200493.291 | 13 | 15422.561 | 49.861 | 0.000b |
| Residual | 217447.631 | 703 | 309.314 | |||
| Total | 417940.922 | 716 | ||||
Table 10.
Coefficients. a.
| Modes | Unstandardized Coefficients | Standardized Coefficients | t | Sig. | Collinearity Statistics | ||
|---|---|---|---|---|---|---|---|
| B | Std. Error | Beta | TOL | VIF | |||
| (Constant) | 18.181 | 0.840 | 21.632 | 0.000 | |||
| BFLP | -0.001 | 0.002 | -0.065 | -0.755 | 0.451 | 0.101 | 9.921 |
| IGCP | 0.083 | 0.053 | 0.134 | 1.572 | 0.116 | 0.102 | 9.782 |
| FLCP | -0.091 | 0.013 | -0.639 | -6.827 | 0.000 | 0.085 | 11.831 |
| PGBP | 0.493 | 0.071 | 0.380 | 6.994 | 0.000 | 0.251 | 3.988 |
| HEMP | 0.112 | 0.056 | 0.213 | 1.998 | 0.046 | 0.065 | 15.306 |
| HDEP | 0.128 | 0.043 | 0.280 | 2.954 | 0.003 | 0.082 | 12.137 |
| OTCP | -1.845 | 0.345 | -0.423 | -5.345 | 0.000 | 0.118 | 8.447 |
| WDEP | 0.098 | 0.020 | 0.787 | 4.860 | 0.000 | 0.028 | 35.436 |
| SLEP | -0.038 | 0.004 | -0.858 | -9.197 | 0.000 | 0.085 | 11.751 |
| GTEP | 0.017 | 0.007 | 0.154 | 2.415 | 0.016 | 0.182 | 5.480 |
| OPHP | -0.040 | 0.005 | -0.413 | -7.393 | 0.000 | 0.237 | 4.225 |
| UWHP | 0.023 | 0.004 | 0.435 | 6.037 | 0.000 | 0.143 | 7.004 |
| DPMP | 0.974 | 0.114 | 0.533 | 8.519 | 0.000 | 0.189 | 5.299 |
a. dependent variable: total CO2 emissions.
Table 11.
Model Summary. b.
| Model | R | R2 | Adjusted R2 | Std. Error of the Estimate | Durbin-Watson |
|---|---|---|---|---|---|
| 1 | 0.412a | 0.170 | 0.154 | 5.4319320 | 1.116 |
aa. predictor variable: (Constant), BFLP, IGCP, FLCP, PGBP, HEMP, HDEP, OTCP, WDEP, SLEP, GTEP, OPHP, UWHP, DPMP. b. dependent variable: CO2 emissions per capita.
Table 12.
Anova.a.
| Model | Sum of Squares | Df | Mean Square | F | Sig. | |
|---|---|---|---|---|---|---|
| 1 | Regression | 4234.835 | 13 | 325.757 | 11.040 | 0.000b |
| Residual | 20713.132 | 702 | 29.506 | |||
| Total | 24947.967 | 715 | ||||
Table 13.
Coefficients. a.
| Modes | Unstandardized Coefficients | Standardized Coefficients | t | Sig. | Collinearity Statistics | ||
|---|---|---|---|---|---|---|---|
| B | Std. Error | Beta | TOL | VIF | |||
| (Constant) | 6.292 | 0.260 | 24.210 | 0.000 | |||
| BFLP | -0.001 | 0.001 | -0.181 | -1.671 | 0.095 | 0.101 | 9.919 |
| IGCP | 0.046 | 0.016 | 0.304 | 2.826 | 0.005 | 0.102 | 9.779 |
| FLCP | -0.016 | 0.004 | -0.467 | -3.950 | 0.000 | 0.085 | 11.829 |
| PGBP | 0.081 | 0.022 | 0.257 | 3.742 | 0.000 | 0.251 | 3.986 |
| HEMP | -0.042 | 0.017 | -0.324 | -2.412 | 0.016 | 0.065 | 15.300 |
| HDEP | 0.005 | 0.013 | 0.049 | 0.407 | 0.684 | 0.082 | 12.134 |
| OTCP | -0.392 | 0.107 | -0.367 | -3.674 | 0.000 | 0.118 | 8.445 |
| WDEP | 0.016 | 0.006 | 0.545 | 2.662 | 0.008 | 0.028 | 35.428 |
| SLEP | -0.002 | 0.001 | -0.209 | -1.771 | 0.077 | 0.085 | 11.748 |
| GTEP | -0.005 | 0.002 | -0.187 | -2.322 | 0.020 | 0.182 | 5.480 |
| OPHP | -0.003 | 0.002 | -0.125 | -1.765 | 0.078 | 0.237 | 4.225 |
| UWHP | 0.007 | 0.001 | 0.556 | 6.110 | 0.000 | 0.143 | 7.002 |
| DPMP | 0.137 | 0.035 | 0.307 | 3.883 | 0.000 | 0.189 | 5.298 |
a. dependent variable: CO2 emissions per capita.
Table 14.
Canonical correlations.
| Correlation | Eigenvalue | Wilks Statistic | F | Num D.F | Denom D.F. | Sig. | |
|---|---|---|---|---|---|---|---|
| 1 | 0.948 | 8.911 | 0.001 | 13.168 | 117.000 | 1044.880 | 0.000 |
| 2 | 0.888 | 3.717 | 0.011 | 9.308 | 96.000 | 946.621 | 0.000 |
| 3 | 0.820 | 2.059 | 0.054 | 6.922 | 77.000 | 846.382 | 0.000 |
| 4 | 0.736 | 1.183 | 0.164 | 5.111 | 60.000 | 743.798 | 0.000 |
| 5 | 0.658 | 0.764 | 0.358 | 3.664 | 45.000 | 638.303 | 0.000 |
| 6 | 0.429 | 0.225 | 0.631 | 2.197 | 32.000 | 528.953 | 0.000 |
| 7 | 0.378 | 0.166 | 0.773 | 1.846 | 21.000 | 414.040 | 0.013 |
| 8 | 0.278 | 0.084 | 0.902 | 1.279 | 12.000 | 290.000 | 0.230 |
| 9 | 0.150 | 0.023 | 0.978 | 0.670 | 5.000 | 146.000 | 0.647 |
H0 for Wilks test is that the correlations in the current and following rows are zero.
Table 15.
Set 1 Standardized canonical correlation coefficients.
| Variable | 1 | 2 | 3 | 4 | 5 | 6 | 7 | 8 | 9 |
|---|---|---|---|---|---|---|---|---|---|
| CECL | -0.158 | -0.037 | 0.275 | -0.426 | 0.106 | 0.593 | -0.867 | 0.167 | -1.188 |
| CECK | 0.111 | -0.141 | -0.077 | -0.223 | 0.188 | -1.253 | -0.068 | -0.099 | 0.470 |
| CECO | -0.302 | -0.208 | 0.962 | -0.839 | 0.884 | 0.826 | 0.273 | -0.485 | 0.504 |
| CEGL | -0.524 | -0.899 | 1.024 | 1.597 | 0.669 | 0.261 | -0.782 | 1.420 | 0.466 |
| CEKS | 0.005 | -0.673 | -0.586 | -0.942 | 0.306 | 0.034 | 0.238 | 0.176 | -0.569 |
| CEDS | 0.519 | 0.556 | -0.658 | -0.626 | -0.355 | -0.467 | 2.368 | -0.534 | -1.218 |
| CEFO | 0.195 | -0.046 | -0.115 | 0.541 | -1.257 | -0.394 | -0.108 | 0.920 | 0.496 |
| CELG | -0.774 | 0.815 | -0.800 | -0.332 | -0.098 | -0.321 | -1.193 | -0.279 | 0.534 |
| CENG | -0.111 | -0.006 | -0.093 | 0.333 | -0.941 | -0.090 | -0.011 | -1.111 | 0.094 |
Table 16.
Set 2 Standardized canonical correlation coefficients.
| Variable | 1 | 2 | 3 | 4 | 5 | 6 | 7 | 8 | 9 |
|---|---|---|---|---|---|---|---|---|---|
| BFLP | 0.434 | -0.012 | 0.353 | -0.217 | -0.136 | -1.216 | 0.449 | -0.017 | 1.505 |
| IGCP | -0.224 | -0.346 | -0.056 | 0.301 | -0.780 | 1.238 | -0.539 | -1.195 | -0.850 |
| FLCP | -0.317 | 0.281 | -0.760 | 1.435 | 0.668 | 1.040 | -0.305 | -0.511 | -0.475 |
| PGBP | 0.046 | -0.090 | -0.008 | -0.623 | 0.034 | -1.467 | -0.112 | 0.353 | -0.720 |
| HEMP | 0.479 | -0.520 | 0.366 | 0.150 | -0.457 | -0.603 | 1.634 | 1.465 | 2.843 |
| HDEP | -0.376 | 0.179 | 0.766 | 1.496 | -0.691 | 0.014 | 1.311 | 0.162 | -2.060 |
| OTCP | 0.075 | 0.075 | -0.113 | 0.091 | -0.396 | 1.470 | -0.962 | -0.993 | -0.382 |
| WDEP | -0.368 | 0.375 | 0.771 | -1.086 | 1.582 | -1.619 | -4.562 | -0.159 | 0.028 |
| SLEP | 0.172 | -1.088 | -1.471 | -0.361 | -0.153 | 1.136 | 1.438 | 0.781 | -0.009 |
| GTEP | -0.411 | 0.826 | -0.517 | -0.405 | -1.842 | -0.107 | 0.023 | -0.079 | -0.711 |
| OPHP | 0.127 | 0.311 | -0.745 | -0.138 | -0.329 | 0.838 | 0.064 | 0.560 | -0.112 |
| UWHP | -0.436 | -0.042 | 1.068 | -0.768 | 1.091 | 0.901 | 0.979 | 0.207 | 0.171 |
| DPMP | -0.160 | -0.261 | 0.134 | 0.094 | 0.836 | -1.772 | 0.773 | -0.446 | 0.526 |
Table 17.
Proportion of variance explained.
| Canonical Variable | Set 1 by Self | Set 1 by Set 2 | Set 2 by Self | Set 2 by Set 1 |
|---|---|---|---|---|
| 1 | 0.350 | 0.315 | 0.526 | 0.473 |
| 2 | 0.105 | 0.083 | 0.163 | 0.128 |
| 3 | 0.147 | 0.099 | 0.027 | 0.018 |
| 4 | 0.069 | 0.037 | 0.042 | 0.023 |
| 5 | 0.079 | 0.034 | 0.032 | 0.014 |
| 6 | 0.096 | 0.018 | 0.009 | 0.002 |
| 7 | 0.043 | 0.006 | 0.016 | 0.002 |
| 8 | 0.056 | 0.004 | 0.044 | 0.003 |
| 9 | 0.055 | 0.001 | 0.022 | 0.000 |
| 1 | In this study, primary energy sources include natural gas, fuel oil, coke, liquefied petroleum gas, kerosene, coal, crude oil, gasoline, and diesel. |
| 2 | The Green Inventory is published by the World Intellectual Property Organization to identify environmentally sound technologies based on the IPC. It divides green patents into eight categories: alternative energy patents, transportation patents, energy conservation patents, waste management patents, agriculture/forestry patents, administrative patents, regulatory or design aspects patents, and nuclear power generation patents. This study only considers alternative energy technology patents. |
| 3 | CO2 emission-related data and alternative energy patent-related data in this study are monthly data for 1995–2018 and 1998–2021. The three-year lag is because it generally takes around three years for a patent application to be granted. |
Disclaimer/Publisher’s Note: The statements, opinions and data contained in all publications are solely those of the individual author(s) and contributor(s) and not of MDPI and/or the editor(s). MDPI and/or the editor(s) disclaim responsibility for any injury to people or property resulting from any ideas, methods, instructions or products referred to in the content. |
© 2024 by the authors. Licensee MDPI, Basel, Switzerland. This article is an open access article distributed under the terms and conditions of the Creative Commons Attribution (CC BY) license (http://creativecommons.org/licenses/by/4.0/).
Copyright: This open access article is published under a Creative Commons CC BY 4.0 license, which permit the free download, distribution, and reuse, provided that the author and preprint are cited in any reuse.


