Submitted:
28 October 2024
Posted:
29 October 2024
You are already at the latest version
Abstract
One of the goals of Oman vision 2040 is to attain a 30% of renewable energy mix, mainly from solar and wind energy projects for electricity generation by 2030, in alignment with the net zero emissions commitment by 2050. The adoption of residential rooftop solar PV installations supports achieving this target. This paper aims to find the suitable regions for rooftop solar PV installations by considering the factors, such as temperature levels, dust accumulation, humidity and population density. In the Middle East countries like Oman, dust from sandstorms significantly affects the performance of PV systems and is an important derating factor to consider when evaluating their performance as discussed in this paper. This paper starts by finding the suitable regions in Oman for solar PV projects based on geographical factors and then proceeds to find the best locations in the selected region. A rooftop solar PV system is designed, analyzed its performance and Levelized Cost of Electricity (LCOE) was calculated for smart bus stop load located in the selected region’s university of technology and applied sciences (UTAS) campus using analytical method. The results obtained through analytical method were compared with System Advisor Model (SAM) software. Key findings from the study: The northern region of Oman was identified as the most suitable region to install the solar PV systems. In the northern regions, Ibri is the best location for rooftop solar PV projects compared to other locations. However other locations are also competitively suitable for solar PV projects. The LCOE of all UTAS branch locations ranges from 8.5 ¢/kWhr to 9.7¢/kWhr. Due to local weather conditions, Salalah has a higher LCOE of solar PV system than other location. After finding the most suitable locations, attractive rooftop policies in solar PV of successful countries are discussed, based on that few strong strategies are suggested to develop rooftop solar PV projects in Oman.
Keywords:
rooftop solar PV
; performance analysis
; levelized cost of electricity
; system advisor model
; policy frameworks
; Sultanate of Oman
1. Introduction
The Climate change is the biggest threat to our planet, like a war between humanity and nature. However, in this battle, humanity’s survival requires working alongside nature than confronting it. Hence, to address climate change key steps have been taken in the Paris agreement and COP 28 summit. As per the Paris Agreement, a target was set to limit global warming to 1.5°C. This target has led to set plans to triple renewable energy capacity and double energy efficiency by 2030 at 2023 COP 28 summit [1]. As a result, many countries have established the 2030 goals, including reducing emissions and taking steps to mitigate the climate change impacts.
A key aspect of these plans involves mixing renewable energy sources into the energy sector, eventually reducing the fossil fuel usage. Consequently, many countries are launching many renewable energy projects, introducing new renewable energy schemes, incentives, and policies to attract public interest, raising renewable energy research funding and creating public awareness about climate change. This global shift shows the responsibility of every individual role in protecting our environment and ensuring a sustainable future.
As per the Paris Agreement, the Sultanate of Oman is committed to reduce greenhouse gas (GHG) emissions and incorporating renewable energy mix in their energy sector. Based on this commitment, the country has planned a target to achieve net zero emissions by 2050 [2]. To achieve this target, Oman energy sector has initiated various projects to incorporate renewable energy sources. The country also aims for 11% renewable energy in its energy mix by 2025 and 30% by 2030 [3] to achieve the Oman vision 2040 renewable energy goal and the 2050 goal in timely manner. In line, with the Paris Agreement commitments Oman aims to reduce its absolute greenhouse gas emission by 7 percent by 2030 as outlined in its climate action strategy [4]. The National Strategy for an orderly transition to net zero states that emission reduction rate of 54% in 2040 and 92% in 2050 from 2021 values [5].
The Sultanate of Oman is fortunate to have renewable energy sources such, as solar power, wind power, geothermal energy and ocean energy. Among these options solar energy is preferred by the energy sector due to its advancements, affordability, drive economic diversification and market demand. When it comes to renewable energy sources Omans’s energy sector primarily focuses on photovoltaic (PV) generation than other renewable energy source. Also, Oman has implemented policies for rooftop PV systems such as Sahim rooftop solar PV initiative [6] and several solar projects have been initiated since 2020 that are expected to be operational, before 2030 [2].
Many researchers analyzed the potential of solar energy in different locations, the feasibility of rooftop solar PV, public awareness of the solar PV transition, policies to promote solar PV and the overall scope of solar energy in Oman.
Oman region is classified as a desert with high dust accumulation, Al siyabi et al. conducted an experimental analysis on the effect of soiling on a 2MWp of car park PV plant at Muscat, Oman and their result shows that 5.6% monthly electricity generation reduced by 7.5% of soiling percentage and 10.8% generation reduced by 12.5% of soiling-percentage [7]. Dust accumulation on solar PV was tested in six cities of Northern Oman and it was found that Liwa, Sohar and Muscat exhibit the higher percentage of dust accumulation due to industrial activity and more vehicles makes the air pollution. In contrast, Al-Khabourh, Suwaiq, and Shinas, which are far away from the industries and limited vehicles experienced the limited dust accumulation. Hussein A. Kazem and Miqdam T. Chaichan recommended that sodium solution is the best option to clean the solar PV in industrial cities, while water washing is sufficient for the other cities [8].
The performance of Solar PV cell material in desert regions is different from that in other regions. The best suitable solar PV system for Oman and the best solar PV site among 25 locations in Oman were identified using HOMER software. The research found that the best type of PV is the Ingeteam 1164kVA with generic PV. The best suitable solar PV sites are Marmul followed by Fahud, Sohar, and Qairoon Hairiti, due to their relatively low Cost of Energy, high clearness index and high level of solar radiation [9].
A total of 130 modules were located in three different region such as Moderate climate, Hot and Humid climate, Hot and Dry Climate places and conducted field study to analyze the degradation rate in these regions. The findings indicated that higher degradation rates and Encapsulant discoloration were observed in hot and humid, hot and dry areas. This study recorded that 1.96% per year of degradation rate and 93% of old age panels observed with Encapsulant discoloration. Based on the research findings Honnurvali, Mohamed Shaik recommended that organic PV cell material exhibit higher temperature sensitivity than traditional PV cell material. Additionally, he recommended to avoid Encapsulant discoloration and delamination in PV modules can be avoided by using strong adhesive strength material between the glass and Ethylene Vinyl Acetate (EVA) [10]. A grid tied 1.4kWp solar desert type PV system was installed at sultan Qaboos University, Muscat. It was monitored for a year and recorded the results for analysis. The result revealed that the monthly average daily capacity factor reached 17% which is higher compared to similar systems installed in other locations world-wide. This study also investigated the impact of dust on the desert type PV, which showed that the percentage of annual energy reduction was only 10% [11].
Zero Energy building (ZEB) is one of the modern concepts for energy saving strategy, solar PV is one of the main components used in ZEB. In Oman, as a demo Zero energy building is constructed and solar PV performance on ZEB was analysed in some research papers [12-14]. A 20kW solar PV is installed on the rooftop of ZEB building located at Sultan Qaboos university and analysed the building energy performance and energy balance. The result showed that the building was less than 3% from achieving its net zero building status [13]. AL Badi investigated the performance and dust impact on the Eco house rooftop solar PV. The results illustrated that, since the rooftop solar PV is placed in a low dust accumulation area, the percentage of energy reduction is minimal. Additionally, the author compared its performance results with other international researchers. The findings revealed that the average daily capacity factor reached 15%, which is either higher or similar to other systems installed in various locations worldwide [14].
A rooftop PV-grid independent system is feasible in Oman by considering reduction of energy demand per household, the introduction of support policies and a reduction in battery costs [15,16]. A 1MW grid connected solar PV in Adam city, Oman was assessed. The assessment results proved that the selected location is promising for solar PVinvestment as it has good annual energy yield and capacity factor [17].
Valuable insights for Oman’s energy sector policymakers to forecast potential growth, identify effective renewable energy policy instruments and evaluate public interest in the solar energy transition are important for shaping the renewable energy mix in energy sector, as assessed in [18]. The results revealed that 95% of residents andcommercial units are willing to use solar PV in the future. The authors identified the main barriers are high installation cost, high maintenance cost and lack of awareness.
The major electricity consumption in Oman is residential sector [19]. Rooftop solar PV supports greatly during daytime peak loads and summer period loads [20]. Raising public interest and awareness about rooftop solar PV can be effectively achieved by installing systems at commercial places and academic institutions. Since students represent the future of the country, equipping them with hands-on experience of solar PV technology at their universities or schools not only educate them but also contributes spread awareness among the general population. This approach can facilitate the seamless adoption of rooftop PV systems in residential areas.
This paper provides a step-by-step approach, starts from selecting the suitable locations for solar PV projects to proposing successful strategies for the adoption of rooftop solar energy technology in the residential sector. As Oman is a desert country, the study starts by assessing the factors that affect solar PV performance in desert regions, followed by identifying the suitable regions in Oman for rooftop solar PV project in section 2. After identifying the suitable regions, Section 3 covers the design and assessment of rooftop solar PV performance in the selected region through a detailed case study. This case study focuses on the design and performance analysis of a rooftop solar PV system for a smart bus stop located at UTAS-Ibri branch. Section 4 presents the performance analysis and LCOE assessment of the solar-powered smart bus stop across various UTAS branches located in Northern region of Oman and Dhofar region. In Section 5, the results are discussed and compared with SAM results, and successful solar polices from other countries are reviewed. Based on these, a few strong strategies are suggested to promote the solar PV projects in Oman.
2. Factors for Assessing Suitable Regions for Solar PV Projects Across Oman
Oman is blessed with abundant solar and wind energy resources, which strengthens the confidence to establish the solar PV systems throughout the Sultanate of Oman. It experiences the average 8 hours of sunshine per day during winter and up to15 hours per day during summer, with an average radiation per day approximately 5 kWh/m2 [21]. The country has excellent solar intensity, with over 342 sunny days per year [22]. Solar PV generation depends not only on solar irradiation but also on the relative humidity of a location. Higher relative humidity reduces solar PV output. In Oman, coastal regions experience higher relative humidity during summer compared to the dry inland regions, which reduces the PV output. Frequent sand and dust storms in Oman, reduces the intensity of solar radiation, resulting in decreased solar power generation [23-24]. Oman geographical features, such as mountains, arid deserts, limited water resources, and challenging terrain contributes to a sparse population and lower energy demand. Therefore, the following main factors are considered to find the suitable region for solar PV projects in Oman: solar irradiation level, temperature coefficient, humidity levels, dust impact and population density. In this section, the factors affecting solar PV projects are discussed and an analysis of suitable regions across Oman is presented.
2.1. Solar PV irradiation level and Temperature coefficient
Figure 1 depicts the global horizontal irradiation (GHI) period of Oman, showing that this country has high irradiation level. This spatial graph is sourced from SolarGIS [25]. Normally, the solar irradiation level required to generate considerable electrical power from solar PV panel ranges between 100 -200 W/m2 [26]. The daily irradiation level across the country ranges from minimum 4.7 kWh/m2/day to a maximum 7.470 kWh/m2/day [9]. These values are highly favourable to produce electrical power from solar panels.
Additionally, the figure 1 highlights that the minimum and maximum solar irradiation levels are experienced in the Dhofar region. Salalah receives the minimum GHI compared to other locations. Though it receives minimum GHI, that itself enough to produce significant electrical power from solar panels. The main areas like Muscat, Nizwa, Ibri and Sohar receive more than 2000kWh/m2 annually.
Solar PV output depends on the GHI. Practically, a simplified model [27] is used to calculate solar PV DC output (Pdc),
(1)
Where:
PDC - DC power output of the PV panel (W)
Prated - Rated power capacity of the PV panel at Standard Test Conditions (STC) (W)
Standard test conditions (STC) - 1000 W/ m2 solar irradiance, 25 cell temperature, air mass is 1.5, and ASTM G173-03 standard spectrum.
GHI - Global Horizontal Irradiance at the location (W/m²)
GSTC - Solar irradiance at STC, typically 1000 W/m²
β - Temperature coefficient of power for the PV module (per °C). This is typically a negative value, around -0.004 to -0.005 per °C for most silicon-based panels.
Tcell - Operating temperature of the PV cell (°C)
Tref - Reference temperature at STC, usually 25°C
Solar PV panel output degrades due to the operating temperature of PV cell. Therefore, Oman’s high temperature cause greater degradation of solar PV output compared to European Countries [28].
Temperatures, across the country fluctuate due to a mix of terrains and oceanic effects. The highland regions in the north and south generally moderate temperatures, throughout the year [29]. In Oman the highest temperatures fall between 32°C and 48°C, both during daytime and nighttime are typically experienced in May and August. On the other hand, the lowest air temperatures ranging from 15°C to 23°C between December and February. Notably the inner and central deserts of Oman exhibit peak daytime temperatures around 50°C during summer.
Temperature significantly influences the PV panel performance and its overall efficiency [30], Although Oman has excellent solar irradiation, due to its high temperature levels, the northern part and Dhofar are more suitable for solar PV installations than the inner and central deserts of Oman.
2.2 Humidity level
The existence of moisture in the atmospheric air scatters the sunlight, disrupts the path of solar irradiation falling on the solar surface, resulting in reduced solar PV output performance [31-32]. This situation can impact the efficiency of panels situated in regions, with consistently high humidity levels like coastal area in Oman.
Figure 2 depicts the humidity levels in Oman. A study conducted by [21] observed that coastal regions experience high humidity in winter, while the Arabian Sea coasts have high humidity levels, exceeding 85% during summer in Oman. The study suggests that interior regions are more favourable than areas, for implementing PV projects.
2.3 Dust accumulation
Dust accumulation and soiling of solar panel affects the solar PV performance significantly [33]. In Oman, there are many factors to cause dust accumulation, such as emissions from power plant chimneys, smelters from the industry, movement of vehicle and sandstorms. Middle east countries often experience heavy sandstorms [34], which lead to more dust particles settling on solar panels, which severely affects their performance. Sandstorms are a more dangerous factor than others in affecting solar PV performance in Middle East countries. They have a large influence in reducing the solar radiation to reach the ground due to air turbidity and also cause heavy dust deposition on solar panels.
Omans land area covers a total of 309,500 kilometres featuring topographic elements including valleys and desert that make up 82% of the land mountain ranges occupying 15% and coastal regions comprising 3%. The vast desert terrain significantly influences the country’s climate and environment leading to sand and dust storms. The expansive desert areas pose a challenge when it comes to PV installation due, to the exposure to sand dust. Fine sand particles are easily stirred by winds. When the surface is heavily encrusted stronger winds are required for sand movement to occur [35].
Oman has different types of sand across its regions shown in Table 1. The Rub'al Khali and Wahiba sands are the primary types, with their fine and loose texture that make them easily swept by the wind. Moreover, there are other sand types are coarser and denser, in nature and necessitate stronger winds to be shifted around.
The average wind speed, in Oman ranges from 10 to 20 km/h throughout the year. Can escalate during summer and winter with occurrences of Shamal winds. These winds carry an amount of dust and sand. During the summer season they often bring hotter weather conditions [36].
Majority of Oman’s topography consists of Rub’ al Khali and Wahiba sands, those areas may not be suitable for installing solar panels due to strong sand deposition. Areas with coarse, gravel sand are considered more suitable for solar PV projects. In these areas, dust accumulation on solar panels due to industrial emissions and vehicle movement. Regular cleaning of solar panels with water can help remove normal dust deposition. If sand deposition more on the solar PV panels, cleaning can be done effectively by applying electrostatic force methodology [37].
2.4. Population Density
In 2024 Omans current population stands at 5.3 million with a population density of 17 peoples, per km² [41]. The majority of the population is concentrated in Northern Oman while coastal areas have a moderate population density. The central and interior regions of Oman have very low population densities due to their predominantly desert landscape and harsh climate shown in Figure 3. The highest population concentration is in the capital, Muscat. Most of the cities are in the northern part of Oman and Salalah in Dhofar region has the highest population density [41]. Thickly populated areas require residential solar PV projects to meet the peak demand and ensure grid stability. The Northern part of Oman, coastal areas and Salalah are the most populated areas in Oman, which are suitable for solar PV projects. Off-grid solar PV projects are suitable for the central areas of Oman.
2.5. Discussion on Solar PV project suitability in various regions across Oman
By considering factors such as solar irradiance, temperature, humidity levels, dust deposition and population density, the solar PV project suitability in various regions of Oman is analysed and summarised in Table 2. The most suitable locations for Solar PV projects are cities in the Northern part of the Oman and coastal areas due to their high solar irradiance and population density. These areas, with well-developed infrastructure, support the integration and maintenance of solar PV systems. Coastal areas have higher humidity than inland areas. The coarse, white sand and gravelly sand in these regions require strong winds to be deposit on solar PV panels. The humidity and dust due to sand, industry smelters and vehicle movement can be manageable with proper cleaning and the latest technology.
The Dhofar and Salalah regions experience high humidity during the Khareef season, while temperature and dust accumulation are moderate, making these regionsmoderately suitable for solar PV projects. Also, Salalah is one of the attractive tourist cities and the third most populated city in Oman, makes solar PV projects economically viable due to its active economic environment.
By considering solar irradiance and low humidity, mountain regions and central Oman are suitable for solar PV projects. But the low population density and high temperature makes solar PV projects less feasible and economically unviable. However, off-grid solar PV projects could be feasible in these areas to provide electricity for the lesser population.
3. Design and Assess the Rooftop solar PV performance in Selected Regions
Based on the table 2, Northern Oman regions and Salalah in Dhofar region are identified as the most suitable regions for solar PV projects. To assess the solar PV performance in each suitable region, eight UTAS branches were selected for case study due to their strategic locations. Table 3 and Figure 4 presents the name and locations of the UTAS branches across Oman. A solar PV powered smart bus stop is designed for UTAS-Ibri branch, and their performance is analyzed using analytical method.
3.1. Energy Demand of the Smart Bus stop
This bus stop is planned to be located within the university campus and serves as a waiting area for female students. Its usage depends on the university’s working hours typically starting with classes at 8 am and ending at 4.00 pm. During breaks between classes female students can sit inside the smart bus stop. The main electrical loads of this bus stop include a 1-ton AC unit, LED lights, a water dispenser and a LED TV. The AC unit and LED lights are equipped with motion sensors. When students occupy the bus stop, all these loads operate at capacity. However, if no students are inside, the AC automatically switches off while the LED lights continue to operate at low intensity.
The bus stop is usually occupied by students from 10 am to 4 pm each day. The operating hours of AC and water dispenser are determined based on when students are available in the bus stop prevailing weather conditions especially during peak summer months and summer vacation holidays such as July and August. In peak summer periods like May and June, when temperatures soar high, the AC and water dispenser have longer operating hours to ensure comfort for the occupants. On the other hand, during vacation holidays in July and August when fewer students use the bus stop power consumption is minimized.
The energy needs of the bus stop are categorized into four groups according to their power consumption as outlined in the table 4. Table 4 displays the operating hours and power consumption for each month at this bus stop. During vacation periods, it isestimated that the bus stop uses 17.73 kWh of power per month. However, during peak summer months, power consumption significantly increases to approximately 324.22 kWh.
3.2. Design of Solar PV system for Smart bus stop load
3.2.1. Sizing of Solar PV Panel
The daily power consumption of the smart bus stop depends on climatic conditions and university working hours. During peak summer, energy consumption of smart bus stop is more due to the continuous operation of heavy loads. While designing the solar PV system, peak summer energy consumption is considered for calculation.
The system loss compensation factor accounts for all the losses in the solar PV system, from solar irradiance on the solar PV panel to the final AC output power to the load. These losses and their typical values are listed in the Table 5. Temperature losses, dust and dirt losses are significant due to high temperatures and frequent sandstorms in Oman. Shading loss is minimal due to the lack of cloud formation. Total system losses are approximately between 15% to 25% [43-45]. For this calculation, a 15% system loss is considered.
It is the number of sun hours per day (Hrsun) that the global horizontal irradiance is equivalent to 1000 W/m². The smart bus stop is assumed to be located at the UTAS- Ibri Branch. The GHI in Ibri, approximately 6.5 kW/m²/day, is considered using the one-sun insolation (1000W/m²) approach. Ibri Sun hours, as calculated in equation (2)
(2)
In solar PV calculations, the number of panels required depends on the daily demand requirement (Edaily), loss compensation factor (PVsystemloss), and sun hours per day (Hrsun). The demand requirement varies based on the season and university timings, with the maximum demand considered for this calculation. The solar PV panel size (PVsize-req) required is designed for peak summer load, as this period consumes the most energy. In equation (3), peak summer energy consumption is considered for daily energy consumption.
= 2.86kW (3)
The number of panels (Npanel-req) needed depends on the size of the Solar PV array calculated in Equation (4). A 550 Wp canadian Solar Panel is considered for Equation (4). 550Wp canadian solar panel characteristics data [46] is presented in Table 6. I-V curve of canadian solar panels is shown in Figure 5.
~ 5 Panels (4)
Based on the calculations, a total of 5 panels are required. The next step is to verify if the size of the solar panels can fit on the bus stop rooftop.
The bus stop design being considered is rectangular and has a roof size of up to 6.5 meters by 4 meters. It is planned to be located near by the one of the entrances of the university shown in Figure 6. When considering the installation of a solar panel on the rooftop, three critical factors come into play: roof space, tilt angle and azimuth angle. The recommended tilt angle falls within the range of 20° to 25° for optimal performance and the azimuth angle should be set at 180 degrees for maximum power generation. However, due to space limitations, the long side (2.266m) of the panel will align parallel to the length (6m) of the rooftop, resulting in an azimuth angle of 180° in the proposed location at UTAS- Ibri branch.
The designated space on top of the bus stops rooftop can accommodate four panels with a power rating of 550Wp each. Therefore, a 2.2 kW solar panel is horizontally positioned on the bus stop rooftop with a 21° tilt angle facing south and a 180° azimuth angle for optimal energy efficiency. Optimal solar PV design result for the smart bus stop is presented in Table 7. Figure 6 provides a top view illustration of the bus stop rooftop with the proposed solar PV system outlined in this paper. The four panels are connected to the on-grid inverter. If the solar PV system not able to generate sufficient power to meet the bus stop's electricity demand, energy will be sourced from the grid through an on-grid inverter. Based on the data in Table 4, solar PV generation meets the energy needs for most months, except during the peak summer season. During this time and when there is low sunlight, smart bus stop systems will import the energy from the grid.
3.2.2. Sizing of Inverter
For an on-grid inverter with an MPPT controller required for the 2.2 kWp solar panel, sizing depends on the solar PV output and peak load. The Maximum DC input power of the inverter is equal to the maximum output power of the solar PV array (PVarray), as calculated in equation (5),
(5)
Compatibility between Solar PV array and the inverter assessed by considering the derating power (PVderated) of the solar PV panel. Mainly Solar PV output power derated due to: Manufacture tolerance of the panel (PVtol), Dust deposition (PVderate-dust),Temperature effect (PVderate-temp), as calculated in equation (8) [47]. Cell temperature (Tcell-temp) can be determined using the equation (6)
(6)
(7) (8)
This array can be connected to an on-grid inverter with an output rating (Invrating), and it is calculated in equation (9)
(9)
3.2.2. Voltage matching between the array voltage and the inverter input voltage
The actual input voltage to the inverter form the solar PV must be within theinverter’s specified voltage range for efficient operation [49].
The maximum input voltage of an inverter depends on the open circuit voltage (Voc) of the solar PV. At low temperatures, the open circuit voltage increases. This increased voltage should not exceed the inverter’s maximum input voltage.
The minimum input voltage of an inverter depends on the maximum power point voltage (Vmp). As the temperature increases, Vmp decreases. This reduced Vmp does not drop below the inverter’s minimum input voltage. The Canadian solar panel temperature characteristics are shown in Table 10 to verify the voltage range of the inverter.
Minimum voltage allowed to the inverter (Vmp-inv) is calculated using equations (10-11)
(10)
(11) Therefore, Minimum number of panels (Nmin-module) in a string to maintain minimum inverter input voltage is calculated in (12),
(12)
Normally, lowest temperature in Oman is around 20°C.
Maximum open circuit voltage at Minimum temperature (Voc-tmin) is calculated in (13),
(13)
Maximum number of panels (Nmax-module) in a string to maintain Maximum inverter
input voltage (Vmax-inv) is calculated in (14)
(14)
The Minimum and Maximum number of panels in a string is calculatedusing equations (10-14) to match the array voltage to the inverter voltage range is calculated and result is shown in Table 11. A proposed smart bus stop PV string must consist of between 3 to 12 panels in a string. According to the calculation, four 550Wp panels are connected in series to form a string.
3.2.3. Cable sizing
Cable sizing is determined by the DC current (Idc-cable) flowing through it. Four solar panels are connected in series to form an array, with a cable running from the solar array to the inverter. The cable sizing is calculated using equation (15).
(15)
For the above calculation 10mm2 DC cable is suitable for 70m to 100m length.
4. Performance analysis and Economic analysis of Solar PV System
4.1. Performance analysis
4.1.1. Solar Array output
The Solar PV output (1) is modified due to various factors such as: Manufacturetolerance of the panel and dust deposition presented in (16). The array output (Parray) is further modified when it is converted to AC energy due to cable loss, inverter efficiency and AC system loss. The total AC energy output (Pac) per day is calculated using the equation (18). The results of solar array output for smart bus stop, Ibri, are shown in Table 12.
(16)
(17)
(18)
(19)
4.1.2. Specific Energy yield
It is a measures the annual energy yield () relative to the total installed capacity, calculated using equation (20).
(20)
4.1.3. Performance ratio
Performance ratio (PR) is used to measure the performance of the unit by considering losses in the system and calculated using equation (21),
(21)
4.1.4 DC Capacity factor
DC Capacity factor (CF) measures the solar energy generation per day relative to the maximum capacity of the solar PV system, calculated using equation (22),
(22)
4.2. Levelised Cost of Electricity of the Solar PV system
The economic feasibility of solar electricity is analysed by the levelized cost of electricity (LCOE) of solar PV system [51-52]. The basic formula is shown in (23).
= (23)
Total lifetime cost and energy production is assessed using discount rate. This variable is critical variable, used to discount future cash flows back to their present value, it reflects the project’s capital cost [53].
Solar PV cost: four 550 Wp Canadian solar panels were purchased at a cost of around $2400, including import taxes and GST. The current market rate for solar PV is approximately $0.28 per watt.
Inverter cost: An on-grid inverter was purchased at a cost of $1700, including all taxes. The solar PV panels and inverter constitute the major portion of the investment. Installation labour and miscellaneous costs add up to $220.
Investment cost (It): It includes solar PV cost, Inverter cost and Installation Labour and Miscellaneous cost
Operation cost (Ot): This cost includes general monitoring using equipment and software. It covers electricity needed for monitoring equipment, communication systems, and auxiliary components. A specialized application is used to monitor solar PVperformance from both mobile and desktop devices. Operation costs are considered to be 0.5% of the total capital cost.
Maintenance cost (Mt): Regular water cleaning is recommended for 2.2kW solar panel. Maintenance cost includes the cleaning labour cost, inspection cost and service cost. A cost of 1% of installation cost per kW is considered for maintenance.
Replacement cost (Rt): A on grid inverter is used in this solar PV system to import power from grid when solar PV power it is not enough to meet the demand of smart bus stop. The typical lifespan of an inverter is 10 years, and replacement costs are considered every 10 years over the project's total lifespan, amounting to 10% of the total investment cost.
Financing cost (Ft): Currently, there is no specific policy to provide financial support such as initial loans, lower interest rate for residential rooftop solar PV projects. Therefore, financing cost is solely based on the annual discount rate, which is 3% in this case.
Based on the calculations above, the LCOE of solar PV in UTAS Ibri branch is determined and required data tabulated in Table 13.
4.3. Performance analysis and Economic analysis of solar powered smart bus stop at various UTAS branches
4.3.1. Performance analysis
To assess the efficiency of solar photovoltaic systems across various UTAS branches, it is assumed that the same set up of Canadian solar panels, cables, room sizes, loads, and inverters are used in the smart bus stop at all UTAS branches. The data required to evaluate the solar array's performance has been collected from System Advisor Model (SAM).
During the peak summer months from May to August spanning 120 days as depicted in Table 14 the performance of solar PV panels at various branches is detailed. At high temperature, the glass over of the solar PV panels tends to absorb more heat, which leads to reduces the output. The dust derating factor is decided by the impact and frequency of the sandstorms in the corresponding areas. Desert regions like Ibra, Nizwa, and Ibri are frequently experienced sandstorms leading to more dust accumulation on solar panels, which reduces their performance. Coastal regions like Al Musannah, Shinas, Muscat and Sur have moderate amount of dust and salt deposition on solar panels reduces their output. During the summer, dust deposition on solar panel located in Salalah is lesser compared to other branches due to Khareef season begins in Salalah. As a result, solar panel in Salalah has lower dust derating factor and Ibri has higher dust derating factor.
During the summer in Oman, Salalah experiences the Khareef season which is like monsoon, with frequent mist, light rain and fewer hours of sunshine, results lesser solar energy production than other regions. While Ibri has higher irradiation than other places, its solar PV energy generation is reduced due to the temperature derating and frequent sandstorms. According to derating factor, Salalah has a lower than other branches, however lesser sun hours result in lesser solar energy compared to other branches. The Coastal area’s solar PV generate more solar energy compared to other areas. Among all the branches Muscat branch solar PV generates more energy during summer.
The derating factor caused by dust can be further minimized through regular cleaning. The smart solar PV bus stop, which has four panels, does not require advanced technology for maintenance. since it's situated on a university campus where the maintenance staff can regularly clean the panels. As a result, a 5% reduction in power output due to dust accumulation is assumed. Consistent cleaning leads to enhanced solar energy generation, as shown the Table 15. This results in a significant increase in solar energy yield at various UTAS branches, particularly in Ibri, and an improvement in the performance ratio.
The temperature related derating factor is increased due to the reduced temperature during the non-summer period, which increases the solar output. However, during this period, the solar array output per day is reduced due to the less sun hours and lower solar irradiance, as shown in Table 16. All branches generate nearly equal amount of solar energy output. The performance ratio of solar PV systems in all branches are improved due to the increased derating factor.
During the non-summer period, dust accumulation is lower compared to the summer period. Consequently, 3% reduction factor is assumed for dirt in this analysis. Regular cleaning enhances the energy yield of the solar PV system, as indicated in Table 17.
The total energy yield throughout the year fluctuates depending on factors such as sun hours, temperature, and dust accumulation. Figure 7 illustrates the annual energy yield at various UTAS branch locations, comparing scenarios with regular cleaning versus without cleaning of solar PV panel.
The total AC energy output of the solar PV systems located at various branches for the first year is presented in Figure 8. Depending on the location and environmental conditions, AC energy generation from solar PV systems of the same capacity ranges from 4243.44 kWh to 4841.34 kWh. Ibri has highest AC energy generation due to long sun hours.
4.3.2. Economic analysis
The LCOE of solar PV systems at various UTAS branches is calculated using Equation (23). The LCOE ranges from 8.5 ¢/kWhr to 9.7¢/kWhr. Due to local weather conditions, Salalah has a higher LCOE of solar PV system than other branches. Except for the Salalah branch, the LCOE of solar PV systems at all other branches nearly equal LCOE , as shown in Figure 9.
5. Results and Discussion
5.1 Design and Analysis of Solar PV system for smart bus stop using SAM software
The System Advisory Model (SAM) is specifically designed software for modelling and analysing the performance of both on grid and off-grid solar PV projects. This software is used to model, analyse the solar PV systems for the smart bus stop, and its results are compared with the section 4 results. Design procedure, parameter setting and device selection of the solar PV system using SAM is shown in Table 18. Since the specified Canadian solar PV panel and specified sun grow inverter is not available in SAMdatabase, equivalent solar PV panel and Inverter is selected for analysis.
5.2. Comparison of Analytical method results and SAM results
5.2.1. Annual Energy yield:
The annual energy output of the solar PV, as calculated using Equation (20), and as obtained from SAM, is shown for various UTAS branches in Figure 10. A slight difference exists between the SAM result and the calculated results due to slight variations in the equivalent device’s characteristics selected from the SAM database and the real-time devices characteristics. Both methods show that Ibri branch provide the maximum solar energy output, while Salalah register the minimum solar energy output.
5.2.2. Performance ratio:
Figure 11 shows the performance ratio during the summer period, the non-summer period, and the SAM results. SAM considered a whole year to calculate the performance ratio. The degradation rate due to dirt is considered constant, assuming regular cleaning throughout the year and calculated performance ratio for summer period and non-summer period using equation (21). During the summer, the performance ratio is around 0.73 due to temperature effects, while during the non-summer period, it is approximately 0.80. The SAM results also proves that the performance ratio is around 0.8 for all branches.
5.2.3. DC Capacity factor
Figure 12 displays the DC Capacity factor is calculated using equation (22) for the summer period and non-summer period, along with the SAM results. During the summer, the DC capacity factor is higher compared to the non-summer period due to increased number of sun hours.
5.2.4 LCOE
Figure 13 displays the LCOE based on calculations using equation (23) and the SAM result. Both results show nearly the same values. All UTAS branches have a LCOE of around 8 ¢/kWh except for Salalah, it has the highest LCOE 11.68¢/kWh.
Electricity generation in Oman mostly depends on natural gas, with the estimated Levelized Cost of Electricity (LCOE) ranging from $30 to $40 per megawatt hour, as stated in a report by the International Energy Agency [54]. On the other hand, solar photovoltaic systems in various location of Oman have an LCOE of around $80 per megawatt hour from the study. While natural gas provides a cost efficient and reliable energy source, concerns about its environmental impact are driving the adoption of alternative energy solutions. Despite solar PV currently having a higher LCOE, advancements in technology and market trends are projected to reduce these costs, making solar PV a more sustainable and competitive choice for the future. This case study offers an information on solar PV power generation on rooftops in optimal locations in Oman, considering various factors. The northern regions of Oman are the most suitable locations to install the solar PV systems. In the northern regions Ibri is the best locations for rooftop solar PV projects compared to other locations. However, other locations are also competitively suitable for solar PV projects. This case study highlights that solar PV is a choice for sustainable energy and aligns with Omans renewable energy goals of Oman Vision 2040. However, the lack of a policy in Omans’s energy sector hinders the promotion of rooftop solar PV.
5.3. Attractive Solar PV strategies for Oman
Rooftop solar PV systems have been successfully implemented in many countries and provide good revenue to both the owners and the government due to attractive and supportive policies and regulations. Hence, a strong policy framework and regulations are important to make the public awareness and to establish the rooftop solar PV system.
Table 19 highlights the attractive policies that have been implemented over the years in the world's leading solar PV countries. A review of policies implemented by leading solar PV countries shows that many initially promoted solar power by introducing fixed FiT, which effectively supported the early adoption of solar systems. As the cost of solar PV systems decreased, these policies were updated accordingly. Subsidy programs for solar PV installation provided financial support to homeowners, driving greater participation in solar initiatives. Some countries have implemented a solar PV business model for low-income groups, allowing people to purchase solar PV system through low interest loans and earn money by selling the electricity through net metering [80]. Also, the government initiate and invest in research and development and launches public awareness programs. Today, the top rooftop solar nations are advancing to the next level by transforming entire cities into green energy or zero-energy buildings, supported by government financial assistance and subsidies. In Oman, a greater number of Oman Nationals are willing to use residential solar PV, but they are not aware of solar energy programs [18]. Therefore, suggesting the following strategies based on successful strategies, best practices from other countries, and their policies and regulation can enhance the promotion of rooftop solar PV systems and to support to frame the policy.
- Design a dynamic FiT to export solar power to the grid, allowinghomeowners can sell their excess solar power through net metering at a dynamic tariff.
- Allocating subsides to install rooftop solar PV systems in home reduces the financial burden on homeowners.
- Implementing a solar PV business model for economically weaker sections to help financially by allowing them to sell the solar power.
- Introducing an incentive to compensate for solar electricity as it is expensive compared to existing electricity tariff makes it economically sustainable.
- Allocate special funding and launch a public awareness program onresidential solar PV
6. Conclusion
This study assessed the suitable region in Oman for installing residential rooftop solar PV projects to support Oman vision 2040’s renewable energy goal. The key factors considered to find the best regions include solar PV irradiation level, temperature coefficient, humidity level, dust accumulation and population density. The initialassessment revealed that mountain regions and central part of Oman have hightemperature coefficient, dust accumulation and sparse population densities making it less feasible, for installing solar PV projects. With the exception of humidity, the northern region and Dhofar region exhibit favorable conditions in terms of all other factors. A case study of rooftop solar PV system for a smart bus stop planned to be in UTAS- Ibri branch is designed and, its performance is compared with that of other UTAS branches in various locations in Northern region and Dhofar region. The findings showed that performance ratio at all locations decreases during the summer compared to non-summer periods due to high temperature experienced in Oman. Ibri is the top location in Oman suitable for solar PV projects. Their annual energy output is further increased by regular cleaning of the solar PV panels. Other locations in the Northern region also show a good annual energy yield from solar PV. Although Salalah experiences less dust impact, its fewer sun hours result in less solar energy yield compared to other locations. AC energy generation from the same capacity solar PV system ranges from 4243.44 kWh to 4841.34 kWh at various UTAS branches located in Northern region of Oman and Salalah. The LCOE of all branches around 8¢ per kWh except for Salalah. The performance analysis is verified with SAM software, which shows almost the same results as the analytical method. Finally, the rooftop policies and regulation of successful countries are discussed and strategies to promote rooftop solar PV in Oman were suggested, such as net metering, FiT, subsidies and low interest loan for installing solar PV projects. The findings of this paper support Oman’s energy sector in achieving their 2030 renewable energy goal and in framing renewable policies in the future.
Funding
This research was funded by the Ministry of Higher Education, Research and Innovation (MOHERI), grant number MOHERI/BFP/UTAS/2022.
Institutional Review Board Statement
Not applicable
Informed Consent Statement
Not applicable
Data Availability Statement
All relevant data in the manuscript are cited in thereference.
Acknowledgments
We would like to thank to the MOHERI for their funding and support of this research. Their commitment to renewable energy research has been instrumental in the success of this project.
Conflicts of Interest
The authors declare no conflicts of interest.
References
- Darby, Sarah J., Geoffrey P. Hammond, and Jianzhong Wu. "Briefing: Stocktaking global warming: the outcomes of the 2023 Dubai Climate Summit (COP28)." Proceedings of the Institution of Civil Engineers-Energy (2024): 1-12.
- Power and water Procurement’s 7-year statement (2023 -2029), Issue 17, NAMA Power and Water Procurement Co. Available Online: 7 Year Statement - Nama Power & Water Procurement (Accessed on 21 October 2024).
- Renewable Energy | Authority for Public Services Regulation. (Accessed on 21 October 2024).
- Charabi, Yassine. Deep near-term mitigation of short-lived climate forcers in Oman: grand challenges and prospects. Environmental Science and Pollution Research 2023, 30, 3918–3928. [Google Scholar] [CrossRef] [PubMed]
- The Sultanate of Oman’s National Strategy for an Orderly Transition to Net Zero November 2022(oma223284E.pdf (fao.org)) (Accessed on 21 October 2024).
- Sahim Page | Authority for Public Services Regulation (apsr.om) (Accessed on 21 October 2024).
- Al Siyabi, Idris, et al. "Effect of soiling on solar photovoltaic performance under desert climatic conditions." Energies 14.3 (2021): 659.
- Kazem, Hussein A., and Miqdam T. Chaichan. The effect of dust accumulation and cleaning methods on PV panels’ outcomes based on an experimental study of six locations in Northern Oman. Solar Energy 2019, 187, 30–38. [Google Scholar] [CrossRef]
- Abdul-Wahab, Sabah; et al. Selection of the best solar photovoltaic (PV) for Oman. Solar Energy 2019, 188, 1156–1168. [Google Scholar] [CrossRef]
- Honnurvali, Mohamed Shaik. "Photovoltaic challenges and recommendations-A case study for Oman." PhD diss., 2023.
- Al-Badi, A. H. Selection of the best solar photovoltaic (PV) for Oman. Energy for Sustainable Development 2018, 47, 107–113. [Google Scholar] [CrossRef]
- AlBusaidi, Ahmed Said, Neha Cherattuparabil Anil. Performance Analysis of a 22.8 kW PV solar system of the HCT ECO house in Oman. International Journal of Renewable Energy Research (IJRER) 2022, 12, 48–57. [Google Scholar]
- Al-Saadi, Saleh Nasser, and Awni K. Shaaban. Zero energy building (ZEB) in a cooling dominated climate of Oman: Design and energy performance analysis. Renewable and Sustainable Energy Reviews 2019, 112, 299–316. [Google Scholar] [CrossRef]
- Al-Badi, Abdullah. Performance assessment of 20.4 kW eco-house grid-connected PV plant in Oman. International Journal of Sustainable Engineering 2020, 13, 230–241. [Google Scholar] [CrossRef]
- Al-Saqlawi, Juman, Kaveh Madani. Techno-economic feasibility of grid-independent residential roof-top solar PV systems in Muscat, Oman. Energy Conversion and Management 2018, 178, 322–334. [Google Scholar] [CrossRef]
- Alhousni, Fadhil Khadoum; et al. A review of PV solar energy system operations and applications in Dhofar Oman. AIMS Energy 2022, 10, 858–884. [Google Scholar] [CrossRef]
- Kazem, Hussein A.; et al. Techno-economic feasibility analysis of 1 MW photovoltaic grid connected system in Oman. Case studies in thermal engineering 2017, 10, 131–141. [Google Scholar] [CrossRef]
- Mishrif, Ashraf, and Asharul Khan. Non-Industrial Solar Energy Use, Barriers, and Readiness: Case Study of Oman. Energies 2024, 17, 3917. [Google Scholar] [CrossRef]
- AnnualReport2022EN.pdf (apsr.om) (Accessed on 21 October 2024).
- Bakhshi-Jafarabadi, Reza, and Seyed Mahdi Seyed Mousavi. Peak Load Shaving of Air Conditioning Loads via Rooftop Grid-Connected Photovoltaic Systems: A Case Study. Sustainability 2024, 16, 5640. [Google Scholar] [CrossRef]
- Hereher, Mohamed, and Ahmed M. El Kenawy. Exploring the potential of solar, tidal, and wind energy resources in Oman using an integrated climatic-socioeconomic approach. Renewable Energy 2020, 161, 662–675. [Google Scholar] [CrossRef]
- Gastli, Adel, and Yassine Charabi. Solar electricity prospects in Oman using GIS-based solar radiation maps. Renewable and Sustainable Energy Reviews 2010, 14, 790–797. [Google Scholar] [CrossRef]
- Al-Dousari, Ali, Domenico Doronzo. Types, indications and impact evaluation of sand and dust storms trajectories in the Arabian Gulf. Sustainability 2017, 9, 1526. [Google Scholar] [CrossRef]
- Chaichan, Miqdam T.; et al. Sand and dust storms’ impact on the efficiency of the photovoltaic modules installed in baghdad: a review study with an empirical investigation. Energies 2023, 16, 3938. [Google Scholar] [CrossRef]
- Solar resource maps & GIS data for 200+ countries | Solargis (Accessed on 21 October 2024).
- Cotfas, Daniel T., and Petru A. Cotfas. Comparative study of two commercial photovoltaic panels under natural sunlight conditions. International journal of photoenergy 2019, 2019, 8365175. [Google Scholar] [CrossRef]
- Bertrand, Cédric, et al. "Solar irradiation from the energy production of residential PV systems." Renewable Energy 125 (2018): 306-318.
- Honnurvali, Mohamed Shaik; et al. Case study of PV output power degradation rates in Oman. IET Renewable Power Generation 2019, 13, 352–360. [Google Scholar] [CrossRef]
- Kwarteng, Andy Y., Atsu S. Dorvlo, and Ganiga T. Vijaya Kumar. "Analysis of a 27-year rainfall data (1977-2003) in the Sultanate of Oman." International Journal of Climatology 29.4 (2009): 605.
- Ponnusamy, Lakshmi, and Dhass Desappan. "An investigation of temperature effects on solar photovoltaic cells and modules." International Journal of Engineering 27.11 (2014): 1713-1722.
- Tripathi, Abhishek Kumar, et al. "Evaluation of solar PV panel performance under humid atmosphere." Materials Today: Proceedings 45 (2021): 5916-5920.
- Kazem, Hussein A., and Miqdam T. Chaichan. "Effect of humidity on photovoltaic performance based on experimental study." International Journal of Applied Engineering Research (IJAER) 10.23 (2015): 43572-43577.
- Garni, Hassan Z. Al. "The Impact of Soiling on PV Module Performance in Saudi Arabia." Energies 15.21 (2022): 1-25.
- Papi, Ramin, et al. "Characterization of hydrologic sand and dust storm sources in the Middle East." Sustainability 14.22 (2022).
- Thornton, John Preston. The effect of sandstorms on PV arrays and components. No. NREL/TP-411-4787; CONF-920678-1. National Renewable Energy Lab., Golden, CO (United States), 1992.
- Al Senafi, Fahad, and Ayal Anis. "Shamals and climate variability in the Northern Arabian/Persian Gulf from 1973 to 2012." International Journal of Climatology 35.15 (2015).
- Vedulla, Gowtham, Anbazhagan Geetha, and Ramalingam Senthil. "Review of strategies to mitigate dust deposition on solar photovoltaic systems." Energies 16.1 (2022): 109.
- Al Kindi, M.; et al. Stratigraphy, palaeoclimatic context and fossils of the Southern Rub Al Khali (the Empty Quarter): results of a geo-archaeological survey around the area of Maitan in the Sultanate of Oman. Historical Biology 2021, 33, 1534–1555. [Google Scholar] [CrossRef]
- Hereher, Mohamed, et al. "Formation of the Wahiba Sand Sea in the Sultanate of Oman: implications of change in wind energy." Arabian Journal of Geosciences 13 (2020): 1-14.
- Hereher, Mohamed E. "Assessment of infrastructure vulnerability to tsunamis upon the coastal zone of Oman using GIS." Geosciences 10.5 (2020): 175.
- Oman Population (2024) - Worldometer (worldometers.info) (Accessed on 21 October 2024).
- WorldPop :: Population Density (Accessed on 21 October 2024).
- Tarigan, Elieser, and Fitri Dwi Kartikasari. "Techno-economic simulation of a grid-connected PV system design as specifically applied to residential in Surabaya, Indonesia." Energy Procedia 65 (2015): 90-99.
- Marion, B. , Adelstein, J., Boyle, K., Hayden, H., Hammond, B., Fletcher, T., & Canada, B. (2005). "Performance parameters for grid-connected PV systems." Proceedings of the 31st IEEE Photovoltaic Specialists Conference, 1601-1606.
- Emery, Keith. "Measurement and characterization of solar cells and modules." Handbook of photovoltaic science and engineering (2011): 797-840.
- Canadian_Solar Panel -Datasheet(Accessed on 21 October 2024).
- Council, Clean Energy. "Grid-Connected Solar PV Systems: Design Guidelines for Accredited Installers." Clean Energy Council: Melbourne, Australia (2013): 1-18.
- Sun grow inverter data sheet(Accessed on 21 October 2024).
- Grid Connect PV system Design Guide, SEIAPI, Issue 1 September 2012(Accessed on 21 October 2024).
- Directorate General of Meteorology, Oman(Accessed on 21 October 2024).
- Tran, Thomas TD, and Amanda D. Smith. Evaluation of renewable energy technologies and their potential for technical integration and cost-effective use within the US energy sector. Renewable and Sustainable Energy Reviews 2017, 80, 1372–1388. [Google Scholar] [CrossRef]
- Tran, Thomas TD, and Amanda D. Smith. Incorporating performance-based global sensitivity and uncertainty analysis into LCOE calculations for emerging renewable energy technologies. Applied energy 2018, 216, 157–171. [Google Scholar] [CrossRef]
- Inmaculada, Guaita-Pradas, and Ana Blasco-Ruiz. Analyzing profitability and discount rates for solar PV plants. A Spanish case. Sustainability 2020, 12, 3157. [Google Scholar] [CrossRef]
- Renewable Hydrogen from Oman, IEA report(Accessed on 21 October 2024).
- Sheng, Chunhong, Yun Cao. Residential Energy Sustainability in China and Germany: The impact of national energy policy system. Sustainability 2018, 10, 4535. [Google Scholar] [CrossRef]
- Liu, Y.; Li, J. German renewable energy legal selection and its implications. Environ. Prot. 2012, 15, 68–70. [Google Scholar]
- Market Incentive Programme (MAP) – Policies - IEA(Accessed on 21 October 2024).
- Matschoss, Patrick; et al. The German incentive regulation and its practical impact on the grid integration of renewable energy systems. Renewable Energy 2019, 134, 727–738. [Google Scholar] [CrossRef]
- Report on the long-term strategy for mobilise investment in the renovation of the national building stock, The Government of the Federal Republic of Germany.
- Wrede, Matthias. The influence of state politics on solar energy auction results. Energy Policy 2022, 168, 113130. [Google Scholar] [CrossRef]
- Zhang Sufang, Li Xingmei. Large scale wind power integration in China: analysis from a policy perspective. Renewable and Sustainable Reviews 2012, 16, 1110–5. [Google Scholar] [CrossRef]
- Zhang, Sufang, and Yongxiu He. Analysis on the development and policy of solar PV power in China. Renewable and Sustainable Energy Reviews 2013, 21, 393–401. [Google Scholar] [CrossRef]
- Xiong, Yongqing, and Xiaohan Yang. "Government subsidies for the Chinese photovoltaic industry." Energy Policy 99 (2016): 111-119.
- Zhang, Sufang. "Analysis of Distributed Solar Photovoltaic (DSPV) Power Policy in China." Chapters (2016): 137-159.
- Wen, Daoyuan, et al. "Development of solar photovoltaic industry and market in China, Germany, Japan and the United States of America using incentive policies." Energy Exploration & Exploitation 39.5 (2021): 1429-1456.
- Tabassum, Sanzana, et al. "Solar energy in the United States: Development, challenges and future prospects." Energies 14.23 (2021): 8142.
- Stolte, Justin. "The Energy Policy Act of 2005: The Path to Energy Autonomy." J. Legis. 33 (2006): 119.
- IEA (2011) National Survey Report of PV Power Applications in the United States 2010. Paris: International Energy Agency.
- U.S. DOE (2015) The SunShot Initiative: Making Solar Energy Affordable for all Americans. USA: U. S. DOE, pp.1–2.
- U.S. DOE (2017) The SunShot 2030 Goals: 3¢ per Kilowatt Hour for PV and 5 ¢ per Killowatt Hour for Dispatchable CSP. USA: U.S. DOE, pp.2–6.
- Solar for All | US EPA (Accessed on 21 October 2024).
- DSIRE (Accessed on 21 October 2024).
- Mills, Andrew, et al. "The impact of retail rate structures on the economics of commercial photovoltaic systems in California." Energy Policy 36.9 (2008): 3266-3277.
- Muhammad-Sukki, Firdaus; et al. Feed-in tariff for solar photovoltaic: The rise of Japan. Renewable energy 2014, 68, 636–643. [Google Scholar] [CrossRef]
- Myojo S & Ohashi, H. “Effects of consumer subsidies for renewable energy on industry growth and Welfare: Japanese solar energy” 39th Annual Conference of European Association for Research in Industrial Economics, Rome 2012: 1-24.
- Kuwahara, Ryoichi, Hyuntae Kim, and Hideki Sato. "Evaluation of zero-energy building and use of renewable energy in renovated buildings: A case study in Japan" Buildings 12.5 (2022): 561.
- Yamaura, Koichi, et al. "Public perceptions on net zero energy houses in Japan." Sustainability Science (2024): 1-12.
- National Portal for Rooftop Solar - Ministry of New and Renewable Energy (Accessed on 21 October 2024).
- Goel, Malti. "Solar rooftop in India: Policies, challenges and outlook." Green Energy & Environment 1.2 (2016): 129-137.
- Hussain, Akhtar, and Hak-Man Kim. Enhancing Renewable Energy Use in Residential Communities: Analyzing Storage, Trading, and Combinations. Sustainability 2024, 16, 891. [Google Scholar] [CrossRef]
Figure 1.
Global Horizontal Irradiation (GHI) period of Oman [25]
Figure 1.
Global Horizontal Irradiation (GHI) period of Oman [25]
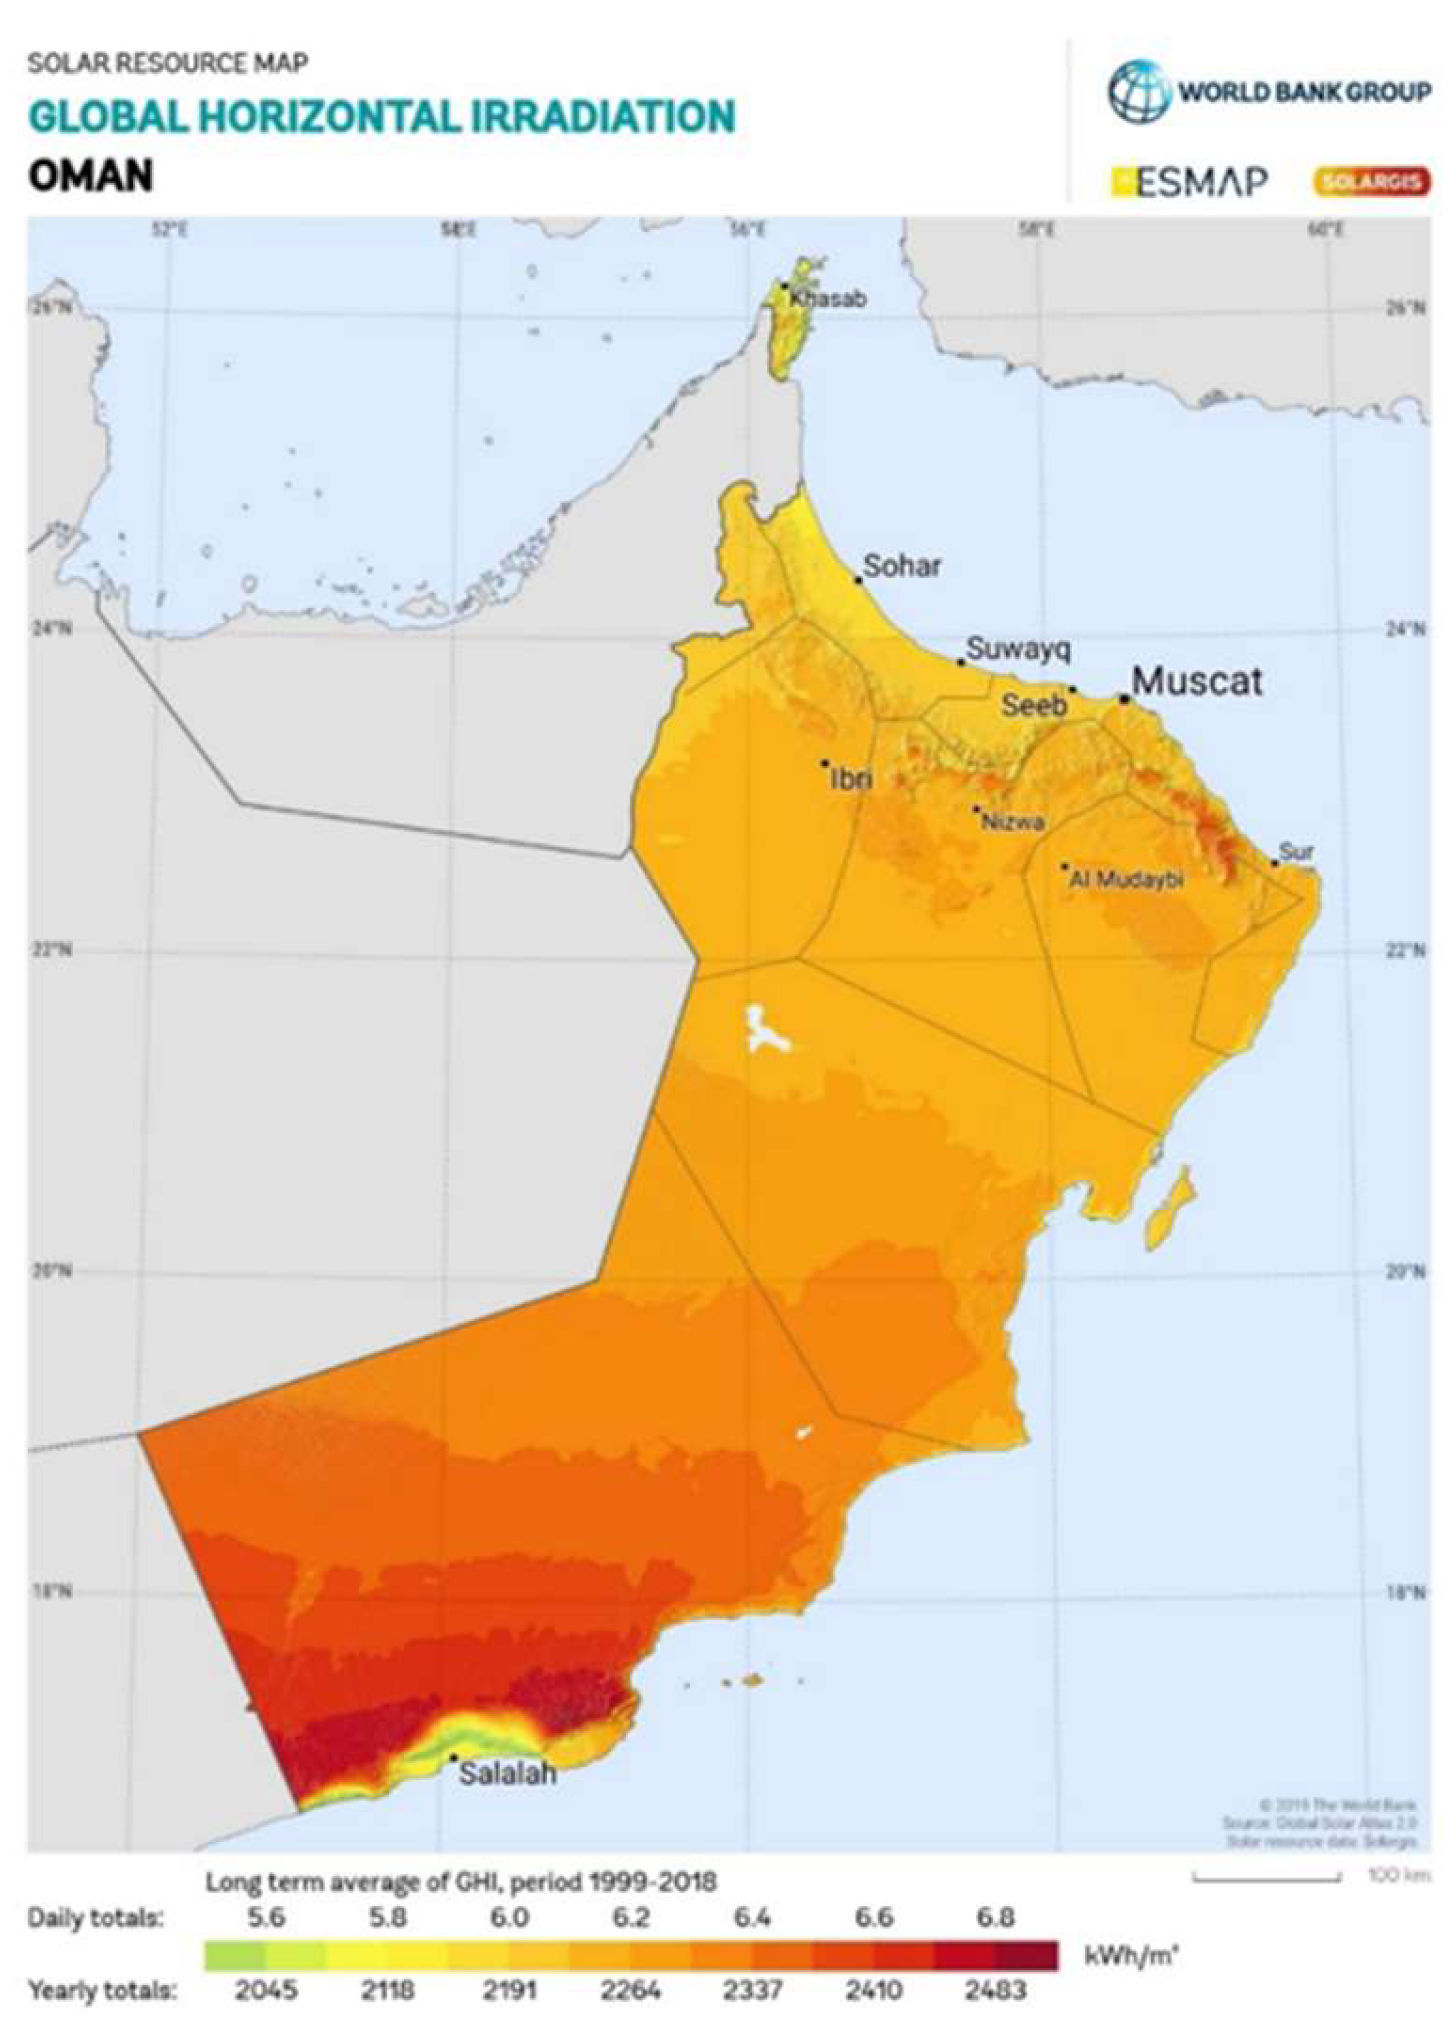
Figure 2.
Spatial distribution of relative humidity (%) for Oman in January and July, averaged for the period 1979 – 2014 [21].
Figure 2.
Spatial distribution of relative humidity (%) for Oman in January and July, averaged for the period 1979 – 2014 [21].
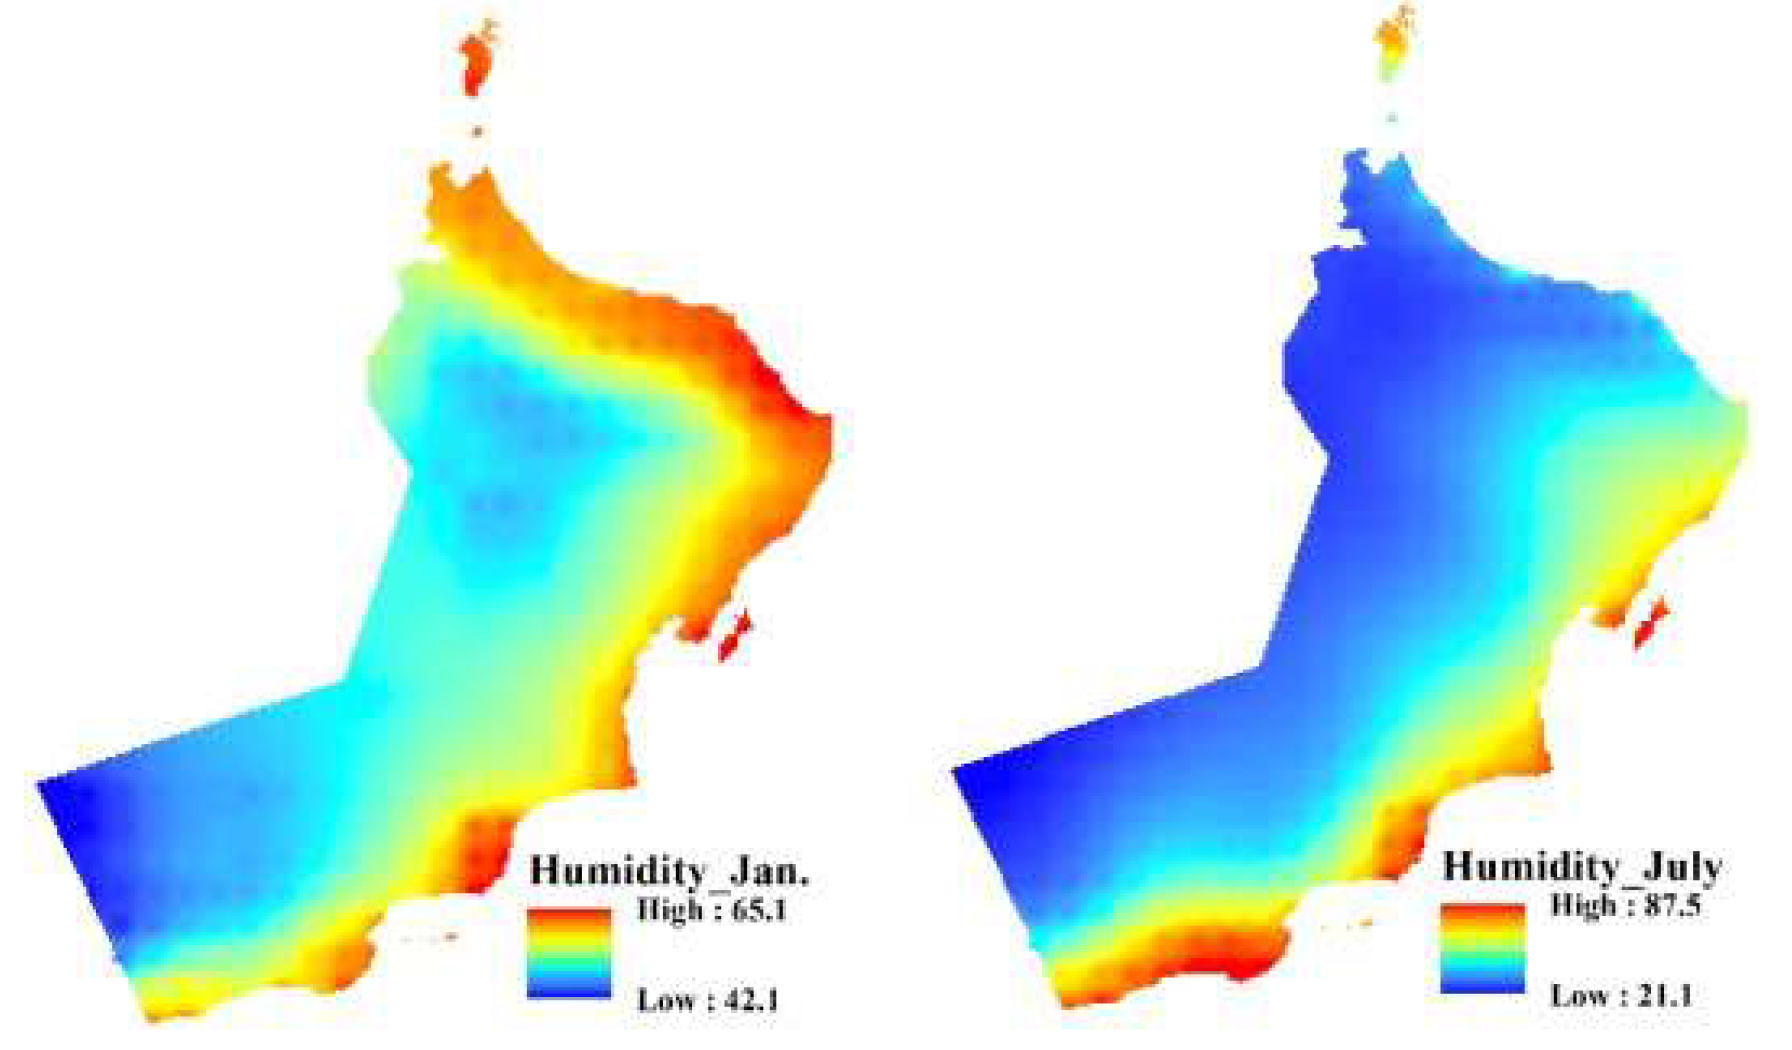
Figure 3.
Spatial map of Population density in Oman [42]
Figure 3.
Spatial map of Population density in Oman [42]
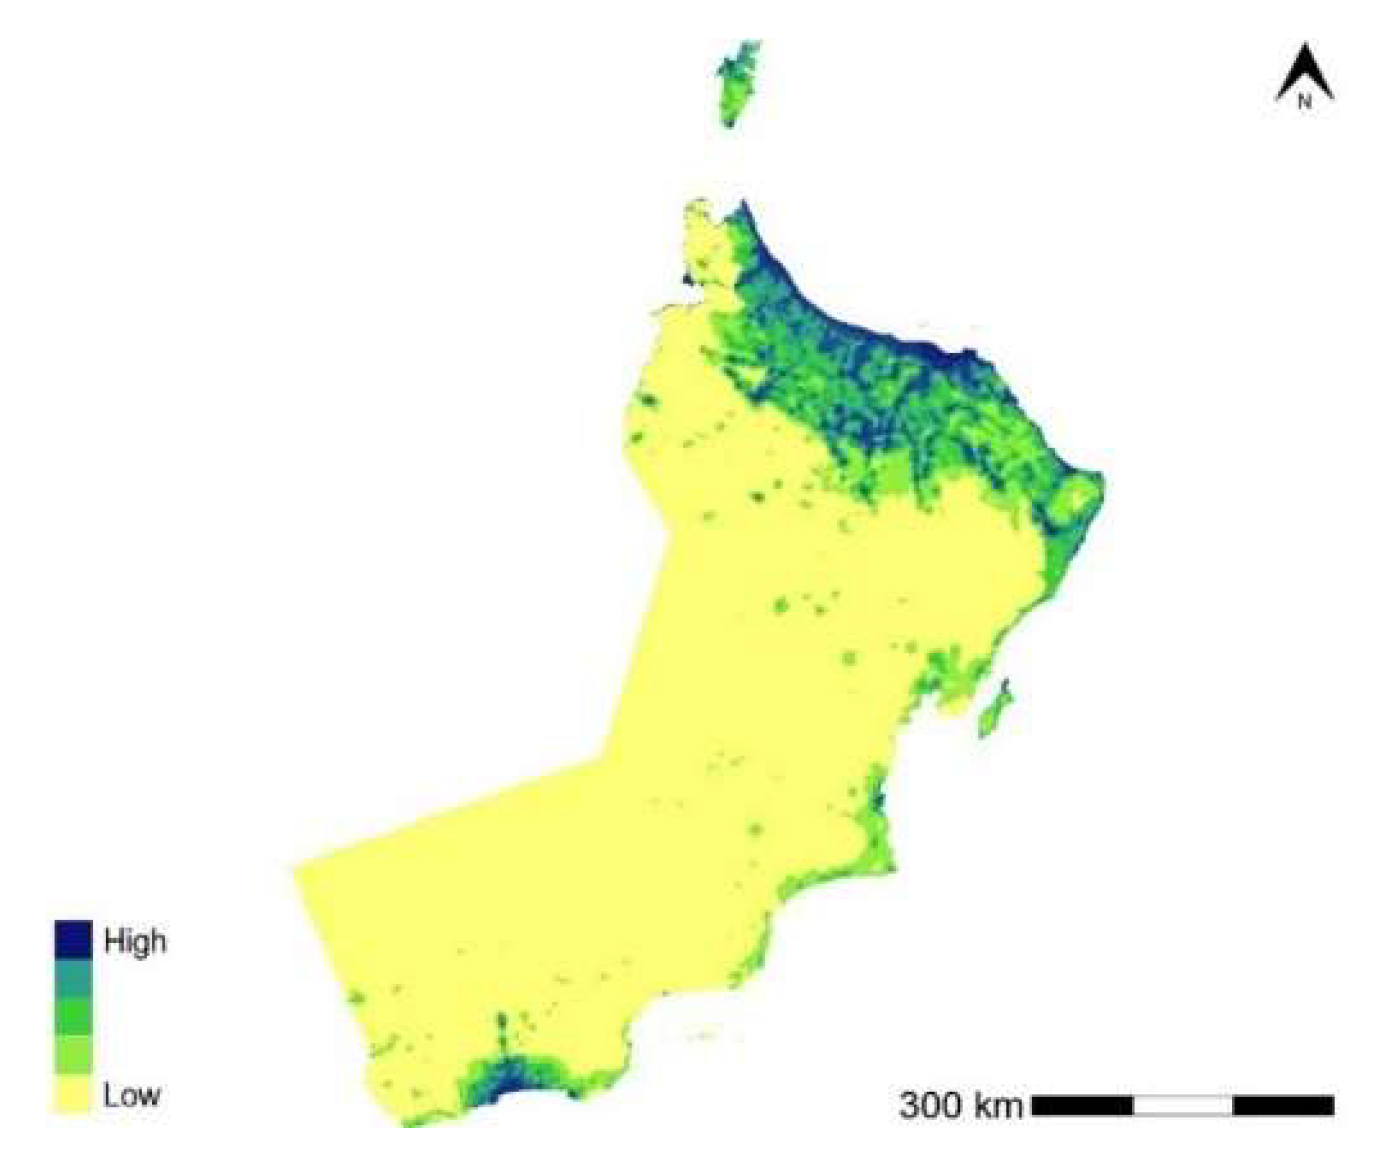
Figure 4.
UTAS Branches Location in Oman
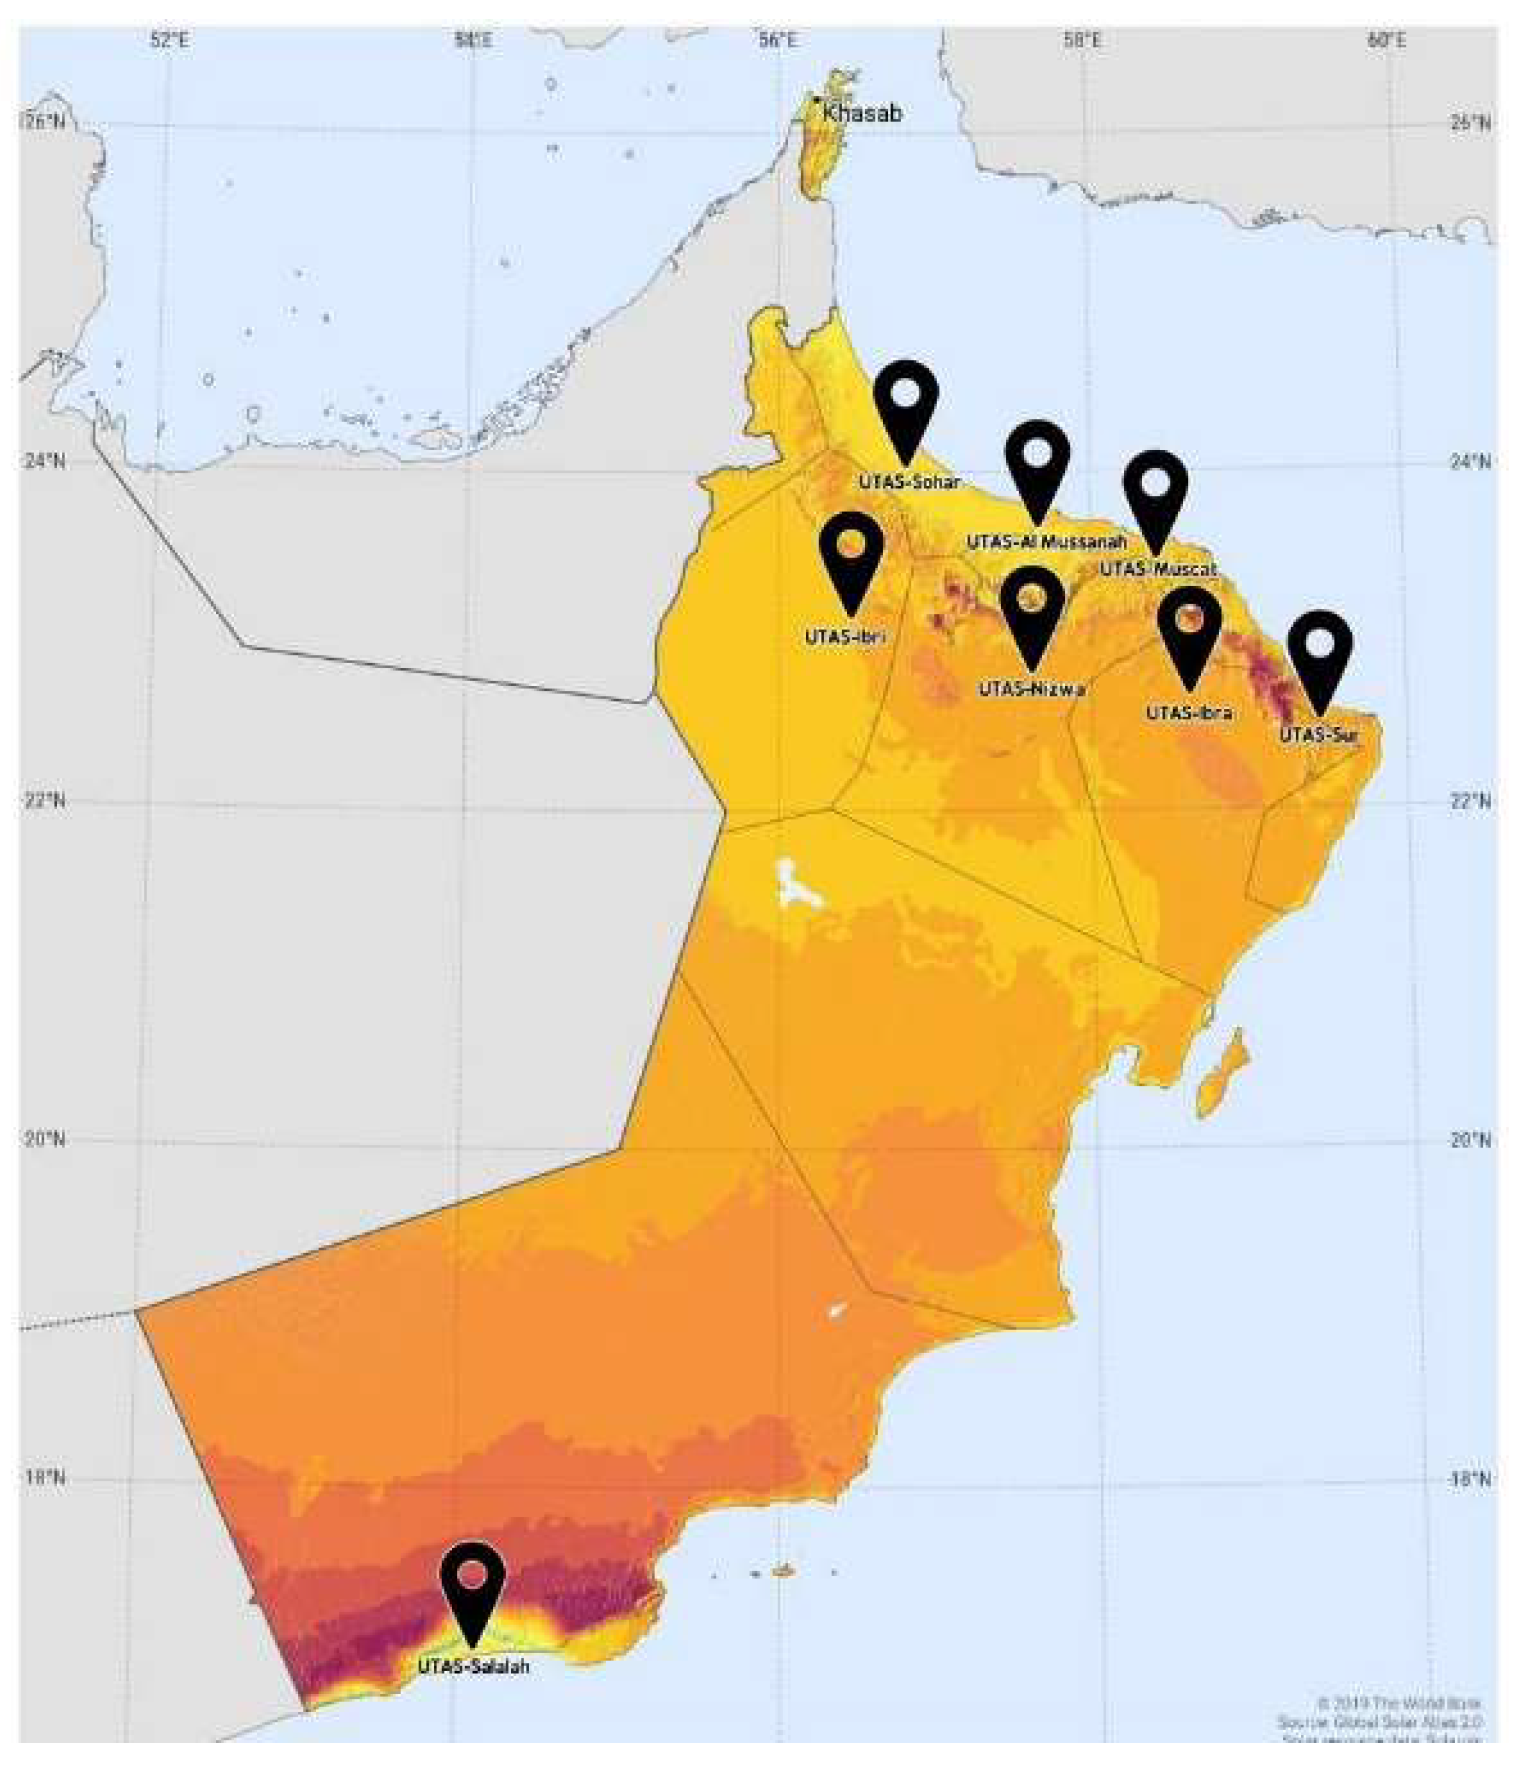
Figure 5.
I-V Characteristics of 550Wp Canadian Solar PV [46].
Figure 5.
I-V Characteristics of 550Wp Canadian Solar PV [46].
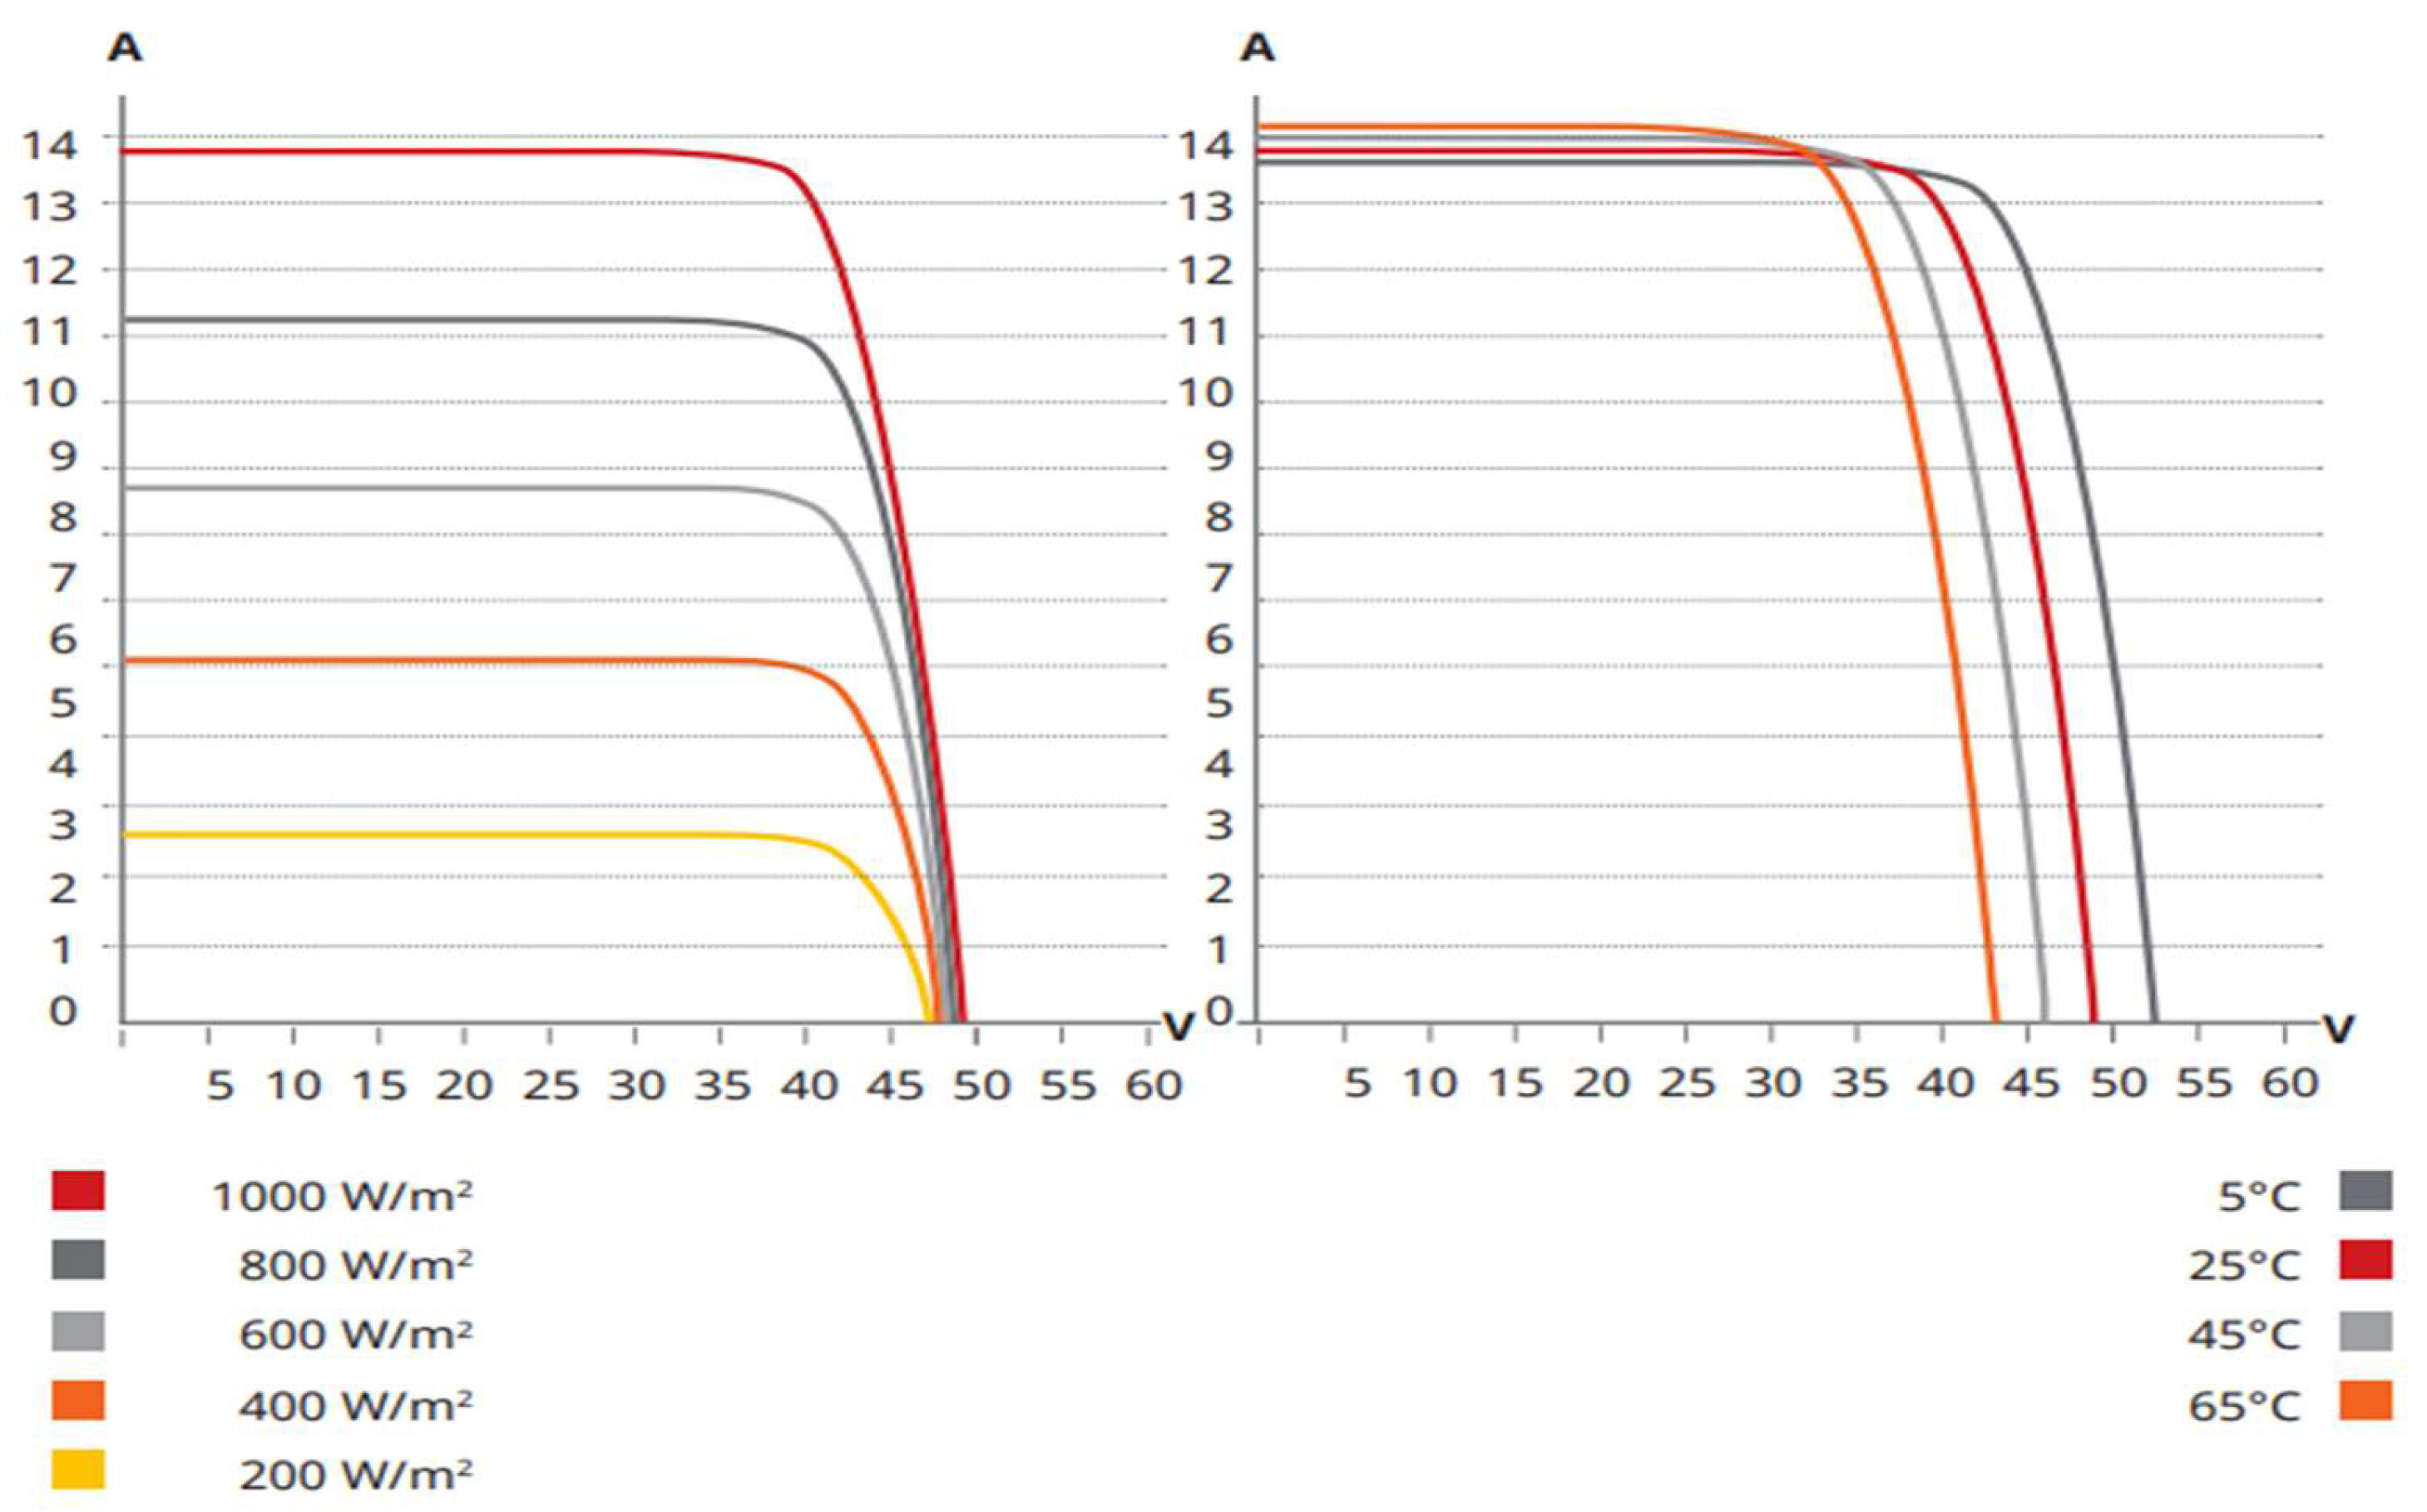
Figure 6.
Solar PV Smart Bus stop proposed location at UTAS-Ibri branch.
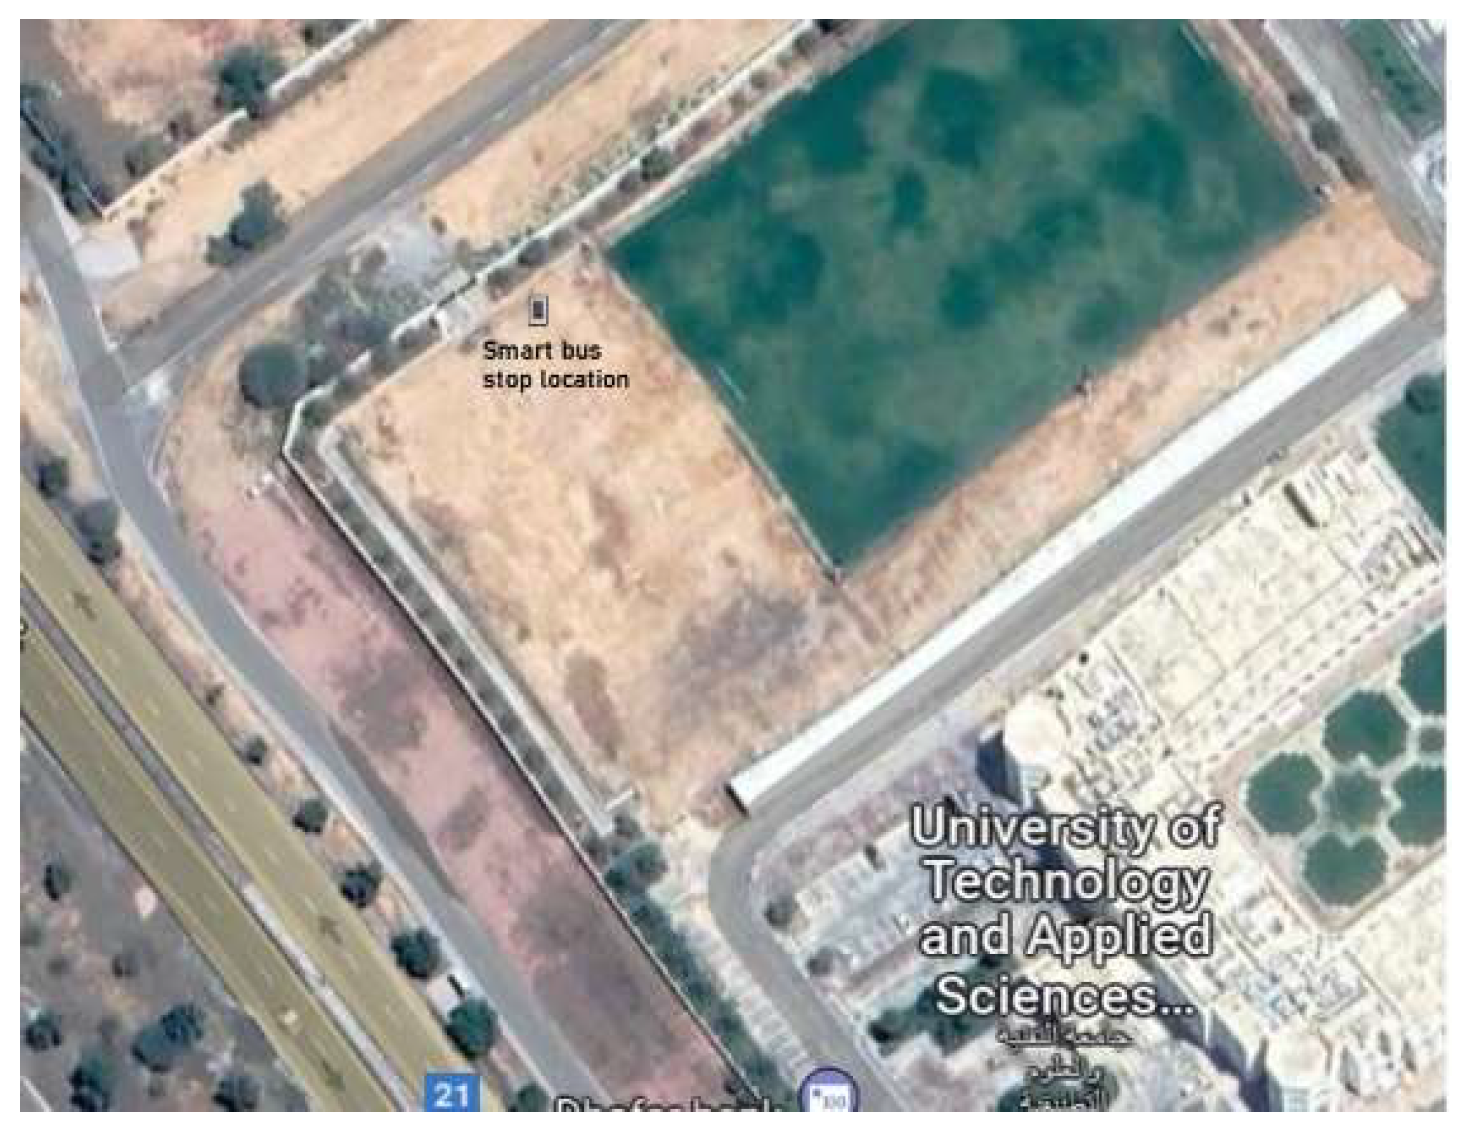
Figure 7.
Comparison of Annual energy yield of solar PV systems with cleaning and without cleaning located at various UTAS branches
Figure 7.
Comparison of Annual energy yield of solar PV systems with cleaning and without cleaning located at various UTAS branches
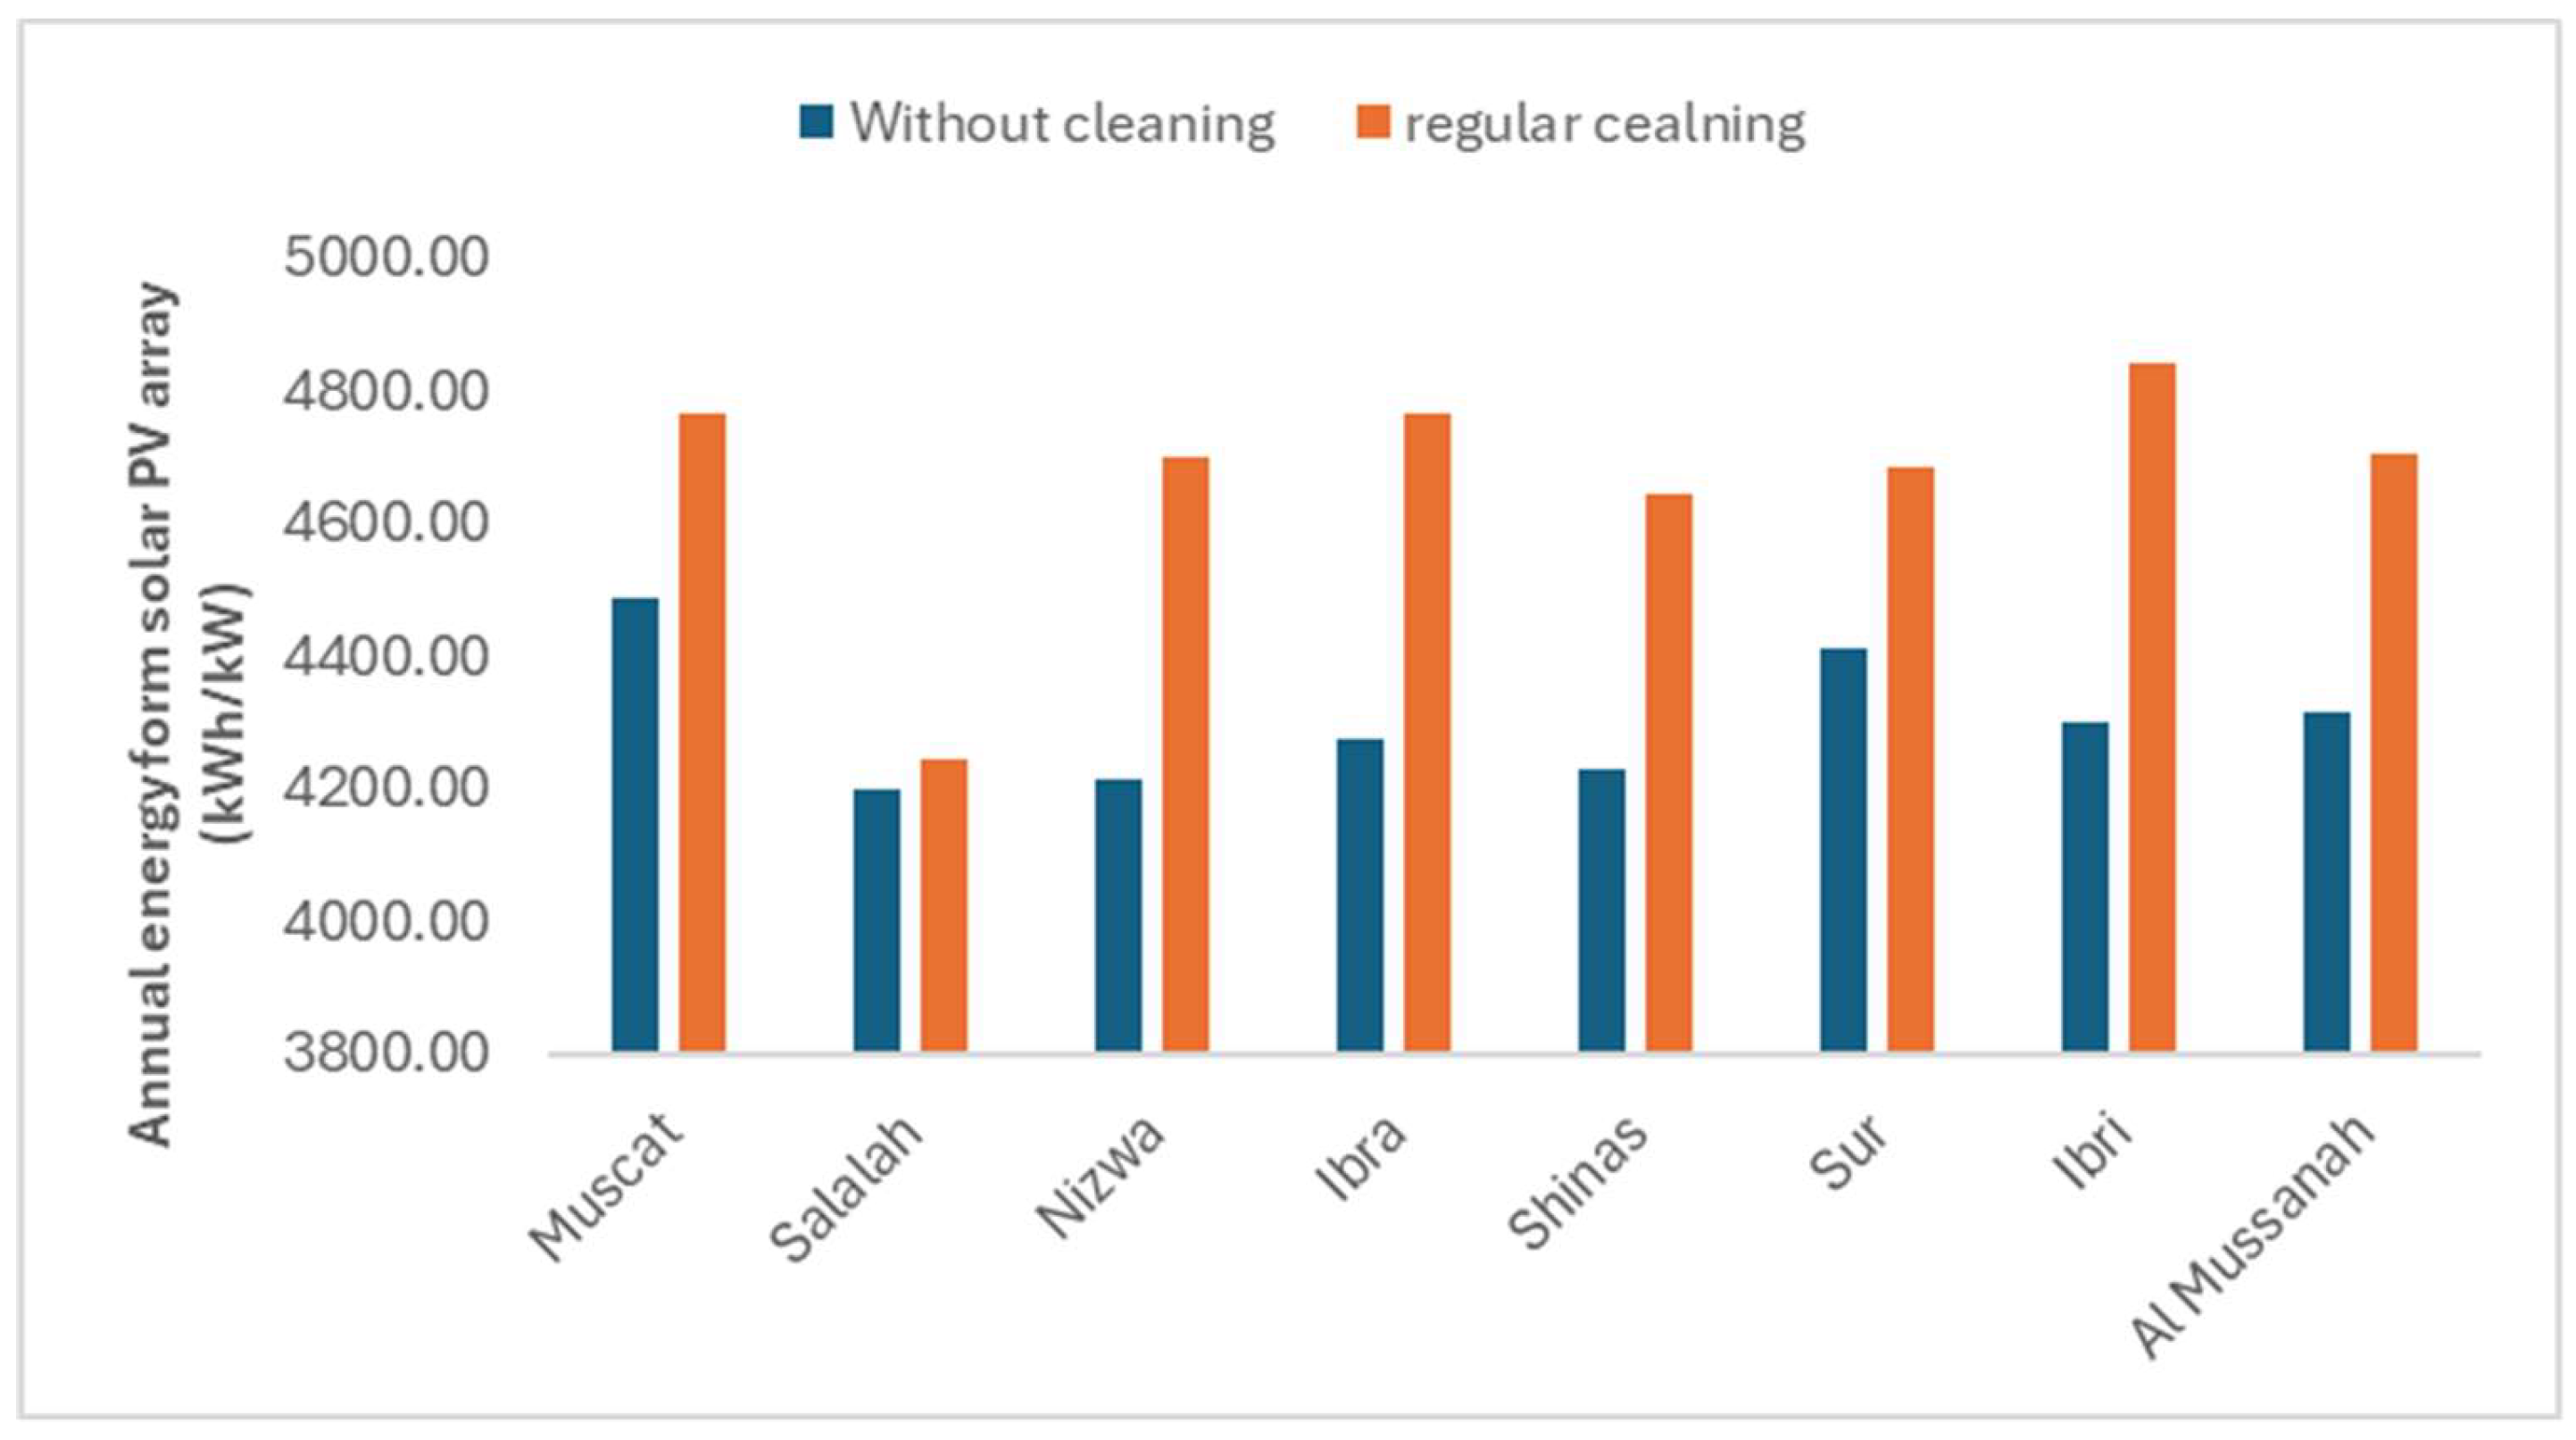
Figure 8.
Annual energy output of solar PV systems located at various UTAs branches
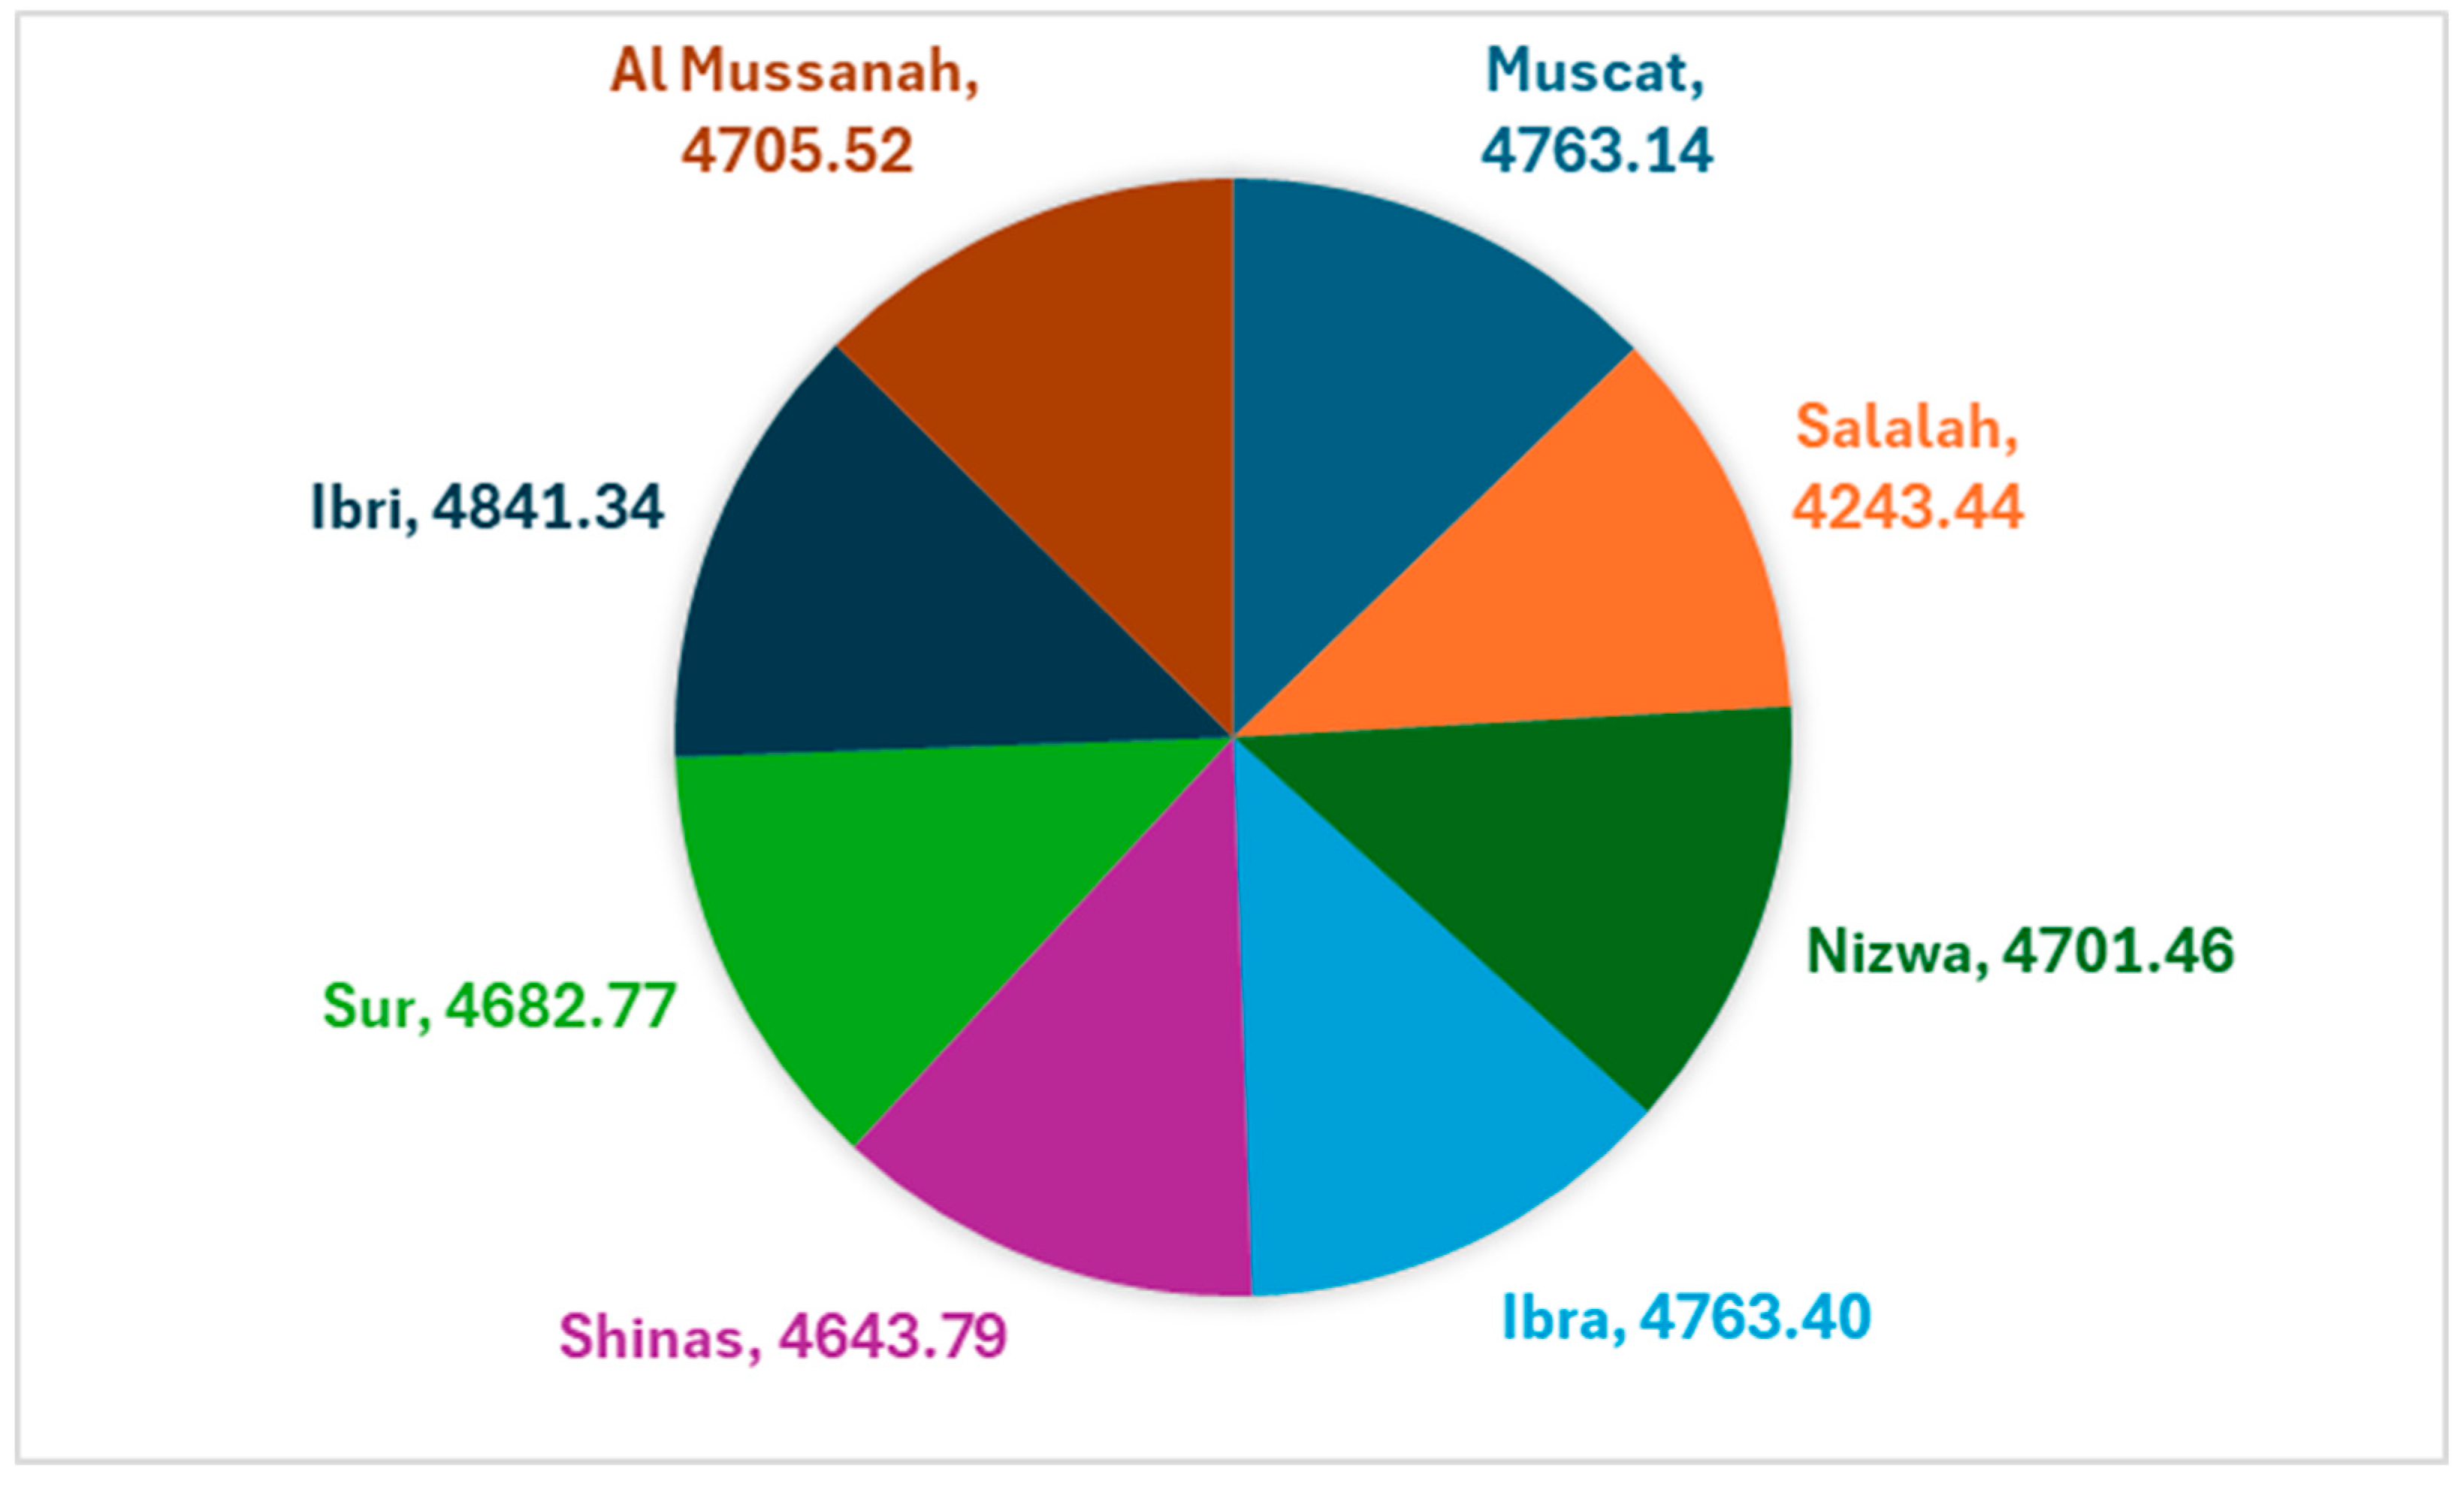
Figure 9.
LCOE of solar PV systems located at various UTAs branches.
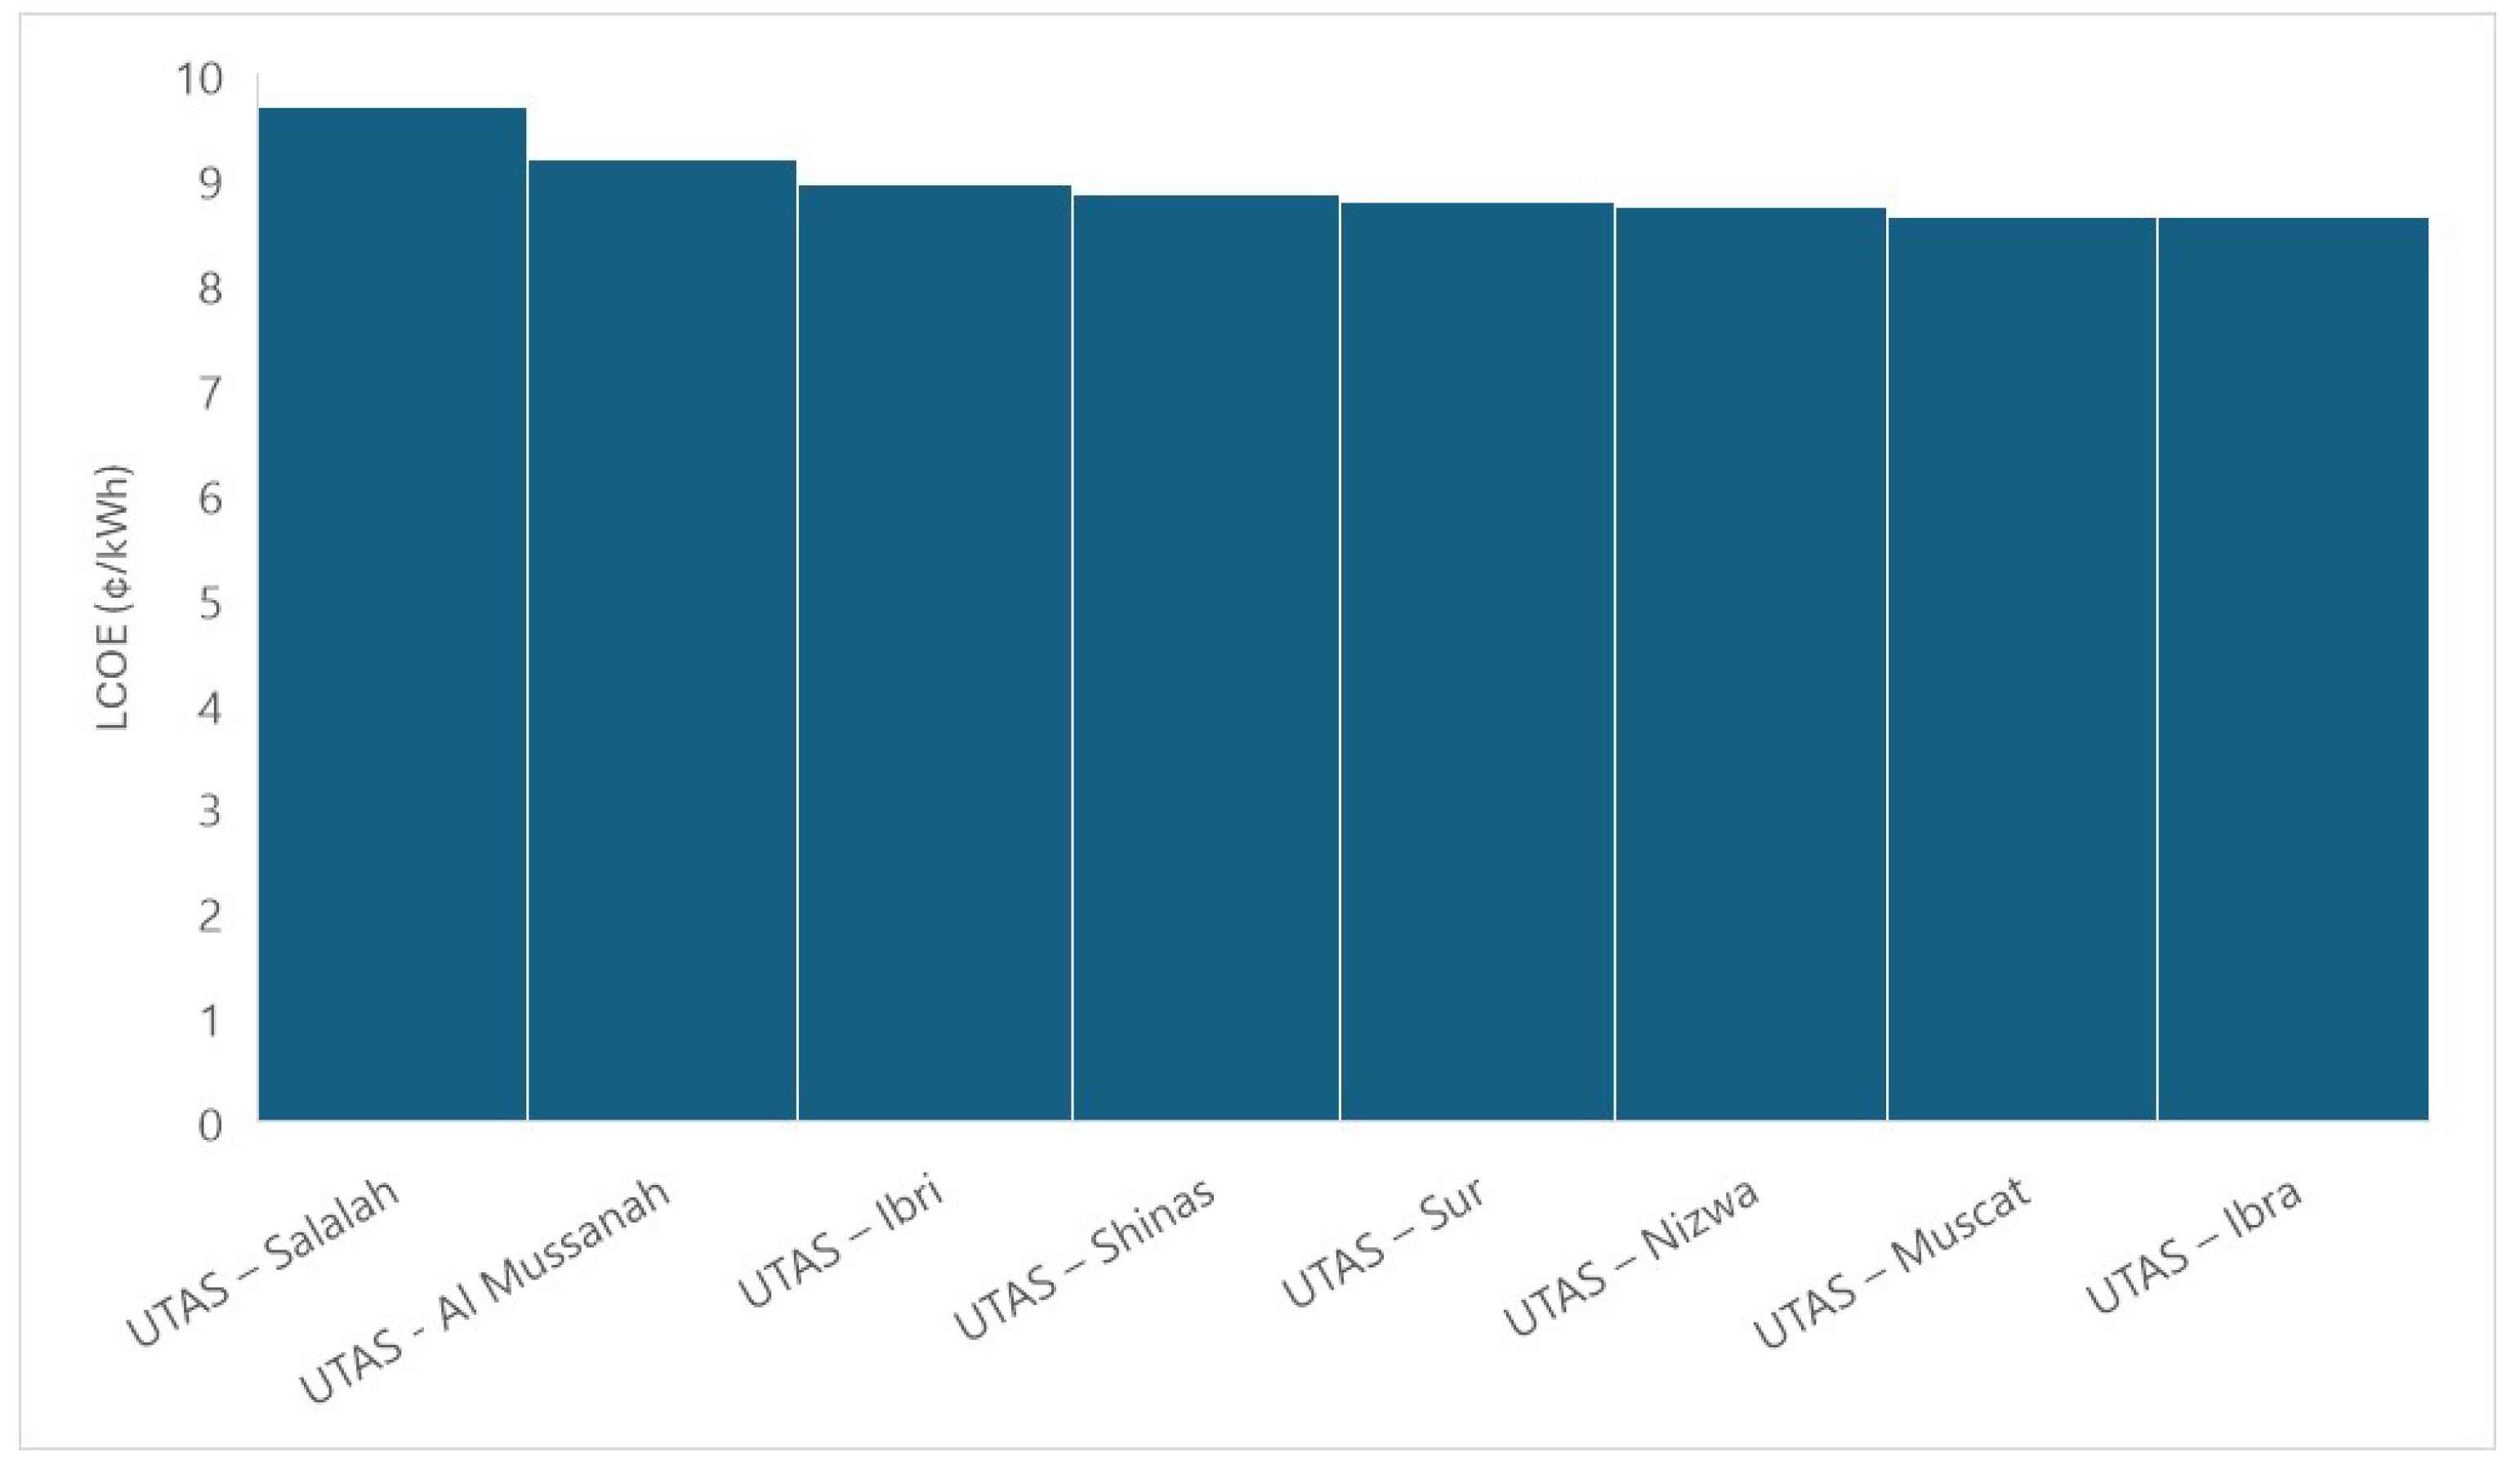
Figure 10.
Solar PV annual energy output of various UTAS branches.
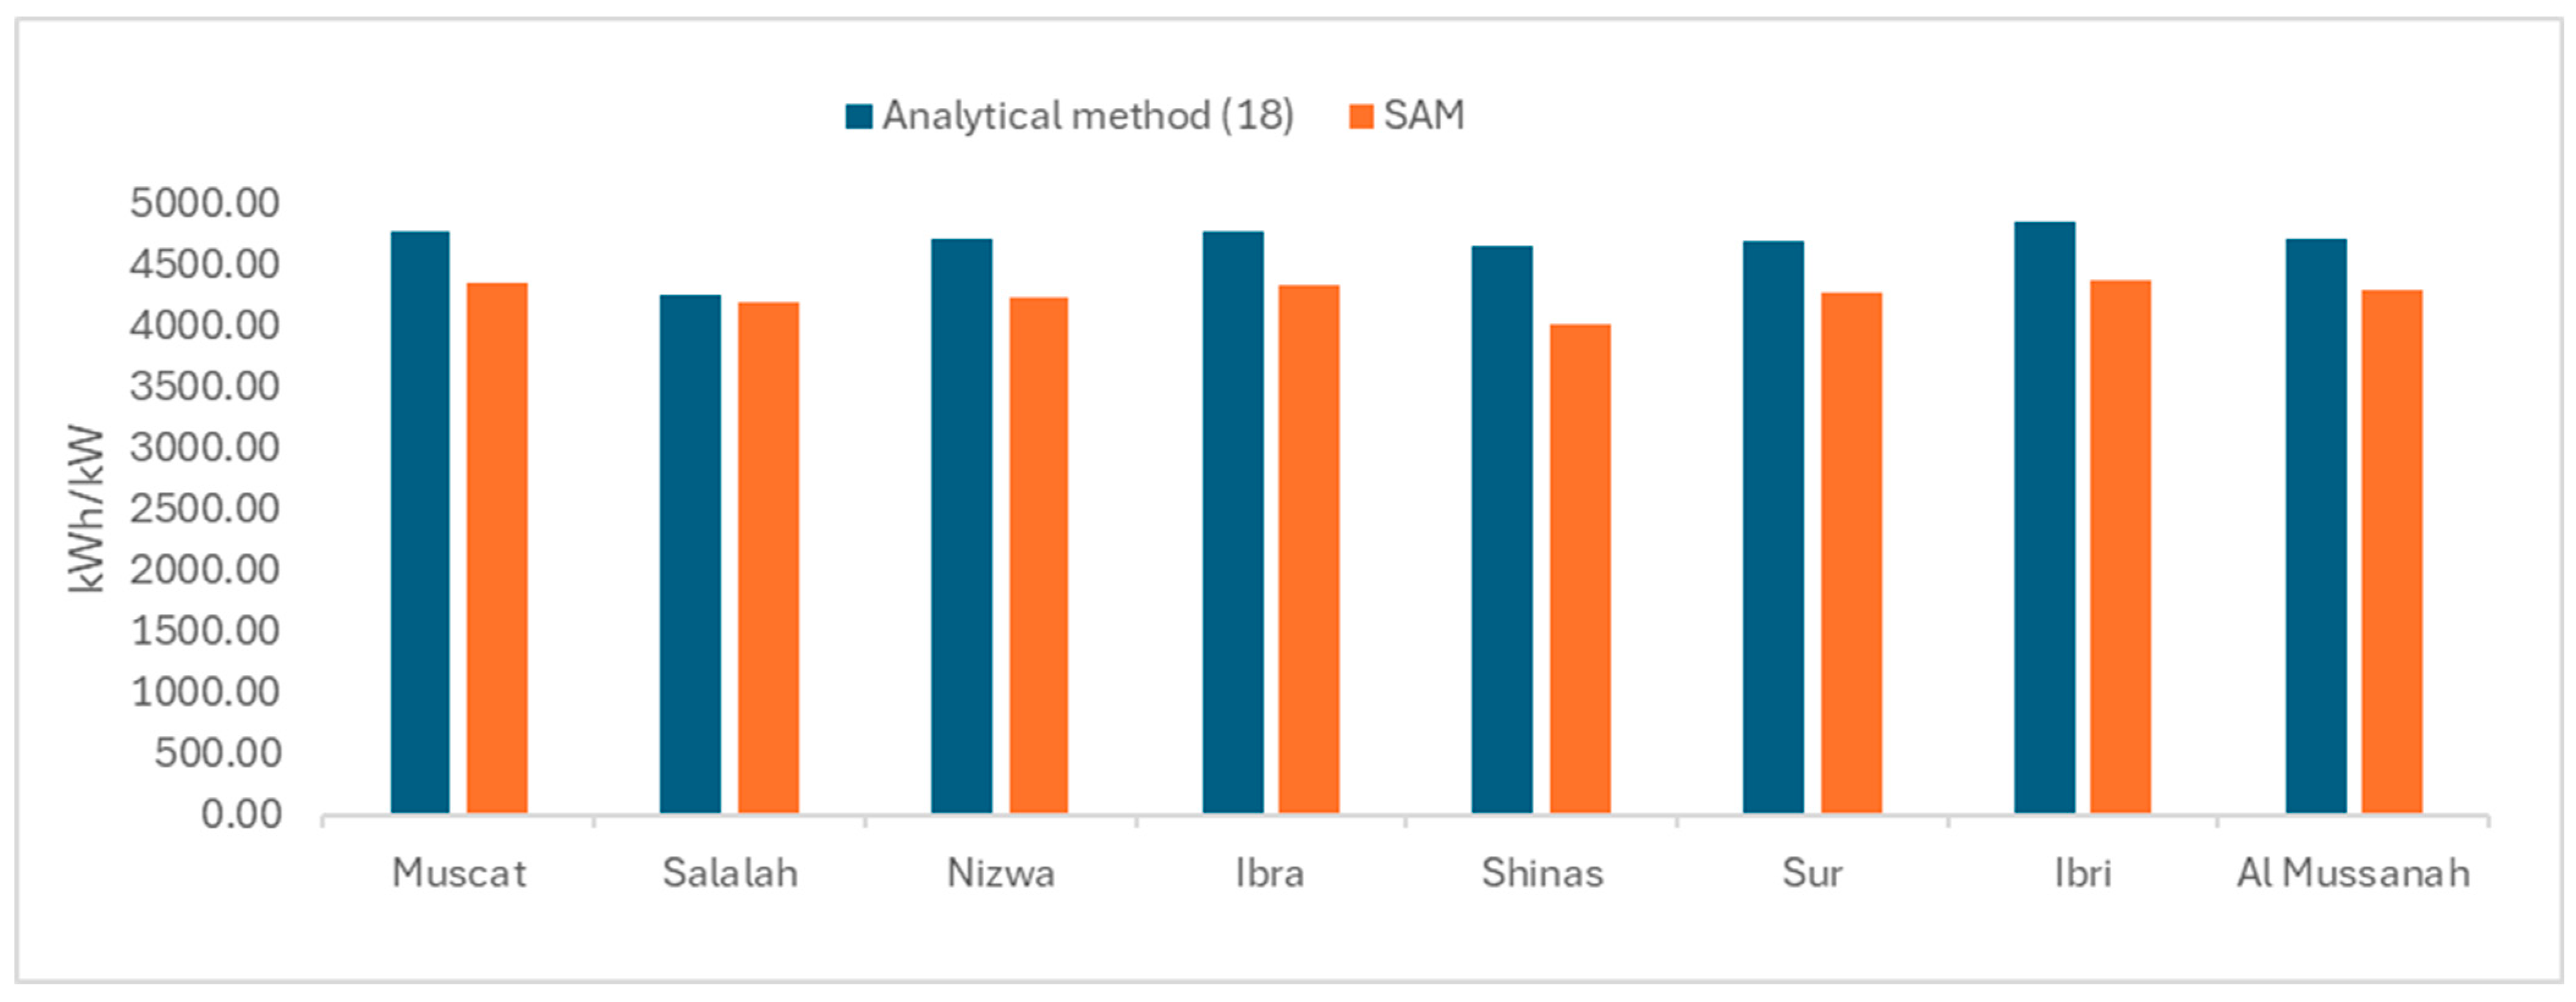
Figure 11.
Solar PV Performance ratio of various UTAS branches.
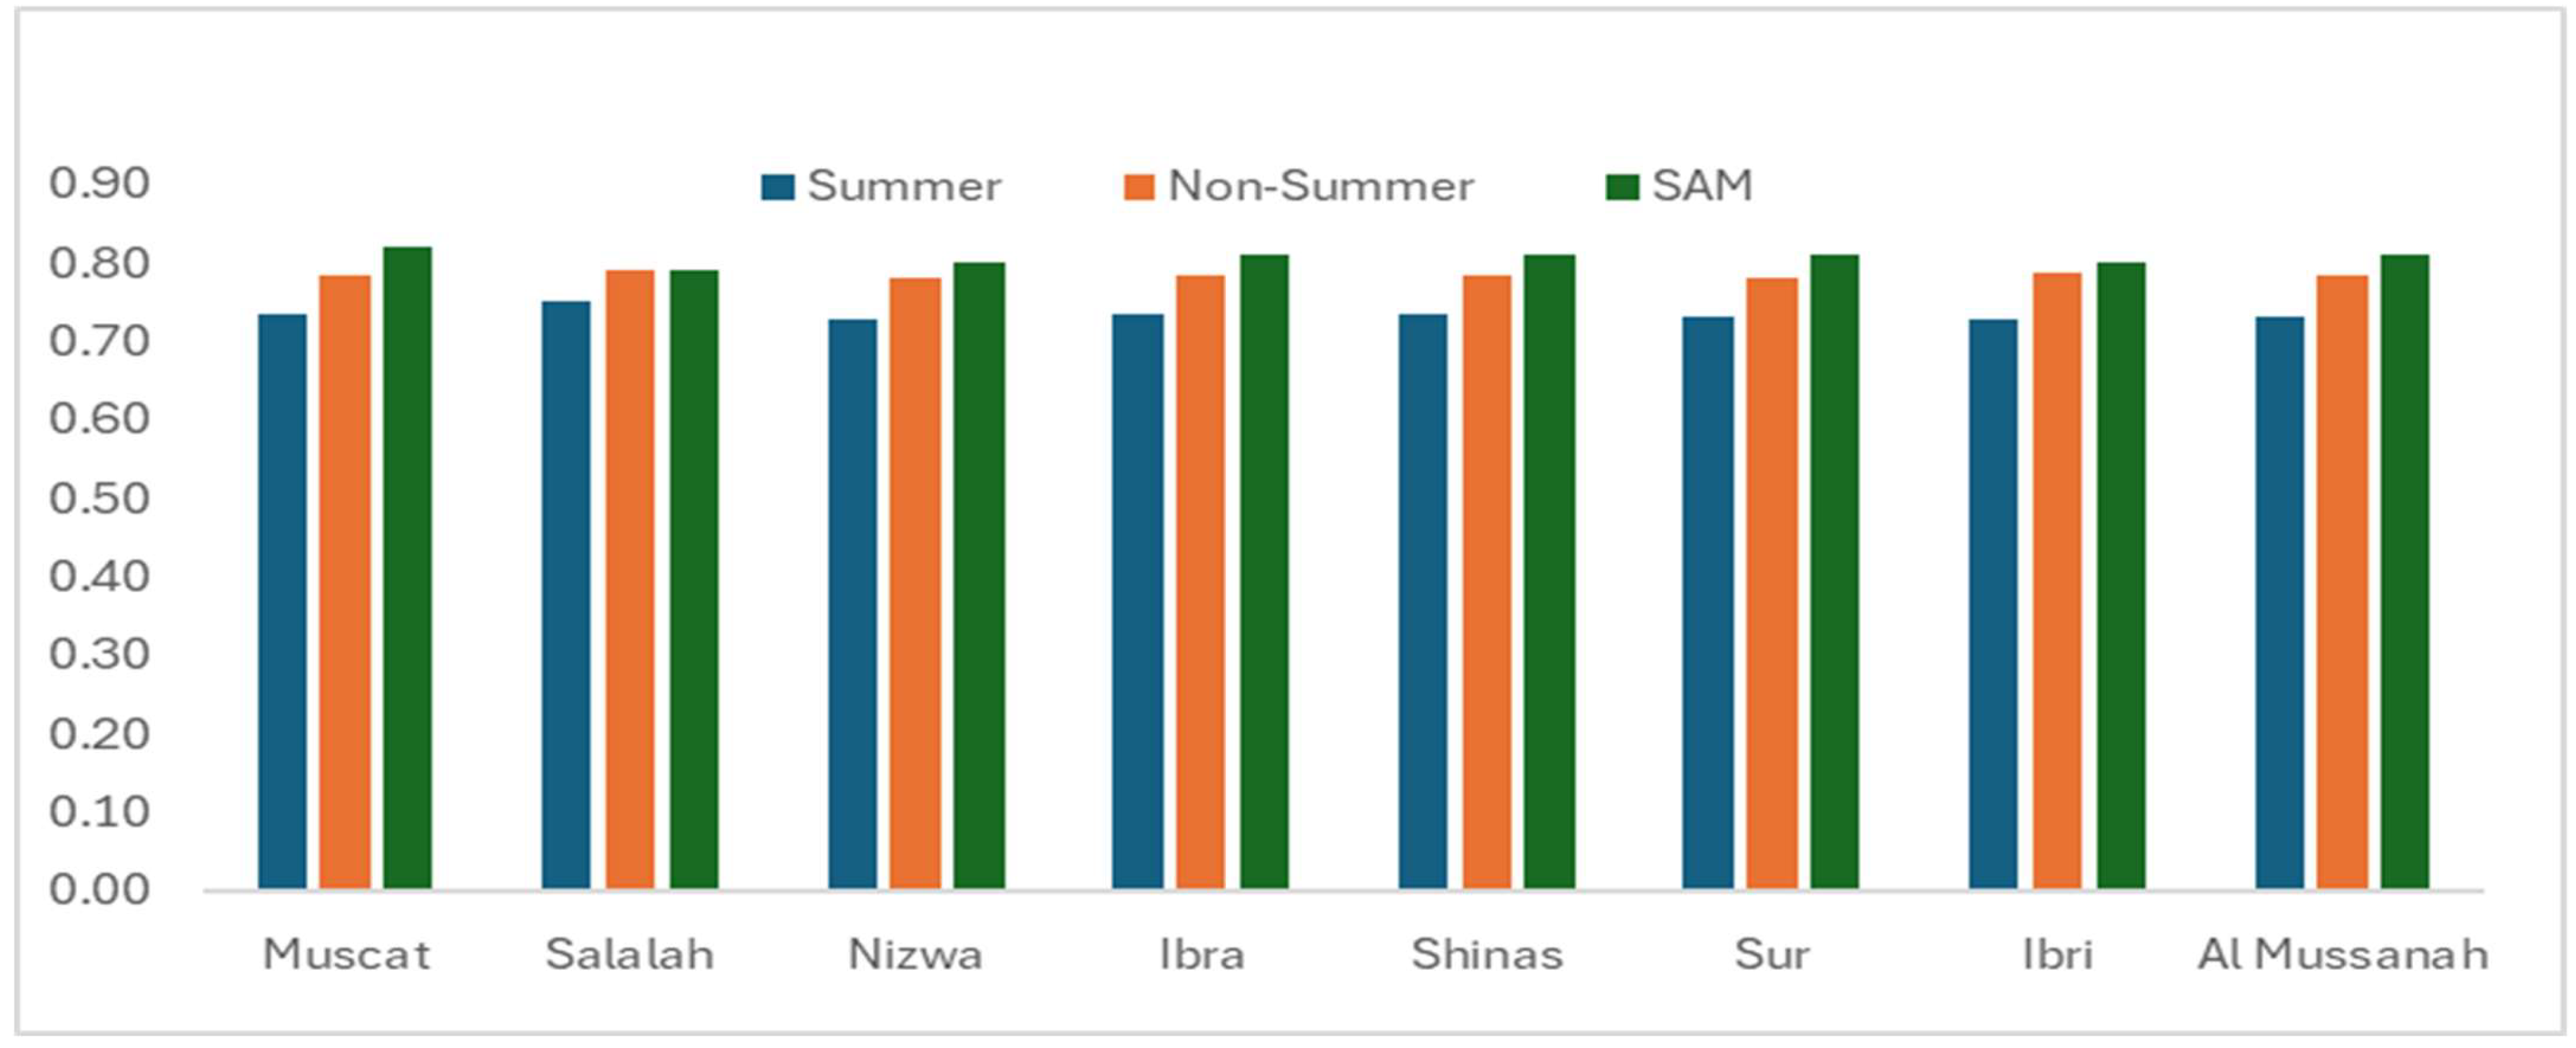
Figure 12.
Solar PV DC Capacity factor for various UTAS branches.
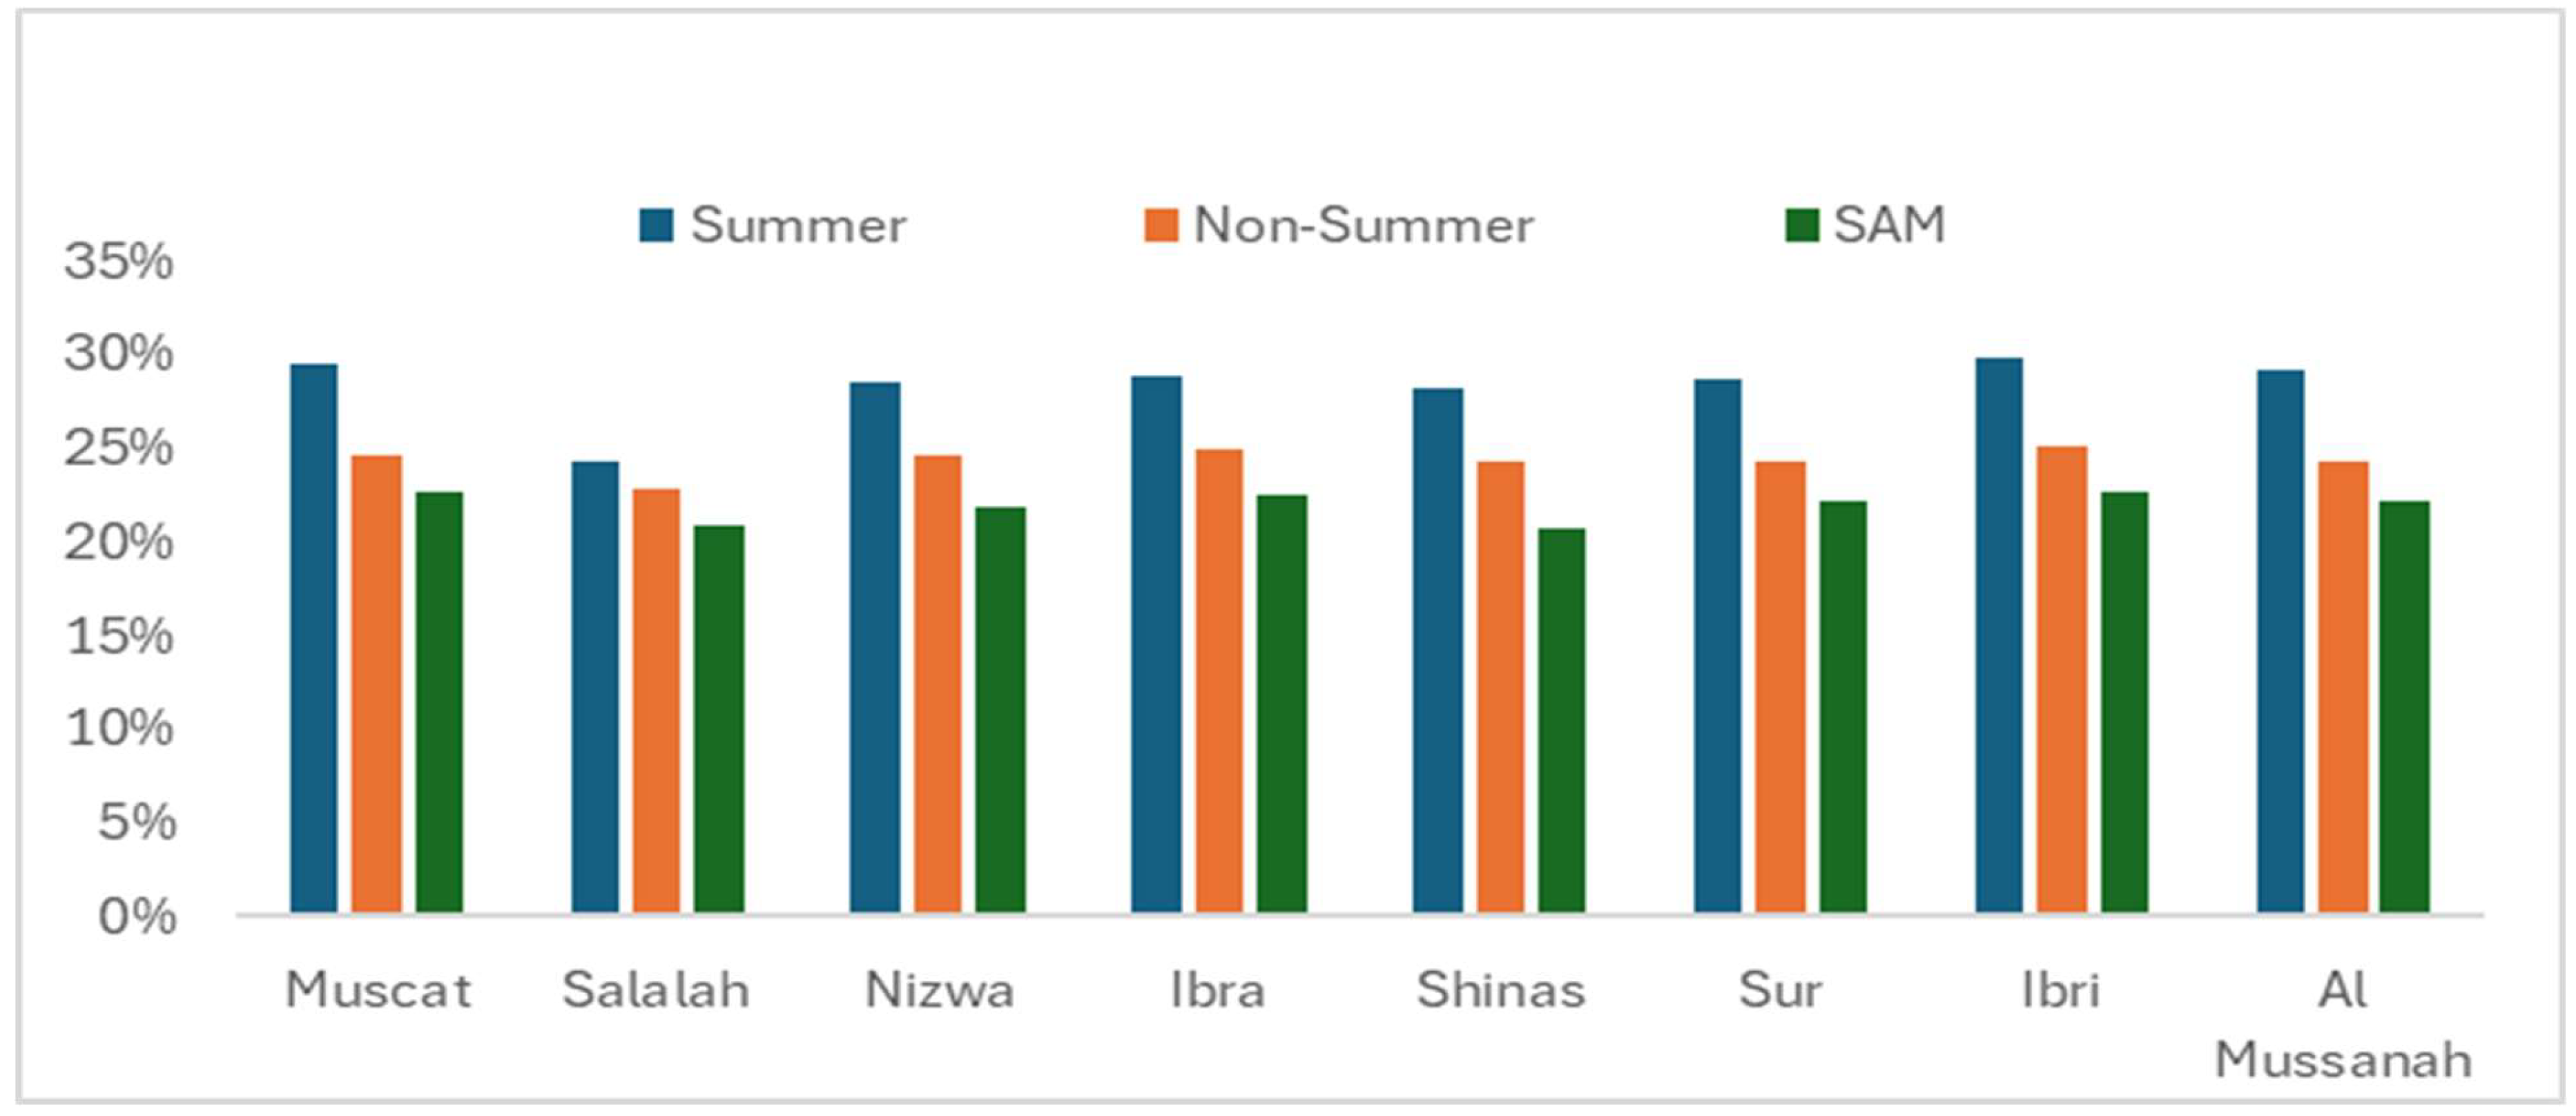
Figure 13.
LCOE of solar PV for various UTAS branches.
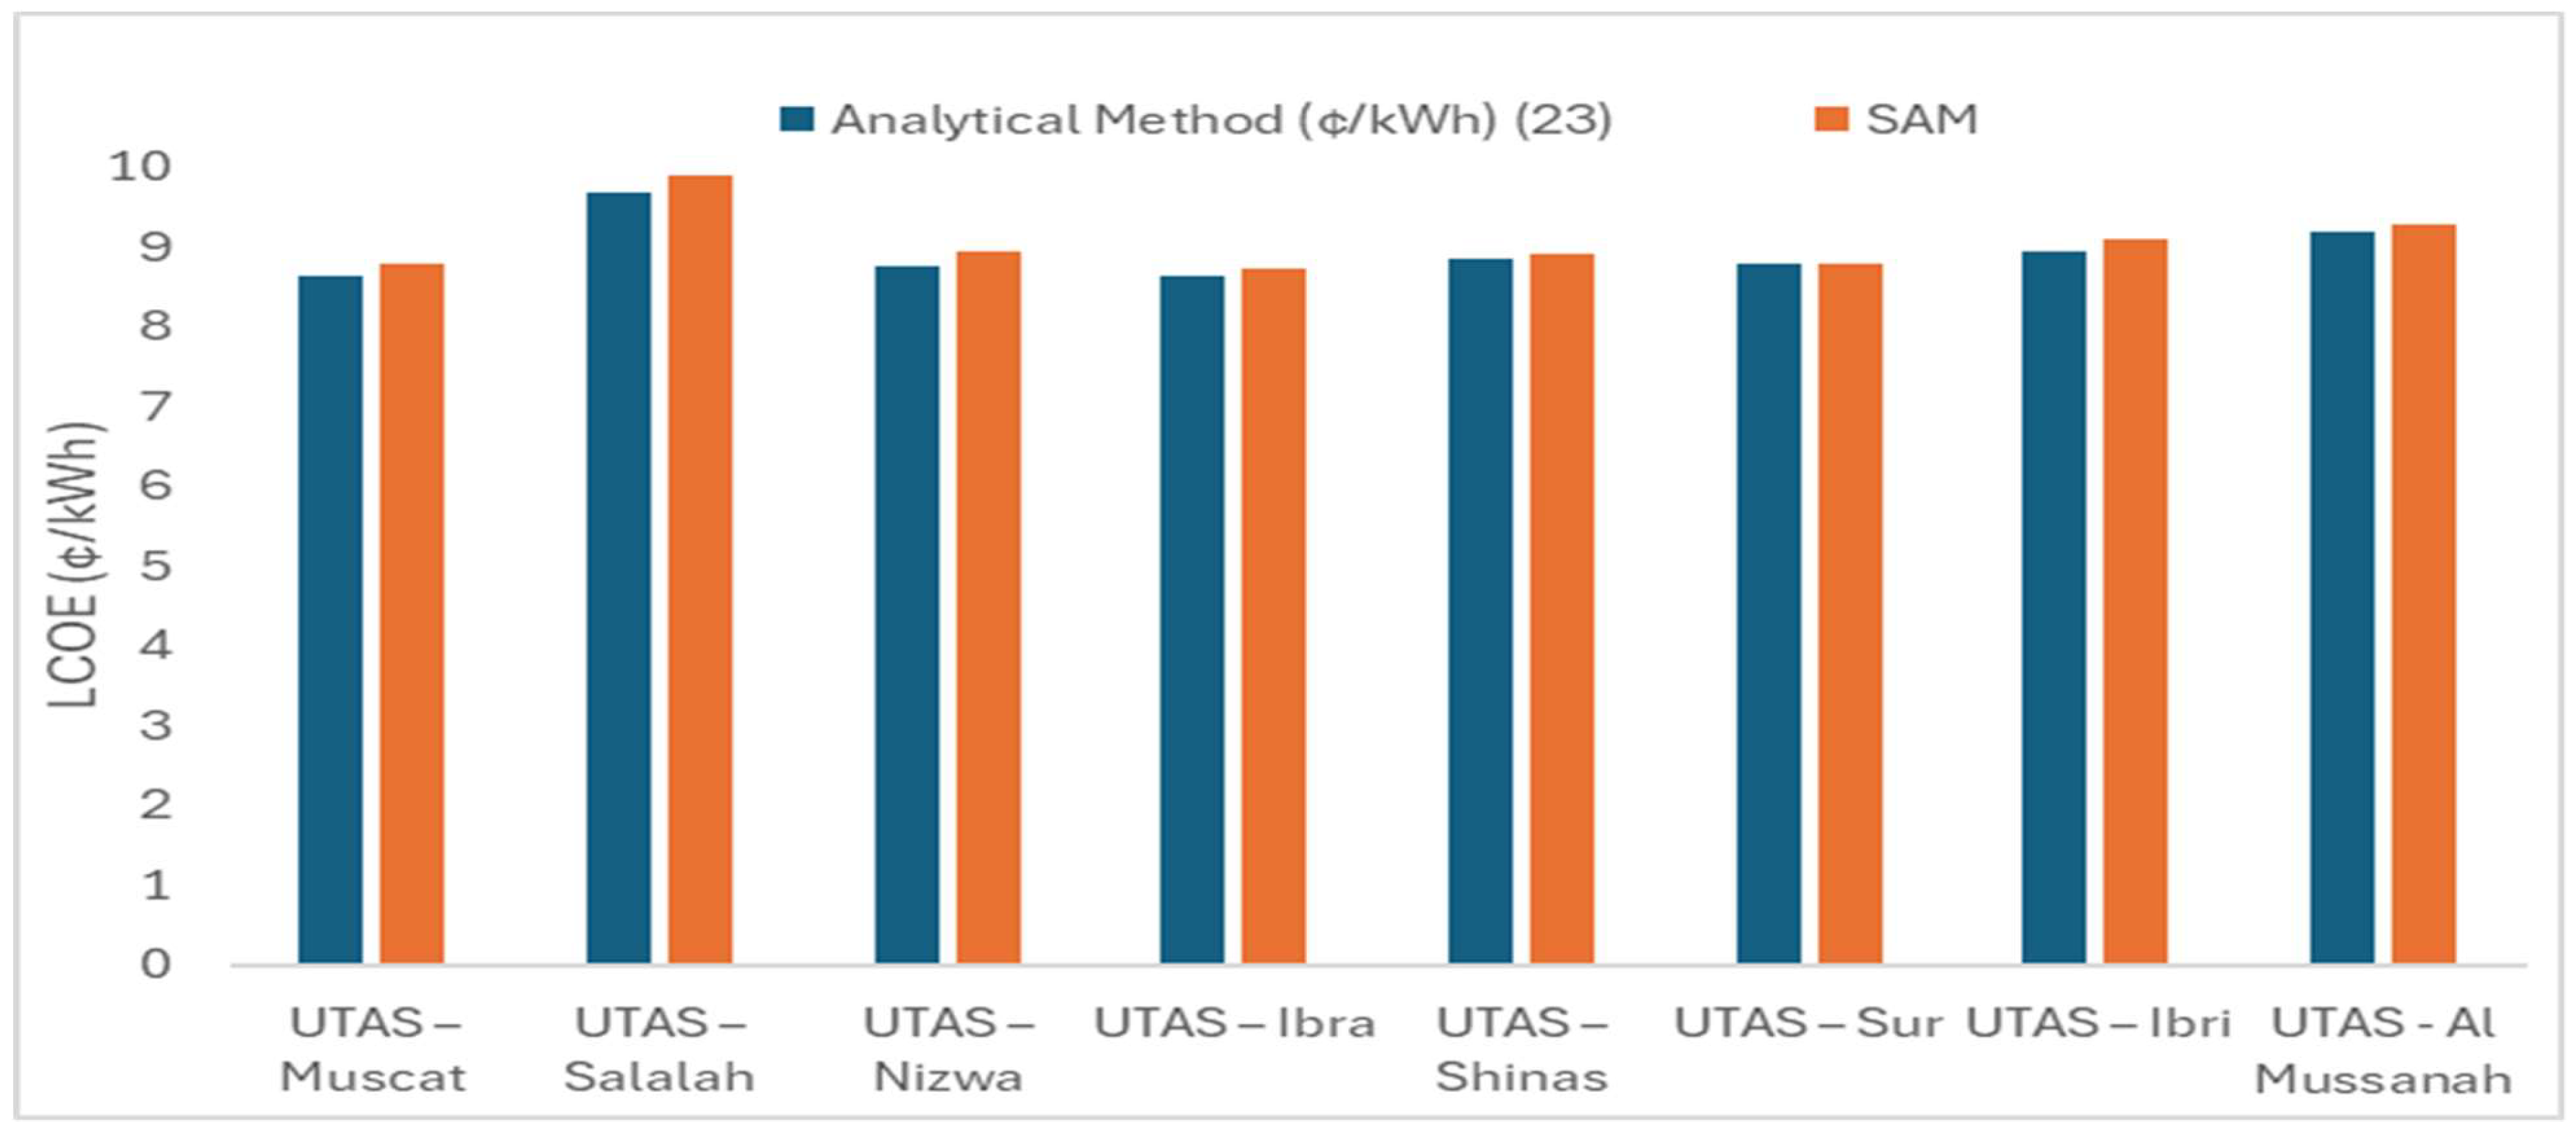

Table 1.
Types of Sand and its characteristics in Oman.
| Types of Sand | Characteristics | Areas covered |
|---|---|---|
| Rub'al Khali (Empty Quarter) [38] | Fine, reddish sand. | Thumrait, Southern Oman |
| Wahiba Sands (Sharqiya Sands) [39] | Fine to medium-grained sand. | Bidiyah, sur, North east corner |
| Coastal Areas [40] | Coarse, white sand | Al-Batinah North and South, Muscat, Ash Sharqiya South, Al-Wusta, Dhofar, Musandam |
| Desert Plains and Gravel Deserts | Mixed coarse sand and gravel. | Ibra, Adam, Ibri, Buraimi |
| Mountain Regions | Coarse sand with rock fragments | Nizwa, Rustaq |
| Alluvial Fans and Wadis | Silty sand and fine gravel | Sohar, Buraimi, Nizwa, Rustaq |
Table 2.
Solar PV project suitability in various regions across Oman.
| Region | Solar Irradiance | Humidity Level | Dust Level | Population Density | Suitability |
|---|---|---|---|---|---|
| Northern Oman | High | Moderate (higher near coast, lower inland) | Moderate to High | High | High |
| Southern Oman (Dhofar, Salalah) | Moderate to High (varies with season) | High during Khareef, moderate otherwise | Low to Moderate | Low to Moderate (highest in Salalah) | Moderate |
| Central Oman | High | Low | High | Very low | Low |
| Western Oman | Moderate to High | Moderate to High near coast, low inland | Low to Moderate | Low | Moderate |
| Coastal Areas | High | High | Moderate | High | High |
| Mountain Areas | Moderate to High (depending on altitude and location) | Low to Moderate | Low | Low | Low to Moderate |
Table 3.
Solar PV for smart bus stop at various UTAS Branches across Oman.
| UTAS Branch Name | Location, Region | Latitude | Longitude |
|---|---|---|---|
| UTAS – Muscat | Al Khoud, Muscat | 23.5803 | 58.4328 |
| UTAS – Salalah | Salalah, Dhofar | 17.0473 | 54.1427 |
| UTAS – Nizwa | Nizwa, Ad Dakhiliyah | 22.8903 | 57.5560 |
| UTAS – Ibra | Ibra, Ash Sharqiyah North | 22.7764 | 58.4934 |
| UTAS – Shinas | Shinas, Al Batinah North | 24.7422 | 56.4292 |
| UTAS – Sur | Sur, Ash Sharqiyah South | 22.5667 | 59.4715 |
| UTAS – Ibri | Ibri, Ad Dhahirah | 23.2424 | 56.4196 |
| UTAS - Al Mussanah | Al Mussanah, Al Batinah South | 23.7432 | 57.5779 |
Table 4.
Solar Powered Smart Bus stop energy Demand.
| Load | Number in Use | Power Rating (W) | Winter (Nov-Mar) |
Summer (Apr, Sep, Oct) |
Peak Summer (May, Jun) |
Vacation (Jul, Aug) |
||||
|---|---|---|---|---|---|---|---|---|---|---|
| T* (Hr) |
E** (W- Hr) |
T* (Hr) |
E** (W- Hr) |
T* (Hr) |
E** (W- Hr) |
T* (Hr) |
E** (W- Hr) |
|||
| Smart AC | 1 | 1000 | 7 | 7000 | 10 | 10000 | 13 | 13000 | 0 | 0 |
| Smart LED light | 10 | 18 | 13 | 2340 | 13 | 2340 | 13 | 2340 | 4.5 | 810 |
| Water Dispenser | 1 | 50 | 7 | 350 | 10 | 500 | 13 | 650 | 0 | 0 |
| Smart TV | 1 | 17 | 13 | 221 | 13 | 221 | 13 | 221 | 4.5 | 76.5 |
| Daily Energy Consumption (kW- Hr) |
9.911 | 13.061 | 16.211 | 8.86 | ||||||
| Monthly Energy Consumption (kW- Hr) |
198.22 | 261.22 | 324.22 | 17.73 | ||||||
T*: Operating Duration, E**: Energy consumed
Table 5.
Types of losses and percentage ranges of losses in Solar PV system [43-45].
| Type of Loss | Description | % range of loss |
|---|---|---|
| Reflection Losses | The glass on solar PV surface reflects the part of solar irradiance on it. | ~2-3% |
| Temperature Losses | Increased temperature reduces the open circuit voltage much more significant. | ~5-10% |
| DC Cable Losses | Due to resistance of the wires | ~1-3% |
| Inverter Losses | During conversion process of DC to AC | ~2-5% |
| AC Cable Losses | Due to resistance of the wires | ~1-2% |
| Shading Losses | Shading due to trees, buildings and clouds. | ~0-1% |
| Losses due to Dust and Dirt | Accumulation of dust due to sandstorm, Industries, and Vehicles | ~2-6% |
| Module Mismatch | Differences in the performance between individual solar panels within a string | ~1-3% |
Table 6.
Canadian Solar Panel characteristics and technical specification data [46].
Table 6.
Canadian Solar Panel characteristics and technical specification data [46].
| Model | CS6W-550MB-AG |
|---|---|
| Nominal Maximum Power (Pmax) | 550 Wp |
| Operating Voltage (Vmp) | 41.7 V |
| Operating Current (Imp) | 13.20 A |
| Open Circuit Voltage (Voc) | 49.6 V |
| Short circuit current (Isc) | 14.00 A |
| Panel Efficiency(η) | 21.4% |
| Cell Type | Mono-crystalline |
| Cell Arrangement | 144 [2 x (12 x 6) ] |
| Dimensions | 2266 ˣ 1134 ˣ 35 mm |
| Weight | 32.2 kg |
Table 7.
Solar PV Optimal data for smart bus stop in UTAS-Ibri.
| Model | CS6W-550MB-AG |
| Sun hours, Ibri () | 6.5Hrs (Eq. (2)) |
| Solar PV system required ( | (Eq. (3)) |
| Number of Panels required () | 5 (Eq. (4)) |
| Number of Panels that can be accommodated on the Rooftop () | 4 |
| Total capacity of Solar PV Array () | 2.2kWp |
| Tilt angle | 21° facing south |
| Azimuth angle | 180° |
Table 8.
Data [48] and the result of sizing an Inverter.
Table 8.
Data [48] and the result of sizing an Inverter.
| Parameter | Values |
|---|---|
| Solar PV Peak power (PVarray) | 2.2 kW (Eq. (5)) |
| Manufactures tolerance of the panel (PVtol) | 0.95 from data sheet |
| Average Temperature, Ibri | 37.37°C [50] |
| Cell temperature (Tcell-temp) | 62.37°C (Eq. (6)) |
| Derate due to dirt deposition (PVderate-dust) | 0.95 (Assumed) |
| Derate due to Temperature (PVderate-temp) | 0.87 (Eq. (7)) |
| Derating power of the solar PV panel (PVderated) | 0.79 (Eq. (8)) |
| Rating of on-grid solar inverter (Invrating ) | 2kW (Eq. (9)) |
Table 9.
Inverter Specification [48].
Table 9.
Inverter Specification [48].
| Model | Maximum PV input voltage (Vmax-inv) |
Minimum PV input voltage (Vmin-inv) |
Maximum PV input current (Imax-inv) |
Maximum Efficiency |
Nominal AC output power (Invrating) |
|---|---|---|---|---|---|
| SG2K-S | 600V | 90V | 10A | 98.2% | 2000W |
Table 10.
Canadian solar Panel temperature characteristics [46].
Table 10.
Canadian solar Panel temperature characteristics [46].
| Temperature Coefficient (β) |
Temperature Coefficient (Voc-tempcoeff) |
Temperature Coefficient (Isc-tempcoeff) |
Nominal Panel operating Temperature | Operating Temperature (tpanel-max) | Temperature Coefficient (Vmp-tempcoeff) |
|---|---|---|---|---|---|
| -0.34 % / °C | -0.26 % / °C | 0.05 % / °C | 41 ± 3°C | 85°C | 0.15 % / °C |
Table 11.
Voltage match results.
| Parameter | Values |
|---|---|
| Maximum power point voltage at Maximum temperature ( Vmp-tmax) | 32.7V (Eq. (10)) |
| Maximum voltage drop in the cables (Vdrop-cable) | 3% assumed |
| Minimum input voltage allowed to the inverter (Vmp-inv) | 31.719V (Eq. (11)) |
| Minimum number of panels (Nmin-module) in a string to maintain Vmin-inv | ~3 Panels (Eq. (12)) |
| Oman lowest temperature (tmin) | ~20°C |
| Maximum open circuit voltage at Minimum temperature ( Voc-tmin) | 50.9 V (Eq. (13)) |
| Maximum number of panels (Nmax-module) in a string to maintain Vmax-inv | ~12 Panels (Eq. (14)) |
Table 12.
Solar array output.
| Parameter | Values |
|---|---|
| Derating factor of the solar PV array ( PVderated) | 0.79 (Eq. (8)) |
| Panel derated power (Pderated) | 434.5 W (Eq. (16)) |
| Sun hour (Hrsun) | 6.5 (Eq. (2)) |
| DC Energy output from array per day (Parray) | 13.035 kWh (Eq. (17) |
| Cable loss () | 3% (Assumed) |
| AC system loss | 1%(Assumed) |
| Total AC Energy output per day (Pac) | 12.29kWh (Eq. (18)) |
| Annual energy form solar PV array ( | 4485.85 kWh (Eq. (19)) |
Table 13.
LCOE Data of Solar powered smart bus stop in UTAS-Ibri
| Parameter | Values |
|---|---|
| Total Solar PV cost | $2400 |
| Inverter cost | $1700 |
| Installation Labor cost and Miscellaneous cost | $220.08 |
| Total Investment cost (It) | $4320.08 |
| Operation cost (Ot) | 0.5% of total Installation cost |
| Maintenance cost (Mt) | $43.2/kW+$3 for every year |
| Replacement cost (Rt) | For every 10th year 10% of the total investment cost |
| Discount (r) | 3% |
| Annual AC energy output (St) | 12.29kWh |
| Degradation rate (d) | 0.5% |
| Lifetime of the project (N) | 25 years |
Table 14.
Performance analysis of solar PV system at various UTAS-Branches during summer.
| UTAS branches | Tavg-temp (approx.) | PVderate-temp | PVderate-dirt | PVderated | Pderated (W) | Parray (kW) | Pac (kW) | EAC (kWh/Ns*) |
CF | Especific-yield (kWh/kW) | PR | |
| Muscat | 40.38 | 0.86 | 0.85 | 0.70 | 383.15 | 9.09 | 13.93 | 13.14 | 1576.49 | 0.26 | 716.59 | 0.66 |
| Salalah | 34.52 | 0.88 | 0.92 | 0.77 | 424.28 | 7.32 | 12.42 | 11.72 | 1405.80 | 0.24 | 639.00 | 0.73 |
| Nizwa | 42.02 | 0.86 | 0.80 | 0.65 | 358.28 | 8.86 | 12.70 | 11.97 | 1436.87 | 0.24 | 653.12 | 0.61 |
| Ibra | 40.55 | 0.86 | 0.80 | 0.66 | 360.37 | 8.89 | 12.81 | 12.08 | 1450.14 | 0.24 | 659.16 | 0.62 |
| Shinas | 40.28 | 0.86 | 0.82 | 0.67 | 369.77 | 8.68 | 12.84 | 12.11 | 1452.83 | 0.24 | 660.38 | 0.63 |
| Sur | 41.22 | 0.86 | 0.85 | 0.69 | 381.88 | 8.88 | 13.56 | 12.79 | 1534.98 | 0.26 | 697.72 | 0.65 |
| Ibri | 42.69 | 0.85 | 0.78 | 0.63 | 348.40 | 9.26 | 12.90 | 12.17 | 1460.30 | 0.24 | 663.77 | 0.60 |
| Al Mussanah | 41.03 | 0.86 | 0.82 | 0.67 | 368.68 | 8.99 | 13.26 | 12.50 | 1500.27 | 0.25 | 681.94 | 0.63 |
*Ns: Number of summer days
Table 15.
Performance analysis with regular cleaning of solar PV system at various UTAS-Branches during summer
Table 15.
Performance analysis with regular cleaning of solar PV system at various UTAS-Branches during summer
| UTAS branches | Tavg-temp (approx..) | PVderate-temp | PVderate-dirt | PVderated | Pderated (W) | Parray (kW) | Pac (kW) | EAC (kWh/Ns*) |
CF | Especific-yield (kWh/kW) | PR | |
| Muscat | 40.38 | 0.86 | 0.95 | 0.78 | 428.23 | 9.09 | 15.57 | 14.68 | 1761.96 | 0.29 | 800.89 | 0.73 |
| Salalah | 34.52 | 0.88 | 0.95 | 0.80 | 438.12 | 7.32 | 12.83 | 12.10 | 1451.64 | 0.24 | 659.84 | 0.75 |
| Nizwa | 42.02 | 0.86 | 0.95 | 0.77 | 425.46 | 8.86 | 15.08 | 14.22 | 1706.28 | 0.29 | 775.58 | 0.73 |
| Ibra | 40.55 | 0.86 | 0.95 | 0.78 | 427.94 | 8.89 | 15.22 | 14.35 | 1722.04 | 0.29 | 782.75 | 0.73 |
| Shinas | 40.28 | 0.86 | 0.95 | 0.78 | 428.40 | 8.68 | 14.87 | 14.03 | 1683.16 | 0.28 | 765.07 | 0.73 |
| Sur | 41.22 | 0.86 | 0.95 | 0.78 | 426.81 | 8.88 | 15.16 | 14.30 | 1715.56 | 0.29 | 779.80 | 0.73 |
| Ibri | 42.69 | 0.85 | 0.95 | 0.77 | 424.33 | 9.26 | 15.72 | 14.82 | 1778.58 | 0.30 | 808.44 | 0.73 |
| Al Mussanah | 41.03 | 0.86 | 0.95 | 0.78 | 427.13 | 8.99 | 15.36 | 14.48 | 1738.12 | 0.29 | 790.05 | 0.73 |
*Ns: Number of summer days
Table 16.
Performance analysis of solar PV system at various UTAS-Branches during non-summer.
| UTAS branches | Tavg-temp (approx..) | PVderate-temp | PVderate-dirt | PVderated | Pderated (W) | Parray (kW) | Pac (kW) | EAC (kWh/Nns*) |
CF | Especific-yield (kWh/kW) | PR | ||||
| Muscat | 29.06 | 0.90 | 0.94 | 0.80 | 442.62 | 7.11 | 12.59 | 11.87 | 2908.36 | 0.24 | 1321.98 | 0.76 | |||
| Salalah | 26.88 | 0.91 | 0.97 | 0.84 | 460.51 | 6.56 | 12.08 | 11.40 | 2791.79 | 0.23 | 1269.00 | 0.79 | |||
| Nizwa | 29.59 | 0.90 | 0.90 | 0.77 | 422.94 | 7.11 | 12.03 | 11.34 | 2779.03 | 0.23 | 1263.19 | 0.73 | |||
| Ibra | 28.13 | 0.90 | 0.90 | 0.77 | 425.27 | 7.18 | 12.21 | 11.52 | 2821.88 | 0.23 | 1282.67 | 0.73 | |||
| Shinas | 28.91 | 0.90 | 0.91 | 0.78 | 428.74 | 7.01 | 12.02 | 11.34 | 2777.51 | 0.23 | 1262.50 | 0.74 | |||
| Sur | 29.83 | 0.90 | 0.94 | 0.80 | 441.34 | 7.05 | 12.45 | 11.74 | 2875.43 | 0.24 | 1307.02 | 0.76 | |||
| Ibri | 28.11 | 0.90 | 0.90 | 0.77 | 425.31 | 7.23 | 12.30 | 11.60 | 2841.74 | 0.23 | 1291.70 | 0.73 | |||
| Al Mussanah | 29.06 | 0.90 | 0.92 | 0.79 | 433.20 | 7.03 | 12.18 | 11.49 | 2814.45 | 0.23 | 1279.29 | 0.74 | |||
*Nns: Number of non-summer days
Table 17.
Performance analysis with regular cleaning of solar PV system at various UTAS-Branches during non-summer
Table 17.
Performance analysis with regular cleaning of solar PV system at various UTAS-Branches during non-summer
| UTAS branches | Tavg-temp (approx..) |
PVderate-temp | PVderate-dirt | PVderated | Pderated (W) | Parray (kW) | Pac (kW) | EAC (kWh/Nns*) |
CF | Especific-yield (kWh/kW) | PR | |
| Muscat | 29.06 | 0.90 | 0.97 | 0.83 | 456.75 | 7.11 | 12.99 | 12.25 | 3001.18 | 0.25 | 1364.17 | 0.78 |
| Salalah | 26.88 | 0.91 | 0.97 | 0.84 | 460.51 | 6.56 | 12.08 | 11.40 | 2791.79 | 0.23 | 1269.00 | 0.79 |
| Nizwa | 29.59 | 0.90 | 0.97 | 0.83 | 455.84 | 7.11 | 12.96 | 12.23 | 2995.17 | 0.25 | 1361.44 | 0.78 |
| Ibra | 28.13 | 0.90 | 0.97 | 0.83 | 458.35 | 7.18 | 13.16 | 12.41 | 3041.36 | 0.25 | 1382.43 | 0.79 |
| Shinas | 28.91 | 0.90 | 0.97 | 0.83 | 457.01 | 7.01 | 12.81 | 12.08 | 2960.64 | 0.24 | 1345.75 | 0.78 |
| Sur | 29.83 | 0.90 | 0.97 | 0.83 | 455.42 | 7.05 | 12.84 | 12.11 | 2967.20 | 0.24 | 1348.73 | 0.78 |
| Ibri | 28.11 | 0.90 | 0.97 | 0.83 | 458.39 | 7.23 | 13.26 | 12.50 | 3062.77 | 0.25 | 1392.17 | 0.79 |
| Al Mussanah | 29.06 | 0.90 | 0.97 | 0.83 | 456.75 | 7.03 | 12.84 | 12.11 | 2967.41 | 0.24 | 1348.82 | 0.78 |
*Nns: Number of non-summer days
Table 18.
Solar PV system design flow for smart bus stop using SAM
| Design Flow | Selection of Devices / Set the parameters |
|---|---|
|
Input Data for Location and Resources: Set the location of the university. Download weather file data and calculate the annual averages of solar irradiance for that location. |
Refer Table 3 |
|
Panel selection Select the suitable panel from the panel database |
Alexus Solar ALEX-550-b-72-S |
|
Inverter selection Select the suitable inverter from the inverter database |
Inverter HMS-2000-4T-NA |
|
Design a System: Set the number of inverters. Configure the number of panels per string in the subarray Set tracking and orientation. |
Number of Inverters: 1 Panels per string in sub array: 1 Number of Panels in sub array: 4 Tilt angle = Latitude angle Azimuth =180 degree Tracking = Fixed |
|
Calculate losses: Irradiance loss due to soiling, DC loss, AC loss, Transformer loss, Transmission loss Set the percentage of soiling loss |
Soiling losses = 5 % DC wiring loss = 3% AC loss = 1% |
| Set grid limit | It is set to export the power when it is not utilised. |
| Set annual Degradation rate | 5% |
| Installation cost Set investment cost: Set operation and maintenance cost Set inflation rate, real discount rate Set sales tax and incentives |
Investment cost = $4320 Operation and maintenance cost : 43.2 $/kW-yr Indirect capital cost, inflation rate, real discount rate = $0 Sales Tax = $0 |
| Upload Electricity Tariff | [46] |
| Upload smart bus stop load | Table 4 |
| Simulate the software and collect the summary report | |
Table 19.
Review of supportive rooftop solar PV policies
| Country | Policies Followed | Findings | Reference |
|---|---|---|---|
| Germany | Feed in Tariff (FiT) | Series of legalization has been applied for most effective feed in tariff. | [55-56] |
| Market Incentive Program |
Bank provides extra funding for small size renewable powered installation. | [57-58] | |
| Hauswende policy | Low-interest rate loans to renovate their buildings to install solar panels. | [59] | |
| Solar energy auction |
Instead of FiT, solar PV developers can participate in competitive auctions to sell their solar generated electricity. | [60] | |
| China | Renewable Energy law | In 2005, government framed renewable energy law under this the following mechanism established: 1. Ensures the market scale and direct investment of renewable energy by protecting strong policy. 2. Framed purchase policies to grid companies to purchase all renewable electricity. 3. Renewable energy producers favored feed in tariff system. 4. Introduced a cost sharing mechanism to sell renewable electricity to the utilities and end users. 5. The renewable energy special fund to support renewable energy research projects. | [61-62] |
| The brightness program and Township Electrification Program | In 1996, The brightness program provided 100W per person on daily basis through solar PV and wind power to the un electrified area. In 2002 Township electrification program provided standalone solar PV to the un electrified towns. | [62] | |
| Solar subsidy Program | Solar Roof Program: In 2009, rooftop subsidy program provides a subsidy for less than 50 kW rooftop system includes on grid inverter, battery and solar PV. Golden sun demonstration Program: In 2009, this program provides 50% subsidy for the on grid solar PV installation cost and 70% for the off grid solar PV installation cost for more than 300kW system size. |
[63] | |
| Poverty Alleviation Program | This program provides financial help to poor regions by installing rooftop solar PV on their homes and community building and sell the solar PV electricity to the grid and the revenue is shared with the participating homeowners. For installation of solar PV, they can get subsidy 3000 yuan from Government and 70% loan from bank. | [64] | |
| Feed in Tariff | In 2011, national wide stable and fixed FiT policy provides the FiT price is higher than the concession bidding process rate. This FiT rate is vary based on the location and type of renewable energy. | [65] | |
| Free grid connection services | The state grid corporation of China provides the free connection services such as technological assistance, equipment testing, grid integration plan for the installed capacities of less than 6 MW to help struggling domestic solar PV industry. | [62] | |
| USA | Energy Policy Act 2005 | In 2005, this policy provided a 30% investment tax credit for PV system investment. This act was complemented by accelerated depreciation, which was approximately 26% to the tax benefit. It reduces the system cost approximately 56 % over six period of many investors. | [65-67] |
| Solar America Initiative | In 2007, under this scheme 13.7 million USD sponsored to eleven university led advanced solar PV projects in manufacturing process and products. | [68] | |
| Sun shot initiative | In 2011, this program helped to reduce the cost of solar installation and supported the growth of solar energy as a viable mainstream power source. | [69-70] | |
| Greenhouse gas reduction fund - Solar for all program | A part of this fund is aimed to support the under privileged community, low income group to benefit from distributed solar energy. | [71] | |
| State incentives | Each state have different incentives, financing options like state tax credits, performance based incentives and solar renewable energy certificates which solar electricity provider can sell. | [72] | |
| Feed in Tariff | Each state has different feed in Tariff. Through net metering policy, home owners can sell their extra solar electricity. | [73] | |
| Japan | Feed in tariff | In 2012 new FiT scheme was introduced for ten to twenty years contract, it is fixed and above market rate. | [74] |
| National subsidy program | The government introduced in 1994 for residential installation of solar PV. This subsidy was covered 50 % of the installation cost for installed capacity maximum up to 5kW. | [75] | |
| Zero energy houses | One way for zero energy houses is installing solar PV systems on their building. Building owners receive subsidies under this scheme to construct and renovate their houses to Zero energy houses | [76-77] | |
| India | Rooftop Solar Programme Phase-II subsidy | It offers financial incentives for the rooftop solar PVinstallation. Homeowners can receive up to 40% Capital subsidy for system up to 3kW and 20% subsidy for system between 3kW and 10kW. | [78] |
| Net metering policy | This scheme provides to the homeowners can export the solar electricity to the grid and receive credits on their electricity bills. | [79] |
Disclaimer/Publisher’s Note: The statements, opinions and data contained in all publications are solely those of the individual author(s) and contributor(s) and not of MDPI and/or the editor(s). MDPI and/or the editor(s) disclaim responsibility for any injury to people or property resulting from any ideas, methods, instructions or products referred to in the content. |
© 2024 by the authors. Licensee MDPI, Basel, Switzerland. This article is an open access article distributed under the terms and conditions of the Creative Commons Attribution (CC BY) license (http://creativecommons.org/licenses/by/4.0/).
Copyright: This open access article is published under a Creative Commons CC BY 4.0 license, which permit the free download, distribution, and reuse, provided that the author and preprint are cited in any reuse.


