Preprint
Article

This version is not peer-reviewed.

Effects of Sarcosine (N-Methylglycine) on NMDA Receptor Hypofunction Induced by MK801: In Vivo Calcium Imaging in the CA1 Region of the Dorsal Hippocampus

A peer-reviewed article of this preprint also exists.

Submitted:

25 October 2024

Posted:

28 October 2024

You are already at the latest version

Abstract

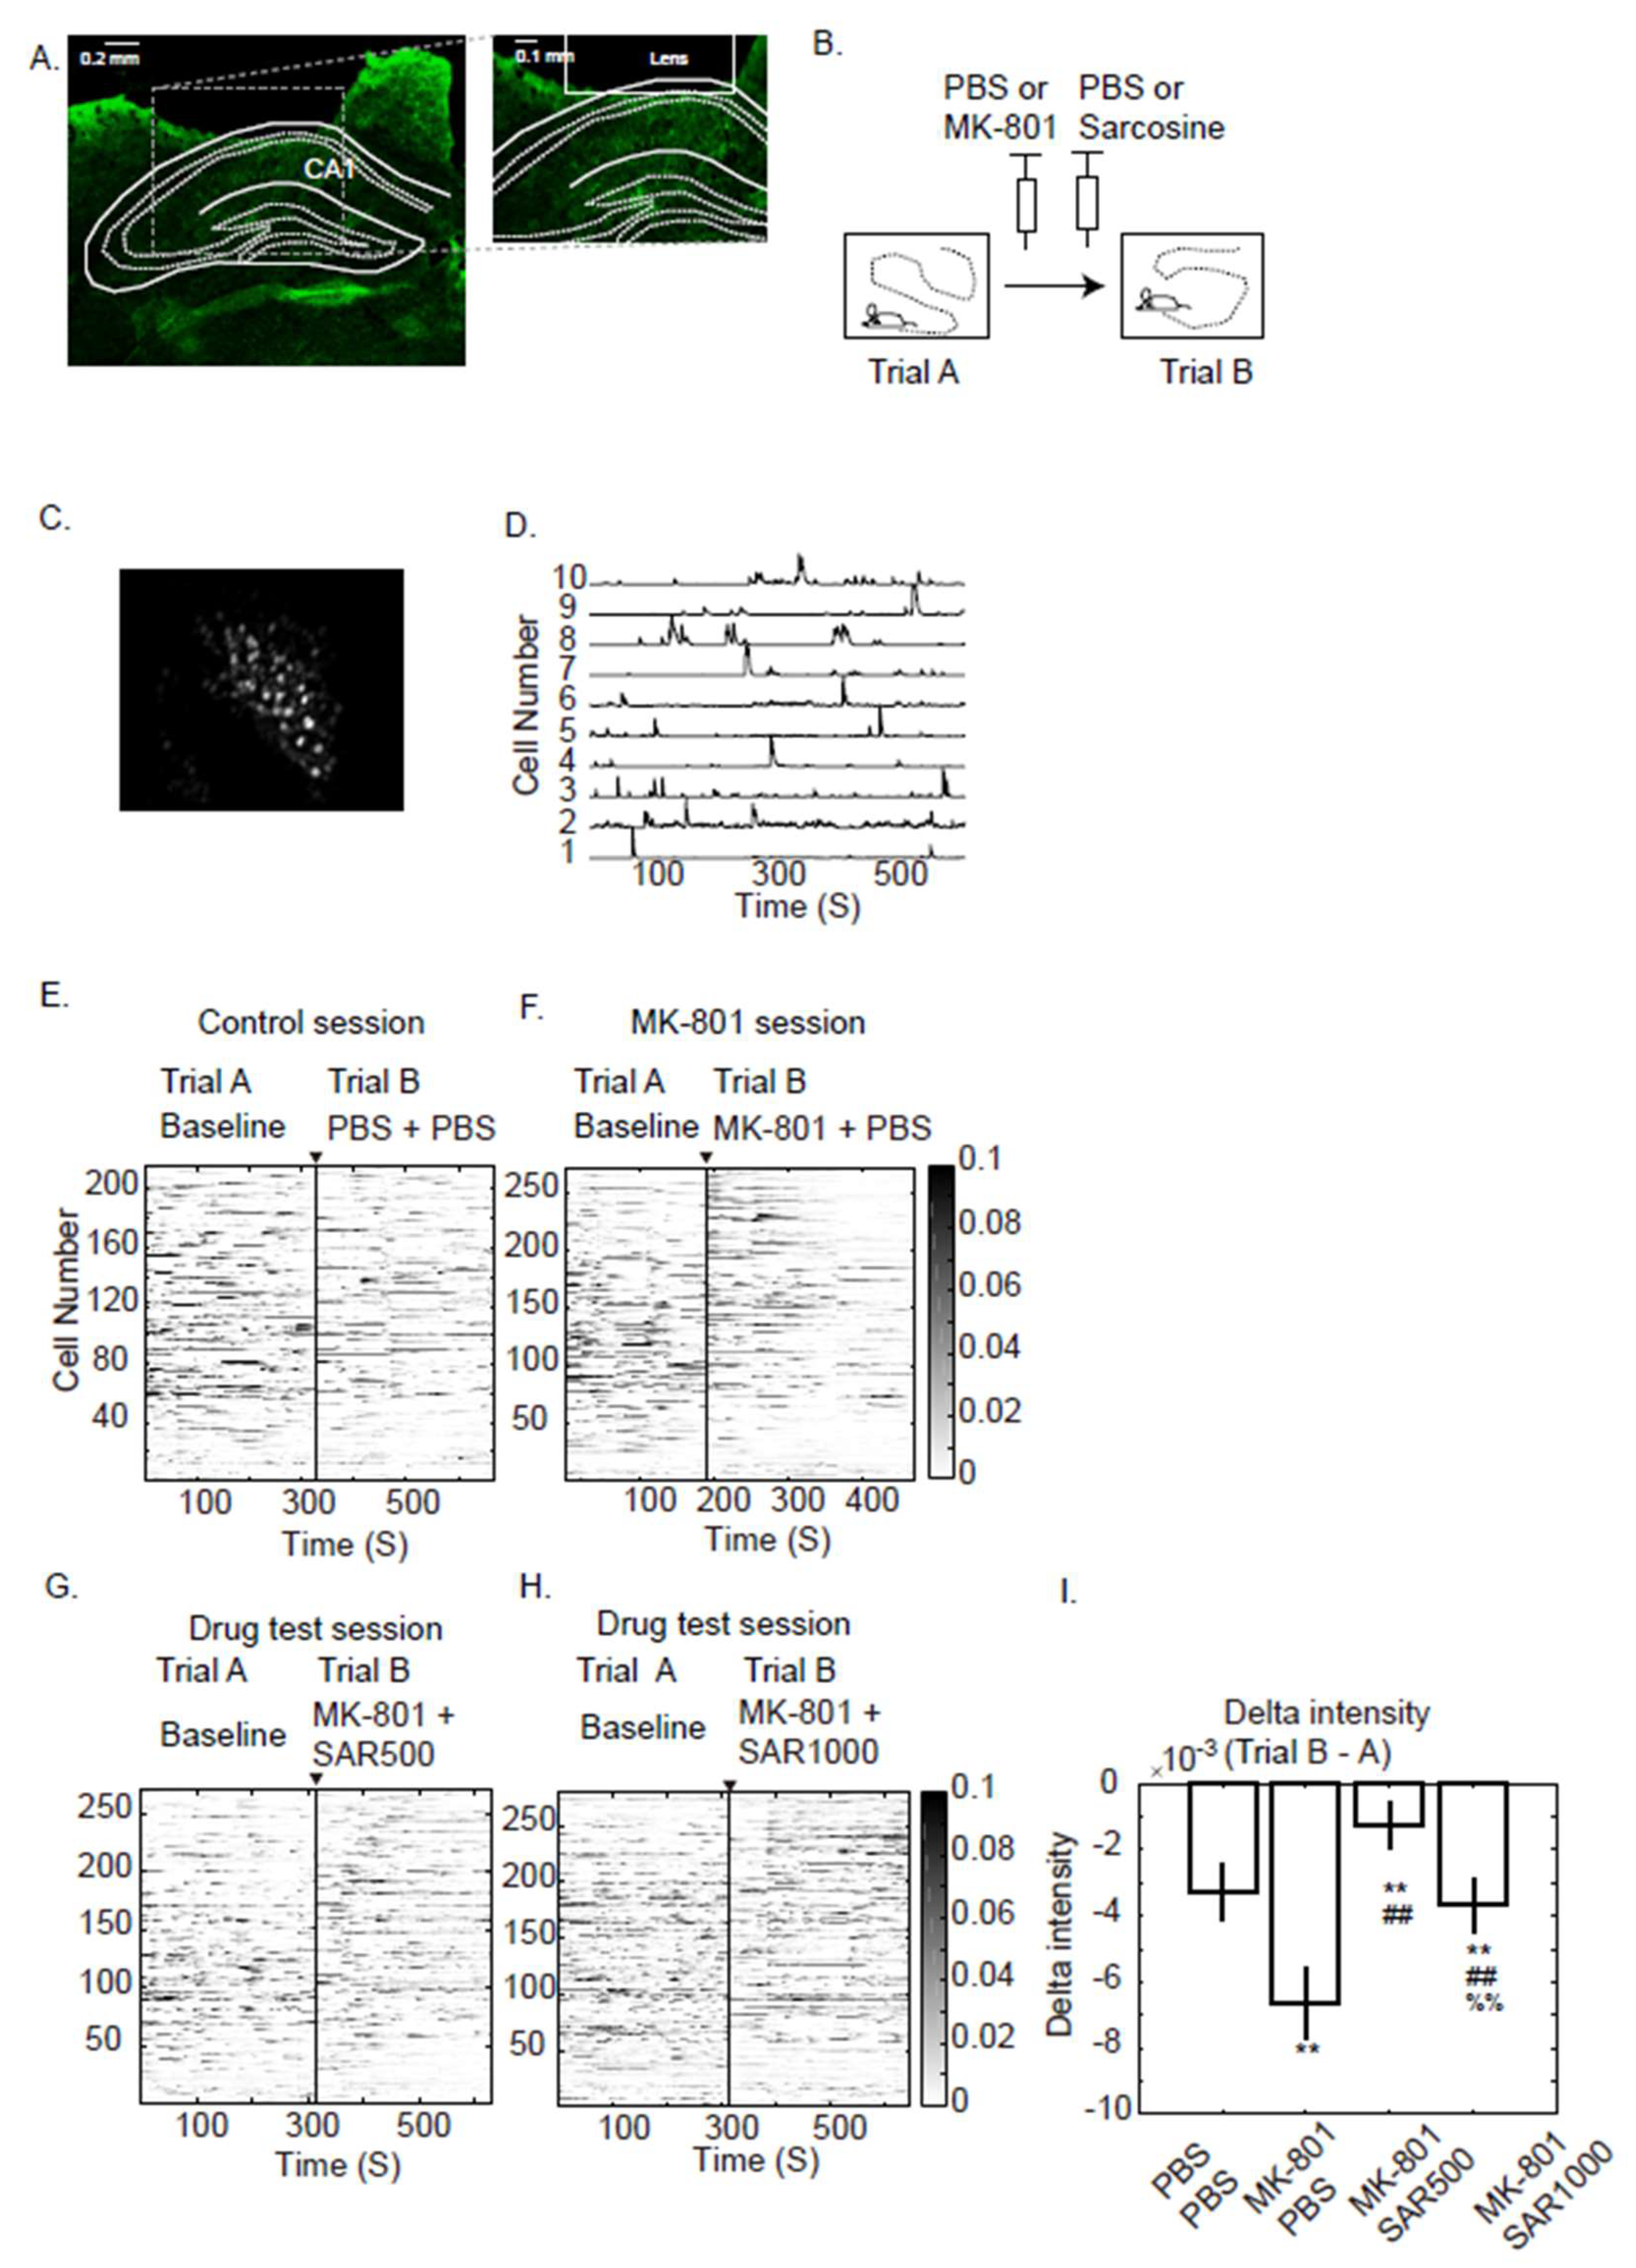
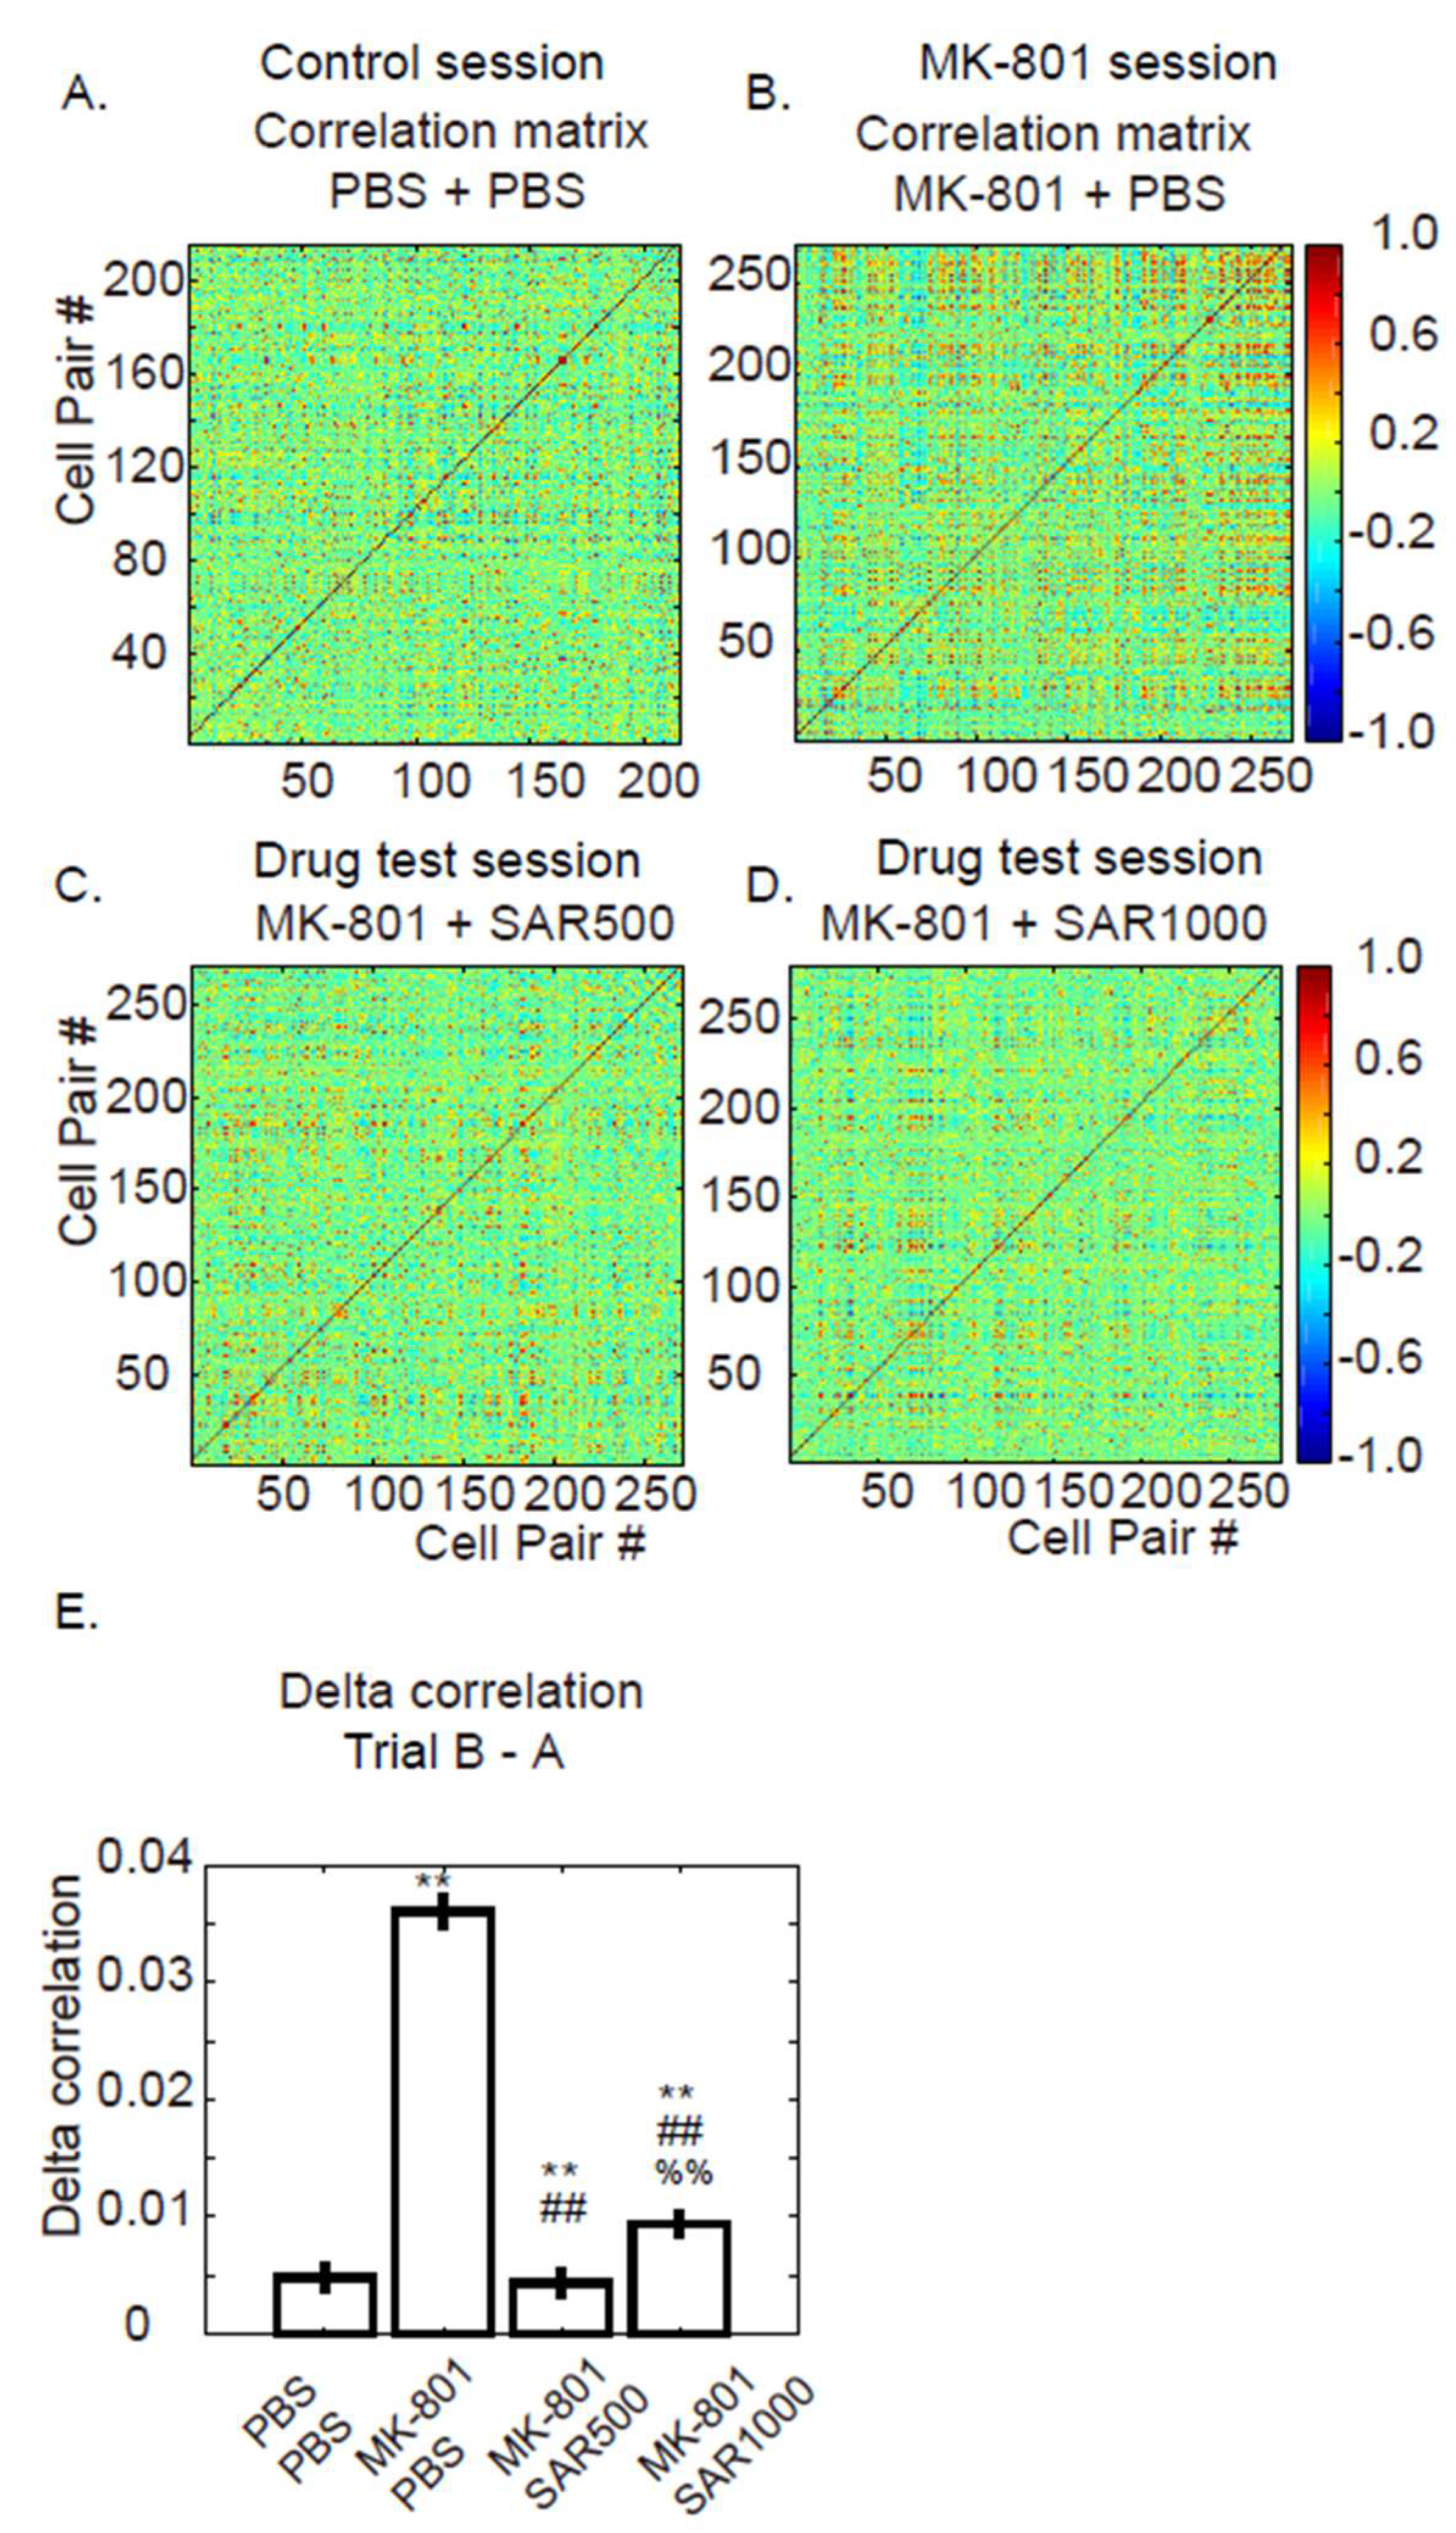
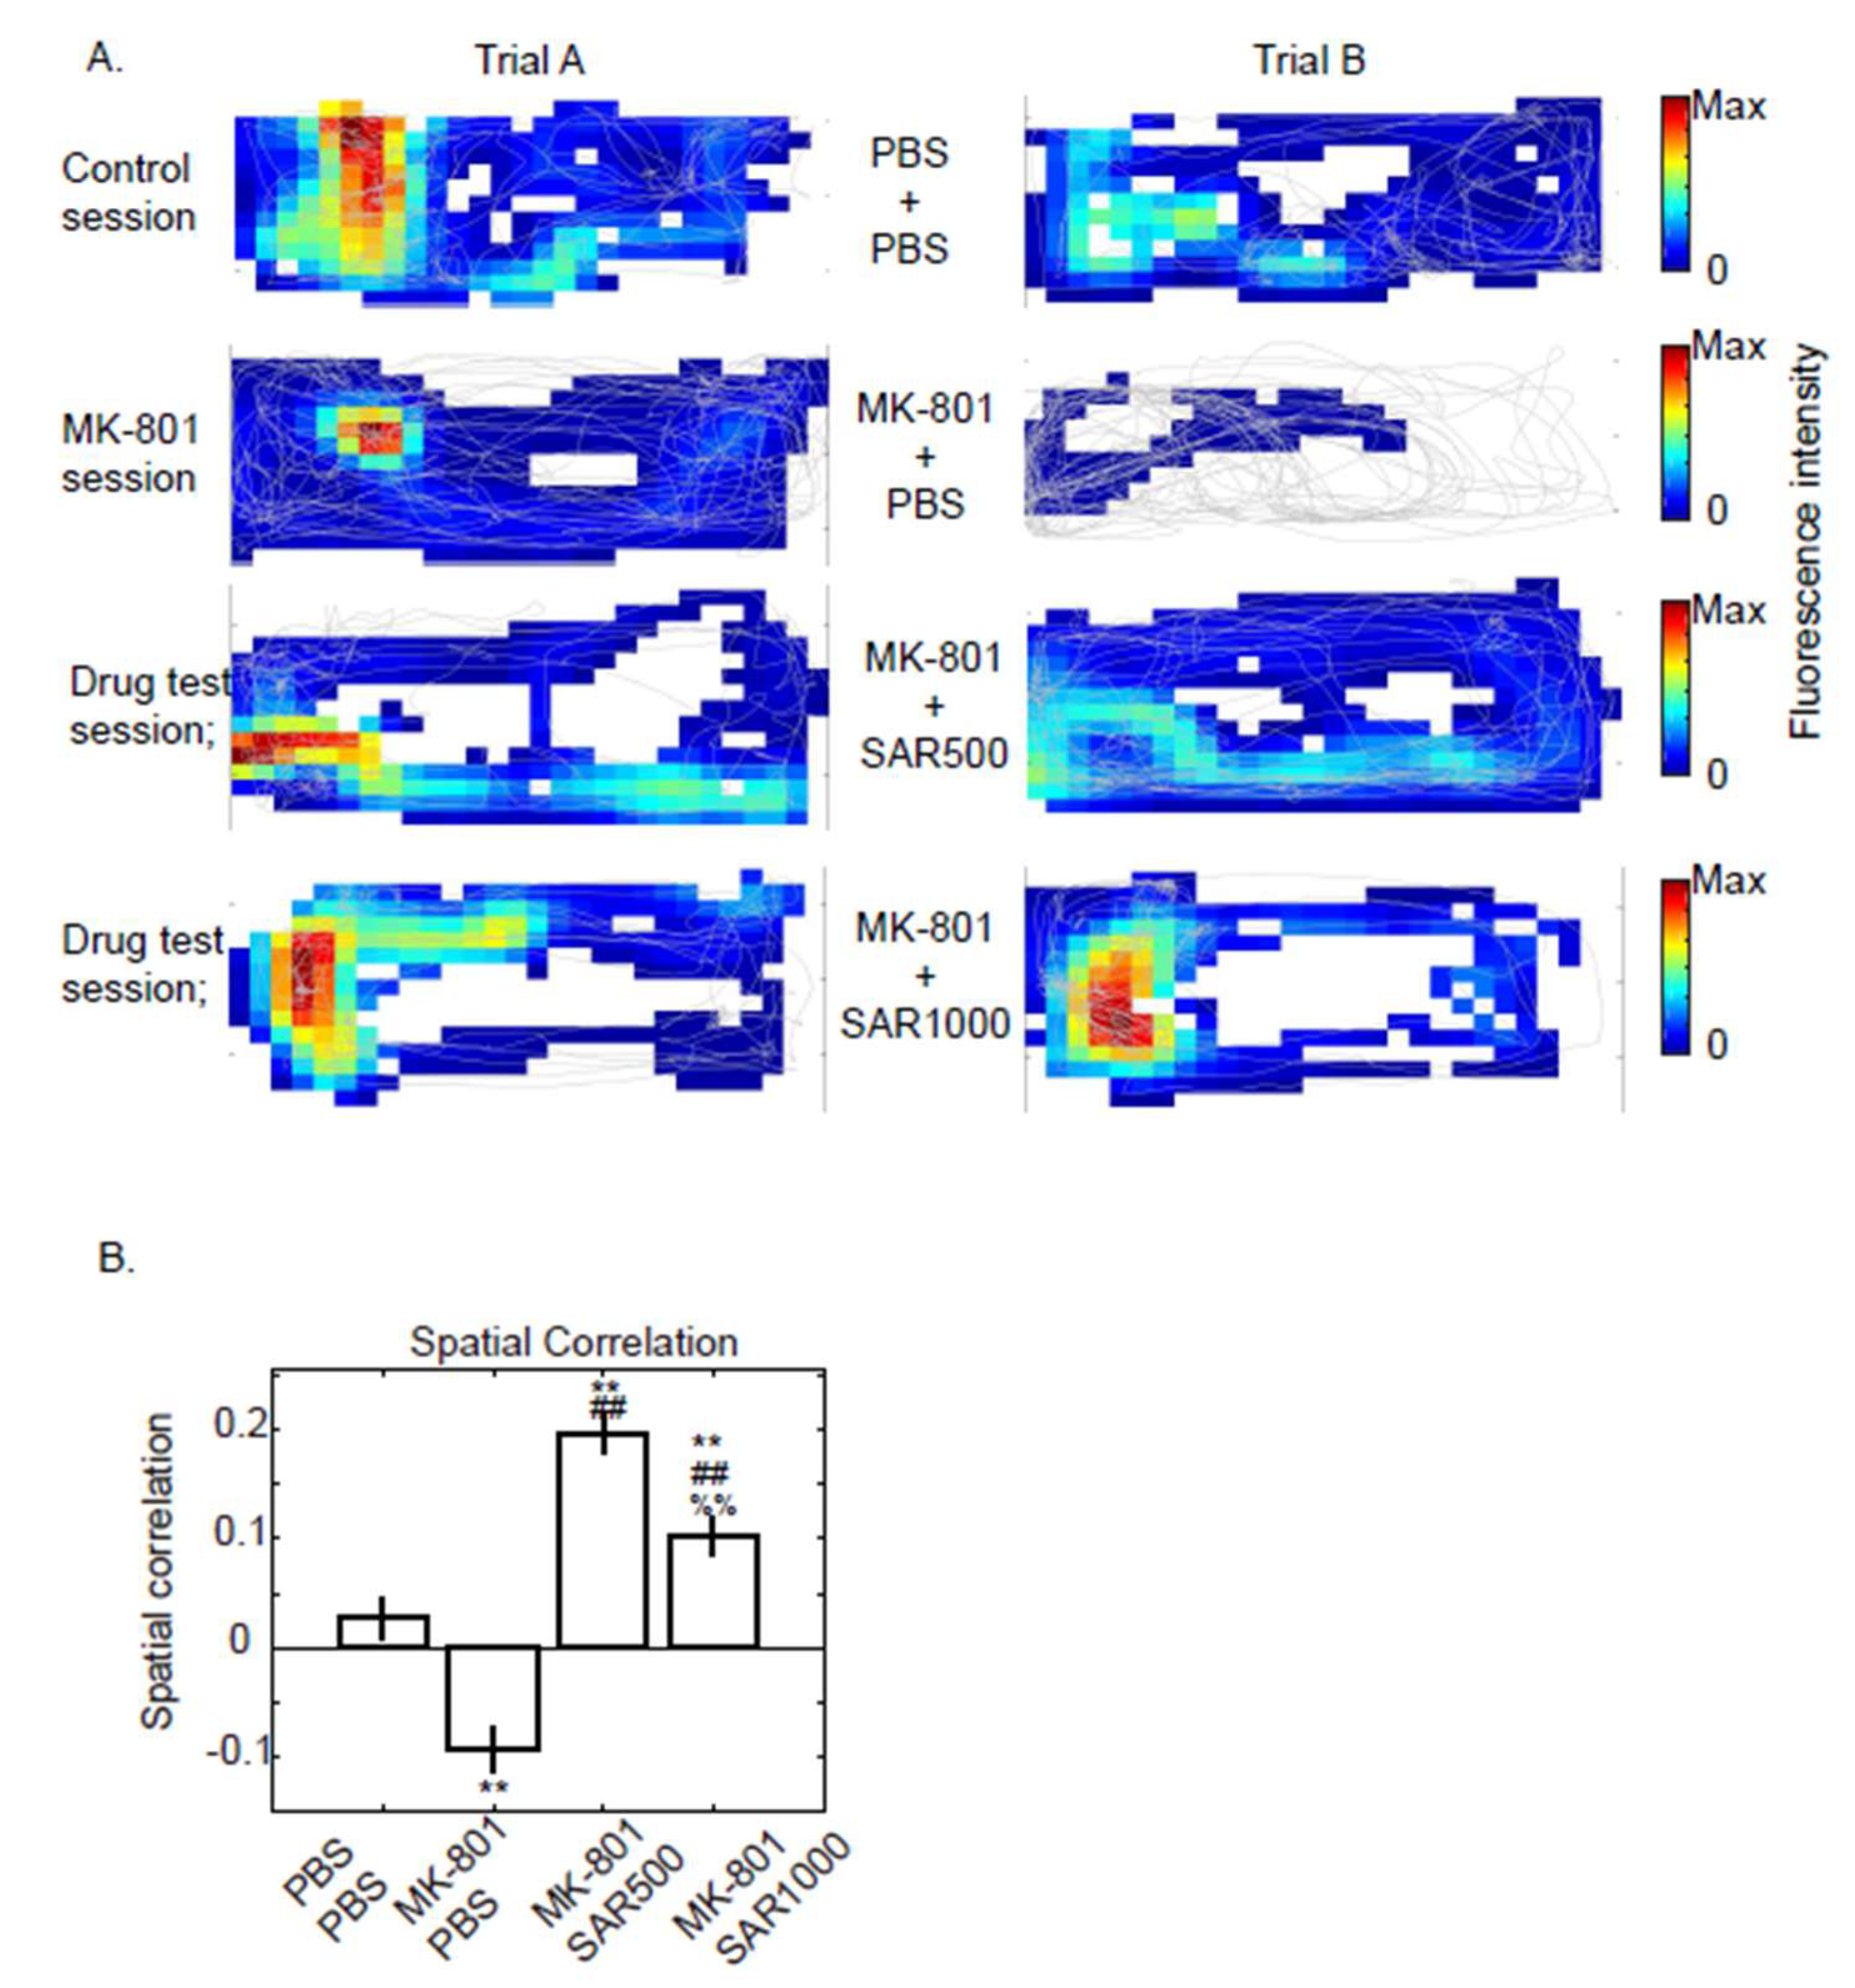
Hypofunction of the glutamate system in the brain is one of the pathophysiological hypotheses for schizophrenia. Accumulating animal and clinical studies show that sarcosine (N-methylglycine), a glycine transporter-1 inhibitor, is effective for ameliorating the negative and cognitive symptoms of schizophrenia. The aims of the present study were to observe the effects of sarcosine on neuronal activity in the dorsal CA1 (dCA1) hippocampal neurons within an NMDA receptor hypofunction model induced by MK801. We applied in vivo calcium imaging to observe the dynamics of fluorescence from the dCA1 hippocampal neurons when the mice were exploring in an open field. Using this tool, we directly measured and compared neuronal properties between sarcosine-treated and untreated mice. At the same time, the physiological function of the neurons was also quantified by measuring their place fields. Our data demonstrated that MK-801 (0.2 mg/kg) diminished the fluorescence intensity of dCA1 neurons that had been genetically modified with a calcium indicator. MK-801 also significantly increased the correlation coefficient between the fluorescence dynamics of pairs of cells, a feature that may be linked to the symptom of disorganization in human patients with schizophrenia. The spatial correlations of place fields in the mice were impaired by MK-801 as well. Injected sarcosine (500 mg or 1000 mg/kg) significantly alleviated the abovementioned abnormalities. Our data provide evidence to support the use of sarcosine to alleviate symptoms of schizophrenia, especially hippocampus-related functions.

Keywords: 
;  ;  ;  ;  

1. Introduction

Hyperactivity of the dopamine system and hypofunction of the glutamate system are two leading theories for the pathophysiology of schizophrenia [1,2,3,4]. The symptoms of schizophrenia have been categorized into positive and negative symptoms [5], which may relate differently to these theories. For instance, N-methyl-D-aspartate (NMDA) receptor hypofunction has been hypothesized to be a key cause of negative symptoms of schizophrenia [2,3,4,6,7]. Cognitive impairment is also a serious problem in patients with schizophrenia [6,7,8]. Drugs that have been developed to potentiate the function of NMDA receptors have been found to be effective in improving cognitive deficits in schizophrenia [6,7,9,10]. Although the NMDA receptor is critical, the pharmacological mechanisms for currently available antipsychotics are mainly focused on the dopamine receptor system [11]. However, dopamine-targeting drugs do not alleviate both positive and negative symptoms; therefore, developing glutamate-targeting drugs has gained much attention in recent years [6,9].
One of the straightforward strategies for enhancing the function of the NMDA receptor is the administration of glutamate. Unfortunately, this therapeutic strategy is limited by the blood-brain barrier [12], which restricts peripheral glutamate from passing to the central nervous system. Alternately, the modulation sites on the NMDA receptor become a main target for developing antipsychotics for schizophrenia. Activation of the NMDA receptor requires not only glutamate binding but also synaptic depolarization and activation of glycine modulatory sites [6]. Therefore, the glycine modulatory site on the NR1 subunit of the NMDA receptor is a potential therapeutic target. In clinical tests, oral administration of glycine significantly improves negative syndromes [13,14]. However, the effective dose needed to cross the blood-brain barrier is high (0.8 g/kg/day) [13,14] and may cause upper gastrointestinal tract discomfort [14]. In recent years, another amino acid, sarcosine (N-methylglycine), was found to be effective as both add-on therapy and monotherapy for schizophrenia in clinical trials [15,16,17,18]. The recommended dose for treating schizophrenia is 2 g/day [15], which is far less than the recommended dose of glycine. Sarcosine was first recognized as an adjuvant medication for schizophrenia because sarcosine indirectly increases synaptic glycine levels by selective inhibition of glycine transporter 1 [19]. The action of sarcosine seems to have multiple underlying pharmacological mechanisms. Pei et al. demonstrated that sarcosine also increases D-serine, a glycine modulatory site agonist in CSF [20]. Moreover, they also reported that sarcosine decreases the surface trafficking of the NR1 subunit of the NMDA receptor and may coactivate directly on the glycine modulatory site [20]. In their experimental design, they used several animal models, such as transgenic mice, MK-801-exposed mice [20,21,22], and brain slices of wild-type mice, to test the underlying therapeutic mechanisms of sarcosine. We noticed some interesting data from their results. First, PET/CT showed that sarcosine ameliorated the MK-801-induced high standardized uptake value of 18F-FDG in the dorsal hippocampus. Second, sarcosine enhances the NMDA receptor-mediated field excitatory postsynaptic potential slope in wild-type mouse hippocampal slices. Pei et al. also performed several behavioral tasks to test whether sarcosine improves MK-801-induced behavioral deficits. In their experiments, they used several groups of animals for various approaches to portray the effect of sarcosine on schizophrenia. They demonstrate that intraperitoneal injection of MK-801 causes decrease of exploratory behavior, sensorimotor gating function, learning and memory functions, and increase of depressive-like behavior in mice which are schizophrenia-related behaviors [20]. In addition, sarcosine alleviated above mentioned schizophrenia-related behavioral in MK-801 mouse model of schizophrenia [20]. We assumed that directly observing the influences of sarcosine on hippocampal neurons in their MK-801-induced schizophrenia like model as the animals are freely behaving may provide evidence for explaining the potential impacts of sarcosine on improving neuronal functions which are processed in hippocampus. We used in vivo calcium imaging in freely moving mice to observe their dorsal hippocampal CA1 (dCA1) neurons [23]. We acquired over 400 neurons in 3 mice (Table 1) and analyzed their properties and physiological functions. The best-known physiological function of dorsal hippocampal cells is their ability to encode spatial memory. Neurons in the hippocampus that preferentially fire when an animal visits a specific place are referred to as place cells [24]. The aim of the present study was to directly observe neurons in the dorsal hippocampus of the MK-801-induced schizophrenia like model [20,21,22] and test whether sarcosine rescues the abnormality of neurons in terms of cell properties. We compared the properties of single, paired, and assembled cells between sarcosine-treated and untreated neurons. Although glutamatergic transmission is implicated in schizophrenia and multiple brain region are involved [20], we narrowed down the target research region to dCA1 as pervious study demonstrated that MK-801 induces abnormalities in dorsal hippocampus which are improved by sarcosine [20]. Our results may pave the way for observing how the dCA1 neurons are influenced in MK-801-induced schizophrenia like model and ability of sarcosine for alleviating the abnormalities.

2. Materials and Methods

2.1. Substances and Animals

Sarcosine (#157741000; Acros Organics; New Jersey, USA) or MK-801 (#M107; Sigma; Merck, Darmstadt, Germany) were separately dissolved in PBS and used immediately when performing the experiment. Concentrations of 0.02 mg/ml for MK-801 and 100 mg/ml or 50 mg/ml for sarcosine were prepared in PBS, which resulted in 0.2 mg/kg of MK801 and 1000 mg/kg or 500 mg/kg of sarcosine in an injection volume of 0.3 ml for a 30-gram mouse [20]. Three male C57BL/6JNarl (26 – 30 g; National Laboratory Animal Center, Taipei, Taiwan) mice were used. The mice were housed in a temperature-controlled room (23 ± 1 °C) with a 12:12 h light:dark cycle. Food and water were available ad libitum. Because we planned to observe the putative place cells in the dCA1, the mice were pretrained for exploration in an open field. The animals were allowed to explore freely in a 15 cm × 30 cm open field for 10 minutes for at least 3 days before the surgery. All procedures performed in this study were approved by the National Taiwan University Animal Care and Use Committee (Approval No.: NTU-109-EL-00029).

2.2. Surgery and Viral Injection

The surgery and viral injection protocols were adapted from Resendez et al.’s report [23] and the UCLA Miniscope Team’s surgery guidelines (http://miniscope.org/index.php/Surgery_Protocol). The mice were subcutaneously injected with an analgesic (buprenorphine, 0.03 mg/kg) and atropine (0.04 mg/kg) to prevent the accumulation of saliva and then anesthetized with isoflurane (induction, 5%; maintenance, 1-2%) in oxygen. Two stainless steel screws were surgically anchored onto the left frontal and interparietal bones. A craniotomy with a diameter of 2.0 mm was performed with the center at AP -2.25 mm, ML +1.8 mm relative to bregma. The dura and cortex were carefully removed by suction with a 27 G needle until the corpus callosum above the dCA1 was exposed. Five hundred nanoliters of viral vectors (AAV-syn-jGCaMP7s-WPRE; 1.5x10¹³, # 104487-AAV9; Addgene viral prep; MA, USA) were injected into the dCA1 (AP: -2.0 mm, ML: +1.5 mm, DV: 1.5 mm, relative to bregma). After the injection had infused for 10 minutes, a gradient index (GRIN) lens (# 64519, diameter 1.8 mm, length 4.31 mm; Edmund Optics; NJ, USA) was implanted onto the dCA1 (AP: -2.25 mm, ML: +1.8 mm, DV: 1.3 mm, relative to bregma) and glued with little light cure adhesive (#3321; Loctite; Düsseldorf, Germany). The anchor screws and GRIN lens were then fixed with dental cement (Tempron; Tokyo, Japan). Since the GRIN lens needs to protrude from the surface of the skull as much as possible and may be easily damaged by the animal, molding silicone rubber (ZA22 Thixo; Zhermack; Badia Polesine, Italy) was applied to the lens and then covered with a thin layer of dental cement to protect the GRIN lens. After 6 weeks of incubation, the mice were sedated with isoflurane (induction, 5%; maintenance, 0.8-1.5%) and fixed in a stereotactic frame. Their silicone rubber was removed, and the surface of the GRIN lens was cleaned with 75% alcohol. A custom-made Miniscope with a baseplate (V3; http://miniscope.org) was placed onto the lens under to monitor the data acquisition software (http://miniscope.org/index.php/Data_Acquisition_Software). The height of the baseplate was adjusted with the stereotactic frame until we saw bright puncta, which represented jGCaMP7s-expressing neurons. The baseplate was carefully cemented in its present location and detached from the Miniscope. After the dental cement was completely dry, the mice were moved to a box for recovery and then placed back to their home cage. The location of implantation was confirmed by histology slices after finishing the whole experiment (Figure 1A).

2.3. Experimental Procedures

The mice were habituated to the procedure for mounting the Miniscope onto the baseplate on a daily basis for 3 days; then, the animals carried the Miniscope and explored freely in a 15 cm × 30 cm open field for 4 minutes for training purposes. After the mice were habituated to the handling procedures and performed well in the open field (i.e., the walking path covered most of the open field), we started to execute the experiments. Four sessions of drug testing experiments were randomly performed at 48-hour intervals to wash out the drug. Each session contained two 4-minute trials (trials A and B) with a drug administration period in between (Figure 1B). In each trial, the mice were also allowed to move freely in the same 15 cm × 30 cm open field in the same environment on training days. The raw calcium imaging videos were acquired by the Miniscope UCLA data acquisition software. At the same time, the behavioral videos were recorded and analyzed by EthoVision tracking software (EthoVision XT; Wageningen, the Netherlands). After finishing trial A, the mice were intraperitoneally injected with PBS (0.01 ml/g) or MK-801 (0.02 mg/kg) and waited 5 minutes and then injected with PBS (0.01 ml/g) or sarcosine (500 mg/kg; SAR500) or sarcosine (1000 mg/kg; SAR1000), which created a combination of 1. PBS + PBS (vehicle control), 2. MK-801 + PBS (untreated session), 3. MK-801 + SAR500 (low dose treatment), and 4. MK-801 + SAR1000 (high dose treatment). Then, the mice waited in their home cage for 20 minutes prior to returning to the open field for experiment trial B.

2.4. Data Analysis

2.4.1. Processing of the Ca2+ Imaging Videos

The calcium imaging videos were processed with MIN1PIPE [25] (Figure 1C and 1D). MIN1PIPE removed the background, noise, and corrected motion artifacts of the videos. The seeds were first automatically selected by MIN1PIPE and then inspected by investigators to exclude the double-selected seeds. We did not compare the fluorescence dynamics of the same cells across days; therefore, the assigned seed numbers were different across sessions (e.g., the assigned cell numbers in the control session are different from those in the MK-801 session). The processed fluorescence intensity traces of each cell were then analyzed by custom written programs in MATLAB (R2016b; MathWorks; MA, USA) described as follows.

2.4.2. Comparisons of Grouped Fluorescence Intensity

To test the effects of sarcosine on restoring the assembled neuronal activities, the fluorescence intensity traces of 20 cells were randomly selected, and their intensity ratio between trial B and trial A was calculated and averaged, which resulted in a sampling unit of 20 neurons, given the finding by Ghandour et al. that approximately 10% of neurons (~ 20 neurons in the present study) in the dCA1 have ensemble activity [26]. This procedure of random selection and averaging was performed 1000 times (MATLAB), which gave 1000 intensity ratios (Figure 2A to 2C). We also used a similar method but randomly selected 30 (Figure 2D to 2F) and 50 (Figure 2G to 2I) traces 1000 times to test whether the sample size affected the results.

2.4.3. Correlation Matrix

To understand the effect on cell-cell interactions, we created a correlation matrix to observe the fluorescence correlations between pairs of dCA1 neurons (Figure 3). The fluorescence intensity traces that proceeded by MIN1PIPE were paired and computed by the MATLAB function corrcoef.m, which calculates the Pearson correlation coefficients of two traces.

2.4.4. Spatial Correlation

The physiological functions of dCA1 cells were tested by measuring the alterations of place fields and comparing the field of trial A with trial B. In detail, we first binned the rectangle open field into a 1-cm-resolution map and matched the time of fluorescence intensity traces to the open field bins where the mice explored in. The maximum fluorescence intensities of each bin are represented as the fluorescence map (Figure 4A). The fluorescence maps were then averaged across the width of the open field, which converted the fluorescence map matrixes into the length of fluorescence map vectors. We then calculated the Spearman correlations between the fluorescence map vectors of trial A and trial B (Figure 4B).

2.5. Statistics

To assess the significance of differences between the four treatment groups (Control, MK-801, MK-801 + SAR500, and MK-801 + SAR1000), a non-parametric bootstrapping approach was employed (MATLAB). For each group, the data was resampled with replacement 1,000 times to generate a distribution of bootstrapped means. Refer to Table 1 for the number of samples in each resampling matched the original sample size for each group. After generating the bootstrapped distributions, a one-way analysis of variance (ANOVA) was performed on the bootstrapped means to evaluate overall differences between the treatment groups. When the ANOVA indicated a significant effect (p < 0.05), post-hoc pairwise comparisons were conducted using Tukey's honestly significant difference (HSD) test to identify which specific groups differed. To assess the significance of differences in the cumulative distributions, we applied the Kolmogorov-Smirnov (K-S) test. Significance analyses were computed by built-in tools in MATLAB and tested with SPSS (Version: 10.0.7, IBM, New York, USA).

3. Results

3.1. Single Neuron Fluorescence Intensity

The activities of right dCA1 neurons of 3 mice are represented by calcium indicators. Figure 1A and 1C demonstrate that jGCamp7s expressed in the dCA1 and GRIN lens is located above the pyramidal layer. Their dynamic changes were video-taped by a Miniscope mounted on the subject’s head (Supplementary videos S1 to S4). The fluorescence dynamics of each seed were picked out and processed, including movement correction (MC), background subtraction, and noise removal, and represented by fluorescence intensity traces (Figure 1D, Supplementary videos S1 to S4). By observing the videos (Supplementary video S2), we noticed that intraperitoneal (IP) administration of 0.2 mg/kg MK-801 seemed to decrease the fluorescence activities of neurons. Therefore, we further displayed their fluorescence by gradient gray lines for better visualization (Figure 1E to 1H, Figure S1). The time intervals between sessions were more than two days for washing out the previous drugs. Because we did not aim to analyze the alterations of the same cell across sessions, the seed numbers and the number of detected neurons were different from session to session but identical within trials (Table 1). The alterations of fluorescence intensities were calculated in Figure 1I, which measured the mean delta fluorescence intensities of each trace between trial A and trial B (Mean ± SEM). Although the fluorescence intensities in trial B were usually lower than those in trial A, which resulted in negative mean values (Figure 1I), MK-801 still significantly reduced the brightness of fluorescence when compared to the delta fluorescence intensities of the vehicle control (Figure 1I, PBS + PBS vs. MK-801 + PBS Bootstrapping and Tukey's post hoc comparison, p < 0.01). Supporting the observation in Figures 1G and 1H, sarcosine ameliorated the MK-801-induced reduction. Moreover, SAR500 (sarcosine 500 mg/kg) showed better restoration than SAR1000 (1000 mg/kg) (Figure 1I, MK-801 + SAR500 vs. MK-801 + PBS Bootstrapping and Tukey's post hoc comparison, p < 0.01; MK-801 + SAR1000 vs. MK-801 + PBS, p < 0.01). Fluorescence intensities from the other mice (Mouse #1; Figure S1C to D and Mouse #2; G to H) also demonstrated better restoration of in SAR500 than SAR1000. Although in Figure 1I, alterations in fluorescence intensities were quantified with each individual neuron considered as a single statistical sample, we were curious about the fluorescence dynamics of cell ensembles. Therefore, we performed two kinds of analyses (Figure 2 and Figure 3) that took multiple cells or paired cells as a measurement.

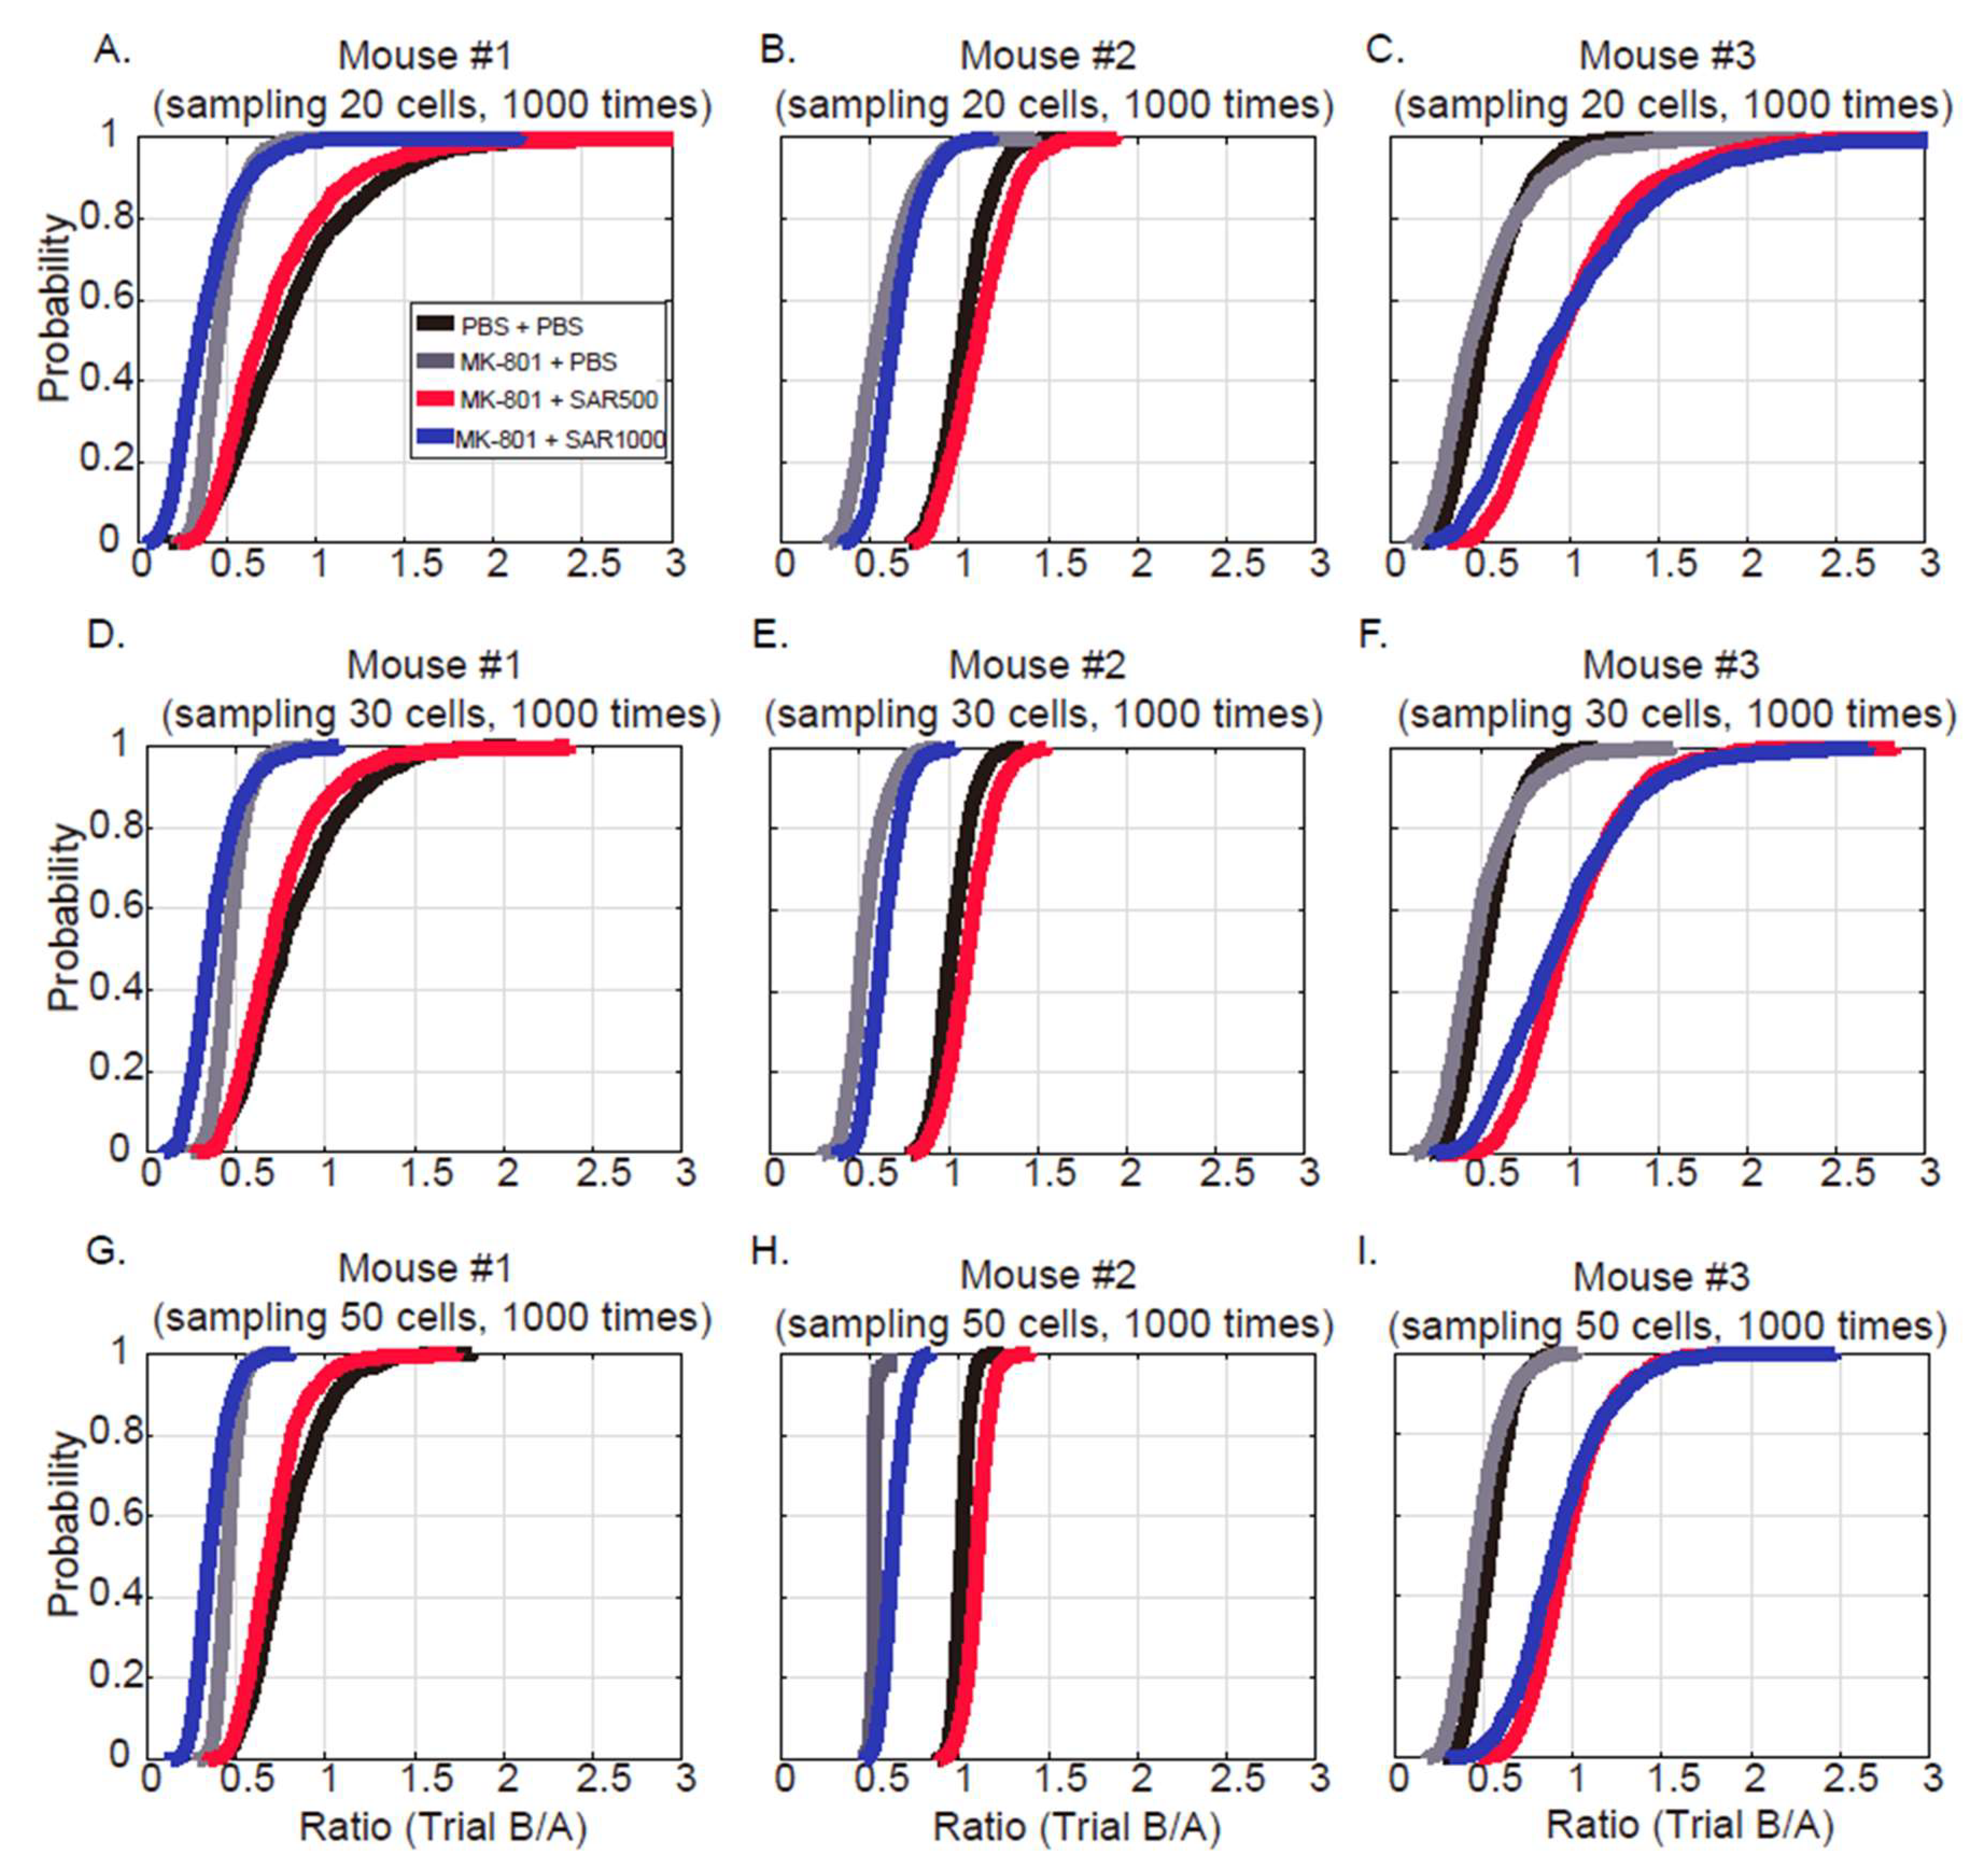
3.2. Grouped Fluorescence Intensity

We randomly sampled 20 cells and averaged their fluorescence intensities of every mouse 1000 times and plotted the cumulative distributions of their ratios between trials (trial B/trial A) (Figure 2A to 2C), given the finding by Ghandour et al. that approximately 10% of neurons (~ 20 neurons in the present study) in the dCA1 have ensemble activities, which hint that they are hippocampal memory engrams [26]. Figure 2A to 2C are the cumulative distributions of mice 1 to 3, respectively. Compared with the vehicle control sessions (Figure 2A to 2C; black lines), the distributions of the trial B/A ratios were shifted toward left after administrating MK-801 (gray lines), which suggests that MK-801 reduced the fluorescence of any 20 neurons (control vs. MK-801+PBS, K-S test; mouse #1, p < 0.01, test statistic = 0.12; mouse #2, p < 0.01, test statistic = 0.87; mouse #3, p < 0.01, test statistic = 0.18). Moreover, SAR500 (red lines) consistently improved the fluorescence intensity of all 3 mice, since their cumulative distributions were shifted toward the right (MK-801 + PBS vs. MK-801 + SAC500, K-S test; mouse #1, p < 0.01, test statistic = 0.50; mouse #2, p < 0.01, test statistic = 0.89; mouse #3, p < 0.01, test statistic = 0.63). However, the effect on the fluorescence of SAR1000 (blue lines) was not very consistent across 3 mice. Although SAR1000 significantly increased the intensity compared with MK-801 (MK-801 + PBS vs. MK-801 + SAC1000, K-S test; mouse #1, p < 0.01, test statistic = 0.38; mouse #2, p < 0.01, test statistic = 0.30; mouse #3, p < 0.01, test statistic = 0.49), a dramatic improvement after SAR1000 injection was evident only in mouse #3 (Figure 2C, blue line). We also analyzed the ratio distributions with sampling units of 30 (Figure 2D to 2F) and 50 (Figure 2G to 2I) neurons to test whether the sampling size might affect the distributions. Consistently, Figure 2D to 2F and 2G to 2I demonstrated a similar tendency of distribution to those of Figure 2A to 2C. Therefore, the data suggest that MK-801 may suppress the activity of dCA1 ensembles and that sarcosine can ameliorate the suppression.

3.3. Pairwise Fluorescence Correlation

Next, we were still interested in knowing the cell-cell activities of dCA1; therefore, we measured the correlation matrix between pairwise fluorescence traces (Figure 3, S2). In Figure 3, the correlation coefficients are variables for measuring the alterations of cell pairs. Interestingly, MK-801 significantly increased the correlation coefficients of pairwise fluorescence intensities (Figure 3B). The percentage of high-correlation cell pairs (R > 0.5) was 9.25% in the MK-801 session (Figure 3A) and 3.87% in the control session (Figure 3B). Both SAR500 and SAR1000 halted the increase in the percentage of high-correlation pairs (Figure 3C, SAR500, 4.34% and Figure 3D, SAR1000, 4.11%). For the statistical test, we compared the alterations of correlation coefficients between baseline (trial A) and postinjection (trial B). The data showed a significant increase in delta cell-cell correlations after the administration of MK-801 (Figure 3E) in comparison to those of PBS. SAR500 or SAR1000 reduced the increases from MK-801 to the level near vehicle control. Because the tendency of the correlation coefficient (elevated after MK-801 administration) is different from the tendency of fluorescence intensity (decreased after MK-801 administration), we compared the pairwise mean fluorescence intensities to the correlation coefficients in trial B of the MK-801 session and noticed a moderated negative correlation (R = -0.587, p < 0.01), which suggested that cells paired with low fluorescence intensities tend to show high cell-cell correlation.

3.4. Spatial Correlation of Fluorescence Map

Although the above data represented the properties of neurons in the dCA1 under MK-801 or sarcosine treatment, we were still curious about the physiological functions of these neurons. Most of the neurons in the hippocampus have a property of place preference, which means that the specific neurons are activated only when the animal is located in a specific area [24]. Therefore, we computed the fluorescence map (Figure 4A) of each cell and measured the spatial correlations between trials A and B. The spatial correlation significantly decreased to -0.094 ± 0.019 after the injection of MK-801 (Figure 4B, Bootstrapping and Tukey's post hoc comparison, p < 0.01). Moreover, SAR500 or SAR1000 both reversed the decreases in spatial correlations induced by MK-801 (Figure 4B, post hoc comparison with MK-801 session, p < 0.01). SAR500 even improved the spatial correlation when compared with the control session (Figure 4B, post hoc comparison with the control session, p < 0.01). These data suggest that the physiological functions of dCA1 were impaired by MK-801 but rescued by sarcosine.

4. Discussion

The aims of the present study were to observe neuronal activity in the dCA1 region under conditions of NMDA receptor hypofunction, induced by MK801, which has been used in previous studies to model certain aspects of schizophrenia-like phenotypes [20,21,22]. While this approach is widely recognized to simulate NMDA receptor dysfunction, a core feature implicated in schizophrenia pathophysiology [2,3,4,9], we acknowledge that the characterization of this animal model as fully representative of schizophrenia remains debated. Thus, we cautiously propose that this model can be considered an NMDA receptor hypofunction model, which may mimic some aspects of schizophrenia for specific experimental purposes, such as evaluating the effects of sarcosine on dCA1 neurons. We used in vivo calcium imaging to observe the fluorescence dynamics of dCA1 neurons and analyzed three aspects of influences, including fluorescence intensity (either single (Figure 1) or assembled cell (Figure 2)), cell-cell correlations (Figure 3), and cellular function (Figure 4). The data showed that MK-801 decreased fluorescence intensity, increased cell-cell correlation, and impaired the place maps of dCA1 neurons. However, sarcosine could ameliorate the abovementioned influences. Using freely behaving calcium imaging to directly observe the effect of MK-801 and sarcosine on neurons is a novel approach, and the findings support previous studies that state that sarcosine is a potential drug for the symptoms of schizophrenia [6,15,16,17,20]. Accumulating studies analyze calcium imaging in the hippocampus to display the cognitive function of animals [27,28,29,30]. However, some limitations or interesting findings were noticed during the experiments. We compared the advantages and caveats of the present methods with traditional unit recording here.

4.1. Fluorescence Intensity

The data demonstrated that regardless of the manipulations, the overall fluorescence intensity of trial B was very slightly lower than that of trial A (Figure 1I). Although the reductions in fluorescence intensity did not mask our main finding, which represented the significant decreases under the effect of MK-801 (Figure 1I), there is still some trade-off between long recording data and the photobleaching effect [23]. For a typical unit recording of place cells, a 10-minute trial is common [31,32] or even up to 30 minutes [24]. However, we were concerned with photobleaching. Thus, we shortened the recording period to approximately 4 minutes per trial and 8 minutes per session. The problems of photobleaching could be improved by dimming the intensity of excitation light of the Miniscope [23] but may worsen the imaging quality if the signal noise ratio of fluorescence is low. However, sarcosine still improved the fluorescence intensity of all mice (i.e., the red and blue lines shifted toward the right). While photobleaching could partially account for this reduction, we cannot rule out other factors such as differences in neural activity or fluctuations in baseline fluorescence levels. However, we monitored the fluorescence signal over time and observed signs consistent with photobleaching, such as a gradual decline in intensity, which suggests that photobleaching is likely a contributing factor to the observed reduction.
The observation that low-dose sarcosine was more effective than high-dose administration could be related to the complexity of dose-response dynamics in NMDA receptor modulation. NMDA receptor is susceptible to desensitization depend on the saturation of glycine-binding site [33]. We speculate that at lower doses, sarcosine may more selectively enhance NMDA receptor activity without overstimulating the system, thereby optimizing synaptic function. In contrast, higher doses may lead to receptor desensitization or saturation, reducing the therapeutic benefits. This observation suggests that careful dosing may be critical in therapeutic settings, warranting further investigation into the optimal dosing strategies for maximizing therapeutic effects. Research in human subjects has also shown that lower doses of sarcosine (1g/day) had a better impact on negative symptoms (measured by The Scale for the Assessment of Negative Symptoms (SANS)) compared to higher doses (2g/day) [15], which supports the effect observed in present study. This parallel finding suggests that sarcosine’s efficacy might be optimized in certain test at lower doses, potentially due to more targeted modulation of NMDA receptor function without overstimulation.

4.2. Measure the Grouped and Paired Cells

Figure 2 randomly sampled the cells and tested the fluorescence intensities with a unit of grouped cells. In addition, we further measured the correlation coefficients of cell-cell fluorescence intensities to test whether the cells fire together, which implies that they work together [34]. Much surprisingly, MK-801 dramatically increased the cell-cell correlations (Figures 3B and 3E). We postulate that the increased cell-cell correlation observed following MK801 administration may result from the widespread suppression of neuronal activity. MK801, by inhibiting NMDA receptor function, likely reduces the overall excitability of neurons, leading to a diminished fluorescence signal. This suppression may cause the neurons to enter a "synchronized" state of low activity, where they are not actively participating in distinct, independent network assemblies. Instead of reflecting coordinated functional activity, this high correlation could be an artifact of reduced neuronal responsiveness, with most neurons displaying uniformly low levels of activity. Local field potential recordings have demonstrated that MK-801 induces hypersynchronization of gamma oscillations, indicative of aberrant network activity [35]. This dysregulated synchrony may contribute to a psychotic-like state, potentially mirroring the disrupted neural circuits characteristic of schizophrenia-related network dysfunction [35]. On the other hand, the increase in cell-cell correlation could also be explained by the impairment of organizing cell assemblies [36]. An increase in the coactivation of hippocampal neurons was reported in a tetrodotoxin-induced schizophrenia model that used electrophysiological recording [36]. Coactivation of cell assemblies that contain relevant functions or representations is one of the key mechanisms in the brain for processing information [34]. In contrast, suppressing unrelated cell assemblies is critical for organizing correct representations. Cognitive disorganization is one of the main symptoms that represent a deficit of inhibition of irrelevant mental activity in patients with schizophrenia [36,37]. We postulate that the increased cell-cell correlation after the injection of MK-801 may lead to the cognitive disorganization syndrome of schizophrenia and that sarcosine can improve disorganization in the hippocampus.

4.3. Physiological Function of dCA1 Neurons

Whether the function of dCA1 neurons is still intact after the administration of MK-801 is also an interesting question. Recording the properties of place cells in the dorsal hippocampus in a schizophrenia animal model has been reported [30,36]. However, various schizophrenia animal models combined with different recording tools revealed distinct results. Olypher et al. used tetrodotoxin to induce psychosis and applied a single-unit recording technique to acquire spikes from the dCA1 [36]. Their simulation model demonstrated that the ability to segregate relevant from irrelevant representations is impaired by tetrodotoxin [36]. Zaremba et al. used chronic two-photon Ca2+ imaging to track dCA1 place cell activities in Df(16)A+/− mice (an animal model of schizophrenia) [30]. They reported that Df(16)A+/− mice show deficiency of stable spatial representation. Our data (Figure 4) have similar results to their report, which demonstrated diminished spatial correlation across trials under the influence of MK-801, and we also demonstrated that sarcosine significantly alleviated these decreases. However, we also noticed that the mean values of the correlation coefficient were low for all sessions (Figure 4B). We think the characteristics of calcium imaging and the size of the open field may account for the low spatial correlation; place cells were traditionally recorded by electrodes with a time resolution that is relatively precise than calcium imaging for identifying the place field. We choose syn-jGcamp7s as a calcium indicator, given that it has a great signal noise ratio [38]. However, the trade-off for a high signal/background ratio is time resolution. The half decay time after 10 action potentials is approximately 1.26 ± 0.04 seconds [38]. Therefore, the time resolution of the calcium indicator is far from unit recording. In addition, because of the limitation of our recording equipment (i.e., lack of commutator) for recoding on a large scale, we performed the experiment in a 30 × 15 cm open field. We postulated that a larger exploration arena for in vivo calcium imaging may reveal a place field map that is more identical to the traditional unit recording technique. Moreover, we did not specifically select and analyze cells that have place preferences. A place cell is easier to identify by repeatedly acquiring its place field in an identical environment. In Figure 4B, we assumed that all the cells we recorded were putative place cells, although the proportions of pyramidal cells that have place cell properties in the dCA1 are 60 to 70% [39]. The reason for making the assumption was due to the difficulty of performing multiple sessions a day without confounding photobleaching issues. Therefore, we did not design the protocol for 3 trials (i.e., baseline, MK-801, MK-801+SAR) session to compare their spatial correlations.

4.4. Sarcosine Treatment

Abnormal dopamine or glutamate systems are two leading hypotheses of the pathophysiology of schizophrenia. In abnormal glutamate system theory, NMDA receptor hypofunction is a key cause of schizophrenia. The present study suggests that sarcosine may beneficial to the NMDA receptor hypofunctional model of schizophrenia. The glycine modulatory site on the NR1 subunit of the NMDA receptor is a potential target for improving symptoms in schizophrenia [6,13,15,16,19,40] given that the concentration of glutamate in the central nervous system is difficult to elevate by peripheral administration. Therefore, an alternative strategy is used: elevating the production of glycine for the glycine modulatory site. In practice, the high effective dosage of direct administration of glycine is still a problem because of its poor ability to cross the blood-brain barrier, which results in a high effective dose and aversive effect for patients [14]. In contrast, inhibition of glycine transporter 1 is another potential way to treat schizophrenia. Sarcosine is a selective glycine transporter 1 inhibitor with a very wide margin of safety. Its recommended dosage is 2000 mg daily in humans, and the present study used a dosage of 500 mg/kg for mice, which is equivalent to 2349 mg for a 60-kg man [20]. Even 2000 mg or 4000 mg/day for humans reported no significant side effects [15,18,41]. Our data demonstrate that sarcosine administered at 500 mg/kg produced more consistent and pronounced improvements compared to the higher dose of 1000 mg/kg in our mouse model. Sarcosine not only inhibits glycine transporter 1 but also regulates the surface trafficking of NMDA receptors, coactivates glycine modulatory sites, and enhances synaptic glycine levels [20]. Although accumulating reports show the pharmacological mechanisms of sarcosine and its effects during clinical use, the present study further provides some evidence for its improvement on patient hippocampal function.

5. Conclusions

In summary, by directly and visually observing dCA1 neurons, our findings demonstrate that sarcosine mitigates the MK801-induced reduction in dCA1 neuronal activity and the associated increase in cell-cell correlation. In addition, combined with its underlying therapeutic mechanisms, wide margin of safety, and influences on dCA1 neurons, sarcosine may ameliorate the hippocampal deficits in schizophrenia patients.

Supplementary Materials

The following supporting information can be downloaded at the website of this paper posted on Preprints.org. Supplementary Figure S1: Examples of fluorescence intensity of dorsal CA1 neurons from Mouse #1 and #2 after administration of MK-801 and sarcosine. (A) to (D) show fluorescence intensity data from Mouse #1 under the following treatments: PBS + PBS, MK-801 + PBS, MK-801 + sarcosine (SAR500, 500 mg/kg), and MK-801 + sarcosine (SAR1000, 1000 mg/kg). (E) to (H) present corresponding fluorescence intensities from mouse #2, subjected to the same treatment conditions as Mouse #1. Supplementary Figure S2: Examples of dorsal CA1 cell-cell correlation matrixes from Mouse #1 and # 2. (A) to (D) show cell-cell correlation matrixes of Mouse #1 after the administration of PBS + PBS, MK-801 + PBS, MK-801 + SAR500, and MK-801 + SAR1000, respectively. (E) to (H) present corresponding cell-cell correlation matrixes from Mouse #2, subjected to the same treatment conditions as Mouse #1. Supplementary video S1: Example videos of dCA1 fluorescence dynamics after the administration of PBS + PBS. The videos were produced by MIN1PIPE [25]. MC stands for “movement corrected”. Processed stands for “processed by MC, background subtraction, and noise removal”. Supplementary video S2: Example videos of dCA1 fluorescence dynamics after the administration of MK-801 + PBS. Supplementary video S3: Example videos of dCA1 fluorescence dynamics after the administration of MK-801 + SAR500. Supplementary video S4: Example videos of dCA1 fluorescence dynamics after the administration of MK-801 + SAR1000.

Author Contributions

The manuscript was written by Y.T. Hsiao and revised by F.C. Chang. Data were analyzed by C.Y. Chang, T.Y. Lee, W.T. Liao, Y.T. Hsiao, and F.C. Chang. C.Y. Chang, T.Y. Lee, W.T. Liao, and Y.T. Hsiao collected the data. The experiments were designed by W.S. Lai and Y.T. Hsiao.

Funding

National Taiwan University (grant number NTU-109L892701), the Ministry of Science and Technology, Taiwan (109-2320-B-002-023-MY2).

Data accessibility

Data are available upon request by contacting the corresponding author.

Acknowledgments

The authors thank National Taiwan University (grant number NTU-109L892701), the Ministry of Science and Technology, Taiwan (109-2320-B-002-023-MY2), and the Neurobiology and Cognitive Science Center for their support.

Competing interests

This is not an industry-supported study. The authors have reported no financial conflicts of interest.

Ethics approval and informed consent

All procedures performed in this study were approved by the National Taiwan University Animal Care and Use Committee (Approval No.: NTU-109-EL-00029).

Abbreviations

dCA1
dorsal hippocampal cornu ammonis area 1
GRIN
Gradient index
IP
Intraperitoneal
K-S
Kolmogorov-Smirnov
MC
Movement correction
NMDA
N-methyl-D-aspartate
PBS
Phosphate buffered saline
SAR500
Sarcosine 500 mg/kg
SAR1000
Sarcosine 1000 mg/kg

References

  1. Howes, O.; McCutcheon, R.; Stone, J. Glutamate and dopamine in schizophrenia: an update for the 21st century. J Psychopharmacol 2015, 29, 97–115. [Google Scholar] [CrossRef] [PubMed]
  2. Javitt, D.C. Glutamate and schizophrenia: phencyclidine, N-methyl-D-aspartate receptors, and dopamine-glutamate interactions. Int Rev Neurobiol 2007, 78, 69–108. [Google Scholar] [CrossRef] [PubMed]
  3. Moghaddam, B.; Javitt, D. From revolution to evolution: the glutamate hypothesis of schizophrenia and its implication for treatment. Neuropsychopharmacology 2012, 37, 4–15. [Google Scholar] [CrossRef] [PubMed]
  4. Olney, J.W.; Newcomer, J.W.; Farber, N.B. NMDA receptor hypofunction model of schizophrenia. J Psychiatr Res 1999, 33, 523–533. [Google Scholar] [CrossRef]
  5. Smith, A.C. Schizophrenia and Madness; George Allen & Unwin: 1982.
  6. Balu, D.T. The NMDA receptor and schizophrenia: From pathophysiology to treatment. Adv Pharmacol 2016, 76, 351–382. [Google Scholar] [CrossRef]
  7. Javitt, D.C.; Balla, A.; Burch, S.; Suckow, R.; Xie, S.; Sershen, H. Reversal of phencyclidine-induced dopaminergic dysregulation by N-methyl-D-aspartate receptor/glycine-site agonists. Neuropsychopharmacology 2004, 29, 300–307. [Google Scholar] [CrossRef]
  8. Lesh, T.A.; Niendam, T.A.; Minzenberg, M.J.; Carter, C.S. Cognitive control deficits in schizophrenia: mechanisms and meaning. Neuropsychopharmacology 2011, 36, 316–338. [Google Scholar] [CrossRef]
  9. Lipina, T.; Labrie, V.; Weiner, I.; Roder, J. Modulators of the glycine site on NMDA receptors, D-serine and ALX 5407, display similar beneficial effects to clozapine in mouse models of schizophrenia. Psychopharmacology (Berl) 2005, 179, 54–67. [Google Scholar] [CrossRef]
  10. Javitt, D.C. Glycine transport inhibitors and the treatment of schizophrenia. Biol Psychiatry 2008, 63, 6–8. [Google Scholar] [CrossRef]
  11. Li, P.; Snyder, G.L.; Vanover, K.E. Dopamine targeting drugs for the treatment of schizophrenia: past, present and future. Curr Top Med Chem 2016, 16, 3385–3403. [Google Scholar] [CrossRef]
  12. Hawkins, R.A. The blood-brain barrier and glutamate. Am J Clin Nutr 2009, 90, 867S–874S. [Google Scholar] [CrossRef] [PubMed]
  13. Javitt, D.C.; Silipo, G.; Cienfuegos, A.; Shelley, A.M.; Bark, N.; Park, M.; Lindenmayer, J.P.; Suckow, R.; Zukin, S.R. Adjunctive high-dose glycine in the treatment of schizophrenia. Int J Neuropsychopharmacol 2001, 4, 385–391. [Google Scholar] [CrossRef]
  14. Heresco-Levy, U.; Javitt, D.C.; Ermilov, M.; Mordel, C.; Silipo, G.; Lichtenstein, M. Efficacy of high-dose glycine in the treatment of enduring negative symptoms of schizophrenia. Arch Gen Psychiatry 1999, 56, 29–36. [Google Scholar] [CrossRef] [PubMed]
  15. Lane, H.Y.; Liu, Y.C.; Huang, C.L.; Chang, Y.C.; Liau, C.H.; Perng, C.H.; Tsai, G.E. Sarcosine (N-methylglycine) treatment for acute schizophrenia: a randomized, double-blind study. Biol Psychiatry 2008, 63, 9–12. [Google Scholar] [CrossRef] [PubMed]
  16. Lane, H.Y.; Chang, Y.C.; Liu, Y.C.; Chiu, C.C.; Tsai, G.E. Sarcosine or D-serine add-on treatment for acute exacerbation of schizophrenia: a randomized, double-blind, placebo-controlled study. Arch Gen Psychiatry 2005, 62, 1196–1204. [Google Scholar] [CrossRef]
  17. Tsai, G.; Lane, H.Y.; Yang, P.; Chong, M.Y.; Lange, N. Glycine transporter I inhibitor, N-methylglycine (sarcosine), added to antipsychotics for the treatment of schizophrenia. Biol Psychiatry 2004, 55, 452–456. [Google Scholar] [CrossRef]
  18. Lane, H.Y.; Lin, C.H.; Huang, Y.J.; Liao, C.H.; Chang, Y.C.; Tsai, G.E. A randomized, double-blind, placebo-controlled comparison study of sarcosine (N-methylglycine) and D-serine add-on treatment for schizophrenia. Int J Neuropsychopharmacol 2010, 13, 451–460. [Google Scholar] [CrossRef]
  19. Bergeron, R.; Meyer, T.M.; Coyle, J.T.; Greene, R.W. Modulation of N-methyl-D-aspartate receptor function by glycine transport. Proc Natl Acad Sci U S A 1998, 95, 15730–15734. [Google Scholar] [CrossRef]
  20. Pei, J.C.; Hung, W.L.; Lin, B.X.; Shih, M.H.; Lu, L.Y.; Luo, D.Z.; Tai, H.C.; Studer, V.; Min, M.Y.; Lai, W.S. Therapeutic potential and underlying mechanism of sarcosine (N-methylglycine) in N-methyl-D-aspartate (NMDA) receptor hypofunction models of schizophrenia. J Psychopharmacol 2019, 33, 1288–1302. [Google Scholar] [CrossRef]
  21. Svoboda, J.; Stankova, A.; Entlerova, M.; Stuchlik, A. Acute administration of MK-801 in an animal model of psychosis in rats interferes with cognitively demanding forms of behavioral flexibility on a rotating arena. Front Behav Neurosci 2015, 9, 75. [Google Scholar] [CrossRef]
  22. Csernansky, J.G.; Martin, M.; Shah, R.; Bertchume, A.; Colvin, J.; Dong, H. Cholinesterase inhibitors ameliorate behavioral deficits induced by MK-801 in mice. Neuropsychopharmacology 2005, 30, 2135–2143. [Google Scholar] [CrossRef] [PubMed]
  23. Resendez, S.L.; Jennings, J.H.; Ung, R.L.; Namboodiri, V.M.; Zhou, Z.C.; Otis, J.M.; Nomura, H.; McHenry, J.A.; Kosyk, O.; Stuber, G.D. Visualization of cortical, subcortical and deep brain neural circuit dynamics during naturalistic mammalian behavior with head-mounted microscopes and chronically implanted lenses. Nat Protoc 2016, 11, 566–597. [Google Scholar] [CrossRef] [PubMed]
  24. O'Keefe, J.; Dostrovsky, J. The hippocampus as a spatial map. Preliminary evidence from unit activity in the freely-moving rat. Brain Res 1971, 34, 171–175. [Google Scholar] [CrossRef] [PubMed]
  25. Lu, J.; Li, C.; Singh-Alvarado, J.; Zhou, Z.C.; Frohlich, F.; Mooney, R.; Wang, F. MIN1PIPE: A miniscope 1-photon-based calcium imaging signal extraction pipeline. Cell Rep 2018, 23, 3673–3684. [Google Scholar] [CrossRef]
  26. Ghandour, K.; Ohkawa, N.; Fung, C.C.A.; Asai, H.; Saitoh, Y.; Takekawa, T.; Okubo-Suzuki, R.; Soya, S.; Nishizono, H.; Matsuo, M.; et al. Orchestrated ensemble activities constitute a hippocampal memory engram. Nat Commun 2019, 10, 2637. [Google Scholar] [CrossRef]
  27. Kondo, M.; Kobayashi, K.; Ohkura, M.; Nakai, J.; Matsuzaki, M. Two-photon calcium imaging of the medial prefrontal cortex and hippocampus without cortical invasion. Elife 2017, 6. [Google Scholar] [CrossRef]
  28. Jimenez, J.C.; Su, K.; Goldberg, A.R.; Luna, V.M.; Biane, J.S.; Ordek, G.; Zhou, P.; Ong, S.K.; Wright, M.A.; Zweifel, L.; et al. Anxiety Cells in a Hippocampal-Hypothalamic Circuit. Neuron 2018, 97, 670–683. [Google Scholar] [CrossRef]
  29. Mau, W.; Sullivan, D.W.; Kinsky, N.R.; Hasselmo, M.E.; Howard, M.W.; Eichenbaum, H. The same hippocampal CA1 population simultaneously codes temporal information over multiple timescales. Curr Biol 2018, 28, 1499–1508. [Google Scholar] [CrossRef]
  30. Zaremba, J.D.; Diamantopoulou, A.; Danielson, N.B.; Grosmark, A.D.; Kaifosh, P.W.; Bowler, J.C.; Liao, Z.; Sparks, F.T.; Gogos, J.A.; Losonczy, A. Impaired hippocampal place cell dynamics in a mouse model of the 22q11.2 deletion. Nat Neurosci 2017, 20, 1612–1623. [Google Scholar] [CrossRef]
  31. Bieri, K.W.; Bobbitt, K.N.; Colgin, L.L. Slow and fast gamma rhythms coordinate different spatial coding modes in hippocampal place cells. Neuron 2014, 82, 670–681. [Google Scholar] [CrossRef]
  32. Hsiao, Y.T.; Zheng, C.; Colgin, L.L. Slow gamma rhythms in CA3 are entrained by slow gamma activity in the dentate gyrus. J Neurophysiol 2016, 116, 2594–2603. [Google Scholar] [CrossRef] [PubMed]
  33. Nahum-Levy, R.; Lipinski, D.; Shavit, S.; Benveniste, M. Desensitization of NMDA receptor channels is modulated by glutamate agonists. Biophys J 2001, 80, 2152–2166. [Google Scholar] [CrossRef] [PubMed]
  34. Hebb, D.O. The organization of behavior; a neuropsychological theory; Wiley: Oxford, England, 1949; pp. xix, 335-xix, 335.
  35. Hakami, T.; Jones, N.C.; Tolmacheva, E.A.; Gaudias, J.; Chaumont, J.; Salzberg, M.; O'Brien, T.J.; Pinault, D. NMDA receptor hypofunction leads to generalized and persistent aberrant gamma oscillations independent of hyperlocomotion and the state of consciousness. PLoS One 2009, 4, e6755. [Google Scholar] [CrossRef]
  36. Olypher, A.V.; Klement, D.; Fenton, A.A. Cognitive disorganization in hippocampus: a physiological model of the disorganization in psychosis. J Neurosci 2006, 26, 158–168. [Google Scholar] [CrossRef] [PubMed]
  37. Liddle, P.F.; Morris, D.L. Schizophrenic syndromes and frontal lobe performance. Br J Psychiatry 1991, 158, 340–345. [Google Scholar] [CrossRef]
  38. Dana, H.; Sun, Y.; Mohar, B.; Hulse, B.K.; Kerlin, A.M.; Hasseman, J.P.; Tsegaye, G.; Tsang, A.; Wong, A.; Patel, R.; et al. High-performance calcium sensors for imaging activity in neuronal populations and microcompartments. Nat Methods 2019, 16, 649–657. [Google Scholar] [CrossRef]
  39. Fenton, A.A.; Kao, H.Y.; Neymotin, S.A.; Olypher, A.; Vayntrub, Y.; Lytton, W.W.; Ludvig, N. Unmasking the CA1 ensemble place code by exposures to small and large environments: more place cells and multiple, irregularly arranged, and expanded place fields in the larger space. J Neurosci 2008, 28, 11250–11262. [Google Scholar] [CrossRef]
  40. Balu, D.T.; Coyle, J.T. The NMDA receptor 'glycine modulatory site' in schizophrenia: D-serine, glycine, and beyond. Curr Opin Pharmacol 2015, 20, 109–115. [Google Scholar] [CrossRef]
  41. Amiaz, R.; Kent, I.; Rubinstein, K.; Sela, B.A.; Javitt, D.; Weiser, M. Safety, tolerability and pharmacokinetics of open label sarcosine added on to anti-psychotic treatment in schizophrenia - preliminary study. Isr J Psychiatry Relat Sci 2015, 52, 12–15. [Google Scholar]
Figure 1. Examples of fluorescence intensity of dorsal CA1 neurons from mouse #3 after administration of MK-801 and sarcosine. (A) Histology slice for the location of GRIN lens implantation. (B) Experimental schedule of a session. The animal was explored in an identical open field in trials A and B. The drugs were injected before trial B. (C) Stacked image that was background subtracted and movement corrected (MC) by MIN1PIPE [25] of one recording session. The unit of the traces are normalized "processed calcium traces (PCT) ", which are normalized calcium signals after neural enhancement and denoising by MIN1PIPE (D) Examples of fluorescence traces. (E) to (H) Example of fluorescence intensities of the same animal under the treatment of PBS + PBS, MK-801 + PBS, MK-801 + sarcosine (SAR500, 500 mg/kg), and MK-801 + sarcosine (SAR1000, 1000 mg/kg). (I) Mean delta fluorescence intensities (trial B – A) of neurons of all animals (Mean ± SEM) (Each single cell was treated as a sample for bootstrapping before statistical analysis). **: vs. PBS + PBS; ##: vs MK-801 + PBS; %%: vs MK-801 + SAR500 indicates significant difference (p < 0.01), as determined using the Bootstrap method followed by Tukey's post hoc test for multiple comparisons.
Preprints 137465 g001
Figure 2. Fluorescence intensity ratio of trial B/trial A of grouped cell ensembles. (A) to (C) Cumulative distribution of the intensity ratio which are randomly sampled and averaged 20 intensity traces 1000 times in mouse #1 to #3, respectively. The manipulations of PBS + PBS, MK-801 + PBS, MK-801 + SAR500, and MK-801 + SAR1000 are represented by black, gray, red, and blue lines. (D) to (F) Intensity ratio which are randomly selected and averaged 30 intensity traces 1000 times. (G) to (I) Intensity ratio which are randomly selected and averaged 50 intensity traces 1000 times.
Preprints 137465 g002
Figure 3. Examples of dorsal CA1 cell-cell correlation matrixes from Mouse #3. (A) to (D) Cell-cell correlation matrixes after the administration of PBS + PBS, MK-801 + PBS, MK-801 + SAR500, and MK-801 + SAR1000, respectively. (E) Delta correlation coefficient (trial B – trial A) of pairwise neurons of all animals (Mean ± SEM) (Each single cell was treated as a sample for bootstrapping before statistical analysis). **: vs. PBS + PBS; ##: vs. MK-801 + PBS; %%: vs. MK-801 + SAR500 indicates significant difference (p < 0.01), as determined using the Bootstrap method followed by Tukey's post hoc test for multiple comparisons.
Preprints 137465 g003
Figure 4. Examples of maximum fluorescence intensity maps from a fluorescence positive cell in dorsal CA1. (A) Maximum fluorescence intensity maps of an example dorsal CA1 fluorescence positive cell are depicted by colors, where warm colors represent strong fluorescence signals and white represents weak signals. The gray line represents the walking trajectory of the animal (Mouse #1). (B) Spatial correlation between trial A and trial B in neurons from all animals (Mean ± SEM) (Each single cell was treated as a sample for bootstrapping before statistical analysis). **: vs. PBS + PBS; ##: vs. MK-801 + PBS; %%: vs. MK-801 + SAR500 indicates significant difference (p < 0.01), as determined using the Bootstrap method followed by Tukey's post hoc test for multiple comparisons.
Preprints 137465 g004
Table 1. The number of fluorescence positive neurons for each mouse and treatment.
PBS+PBS MK801+PBS MK801+SAR500 MK801+SAR1000
Mouse 10 199 101 150 161
Mouse 11 59 51 69 90
Mouse 12 215 271 270 279
Disclaimer/Publisher’s Note: The statements, opinions and data contained in all publications are solely those of the individual author(s) and contributor(s) and not of MDPI and/or the editor(s). MDPI and/or the editor(s) disclaim responsibility for any injury to people or property resulting from any ideas, methods, instructions or products referred to in the content.
Copyright: This open access article is published under a Creative Commons CC BY 4.0 license, which permit the free download, distribution, and reuse, provided that the author and preprint are cited in any reuse.
Prerpints.org logo

Preprints.org is a free preprint server supported by MDPI in Basel, Switzerland.

Subscribe

Disclaimer

Terms of Use

Privacy Policy

Privacy Settings

© 2025 MDPI (Basel, Switzerland) unless otherwise stated